exploring, summarizing and presenting datauser.medunigraz.at/andrea.berghold/phd/phd_course... ·...
TRANSCRIPT

Berghold, IMI, MUG
Exploring, summarizing and presenting data
Berghold, IMI, MUG
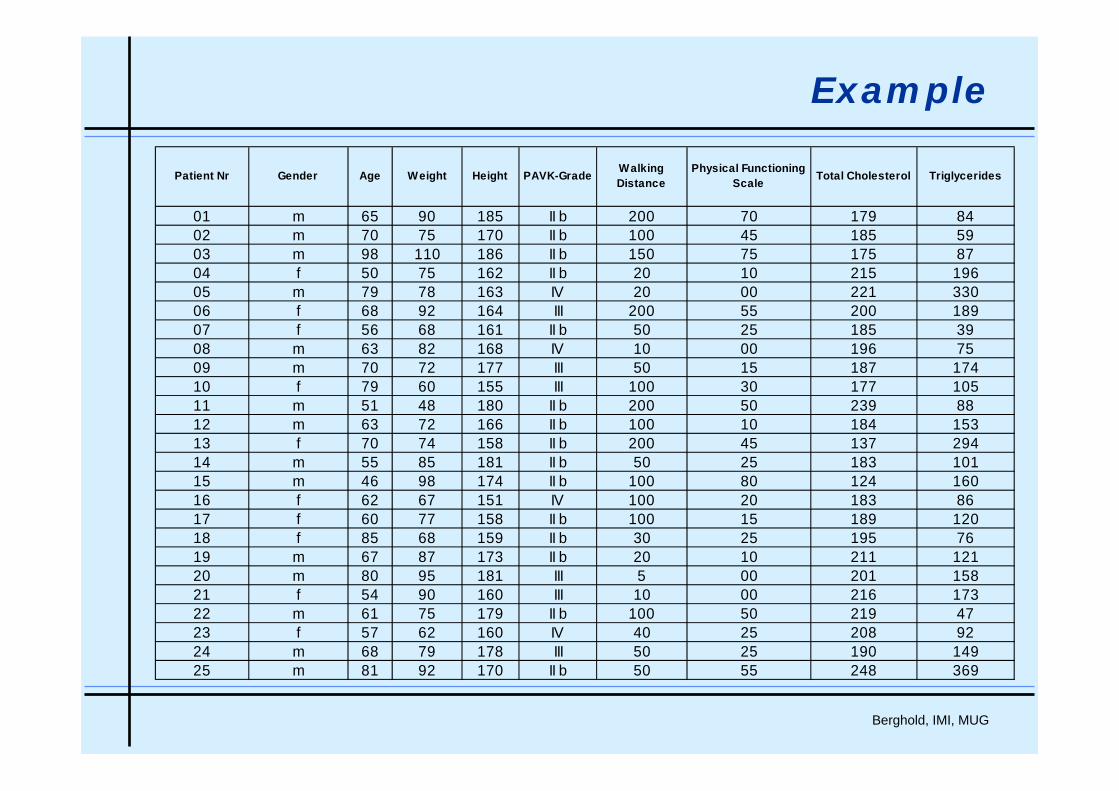
Example
Patient Nr Gender Age Weight Height PAVK-Grade Walking Distance
Physical Functioning Scale Total Cholesterol Triglycerides
01 m 65 90 185 II b 200 70 179 8402 m 70 75 170 II b 100 45 185 5903 m 98 110 186 II b 150 75 175 8704 f 50 75 162 II b 20 10 215 19605 m 79 78 163 IV 20 00 221 33006 f 68 92 164 III 200 55 200 18907 f 56 68 161 II b 50 25 185 3908 m 63 82 168 IV 10 00 196 7509 m 70 72 177 III 50 15 187 17410 f 79 60 155 III 100 30 177 10511 m 51 48 180 II b 200 50 239 8812 m 63 72 166 II b 100 10 184 15313 f 70 74 158 II b 200 45 137 29414 m 55 85 181 II b 50 25 183 10115 m 46 98 174 II b 100 80 124 16016 f 62 67 151 IV 100 20 183 8617 f 60 77 158 II b 100 15 189 12018 f 85 68 159 II b 30 25 195 7619 m 67 87 173 II b 20 10 211 12120 m 80 95 181 III 5 00 201 15821 f 54 90 160 III 10 00 216 17322 m 61 75 179 II b 100 50 219 4723 f 57 62 160 IV 40 25 208 9224 m 68 79 178 III 50 25 190 14925 m 81 92 170 II b 50 55 248 369

Berghold, IMI, MUG
Scales
• Nominal scale
• Ordinal scale
• Numerical scale

Berghold, IMI, MUG
Nominal Scale
The values of any two study units can be classified either as identical or non identical
• hair colour• place of birth• blood group• Binary (dichotomous) variables: gender, rhesus factor, ...

Berghold, IMI, MUG
Ordinal Scale
Observation are still classified but some observations have "more" orare "greater than" other observations.
• school grades• stage of breast cancer• side effect of a drug
(mild, average, severe)• pain-scores ...

Berghold, IMI, MUG
Numerical Scale
continuous (e.g. age, height - measurements) discrete (e.g. number of fractures, number of children - counts)
• weight• body temperature• blood pressure• serum cholesterol ...

Berghold, IMI, MUG
Types of Data
• Qualitative data – categorical variable
• Nominal scale
• Ordinal scale
• Quantitative data
• Discrete variables
• Continuous variables
Berghold, IMI, MUG
Examples
• Protein measured in urine
• Spontaneous urine – using test strips(neg., pos.: +,++,+++)
• 24 hours sample of urineprotein g/24hours
• Smoking
• Consumed tobacco g/day
• Number of smoked cigarettes per day
• Non-smoker, smoker

Berghold, IMI, MUG
Criteria - measurements
• Reliability
• Validity
• Ease of Use

Berghold, IMI, MUG
Reliability
reliable unreliable
●●●
● ●
●
●●●● ●
●●
●
●
●
● ●●
●

Berghold, IMI, MUG
Validity
Valid Not valid
●●●
● ●
●
●●●●
●●●
● ●
●
●●●●

Berghold, IMI, MUG
Descriptive Statistics
• Exploring and presenting data in form of graphs
• Summarizing - data reduction (mean, variance etc.)
• Presenting data in form of tables

Berghold, IMI, MUG
Frequency
• Qualitative data
• absolute and relative frequency
• Quantitative data – define class intervals
• Determine the number of class intervals
• There should be enough class intervals to show the shapeof the distribution but not too many that minor fluctuationsare noticeable.

Berghold, IMI, MUG
Graphs
• Barchart
• Piechart
• Histogram
• Box-and-whisker plot
• Scatterplot
• Time series plot
• ...

Berghold, IMI, MUG
Barchart
number of decayed teeth in pupils
25 33,3 33,3
26 34,7 68,0
9 12,0 80,0
7 9,3 89,3
2 2,7 92,0
4 5,3 97,3
1 1,3 98,7
1 1,3 100,0
75 100,0
0
1
2
3
4
5
6
7
total
frequencies percentagecumulativepercentage
decayed teeth in pupils
number of decayed teeth in pupils
76543210
abso
lute
freq
uenc
y
30
20
10
0

Berghold, IMI, MUG
Piechart
PAVK-Grade
IV24%
III26%
II b50%

Berghold, IMI, MUG
Histogram and cumulative distribution
FT3
1-1,5 1,5-2 2-2,5 2,5-3 3-3,5 3,5-4 4-4,5 4,5-5 5-5,5 5,5-6
rel.
frequ
ency
0,00
0,05
0,10
0,15
0,20
0,25
0,30
0,35
FT3
1-1,5 1,5-2 2-2,5 2,5-3 3-3,5 3,5-4 4-4,5 4,5-5 5-5,5 5,5-6
F(x)
0,0
0,2
0,4
0,6
0,8
1,0

Berghold, IMI, MUG
Histogram 1
TRIGLYCERIDES (mg / 100 ml)
240
230
220
210
200
190
180
170
160
150
140
130
120
110
100908070
frequ
ency
12
10
8
6
4
2
0
Std.dev. = 38,83 Mean = 129
N = 80,00

Berghold, IMI, MUG
Histogram 2
TOTAL CHOLESTEROL (mg / 100 ml)
800
750
700
650
600
550
500
450
400
350
300
250
200
150
100
frequ
ency
50
40
30
20
10
0
Std.dev. = 92,46 Mean = 220
N = 80,00

Berghold, IMI, MUG
Histogram 3
SYSTOLIC BLOOD PRESSURE (mmHg)
220200180160140120100
frequ
ency
30
25
20
15
10
5
0
Std.dev. = 21,97 Mean = 162
N = 80,00

Berghold, IMI, MUG
a) unimodal b) skewed positively c) skewed negatively
c) bimodal e) trapezoid f) truncated
g) L- shaped h) J - shaped i) U - shaped
TypesTypes of Distributionof Distribution
Berghold, IMI, MUG
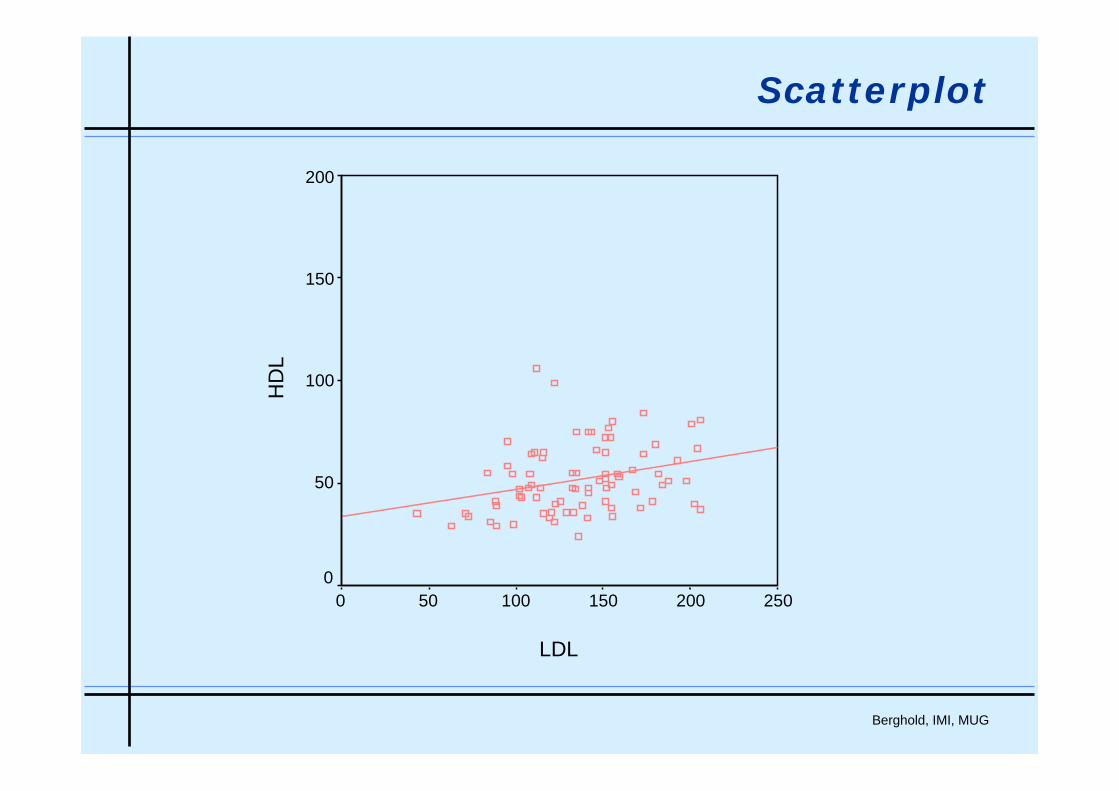
Scatterplot
LDL
250200150100500
HD
L
200
150
100
50
0

Berghold, IMI, MUG
Summarizing Data
Common statistics used to summarize data and describe certainattributes of a set of data.
• Variance, standard deviation• Range• Interquartile range
• Mean• Median, quantile• Mode
• Measures of dispersion:the spread of data
• Measures of location:the central tendency

Berghold, IMI, MUG
Mean
Mean = arithmetic mean
Note:
• The mean is sensitive to extreme values
∑=
=n
iix
nx
1
1

Berghold, IMI, MUG
Example
Values: 1, 2, 30
3021
11:
=xmean
( ) 113
3021=
++=x

Berghold, IMI, MUG
Variance, standard deviation
The variance of a data set is the arithmetic mean of the squareddifferences between the observations and the mean.
The standard deviation is primarily used to describe data. It is thesquare root of the variance.
In many circumstances the large majority (about 95%) of a set of observations will be within two standard deviations of the mean(depends on the shape of the distribution – normal distribution) – normal range
( )∑=
−−
=n
ii xx
ns
1
22
11
2ss =

Berghold, IMI, MUG
Example
The number of cows 4 farmers own in 3 villages
standard deviation
mean
observations
s = 10.0s = 0s = 1.8
0, 0, 0, 205, 5, 5, 53, 6, 7, 4
village 3village 2village 1
5=x 5=x 5=x
Berghold, IMI, MUG
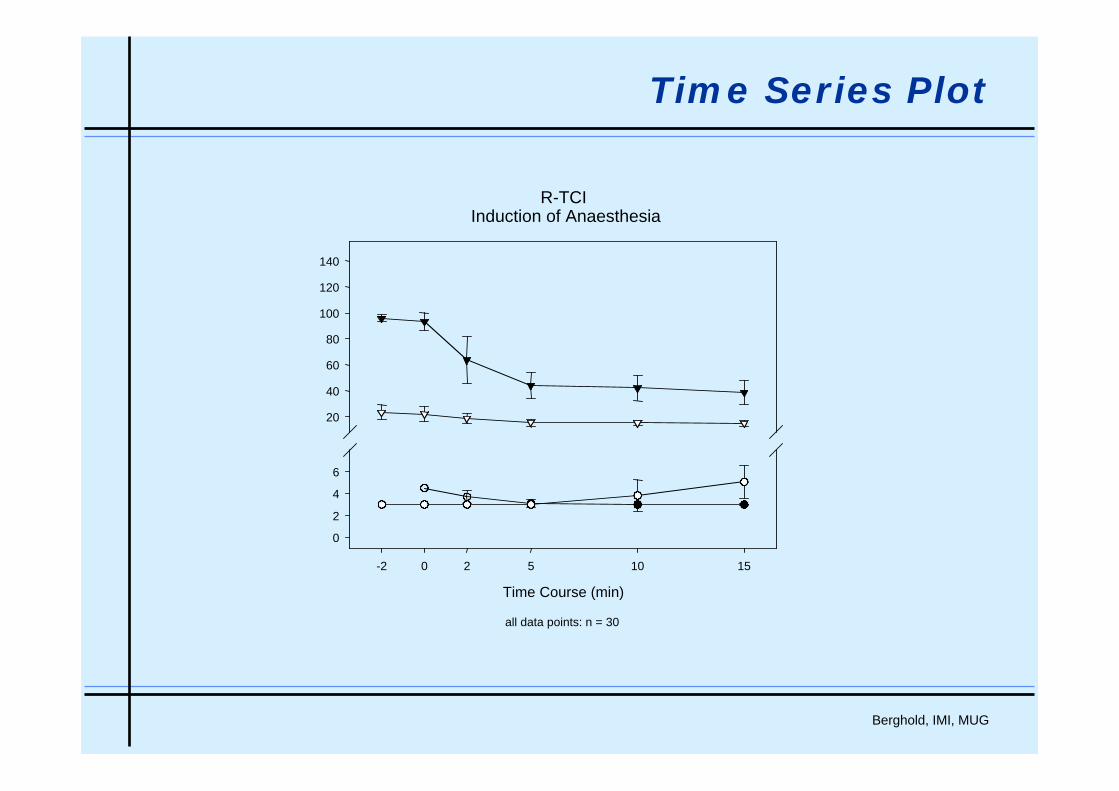
Time Series Plot
R-TCIInduction of Anaesthesia
Time Course (min)
-2 0 2 5 10 15
0
2
4
6
20
40
60
80
100
120
140
all data points: n = 30

Berghold, IMI, MUG
Geometric mean
Geometric mean
The geometric mean is generally used with data measured on a logarithmic scale
The logarithm of the geometric mean is equal to the mean of thelogarithms of the observations
nnxxxG ...21=
∑=
=n
i
i
nxG
1
loglog

Berghold, IMI, MUG
Median
Median
The median is the central value of the distribution
• if n is odd
• if n is even
( )( )2/1~
+= nxx
( ) ( )( )12/2/21~
++= nn xxx

Berghold, IMI, MUG
Mean - Median
Example: n = 3values: 1, 2, 30
3021
2~:
=xmedian
11=xmean:

Berghold, IMI, MUG
skewed negatively
MoMo xxMeMe < < <<
skewed positively
MoMoxx MeMe <<<<
Skewness by mean, median and mode
Berghold, IMI, MUG
Quantiles
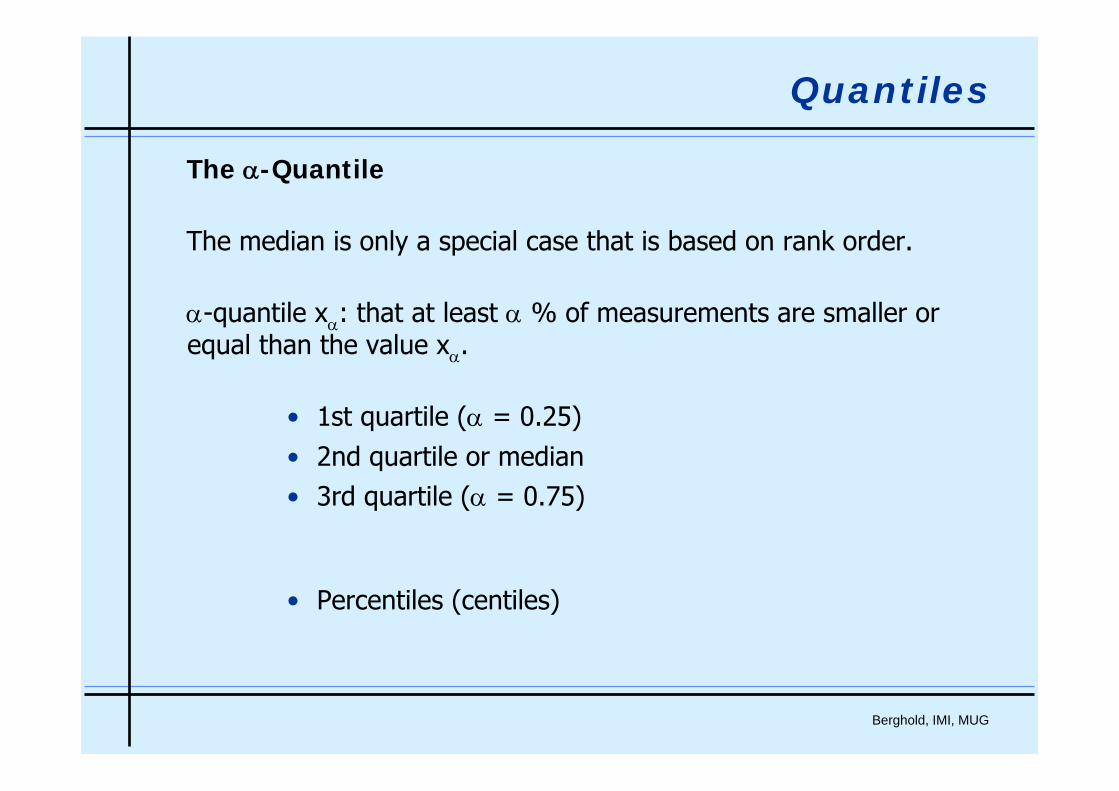
The α-Quantile
The median is only a special case that is based on rank order.
α-quantile xα: that at least α % of measurements are smaller orequal than the value xα.
• 1st quartile (α = 0.25)• 2nd quartile or median• 3rd quartile (α = 0.75)
• Percentiles (centiles)

Berghold, IMI, MUG
Quantiles
The α-Quantile xα
Calculation:
α*n, rankorder m
• if α*n is not an integer, than m is the next integer following α*nand xα= x(m).
• if α*n is an integer, than m = α*n and
21++
= mm xxxα
Berghold, IMI, MUG
Quantiles

Berghold, IMI, MUG
Data:
1 2 3 4 5 6 7 8 9 10 11 12 13 14 15 16
5, 2, 2, 6, 7, 2, -40, 2, 3, 2, 1, 1, 12, 3, 4, 0
-40, 0, 1, 1, 2, 2, 2, 2, 2, 3, 3, 4, 5, 6, 7, 12
Interquartile range = Q3 – Q1 = 3
Me = 2.0 Q3 = 4.5Q1 = 1.5
Quantiles

Berghold, IMI, MUG
Interquartile Range
Interquartile range
The 50% central range is sometimes used to describe variability
IQR = 3rd quartile - 1st quartile

Berghold, IMI, MUG
Box-and-Whisker Plot
minimum
1st quartile
median
3rd quartile
maximum
Berghold, IMI, MUG
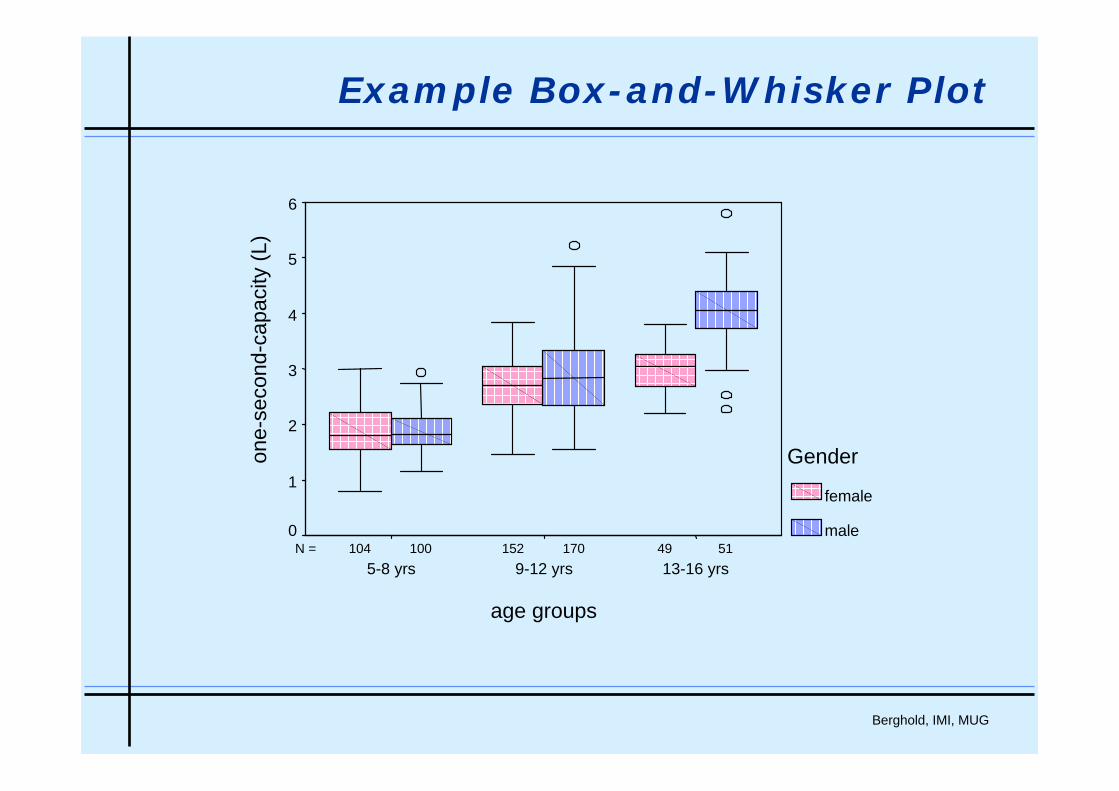
Example Box-and-Whisker Plot
51170100 49152104N =
age groups
13-16 yrs9-12 yrs5-8 yrs
one-
seco
nd-c
apac
ity(L
)
6
5
4
3
2
1
0
Gender
female
male
Berghold, IMI, MUG
In bunten Bildernwenig Klarheit,viel Irrtum undein wenig Wahrheit.
J. W. v. Goethe
15
0
5
20
25
0
546
213

Berghold, IMI, MUG
Numerical Presentation
Data summary should not be by the mean (median) alone, but someindication of variability should also be provided.
E.g.: "... the mean diastolic blood pressure was 102.3 mm Hg (SD 11.9)."
mean: quote it to one extra decimal place compared withthe raw data (depending on amount of data)
standard deviation: display with same precision as meanor with one more decimal place.
Presentation of Results

Berghold, IMI, MUG
Tables
Mean (SD)
Age 67,8 (10,8) Total Cholesterol 213,3 (41,1)
Triglycerides 129,4 (72,0)
frequency % Gender f 35 (46)
m 41 (54)
PAVK-Grade II b 38 (50) III 20 (26) IV 18 (24)