exploring the engineering student experience the engineering student experience: findings from the...
TRANSCRIPT
Exploring the Engineering Student Experience:
Findings from the Academic Pathways of People Learning Engineering Survey (APPLES)
TR-10-01
Sheri Sheppard, Shannon Gilmartin, Helen L. Chen, Krista Donaldson, Gary Lichtenstein, Özgür Eris, Micah Lande, and
George Toye
September 2010


Center for the Advancement of Engineering Education Technical Report CAEE-TR-10-01 This publication is available on the CAEE web site: http://www.engr.washington.edu/caee/
This publication is licensed under a Creative Commons Attribution-Noncommercial-No Derivative Works 3.0 Unported License. A copy of this license is available at: http://creativecommons.org/licenses/by-nc-nd/3.0/ Suggested citation for this publication: Sheppard, S., Gilmartin, S., Chen, H.L., Donaldson, K., Lichtenstein, G., Eris, Ö., Lande, M., & Toye, G. (2010). Exploring the Engineering Student Experience: Findings from the Academic Pathways of People Learning Engineering Survey (APPLES) (TR-10-01). Seattle, WA: Center for the Advancement for Engineering Education.


Table of Contents
Introduction ..................................................................................................................................... i Acknowledgments .......................................................................................................................... ii Part I. The APPLE Survey and Population ................................................................................. 1 Chapter 1. What is the APPLE Survey Tool?.............................................................................. 2 Chapter 2: Who participated in APPLES? ................................................................................ 11
2.1 APPLES Institutional Recruitment and Demographics ................................................... 11 2.2 APPLES Student Recruitment and Demographics ........................................................... 14
Chapter 3: What is in this report? .............................................................................................. 20 Part II. The Big Picture of the Student Experience .................................................................. 23 Chapter 4: Who are these students? ........................................................................................... 24
4.1 Demographic Characteristics ........................................................................................... 24 4.2 What Engineering Fields Are Represented in this Sample? ............................................. 28
Chapter 5: What is the college experience like? ........................................................................ 31 5.1 The College Experience—Seniors ................................................................................... 33 5.2 The College Experience—Seniors Versus First-Year Students ....................................... 36 5.3 Findings About the College Experience ........................................................................... 38
Positive differences between seniors and first-years ......................................................... 38 Negative difference between seniors and first-years ......................................................... 39 Women and men, alike and different ................................................................................ 39
Chapter 6: What motivates students to study engineering? ..................................................... 40 6.1 Motivation Among Seniors .............................................................................................. 40
Motivational factors interrelated ....................................................................................... 42 Motivational factors related to instructors ......................................................................... 43 Motivational factors related to out-of-classroom college experiences .............................. 43 Motivational factors as related to major and gender ......................................................... 44
6.2 Comparing Motivation Between Seniors and First-Year Students .................................. 45 Motivational factors related to instructors and team-based project work .......................... 47 First-year student motivation as related to persistence in engineering .............................. 47
6.3 Findings: What Motivates Students to Study Engineering ............................................... 48 A range of motivational factors ......................................................................................... 48 How to reinforce motivation ............................................................................................. 48 Motivational differences between women and men .......................................................... 49 Motivation and persistence in engineering ........................................................................ 49
Chapter 7: How do students learn about engineering? ............................................................. 50 7.1 Seniors’ Knowledge About Engineering .......................................................................... 50
Correlates of knowledge gain among seniors .................................................................... 51 Perceived importance of key skills among seniors ............................................................ 52
7.2 Knowledge—Seniors and First-Year Students ................................................................. 54 Correlates of knowledge gain among first-year students .................................................. 55

Perceived importance of key skills among first-year students .......................................... 55 7.3 Findings: How Students Learn About Engineering .......................................................... 56
First-years vs. seniors ........................................................................................................ 56 Recognizing what is important in engineering work ......................................................... 56 Women and men learning about engineering .................................................................... 57
Part III. An Overlay of URM Status on the Engineering Student Experience ....................... 58 Chapter 8: Do engineering students’ motivations and college experiences vary by URM
status? ................................................................................................................................... 59 8.1 Sample Sizes and Presentation of Data ............................................................................ 59 8.2 Critical Takeaways ........................................................................................................... 64 8.3 Findings: How URM Status Differentiates the Experience.............................................. 65
Chapter 9: Do family and socioeconomic characteristics vary by URM status? .................... 66 9.1 SES-Related Demographics ............................................................................................. 66 9.2 Findings: Family and Socioeconomic Backgrounds of URM Students Compared to Non-URM Students ........................................................................................................................ 69
URM status, gender, and SES are interrelated .................................................................. 69 Part IV. Engineering-Related Outcomes .................................................................................... 70 Chapter 10: How confident are students? What contributes to confidence? .......................... 71
10.1 Students’ Confidence in Engineering-related Skills ....................................................... 71 Seniors and confidence ...................................................................................................... 71 Confidence among first-year students and seniors ............................................................ 74 Confidence, gender, and URM status ................................................................................ 74
10.2 Modeling of Confidence ................................................................................................. 75 Introduction to the models ................................................................................................. 75 What the models say .......................................................................................................... 81
10.3 Findings: What Confidence Looks Like and What Contributes to It ............................. 82 Not all confidence levels are equal .................................................................................... 82 Confidence in math and science skills remains constant ................................................... 83 Demographic variation and possible interactions for further study .................................. 84 Why are there the differences in perceived importance and confidence in key skills? ..... 84
Chapter 11: What do students’ post-graduation plans look like? What contributes to these plans? ..................................................................................................................................... 85 11.1 Descriptions of Post-Graduation Intentions ................................................................... 85
Engineering options ........................................................................................................... 88 Non-engineering options ................................................................................................... 89 Combinations of plans, diverse pathways ......................................................................... 90 Post-graduation plans of URM and non-URM students .................................................... 91
11.2 Modeling Post-Graduation Plans .................................................................................... 94 Overview of the regression models ................................................................................... 94 Senior regression models ................................................................................................... 97 First-year student regression models ............................................................................... 102 Findings from the models: An overview ......................................................................... 105

11.3 Detailed Description of Findings from the Models ...................................................... 107 Senior student models ..................................................................................................... 108 First-year student models ................................................................................................ 112 Do top senior predictors vary by gender? A look at interaction effects .......................... 113 Additional thoughts on demographic (non-)variation in post-graduation plans .............. 114
11.4 Findings: Students’ Post-Graduation Plans and What Contributes to Them ................ 114 Post-graduation directions: Most seniors positive on engineering jobs .......................... 115 Post-graduation directions: Forty percent considering engineering graduate work ........ 115 Post-graduation directions: Seniors still unsure and have a combination of plans .......... 116 The faces of tomorrow’s professionals: URM graduate school plans ............................. 116 The faces of tomorrow’s professionals: Women’s plans are similar to men’s, but… ..... 117 Key factors in plans … .................................................................................................... 117
Chapter 12: A different way to look at students ...................................................................... 119 12.1 Group Demographics ................................................................................................... 120 12.2 Key Variables by Group ............................................................................................... 121
Group 1 (M/C): The High Involvement Group ............................................................... 122 Group 4 (m/c): The Low Involvement Group ................................................................. 122 Group 2 (M/c): The Average Involvement, Engineering Focused Group ....................... 122 Group 3 (m/C): The Average Involvement, Non-Engineering Focused Group .............. 122 The group profiles: What they might tell us about engineering seniors .......................... 123 Mean differences by group: Detailed findings ................................................................ 123
12.3 Post-Graduation Plans by Motivation/Confidence Groupings ..................................... 128 Group 2 (M/c): The Average Involvement, Engineering Focused Group ....................... 132 Group 3 (m/C): The Average Involvement, Non-Engineering Focused Group .............. 132 Group 1 (M/C): The High Involvement Group ............................................................... 132 Group 4 (m/c): The Low Involvement Group ................................................................. 133
12.4 Implications for Practice: Developing Professional Skills and Career Plans ............... 133 Learning to see oneself in engineering ............................................................................ 133 Professional and interpersonal skill development ........................................................... 133 Heading away from engineering ..................................................................................... 134 Helping students think through multiple options ............................................................ 134
Part V. Looking Forward .......................................................................................................... 135 Chapter 13: Five key takeaways ............................................................................................... 136
13.1 Key Insight #1: Primary Interest Comes From Within ................................................ 136 13.2 Key Insight #2: Learning About Engineering Linked to Multiple Sources ................. 137 13.3 Key Insight #3: Professional and Interpersonal Skills Play Out in Surprising Ways ... 137 13.4 Key Insight #4: Intrinsic Psychological Motivation and Confidence in Professional and Interpersonal Skills—Two Telling Variables ....................................................................... 138 13.5 Key Insight #5: Demographics Matter—But How Much? ........................................... 138
Chapter 14: Implications for practice and new questions ...................................................... 140 14.1 Key Insight #1: Primary Interest Comes From Within ................................................ 140
Implications for Educational Practice ............................................................................. 140 New Research Questions ................................................................................................. 140

14.2 Key Insight #2: Learning About Engineering Linked to Multiple Sources ................. 140 Implications for Educational Practice ............................................................................. 140 New Research Questions ................................................................................................. 141
14.3 Key Insight #3: Professional and Interpersonal Skills Play Out in Surprising Ways ... 141 Implications for Educational Practice ............................................................................. 141 New Research Questions ................................................................................................. 141
14.4 Key Insight #4: Intrinsic Psychological Motivation and Confidence in Professional and Interpersonal Skills—Two Telling Variables ....................................................................... 142
Implications for Educational Practice ............................................................................. 142 New Research Questions ................................................................................................. 142
14.5 Key Insight #5: Demographics Matter—But How Much? ........................................... 142 Implications for Educational Practice ............................................................................. 142 New Research Questions ................................................................................................. 142
Part VI. References .................................................................................................................... 144 Part VII. Appendices .................................................................................................................. 148
I.1 The Academic Pathways of People Learning Engineering Survey (APPLES) Instrument I.2 Descriptions of the Major Declaration Process and Institutional Selectivity Characteristics I.3 Definitions of APPLES Engineering Majors and Other Majors II.1 Means and Standard Deviations of Core Constructs II.2 Simple Correlation Coefficients: First-Year Students II.3 Calculating APPLES Multi-Item Variables IV Methodological Notes for Regressions

List of Tables and Figures
Chapter 1: What is the APPLE Survey Tool? Table 1.1 Survey Development Timeline .................................................................................................... 2 Table 1.2 Mapping of Core Variables Across APS Survey Instruments ...................................................... 3 Table 1.3 Internal Consistency of Multi-Item APPLES Variables ............................................................... 4 Table 1.4 Single-Item APPLES Variables and Related Items ...................................................................... 6 Table 1.5 APPLES Demographic Items ....................................................................................................... 7 Table 1.6 Definitions and Rationale Behind the APPLE Survey Variables ................................................. 8 Chapter 2: Who participated in APPLES? Table 2.1 Summary of Primary and Secondary Stratification Characteristics ............................................ 11 Table 2.2 Descriptions of Institutional Characteristics ............................................................................... 12 Table 2.3 Summary of Stratification Characteristics Relative to National Picture ..................................... 13 Table 2.4 Summary of APPLES Students by Institutional Characteristics................................................. 14 Table 2.5 Summary of Demographic Characteristics of APPLES Respondents ........................................ 15 Chapter 3: What is in this report? Table 3.1 APPLES Variables Considered in Part I ..................................................................................... 21 Table 3.2 APPLES Variables Considered in Part III .................................................................................. 22 Table 3.3 APPLES Variables Considered in Part IV .................................................................................. 22 Chapter 4: Who are these students? Table 4.1 Gender and Racial/Ethnic Background of First-Year and Senior Students ................................ 24 Table 4.2 Race and Ethnicity of Engineering Seniors ................................................................................ 25 Table 4.3 Additional Demographics on First-Year and Senior Students by Gender .................................. 27 Table 4.4 Single and Double Major Patterns of First-Year and Senior Students by Gender ...................... 28 Figure 4.1 Comparison of Engineering Majors in APPLES’ Senior Population with NSF 2005 Data ...... 29 Table 4.5 Distribution of Majors Among APPLES Senior Women and Men ............................................ 30 Chapter 5: What is the college experience like? Table 5.1 Simple Correlation Coefficients: Academic Experiences Among Senior Women ..................... 31 Table 5.2 Simple Correlation Coefficients: Academic Experiences Among Senior Men .......................... 32 Table 5.3 The Coursework Experience of APPLES Seniors ...................................................................... 33 Table 5.4 Activities of APPLES Seniors Outside of the Classroom ........................................................... 34 Table 5.5 “Outcomes” of the College Experience ...................................................................................... 35 Table 5.6 Comparing Coursework Experience Variables for First-Year Students and Seniors ................. 36 Table 5.7 Comparing Activities Out of the Classroom for First-Year Students and Seniors ..................... 37 Table 5.8 Comparing “Outcomes” for First-Year Students and Seniors .................................................... 38 Chapter 6: What motivates students to study engineering? Figure 6.1 Seniors’ Motivation to Study Engineering ................................................................................ 40 Figure 6.2 Seniors’ Motivation to Study Engineering by Gender .............................................................. 41 Table 6.1a Simple Correlation Coefficients: Motivational Factors Among Senior Women ...................... 42 Table 6.1b Simple Correlation Coefficients: Motivational Factors Among Senior Men ........................... 43 Table 6.2 Simple Correlations Between Motivational Factors and Faculty Interactions Among Seniors by
Gender ............................................................................................................................................ 43

Table 6.3 Simple Correlations Between Motivational Factors and Out-of-Classroom Experiences Among Seniors by Gender .......................................................................................................................... 44
Figure 6.3 First Year Students’ Motivation to Study Engineering by Gender ............................................ 46 Figure 6.4 Motivation to Study Engineering by Academic Standing ......................................................... 46 Table 6.4 Simple Correlations Between Motivational Factors, Faculty Interactions, and Exposure to
Team-Based Projects Among First-Year Students by Gender ....................................................... 47 Table 6.5 Simple Correlations Between Intrinsic Psychological Motivation and Intention to Complete an
Engineering Major Among First-Year Students by Gender .......................................................... 48
Chapter 7: How do students learn about engineering? Table 7.1 Knowledge About Engineering Among Seniors by Gender ....................................................... 50 Table 7.2 Sources of Engineering Knowledge Among Seniors by Gender and Source Type .................... 50 Table 7.3 Simple Correlation Coefficients: Knowledge about Engineering and Select Academic
Experiences Among Senior Women and Men ............................................................................... 51 Table 7.4 Perceived Importance of Skills Among Seniors by Gender........................................................ 52 Table 7.5a Simple Correlation Coefficients: Perceived Importance of Professional/Interpersonal Skills
and Select Academic Experiences Among Senior Women and Men ............................................ 53 Table 7.5b Simple Correlation Coefficients: Perceived Importance of Math/Science Skills and Select
Academic Experiences Among Senior Women and Men .............................................................. 53 Table 7.6: Sources of Engineering Knowledge Among First-Years and Seniors by Source Typ .............. 54 Table 7.7 Knowledge About Engineering Among First-Years and Seniors ............................................... 54 Table 7.8 Simple Correlation Coefficients: Knowledge about Engineering and Select Academic
Experiences Among First-Year Women and Men ......................................................................... 55 Table 7.9 Perceived Importance of Skills Among First-Years and Seniors................................................ 56 Chapter 8: Do engineering students’ motivations and college experiences vary by URM status? Table 8.1 First-Year and Senior Sample Sizes by Gender and URM Status .............................................. 59 Table 8.2 Mean Scores on College Experience Variables by Academic Standing, URM Status, and
Gender ............................................................................................................................................ 61 Table 8.3 Mean Scores on Motivation Variables by Academic Standing, URM Status, and Gender ........ 62 Table 8.4 Knowledge Variables by Academic Standing, URM Status, and Gender .................................. 63 Chapter 9: Do family and socioeconomic characteristics vary by URM status? Table 9.1a Demographic Profile of First-Year Engineering Majors by URM Status ................................. 67 Table 9.1b Demographic Profile of Senior Engineering Majors by URM Status ....................................... 68 Table 9.2 Statistical Significance of SES Differences by URM Status Among First-Year and Senior
Women and Men ............................................................................................................................ 69 Chapter 10: How confident are students? What contributes to confidence? Figure 10.1 Confidence of Senior Women and Men .................................................................................. 72 Table 10.1 Simple Correlation Coefficients: Confidence Measures Among Senior Women and Men ...... 72 Table 10.2 Simple Correlation Coefficients: Confidence in and Perceived Importance of Math/Science
and Professional/Interpersonal Skills Among Senior Women and Men ........................................ 73 Table 10.3 Mean Scores on Confidence Measures by Academic Standing and Gender ............................ 74 Table 10.4 Mean Scores on Confidence Measures by Academic Standing, URM Status, and Gender ..... 75 Table 10.5 Confidence Models: Student-Level Independent Variables ..................................................... 76 Table 10.6 Senior Confidence in Professional/Interpersonal Skills: Student-Level Predictors at Final
Model with All Variables Entered ................................................................................................. 78

Table 10.7 First-Year Student Confidence in Professional/Interpersonal Skills: Student-Level Predictors at Final Model with All Variables Entered .................................................................................... 79
Table 10.8 Senior Confidence in Math/Science Skills: Student-Level Predictors at Final Model with All Variables Entered ........................................................................................................................... 80
Chapter 11: What do students’ post-graduation plans look like? What contributes to these plans? Figure 11.1 Post-Graduation Plans of Seniors ............................................................................................ 86 Figure 11.2 Post-Graduation Plans of Senior Women and Men ................................................................. 86 Figure 11.3 Post-Graduation Plans of Senior and First-Year Students ....................................................... 87 Figure 11.4 Post-Graduation Plans of First-Year Women and Men ........................................................... 87 Table 11.1 Post-Graduation Plans of Senior and First-Year Women and Men .......................................... 88 Figure 11.5 Seniors’ Post-Graduation Plans: Multiple Options and Interests ............................................ 91 Table 11.2 Post-Graduation Plans of Senior and First-Year Women by URM Status ............................... 92 Table 11.3 Post-Graduation Plans of Senior and First-Year Men by URM Status ..................................... 93 Table 11.4 Combinations of Plans for URM and Non-URM Seniors ........................................................ 94 Table 11.5 Student-Level Independent Variables in Four Senior Models and Two First-Year Models .... 96 Table 11.6 Senior Plans to Pursue Engineering Work After Graduation (EngJob): Student-Level
Predictors at Final Model with All Variables Entered ................................................................... 98 Table 11.7 Senior Plans to Attend Engineering Graduate School (EngGS): Student-Level Predictors at
Final Model with All Variables Entered ........................................................................................ 99 Table 11.8 Senior Plans to Pursue a Non-Engineering Job After Graduation (NonEngJob): Student-Level
Predictors at Final Model with All Variables Entered ................................................................. 100 Table 11.9 Senior Plans to Attend Non-Engineering Graduate School (nonEngGS): Student-Level
Predictors at Final Model with All Variables Entered ................................................................. 101 Table 11.10 First-Year Student Plans to Pursue Engineering Work After Graduation (EngJob): Student-
Level Predictors at Final Model with All Variables Entered ....................................................... 103 Table 11.11 First-Year Student Plans to Attend Engineering Graduate School (EngGS): Student-Level
Predictors at Final Model with All Variables Entered ................................................................. 104 Table 11.12 Statistical Significance of Independent Variables in the Four Senior and Two First-Year
Models ......................................................................................................................................... 106 Table 11.13 Independent Variable: Confidence in Professional/Interpersonal Skills .............................. 108 Table 11.14 Independent Variable: Intrinsic Psychological Motivation................................................... 109 Table 11.15 Independent Variable: Exposure to the Engineering Profession ........................................... 109 Table 11.16 Independent Variable: Financial Motivation ........................................................................ 110 Table 11.17 Independent Variable: Academic Involvement: Engineering Courses ................................. 110 Table 11.18 Independent Variable: GPA Index ........................................................................................ 111 Table 11.19 Independent Variable: Frequency of Non-engineering Extracurricular Participation .......... 111 Table 11.20 Independent Variable: Intrinsic Behavioral Motivation ....................................................... 112 Table 11.21 Independent Variable: URM Status ...................................................................................... 113 Chapter 12: A Different Way to Look at Students Table 12.1 The Four Groups Defined ....................................................................................................... 119 Table 12.2 Demographic Characteristics of the Motivation/Confidence Groups ..................................... 120 Table 12.3 Distribution of Seniors by Motivation/Confidence Groupings, URM Status, and Gender ..... 121 Table 12.4 Characterizing the Motivation/Confidence Groups ................................................................ 123 Table 12.5 The Coursework Experience ................................................................................................... 124 Table 12.6 Out-of–Classroom Activities .................................................................................................. 124 Table 12.7 Research Experience ............................................................................................................... 125 Table 12.8 Overall Outcomes of College .................................................................................................. 125

Table 12.9 Motivation to Study Engineering ............................................................................................ 126 Table 12.10 Self-reported Gains in Knowledge of Engineering Since Entering College ......................... 126 Table 12.11 Perceived Importance............................................................................................................ 127 Table 12.12 Confidence ............................................................................................................................ 127 Table 12.13 Post-Graduation Plans of Seniors by Group ......................................................................... 129 Table 12.14 Senior Plans to Pursue Engineering Work After Graduation and the Role of
Motivation/Confidence Groups: Student-Level Predictors at Final Model with All Variables Entered ......................................................................................................................................... 130
Table 12.15 Combinations of Plans by Group .......................................................................................... 131

Exploring the Engineering Student Experience i
Introduction
This report is based on data from the Academic Pathways of People Learning Engineering Survey (APPLES), administered to engineering students at 21 U.S. engineering colleges and schools in the spring of 2008. The first comprehensive set of analyses completed on the APPLES dataset presented here looks at how engineering students experience their education, how they gain knowledge of what engineering is, and what their post-graduation plans are. The APPLES instrument is one of the research tools developed and used by the National Science Foundation-funded Academic Pathways Study (APS)1. The APPLES study represented the major cross-sectional survey component of the APS. Other components included a four-year longitudinal study of 160 engineering students at four institutions, and interviews of over 90 practicing engineers in a range of professional settings. Taken together, these components were designed to expand our understanding of the undergraduate engineering experience and the transition from school to the workplace. The APS research questions focus on four primary areas that investigate what engineering graduates need to succeed in an increasingly complex world:
• Skills and Knowledge: How do students’ engineering skills and knowledge develop and/or change over time?
• Identity: How do students come to identify themselves as engineers? How does student appreciation, confidence, and commitment to engineering change as they navigate their education? How does this in turn impact how these students make decisions about further participation in engineering after graduation?
• Education: What elements of students’ engineering educations contribute to changes observed in the questions related to skills, knowledge, and identity? What do students find difficult and how do they deal with the difficulties they face?
• Workplace: How do students and early career engineers conceive of their engineering future? What skills do early career engineers need as they enter the workplace? Where did they obtain these skills? Are there any missing skills?
More on the APS, its design and research findings, can be found at: http://www.engr.washington.edu/caee/publications.html#Resources
1 The APS is one of three elements within The Center for the Advancement of Engineering Education (CAEE). The other two elements of CAEE are the Scholarship on Teaching Engineering and the Institute for Scholarship on Engineering Education. The CAEE partner institutions are Colorado School of Mines, Howard University, Stanford University, University of Minnesota, and University of Washington, the lead institution.

Exploring the Engineering Student Experience ii
Acknowledgements
The work presented in this report on APPLES would not have been possible without the involvement of many people. We wish to acknowledge the 21 schools who participated in the deployment of APPLES; at each school we were assisted by the dean of engineering, a campus coordinator, and the undergraduate students who completed APPLES. Also critical to this work were our CAEE colleagues who provided advice and encouragement at all stages of the project: Cindy Atman, Robin Adams, Sylvia Bach, Debbie Chachra, Mia Clark, Lorraine Fleming, Deborah Kilgore, Stacie Lande, Judy Lee, Heidi Loshbaugh, Dennis Lund, Ron Miller, Shehan Perera, Reed Stevens, Ruth Streveler, Jennifer Turns, Ken Yasuhara; and Dr. Anthony Antonio and PhD students Samantha Brunhaver, Sarah Parikh, and Elizabeth Otto who provided technical reviews. We acknowledge the generous support of the National Science Foundation through Grant No. ESI-0227558, which funded the Academic Pathways Study through the Center for the Advancement of Engineering Education, a collaboration of five partner universities.

Exploring the Engineering Student Experience 1
Part I. The APPLE Survey and Population
The major cross-sectional component of the APS was the Academic Pathways of People Learning Engineering Survey (APPLES). A main objective of the APPLE Survey was to explore the educational experiences of students at a range of types of engineering schools. In addition, the instrument was designed to corroborate and expand upon earlier findings from the APS longitudinal cohort study that ran from 2003-2007 in which 160 engineering students were followed from the beginning of college to graduation. The APPLES instrument was derived from the survey instrument for the longitudinal cohort, called the Persistence in Engineering (PIE) survey. A common set of variables between the PIE Survey and the APPLE Survey provided a natural link. The first administration of APPLES (“APPLES1”) was deployed in April 2007 and was focused on the broader population of students at the same four core institutions that participated in the earlier APS longitudinal study. Students who were either studying engineering, interested in studying engineering, or who thought they would study engineering but later opted for a non-engineering major were invited to complete the survey. They were recruited using posters, ads in the student newspaper, email invitations from the school of engineering, student engineering societies and departments, and announcements made in relevant courses (Donaldson et al., 2007). Over 900 students completed the APPLES1 survey. The second administration of APPLES (called “APPLES2” in previous publications) was conducted from January to March 2008 with a carefully selected, stratified sample of 21 universities in the U.S. Although the targeted population was American undergraduate engineering students, it was not feasible to randomly sample individual students. Instead, sampling was done by institution using a stratified approach based on institutional characteristics. A total of 4,587 students across 21 institutions participated in the survey. After data cleaning (for example, the removal of ineligible respondents such as graduate students), the final data set size included 4,266 subjects. The average survey response rate relative to the undergraduate engineering population at participating institutions was 14 percent. Individual school response rates varied from 49 percent at a small institution to 5 percent at a medium-large institution (Donaldson et al., 2008a). This report presents the first set of analyses conducted on the APPLES dataset. The first section of the report (Chapters 1-3) is an overview of the APPLES instrument along with demographics of the overall cross-sectional population surveyed. In Chapter 1, the APPLES instrument is described, including definitions of the variables which form the basis of the rest of the report. Chapter 2 specifies the selection of the 21 schools where APPLES was deployed and the demographics of the 4,266 students who completed the survey. Then in Chapter 3, the organization of the remainder of the report and its focus on the comparisons between first-year and senior engineering majors are outlined


Exploring the Engineering Student Experience 2
Chapter 1: What is the APPLE survey tool?
The APPLES tool and its deployment in 2008 are the focus of this report. Some basic facts on APPLES to orient the reader are:
• APPLES stands for the Academic Pathways of People Learning Engineering Survey. • APPLES is a 10-minute online survey designed to characterize the engineering
undergraduate experience and factors that influence undergraduate persistence in the engineering major and subsequently, the engineering profession.
• APPLES was derived from a longer survey called the Persistence in Engineering (PIE) Survey designed to study a longitudinal cohort of 160 students.
• APPLES was administered in early 2008 to over 4,500 undergraduate students, first-year to senior year, currently, previously, or intending to study engineering. The 21 institutions sampled were selected based on a variety of institutional characteristics including Carnegie Classification.
• After data cleaning, the data set used for analysis consisted of 4,266 students. • The average response rate relative to the undergraduate engineering populations at the
participating institutions was 14 percent. • APPLES participants were offered a $4 incentive to complete the survey. Not all
participants collected the incentive; the average incentive cost per APPLES participant was $2.65.
The timeline for deployment of APPLES is shown in Table 1.1. Because of the close relationship of APPLES to the Persistence in Engineering Survey, both are shown in the table. Table 1.1 Survey Development Timeline
2003 2004 2005 2006 2007 2008
PIE Survey developed and refined over seven longitudinal administrations to 160 students at four institutions
APPLES1 deployed to more than 900 students at four institutions
APPLES2* deployed to over 4,200 students at 21 institutions
* This and other recent reports refer to APPLES2 simply as “APPLES.” Table 1.2 lists the core variables in APPLES and its predecessor, the PIE survey, organized according to the relevant APS research question category. Table 1.1 also identifies whether the variable was addressed in one, two, or all three of the APS survey instruments, thereby providing some sense of the evolution of individual variables over the course of the study. Although several of the survey items comprising each variable were slightly modified and refined over time, the meaning and definition of each of the variables largely remained constant across surveys.

Exploring the Engineering Student Experience 3
Table 1.2 Mapping of Core Variables Across APS Survey Instruments
APS Research Question Category
APS Survey Instrument APPLES (2008) PIE Survey (2003-2007) APPLES1 (2007)
SKILLS Confidence in Math and Science Skills Confidence in Professional and Interpersonal Skills Confidence in Solving Open-Ended Problems Perceived Importance of Math and Science Skills Perceived Importance of Professional and Interpersonal Skills
IDENTITY Motivation (Financial) Motivation (Parental Influence) Motivation (Social Good) Motivation (Mentor Influence) Extracurricular Fulfillment Intrinsic Motivation
(Psychological) --- ---
Intrinsic Motivation (Behavioral)
--- ---
EDUCATION Academic Persistence*
Curriculum Overload Financial Difficulties* Academic Disengagement (Liberal Arts Courses) Academic Disengagement (Engineering) Frequency of Interaction with Instructors Satisfaction with Instructors Overall Satisfaction with Collegiate Experience* Exposure to Project-
Based Learning Methods (Group & Individual
Projects) *
--- Exposure to Project-Based Learning Methods
(Group & Individual Projects) *
--- --- Collaborative Work Style
--- --- Satisfaction with Academic Facilities
WORKPLACE Professional Persistence* Knowledge of the Engineering Profession*
* Indicates a variable defined by a single survey item Table 1.3 describes the 16 multi-item variables in the APPLES instrument. These are variables that potentially influence students’ intentions to major in engineering and eventually, to continue studying or working in an engineering field. Included in the table for each variable are the Cronbach’s alpha scores, a test of internal consistency of the individual items that comprise each variable. These scores measure the statistical reliability resulting from the similarity of individual item responses and represent the extent to which the items in a scale can be treated as measuring the same latent construct (such as motivation). Generally speaking, Cronbach’s alphas of .60 and higher are considered to be an acceptable level of internal consistency, although this threshold is arbitrary and an alpha value of .70 or above is preferable.

Exploring the Engineering Student Experience 4
Table 1.3 Internal Consistency of Multi-Item APPLES Variables (Cronbach’s Alphas)
Variable and Constituent Items
APPLES2 Cronbach’s
Alpha
APPLES1 Cronbach’s
Alpha 1. Motivation (Financial) 0.81 0.82
Engineers are well paid. Engineers make more money than most other professionals. An engineering degree will guarantee me a job when I graduate.
2. Motivation (Parental Influence) 0.83 0.87 My parents would disapprove if I chose a major other than engineering.
My parents want me to be an engineer. 3. Motivation (Social Good) 0.77 0.64
Technology plays an important role in solving society’s problems.
Engineers have contributed greatly to fixing problems in the world.
Engineering skills can be used for the good of society. Not asked 4. Motivation (Mentor Influence) 0.77 0.60
A faculty member, academic advisor, teaching assistant or other university affiliated person has encouraged and/or inspired me to study engineering.
A non-university affiliated mentor has encouraged and/or inspired me to study engineering.
A mentor has introduced me to people and opportunities in engineering.
Not asked
A mentor has supported my decision to major in engineering. Not asked 5. Motivation (Intrinsic, Psychological) 0.75 Not asked
I feel good when I am doing engineering I think engineering is fun I think engineering is interesting
6. Motivation (Intrinsic, Behavioral) 0.72 Not asked I like to build stuff I like to figure out how things work
7. Confidence in Math and Science Skills 0.80 0.82 Confidence: Science ability Confidence: Math ability Confidence: Ability to apply math and science principles in solving real world problems
8. Confidence in Professional and Interpersonal Skills 0.82 0.80 Confidence: Self confidence (social) Confidence: Leadership ability Confidence: Public speaking ability Confidence: Communication skills Confidence: Business ability Confidence: Ability to perform in teams

Exploring the Engineering Student Experience 5
Variable and Constituent Items
APPLES2 Cronbach’s
Alpha
APPLES1 Cronbach’s
Alpha 9. Confidence in Solving Open-Ended Problems 0.65 0.68
Creative thinking is one of my strengths I am skilled at solving problems with multiple solutions Confidence: Critical thinking skills
10. Perceived Importance of Math and Science Skills 0.80 0.79 Perceived importance: Math ability Perceived importance: Science ability Perceived importance: Ability to apply math and science principles in solving real world problems
11. Perceived Importance of Professional and Interpersonal Skills
0.82 0.83
Perceived importance: Self confidence (social) Perceived importance: Leadership ability Perceived importance: Public speaking ability Perceived importance: Communication skills Perceived importance: Business ability Perceived importance: Ability to perform in teams
12. Curriculum Overload 0.82 0.78 How well are you meeting the workload demands of your coursework?
How stressed do you feel in your coursework right now? During the current year, how much pressure have you felt with course load
During the current year, how much pressure have you felt with course pace
During the current year, how much pressure have you felt with balance between social and academic life
13. Academic Disengagement (Liberal Arts Courses) 0.75 0.88 Came late to liberal arts class Skipped liberal arts class Turned in liberal arts assignments that did not reflect your best work
Turned in liberal arts assignments late 14. Academic Disengagement (Engineering-related Courses) 0.71 0.86
Came late to engineering class Skipped engineering class Turned in engineering assignments that did not reflect your best work
Turned in engineering assignments late 15. Frequency of Interaction with Instructors 0.70 0.74
Instructors during class Instructors during office hours Instructors outside of class or office hours
16. Satisfaction with Instructors 0.79 0.72 Quality of instruction Availability of instructors

Exploring the Engineering Student Experience 6
Variable and Constituent Items
APPLES2 Cronbach’s
Alpha
APPLES1 Cronbach’s
Alpha Quality of advising by instructors Academic advising
A few modifications were made to the APPLES instrument between the first (2007) and second (2008) deployments. Changes included adding items in order to bolster the internal reliability of one variable (as shown in Table 1.3) and two new variables on internal motivation were incorporated. Tables 1.4 and 1.5 provide more detail on the other items in the APPLES instrument including nine additional single item variables used to describe the student experience (Table 1.4) and the APPLES demographic items used to characterize the survey respondents (Table 1.5). Table 1.6 gives background on the variables, and a copy of the final APPLES instrument, which includes response options for all survey items, can be found in Appendix I.1. More on APPLES can be found at: http://www.applesurvey.org/ Table 1.4 Single-Item APPLES Variables and Related Items
17. Academic Persistence Do you intend to complete a major in engineering?
18. Professional Persistence Do you intend to practice, conduct research in, or teach engineering for at least 3 years after graduation? Do you see yourself pursuing a career in engineering? How likely is it that you would do each of the following after graduation: Work in an engineering job How likely is it that you would do each of the following after graduation: Work in a non-engineering job How likely is it that you would do each of the following after graduation: Go to graduate school in an engineering discipline How likely is it that you would do each of the following after graduation: Go to graduate school in a non-engineering discipline
19. Exposure to the Engineering Profession How much exposure have you had to a professional engineering environment as a visitor, intern, or employee?
20. Knowledge of the Engineering Profession Before college, how much knowledge did you have about the engineering profession? Since entering college, how much knowledge have you gained about the engineering profession? How did you gain your knowledge about the engineering profession?
From being a visitor From being a co-op student or intern From being an employee From a family member From a close friend From school-related experiences From other
Do any of your immediate family members (parents, siblings) hold an engineering degree?

Exploring the Engineering Student Experience 7
21. Exposure to Project-Based Learning Methods During the current school year, what portion of your classes have used the following teaching methods? Individual projects During the current school year, what portion of your classes have used the following teaching methods? Team projects
22. Extracurricular Involvement (Engineering and Non-Engineering) Importance of non-engineering activities on or off campus Involvement in non-engineering activities Level of involvement: Student engineering activities such as engineering clubs or societies
23. Research Experience Since coming to college, have you had any research experiences in engineering and/or non-engineering areas
24. Financial Difficulties Do you have any concerns about your ability to finance your college education?
25. Overall Satisfaction with Collegiate Experience Rate the overall quality of your collegiate experience so far
Table 1.5 APPLES Demographic Items 26. Student Characteristics
What school are you currently attending? Gender Racial or ethnic identification Age Housing: which of the following best describes where you are living now while attending college?
27. Academic Status What is your current academic standing?(freshman, sophomore, junior, senior, 5th year senior, graduate student, other) When you first entered this institution, were you: (first-time, returning, transfer student) Full-time/part-time student? What is your cumulative grade point average? [GPA Index]
28. Academic Interests and Majors What were you most interested in majoring in when you first came to university? What is your current major or first choice of major? What is your second choice or major or second major/minor?
29. Citizenship, Immigration and Cultural Status Citizenship status (U.S. citizen, permanent resident of U.S., other) Were you born in the U.S.? Did one or more of your parents/guardians immigrate to the U.S.? Is English your first language? Are you a first generation college student?
30. Socioeconomic Status Would you describe your family as low, lower middle, middle, upper-middle, or high income? Highest level of education mother completed Highest level of education father completed

Exploring the Engineering Student Experience 8
Table 1.6 Definitions and Rationale Behind the APPLE Survey Variables
APPLES Variable Variable Description and Rationale
1. Motivation to Study Engineering: Financial
Motivation to study engineering due to the belief that engineering will provide a financially rewarding career. Astin (1993) found that engineering majors frequently reported that the “chief benefit of college is making money.” Seymour found that the belief “science, mathematics and engineering career options and rewards are not worth the effort to get the degree" influenced the decision to leave engineering (Adelman, 1998; Seymour & Hewitt, 1997). This variable was borrowed from the Pittsburgh Freshman Engineering Attitudes Survey (PFEAS) (Besterfield-Sacre et al, 1995; 1997).
2. Motivation to Study Engineering: Parental Influence
Motivation to study engineering due to parental influences. Astin found that having a father who is an engineer was an indicator for engineering as a career choice (Adelman, 1998). However, Seymour and Hewitt’s findings (1994, 1997) suggest that men leaving science and engineering majors are those most likely to have followed a “family career tradition” into science and engineering fields. This variable was borrowed from the PFEAS.
3. Motivation to Study Engineering: Social Good
Motivation to study engineering due to the belief that engineers improve the welfare of society. Since Astin (1993) reported that engineering majors frequently voiced the belief that “individuals can’t change society,” it is relevant to investigate whether this motivation variable is a persistence factor. Also, Nicholls et al. (2007) reported that non-STEM students were more likely to be motivated by influencing social values than STEM students. Thus, students who leave engineering might respond more strongly to this variable than the ones who stay. This variable was borrowed from the PFEAS.
4. Motivation to Study Engineering: Mentor Influence
Motivation to study engineering due to the influence of mentor(s) while in college. Schuman et al. (1999) suggested that students who drop out of engineering do not seek counseling services that are offered by the institutions.
5. Motivation to Study Engineering: Intrinsic Psychological
Motivation to study engineering for its own sake, to experience enjoyment that is inherent in the activity. This variable is a modified version of the intrinsic motivation subscale of the Situational Motivation Scale (SIMS) (Guay, Vallerand, & Blanchard, 2000).
6. Motivation to Study Engineering: Intrinsic Behavioral
Motivation related to practical and hands-on aspects of engineering, e.g., “I like to figure out how things work,” “I like to build stuff.”
7. Confidence in Math and Science Skills
Math and science skills refer to proficiency in science, critical thinking, real-world problem solving, and computation. Engineering majors frequently reported “growth in analytic and problem-solving skills” during their undergraduate careers in Astin (1993). Besterfield-Sacre (1995, 1997) also identified “low confidence in basic mathematics, science, and engineering skills” as a characteristic of engineering students who did not persist. Burtner (1994) identified confidence in math and science ability as a predictor for short and long term persistence in engineering.

Exploring the Engineering Student Experience 9
8. Confidence in Professional and Interpersonal Skills
Professional and interpersonal skills refer to proficiency in business, communication and teamwork. The variable explores the relationship between self-efficacy and persistence in engineering education. Seymour identified “feeling discouraged/losing confidence due to low grades in early years” as a persistence factor (Seymour & Hewitt, 1994; 1997). Seymour’s findings are relevant to all three variables that are associated with self reported confidence.
9. Confidence in Solving Open-Ended Problems
Level of confidence in the ability to engage problems with multiple solutions. Although there is agreement that practicing engineers solve open-ended problems, it is not clear whether engineering curricula successfully prepare students to tackle such problems (Dym, 2005).
10. Perceived Importance of Math and Science Skills
Perceived importance of math and science skills, as measured by Variable 7, in becoming a successful engineer.
11. Perceived Importance of Professional and Interpersonal Skills
Perceived importance of professional and interpersonal engineering knowledge and skills, as measured by Variable 8, in becoming a successful engineer.
12. Curriculum Overload
Level of difficulty in coping with the pace and load demands of engineering-related courses. Seymour identified the level and the large volume of work required in the engineering curriculum, coupled with the rapid pace at which the information must be absorbed, to be a strong persistence factor (Seymour & Hewitt, 1994; 1997). Adelman (1998) reported that although the engineering major credit loads are not significantly higher than those of other majors, engineering students “perceive overload because of the high ratio of classroom, laboratory, and study hours to credit awarded.”
13. & 14. Academic Involvement (Liberal Arts, Engineering Related Courses)
Frequency of events signaling disengagement or lack of involvement from engineering and non-engineering courses. Seymour found that a lack of or loss of interest in science, mathematics and engineering, as well as a belief that non-engineering majors offer a “better education,” were both persistence factors (Seymour & Hewitt, 1994, 1997). Thus, lower involvement in engineering courses, while remaining engaged in non-engineering courses, might be a precursor to leaving engineering. On the other hand, disengagement from both engineering and non-engineering courses might be a precursor to leaving college. This variable was borrowed from the Your First College Year (YFYC) survey (Higher Education Research Institute, 2010b).
15. Frequency of Interaction with Instructors
Frequency of interactions with faculty and teaching assistants. Seymour found “poor teaching by science, mathematics, and engineering faculty” to be a strong persistence factor (Seymour & Hewitt, 1994; 1997). Strong correlation between student-faculty interaction and college GPA and retention have been reported (French, 2003). Also, engineering faculty often rely heavily on TAs in order to carry out teaching responsibilities, who might lack adequate teaching experience, which may also be a persistence factor. Furthermore, a significant percentage of TAs in engineering are foreign students, and experience difficulties in classroom management and communication (Seymour & Hewitt, 1994; 1997). This variable was borrowed from the PFEAS.

Exploring the Engineering Student Experience 10
16. Satisfaction with Instructors
Level of satisfaction with interactions with faculty and teaching assistants.
17. & 18. Persistence in Engineering (Academic, Professional)
This variable is defined as two dimensions: “academic persistence” is graduating with an undergraduate engineering degree, whereas “professional persistence” is an intention to practice engineering for at least three years after graduation. Although the second is contingent on the first, not all students who graduate with an engineering degree practice engineering.
19. Exposure to the Engineering Profession
Level of exposure to professional engineering environments as a visitor, intern, or employee.
20. Knowledge of the Engineering Profession
This variable addresses various dimensions that contribute to knowledge of the engineering profession including self-assessed gains in understanding the field from before college and since entering college. Sources that contribute to students’ perceptions of engineering through direct interactions (as a visitor, co-op, intern, employee), family members or peers, and other related experiences are also identified. Several studies have documented the influence of parents, particularly fathers, on their children’s career choices, especially women (Assessing Women in Engineering Project, 2005; Hellerstein & Morrill, 2010; Leppel, Williams, & Waldauer, 2001).
21. Exposure to Project-Based Learning (a. Individual Projects, b. Team Projects)
Level of exposure to project-based learning (PBL) pedagogies in courses. The majority of engineering students enjoy courses which utilize project-based learning methods (Dym, 2005). Recent ABET requirements have resulted in an increase in design courses in engineering curricula, which are often taught using PBL approaches.
22. Extracurricular Involvement (Engineering and Non-Engineering)
Astin (1993) found that engineering majors reported low satisfaction with student life, including participation in extracurricular activities. Tracking the perceived importance of extracurricular activities in concert with the frequency of involvement in extracurricular activities allows us to place the level of involvement in its proper context.
23. Research Experience Reflects whether a student has had experience during in a college doing engineering and/or non-engineering research.
24. Financial Difficulties Level of comfort with financing college expenses. Seymour found having financial difficulties to be a persistence factor (Seymour & Hewitt, 1994; 1997).
25. Overall Satisfaction with Collegiate Experience
General satisfaction with the overall quality of the college experience. This question is asked at the end of the survey to obtain a Gestalt-like judgment. Continued dissatisfaction with the overall college experience is hypothesized to result in low persistence.


Exploring the Engineering Student Experience 11
Chapter 2: Who participated in APPLES?
2.1 APPLES Institutional Recruitment and Demographics The overarching goal of the cross-sectional APPLE Survey was to look at the undergraduate engineering student experience across a broader range of students and institutions than were represented in the longitudinal component of the Academic Pathways Study. Since there is currently no readily-available list of U.S. undergraduate engineering students from which to randomly sample, we chose to sample by institution. To ensure a balanced national sample of engineering students and institutions, we stratified using several institutional characteristics including:
1. Carnegie Classification (2002) 2. Student body ethnic composition, gender balance, and enrollment status (full-time versus
part-time) 3. Institution size, type (private vs. public), geographic location, number of transfer
students, and whether the institution had a religious affiliation. These stratification requirements are shown in Table 2.1, along with the number of institutions that participated in APPLES. Table 2.2 describes the institutional criteria used to select and stratify our sample. Table 2.1 Summary of Primary and Secondary Stratification Characteristics
Type of Institution Required Participated Primary Stratifications
Doctoral/Research – Extensive 5 7 Doctoral/Research – Intensive 2 4 Specialized Institutions – Engineering 2 3 Master’s Colleges and Universities I 2 3 Specialized Institutions – Other 1 0 Baccalaureate Colleges – General 1 2 Baccalaureate Colleges – Liberal Arts 1 2
Secondary Stratifications Historically Black Colleges and Universities 1 2 Hispanic-Serving Institutions 1 2 Single-Gender Institutions 1 1 Part-Time Student Population > 30% 1 4
Recruiting Redundancy 3-7* 3 TOTAL 21-25 21
* We estimated we needed to recruit 3-7 additional institutions should one or more institutions be unable to participate in APPLES late in the process.

Exploring the Engineering Student Experience 12
Table 2.2 Descriptions of Institutional Characteristics
Institutional Characteristic
Description
Carnegie Classifications (2000)
Carnegie Classifications of Institutions of Higher Education as determined by The Carnegie Foundation for the Advancement of Teaching; http://www.carnegiefoundation.org/classifications/
Ethnic Minority Dominant
Institution is officially classified as a HBCU (Historically Black College or University) or a HSI (Hispanic Serving Institution). Note: There were no Native American dominant higher education institutions with undergraduate engineering programs
Part-time Status Based on the percentage of undergraduate engineering students who are part-time, defined as: Negligible (<1%), Low (1-10%), Medium (11-25%), High (>25%). This was an adjustment of the original sampling plan, where the cut-off between Medium and High was set at 30%.
Size Based on the number of undergraduates enrolled at the institution; Small: <2,000 students; Medium: 2000 to 15,000 students; Large: >15,000 students
Public Institution If the institution is a public university
University Setting Determined from College Board data; Urban, Suburban (>50,000 people); Suburban town (<50,000) or Rural
Major Declaration Process
How and when a student needs to declare his/her major; 3 categories: 1) Student is accepted to institution in school of engineering or for specific engineering major (or accepted to a technical school that has ONLY engineering majors), 2) Student accepted to institution without specifying a major (free to declare any major as long as minimum requirements of major are met), 3) Student accepted to institution then needs to apply (usually sophomore year) to an engineering major (see Appendix I.2 for additional details)
Institutional Selectivity We view institutional selectivity as “a measure of the role of peers and interactions with other students in understanding the educational impact of the institution” (Pascarella et al., 2006). For APPLES, the operational definition of institutional selectivity is based on the average SAT Math and Critical Reading scores of students at the institution attended (see Appendix I.2 for additional details)

Exploring the Engineering Student Experience 13
Two additional institutional characteristics—Major Declaration Process and Institutional Selectivity—listed in Table 2.2 were not used for recruitment purposes but were developed specifically for future analysis of the APPLES dataset. Descriptions of how these variables were determined and calculated are included in Appendix 1.2. Although APPLES’s institutional sample was not designed for national representativeness, participating institutions largely reflected the diversity of U.S. baccalaureate-granting colleges and universities offering undergraduate engineering degrees with respect to control (public vs. private), region, size, and basic Carnegie Classification (see Table 2.3).
Table 2.3 Summary of Stratification Characteristics Relative to National Picture Tertiary Stratification
Considerations National Picture (2007) [1] Participating Institutions [3] Carnegie Classifications (2000) [2]: Percent of engineering students at various institution types.
Doctoral/Research Extensive = 60% Doctoral/Research Intensive = 15% Specialized Institutions Engineering = 4% Masters Colleges and Universities I = 18% Specialized Institutions Other = 1% Baccalaureate Colleges General = 1% Baccalaureate Colleges Liberal Arts = 1%
Doctoral/Research Extensive = 63% Doctoral/Research Intensive = 9% Specialized Institutions Engineering = 10% Masters Colleges and Universities I = 15% Specialized Institutions Other = 0% Baccalaureate Colleges General = 2% Baccalaureate Colleges Liberal Arts = 1%
Institution size (based on enrollments)
Large = 54% Medium = 43% Small = 3%
Large = 33% (7 of the 21 institutions) Medium = 38% (8 of the 21 institutions) Small = 29% (6 of the 21 institutions)
Geographic diversity (Information not available) 17 states represented Funding type Public = 63%
Private = 37% Public = 67% (14 of the institutions) Private = 33% (7 of the institutions)
Religious affiliation 14% of institutions 4% of population
5% (1 institution)
Transfer student population (Information not available) Two 3+2 completion institutions [1] Percentage of national sample of 319 institutions offering ABET accredited undergraduate engineering degrees. [2] Data for the national picture of undergraduate engineering students by Carnegie Classifications at 319 institutions, N=403,889 from ASEE (2004). [3] Data for Participating Institutions are based on the total number of enrolled students (part time and full time) at each of the 21 APPLES institutions. These numbers were collected from ASEE (2006) enrollment figures.
The strategic sampling method for APPLES resulted in 21 institutions consenting to participate in the study.

Exploring the Engineering Student Experience 14
2.2 APPLES Student Recruitment and Demographics Following the recruitment of the institutions, the APPLES team worked closely with local institutional coordinators to develop a detailed plan for recruiting student respondents and in particular, the oversampling of specific student groups (e.g., women). A minimum number of respondents was determined for each of the following strata and tailored to each participating APPLES institution:
1. Primary strata: academic level (freshman, sophomore, junior, and senior), persisters/non-persisters, and men/women
2. Secondary strata: ethnic minority and international students 3. Tertiary strata: part-time and transfer students
The APPLES sampling strategy was designed to allow for examination of the engineering experience by gender, by underrepresented minority status, and by academic level (first-year through senior) as well as analyses of student responses by institutional groupings. These groupings represent the various institutional selection criteria, such as public vs. private, Carnegie Classification, institutional setting (rural, urban), as listed in Table 2.4. A detailed description of both the institutional and student sampling processes can be found in Donaldson and Sheppard (2007) and Donaldson et. al. (2008a). Table 2.4 Summary of APPLES Students by Institutional Characteristics Institutional Characteristic* ALL Respondents Engineering Majors Other Majors N Valid % N % N % Total Number of Respondents 4266 100% 3911 100% 340 100% Ethnic Minority Dominant Yes [4] 446 10.5% 423 10.8% 19 5.6% No [17] 3820 89.5% 3488 89.2% 321 94.4%
Size Small [6] 700 16.4% 636 16.3% 61 17.9% Medium [8] 1587 37.2% 1460 37.3% 120 35.3% Large [7] 1979 46.4% 1815 46.4% 159 46.8%
Public Institution Yes [14] 2983 69.9% 2713 69.4% 257 75.6% No [7] 1283 30.1% 1198 30.6% 83 24.4%
University Setting Urban [10] 2528 59.3% 2344 59.9% 177 52.1% Suburban city [8] 1520 35.6% 1358 34.7% 155 45.6% Suburban town or Rural [3] 218 5.1% 209 5.3% 8 2.4%
Part-Time Students Negligible (<1%) [10] 1765 41.4% 1615 41.3% 140 41.2% Low (1-10%) [5] 1501 35.2% 1360 34.8% 138 40.6% Medium (11-25%) [2] 460 10.8% 426 10.9% 33 9.7% High (>25%) [4] 540 12.7% 510 13% 29 8.5%

Exploring the Engineering Student Experience 15
Institutional Characteristic* ALL Respondents Engineering Majors Other Majors N Valid % N % N % Major Declaration Process Accepted into School of Engineering or Engineering Major [12] 2852 66.9% 2598 66.4% 242 71.2% Accepted into any major [8] 1283 30.1% 1204 30.8% 77 22.6% Student accepted and then applies to major [1] 131 3.1% 109 2.8% 21 6.2%
Institutional Selectivity Not very difficult [6] 681 16% 647 16.5% 30 8.8% Somewhat difficult [5] 745 17.5% 669 17.1% 73 21.5% Moderately difficult [4] 1518 35.6% 1406 35.9% 108 31.8% Very difficult [6] 1322 31% 1189 30.4% 129 37.9%
Institutional Selectivity (median split) Low Selectivity [11] 1426 33.4% 1316 33.6% 103 30.3% High Selectivity [10] 2840 66.6% 2595 66.4% 237 69.7%
Carnegie Classifications (2000) DR-E Doctoral Research Extensive [7] 2560 60% 2316 59.2% 238 70% DR-I Doctoral/Research Intensive [4] 493 11.6% 462 11.8% 29 8.5% M1 Masters Colleges & Univ. [3] 336 7.9% 316 8.1% 17 5% SI-Eng Specialized Institutions [3] 535 12.5% 522 13.3% 10 2.9% B-G – Baccalaureate – General [2] 179 4.2% 155 4% 24 7.1% B-LA Baccalaureate – Liberal Arts [2] 163 3.8% 140 3.6% 22 6.5%
*Number of participating institutions in each category is noted by [] The total number of respondents to the APPLE Survey was 4,587 from the 21 institutions. After data cleaning (for example, removing ineligible respondents such as graduate students), the final data set included 4,266 respondents with 3,911 classified as engineering majors and 340 representing other majors. The remaining 15 respondents were coded as missing data. Weights for the APPLES dataset were not calculated since information on the engineering student population at participating institutions was incomplete. Women were overrepresented in the APPLES sample; therefore, findings are reported separately for men and women. Table 2.5 describes the respondent groups according to selected demographic characteristics. Table 2.5 Summary of Demographic Characteristics of APPLES Respondents Demographic Characteristic ALL Respondents[1] Engineering Majors[2] Other Major[2]
N % N % N % Total Number of Respondents 4266 100% 3911 100% 340 100% Academic Standing (Q2) First Year 937 22.1% 869 22.3% 62 18.3% Sophomore 967 22.8% 884 22.7% 81 23.9% Junior 1121 26.4% 1013 26% 105 31% Senior 903 21.3% 840 21.6% 61 18% Fifth year senior 321 7.6% 290 7.4% 30 8.8%

Exploring the Engineering Student Experience 16
Demographic Characteristic ALL Respondents[1] Engineering Majors[2] Other Major[2]
N % N % N % Sex (Q36) Female 1438 34% 1294 33.3% 137 40.9% Male 2794 66% 2590 66.7% 198 59.1%
Race/Ethnicity (Q37) [3] American Indian or Alaska Native 18 .4% 17 .4% 1 .3% Asian or Asian American 646 15.1% 602 15.4% 42 12.4% Black or African American 302 7.1% 274 7% 24 7.1% Hispanic or Latino/a 335 7.9% 327 8.4% 8 2.4% Native Hawaiian or Pacific Islander 8 .2% 8 .2% 0 0 White 2452 57.5% 2227 57% 221 65% Other 77 1.8% 73 1.9% 4 1.2% Multiracial 247 5.8% 224 5.7% 19 5.6% I prefer not to answer 167 3.9% 145 3.7% 21 6.2%
URM Status [4] URM 679 17.7% 640 18.2% 34 11.3% Non-URM 3154 82.3% 2880 81.8% 267 88.7%
Current major/First choice of major (Q5) Aerospace Engineering 202 4.8% 202 5.2% 0 0 Chemical Engineering 307 7.2% 307 7.9% 0 0 Civil Engineering 446 10.5% 446 11.4% 0 0 Electrical Engineering 528 12.4% 528 13.5% 0 0 Industrial Engineering 278 6.6% 278 7.1% 0 0 Materials and Metallurgical Engineering
113 2.7% 113 2.9% 0 0
Mechanical Engineering 981 23.1% 981 25.1% 0 0 Computer Science/ Engineering (in engineering)
409 9.6% 409 10.5% 0 0
Other Engineering 55 1.3% 55 1.4% 0 0 Other Eng: Agricultural Engineering 12 .3% 12 .3% 0 0 Other Eng: BioX Eng 255 6% 255 6.5% 0 0 Other Eng: Construction Eng 13 .3% 13 .3% 0 0 Other Eng: Eng Math & Physics 29 .7% 29 .7% 0 0 Other Eng: Eng OR & Business 30 .7% 30 .8% 0 0 Other Eng: Environmental Engineering
50 1.2% 50 1.3% 0 0
Other Eng: General Engineering 44 1% 44 1.1% 0 0 Other Eng: Nuclear Engineering 16 .4% 16 .4% 0 0 Other Eng: Ocean Engineering 24 .6% 24 .6% 0 0 Arts & Humanities 17 .4% 1 0 16 4.7% Computer Science (non-engineering) 108 2.5% 38 1% 70 20.8% Math and Natural Sciences 84 2% 24 .6% 60 17.8% Physical Sciences 55 1.3% 18 .5% 37 11% Social Sciences 30 .7% 4 .1% 26 7.7% Other Non-Engineering 63 1.5% 11 .3% 52 15.4% Other Non-Eng: Business 77 1.8% 11 .3% 66 19.6% Other Non-Eng: STM 16 .4% 6 .2% 10 3%
Exploring the Engineering Student Experience 17
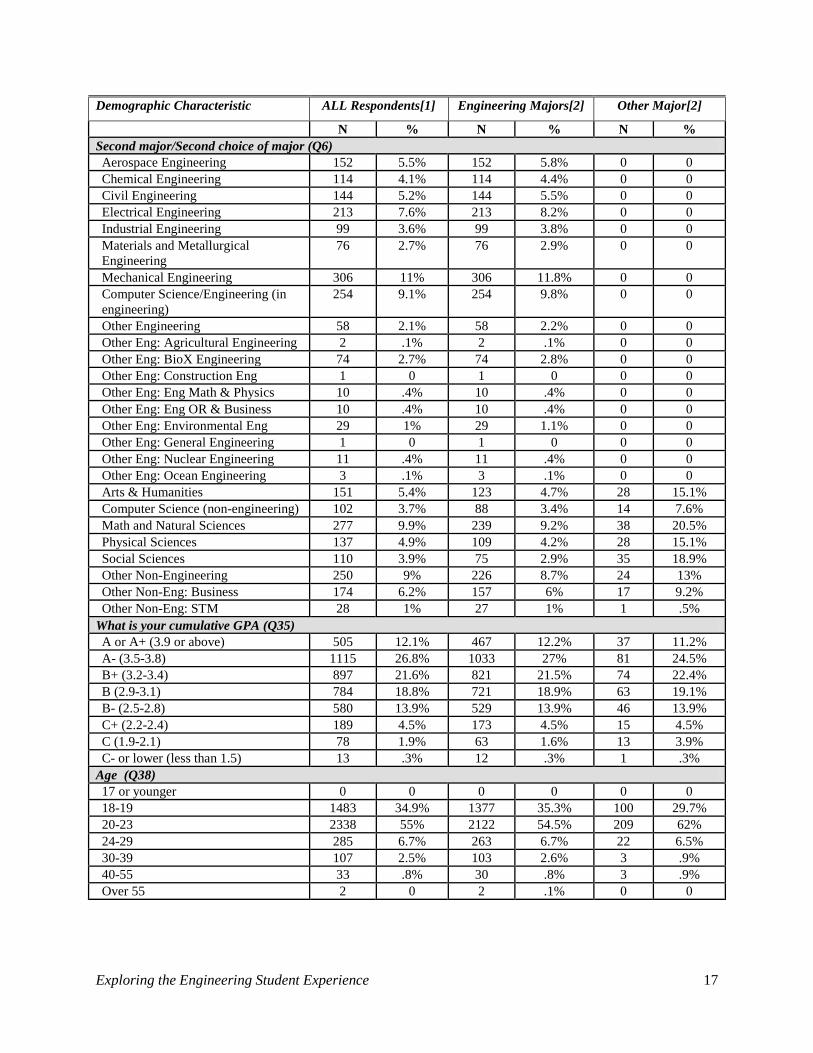
Demographic Characteristic ALL Respondents[1] Engineering Majors[2] Other Major[2]
N % N % N % Second major/Second choice of major (Q6) Aerospace Engineering 152 5.5% 152 5.8% 0 0 Chemical Engineering 114 4.1% 114 4.4% 0 0 Civil Engineering 144 5.2% 144 5.5% 0 0 Electrical Engineering 213 7.6% 213 8.2% 0 0 Industrial Engineering 99 3.6% 99 3.8% 0 0 Materials and Metallurgical Engineering
76 2.7% 76 2.9% 0 0
Mechanical Engineering 306 11% 306 11.8% 0 0 Computer Science/Engineering (in engineering)
254 9.1% 254 9.8% 0 0
Other Engineering 58 2.1% 58 2.2% 0 0 Other Eng: Agricultural Engineering 2 .1% 2 .1% 0 0 Other Eng: BioX Engineering 74 2.7% 74 2.8% 0 0 Other Eng: Construction Eng 1 0 1 0 0 0 Other Eng: Eng Math & Physics 10 .4% 10 .4% 0 0 Other Eng: Eng OR & Business 10 .4% 10 .4% 0 0 Other Eng: Environmental Eng 29 1% 29 1.1% 0 0 Other Eng: General Engineering 1 0 1 0 0 0 Other Eng: Nuclear Engineering 11 .4% 11 .4% 0 0 Other Eng: Ocean Engineering 3 .1% 3 .1% 0 0 Arts & Humanities 151 5.4% 123 4.7% 28 15.1% Computer Science (non-engineering) 102 3.7% 88 3.4% 14 7.6% Math and Natural Sciences 277 9.9% 239 9.2% 38 20.5% Physical Sciences 137 4.9% 109 4.2% 28 15.1% Social Sciences 110 3.9% 75 2.9% 35 18.9% Other Non-Engineering 250 9% 226 8.7% 24 13% Other Non-Eng: Business 174 6.2% 157 6% 17 9.2% Other Non-Eng: STM 28 1% 27 1% 1 .5%
What is your cumulative GPA (Q35) A or A+ (3.9 or above) 505 12.1% 467 12.2% 37 11.2% A- (3.5-3.8) 1115 26.8% 1033 27% 81 24.5% B+ (3.2-3.4) 897 21.6% 821 21.5% 74 22.4% B (2.9-3.1) 784 18.8% 721 18.9% 63 19.1% B- (2.5-2.8) 580 13.9% 529 13.9% 46 13.9% C+ (2.2-2.4) 189 4.5% 173 4.5% 15 4.5% C (1.9-2.1) 78 1.9% 63 1.6% 13 3.9% C- or lower (less than 1.5) 13 .3% 12 .3% 1 .3%
Age (Q38) 17 or younger 0 0 0 0 0 0 18-19 1483 34.9% 1377 35.3% 100 29.7% 20-23 2338 55% 2122 54.5% 209 62% 24-29 285 6.7% 263 6.7% 22 6.5% 30-39 107 2.5% 103 2.6% 3 .9% 40-55 33 .8% 30 .8% 3 .9% Over 55 2 0 2 .1% 0 0

Exploring the Engineering Student Experience 18
Demographic Characteristic ALL Respondents[1] Engineering Majors[2] Other Major[2]
N % N % N % Citizenship Status (Q39) U.S. Citizen 3720 87.7% 3394 87.2% 313 92.9% Permanent Resident of U.S. 195 4.6% 184 4.7% 11 3.3% Other 327 7.7% 313 8% 13 3.9%
Were you born in the U.S.? (Q40) No 648 15.7% 613 16.2% 34 10.2% Yes 3473 84.3% 3163 83.8% 298 89.8%
Did one or more of your parents/guardians immigrate to the U.S.? (Q41) No 3160 74.9% 2875 74.3% 275 81.6% Yes 1059 25.1% 993 25.7% 62 18.4%
Is English your first language?(Q42) No 771 18.2% 733 18.8% 36 10.7% Yes 3476 81.8% 3161 81.2% 302 89.3%
Are you a first generation college student?(Q43) No 3472 81.6% 3172 81.3% 289 85.3% Yes 782 18.4% 729 18.7% 50 14.7%
Are you enrolled primarily as a: (Q44) Full-time student 4142 97.4% 3801 97.5% 326 96.4% Part-time student 109 2.6% 97 2.5% 12 3.6%
Would you describe your family as: (Q46) High income 218 5.2% 197 5.2% 21 6.3% Upper-middle income 1349 32.4% 1222 32% 124 37.2% Middle income 1649 39.6% 1519 39.7% 124 37.2% Lower-middle income 665 16% 619 16.2% 44 13.2% Low income 287 6.9% 267 7% 20 6%
What is the highest level of education that your mother completed (Q47) Did not finish high school 176 4.3% 167 4.4% 8 2.4% Graduated from high school 666 16.1% 624 16.4% 41 12.4% Attended college 495 12% 443 11.7% 49 14.8% Completed AA, AS 498 12% 470 12.4% 27 8.2% Completed BA, BS 1363 32.9% 1245 32.8% 113 34.1% Completed MA, MS 737 17.8% 662 17.4% 74 22.4% Completed PhD, JD, MD 203 4.9% 184 4.8% 19 5.7%
What is the highest level of education that your father completed (Q48) Did not finish high school 155 3.8% 142 3.8% 12 3.7% Graduated from high school 593 14.5% 546 14.6% 46 14% Attended college 475 11.6% 437 11.7% 35 10.7% Completed AA, AS 295 7.2% 274 7.3% 21 6.4% Completed BA, BS 1299 31.8% 1184 31.6% 111 33.8% Completed MA, MS 792 19.4% 732 19.5% 58 17.7% Completed PhD, JD, MD 478 11.7% 432 11.5% 45 13.7%
Computed SES Bins [5] Low 1084 29% 1008 29.5% 72 23.8% Lower-middle 884 23.7% 816 23.9% 66 21.9% Upper-middle 617 16.5% 556 16.3% 58 19.2% High 1148 30.8% 1040 30.4% 106 35.1%

Exploring the Engineering Student Experience 19
In reviewing the data tables in this section, please note that: [1] Total number of responses after data cleaning, N=4,266. Engineering majors: N=3,911. All other
majors: N=340. The number of valid responses for each question may vary. All percentages in Table 2.5 are based on valid responses.
[2] Description of the process by which engineering majors and other majors were determined is described in Appendix I.3.
[3] Under Race/Ethnicity: These numbers represent respondents who selected only one racial/ethnic category in response to question #36: “What is your racial or ethnic identification? (Check all that apply).” Respondents who selected more than one category are grouped under “Multiracial.”
[4] Underrepresented minorities (URMs) are defined as students who marked Native Hawaiian or Pacific Islander (NHPI), Black/African-American, Hispanic or Latino/a, Native American, or any combination of the four. Non-URMs are students who marked Asian or Asian American, White, or White and Asian or Asian American. If a student marks multiple races/ethnicities, ALL of which are URM, i.e., a student who marks Black/African American and Hispanic or Latino/a, for instance, or NHPI and Black/African American: this student falls into our APPLES URM group. If a student marks multiple races/ethnicities, ONLY SOME of which are URM, i.e., a student who marks White, Black/African American, and Hispanic or Latino/a, for instance, or Asian or Asian American and Hispanic or Latino/a: this student does NOT fall into our URM group NOR does this student fall into our non-URM group. In other words, we do not include this student in any URM/non-URM comparison because we do not know how to correctly classify her or him. These students are classified as "Missing." The Missing category also includes respondents who selected "I prefer not to answer," "Not Applicable," or who skipped the question. 433 of the total number of respondents were considered missing.
[5] For a specific discussion of socioeconomic status (SES) and how it was calculated, please reference Donaldson et al. (2008b).


Exploring the Engineering Student Experience 20
Chapter 3: What is in this report?
This report presents the first set of analyses of APPLES data. These analyses are focused on the characteristics, experiences, and plans of first-year and senior engineering majors in our study. Differences by gender and by underrepresented racial/ethnic minority (URM) status are also considered. In the first part of the report we have presented the reader with an overview of the APPLES instrument, along with the demographics of the cross-sectional student sample. In Part II we zero in on the demographics of the senior and first-year engineering majors who completed APPLES (Chapter 4), and describe their college experience (Chapter 5), their motivation for studying engineering (Chapter 6), and their knowledge of engineering (Chapter 7). The specific APPLES variables addressed in each of these chapters are listed in Table 3.1. In Part III we look at how gender and URM status affect the college experience, looking at both the actual experience itself (Chapter 8), as well as the associated demographics of these populations (Chapter 9). The specific APPLES variables considered in each of these chapters are listed in Table 3.2. In Part IV we begin by examining some of the outcomes of college, namely confidence in key skills (Chapter 10) and post-graduation plans (Chapter 11). In describing these outcomes we present descriptive statistics and regression models that consider when demographic and/or experience variables affect these outcomes. The specific APPLES variables addressed in each of these two chapters are listed in Table 3.3. In Chapter 12 we focus on how motivation to study engineering in combination with confidence affects not only the college experience, but also post-college plans. Finally, in Part V we look to the future. In Chapter 13 we present five key takeaways and in Chapter 14 we consider the implications from our findings and new research questions suggested by them. The findings presented throughout this report are based on descriptive and multivariate analyses that examine relationships, patterns, and between-group differences in our data. The methods used range from independent sample t-tests to ordinary least squares regressions.

Exploring the Engineering Student Experience 21
Table 3.1 APPLES Variables Considered in Part II
Chapter APPLES Variables Chapter 4 Who are these students? 26. Student Characteristics 27. Academic Status 28. Academic Interests and Majors 29. Citizenship, Immigration and Cultural Status 30. Socioeconomic Status 24. Financial Difficulties Chapter 5 What is the college experience like? 12. Curriculum Overload 13. Academic Involvement (Liberal Arts Courses) [1] 14. Academic Involvement (Engineering-related Courses) [1] 15. Frequency of Interaction with Instructors 16. Satisfaction with Instructors 19. Exposure to Engineering Profession 21. Exposure to Project-Based Learning Methods Individual Projects and Team Projects 22. Extracurricular Involvement (Engineering and Non-Engineering) Frequency of Engineering Extracurricular Participation Frequency of Non-engineering Extracurricular Participation Importance of Non-engineering Extracurricular Participation 23. Research Experience 25. Overall Satisfaction with Collegiate Experience 27. Academic Status: GPA Index Chapter 6 What motivates students to study engineering? 1. Motivation (Financial) 2. Motivation (Parental Influence) 3. Motivation (Social Good) 4. Motivation (Mentor Influence) 5. Motivation (Intrinsic, Psychological) 6. Motivation (Intrinsic, Behavioral) 18. Academic Persistence Chapter 7 How do students learn about engineering? 10. Perceived Importance of Math and Science Skills 11. Perceived Importance of Professional and Interpersonal Skills 20. Knowledge of the Engineering Profession Knowledge of Engineering Before College Self-reported Gains in Knowledge of Engineering Since Entering College Sources of Engineering Knowledge
The numbered APPLES variables are further described in Tables 1.2-1.6. [1] In the development of APPLE survey instrument, these two variables were formulated as measures of
Academic Disengagement (see Table 1.2). In the analysis reported here, they have been reframed as Academic Involvement (which is 100-Academic Disengagement).

Exploring the Engineering Student Experience 22
Table 3.2 APPLES Variables Considered in Part III Chapter APPLES Variables Chapter 8 Do engineering students’ motivations and college experiences vary by URM
status? See variables in Chapters 4-7 Chapter 9 Do family and socioeconomic characteristics vary by URM status? 26. Student Characteristics 27. Academic Status 28. Academic Interests and Majors 29. Citizenship, Immigration and Cultural Status 30. Socioeconomic Status
The numbered APPLES variables are further described in Tables 1.2-1.6. Table 3.3 APPLES Variables Considered in Part IV Chapter APPLES Variables Chapter 10 How confident are students? What contributes to confidence? 7. Confidence in Math and Science Skills 8. Confidence in Professional and Interpersonal Skills 9. Confidence in Solving Open-ended Problems Chapter 11 What do students’ post-graduation plans look like? What contributes to
these plans? 18. Professional Persistence Chapter 12 A Different Way to Look at Students
The numbered APPLES variables are further described in Tables 1.2-1.6.


Exploring the Engineering Student Experience 23
Part II. The Big Picture of the Student Experience
In this part of our report we present APPLES findings related to engineering students’ college experiences, students’ motivation to study engineering, and where students report learning about engineering practice. We focus our attention on senior1 and first-year students majoring in engineering, by gender and by academic standing. This allows us to compare responses from students who have experienced the “totality” of an engineering education (seniors) with those of students who are just beginning their education (first-years). We start by presenting the demographics of senior and first-year APPLES respondents to address the question: Who are these students? (Chapter 4). We then consider three broad questions about our engineering majors: What is their college experience like? (Chapter 5); What motivates students to study engineering? (Chapter 6); How do they learn about engineering practice? (Chapter 7). In our discussions, we first consider responses among senior women (SrW) and men (SrM), and then compare these with responses among first-year students2. In some instances, when we compare across the academic standing of seniors to first-year students, we focus on the aggregate estimate for all students (men and women), but we note if and how these cohort differences vary by gender. To guide our discussion, we identify differences and relationships that reach statistical significance at p<.001, unless noted3. Although we do not report effect sizes in the tables, we consider the magnitude, direction, and practical significance of the differences and relationships. Our statistical tests include one-way ANOVAs, paired-sample t-tests, tests of association for categorical variables (using contingency tables and chi-squared tests of independence), z-tests for independent proportions, and Pearson’s simple correlations. Standard deviations (and sample sizes) for all mean scores are reported in Appendix II.1. Note that because our data are cross-sectional, statements about “change over time” are necessarily inferential. We recognize that differences between first-year students and seniors may reflect not only developmental trajectories, but also contextual factors (e.g., shifting economic contexts for engineering students over the past five years, the fact that our seniors are all declared engineering majors while many of our first-year students are prospective engineering majors, and so on), and we frame our interpretations accordingly.
1 In the analyses presented in Parts II-V, students in their fourth or greater year of study are classified as seniors. 2 In our descriptive analyses, we report estimates for women and men separately and test the statistical significance of gender differences using parametric and non-parametric methods. 3 Throughout the report, significance levels are denoted as: ***p<.001, **p<.01, and *p<.05. We consider findings not significant (ns) if p>.05.


Exploring the Engineering Student Experience 24
Chapter 4: Who are these students?
In order to contextualize and understand students’ experiences in engineering—and what this means for the engineering “pipeline” more generally—we must understand where today’s engineering students come from, and the very basic parameters of their collegiate lives (place of residence, type of major, and so on). This sets the stage for all of the reporting and interpretation in this report. Indeed, who are these students who completed the APPLES survey?
4.1 Demographic Characteristics Gender ratios among first-year and senior APPLES engineering majors are presented in Table 4.1, as is the distribution of students by racial/ethnic group. Table 4.1 Gender and Racial/Ethnic Background of First-Year and Senior Students
All values are percents ***p<.001, **p<.01, *p<.05, ns=not significant Several noteworthy observations regarding the demographics of specific groups within the APPLES dataset include:
• Women in the sample: Women are overrepresented in the APPLES sample (see Chapter 2 for details about the APPLES sampling strategy and the oversampling of certain groups). Whereas women comprise 19.5 percent of the U.S. population of engineering students1, they comprise 35.8 percent and 29.1 percent of the first-year and senior students within the APPLES dataset, respectively. In our descriptive analyses, we report all estimates for women
1 National Science Foundation, Division of Science Resources Statistics. Detailed Statistical Tables NSF 10-321. Arlington, VA. Available at http://www.nsf.gov/statistics/nsf08321 TABLE 11. Women as a percentage of all bachelor's recipients, by major field group: 1966–2006.
All (n=869)
Women (n=311)
Men (n=557)
Significance of gender difference
All (n=1130)
Women (n=326)
Men (n=795)
Significance of gender difference
Gender 35.8 64.2 29.1 70.9Race/Ethnicity American Indian/Alaska 0.8 1.0 0.5 ns 0.5 0.9 0.4 ns Asian 16.9 15.1 18.0 ns 12.6 16.3 10.9 * African American/Black 7.8 9.3 7.0 ns 7.7 9.2 7.2 ns Hispanic/Latino 7.9 8.0 7.9 ns 8.5 12.0 7.2 * Native Hawaiian/Pacific 0.2 0.3 0.2 ns 0.4 0.3 0.4 ns White 55.4 55.9 55.1 ns 59.8 54.3 62.8 * Other 1.4 1.0 1.6 ns 1.9 1.8 2.0 ns Multi-ethnic 6.3 8.0 5.4 ns 5.0 3.1 5.9 ns
URM (Amer. Indian/African American/Latino/NHPI) 19.0 21.3 17.6 ns 19.2 24.4 17.0 **
First-Year Students Seniors

Exploring the Engineering Student Experience 25
and men separately, and test the statistical significance of gender differences using parametric and non-parametric methods, as noted earlier.
• URM students in the sample: For the purpose of this report (see Chapters 8 and 9), we compare the engineering experiences of students from underrepresented racial/ethnic minority (URM) backgrounds (Black/African American; Hispanic/Latino/a; American Indian/Alaska Native; Native Hawaiian/Pacific Islander) with those of students from non-underrepresented racial/ethnic backgrounds (non-URM, i.e., White and/or Asian). Among both first-year and senior APPLES respondents, the percentage of URM students is higher than that in the national population—19% versus 13.3%, according to 2006 National Science Foundation (NSF) data2. However, APPLES and NSF URM percentages are not directly comparable due to differences in how APPLES and NSF collect and report race/ethnicity, and define URM status3. Keeping in mind such differences, Table 4.2 lists the percentages of APPLES seniors and all engineering bachelor’s degree-earners in the U.S. across individual racial/ethnic categories.
• Seniors by URM status and gender: Proportionately more senior women are classified as URM students than are senior men (24.4% vs. 17.0%), meaning that APPLES senior women are more diverse than are APPLES senior men.
Table 4.2 Race and Ethnicity of Engineering Seniors
[1] Does not include students who marked "I prefer to not answer" [2] See footnote 2
2 National Science Foundation, Division of Science Resources Statistics, special tabulations of U.S. Department of Education, National Center for Education Statistics (NCES), Integrated Postsecondary Education Data System, Completions Survey, 1998–2007. Available at http://www.nsf.gov/statistics/wmpd/degrees.cfm#bachelor, TABLE C-6. Bachelor's degrees, by field, citizenship, and race/ethnicity: 1998–2007. 3 On the APPLES instrument, respondents could mark multiple racial/ethnic categories; respondents who marked single or multiple underrepresented racial/ethnic categories (Black/African American, Hispanic/Latino, American Indian/Alaska Native, Native Hawaiian/Pacific Islander) were then counted as URM students (see Part I, Chapter 2 for a full description of URM calculations). In NSF estimates (which are derived from NCES data), students are assigned to one racial/ethnic category only (i.e., there is no provision for multiple races/ethnicities). URM students using NSF estimates are those from Black/African American, Hispanic, and American Indian/Alaska Native backgrounds, singularly classified. Given these differing methods and calculations, the percentage of URMs students as reported by the NSF will be different from the reported percentage of URMs in the APPLES sample. Nevertheless, we note consonance in individual non-white racial/ethnic categories, as summarized in Table 4.2.
APPLES Seniors [1]
NSF 2006 Data [2]
White 59.8 68.6Asian 12.6 13.5Hispanic/Latino 8.5 7.7African American/Black 7.7 5.0Multi-ethnic 5.0 n/aOther 1.9 4.6American Indian/Alaska Native 0.5 0.6Native Hawaiian/Pacific Islander 0.4 n/a

Exploring the Engineering Student Experience 26
Additional demographic data on APPLES first-year and senior engineering majors are presented in Table 4.3. The following are several important observations regarding:
• Where students live: Seniors are less likely to live in a dorm on campus than are first-year students (80.2% first-years vs. 21.7% seniors). For both cohorts, women are more likely to live in a dorm on campus than are men.
• Mother’s education: Based on chi-square tests, first-year and senior women report higher levels of mother’s education than do first-year and senior men, respectively. The gender difference is less pronounced when looking at the level of father’s education. We will return to this issue when we examine URM status in conjunction with gender in Part III.
• Perceived family income: Students are most likely to report that they are from middle income families (41.3% first-years, 39.2% seniors), followed by upper-middle income families (34.0% first-years, 30.2% seniors). Nearly 20 percent of first-years and 26 percent of seniors report coming from families of lower-middle and lower income.
• Financial concerns: Nearly one in three first-year students and two in five seniors report “major” or “extreme” concerns regarding financing their college education.
• First-generation college student: One in five engineering majors is a first-generation college attendee (17.2% first-years, 21.1% seniors).
• Family member is an engineer: More than 30 percent of first-year and senior APPLES engineering majors report having a family member (parent or sibling) who has an engineering degree. Considering that engineering majors make up less than five percent of the bachelors degrees awarded annually in the U.S.4, this is a remarkably high number.
• Citizenship and Language: Roughly one in nine first-year and senior students are not U.S. citizens (12.6% first-years, 11.3% seniors), and for almost one in five students, English is a second language (17.9% first-years, 17.1% seniors).
4 National Science Foundation, Division of Science Resources Statistics. S&E Degrees: 1966–2006. Detailed Statistical Tables NSF 10-321. Arlington, VA. Available at http://www.nsf.gov/statistics/nsf08321/ TABLE 6. Percentage distribution of bachelor's degrees awarded, by major field group: 1966–2006.
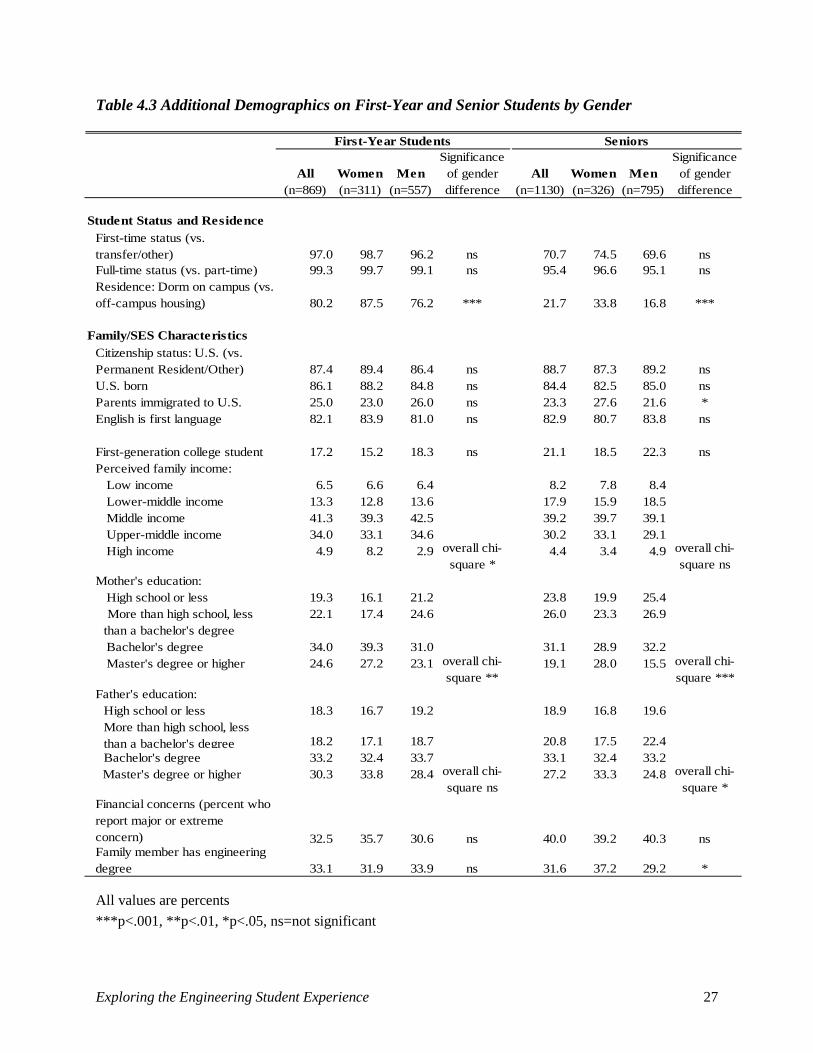
Exploring the Engineering Student Experience 27
Table 4.3 Additional Demographics on First-Year and Senior Students by Gender
All values are percents ***p<.001, **p<.01, *p<.05, ns=not significant
All (n=869)
Women (n=311)
Men (n=557)
Significance of gender difference
All (n=1130)
Women (n=326)
Men (n=795)
Significance of gender difference
Student Status and ResidenceFirst-time status (vs. transfer/other) 97.0 98.7 96.2 ns 70.7 74.5 69.6 nsFull-time status (vs. part-time) 99.3 99.7 99.1 ns 95.4 96.6 95.1 nsResidence: Dorm on campus (vs. off-campus housing) 80.2 87.5 76.2 *** 21.7 33.8 16.8 ***
Family/SES Characteristics
Citizenship status: U.S. (vs. Permanent Resident/Other) 87.4 89.4 86.4 ns 88.7 87.3 89.2 nsU.S. born 86.1 88.2 84.8 ns 84.4 82.5 85.0 nsParents immigrated to U.S. 25.0 23.0 26.0 ns 23.3 27.6 21.6 *English is first language 82.1 83.9 81.0 ns 82.9 80.7 83.8 ns
First-generation college student 17.2 15.2 18.3 ns 21.1 18.5 22.3 nsPerceived family income: Low income 6.5 6.6 6.4 8.2 7.8 8.4 Lower-middle income 13.3 12.8 13.6 17.9 15.9 18.5 Middle income 41.3 39.3 42.5 39.2 39.7 39.1 Upper-middle income 34.0 33.1 34.6 30.2 33.1 29.1 High income 4.9 8.2 2.9 overall chi-
square *4.4 3.4 4.9 overall chi-
square nsMother's education: High school or less 19.3 16.1 21.2 23.8 19.9 25.4
More than high school, less than a bachelor's degree
22.1 17.4 24.6 26.0 23.3 26.9
Bachelor's degree 34.0 39.3 31.0 31.1 28.9 32.2 Master's degree or higher 24.6 27.2 23.1 overall chi-
square **19.1 28.0 15.5 overall chi-
square ***Father's education:
High school or less 18.3 16.7 19.2 18.9 16.8 19.6More than high school, less than a bachelor's degree 18.2 17.1 18.7 20.8 17.5 22.4Bachelor's degree 33.2 32.4 33.7 33.1 32.4 33.2
Master's degree or higher 30.3 33.8 28.4 overall chi-square ns
27.2 33.3 24.8 overall chi-square *
Financial concerns (percent who report major or extreme concern) 32.5 35.7 30.6 ns 40.0 39.2 40.3 nsFamily member has engineering degree 33.1 31.9 33.9 ns 31.6 37.2 29.2 *
First-Year Students Seniors

Exploring the Engineering Student Experience 28
4.2 What Engineering Fields Are Represented in this Sample? Table 4.4 summarizes patterns in fields of study among our APPLES first-year and senior engineering majors. Nearly half of first-year students are considering a double major, or major and minor, in two engineering fields; in comparison, less than one-third of the seniors are actually double-majoring in engineering (or have a major and minor in two engineering fields5). This finding may reflect uncertainty in committing to a particular engineering major by first year students at the time the survey was administered. However, comparable percentages of first-years and seniors report considering or having two majors in an engineering and a non-engineering field (26.0% first-years, 30.4% seniors). There are a few gender differences in these data: senior men are 1.5 times more likely than senior women to report they are double majoring in two engineering fields. In contrast, senior women are more likely to report having a double major (or a major with a minor) in an engineering field and a non-engineering field. This greater likelihood of women to report double majoring in engineering and non-engineering is even apparent among first-year students, albeit the gender difference is smaller. Table 4.4 Single and Double Major Patterns of First-Year and Senior Students by Gender
All values are percents ***p<.001, **p<.01, *p<.05, ns=not significant Figure 4.1 shows the distribution of engineering major fields among APPLES seniors. Importantly, this figure reflects majors (or degrees), not students, given that some students have two engineering majors. A wide range of engineering majors are represented among seniors respondents with Mechanical Engineering majors being most prevalent (at 30%), followed by “Other” Engineering majors, and Electrical Engineering majors. As context, the distribution of
5 Given the way APPLES Questions 5 and 6 were asked (see Appendix I), students may be indicating double majors, or a major and a minor. For brevity, we often refer to this as double-majoring, but realize that students may not be completing enough units in the second field to qualify for a second major, and instead pursue a minor.
All (n=869)
Women (n=311)
Men (n=557)
Significance of gender difference
All (n=1130)
Women (n=326)
Men (n=795)
Significance of gender difference
Major type:Single engineering major 24.4 22.2 25.7 41.8 42.0 42.0Double engineering major (or major/minor) 49.6 47.3 50.8 27.9 20.9 30.4Double major (or major/minor): One engineering, one non-engineering 26.0 30.5 23.5
overall chi-sq ns 30.4 37.1 27.5
overall chi-sq **
First-Year Students Seniors

Exploring the Engineering Student Experience 29
engineering degrees in the U.S. in 2005 is also shown6. We see that APPLES data mimic national data with respect to the percentage of Industrial Engineering majors; however, Electrical Engineering majors are underrepresented and Mechanical Engineering majors are overrepresented in the APPLES sample. Table 4.5 shows the distribution of engineering majors among APPLES seniors by gender. We see that APPLES men are more likely to be majoring in Electrical and Mechanical Engineering than are APPLES women, whereas APPLES women are more likely to be majoring in Chemical Engineering; this finding is consistent with national trends7. Gender differences in the percentages of Civil and Other Engineering majors are not significant8. Although we generally do not disaggregate data by major field of study in this report, future research will test variations by and interactions with major. Figure 4.1 Comparison of Engineering Majors in APPLES’ Senior Population with NSF 2005 Data
[1] See footnote 6.
6 National Science Foundation, Division of Science Resources Statistics, special tabulations of U.S. Department of Education, National Center for Education Statistics, Integrated Postsecondary Education Data System, Completions Survey, 1998–2007. Available at http://www.nsf.gov/statistics/wmpd/degrees.cfm#bachelor, TABLE C-5. Bachelor's Degrees, by field and sex: 1998–2007. 7 National Science Foundation, Division of Science Resources Statistics. 2010 Science and Engineering Degrees: 1997–2006. Detailed Statistical Tables NSF 10-300. Arlington, VA. Available at http://www.nsf.gov/statistics/nsf08321/. TABLE 49. Chemical Engineering degrees awarded, by degree level and sex of recipient: 1966–2006. In 2006, 35 percent of students receiving BS degrees in Chemical Engineering were women; as compared, for example to 13 percent in Mechanical Engineering. 8 Computer Science in Engineering or Computer Engineering, Bioengineering, Environmental Engineering, and Other Engineering are collapsed into a single category.
0.05.0
10.015.020.025.030.035.0
Mech Other E
Elec Civil IE Aero Chem Mat'l
Perc
ent
Engineering Majors
APPLES
NSF-2005

Exploring the Engineering Student Experience 30
Table 4.5 Distribution of Majors Among APPLES Senior Women and Men9
[1] Other Engineering=Computer Science in Engineering or Computer Engineering, Bioengineering, Environmental Engineering, and Other Engineering collapsed ***p<.001, **p<.01, *p<.05, ns=not significant
9 The number of engineering majors is greater than the number of APPLES seniors, as it includes every instance in Q5 and Q6 of a student indicating an engineering field.
Total # degrees
Percent of total Total # degrees
Percent of total
Sig of z-test for independent proportions
Aero Engineering 79 7.7 14 3.6 **Chemical Engineering 34 3.3 38 9.7 ***Civil Engineering 106 10.3 53 13.6 nsElectrical Engineering 176 17.2 36 9.2 ***Industrial Engineering 59 5.8 42 10.8 **Materials Engineering 34 3.3 24 6.2 *Mechanical Engineering 314 30.6 83 21.3 ***Other Engineering [1] 223 21.8 100 25.6 nsTotal 1,025 390
Men Women


Exploring the Engineering Student Experience 31
Chapter 5: What is the college experience like?
College consists of experiences both in and outside of the classroom. What did APPLES senior and first-year engineering students tell us about these experiences? How do these experiences compare between women and men? How might they change over time? We address these questions in this chapter, drawing from the items on the APPLES survey instrument that probe students’ academic involvement, satisfaction, and achievement1
. We discuss simple correlations between these variables (Tables 5.1 and 5.2) as well as mean scores (Tables 5.3 to 5.8) and percentages. Appendix II.2 present these data for first-year students by gender.
Table 5.1 Simple Correlation Coefficients: Academic Experiences Among Senior Women
N=326 ***p<.001, **p<.01, *p<.05, ns=not significant
1 Part I of this report provides an overview of all of multi- and single- item variables of interest in the APPLES study.
1 2 3 4 5 6 7 8 9 10 11 12 13 14 15 161. Exposure: Individual-based Projects 12. Exposure: Team-based Projects .033 13. Frequency of Interaction with Instructors .207*** .289*** 1
4. Satisfaction with Instructors .114 .074 .350*** 15. Curriculum Overload -.017 -.084 -.009 -.187** 16. Academic Involvement - Engineering .015 .151** .170** .084 -.145** 17. Academic Involvement - Liberal Arts .015 .069 .012 .067 -.107 .629*** 18. Frequency of Engineering Extracurricular Participation -.005 .005 .179** -.014 -.001 .040 .025 19. Importance of Non-engineering Extracurricular Participation .044 -.026 .111 .094 -.015 .020 .132* .211*** 110. Frequency of Non-engineering Extracurricular Participation -.025 -.085 .021 .171** -.076 -.070 .075 .215*** .708*** 111. Engineering Research .128* .090 .141* .090 -.020 -.005 .085 .107 .061 .041 112. Exposure to Engineering Profession .076 .031 .128* .137* -.143* .049 .065 .160** .205*** .201*** .042 113. Overall Satisfaction .083 .077 .255*** .560*** -.193** .079 -.019 .042 .124* .150** .011 .167** 114. Financial Concerns .015 -.062 .065 -.134* .216*** -.054 -.105 .029 -.002 -.041 -.081 -.053 -.136* 115. GPA Index .060 -.004 .194*** .211*** -.192** .257*** .199** .112* .108 .160** .130* .135* .200*** -.280*** 116. Intent to Major in Engineering .009 .062 .113* .158** -.006 -.005 -.026 .063 -.045 -.068 .119* .039 .096 -.099 .062 1

Exploring the Engineering Student Experience 32
Table 5.2 Simple Correlation Coefficients: Academic Experiences Among Senior Men
N=795 ***p<.001, **p<.01, *p<.05, ns=not significant
1 2 3 4 5 6 7 8 9 10 11 12 13 14 15 161. Exposure: Individual-based Projects 12. Exposure: Team-based Projects .064 13. Frequency of Interaction with Instructors .076* .183*** 14. Satisfaction with Instructors .084* .140*** .218*** 15. Curriculum Overload .015 .035 .054 -.128*** 16. Academic Involvement - Engineering -.071 -.027 .020 .024 -.107** 17. Academic involvement - Liberal Arts -.069 -.083* -.040 -.039 -.095* .620*** 18. Frequency of Engineering Extracurricular Participation -.032 .135*** .222*** .156*** -.001 .034 -.007 19. Importance of Non-engineering Extracurricular Participation .013 .087* .127*** .006 .073* -.111** -.002 .143*** 110. Frequency of Non-engineering Extracurricular Participation .031 .078* .165*** .039 -.035 -.085* -.030 .201*** .720*** 111. Engineering Research .024 .087* .233*** .081* .019 .013 .038 .111** .043 .093** 112. Exposure to Engineering Profession .054 .092** .174*** .048 -.059 .103** .033 .093** .157*** .244*** .213*** 113. Overall Satisfaction .072* .147*** .202*** .587*** -.093** .091* -.021 .162*** .079* .131*** .107** .145*** 114. Financial Concerns .032 .033 .085* -.142*** .175*** .019 -.063 .032 -.007 -.045 -.004 -.009 -.147*** 115. GPA Index -.028 -.007 .132*** .135*** -.166*** .269*** .177*** .177*** -.052 .025 .122** .165*** .143*** -.086* 116. Intent to Major in Engineering -.093** .048 .066 .108** .026 .065 -.004 .122** .014 -.025 .081* .104** .102** -.044 .089* 1
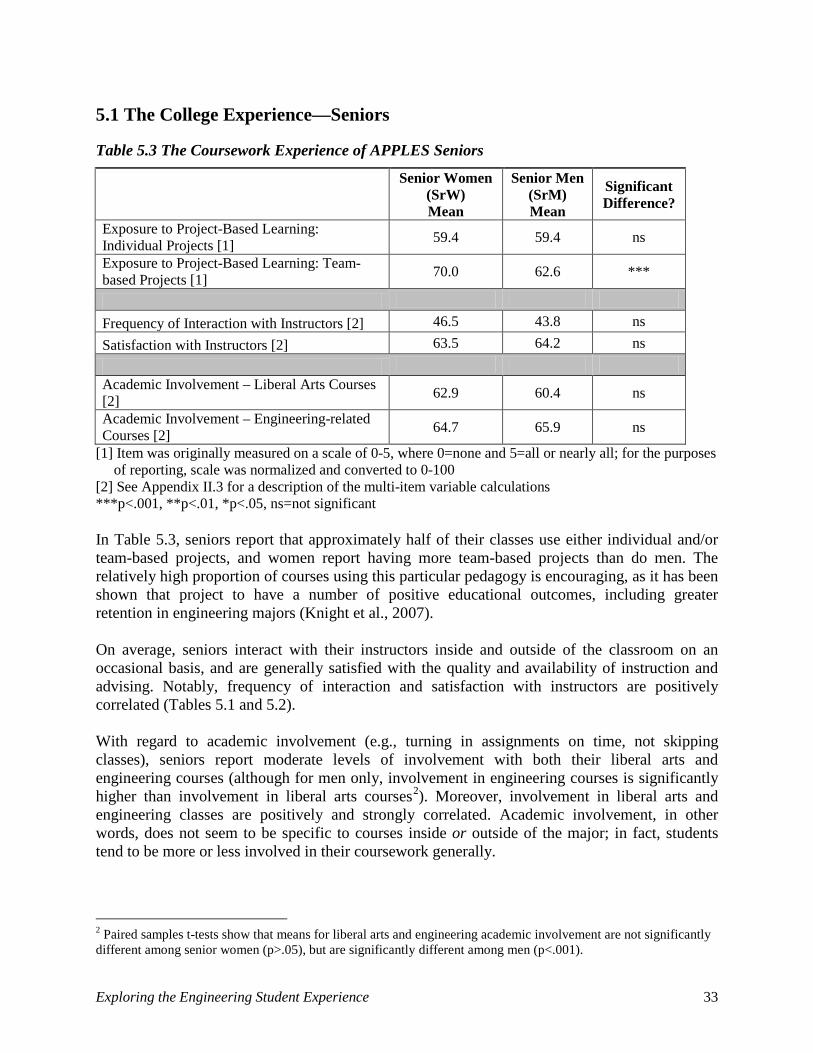
Exploring the Engineering Student Experience 33
5.1 The College Experience—Seniors
Table 5.3 The Coursework Experience of APPLES Seniors
Senior Women
(SrW) Mean
Senior Men (SrM) Mean
Significant Difference?
Exposure to Project-Based Learning: Individual Projects [1] 59.4 59.4 ns
Exposure to Project-Based Learning: Team-based Projects [1] 70.0 62.6 ***
Frequency of Interaction with Instructors [2] 46.5 43.8 ns Satisfaction with Instructors [2] 63.5 64.2 ns Academic Involvement – Liberal Arts Courses [2] 62.9 60.4 ns
Academic Involvement – Engineering-related Courses [2] 64.7 65.9 ns
[1] Item was originally measured on a scale of 0-5, where 0=none and 5=all or nearly all; for the purposes of reporting, scale was normalized and converted to 0-100
[2] See Appendix II.3 for a description of the multi-item variable calculations ***p<.001, **p<.01, *p<.05, ns=not significant In Table 5.3, seniors report that approximately half of their classes use either individual and/or team-based projects, and women report having more team-based projects than do men. The relatively high proportion of courses using this particular pedagogy is encouraging, as it has been shown that project to have a number of positive educational outcomes, including greater retention in engineering majors (Knight et al., 2007). On average, seniors interact with their instructors inside and outside of the classroom on an occasional basis, and are generally satisfied with the quality and availability of instruction and advising. Notably, frequency of interaction and satisfaction with instructors are positively correlated (Tables 5.1 and 5.2). With regard to academic involvement (e.g., turning in assignments on time, not skipping classes), seniors report moderate levels of involvement with both their liberal arts and engineering courses (although for men only, involvement in engineering courses is significantly higher than involvement in liberal arts courses2
). Moreover, involvement in liberal arts and engineering classes are positively and strongly correlated. Academic involvement, in other words, does not seem to be specific to courses inside or outside of the major; in fact, students tend to be more or less involved in their coursework generally.
2 Paired samples t-tests show that means for liberal arts and engineering academic involvement are not significantly different among senior women (p>.05), but are significantly different among men (p<.001).

Exploring the Engineering Student Experience 34
Among men, the correlations between engineering course involvement and both satisfaction and frequency of interaction with instructors are not significant, and neither is the correlation between engineering course involvement and exposure to project-based learning. Among women, there appears to be a slightly stronger and positive pattern of association between engineering course involvement and team projects, and involvement and faculty interaction, though correlations are significant at p<.01.
Table 5.4 Activities of APPLES Seniors Outside of the Classroom
Senior
Women (SrW) Mean
Senior Men (SrM)
Mean
Significant Difference?
Frequency of Engineering Extracurricular Participation [1] 50.7 36.3 ***
Frequency of Non-engineering Extracurricular Participation [2] 78.0 71.3 ***
Importance of Non-engineering Extracurricular Participation [3] 65.0 59.3 **
Exposure to Engineering Profession [4] 69.0 67.0 ns [1] Item was originally measured on a scale of 0-3, where 0=no involvement and 3=extensive
involvement; for the purposes of reporting, scale was normalized and converted to 0-100 [2] Item was originally measured on a scale of 0-3, where 0=never and 3=frequently; for the purposes of
reporting, scale was normalized and converted to 0-100 [3] Item was originally measured on a scale of 0-3, where 0=not important and 3=essential; for the
purposes of reporting, scale was normalized and converted to 0-100 [4] Item was originally measured on a scale of 0-3, where 0=no exposure and 3=extensive exposure; for
the purposes of reporting, scale was normalized and converted to 0-100 ***p<.001, **p<.01, *p<.05, ns=not significant Senior women report higher levels of participation in non-engineering extracurricular activities, which is consistent with the finding that these activities may be more important to women (65.0 SrW, 59.3 SrM). Even though these non-engineering activities may be more important to women, for all APPLES seniors they are in the "very important" range. Senior women also report higher levels of participation in extracurricular engineering activities (e.g., engineering clubs and societies) than do senior men (see Table 5.4). Extracurricular participation in engineering activities is positively correlated with extracurricular participation in non-engineering activities for women and men. (a parallel "importance" question was not asked of engineering activities). Interestingly, there is weak or no association between engineering course involvement and extracurricular participation in engineering and non-engineering activities for women and men, suggesting that there is not a single story that describes how students combine extracurricular involvement and coursework. Seniors also are involved with engineering research: 55.1 percent of women and 47 percent of men report that they have had engineering research experience since entering college. Tables 5.1 and 5.2 indicate that research is correlated with faculty interaction among men in particular.

Exploring the Engineering Student Experience 35
On average, seniors report a moderate amount of exposure to the professional engineering environment as visitors, interns, or employees (Table 5.4). There is a positive correlation between this type of exposure and extracurricular participation in non-engineering activities, and, among men only, between exposure and research experience. The relationship between exposure and extracurricular engineering activities is weaker, again indicating that there are no simple patterns in how students choose to spend or allocate their time. Senior men and women report similar grade point averages (68/100 using the GPA Index3
Table 5.5 “Outcomes” of the College Experience
), as shown in Table 5.5. For both men and women, GPA is positively correlated with academic involvement (both in liberal arts and engineering courses), and with frequency and satisfaction with instructors.
Senior Women
(SrW) Mean
Senior Men (SrM) Mean
Significant Difference?
GPA Index (see footnote 3) 67.8 68.4 ns Curriculum Overload [1] 57.3 52.1 *** Pressure to Balance Between Social and Academic Life [2] 53.2 47.8 **
Overall Satisfaction [3] 73.3 70.7 ns [1] See Appendix II.3 for description of multi-item variable calculation [2] Item was originally measured on a scale of 0-5, where 0=no pressure and 5=high pressure; for the
purposes of reporting, scale was normalized and converted to 0-100 [3] Item was originally measured on a scale of 0-3, where 0=very dissatisfied and 3=very satisfied; for the
purposes of reporting, scale was normalized and converted to 0-100 ***p<.001, **p<.01, *p<.05, ns=not significant 3 Guide for GPA Index Conversion
GPA Index, as reported in Table 5.5. On a 100 point scale where C- is baseline defined as 0 (current
recode)
What is your cumulative
GPA? (Q35) - original question
Original coding of
Q35
On a 4 point scale (taking
the higher number of the range)
Converting the 4 point scale to
a 100 point scale (where
C- is 1.5)
100 A or A+ (3.9 or above)
0 3.9 97.5
85.7 A- (3.5-3.8) 1 3.8 95 71.4 B+ (3.2-3.4) 2 3.4 85 57.1 B (2.9-3.1) 3 3.1 77.5 42.8 B- (2.5-2.8) 4 2.8 70 28.5 C+ (2.2-2.4) 5 2.4 60 14.2 C (1.9-2.1) 6 2.1 52.5
0 C- or lower (less than 1.5)
7 1.5 37.5

Exploring the Engineering Student Experience 36
Average levels of “curriculum overload” (as related to course pace, workload, and balance between social and academic lives) are moderate, though women report higher levels of overload than do men. One component of curriculum overload is the balance between academic and social demands4
; women report this type of pressure more so than do men (p<.01).
We note that curriculum overload is negatively correlated with the GPA Index, suggesting that students who are achieving higher grades generally feel less stressed about their coursework. Perhaps the positive feedback of higher grades may serve to buffer or dampen a sense of overload, and/or that overload may lead to lower levels of academic achievement. Simple correlations do not allow us to know whether a sense of overload is affecting grade performance, or if grades are affecting overload, or if there is a related set of factors at work that contribute to this link. For example, students’ sense of curriculum overload may be tied to factors outside their immediate study of engineering. Curriculum overload was found to be positively correlated with concerns over financing one’s education (this is item 14 in Tables 5.1 and 5.2). Senior men and women are generally satisfied with their overall college experience (Table 5.5). Overall satisfaction is positively correlated with satisfaction with instructors, and with frequency of interaction with instructors. It is also positively correlated with GPA. 5.2 The College Experience—Seniors Versus First-Year Students We now consider the same variables on coursework experience, activities outside of the classroom, and “outcomes” for first-year students (FY), as compared with seniors (Sr). Because these data are cross-sectional, inferences about change over time are made cautiously, as these findings may be due to contextual as well as developmental differences. Gender comparisons for first-year students are included in Appendix II.2.
Table 5.6 Comparing Coursework Experience Variables for First-Year Students and Seniors
First-Year
Students (FY, n=869) Mean
Seniors (Sr, n=1130)
Mean
Significant Difference between FY and Sr?
Exposure to Project-Based Learning: Individual Projects [1] 61.2 59.2 ns
Exposure to Project-Based Learning: Team-based Projects [1] 54.4 64.8 *** overall, (*** W, *** M)
Frequency of Interaction with Instructors [2] 35.3 44.7 *** overall, (*** W, *** M)
Satisfaction with Instructors [2] 72.4 63.9 *** overall, (*** W, *** M) Academic Involvement- Liberal Arts [2] 73.3 61.2 *** overall, (*** W, *** M) Academic Involvement- Engineering [2] 77.0 65.6 *** overall, (*** W, *** M)
[1] Item was originally measured on a scale of 0-5, where 0=none and 5=all or nearly all; for the purposes of reporting, scale was normalized and converted to 0-100
[2] See Appendix II.3 for description of multi-item variable calculation ***p<.001, **p<.01, *p<.05, ns=not significant 4This item is included in the “Curriculum Overload” variable; however, we examine this item on its own as it can uniquely give us a sense of how challenged students are by both the academic and non-academic parts of their lives.

Exploring the Engineering Student Experience 37
Seniors have more exposure to team-based projects than do first-year students (Table 5.6). They also have more interactions with their instructors. Yet, seniors are less satisfied with their instructors than are first-year students. This may reflect lower levels of overall satisfaction among seniors (as we will see below), and/or that the possibility that seniors may have higher standards/expectations for teaching. We also see that seniors are less involved in both their engineering and liberal arts courses than are first-years.
Table 5.7 Comparing Activities Out of the Classroom for First-Year Students and Seniors
First-Year
Students (FY) Mean
Seniors (Sr) Mean Significant Difference?
Frequency of Engineering Extracurricular Participation, [1] 29.3 40.7 *** overall, (*** W, ***M)
Frequency of Non-engineering Extracurricular Participation [2] 71.0 73.3 ns
Importance of Non-engineering Extracurricular Participation [3] 58.3 61.0 ns
Exposure to Engineering Profession [4] 34.7 67.7 *** overall, (***W, ***M)
[1] Item was originally measured on a scale of 0-3, where 0=no involvement and 3=extensive involvement; for the purposes of reporting, scale was normalized and converted to 0-100
[2] Item was originally measured on a scale of 0-3, where 0=never and 3=frequently; for the purposes of reporting, scale was normalized and converted to 0-100
[3] Item was originally measured on a scale of 0-3, where 0=not important and 3=essential; for the purposes of reporting, scale was normalized and converted to 0-100
[4] Item was originally measured on a scale of 0-3, where 0=no exposure and 3=extensive exposure; for the purposes of reporting, scale was normalized and converted to 0-100
***p<.001 **p<.01 *p<.05 ns=not significant Seniors and first-year students report similar levels of involvement in non-engineering activities, and ascribe similar levels of importance to these activities (Table 5.7). Seniors are more involved in extracurricular engineering activities than are first-year students. Seniors report more exposure to engineering through internships, jobs, and visits to companies, and more have had research experience (49.2% of seniors vs. 21.4% first-years).

Exploring the Engineering Student Experience 38
Table 5.8 Comparing “Outcomes” for First-Year Students and Seniors
First-Year
Students (FY) Mean
Seniors (Sr)
Mean Significant Difference?
GPA Index (see footnote 3) 70.0 68.2 ns Curriculum Overload [1] 52.0 53.6 ns overall, (ns W; ** M) Pressure to Balance Between Social and Academic Life [2] 44.8 49.4 *** overall, (* W, *** M)
Overall Satisfaction [3] 78.3 71.3 *** overall, (*** W, *** M) [1] See Appendix II.3 for description of multi-item variable calculation [2] Item was originally measured on a scale of 0-5, where 0=no pressure and 5=high pressure; for the
purposes of reporting, scale was normalized and converted to 0-100 [3] Item was originally measured on a scale of 0-3, where 0=very dissatisfied and 3=very satisfied; for the
purposes of reporting, scale was normalized and converted to 0-100 ***p<.001, **p<.01, *p<.05, ns=not significant Seniors and first-year students report similar GPA Index scores (Table 5.8); this finding is consistent with data presented in Ohland et al. (2008) and Lichtenstein et al. (2009). However, the finding that seniors report similar GPAs to first-years despite lower levels of course involvement (see Table 5.6) suggests that seniors may have gotten better at “doing school” as compared with first-years, or that the basis for grading may change as students enter a major. Seniors report less overall satisfaction with college than do first-year students. In addition, senior men report a shift upward in curriculum overload relative to first-year men (p<.01). Women’s sense of overload is fairly constant across academic standing, and is significantly higher than the overload reported by men (Table 5.5). When we probe further into the pressure relating to the balance between social and academic demands (one of the items within the curriculum overload variable), both senior men and women report more pressure to balance their social and academic lives than do first-years. However, the difference reaches significance at p<.001 for men only. 5.3 Findings About the College Experience Positive differences between seniors and first-years Seniors interact more with instructors than do first-year students, and their courses utilize more project-based learning in teams. Not surprisingly, more of them have had research, co-op and internship experiences. Seniors are also more active in engineering extracurricular activities than are first-years. Whereas participation in engineering extracurricular activities is greater among seniors than among first-year students, participation in non-engineering extracurricular activities is comparable between the academic cohorts.

Exploring the Engineering Student Experience 39
Negative difference between seniors and first-years Taken as a whole, seniors are less satisfied than are first-years with their overall college experience. Also, seniors are less satisfied than first-years with their instructors, even though they are interacting with them more frequently. Furthermore, seniors are less academically involved in their courses than are first-year students. This is true for both engineering and liberal arts courses. This is certainly an issue that merits consideration by faculty and programs: why do students who should be deeply invested in their major (by their fourth or even fifth year of schooling) actually attend class less, not turn in their best work, and so on? Perhaps we should interpret this possible decline in academic involvement in light of greater extracurricular participation in engineering activities and research, and even their increased interaction with instructors. Are students, as they progress through their academic career, expanding their ways of learning about engineering at the expense of high levels of curricular participation? Are they learning to optimize their time? Have they learned what is needed to “do school,” since in general their GPAs are not dropping? While seniors may be more efficient in “doing school,” we also note that senior men report a greater sense of curriculum overload and, specifically, more difficulty in balancing their personal and academic lives than do first-year men. This difference in academic standing is less pronounced among women. However, women’s sense of overload and difficulty with balance exceed that of men’s at the senior level (as well as at the first-year level—see Appendix II.2).
Women and men, alike and different… Many of the college experiences of women and men majoring in engineering are similar. They have similar levels of interaction and satisfaction with instructors, and report similar levels of academic involvement, as well as exposure to engineering through co-ops, internships and research. They also report similar GPAs. There are two important gender differences among engineering seniors:
• Women report more frequent involvement in engineering and non-engineering extracurricular activities than do men, and in the case of non-engineering activities, they attribute more importance to these activities. This suggests that activities outside of the classroom may play a more prominent role in the lives of undergraduate engineering women as compared with men.
• Women report a greater sense of curricular overload than do men. Examining one specific dimension of overload, women report greater pressure to balance their social and academic lives.


Exploring the Engineering Student Experience 40
Chapter 6: What motivates students to study engineering?
In this chapter, we examine the factors that influence students’ motivations to study engineering. More specifically, we explored the extent to which students are motivated to study engineering due to:
• Intrinsic reasons (behavioral and psychological)
• The perceived relevance and role of engineering (seeing engineering as the means to affect social good or to achieve a financially successful career)
• The influence of the people around them (parents and mentors).
These types of motivational factors were suggested by Seymour and Hewitt (1997), Ryan and Deci (2000), and Eccles and Wigfield (2002). 6.1 Motivation Among Seniors We found that engineering seniors are primarily motivated by behavioral, psychological, and social good factors (see Figure 6.1). Figure 6.1 Seniors’ Motivation to Study Engineering [1]
Variable mean scores presented on a scale of 0-100; N=1130 [1] See Appendix II.3 for description of multi-item variable calculation

Exploring the Engineering Student Experience 41
Figure 6.2 Seniors’ Motivation to Study Engineering by Gender [1] [2]
Variable mean scores presented on a scale of 0-100; Women: n=326; Men: n=795 [1] Statistical notation refers to the significance of the gender difference in mean scores for each variable.
Blank notation indicates that the difference is not significant (p>.05). Appendix II.1 provides means and standard deviations for each measure.
[2] Paired sample t-tests were conducted in order to assess which motivation means were significantly different from one another, first among senior women and then among senior men. Among women, all means were significantly different at p<.001 except for: Social Good Motivation and Intrinsic Psychological Motivation, which was significant at p<.01; Social Good Motivation and Intrinsic Behavioral Motivation, which was not significant; and Intrinsic Psychological Motivation and Intrinsic Behavioral Motivation, which was not significant. Among men, all means were significantly different at p<.001.
***p<.001, **p<.01, *p<.05 Among senior women, mean scores on intrinsic psychological motivation and intrinsic behavioral motivation are not significantly different, nor are mean scores on intrinsic behavioral motivation and social good motivation (see Figure 6.2). This suggests that intrinsic psychological motivation, intrinsic behavioral motivation, and social good motivation are of comparable “weight.” In contrast, among senior men, the mean scores on intrinsic behavioral motivation are significantly higher than are scores on both the psychological and social good motivational constructs, indicating that for men, behavioral factors (the “doing” of engineering—building, figuring out how things work, and so on) might be most important to their decision to pursue engineering in college. Moreover, when comparing men’s motivational “profile” to women’s, men’s mean scores on behavioral motivation are significantly higher than are women’s. Still, for both men and women, behavioral factors are cited as “moderate” or “major” reasons to pursue engineering more often than not. On average, the financial reasons for pursuing engineering studies are of moderate importance to senior men and women.

Exploring the Engineering Student Experience 42
While mentor motivation may not be as salient for students as are other motivational constructs, senior women tend to cite the influence of mentors more so than do senior men. For both men and women, parents’ attitudes and values were ranked lowest in terms of reasons to pursue engineering studies.
Motivational factors interrelated
These six dimensions of motivation are interrelated (see Tables 6.1a and 6.1b). For example, seniors who pursue engineering for its intrinsic value (psychological and behavioral) also tend to be motivated by its potential social value. Mentor motivation is positively correlated with social good motivation and psychological motivation, which suggests that mentors may play an important (and subtle) role in helping to develop other motivational dimensions. Parental motivation is positively correlated with financial motivation. Parental motivation is also correlated with having parents and/or siblings who are engineers (0.331*** SrW, 0.201*** SrM; not included in Tables 6.1a/b). Among senior men but not senior women, parental motivation is correlated with mentor motivation, raising the possibility that men see or count parents as mentors more so than women do. Among senior women, parental motivation and psychological motivation are negatively correlated (as are parental motivation and behavioral motivation, p<.01). Further multivariate work must be conducted to examine these interrelationships—and possible interactions with gender—more closely. Table 6.1a Simple Correlation Coefficients: Motivational Factors Among Senior Women
***p<.001, **p<.01, *p<.05
1 2 3 4 5 61. Intrinsic Psychological Motivation 12. Intrinsic Behavioral Motivation .643*** 13. Social Good Motivation .696*** .412*** 14. Financial Motivation -.092 -.079 .009 15. Mentor Influence Motivation .256*** .145*** .208*** -.036 16. Parental Influence Motivation -.223***-.148** -.060 .261*** .100 1

Exploring the Engineering Student Experience 43
Table 6.1b Simple Correlation Coefficients: Motivational Factors Among Senior Men
***p<.001 **p<.01 *p<.05 Motivational factors related to instructors We were curious as to how motivation might be related to college instructors. Table 6.2 shows the four out of six motivational factors (all but parent and financial motivation) that are positively and significantly correlated with two measures of faculty-student interactions (frequency and satisfaction). There is some variation in the size of the coefficients, and gender differences; for instance, among women, frequency of instructor interaction is more closely tied to social good motivation than is satisfaction with instructors, while among men, the reverse is true. These correlations suggest that there may be an important interplay between motivation and relationships with faculty, In other words, are, in fact, “intrinsic” motivational factors not as separate from the academic environment as they seem? Are students with certain motivational profiles more likely to interact and express satisfaction with faculty? How do faculty contribute to and reinforce students’ motivations? How does this play out in terms of students’ engineering achievements and choices?
Table 6.2 Simple Correlations Between Motivational Factors and Faculty Interactions Among Seniors by Gender
***p<.001, **p<.01, *p<.05
Motivational factors related to out-of-classroom college experiences We also considered whether motivational factors might be correlated with out-of-classroom experiences. We considered frequency of participation in extracurricular engineering activities, and exposure to engineering through co-ops and internships. The results are shown in Table 6.3.
W M W M W M W M1. Frequency of Interaction with Instructors .330 *** .173 *** .203 *** .107 ** .245 *** .112 ** .210 *** .202 ***2. Satisfaction with Instructors .244 *** .267 *** .123 * .127 ** .098 .194 *** .179 ** .150 ***
Social Good Mentor InfluenceIntrinsic-
PsychologicalIntrinsic-
Behavorial
1 2 3 4 5 61. Intrinsic Psychological Motivation 12. Intrinsic Behavioral Motivation .632*** 13. Social Good Motivation .659*** .359*** 14. Financial Motivation .008 .083 .149*** 15. Mentor Influence Motivation .148*** .130*** .188*** .109** 16. Parental Influence Motivation .010 -.052 .087* .144*** .232*** 1

Exploring the Engineering Student Experience 44
Table 6.3 Simple Correlations Between Motivational Factors and Out-of-Classroom Experiences Among Seniors by Gender
***p<.001, **p<.01, *p<.05 Extracurricular involvement in engineering activities is correlated with social good motivation (although these coefficients, like others in this table, indicate very modest associations). How and why does participation in these activities connect with the desire to study engineering in order to address societal problems? Also, exposure to the engineering profession through co-ops, internships and work assignments is associated with mentor motivation. What might this relationship between professional exposure and mentors say about who is actually mentoring today’s students? Does exposure to the profession simultaneously expose students to mentors, thereby strengthening that particular motivational dimension? Or is something else at work?
Motivational factors as related to major and gender As described in Chapter 4, the percentage of women majoring in particular engineering majors varies by major (for example, women make up 35% of U.S. students receiving bachelors’ degrees in Chemical Engineering, and 13% of those receiving bachelors’ degrees in Mechanical Engineering1). This suggests that women are drawn to some branches of engineering more so than others. Might it also be that women who study a particular type of engineering are motivated by different factors than are women who choose other engineering pathways? Drawing from the APPLES data, Parikh et al. (2009) explored how motivation to study engineering varies by gender and by engineering major. Results show that senior women majoring in BioX engineering (a grouping of any of the bioscience-related engineering fields), Mechanical Engineering (ME), Electrical Engineering (EE), and Aerospace Engineering (AE) exhibit comparable (and high) levels of psychological, behavioral and social good motivation, followed by financial motivation. For women in Industrial Engineering (IE) and Chemical Engineering (CE), psychological, social good and financial motivations are of comparable (and
1 National Science Foundation, Division of Science Resources Statistics. 2010 Science and Engineering Degrees: 1997–2006. Detailed Statistical Tables NSF 10-300. Arlington, VA. Available at http://www.nsf.gov/statistics/nsf08321/. TABLE 49. Chemical engineering degrees awarded, by degree level and sex of recipient: 1966–2006. TABLE 54. Mechanical engineering degrees awarded, by degree level and sex of recipient: 1966-2007. In 2006, 35 percent of students receiving BS degrees in Chemical Engineering were women; as compared, for example to 13 percent in Mechanical Engineering.
W M W M W M W M W M W M1. Frequency of Engineering Extracurricular Participation
0.116* 0.126*** .094 .038 0.167** 0.160*** -.028 .015 0.176** 0.113** -.046 0.075*
2. Exposure to Engr. Profession
.031 0.133*** .045 0.135*** .013 0.107** 0.137* 0.077* 0.151** 0.200*** .016 -.045
Intrinsic Psycho. Intrinsic Behavorial
Social Good Financial Mentor Influence Parental Influence

Exploring the Engineering Student Experience 45
high) strengths, followed by behavioral motivation. The IE women are much more financially motivated to study engineering than their BioX counterparts, and much less behaviorally and psychologically motivated than their ME and EE counterparts. Men majoring in BioX engineering exhibit comparable (and high) levels of psychological, behavioral and social good motivation, followed by financial motivation. They are therefore similar to women not only in BioX, but in ME, EE and AE. They are, however, different from other men who major in ME, EE and AE, where there is a clear hierarchy in motivations: behavioral is followed by psychological, then social good, and lastly by financial motivation. This research poses several questions for future studies of motivation-driven patterns in engineering education and career pathways. For example, once students select a major, are they able to realize or act on what drew them there in the first place? How does motivation itself influence the nature of work or research conducted in the major (or the intellectual “output” of undergraduate engineering programs), which in turn reinforces the appeal of the major to certain student groups? 6.2 Comparing Motivation Between Seniors and First-Year Students Above we considered seniors’ motivation to study engineering, and began to explore how motivation might be reinforced by the college experience (looking specifically at college instructors). Figure 6.3 shows the mean motivation scores for first-year women and men. As with seniors, intrinsic factors are the strongest motivators, and parental and mentor motivational factors are the weakest. Similar to the senior picture, there are significant differences between first-year women’s and men’s intrinsic behavioral motivations (p<.001) and mentor motivations (p<.01), although the sizes of the gaps are smaller for the first year students. The findings presented in Figure 6.4 compare seniors’ motivational profiles with those of first-years. The profiles are very similar, suggesting that students’ motivations to pursue engineering may take shape due to early educational experiences, and college tends to reinforce what initially draws them to the field. A similar “stability” to motivational factors between first-year and seniors was also seen in the longitudinal work conducted with the PIE survey where students’ motivations for studying engineering were probed seven times during their college years (Eris et. al. 2010).
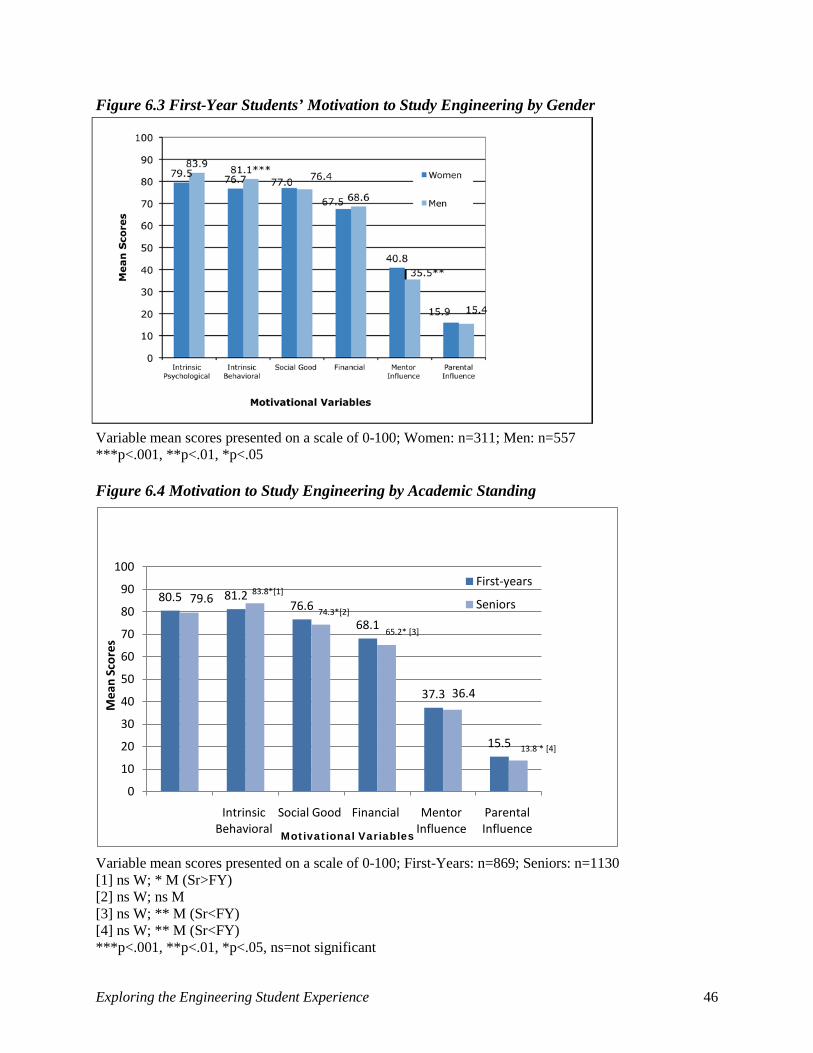
Exploring the Engineering Student Experience 46
Figure 6.3 First-Year Students’ Motivation to Study Engineering by Gender
Variable mean scores presented on a scale of 0-100; Women: n=311; Men: n=557 ***p<.001, **p<.01, *p<.05 Figure 6.4 Motivation to Study Engineering by Academic Standing
Variable mean scores presented on a scale of 0-100; First-Years: n=869; Seniors: n=1130 [1] ns W; * M (Sr>FY) [2] ns W; ns M [3] ns W; ** M (Sr<FY) [4] ns W; ** M (Sr<FY) ***p<.001, **p<.01, *p<.05, ns=not significant
80.5 81.276.6
68.1
37.3
15.5
79.683.8*[1]
74.3*[2]
65.2* [3]
36.4
13.8 * [4]
0
10
20
30
40
50
60
70
80
90
100
Intrinsic Behavioral
Social Good Financial Mentor Influence
Parental Influence
Mea
n Sc
ores
First-years
Seniors
Motivational Variables

Exploring the Engineering Student Experience 47
Motivational factors related to instructors and team-based project work Table 6.4 summarizes simple correlations between faculty interactions and the four motivational factors in Table 6.2, this time among first-year students. For both first-years and seniors, the frequency of interaction with instructors is correlated with mentor motivation. However, the significant correlation between frequency of instructor interaction and intrinsic psychological motivation among senior women is not present among first-year women. Similarly, the significant correlation between instructor satisfaction and social good motivation among senior men is not present among first-year men. Perhaps instructors factor into students’ motivations and choices to a greater degree as they progress through college and develop more of these kinds of relationships. Furthermore, first-year students may have fewer faculty interactions to draw from. More research is needed to understand when, where, and why faculty have an impact on students’ reasons for pursuing various lines of study and work. We also explored whether motivation might be correlated with pedagogical strategies, particularly in light of the increased investment by many engineering programs in team-based project work for both motivational and learning reasons. For first-year men, team-based project work and intrinsic psychological motivation are correlated; this correlation is not significant among first year women2. We will return to the question of the role of team-based projects in the college experience in Chapter 7. Table 6.4 Simple Correlations Between Motivational Factors, Faculty Interactions, and Exposure to Team-Based Projects Among First-Year Students by Gender
Intrinsic-
Psychological Intrinsic-
Behavioral Social Motivation Mentor Influence
Motivation W M W M W M W M 1. Frequency of Interaction with Instructors
.056 .164 *** .004 .068 .031 .093 * .167 ** .195 ***
2. Satisfaction with Instructors
.227 *** .161 *** .134 * .108 * .078 .043 .127 * .140 **
3. Exposure to Project-Based Learning: Team-based Projects
.043 .165 *** .121 * .114 ** .116 * .128 ** .178 ** .109 *
***p<.001, **p<.01, *p<.05 First-year student motivation as related to persistence in engineering Of all of the motivational factors, intrinsic psychological motivation is perhaps the most difficult to “bottle”—but the most precious to sustain. Feeling a close identification with one’s work on an affective, visceral level can be a major factor in pursuing such work in the face of inevitable obstacles and challenges. Is there a relationship between psychological motivation and the
2 This was not a correlate of motivation among seniors.

Exploring the Engineering Student Experience 48
strength of a student’s commitment to complete an engineering degree? As shown in Table 6.5, first-year students who are motivated to study engineering because they enjoy it tend to have a stronger commitment to persist. There may be several reasons for this link. Analyses with longitudinal data from the Persistence in Engineering survey confirms a link between psychological motivation and retention in an engineering major (Otto et al., 2009). Multivariate models in Chapter 11 allow us to examine more closely the role of intrinsic psychological motivation in engineering plans. Table 6.5 Simple Correlations Between Intrinsic Psychological Motivation and Intention to Complete an Engineering Major Among First-Year Students by Gender
Intention to Complete an Engineering Major Intrinsic
Psychological Motivation
Women .216***
Men .331*** ***p<.001 **p<.01 *p<.05 6.3 Findings: What Motivates Students to Study Engineering A range of motivational factors Students are motivated to study engineering by intrinsic factors (psychological and behavioral), extrinsic factors (social good and financial reward), and relationship factors (mentors and parents), in that order. The strength and order of these various factors are not appreciably different between first-year students and seniors, suggesting that the reasons to study engineering may take shape prior to matriculating college or early on in the college experience. Motivational factors may not act independently; for instance, the intrinsic, social good, and mentor motivational factors are correlated with one another. How to reinforce motivation For seniors, four of the six types of motivation—intrinsic behavioral, intrinsic psychological, social good and mentor influence—are correlated with frequency and satisfaction with instructors. It may be that that the motivated student seeks out more frequent contact with instructors, and/or that more frequent and satisfying interactions with faculty shore up student motivation. At the very least, this underscores the important role(s) that faculty may play in reinforcing students’ interests in engineering, and our need to better understand and capitalize on these roles. We note the relatively modest role that mentor motivation appears to play in students’ reasons for pursuing engineering studies. There is much discussion of mentoring in the sciences and engineering, particularly as mentoring relates to building a more diverse base of talent in the U.S., and providing students with sustained advice, encouragement, and connections to succeed in a complex and competitive engineering workforce. It may be that mentors act indirectly, helping students to see how engineering meets certain social ends, or is simply fun to do—mentors as a “top reason” per se would not, in this case, be expected. It also might be that many students do not find mentors in engineering, particularly early on, given the more central focus

Exploring the Engineering Student Experience 49
on math and science skills in K-12 curricula. Clearly, the role of mentoring in developing students’ passion for engineering demands continued study. Motivational differences between women and men We do see that behavioral intrinsic motivation is greater among men, whereas mentor motivation is greater among women. In addition, for women, intrinsic psychological and behavioral motivation and social good motivation are of comparable strengths, whereas for men there is a measurable difference in the rank order of motivations: intrinsic behavioral followed by intrinsic psychological, followed by social good. Motivation and persistence in engineering Among first-year students, their intention to complete an engineering major is correlated with their level of intrinsic psychological motivation. This suggests that students who are “jazzed” about engineering because of the inherent enjoyment of the work may be more likely to persist in the major. However, intrinsic psychological motivation is only one dimension of the “persistence” puzzle; other motivational factors in combination with intrinsic psychological motivation may play key roles, not to mention the individual’s ability to overcome barriers and take advantage of the supports that occur along their academic pathway. What explains—and strengthens—the link between liking something and seeing it all the way through to the degree? What factors are “behind” this correlation, and how can we use them to improve educational practice and retention? Our findings also suggest that various types of motivation could be at least partially developed prior to matriculating college. Certainly college has a role in bolstering motivation—faculty, out-of-the-classroom experiences, and teaching strategies are all “tools” for shoring up motivation. However, to continue to draw students to engineering, we need to consider how to foster excitement about engineering even earlier. This will not be easy. How do we get K-12 students intrinsically interested in the types of problems that engineers work on, and excited about the thinking strategies and working approaches used by engineers?

Exploring the Engineering Student Experience 50
Chapter 7: How do students learn about engineering?
We looked at students’ perceived knowledge about engineering, taking into consideration what they report knowing about engineering and what they think are important skills to carry out engineering work. We also addressed their sources for learning about engineering, casting the net widely to include not only school-related activities but also professional and personal contacts.
7.1 Seniors’ Knowledge About Engineering
Table 7.1 Knowledge About Engineering Among Seniors by Gender
Senior Women (SrW) n=326
Senior Men (SrM) n=795
Significant Difference?
Knowledge of Engineering Before College [1] 40.3 43.0 ns Self-Reported Gains in Knowledge of Engineering Since Entering College [1]
82.0 83.0 ns
Mean number of Sources of Knowledge 2.30 2.28 ns [1] Item was originally measured on a scale of 0-3, where 0=no knowledge and 3=extensive knowledge;
for the purposes of reporting, scale was normalized and converted to 0-100 ***p<.001, **p<.01, *p<.05, ns=not significant
Table 7.2 Sources of Engineering Knowledge Among Seniors by Gender and Source Type
Senior Women
(SrW) Senior Men
(SrM) Significant Difference?
Percentage who marked source of engineering knowledge coming from:
Work (co-op, internship, employment) 74.2 73.2 ns Personal contacts 48.5 43.5 ns School-related experiences 61.0 59.6 ns Other source 7.1 6.4 ns
***p<.001, **p<.01, *p<.05, ns=not significant Seniors report that their understanding of engineering work has increased in college, moving from “limited” knowledge at the beginning to well above “moderate” knowledge by their fourth or fifth year (Table 7.1). When asked, “How did you gain your knowledge about the engineering profession?” and given a choice of seven1 possible “knowledge sources,” women marked, on average, 2.30 sources, and men, 2.28. Thus, students attribute gains in understanding to multiple experiences and contexts. These seven sources were then collapsed into three categories of work-related experiences (visitor, intern, co-op, employee), personal contacts (family member, close friend), and school-related experience to reflect learning that may happen inside and outside of the formal educational setting. Seniors most often cite work-related experiences as a co-op student, intern,
1 The seven options were: “from being a visitor”; “from being a co-op student or intern”; “from being an employee”; “from a family member”; “from a close friend”; “from school-related experiences”; and “other (specify).”

Exploring the Engineering Student Experience 51
or employee in an engineering firm (Table 7.2). School-related experiences are frequently cited as well. And nearly half of women and men report that personal contacts such as friends and family are sources of engineering knowledge. Students also had the option of specifying “other” as a source of engineering knowledge. The “other” category included such sources as guest speakers, high school magnet school, organizations (Boy Scouts, Society of Women Engineers, Engineers Without Borders), conferences, competitions and activities (FIRST Robotics (For Inspiration and Recognition of Science and Technology), Formula SAE (Society of Automotive Engineers), amateur radio), Institute for P-12 Engineering Research and Learning (INSPIRE), military, and various media (books, television such as the Discovery Channel, films, magazines, internet).
Correlates of knowledge gain among seniors Self-reported gains in engineering knowledge since entering college are positively correlated with several educational experience measures, as listed in Table 7.3. For all seniors, knowledge gain is correlated with exposure to co-op, internship and/or employment experiences. For senior women, knowledge gains are correlated with their knowledge of engineering before matriculating college. For senior men, we see knowledge gains correlated with such experience measures as research experience and extracurricular involvement (in both engineering and non-engineering activities). The coefficients for women on these measures are smaller (in some cases, considerably so) and do not reach statistical significance. Table 7.3 Simple Correlation Coefficients: Knowledge about Engineering and Select Academic Experiences Among Senior Women and Men
***p<.001, **p<.01, *p<.05
Women Men1. Knowledge of Engineering Before College .221*** .0692. Source of Engineering Knowledge: Work-related experiences .167** .218***3. Exposure to Engineering Profession .330*** .339***4. Source of Engineering Knowledge: School-related experiences .069 .135***5. Total Number of Knowledge Sources .153** .247***6. Frequency of Interaction with Instructors .140* .169***7. Satisfaction with Instructors .126* .244***8. Frequency of Engineering Extracurricular Participation .091 .142***9. Frequency of Non-engineering Extracurricular Participation .093 .170***10. Research Experience .040 .174***11. Exposure to Project-Based Learning: Team Projects .090 .096**
Self-reported Gains in Knowledge of Engineering
Since Entering College
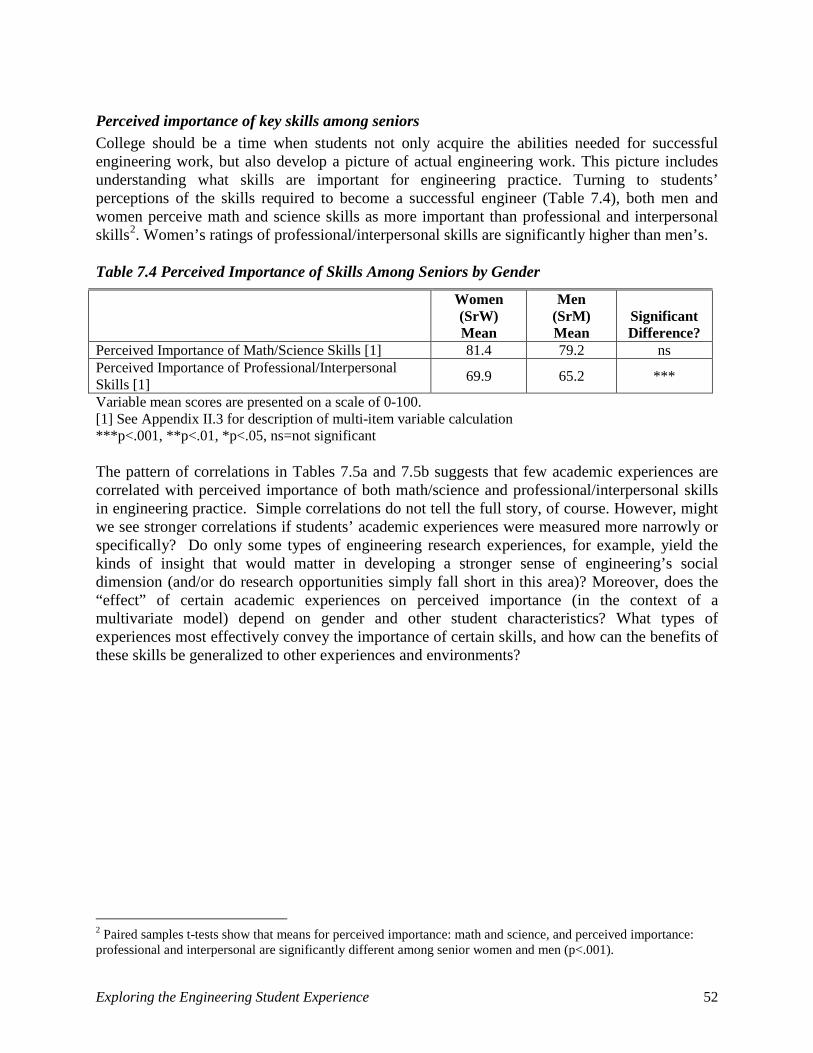
Exploring the Engineering Student Experience 52
Perceived importance of key skills among seniors College should be a time when students not only acquire the abilities needed for successful engineering work, but also develop a picture of actual engineering work. This picture includes understanding what skills are important for engineering practice. Turning to students’ perceptions of the skills required to become a successful engineer (Table 7.4), both men and women perceive math and science skills as more important than professional and interpersonal skills2. Women’s ratings of professional/interpersonal skills are significantly higher than men’s. Table 7.4 Perceived Importance of Skills Among Seniors by Gender
Women (SrW) Mean
Men (SrM) Mean
Significant Difference?
Perceived Importance of Math/Science Skills [1] 81.4 79.2 ns Perceived Importance of Professional/Interpersonal Skills [1] 69.9 65.2 ***
Variable mean scores are presented on a scale of 0-100. [1] See Appendix II.3 for description of multi-item variable calculation ***p<.001, **p<.01, *p<.05, ns=not significant The pattern of correlations in Tables 7.5a and 7.5b suggests that few academic experiences are correlated with perceived importance of both math/science and professional/interpersonal skills in engineering practice. Simple correlations do not tell the full story, of course. However, might we see stronger correlations if students’ academic experiences were measured more narrowly or specifically? Do only some types of engineering research experiences, for example, yield the kinds of insight that would matter in developing a stronger sense of engineering’s social dimension (and/or do research opportunities simply fall short in this area)? Moreover, does the “effect” of certain academic experiences on perceived importance (in the context of a multivariate model) depend on gender and other student characteristics? What types of experiences most effectively convey the importance of certain skills, and how can the benefits of these skills be generalized to other experiences and environments?
2 Paired samples t-tests show that means for perceived importance: math and science, and perceived importance: professional and interpersonal are significantly different among senior women and men (p<.001).

Exploring the Engineering Student Experience 53
Table 7.5a Simple Correlation Coefficients: Perceived Importance of Professional/Interpersonal Skills and Select Academic Experiences Among Senior Women and Men
***p<.001, **p<.01, *p<.05 Table 7.5b Simple Correlation Coefficients: Perceived Importance of Math/Science Skills and Select Academic Experiences Among Senior Women and Men
***p<.001, **p<.01, *p<.05
Women (SrW)
Men (SrM)
1. Self-reported Gains in Knowledge of Engineering Since Entering College
.171** .105**
2. Knowledge of Engineering Before College .028 .0353. Source of Engineering Knowledge: Work-related experiences .051 .0384. Exposure to Engineering Profession .121* .0665. Source of Enginering Knowledge: School-related experiences .012 -.0356. Total Number of Knowledge Sources .065 -.0157. Frequency of Interaction with Instructors .164** .174***8. Satisfaction with Instructors .026 .129***9. Frequency of Engineering Extracurricular Participation .051 .173***10. Frequency of Non-engineering Extracurricular Participation .035 .03511. Research Experience -.031 .06212. Exposure to Project-Based Learning: Team-based Projects .135* .135***
Perceived Importance of Professional/Interpersonal
Skills to Engineering
Women (SrW)
Men (SrM)
1. Self-reported Gains in Knowledge of Engineering Since Entering College
-.005 .069
2. Knowledge of Engineering Before College -.087 .0513. Source of Engineering Knowledge: Work-related experiences -.074 -.094**4. Exposure to Engineering Profession -.051 -.098**5. Source of Enginering Knowledge: School-related experiences .064 .0706. Total Number of Knowledge Sources .008 -.0337. Frequency of Interaction with Instructors -.033 .0568. Satisfaction with Instructors -.107 .144***9. Frequency of Engineering Extracurricular Participation -.017 .00510. Frequency of Non-engineering Extracurricular Participation .049 -.03611. Research Experience .006 -.01312. Exposure toProject-Based Learning: Team-based Projects -.035 .019
Perceived Importance of Professional/Interpersonal
Skills

Exploring the Engineering Student Experience 54
7.2 Knowledge—Seniors and First-Year Students First-year students and seniors differ in their sources of knowledge about engineering. As presented in Table 7.6, first-year students more frequently cite personal relationships and contacts, whereas seniors more frequently refer to work experiences. Overall, first-year students and seniors are equally likely to indicate school-related experiences as a source of knowledge. However, once the data are disaggregated by gender, first-year women are more likely than senior women to report that school experiences have helped them gain an understanding of engineering (p<.01). On average, seniors have more sources of knowledge than do first-year students (2.28 for seniors, 1.96 for first-year students, p<.001).
Table 7.6: Sources of Engineering Knowledge Among First-Years and Seniors by Source Type First-Year
Students (FY)
n=869 Seniors (Sr)
n=1130 Significant Difference? Percentage who marked knowledge of engineering coming from:
Work (co-op, internship, employment)
37.4 73.5 *** overall (*** W, ***M)
Personal contacts 59.1 45.0 *** overall (*W, *** M) School-related experiences 63.4 59.7 ns overall (** W, ns M) Other source 9.4 6.6 * overall (ns W, ns M)
***p<.001, **p<.01, *p<.05, ns=not significant
First-year students rate their gains in engineering knowledge since entering college as “moderate” (See Table 7.7). Seniors report greater gains than do first-year students. By contrast, first-year students’ self-rated knowledge prior to college entry is greater than senior’s self-rated knowledge. Perhaps seniors assess their prior levels of knowledge more conservatively after four years of formal education, internships and co-op experiences, and so on.
Table 7.7 Knowledge About Engineering Among First-Years and Seniors
First-year students (FY)
Mean
Seniors (Sr)
Mean Significant Difference? Knowledge of Engineering Before College [1] 48.7 42.3 *** overall (**W, ***M)
Self-Reported Gains in Knowledge of Engineering Since Entering College [1] 66.7 82.7 *** overall (***W, ***M)
[1] Item was originally measured on a scale of 0-3, where 0=no knowledge and 3=extensive knowledge; for the purposes of reporting, scale was normalized and converted to 0-100
***p<.001, **p<.01, *p<.05, ns=not significant

Exploring the Engineering Student Experience 55
Correlates of knowledge gain among first-year students Like seniors, exposure to the engineering profession through co-ops and internships is positively correlated with gains in engineering knowledge for both first-year women and men (Table 7.8). The pattern of correlations in Tables 7.8 (first-years) and 7.2 (seniors) is different in that knowledge gain is correlated with exposure to team-based project work for both first-year women and men, but less so for senior women and men. Why might team-based project work be more salient for first-years than seniors in terms of “getting a handle” on engineering? How are students’ perceptions of team-based project work influenced by their involvement in extra-curricular or work-related team-based projects? We note that for first-year and senior women, self-reported knowledge before entering college is positively associated with knowledge gains since entering college; this is also true of first-year men. The relationship among senior men is weaker. Table 7.8 Simple Correlation Coefficients: Knowledge about Engineering and Select Academic Experiences Among First-Year Women and Men
***p<.001, **p<.01, *p<.05
Perceived importance of key skills among first-year students First-year students perceive math and science as being more important to engineering than do seniors (see Table 7.9). This may reflect the strong connections made among math, science, and engineering in high school academic and career advising, and the possibility that this connection diminishes somewhat by a student’s senior year, when the engineering student can more accurately recognize that math and science represent only one part of the engineer’s “tool kit”. First-year students ascribe slightly more importance to professional and interpersonal skills than do seniors. We had expected that seniors would place greater importance on professional and interpersonal skills than would first-year students, given seniors’ greater exposure to the work-
Women (n=311)
Men (n=557)
1. Knowledge of Engineering Before College .185** .276***2. Source of Engineering Knowledge: Work-related experiences .040 .142**3. Exposure to Engineering Profession .221*** .234***4. Source of Engineering Knowledge: School-related experiences .158** .118**5. Total Number of Knowledge Sources .110 .194***6. Frequency of Interaction with Instructors .040 .218***7. Satisfaction with Instructors .192** .235***8. Frequency of Engineering Extracurricular Participation .158** .243***9. Frequency of Non-engineering Extracurricular Participation .067 .05210. Research Experience .101 .166***11. Exposure to Project-Based Learning: Team Projects .270*** .250***
Self-reported Gains in Knowledge of
Engineering Since Entering College

Exploring the Engineering Student Experience 56
world through co-ops, internships and employment, as well as the academy’s increased emphasis on these types of skills (ABET, 2010), but this was not the case. This finding is consistent with results from the longitudinal PIE survey, where the professional and interpersonal skills were not viewed as more important by seniors than when those same students were first-year students (Eris, 2010).
Table 7.9 Perceived Importance of Skills Among First-Years and Seniors
First-year students (FY)
Mean
Seniors (Sr)
Mean Significant Difference? Perceived Importance of Math/Science Skills [1] 86.9 79.9 *** overall (***W, ***M)
Perceived Importance of Professional/Interpersonal Skills [1] 68.3 66.5 * overall (ns W, ns M)
Variable mean scores are presented on a scale of 0-100. [1] See Appendix II.3 for description of multi-item variable calculation ***p<.001, **p<.01, *p<.05, ns=not significant
7.3 Findings: How Students Learn About Engineering
First-years vs. seniors Thankfully, the seniors report greater gains in knowledge since entering college than do first-years. When asked about knowledge of engineering prior to college, seniors report lower levels than do first-year students. Perhaps seniors have a different sense of where they started given the extensive gains they have made over time. Students attribute their gains in engineering knowledge to a number of sources, and seniors cite more sources than do first-years. Seniors, more so than first-years, report this knowledge as coming from co-op and internship experiences. Approximately 60 percent of first-year and senior students cited school-related experiences. Interestingly, for first-year students, team-based project work was correlated with gains in engineering knowledge.
Recognizing what is important in engineering work Seniors perceive math and science skills as being more important in engineering practice than professional and interpersonal skills. This finding is not surprising given the central role that interest and skill in math and science play in recruiting students to engineering in the first place, not to mention their prominent (and front-door) positioning in a typical engineering curriculum. We are heartened that professional and social skills were perceived to be as important as they were. However, when we look at differences between seniors and first-years on perceived importance of math and science skills, we see that seniors rate these skills as being less important than do first-year students. There may be several reasons for this. Because of co-op and internship experience, seniors may see math and science as just one piece of practice, whereas first-years, based on high school counseling, may believe that math and science are more central and represent the “penultimate” skills in engineering. This decreased perception of importance might

Exploring the Engineering Student Experience 57
also reflect a disconnect between school-based math and science and work-practice math and science; seniors may be responding on the survey based on school-based math and science. We also see seniors reporting the importance of professional and interpersonal skills at a level comparable with (if not slightly less than) first-year students. We had expected seniors, with their significantly greater co-op, internship, project-based learning experiences and participation in engineering extracurricular activities, to perceive these skills as more important to engineering work than would first-year students. This was not the case.
Women and men learning about engineering Women and men report similar gains in learning about engineering and cite similar sources for these gains. One noteworthy gender difference: senior women report professional and interpersonal skills as being more important than do men. Why is this, and with what consequence?

Exploring the Engineering Student Experience 58
Part III. An Overlay of URM Status on the Engineering Student Experience
African Americans, Latinas/os, American Indians and Alaska Natives, and Native Hawaiians and Pacific Islanders are underrepresented in the U.S. engineering student population, in spite of many years of research and national investment to move towards equitable representation (Chubin, et al., 2008). Research also shows that students from underrepresented racial/ethnic backgrounds who enter science, technology, engineering and mathematics (STEM) majors do not persist through these majors at the same rate as do their non-underrepresented peers (Chang, et al., 2010; Higher Education Research Institute, 2010a; Huang, Taddese, & Walter, 2000). It is important to identify what is happening at the level of the student experience that contributes to these patterns, and develop policies to better support women and men engineers from a broader range of backgrounds. Engineering as an inclusive and diverse enterprise, representative of the communities it serves, is integral to technological innovation and effectuating positive social change. An engineering workforce built on and around diverse talent and backgrounds will be essential for the increasingly global scale of scientific collaborations as well. Chapter 8 summarizes the analyses of our major APPLES variables by gender and underrepresented racial/ethnic minority (URM) status. We consider how motivation to study engineering, knowledge about engineering, and engineering learning experiences vary for diverse student groups. In Chapter 9, we consider the socioeconomic background of APPLES URM and non-URM students. Socioeconomic status (SES) is a measure of an individual’s or family’s relative economic and social ranking (Hearn, 1988; U.S. Department of Education, 2008). While the impact of SES relative to students’ higher educational outcomes has been well documented, there has been little examination (to our knowledge) of the role of SES in the undergraduate engineering experience (Donaldson et al., 2008b, is a noteworthy exception). In Chapter 4, we highlighted gender similarities and differences on key SES indicators. In Chapter 9, we ask: To what extent can socioeconomic factors help to explain patterns and trends in our data when we explore educational experiences by gender, academic standing, and race/ethnicity?


Exploring the Engineering Student Experience 59
Chapter 8: Do engineering students’ motivations and college experiences vary by URM status?
8.1 Sample Sizes and Presentation of Data As noted in Chapter 4 (Table 4.1), underrepresented racial/ethnic minority (URM) students comprise about 19 percent of our sample of engineering majors. This translates into 61 URM women and 89 URM men among first-year students, and 75 URM women and 122 URM men among seniors. These are relatively small sample sizes, especially for URM women. Table 8.1 lists the sample sizes for both URM and non-URM students. Table 8.1 First-Year and Senior Sample Sizes by Gender and URM Status
First-Years Seniors URM Non-URM URM Non-URM Women 61 226 75 233 Men 89 416 122 594
The data that support the discussion of URM status as related to students’ college experiences, motivation to study engineering, and knowledge about engineering are found in Tables 8.2- 8.4. The variables addressed in each table include:
The College Experience: (Table 8.2) Frequency of Interaction with Instructors Satisfaction with Instructors Academic Involvement (Engineering Courses) Academic Involvement (Liberal Arts Courses) Frequency of Engineering Extracurricular Participation Frequency of Non-engineering Extracurricular Participation Exposure to Engineering Profession Research Experience GPA Index Curriculum Overload Pressure to Balance Social and Academic Lives Overall Satisfaction with Collegiate Experience
Motivation to Study Engineering: (Table 8.3) Intrinsic Psychological Motivation Intrinsic Behavioral Motivation Social Good Motivation Financial Motivation Mentor Influence Motivation Parental Influence Motivation
Knowledge of Engineering: (Table 8.4) Knowledge of Engineering Gains Knowledge from School Knowledge from Co-op, Internship, Work Knowledge from People

Exploring the Engineering Student Experience 60
Number of Sources of Knowledge Perceived Importance of Professional & Interpersonal Skills Perceived Importance of Math & Science Skills
For this report, we focus on the similarities and differences between URM and non-URM students within each gender, rather than gender similarities and differences among URM students and among non-URM students. That is, each table summarizes data for non-URM and URM women, and then for non-URM and URM men. In addition, each table indicates whether the mean scores or percentages are significantly different based on academic standing (e.g., first-year versus senior URM women, as read across a row), and URM status (e.g., first year non-URM men versus first-year URM men, as read down a column). Using women’s satisfaction with instructors (Table 8.2) as an example of how to read these tables, we see that senior women are less satisfied with their instructors than their first-year counterparts, and that the difference is more pronounced for URM women (71.0FY, 58.7Sr, URM***), than for non-URM (NU) women (71.3FY, 65.1Sr, NU**). At the same time, the difference in satisfaction between non-URM and URM first-year women is not significant (71.3NU, 71.0URM, ns), whereas weak significance is reached among seniors (65.1NU, 58.7URM*).

Exploring the Engineering Student Experience 61
Table 8.2 Mean Scores on College Experience Variables by Academic Standing, URM Status, and Gender
***p<.001 **p<.01 *p<.05 ns=not significant
Frequency of Interaction with Instructors First-Years Seniors First-Years Seniors
(mean, 0-100) Women ns ns Men * nsnon-URM 35.7 45.2 *** non-URM 34.2 43.1 ***URM 38.9 49.1 * URM 39.9 46.2 *
Satisfaction with Instructors First-Years Seniors First-Years Seniors(mean, 0-100) Women ns * Men ns ns
non-URM 71.3 65.1 ** non-URM 72.5 63.6 ***URM 71.0 58.7 *** URM 74.4 67.3 *
Academic Involvement (Engr Courses) First-Years Seniors First-Years Seniors
(mean, 0-100) Women ns ns Men ns nsnon-URM 77.3 64.4 *** non-URM 76.4 66.3 ***URM 80.1 66.1 *** URM 77.0 66.0 ***
Academic Involvement (Liberal Arts Courses) First-Years Seniors First-Years Seniors
(mean, 0-100) Women ns ns Men ns nsnon-URM 76.6 63.5 ** non-URM 72.5 61.0 ***URM 72.2 60.8 *** URM 69.6 58.5 **
Frequency of Engr. Extracurricular Participation First-Years Seniors First-Years Seniors
(mean, 0-100) Women ns ns Men ** **non-URM 35.0 49.7 *** non-URM 24.0 34.7 ***URM 39.3 53.0 * URM 34.3 44.0 *
Frequency of Non-Engr. Extracurricular Participation First-Years Seniors First-Years Seniors
(mean, 0-100) Women ns * Men ns *
non-URM 76.7 79.7 ns non-URM 69.0 72.3 nsURM 74.3 72.0 ns URM 66.0 66.0 ns
Exposure to Engr. Profession First-Years Seniors First-Years Seniors
(mean, 0-100) Women ns ns Men ns nsnon-URM 31.3 68.7 *** non-URM 34.7 68.0 ***URM 39.0 72.0 *** URM 39.7 63.0 ***
Research Experience First-Years Seniors First-Years Seniors(percent) Women * ns Men ** ns
non-URM 13.0 54.8 *** non-URM 21.4 45.3 ***URM 26.7 54.7 *** URM 37.1 48.4 ***
GPA Index First-Years Seniors First-Years Seniors(mean, 0-100) Women ns *** Men *** ns
non-URM 70.7 71.0 ns non-URM 72.4 68.9 **URM 65.0 57.7 ns URM 61.5 65.3 ns
Curriculum Overload First-Years Seniors First-Years Seniors(mean, 0-100) Women ns ns Men ns ns
non-URM 57.5 57.5 ns non-URM 50.1 52.6 *URM 54.7 56.9 ns URM 47.3 49.1 ns
Pressure to Balance Social and Academic Lives First-Years Seniors First-Years Seniors
(mean, 0-100) Women ns ns Men ns nsnon-URM 48.8 53.8 * non-URM 43.0 48.6 ***URM 46.8 52.0 ns URM 44.0 44.6 ns
Overall Satisfaction with Collegiate Experience First-Years Seniors First-Years Seniors
(mean, 0-100) Women *** * Men ns nsnon-URM 82.0 74.7 *** non-URM 78.3 70.7 ***URM 69.0 68.0 ns URM 75.3 72.0 ns
(a) Women (b) Men
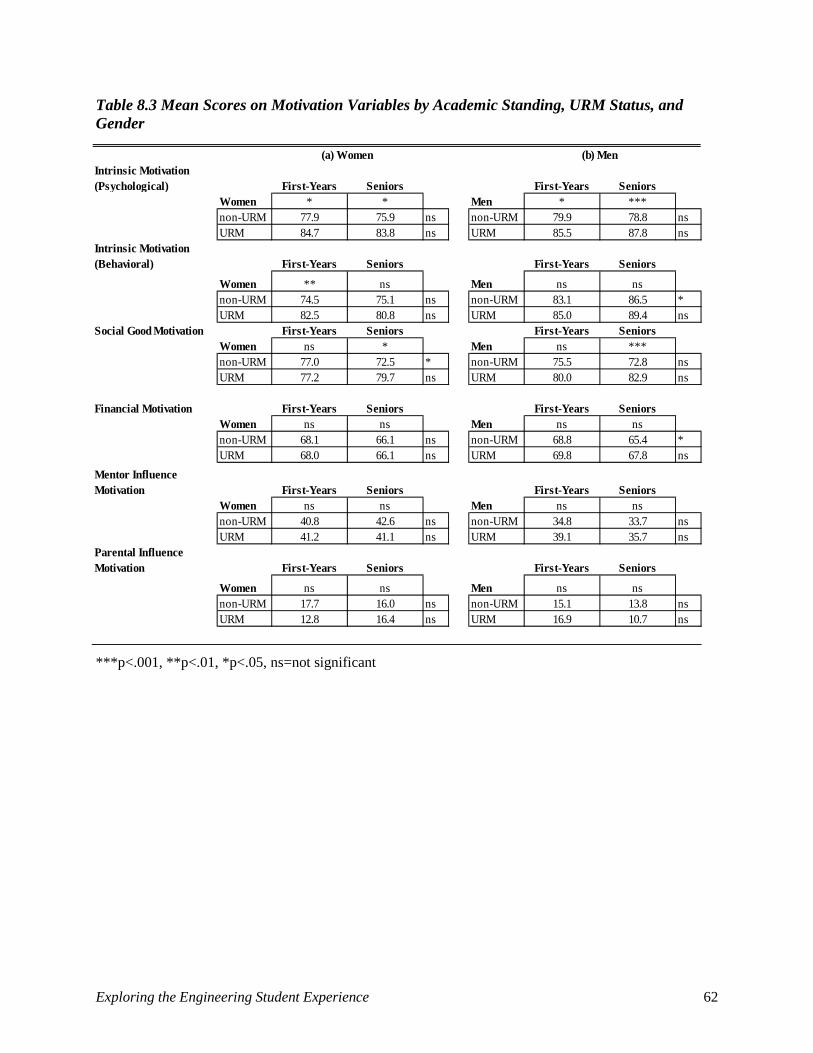
Exploring the Engineering Student Experience 62
Table 8.3 Mean Scores on Motivation Variables by Academic Standing, URM Status, and Gender
***p<.001, **p<.01, *p<.05, ns=not significant
Intrinsic Motivation (Psychological) First-Years Seniors First-Years Seniors
Women * * Men * ***non-URM 77.9 75.9 ns non-URM 79.9 78.8 nsURM 84.7 83.8 ns URM 85.5 87.8 ns
Intrinsic Motivation (Behavioral) First-Years Seniors First-Years Seniors
Women ** ns Men ns nsnon-URM 74.5 75.1 ns non-URM 83.1 86.5 *URM 82.5 80.8 ns URM 85.0 89.4 ns
Social Good Motivation First-Years Seniors First-Years SeniorsWomen ns * Men ns ***non-URM 77.0 72.5 * non-URM 75.5 72.8 nsURM 77.2 79.7 ns URM 80.0 82.9 ns
Financial Motivation First-Years Seniors First-Years SeniorsWomen ns ns Men ns nsnon-URM 68.1 66.1 ns non-URM 68.8 65.4 *URM 68.0 66.1 ns URM 69.8 67.8 ns
Mentor Influence Motivation First-Years Seniors First-Years Seniors
Women ns ns Men ns nsnon-URM 40.8 42.6 ns non-URM 34.8 33.7 nsURM 41.2 41.1 ns URM 39.1 35.7 ns
Parental Influence Motivation First-Years Seniors First-Years Seniors
Women ns ns Men ns nsnon-URM 17.7 16.0 ns non-URM 15.1 13.8 nsURM 12.8 16.4 ns URM 16.9 10.7 ns
(a) Women (b) Men

Exploring the Engineering Student Experience
63
Table 8.4 Knowledge Variables by Academic Standing, URM Status, and Gender
***p<.001, **p<.01, *p<.05, ns=not significant
Knowledge of Engineering Gains First-Years Seniors First-Years Seniors
(mean, 0-100) Women ns ns Men * **non-URM 64.7 81.7 *** non-URM 65.7 82.0URM 69.0 84.3 *** URM 72.0 87.7
Knowledge Source: School First-Years Seniors First-Years Seniors
(percent) Women ns ns Men ns nsnon-URM 73.9 63.5 * non-URM 59.4 57.4URM 63.9 52.0 ns URM 58.4 63.1
Knowledge Source: Co-op, Internship, Work First-Years Seniors First-Years Seniors
(percent) Women * ns Men ns nsnon-URM 41.6 75.1 *** non-URM 37.5 74.1URM 26.2 76.0 *** URM 36.0 66.4
Knowledge Source: people First-Years Seniors First-Years Seniors
(percent) Women ns ns Men ns nsnon-URM 61.1 49.4 * non-URM 58.7 44.3URM 47.5 44.0 ns URM 61.8 37.7
No. of Sources of Knowledge First-Years Seniors First-Years Seniors
Women ** ns Men ns nsnon-URM 2.1 2.4 ns non-URM 1.9 2.3URM 1.7 2.2 * URM 1.9 2.2
Perceived Importance of Professional & Interpersonal Skills First-Years Seniors First-Years Seniors
(mean, 0-100) Women ns *** Men *** ***non-URM 69.5 67.2 ns non-URM 65.0 63.9URM 73.9 78.7 ns URM 75.2 72.4
Perceived Importance of Math & Science Skills First-Years Seniors First-Years Seniors
(mean, 0-100) Women ns ns Men ns *non-URM 87.0 80.2 *** non-URM 86.1 78.7URM 90.2 84.6 ns URM 87.4 82.5
(a) Women (b) Men

Exploring the Engineering Student Experience
64
8.2 Critical Takeaways The results in Tables 8.2 through 8.4 indicate that many aspects of the engineering student experience are the same for URM and non-URM women and men1. Seniors, regardless of URM status, report more frequent interaction with instructors and more participation in engineering extracurricular activities than do first-years. At the same time, seniors are less satisfied with instructors and less academically involved in both their engineering and non-engineering coursework. We also see no significant differences between URM and non-URM seniors with respect to reported participation in engineering co-op and internship experiences/opportunities, and their sources for learning about engineering through co-ops and internships, school experiences, and personal and professional contacts (in that order). There are at least four additional critical takeaways from these data, particularly as related to thinking about the engineering student pipeline, and the importance of recruiting and retaining a diverse group of students. They are: 1. GPA Index (see Table 8.2): GPAs among first-year URM and non-URM women are not
significantly different; however, the gap widens and reaches significance among seniors. For men, the opposite is true: a significant GPA difference in the first year narrows and loses significance among seniors.
2. Perceived Importance of Professional and Interpersonal Skills (see Table 8.4): As seniors,
both URM women and men ascribe more importance to professional and interpersonal skills than do non-URM women and men. This perception gap also exists between first-year URM and non-URM men, but not between first-year URM and non-URM women.
3. Intrinsic Psychological Motivation (see Table 8.3): Senior URM men are more
psychologically motivated to study engineering than are senior non-URM men. Differences among first-year men are smaller. Among women, there is a gap in the same direction at both the first-year and senior levels.
4. Extracurricular Involvement (see Table 8.2): There are mostly similar levels of involvement
in engineering (and non-engineering) extracurricular activities for URM and non-URM women, both as first-years and as seniors. In contrast, URM men are consistently more involved in engineering extracurricular activities than are non-URM men.
In the upcoming chapters on college outcomes (Chapter 10 on Confidence and Chapter 11 on Post-Graduation Plans) some of these variables become predictors of outcomes. The extent to which college experiences and motivation vary (or not) by both gender and race/ethnicity will contribute to a more refined understanding of what really matters in engineering student success.
1 Though the statistical significance of these differences can vary, the URM sample sizes are very small, and we consider magnitude and direction of difference in all groups when thinking about overall trends.

Exploring the Engineering Student Experience
65
8.3 Findings: How URM Status Differentiates the Experience In this chapter we have identified the ways in which the college experience appears to be independent of URM status—for example, frequency of interaction with instructors and involvement in engineering experiences such as internships. At the same time, there are several potentially important measures on which experiences are different by URM status and gender, namely, the GPAs of senior women, and types of extracurricular involvement and level of psychological motivation among men. It also is interesting to note that several gender differences discussed in earlier chapters are evident among URM and non-URM students alike—although these findings are not the focus of our current analyses, they are worthy of reflection when thinking about the engineering experience in its totality.


Exploring the Engineering Student Experience 66
Chapter 9: Do family and socioeconomic characteristics vary by URM status?
9.1 SES-Related Demographics The findings in the preceding chapter suggest that there is a fair amount of consonance in experience among our APPLES engineering majors, regardless of underrepresented racial/ethnic minority (URM) status and gender. However, some differences stand out, namely those related to GPA, motivation, perceptions, and extracurricular involvement.
In order to learn more about why undergraduate engineering experiences may vary by both gender and race/ethnicity, particularly in light of national data on differential persistence and degree attainment rates, the next stage of our analyses considers if and how socioeconomic status (SES) has an impact. For these analyses, we examined three factors that are indicators of SES: perceived family income, being a first generation college student, and parents’ highest level of education. These SES-related demographics by academic standing (first-year or senior), URM status, and gender are presented in Table 9.1. The statistical significance of URM versus non-URM differences by gender is summarized in Table 9.2. Tables 9.1 and 9.2 highlight several key results:
1. Perceived Family Income: Across both cohorts, URM students’ perceived family income is significantly lower than that of non-URM students. Specifically, URM students report their family’s income level as being below “middle income,” whereas non-URM students report their family’s income level as being above “middle income.” (See Appendix 1.1 for the response options to this survey item.)
2. Women and First-Generation College Student Status: Differences between non-URM and URM women in terms of first-generation status are not statistically significant. The proportion of women whose mothers earned a bachelor’s degree or higher exceeds 50 percent for all groups. Larger differences exist in the degree attainment of fathers, particularly among first-years. Forty-two percent of first-year URM women report that their father earned a bachelor’s degree or higher, versus 72 percent of first-year non-URM women.
3. Men and First-Generation College Student Status: Unlike women, first-generation status differs significantly between URM and non-URM men; one in three URM men are first-generation college attendees, while for non-URM men the ratio is closer to one in five. Fewer URM men, both at the first-year and senior levels, report having parents (mother and/or father) who have a bachelor’s degree or higher.
4. Concern about Financing College: Roughly comparable proportions of students are concerned about their ability to finance their college education, especially at the senior level. This finding likely reflects a combination of factors and is not solely dependent on a family’s socioeconomic status (e.g., securing and paying off student loans, finding employment during college, etc.). The high percentage of students reporting “major” or “extreme” concerns about financing college is troubling.

Exploring the Engineering Student Experience 67
Table 9.1a Demographic Profile of First-Year Engineering Majors by URM Status
Women URM (n=61)
Women -Non-URM
(n=226)
Sig. non-URM vs.
URM difference:
W
URM Men
(n=89)
Non-URM Men
(n=416)
Sig. non-URM vs.
URM difference:
MFamily/SES Characteristics
Perceived family income (mean) 1.87 2.35 ** 1.66 2.23 ***
First-generation college student (percent saying Yes) 23.0 12.9 ns 34.1 15.2 ***
Mother's education (percent, distribution) * **
High school or less 29.3 13.4 34.1 18.9More than high school, less than a bachelor's degree 13.8 16.5 25.9 25.1Bachelor's degree 36.2 40.6 27.1 31.3Master's degree or higher 20.7 29.5 12.9 24.8
Percent reporting mother with Bachelor's or higher: 56.9 70.1 40.0 56.1
Father's education (percent, distribution) *** **
High school or less 38.2 12.2 32.5 16.8More than high school, less than a bachelor's degree 20.0 15.8 25.0 18.8Bachelor's degree 10.9 36.9 26.3 34.5Master's degree or higher 30.9 35.1 16.3 30.0
Percent reporting father with Bachelor's or higher: 41.8 72.0 42.6 64.5
Financial concerns (percent who report major/extreme concern) 39.3 34.1 ns 41.4 28.0 *
First-Years
*p<.05, **p<.01, ***p<.001, ns=not significant

Exploring the Engineering Student Experience 68
Table 9.1b Demographic Profile of Senior Engineering Majors by URM Status
URM Women (n=75)
Non-URM
Women (n=233)
Sig. non-URM vs.
URM difference
: W
URM Men
(n=122)
Non-URM Men
(n=594)
Sig. non-URM vs.
URM difference:
MFamily/SES Characteristics
Perceived family income (mean) 1.68 2.23 *** 1.52 2.14 ***
First-generation college student (percent saying Yes) 25.3 16.7 ns 36.1 19.7 ***
Mother's education (percent, distribution) ns ***
High school or less 16.4 21.1 39.7 23.3More than high school, less than a bachelor's degree 30.1 22.0 29.3 25.7Bachelor's degree 31.5 27.6 20.7 34.3Master's degree or higher 21.9 29.3 10.3 16.6
Percent reporting mother with Bachelor's or higher: 53.4 56.9 31.0 50.9
Father's education (percent, distribution) * ***
High school or less 25.4 14.7 34.2 16.4More than high school, less than a bachelor's degree 22.4 16.4 22.8 23.0Bachelor's degree 32.8 32.0 33.3 33.5Master's degree or higher 19.4 36.9 9.6 27.1
Percent reporting father with Bachelor's or higher: 52.2 68.9 42.9 60.6
Financial concerns (percent who report major/extreme concern) 46.7 36.4 ns 45.5 39.8 ns
Seniors
*p<.05, **p<.01, ***p<.001, ns=not significant

Exploring the Engineering Student Experience 69
Table 9.2 Statistical Significance of SES Differences by URM Status Among First-Year and Senior Women and Men
First-Year
Women Senior
Women First-Year
Men Senior Men Perceived family income (mean) ** *** *** *** First-generation college student ns ns *** ***
Mother's education * ns ** *** Father's education *** * ** *** Financial concerns (percent who report major/extreme concern)
ns ns * ns
*p<.05, **p<.01, ***p<.001, ns=not significant
9.2 Findings: Family and Socioeconomic Backgrounds of URM Students Compared to Non-URM Students
URM status, gender, and SES are interrelated SES-related differences by URM status and gender are noteworthy. The difference between URM and non-URM women is manifested in perceived family income and father’s education. The difference between URM and non-URM men is manifested in perceived family income and in both parents’ educational backgrounds. Students in all groups, however, have concerns about financing their college education. Given such variation in our SES indicators, we need to carefully interpret differences in the college experience by URM status. Such differences may partly reflect differences in family income and/or education level, as well as the resources associated with socioeconomic status. To what extent, for instance, does SES affect GPA differences, especially among senior women? How might a lower-SES background strengthen students’ intrinsic motivation to study engineering? In Chapter 11, we examine students’ plans for their engineering futures and explore how these plans may vary by gender and URM status. Findings from Chapters 8 and 9 will help to illuminate this examination.

Exploring the Engineering Student Experience 70
Part IV. Engineering-Related Outcomes
In this part of the report, we examine the outcomes of a college experience. An engineering educator might consider these outcomes to be mainly the desired abilities of graduating seniors outlined by ABET (2010), such as the abilities to apply knowledge of mathematics, science and engineering; identify, formulate, and solve engineering problems; and function in multi-disciplinary teams. These competencies would fall under what Astin (1993) calls Cognitive Outcomes—knowledge, critical thinking ability, career development, level of educational achievement. In addition to Cognitive Outcomes are Affective Outcomes. Affective Outcomes include self-concept, values, beliefs, drive for achievement, and satisfaction with college, interpersonal relationships, and avocations. Our analysis of APPLES data allows us to explore outcomes in both domains. For Affective Outcomes, we investigate student’s confidence in key engineering skills: open-ended problem-solving; math and science; and professional and interpersonal skills. Our findings on students’ confidence are summarized in Chapter 10. For Cognitive Outcomes, we consider students’ post-graduation plans, specifically whether these plans include engineering or non-engineering jobs, and engineering or non-engineering graduate school. These findings are discussed in Chapter 11. Chapters 10 and 11 each begin by presenting the descriptive statistics on confidence and post-graduation plans, respectively. We analyze data by gender, academic standing, and URM status. We then develop regression models to explore which factors predict these outcomes. Drawing from what we have learned about the factors that are closely related to students’ post-graduation plans, we develop a new framework within which to understand students’ engineering experiences in Chapter 12. We focus on the roles of motivation and confidence in differentiating students’ engineering activities, perceptions, and long-term goals.


Exploring the Engineering Student Experience 71
Chapter 10: How confident are students? What contributes to confidence?
This chapter summarizes our examination of students’ confidence in three areas that are relevant to engineering work: math and science skills, professional and interpersonal skills, and open-ended problem-solving skills. In Section 10.1, we report what we learned about confidence in these skills among APPLES seniors and first-year students. In Section 10.2, we explore predictors of confidence. Lastly in Section 10.3, we summarize what we have learned about students’ confidence through this descriptive and regression work.
10.1 Students’ Confidence in Engineering-related Skills Throughout this chapter, we focus on three multi-item measures of confidence:
• Confidence in Open-ended Problem Solving consists of items on self-assessed critical thinking skills, skill in solving problems with multiple solutions, and strength in creative thinking.
• Confidence in Math and Science Skills includes items on self-assessed ability in math and science, and the ability to apply math and science principles in solving real-world problems.
• Confidence in Professional and Interpersonal Skills consists of items on self-assessed social confidence, and the abilities to lead, engage in public speaking, engage in business, communicate, and perform in teams.
For each skill or ability, students were asked to rate themselves “as compared to your classmates” (with the exception of two items in the open-ended problem solving construct that asked students how much they agreed-disagreed with specific statements). Thus, higher scores on these constructs reflect stronger self-concepts relative to the perceived abilities of peers, or more simply for our analyses, higher levels of confidence. Appendix II.3 lists coding schemes for each item and the reliabilities of the overall measures.
Seniors and confidence Seniors’ scores on all three confidence measures trend towards the top. Put differently, the majority of seniors in our sample rate themselves as “average,” “above average,” or “highest 10%” when asked to compare their skills to those of their classmates. Seniors are most confident in their abilities to solve open-ended problems. They are slightly less confident in their math and science skills, and in their professional and interpersonal skills1 (see Figure 10.1). Notably, senior men are more confident in their open-ended problem solving skills than are senior women. There is a smaller gender difference in self-rated math and science skills and no difference was found between men and women in self-rated professional/interpersonal skills.
1 Paired sample t-tests showed that all three confidence means were significantly different at p<.001 among senior men and women, with one exception: mean math/science confidence and mean professional/interpersonal confidence were not significantly different among women (p>.05).

Exploring the Engineering Student Experience 72
Figure 10.1 Confidence of Senior Women and Men
Variable mean scores presented on a scale of 0-100; Women: n=326; Men: n=795 ***p<.001, **p<.01, *p<.05 These measures of confidence are positively correlated with one another (see Table 10.1), suggesting that students who are confident in one skill set also tend to be confident in other skill sets. Moreover, confidence in math/science skills and confidence in professional/interpersonal skills are positively correlated with the perceived importance of these skills in engineering (Table 10.2). We might speculate that both measures are critical to or “foreshadow” students’ post-graduation plans and pathways; that is, students must have high levels of both skills in order to persist in engineering. However, as we will see in Chapter 11, this is not necessarily the case. Table 10.1 Simple Correlation Coefficients: Confidence Measures Among Senior Women and Men
***p<.001, **p<.01, *p<.05
75.6
70.169.3
79.7***
73.4**
69.4
64
66
68
70
72
74
76
78
80
82
Solving Open-Ended Problems
Math & Science Professional & Interpersonal
Vari
ab
le S
core
Confidence in skills in...
Sr. WSr. M
1. Confidence in Solving Open-ended Problems
2. Confidence in Math & Science Skills
3. Confidence in Professional & Interpersonal Skills
W 1
M 1
W .456 *** 1
M .401 *** 1
W .430 *** .207 *** 1
M .389 *** .134 *** 1
1. Confidence in Solving Open-ended Problems
2. Confidence in Math & Science Skills
3. Confidence in Professional & Interpersonal Skills

Exploring the Engineering Student Experience 73
Table 10.2 Simple Correlation Coefficients: Confidence in and Perceived Importance of Math/Science and Professional/Interpersonal Skills Among Senior Women and Men
***p<.001, **p<.01, *p<.05, ns=not significant Confidence among first-year students and seniors Table 10.3 lists first-year students’ mean scores on all three confidence measures, by gender. As with seniors, first-year students tend to be most confident in their ability to solve open-ended problems, followed by their math/science skills and then professional/interpersonal skills.2 Confidence levels in professional and interpersonal skills are comparable between first-year women and men, with weak differences found in confidence in math and science (p<.01) and open-ended problem solving (p<.05). There is no difference in confidence in math and science skills between first-year students and seniors. Moreover, the gap between women and men in math and science confidence is constant across cohorts. Thus, students’ math and science confidence is essentially static, although the importance they ascribe to math and science is not—recall that on average, seniors ascribe less importance to math and science skills in professional engineering work than do first-year students (see Chapter 7). Seniors are more confident in their professional and interpersonal skills than are first-year students. Still, for both first-years and seniors, students tend to be less confident in these skills as compared to those in other domains, suggesting that we consider whether engineering programs are training “well-rounded” engineers (keeping in mind that student confidence is still “above average”). Senior men are more confident in their open-ended problem-solving skills than are first-year men. However, senior and first-year women have similar levels of confidence in open-ended problem-solving. Perhaps the college experience contributes positively to men’s confidence but has less of an impact on women’s confidence, with the net effect being a wider gender gap among seniors as compared to first-year students.
2 Paired sample t-tests showed that all three confidence means were significantly different at p<.001 among first-year men and women, with one exception: the mean scores for math/science confidence and professional/interpersonal confidence were significantly different among women at p<.01.
Confidence in Math & Science Skills
Confidence in Professional & Interpersonal Skills
W .291 *** .059 ns
M .334 *** .039 ns
W .153 ** .240 ***
M .178 *** .236 ***
Perceived Importance of Math & Science Skills
Perceived Importance of Professional and Interpersonal Skills

Exploring the Engineering Student Experience 74
Table 10.3 Mean Scores on Confidence Measures by Academic Standing and Gender
Senior women: n=326; Senior men: n=795 First-year women: n=311; First-year men: n=557 ***p<.001, **p<.01, *p<.05, ns=not significant Confidence, gender, and URM status Comparisons between underrepresented racial/ethnic minority (URM) and non-URM women and men on our three confidence measures are shown in Table 10.4. Differences between URM and non-URM students in confidence in math and science skills are small and not significant. The findings presented in Chapter 8 show that URM and non-URM students ascribe similar levels of importance to math and science skills. Turning to confidence in open-ended problem-solving, higher levels of confidence among seniors relative to first-year students are evident for all groups except non-URM women. The difference between senior and first-year students in terms of professional/interpersonal confidence is statistically significant for non-URM men (p<.001) and URM women (p<.01). Indeed, the magnitude of this difference is largest for URM women, which serves to both reverse and widen the confidence gap between non-URM and URM women when we compare first-year and senior cohorts. This finding is especially interesting when we consider seniors’ perceptions of the importance of these skills to professional engineering work (see Chapter 8): URM women ascribe the greatest importance to these skills (78.7), followed by URM men (72.4), non-URM women (67.2), and non-URM men (63.9). The overall trend is that URM women, as they near graduation, see the social aspects of engineering as especially important, and see themselves as particularly strong in this area.
Confidence in Solving Open-ended Problems First-Years Seniors
* ***Women 73.9 75.6 nsMen 76.1 79.7 ***
Confidence in Math & Science Skills First-Years Seniors
** **Women 69.8 70.1 nsMen 73.1 73.4 ns
Confidence in Professional & Interpersonal Skills First-Years Seniors
ns nsWomen 66.6 69.3 ***Men 65.9 69.4 ***

Exploring the Engineering Student Experience 75
Table 10.4 Mean Scores on Confidence Measures by Academic Standing, URM Status, and Gender [1]
[1] See Chapter 8 for sample sizes by group. ***p<.001, **p<.01, *p<.05, ns=not significant 10.2 Modeling of Confidence
Introduction to the models As part of a series of regression models primarily designed to explore students’ post-graduation plans and projected career paths (see Chapter 11), we conducted three ordinary least squares regression analyses to explore what student-level characteristics and college experiences help to explain variations in confidence. Among seniors, we focused on confidence in professional and interpersonal skills, and confidence in math and science skills; among first-year students, we focused on confidence in professional and interpersonal skills only.3 The independent variables for these models constitute a subset of those tested in the models of post-graduation plans; both Chapter 11 and Appendix IV provide additional details about all of the models and the derivation of the confidence subset. The student-level independent variables considered in the three confidence models are listed in Table 10.5.
3 We excluded confidence in open-ended problem solving because this variable did not have much predictive power in our models of post-graduation plans (see Appendix IV), and because both confidence in math/science skills and confidence in professional/interpersonal skills are psychometrically stronger measures (i.e., they have higher Cronbach’s alpha values, as noted in Appendix II.3). When looking at first-year students, we modeled only confidence in professional/interpersonal skills because this variable carried considerable weight across all regressions of senior post-graduation plans and as a result, was important to evaluate as a dependent variable at both senior and first-year levels.
Confidence in Solving Open-ended Problems First-Years Seniors First-Years Seniors
Women ns ns Men ns nsnon-URM 74.3 74.9 ns non-URM 75.9 79.3 ***URM 72.0 78.3 * URM 76.1 81.3 *
Confidence in Math & Science Skills First-Years Seniors First-Years Seniors
Women ns ns Men ns nsnon-URM 70.4 70.4 ns non-URM 73.1 73.0 nsURM 66.3 70.0 ns URM 72.4 76.0 ns
Confidence & Professional and Social Skills First-Years Seniors First-Years Seniors
Women ns ** Men ns nsnon-URM 67.2 67.6 ns non-URM 65.2 69.2 ***URM 64.4 73.9 ** URM 66.9 70.5 ns
(a) Women (b) Men
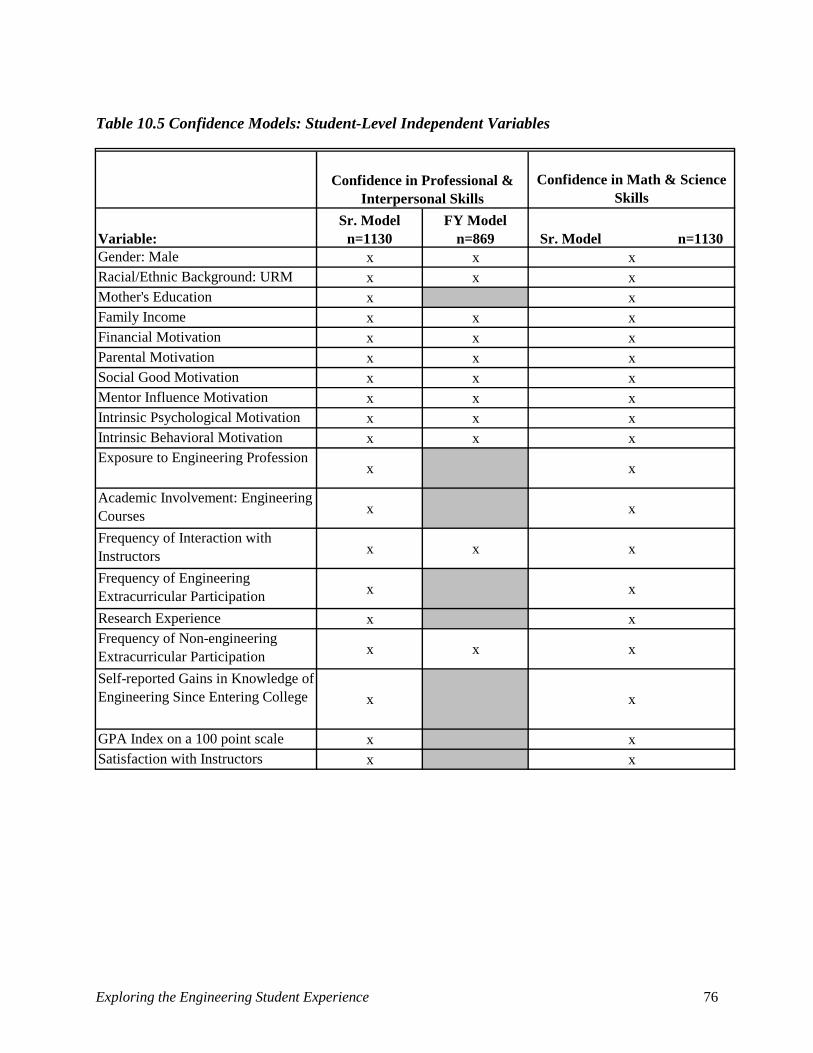
Exploring the Engineering Student Experience 76
Table 10.5 Confidence Models: Student-Level Independent Variables
Confidence in Math & Science Skills
Variable:Sr. Model
n=1130FY Model
n=869 Sr. Model n=1130Gender: Male x x xRacial/Ethnic Background: URM x x xMother's Education x xFamily Income x x xFinancial Motivation x x xParental Motivation x x xSocial Good Motivation x x xMentor Influence Motivation x x xIntrinsic Psychological Motivation x x xIntrinsic Behavioral Motivation x x xExposure to Engineering Profession
x x
Academic Involvement: Engineering Courses x x
Frequency of Interaction with Instructors x x x
Frequency of Engineering Extracurricular Participation x x
Research Experience x xFrequency of Non-engineering Extracurricular Participation x x x
Self-reported Gains in Knowledge of Engineering Since Entering College x x
GPA Index on a 100 point scale x xSatisfaction with Instructors x x
Confidence in Professional & Interpersonal Skills
Exploring the Engineering Student Experience 77
In this section, we use regression modeling to address the following questions:
• Which demographic characteristics and educational experiences predict confidence in professional and interpersonal skills and confidence in math and science skills among seniors?
• Which demographic characteristics and educational experiences predict confidence in professional and interpersonal skills among first-year students?
• For confidence in professional and interpersonal skills, are senior and first-year models comparable?4
Tables 10.6 through 10.8 summarize the results of the final confidence models after all variables are entered. (The coefficients for the 20 institutional dummy variables—as described in Chapter 11 and Appendix IV—are not presented in these tables but are available upon request.) Each model explains about 16-19 percent of the variance in the respective dependent variable. For the purpose of our discussion, we focus on those student-level predictors of confidence in each model that reach statistical significance at p<.001, unless otherwise noted. Each table presents means and standard deviations for all variables in the model, in addition to simple correlation coefficients (Pearson’s r and significance level) between each independent variable and the dependent variable. Correlation coefficients show the association between two variables without controlling for any other measure; this descriptive assessment identifies important relationships between independent and dependent variables that may be further explained by introducing covariates into the models. The remaining columns show the “effect” of each independent variable in a fully adjusted model, i.e., while holding all other variables constant. We list the regression coefficient (b), standard error, Beta, t statistic, and significance level, as well as a 95% confidence interval for the b coefficient. The totality of these statistics allows us to see a variable’s unique and relative predictive power, as well as the precision of our estimates.
4 Keep in mind there are fewer independent variables in the first-year model due to a smaller sample size.

Exploring the Engineering Student Experience 78
Table 10.6 Senior Confidence in Professional/Interpersonal Skills: Student-Level Predictors at Final Model with All Variables Entered
NOTE: 1. This table shows regression coefficients for student-level variables in the final model (all variables
entered). Coefficients for 20 institutional dummy variables are not presented/are available upon request. R-square at Model 1 (with entry of institutional dummy variables) = .054, F=2.403 (20,838), p<.01.
***p<.001, **p<.01, *p<.05
MeanStd. Dev. r b
Std. Error Beta t
Lower Bound
Upper Bound
DV: Confidence in Professional/Interpersonal Skills
69.93 16.33
(Constant) 32.16 4.46 7.22 *** 23.41 40.90
Gender: Male 0.69 0.46 0.02 2.15 1.23 0.06 1.75 -0.26 4.56Racial/Ethnic Background: URM 0.20 0.40 0.06 2.32 1.78 0.06 1.31 -1.16 5.81Mother's Education 3.12 1.64 0.06 * 0.00 0.35 0.00 0.00 -0.68 0.68Family Income 2.07 1.00 0.13 *** 2.46 0.58 0.15 4.20 *** 1.31 3.60Financial Motivation 66.56 24.74 0.08 ** 0.04 0.02 0.07 2.01 0.00 0.09Parental Influence Motivation 14.03 24.18 -0.01 -0.03 0.02 -0.05 -1.34 -0.08 0.01Social Good Motivation 75.66 22.25 0.08 ** 0.00 0.03 0.00 -0.04 -0.06 0.06Mentor Influence Motivation 37.71 26.02 0.15 *** 0.05 0.02 0.07 2.14 * 0.00 0.09Intrinsic Psychological Motivation 80.03 21.21 0.07 * -0.02 0.04 -0.03 -0.61 -0.10 0.05Intrinsic Behavioral Motivation 83.84 23.15 0.07 * 0.03 0.03 0.04 0.89 -0.03 0.09Exposure to Engineering Profession 2.08 1.01 0.21 *** 1.03 0.60 0.06 1.73 -0.14 2.21Academic Involvement: Engineering 65.81 19.97 0.00 0.02 0.03 0.03 0.76 -0.03 0.08Frequency of Interaction with Instructors
45.16 20.94 0.18 *** 0.10 0.03 0.13 3.33 ** 0.04 0.16
Frequency of Engineering Extracurricular Participation
1.24 0.99 0.17 *** 1.24 0.57 0.08 2.18 * 0.13 2.36
Research Experience 0.50 0.50 0.14 *** 3.00 1.10 0.09 2.74 ** 0.85 5.16Frequency of Non-engineering Extracurricular Participation
2.22 0.90 0.26 *** 3.54 0.63 0.20 5.59 *** 2.30 4.79
Self-reported Gains in Knowledge of Engineering Since Entering College
2.51 0.58 0.22 *** 3.24 0.99 0.12 3.26 ** 1.29 5.20
GPA on 100 point scale 68.24 20.22 0.05 0.00 0.03 0.00 -0.11 -0.06 0.05Satisfaction with Instructors 64.36 21.05 0.06 * 0.00 0.03 -0.01 -0.16 -0.06 0.05
n=859R-square: .220Adjusted R-square: .183
95% Confidence
Coefficients at Final Model

Exploring the Engineering Student Experience 79
Table 10.7 First-Year Student Confidence in Professional/Interpersonal Skills: Student-Level Predictors at Final Model with All Variables Entered
NOTE: 1. This table shows regression coefficients for student-level variables in the final model (all variables
entered). Coefficients for 20 institutional dummy variables are not presented/are available upon request. R-square at Model 1 (with entry of institutional dummy variables) = .052, F=1.885(20,688), p<.05.
***p<.001, **p<.01, *p<.05
MeanStd. Dev. r b
Std. Error Beta t
Lower Bound
Upper Bound
DV: Confidence in Professional/Interpersonal Skills
66.31 16.39
(Constant) 37.64 4.05 9.30 *** 29.69 45.58
Gender: Male 0.64 0.48 -0.03 1.12 1.30 0.03 0.86 -1.44 3.67Racial/Ethnic Background: URM 0.19 0.39 0.00 -0.28 1.90 -0.01 -0.14 -4.01 3.46Family Income 2.21 0.94 0.08 * 1.55 0.65 0.09 2.40 * 0.28 2.82Financial Motivation 69.03 24.55 0.12 ** 0.05 0.03 0.07 1.93 0.00 0.10Parental Influence Motivation 15.73 24.48 0.08 * 0.00 0.03 0.00 0.02 -0.05 0.05Social Good Motivation 77.07 21.76 0.15 *** 0.07 0.04 0.09 1.98 0.00 0.14Mentor Influence Motivation 37.65 24.97 0.22 *** 0.08 0.03 0.13 3.21 ** 0.03 0.13Intrinsic Psychological Motivation 80.44 20.45 0.10 ** -0.02 0.05 -0.02 -0.39 -0.11 0.08Intrinsic Behavioral Motivation 81.05 22.28 0.06 0.02 0.04 0.03 0.62 -0.05 0.09Frequency of Interaction with Instructors
36.19 19.85 0.21 *** 0.20 0.03 0.24 6.09 *** 0.13 0.26
Frequency of Non-engineering Extracurricular Participation
2.14 0.90 0.19 *** 3.32 0.66 0.18 5.05 *** 2.03 4.61
n=709R-square: .196Adjusted R-square: .159
Coefficients at Final Model95%
Confidence
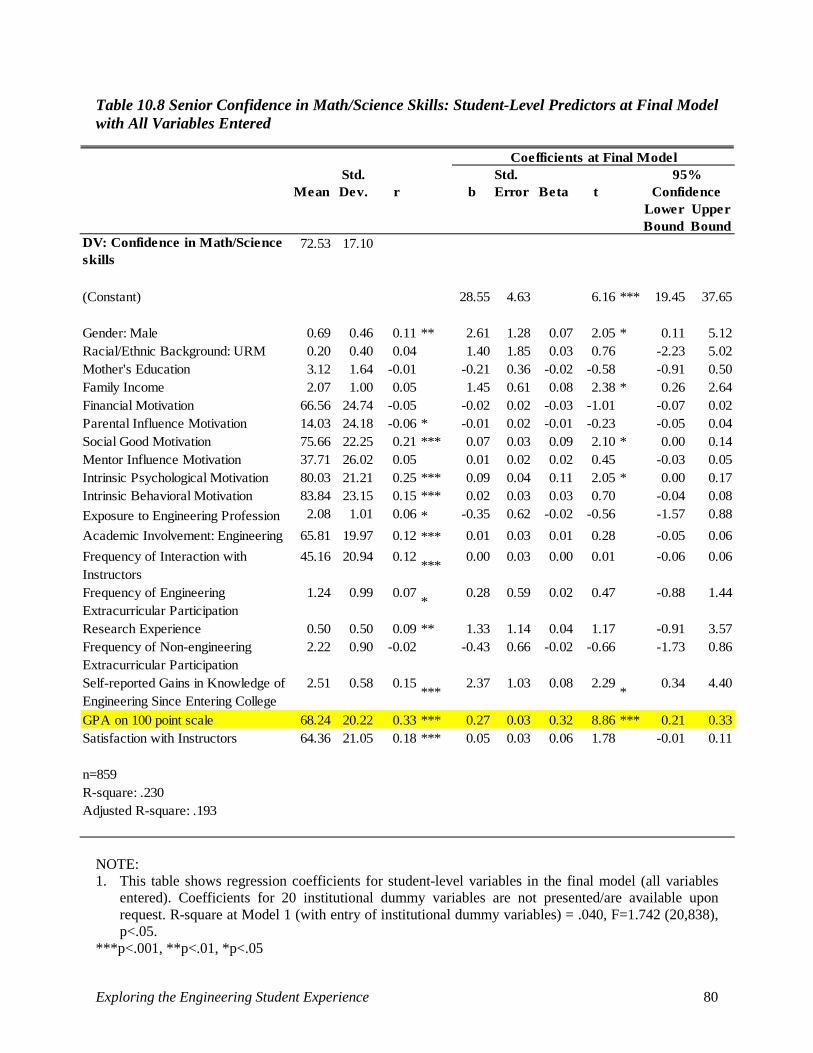
Exploring the Engineering Student Experience 80
Table 10.8 Senior Confidence in Math/Science Skills: Student-Level Predictors at Final Model with All Variables Entered
NOTE: 1. This table shows regression coefficients for student-level variables in the final model (all variables
entered). Coefficients for 20 institutional dummy variables are not presented/are available upon request. R-square at Model 1 (with entry of institutional dummy variables) = .040, F=1.742 (20,838), p<.05.
***p<.001, **p<.01, *p<.05
MeanStd. Dev. r b
Std. Error Beta t
Lower Bound
Upper Bound
DV: Confidence in Math/Science skills
72.53 17.10
(Constant) 28.55 4.63 6.16 *** 19.45 37.65
Gender: Male 0.69 0.46 0.11 ** 2.61 1.28 0.07 2.05 * 0.11 5.12Racial/Ethnic Background: URM 0.20 0.40 0.04 1.40 1.85 0.03 0.76 -2.23 5.02Mother's Education 3.12 1.64 -0.01 -0.21 0.36 -0.02 -0.58 -0.91 0.50Family Income 2.07 1.00 0.05 1.45 0.61 0.08 2.38 * 0.26 2.64Financial Motivation 66.56 24.74 -0.05 -0.02 0.02 -0.03 -1.01 -0.07 0.02Parental Influence Motivation 14.03 24.18 -0.06 * -0.01 0.02 -0.01 -0.23 -0.05 0.04Social Good Motivation 75.66 22.25 0.21 *** 0.07 0.03 0.09 2.10 * 0.00 0.14Mentor Influence Motivation 37.71 26.02 0.05 0.01 0.02 0.02 0.45 -0.03 0.05Intrinsic Psychological Motivation 80.03 21.21 0.25 *** 0.09 0.04 0.11 2.05 * 0.00 0.17Intrinsic Behavioral Motivation 83.84 23.15 0.15 *** 0.02 0.03 0.03 0.70 -0.04 0.08Exposure to Engineering Profession 2.08 1.01 0.06 * -0.35 0.62 -0.02 -0.56 -1.57 0.88Academic Involvement: Engineering 65.81 19.97 0.12 *** 0.01 0.03 0.01 0.28 -0.05 0.06Frequency of Interaction with Instructors
45.16 20.94 0.12***
0.00 0.03 0.00 0.01 -0.06 0.06
Frequency of Engineering Extracurricular Participation
1.24 0.99 0.07*
0.28 0.59 0.02 0.47 -0.88 1.44
Research Experience 0.50 0.50 0.09 ** 1.33 1.14 0.04 1.17 -0.91 3.57Frequency of Non-engineering Extracurricular Participation
2.22 0.90 -0.02 -0.43 0.66 -0.02 -0.66 -1.73 0.86
Self-reported Gains in Knowledge of Engineering Since Entering College
2.51 0.58 0.15***
2.37 1.03 0.08 2.29*
0.34 4.40
GPA on 100 point scale 68.24 20.22 0.33 *** 0.27 0.03 0.32 8.86 *** 0.21 0.33Satisfaction with Instructors 64.36 21.05 0.18 *** 0.05 0.03 0.06 1.78 -0.01 0.11
n=859R-square: .230Adjusted R-square: .193
Coefficients at Final Model95%
Confidence

Exploring the Engineering Student Experience 81
What the models say Confidence in professional and interpersonal skills: Among seniors, the strongest predictors of confidence in professional/interpersonal skills (holding all other variables constant) are perceived family income (an indicator of SES) and participation in non-engineering extracurricular activities. Have students from higher-income families come to college with more exposure to situations where they developed the types of interpersonal skills (along with confidence in these skills) needed in professional work? And what aspects of non-engineering extracurricular activities might enhance students’ confidence in their social skills? Alternately, are students with greater professional and interpersonal confidence more likely to seek out these types of activities? 5 Importantly, engineering-specific activities are also related to professional/interpersonal confidence. We note positive simple correlations between confidence and engineering research, exposure to the engineering profession, and participation in engineering clubs, events, and groups outside of class. However, these variables lose their unique predictive power once all of the variables are controlled for in the model, due in part to the predictive power they share with one another, and to weaker relationships with this measure of confidence. That is, engineering activities may well help to develop students’ skills in teams, as leaders, and so on, but might not pack the same punch as non-engineering activities. Why might this be? One possible interpretation is that engineering activities may not be providing the same types of opportunities for professional/interpersonal development than other activities are, to the extent that these other activities are. Students may need to draw from a broad menu of experiences outside of engineering in order to build leadership, collaborative, and other professional skills. Another possibility is that students with both higher and lower levels of professional and interpersonal confidence may be participating in engineering activities, particularly if they are mandatory in some programs, with the net result being a weaker relationship between engineering activity and professional/interpersonal confidence overall. Turning to the first-year model: As with seniors, participation in non-engineering extracurricular activities is a positive and strong predictor of confidence in professional and interpersonal skills. Again, it is possible that students with strong leadership and interpersonal self-concepts seek out these non-engineering experiences even in the first college year, looking for a broader range of activities and exposure to different types of people than those they might find in their engineering programs. It is also possible that these non-engineering extracurricular activities serve to build students’ confidence in their ability to work and communicate with others.
5 For each confidence regression, an exploratory follow-up regression analysis was conducted to examine interaction effects between significant (p<.001) predictors and gender, after controlling for the 20 institutional dummy variables and main effects. All interaction terms were not statistically significant once entered into the model (p>.05), with one exception: for confidence in professional/interpersonal skills among seniors, the interaction between gender and participation in non-engineering extracurricular activities was positive and significant at p<.05 (b=2.961, SE=1.263, t=2.343). This indicates that the positive relationship between non-engineering extracurricular activities and professional/interpersonal confidence may be stronger for men than for women. However, given the relatively small value of the t statistic and its associated p-value, this interaction should be interpreted cautiously. Also, these interaction term analyses controlled only for main effects of significant (p<.001) predictors, as opposed to all control variables in the full model. Further analysis is needed to assess the significance of the interactions while holding all other variables constant.

Exploring the Engineering Student Experience 82
In addition to participation in non-engineering extracurricular activities, frequency of interaction with instructors is a strong predictor of confidence in professional/interpersonal skills in the first-year model, holding all other measures constant. Thus, among first-year students of comparable backgrounds and motivation to study engineering, higher levels of faculty interaction translate into higher levels of interpersonal confidence—whether because students with high levels of confidence seek out these interactions, or because these interactions have a positive effect on students’ self-perceived abilities to communicate. We also note that perceived family income is a weak but positive predictor of confidence (p<.05) among first-year students, suggesting that higher-SES students may indeed come to college with greater professional/interpersonal confidence and/or resources upon which to continue skill growth. Confidence in math and science skills: Returning to seniors and their confidence in math and science skills, only one measure, GPA Index, reached significance at p<.001. Seniors with higher GPAs tend to have higher levels of confidence in their math and science abilities relative to their peers, even after controlling for academic experiences that might help to explain this link (e.g., involvement in engineering coursework and research, interaction with professors, and so on). We note a weak gender effect in the final model that is consistent with the descriptive results: men have higher levels of math/science confidence than do women (p<.05).
10.3 Findings: What Confidence Looks Like and What Contributes to It In this chapter, we explored three aspects of students’ confidence in: math and science skills, professional and interpersonal skills, and open-ended problem solving. We considered the differences between seniors and first-year students, and identified the factors that may contribute to their development. Helping students develop confidence in essential engineering skills is certainly an educational objective of engineering programs. With an eye towards contributing to the improvement of these programs, we found the following:
Not all confidence levels are equal Our APPLES engineering majors generally have an above-average level of confidence in their open-ended problem solving skills, math and science skills, and professional and interpersonal skills, although confidence in open-ended problem solving is highest. While confidence is not the same as competence, we would argue that confidence in these key engineering skills is a desired "meta-skill" itself. We found that although confidence levels in professional and interpersonal skills are comparable among senior women and men, women are less confident than men in their open-ended problem solving and math/science skills. The gender gap in open-ended problem solving confidence among seniors is greater than is the gap among first-years, suggesting that the college experience is affecting the development of men's and women's confidence differently. While confidence in open-ended problem solving is on the high end for APPLES students, confidence in professional and interpersonal skills is on the lower end. The range is particularly stark for senior and first-year men. Does the finding that seniors are “least” confident in

Exploring the Engineering Student Experience 83
professional and interpersonal skills (even though the scores are still, on average, high) suggest that engineering is doing “less well” here than in other domains? Indeed, not only do our engineering majors have lower levels of confidence in this critical area, but as we discuss in Chapter 11, we may be losing those who rate themselves most highly on professional/interpersonal dimensions to non-engineering career paths. Moreover, it is participation in non-engineering rather than engineering extracurricular activities that has the strongest unique relationship with students’ professional/interpersonal confidence. On the face of it, the development of professional/interpersonal skills appears not to be engineering’s strongest suit. It may be that students who have high levels of interpersonal confidence are simply drawn to activities outside of their major, more so than are less interpersonally confident students. And on the plus side, seniors have higher levels of confidence in professional and interpersonal skills than do first-year students. Yet engineering-focused extracurricular activities and engineering experiences in and around the classroom should be able to help students develop professional and interpersonal skills concurrently with their technical expertise, thereby resulting in a convergence of confidence levels across all domains over time. How might these “in-field” activities be refined and redesigned to this end?
Confidence in math and science skills remains constant Confidence in math and science remains constant, and at an above-average level, for first-year and senior men and women. This makes sense if we consider that students are comparing themselves to “classmates” on these measures—engineering majors are likely to rate themselves highly on math and science relative to peers given the prerequisites for entry and persistence in their degree programs. However, recall from Chapter 7 that seniors perceive math and science as less important in engineering work than do first-year students. Perhaps as students get a more realistic sense of the role of math/science in professional work (through, for example, their co-op and internship experiences), they begin to perceive it as one of a number of skill sets needed for successful practice. (Of course, if this were entirely the case, we might expect perceived importance of professional/interpersonal skills to be higher among seniors than first-year students. Yet this is not evident in our data, again pointing to something unique about engineering curricula and the social-skill domain. Despite their numerous co-op, internship, and research experiences, and increased involvement in team-based projects, why are students not seeing these skills as an essential part of engineering practice?) Confidence in math and science skills was predicted by GPA; we cautiously interpret this as indicating that confidence is at least partly grounded in school-measured academic performance. Gender and perceived family income were weak predictors, whereas URM status was not a predictor. That gender and family income are predictors of confidence in math and science skills is of concern. At the same time, the fact that racial/ethnic background does not differentiate confidence in these key skills is good news. Frequency of interaction with faculty, involvement in research, engineering extracurricular activities, and exposure to engineering through co-ops, internships and work experience all had no unique predictive power in this model. Why is it that the components of an engineering education one might hope would contribute to confidence do

Exploring the Engineering Student Experience 84
not, in fact, explain a significant proportion of the variance, all else being equal? Might these measures play a stronger role in the earlier stages of an engineering student’s experience, e.g., in sophomore and junior years?
Demographic variation and possible interactions for further study Family income, one indicator of socioeconomic status, is a positive predictor of confidence in professional/interpersonal skills of seniors. That is, among engineering majors with comparable academic experiences, a student from a higher family income is more confident than a student from a lower family income. Family income was also a weak predictor in the first-year model. We are left wondering whether students from higher-income backgrounds come to college with a stronger sense of “interpersonal ability” when they compare themselves to their peers, or are these students more interested in and prepared to take advantage of certain college activities that help hone these skills? Somehow family income level is fueling a difference in professional and interpersonal confidence. New insights on the connections between engineering activities and professional and interpersonal confidence might be gained from further study of how URM women navigate their education; this particular group is at the high end for both confidence in and perceived importance of such skills. What is enabling these women, on average from lower perceived family income as compared to their non-URM female counterparts, to see perhaps most clearly the professional and interpersonal skills needed in engineering, and to rate themselves highly on these critical skills? How can we use these insights to reinforce their persistence and success in engineering, and extrapolate these lessons to other groups?
Why are there differences in perceived importance and confidence in key skills? At the very least, the differences described above regarding confidence in and perceived importance of key engineering-related skills, by gender, race/ethnicity, and academic standing, underscore the complexity and heterogeneity of “the college experience” and its impact on a variety of perception and confidence outcomes. We expect that the following (or some combination) may be occurring as part of these college experiences: 1) various groups are involved in different curricular and extracurricular activities that build their understanding and confidence; 2) various groups are involved in the same curricular and extracurricular activities but internalize, experience, and/or benefit from them in different ways; and/or 3) various groups come to college with different pre-college experiences on which to overlay their college experience. Teasing apart and testing these “candidate hypotheses” on differences and interaction effects may be useful in gaining a more fundamental understanding of how college impact is conditional, and how engineering education can be improved for all students.

Exploring the Engineering Student Experience 85
Chapter 11: What do students’ post-graduation plans look like? What contributes to these plans?
On the survey, we included a set of questions that would allow us to probe students’ post-graduation plans and possible career paths. We were specifically interested in four options:
• working in an engineering job • working in a non-engineering job • attending graduate school in an engineering discipline • attending graduate school in a non-engineering discipline
In this chapter, we describe what students told us, and how their plans take shape in relation to their myriad educational experiences and individual characteristics. 11.1 Descriptions of Post-Graduation Intentions We asked students to rate the likelihood of working in an engineering (EngJob) or non-engineering (NonEngJob) job, or attending engineering (EngGS) or non-engineering (NonEngGS) graduate school after graduation. Each question was measured on a five-point Likert scale, from “definitely not” to “definitely yes,” What seniors and first-year students told us (having completed the APPLE Survey in the spring of 2008, six months prior to the 2008 global recession) is presented in Figures 11.1 through 11.4 and Tables 11.1 through 11.3:
Figure 11.1: Post-Graduation Plans of Seniors Figure 11.2: Post-Graduation Plans of Senior Women and Men Figure 11.3: Post-Graduation Plans of Senior and First-Year Students Figure 11.4: Post-Graduation Plans of First-Year Women and Men Table 11.1: Post-Graduation Plans of Senior and First-Year Women and Men Table 11.2: Post-Graduation Plans of Senior and First-Year Women, by URM Status Table 11.3: Post-Graduation Plans of Senior and First-Year Men, by URM Status
In the discussion below, we first consider what responses looked like in terms of engineering options (job and graduate school), and non-engineering options (job and graduate school). Next we look at how students combined options, followed by an examination of how post-graduation plans vary by underrepresented racial/ethnic minority (URM) status.
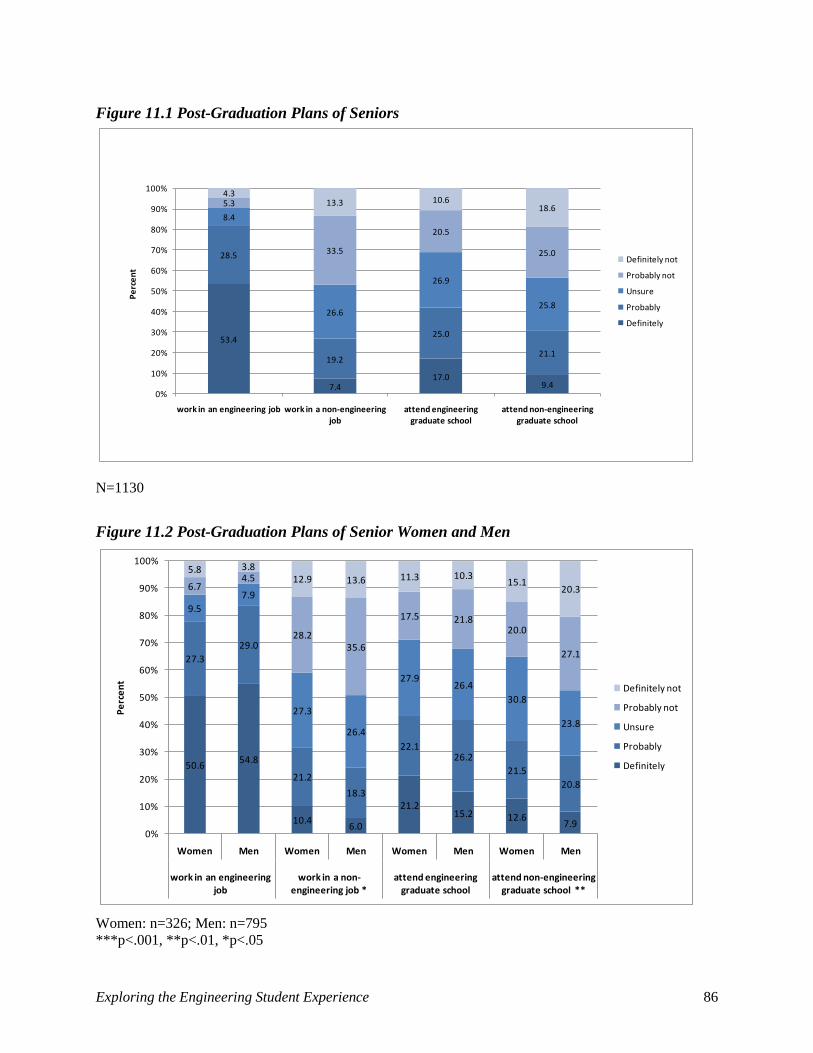
Exploring the Engineering Student Experience 86
Figure 11.1 Post-Graduation Plans of Seniors
N=1130
Figure 11.2 Post-Graduation Plans of Senior Women and Men
Women: n=326; Men: n=795 ***p<.001, **p<.01, *p<.05
53.4
7.417.0
9.4
28.5
19.2
25.0
21.1
8.4
26.6
26.9
25.8
5.3
33.5
20.5
25.0
4.313.3 10.6
18.6
0%
10%
20%
30%
40%
50%
60%
70%
80%
90%
100%
work in an engineering job work in a non-engineering job
attend engineering graduate school
attend non-engineering graduate school
Perc
ent
Definitely not
Probably not
Unsure
Probably
Definitely
50.6 54.8
10.46.0
21.215.2 12.6
7.9
27.329.0
21.2
18.3
22.126.2
21.520.8
9.57.9
27.3
26.4
27.926.4
30.8
23.8
6.74.5
28.235.6
17.5 21.820.0
27.1
5.8 3.812.9 13.6 11.3 10.3
15.120.3
0%
10%
20%
30%
40%
50%
60%
70%
80%
90%
100%
Women Men Women Men Women Men Women Men
work in an engineering job
work in a non-engineering job *
attend engineering graduate school
attend non-engineering graduate school **
Perc
ent
Definitely not
Probably not
Unsure
Probably
Definitely

Exploring the Engineering Student Experience 87
Figure 11.3 Post-Graduation Plans of Senior and First-Year Students
53.4
36.6
7.4 2.7
17.0 12.2 9.4 4.0
28.5
44.2
19.217.8
25.0 31.1
21.1
16.4
8.4 12.8
26.6 37.2
26.937.4
25.832.9
5.35.5
33.535.5
20.5
15.3
25.0 32.9
4.3 0.913.3
6.8 10.63.9
18.6 13.6
0%
10%
20%
30%
40%
50%
60%
70%
80%
90%
100%
Seniors First-years Seniors First-years Seniors First-years Seniors First-years
Plans to work in an engineering job ***
Plans to work in a non-engineering job
***
Plans to attend engineering graduate
school ***
Plans to attend non-engineering graduate
school ***
Perc
ent
Definitely not
Probably not
Unsure
Probably
Definitely
Seniors: n=1130; First-Years: n=869 ***p<.001, **p<.01, *p<.05
Figure 11.4 Post-Graduation Plans of First-Year Women and Men
Women: n=311; Men: n=557 ***p<.001, **p<.01, *p<.05
35.0 37.5
2.3 2.911.6 12.6
4.8 3.6
43.744.5
20.6 16.3
32.2 30.6
16.7 16.3
15.1 11.5
40.5
35.4
37.0 37.7
36.730.9
4.8 5.9
29.638.9
14.8 15.7
31.5
33.8
1.3 0.57.1 6.5 4.5 3.4
10.315.4
0%
10%
20%
30%
40%
50%
60%
70%
80%
90%
100%
Women Men Women Men Women Men Women Men
work in an engineering job
work in a non-engineering job
attend engineering graduate school
attend non-engineering graduate school
Perc
ent
Definitely not
Probably not
Unsure
Probably
Definitely

Exploring the Engineering Student Experience 88
Table 11.1 Post-Graduation Plans of Senior and First-Year Women and Men (percentages)
***p<.001, **p<.01, *p<.05, ns=not significant
Engineering options Seniors: Looking ahead, 81.9 percent of seniors report they will “definitely” or “probably” work in an engineering job after graduation (with 53.4% reporting “definitely yes” and 28.5% reporting “probably yes”). These students are leaning towards engineering work. The balance (18.0%) of students is evenly split between “unsure” (8.4%) and “definitely not” or “probably not” (9.6%) (Figure 11.1). When thinking about the likelihood of going on to graduate school in engineering, 42 percent of seniors marked “definitely yes” or “probably yes.” Another 26.9 percent are “unsure” about engineering graduate school. And just over 30 percent of seniors are ruling it out: 20.5 percent marked “probably not” and 10.6 percent marked “definitely not”. We note that senior women’s post-graduation engineering plans are similar to men’s (Figure 11.2). Comparisons with First-Year Students: The proportions of first-year students and seniors leaning towards engineering work and engineering graduate school are comparable, at about 80 percent and 40 percent, respectively (see Figure 11.3). However, first-years and seniors differ in two significant ways.
Plans to…
Probably or definitely
not Unsure
Probably or definitely
yes
Probably or definitely
not UnsureProbably or
definitely yes
Is overall chi-square
significant within gender
and cohort (e.g., FY
women vs Sr work in an engineering job
Seniors 12.6 9.5 77.9 8.3 7.9 83.8** for women, ns for men
First-years 6.1 15.1 78.8 6.5 11.5 82.0work in a non-engineering job
Seniors 41.1 27.3 31.6 49.2 26.4 24.3** for women and men
First-years 36.7 40.5 22.8 45.4 35.4 19.2attend engineering graduate school
Seniors 28.8 27.9 43.3 32.1 26.4 41.4** for women, *** for men
First-years 19.3 37.0 43.7 19.1 37.7 43.2attend non-engineering graduate school
Seniors 35.1 30.8 34.2 47.4 23.8 28.8** for women, *** for men
First-years 41.8 36.7 21.5 49.2 30.9 19.9
Women Men
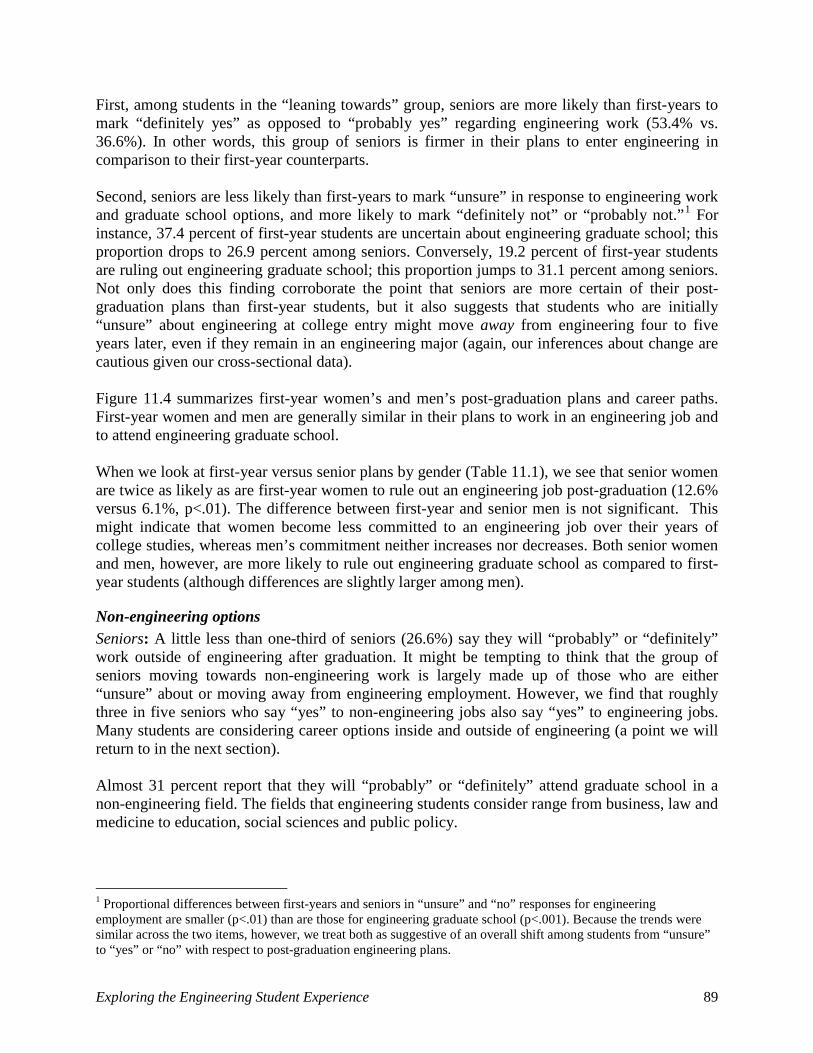
Exploring the Engineering Student Experience 89
First, among students in the “leaning towards” group, seniors are more likely than first-years to mark “definitely yes” as opposed to “probably yes” regarding engineering work (53.4% vs. 36.6%). In other words, this group of seniors is firmer in their plans to enter engineering in comparison to their first-year counterparts. Second, seniors are less likely than first-years to mark “unsure” in response to engineering work and graduate school options, and more likely to mark “definitely not” or “probably not.”1 For instance, 37.4 percent of first-year students are uncertain about engineering graduate school; this proportion drops to 26.9 percent among seniors. Conversely, 19.2 percent of first-year students are ruling out engineering graduate school; this proportion jumps to 31.1 percent among seniors. Not only does this finding corroborate the point that seniors are more certain of their post-graduation plans than first-year students, but it also suggests that students who are initially “unsure” about engineering at college entry might move away from engineering four to five years later, even if they remain in an engineering major (again, our inferences about change are cautious given our cross-sectional data). Figure 11.4 summarizes first-year women’s and men’s post-graduation plans and career paths. First-year women and men are generally similar in their plans to work in an engineering job and to attend engineering graduate school. When we look at first-year versus senior plans by gender (Table 11.1), we see that senior women are twice as likely as are first-year women to rule out an engineering job post-graduation (12.6% versus 6.1%, p<.01). The difference between first-year and senior men is not significant. This might indicate that women become less committed to an engineering job over their years of college studies, whereas men’s commitment neither increases nor decreases. Both senior women and men, however, are more likely to rule out engineering graduate school as compared to first-year students (although differences are slightly larger among men).
Non-engineering options Seniors: A little less than one-third of seniors (26.6%) say they will “probably” or “definitely” work outside of engineering after graduation. It might be tempting to think that the group of seniors moving towards non-engineering work is largely made up of those who are either “unsure” about or moving away from engineering employment. However, we find that roughly three in five seniors who say “yes” to non-engineering jobs also say “yes” to engineering jobs. Many students are considering career options inside and outside of engineering (a point we will return to in the next section). Almost 31 percent report that they will “probably” or “definitely” attend graduate school in a non-engineering field. The fields that engineering students consider range from business, law and medicine to education, social sciences and public policy.
1 Proportional differences between first-years and seniors in “unsure” and “no” responses for engineering employment are smaller (p<.01) than are those for engineering graduate school (p<.001). Because the trends were similar across the two items, however, we treat both as suggestive of an overall shift among students from “unsure” to “yes” or “no” with respect to post-graduation engineering plans.

Exploring the Engineering Student Experience 90
About one-quarter of seniors are “unsure” about non-engineering job and graduate school options. This is similar to the proportion of students who are “unsure” about engineering graduate school, but is three times greater than the proportion of students who are “unsure” about an engineering job. Findings suggest that senior women may be more likely than men to consider non-engineering options after graduation, although these differences are significant at p<.05 only (Figure 11.2). Multivariate analysis in Section 11.2 explores whether these differences persist after controlling for key measures of motivation, academic experience, perceptions, and confidence. Comparisons with First-Year Students: Proportionately more seniors than first-years are leaning towards non-engineering work and graduate school (Figure 11.3). Fewer seniors are “unsure” about these options. Overall, these data suggest that uncertainty about engineering options in the first year of college may give way to greater interest in non-engineering pathways by the fourth or fifth year.
Combinations of plans, diverse pathways As noted above, roughly 60 percent, or three in five, of those seniors who are leaning towards non-engineering employment are also leaning towards engineering employment. Given that students are considering multiple career options and plans that may not be mutually exclusive, how many are thinking about engineering options only? How many are thinking about engineering and non-engineering options in tandem? We explored students’ combinations of plans by looking at seniors who have a clear disciplinary focus (in engineering or non-engineering), seniors who are considering two options that span disciplines but are sector-specific (i.e., industry or graduate school), and seniors whose still-evolving plans include both non-engineering and engineering job and graduate school options2. As Figure 11.5 shows, 29.8 percent of seniors, or close to one in three, are considering engineering options exclusively (having marked “definitely yes” to engineering employment and/or engineering graduate school, and “definitely not” or “probably not” to both non-engineering employment and non-engineering graduate school). Seven percent are considering non-engineering options exclusively. The remaining students—nearly two-thirds of our sample—are thinking about a combination of engineering and non-engineering options after graduation. Several dynamics may be playing into students’ multiplicity of plans: engineering is increasingly viewed as a flexible platform for a variety of career options; a singular career trajectory is increasingly uncommon given today’s professional and economic realities; and/or seniors are still uncertain of the directions of their professional lives. The findings of Lichtenstein et al. (2009) remind us that even seniors a few months before graduation are struggling to make decisions about the next steps in their careers. That so many of these seniors have plans that extend beyond engineering is noteworthy and should be cause for consideration by engineering educators and programs. Do our programs and faculty support students who see engineering as just one component of their professional lives? 2 Students in this latter group marked “unsure,” “probably yes,” or “definitely yes” to at least three or all four options presented to them.

Exploring the Engineering Student Experience 91
We note a small gender difference in career plans when analyzed in this way: senior men are more likely than are senior women to focus on engineering jobs and/or engineering graduate school exclusively (32.2% of men versus 24.6% of women, p<.05).
Figure 11.5 Seniors’ Post-Graduation Plans: Multiple Options and Interests [1]
[1] Engr. Focus Leaning towards Eng. Job and/or Eng. GS, only Non-Engr. Focus Leaning towards Non-Eng. Job and/or Non-Eng. GS, only Job Focus Leaning towards Job, unsure about other options Grad. School Focus Leaning towards Grad. School, unsure about other option Three Options Considering options that include two engineering or non-engineering options,
and one non-engineering or engineering option, respectively Four Options Considering engineering and non-engineering jobs and graduate school
Post-graduation plans of URM and non-URM students We examined how post-graduation plans differ by URM status in addition to gender and academic standing. Students’ projected plans for engineering work, engineering graduate school, non-engineering work and non-engineering graduate school among URM and non-URM women and men are summarized in Tables 11.2 and 11.3.
Engr. Focus30%
Non-Engr. Focus7%
Job Focus5%
Grad. School Focus
0%
Three Options35%
Four Options 23%

Exploring the Engineering Student Experience 92
Table 11.2 Post-Graduation Plans of Senior and First-Year Women by URM Status (percentages)
Sample sizes by group: First-Year URM Women: n=61; First-Year Non-URM Women: n=226; Senior URM Women: n=75; Senior Non-URM Women: n=233 ***p<.001, **p<.01, *p<.05, ns=not significant
(a) Senior Women by URM status
Plans to…
Probably or
definitely not Unsure
Probably or
definitely yes
Is overall chi-square significant
?work in an engineering job Non-URM 14.2 7.7 78.1 *
URM 6.7 16.0 77.3work in a non-engineering job Non-URM 42.9 27.5 29.6 ns
URM 42.7 26.7 30.7attend engineering graduate school Non-URM 30.9 29.6 39.5 *
URM 21.3 21.3 57.3Non-URM 36.1 34.3 29.6 *URM 36.5 20.3 43.2
(b) First-Year Women by URM status
Plans to…
Probably or
definitely not Unsure
Probably or
definitely yes
Is overall chi-square significant
?work in an engineering job Non-URM 6.2 15.9 77.9 ns
URM 4.9 11.5 83.6work in a non-engineering job Non-URM 35.4 40.7 23.9 ns
URM 44.3 36.1 19.7attend engineering graduate school Non-URM 23.0 38.9 38.1 ***
URM 9.8 23.0 67.2Non-URM 42.0 36.7 21.2 nsURM 42.6 36.1 21.3
attend non-engineering graduate school
attend non-engineering graduate school

Exploring the Engineering Student Experience 93
Table 11.3 Post-Graduation Plans of Senior and First-Year Men by URM Status (percentages)
(a) Senior Men by URM Status
Plans to...
Probably or
definitely not Unsure
Probably or
definitely yes
Is overall chi-square significant
?work in an engineering job Non-URM 8.6 8.2 83.2 NS
URM 4.9 7.4 87.7work in a non-engineering job Non-URM 48.7 26.6 24.7 NS
URM 47.5 30.3 22.1attend engineering graduate school Non-URM 35.7 27.1 37.2 ***
URM 19.7 23.8 56.6Non-URM 48.2 23.9 27.8 NSURM 40.2 29.5 30.3
(b) First-Year Men by URM Status
Plans to...
Probably or
definitely not Unsure
Probably or
definitely yes
Is overall chi-square significant
?work in an engineering job Non-URM 6.5 12.0 81.4 NS
URM 5.7 9.1 85.2work in a non-engineering job Non-URM 45.8 36.9 17.3 NS
URM 44.8 32.2 23.0attend engineering graduate school Non-URM 21.0 41.4 37.6 ***
URM 10.2 25.0 64.8Non-URM 48.9 32.0 19.0 NSURM 51.7 29.9 18.4
attend non-engineering graduate school
attend non-engineering graduate school
Sample sizes by group: First-Year URM Men: n=89; First-Year Non-URM Men: n=416; Senior URM Men: n=122; Senior Non-URM Men: n=594 ***p<.001, **p<.01, *p<.05, ns=not significant
We find that comparable percentages (~80%) of first-year and senior men and women are leaning towards engineering jobs, irrespective of URM status (Tables 11.2 and 11.3). However, URM students are more likely than non-URM students to consider attending engineering graduate school. Differences between URM and non-URM students in their plans to attend engineering graduate school are narrowest among senior women (57.3% of senior URM women marked “probably yes” or “definitely yes” in response to engineering graduate school, versus 39.5% of their non-URM female peers, p<.05, Table 11.2).

Exploring the Engineering Student Experience 94
Although the difference is similarly narrow, senior URM women are more likely than senior non-URM women to be considering graduate school in non-engineering fields as well (Table 11.2). Are URM women seeing their career aspirations as requiring further education in both non-engineering and engineering fields? Why might they conceive of their graduate school plans more broadly than their non-URM female peers? Notably, when we look at the combinations of future plans among seniors (Table 11.4), almost one-third of both URM and non-URM seniors are focused on engineering exclusively after graduation (27.3% and 30.1%, respectively). At the same time, URM students are more likely than non-URM students to think about multiple options across engineering and non-engineering, graduate school and industry (67.3% versus 56.3%, p<.01, Table 11.4).
Table 11.4 Combinations of Plans for URM and Non-URM Seniors
URM seniors
(percent)
Non-URM seniors
(percent)
Disciplinary Focus: 31.0 37.5 Engr. Focus 27.3 30.1 Non-Engr. Focus 3.7 7.4 Job or Grad School Focus: 1.6 6.2 Job Focus 1.6 5.6 Grad. School Focus 0.0 0.6 Focus Across Disciplines: 67.3 56.3 Three Options 37.4 34.9 Four Options 29.9 21.4 TOTAL 100% 100%
11.2 Modeling Post-Graduation Plans Overview of the regression models We developed six regression models in order to explore how various factors affect post-graduation plans. These regression analyses (as with all of the regression analyses in our report) are both exploratory and grounded in major theories of college student development and assessment, namely Astin’s Input-Environment-Outcome model and Kuh’s Engagement Model. For instance, we broadly consider students’ post-graduation aspirations and plans (“outcomes”) to be a function of specific, formative college experiences (“environments”) after controlling for those background characteristics (students’ “inputs”) that influence the likelihood of having these outcomes and experiences to begin with (e.g., gender, socioeconomic status, motivations to study engineering). We also examine several measures of student participation in both curricular and extracurricular dimensions of campus life, given that measures of involvement are strongly linked to student success in college (Astin, 1993; Chen et al., 2008; Kuh et al., 2005; Pascarella and Terenzini, 2005). That being said, we recognize that with cross-sectional data, we are limited in our ability to assert that environments “lead to” certain outcomes, or that involvement “leads to” success—in fact, our “environments” and “outcomes” can be mutually reinforcing, as can certain affective characteristics (e.g., motivation) that go along with them. Thus, we are cautious

Exploring the Engineering Student Experience 95
in our causal interpretations, treating experiences as possible catalysts for plans, or grounds for plans that are taking shape, while also being concurrently influenced and driven by students’ evolving interests. Our regression models first controlled for 20 institutional dummy variables (representing the 21 participating schools with 20 dummy variables and one reference school) to account for the nested aspect of our dataset (with students clustered by school)3. We then tested a series of student-level independent variables, modeled according to the input-environment-outcome rationale described above. The 22 student-level independent variables considered in the four senior models, and the 13 student-level independent variables considered in the two first-year models are listed in Table 11.5. For the current discussion, we focus on the student-level results of the final models with all of the independent variables entered, rather than how one set of variables mediates the effect of another set of variables, or how each set of variables successively strengthens the overall model. In subsequent reports and manuscripts, the hierarchical nature of these models will be discussed more fully in the context of specific research questions. Coefficients for the institutional dummy variables are not presented, but are available on request. Additional methodological details of the analyses are described in Appendix IV.
3 Future analyses of these data will construct hierarchical linear models (HLM) to directly estimate school-level effects on outcomes and relationships of interest.

Exploring the Engineering Student Experience 96
Table 11.5 Student-Level Independent Variables in Four Senior Models and Two First-Year Models
Student-Level Independent Variables
(1) All Four Senior Post-graduation Plans Models
(2) Both First-Year Eng. Job and Eng. Grad. School Models
Gender: Male X XRacial/Ethnic Background: URM X XMother's Education XFamily Income X XFinancial Motivation X XParental Influence Motivation X XSocial Good Motivation X XMentor Influence Motivation X XIntrinsic Psychological Motivation X XIntrinsic Behavioral Motivation X XExposure to Engineering Profession XAcademic Involvement: Engineering Courses XFrequency of Interaction with Instructors X XFrequency of Engineering Extracurricular Participation
X
Research Experience XFrequency of Non-engineering Extracurricular Participation
X X
Self-reported Gains in Knowledge of Engineering Since Entering College
X
GPA on 100 point scale XSatisfaction with Instructors XConfidence in Math and Science Skills X XConfidence in Professional and Interpersonal Skills X X

Exploring the Engineering Student Experience 97
Senior regression models Four ordinary least squares regression analyses were designed to examine the relationship between demographic characteristics, motivational factors, academic experiences, attitudes and self-perceptions, and post-graduation plans among seniors. These analyses examine plans to pursue engineering work (EngJob), engineering graduate school (EngGS), non-engineering work (NonEngJob), and non-engineering graduate school (NonEngGS). As presented in Tables 11.6 through 11.9, adjusted R-square values for the four senior models range from 0.161 to 0.273. These models explain about 16 to 27 percent of the variance in the respective dependent variables, with the highest proportion of variance explained in the two engineering-specific models (plans for engineering employment and plans for engineering graduate school). While these R-square values are not large, they are in line with other multivariate work on affective measures and/or degree and career aspirations (e.g., Sax et al., 2008). It is perhaps unsurprising that our models are “better” at predicting engineering plans than non-engineering plans, since most of our independent variables measure engineering-related experiences, attitudes, and motivational characteristics, and our sample is limited to engineering majors. The APPLES instrument did not capture the many non-engineering experiences of engineering majors that may influence the likelihood of non-engineering career and graduate school interests, above and beyond “participation in non-engineering extra-curricular activities” broadly defined. Future research will probe these non-engineering activities and interests more deeply.

Exploring the Engineering Student Experience 98
Table 11.6 Senior Plans to Pursue Engineering Work After Graduation (EngJob): Student-Level Predictors at Final Model with All Variables Entered
MeanStd. Dev. r b
Std. Error Beta t
Lower Bound
Upper Bound
DV: Plans to pursue engineering work (rescaled) 49.45 7.95
(Constant) 36.73 2.18 16.82 *** 32.44 41.02
Gender: Male 0.69 0.46 0.10 ** 0.04 0.57 0.00 0.06 -1.08 1.15Racial/Ethnic Background: URM 0.20 0.40 0.09 ** -0.53 0.82 -0.03 -0.65 -2.14 1.07Mother's Education 3.12 1.64 -0.12 *** -0.02 0.16 0.00 -0.10 -0.33 0.30Family Income 2.07 1.00 -0.13 *** -0.38 0.27 -0.05 -1.41 -0.92 0.15Financial Motivation 66.56 24.74 0.19 *** 0.05 0.01 0.15 4.59 *** 0.03 0.07Parental Influence Motivation 14.03 24.18 -0.11 *** -0.03 0.01 -0.10 -3.02 ** -0.05 -0.01Social Good Motivation 75.66 22.25 0.17 *** -0.01 0.01 -0.04 -1.00 -0.04 0.01Mentor Influence Motivation 37.71 26.02 -0.04 -0.02 0.01 -0.07 -2.01 * -0.04 0.00Intrinsic Psychological Motivation 80.03 21.21 0.29 *** 0.07 0.02 0.19 3.78 *** 0.03 0.11Intrinsic Behavioral Motivation 83.84 23.15 0.29 *** 0.03 0.01 0.09 2.29 * 0.00 0.06Exposure to Engineering Profession
2.08 1.01 0.19 *** 1.34 0.28 0.17 4.86 *** 0.80 1.88
Academic Involvement: Engineering
65.81 19.97 0.20 *** 0.05 0.01 0.12 3.71 *** 0.02 0.07
Frequency of Interaction with Instructors
45.16 20.94 0.09 ** 0.01 0.01 0.02 0.62 -0.02 0.04
Frequency of Engineering Extracurricular Participation
1.24 0.99 -0.01 0.05 0.26 0.01 0.20 -0.46 0.57
Research Experience 0.50 0.50 -0.04 -0.65 0.51 -0.04 -1.28 -1.64 0.35Frequency of Non-engineering Extracurricular Participation
2.22 0.90 -0.11 ** -0.58 0.30 -0.07 -1.95 -1.16 0.00
Self-reported Gains in Knowledge of Engineering Since Entering College
2.51 0.58 0.21 *** 1.25 0.46 0.09 2.72 ** 0.35 2.16
GPA on 100 Point Scale 68.24 20.22 -0.06 -0.04 0.01 -0.10 -2.91 ** -0.07 -0.01Satisfaction with Instructors 64.36 21.05 0.07 * -0.01 0.01 -0.02 -0.46 -0.03 0.02Confidence in Math and Science Skills
72.53 17.10 0.12 *** 0.03 0.02 0.07 1.95 0.00 0.06
Confidence in Professional and Interpersonal Skills
69.93 16.33 -0.06 -0.06 0.02 -0.12 -3.61 *** -0.09 -0.03
Perceived Importance of Professional and Interpersonal Skills
67.06 17.51 0.17 *** 0.04 0.01 0.09 2.84 ** 0.01 0.07
n=859R-square: .309Adjusted R-square: .273
Coefficients at Final Model95%
Confidence
NOTES: 1. This table shows regression coefficients for student-level variables in the final model (all variables
entered). Coefficients for 20 institutional dummy variables are not presented/are available upon request. R-square at Model 1 (with entry of institutional dummy variables) = .121, F = 5.787 (20,838), p<.001.
2. Due to the skewed nature of the dependent variable, this item was recoded so that responses better approximated a normal distribution. An inverse normal transformation was applied to the midpoints of the cumulative percentages at or below successive response choices.
***p<.001, **p<.01, *p<.05

Exploring the Engineering Student Experience 99
Table 11.7 Senior Plans to Attend Engineering Graduate School (EngGS): Student-Level Predictors at Final Model with All Variables Entered
NOTE: This table shows regression coefficients for student-level variables in the final model (all variables entered). Coefficients for 20 institutional dummy variables are not presented/are available upon request. R-square at Model 1 (with entry of institutional dummy variables) = .091, F = 4.198(20,838), p<.001. ***p<.001, **p<.01, *p<.05
MeanStd. Dev. r b
Std. Error Beta t
Lower Bound
Upper Bound
DV: Plans to attend engineering graduate school 2.16 1.24
(Constant) 0.09 0.34 0.25 -0.59 0.76
Gender: Male 0.69 0.46 -0.03 -0.08 0.09 -0.03 -0.95 -0.26 0.09Racial/Ethnic Background: URM 0.20 0.40 0.15 *** 0.11 0.13 0.04 0.89 -0.14 0.37Mother's Education 3.12 1.64 0.00 0.04 0.02 0.05 1.42 -0.01 0.08Family income 2.07 1.00 -0.12 *** -0.08 0.04 -0.06 -1.77 -0.16 0.01Financial Motivation 66.56 24.74 -0.06 * 0.00 0.00 -0.02 -0.75 0.00 0.00Parental Influence Motivation 14.03 24.18 -0.05 0.00 0.00 0.01 0.31 0.00 0.00Social Good Motivation 75.66 22.25 0.22 *** 0.00 0.00 0.04 1.05 0.00 0.01Mentor Influence Motivation 37.71 26.02 0.05 0.00 0.00 -0.02 -0.47 0.00 0.00Intrinsic Psychological Motivation 80.03 21.21 0.32 *** 0.01 0.00 0.14 2.70 ** 0.00 0.01Intrinsic Behavioral Motivation 83.84 23.15 0.21 *** 0.00 0.00 0.08 2.00 0.00 0.01Exposure to Engineering Profession
2.08 1.01 0.01 0.00 0.04 0.00 -0.06 -0.09 0.08
Academic Involvement: Engineering
65.81 19.97 0.13 *** 0.00 0.00 0.03 0.91 0.00 0.01
Frequency of Interaction with Instructors
45.16 20.94 0.20 *** 0.00 0.00 0.07 1.89 0.00 0.01
Frequency of Engineering Extracurricular Participation
1.24 0.99 0.13 *** 0.11 0.04 0.09 2.64 ** 0.03 0.19
Research Experience 0.50 0.50 0.13 *** 0.19 0.08 0.07 2.33 * 0.03 0.34Frequency of Non-engineering Extracurricular Participation
2.22 0.90 -0.09 ** -0.08 0.05 -0.05 -1.61 -0.17 0.02
Self-reported Gains in Knowledge of Engineering Since Entering College
2.51 0.58 0.07 * -0.04 0.07 -0.02 -0.50 -0.18 0.11
GPA on 100 Point Scale 68.24 20.22 0.21 *** 0.01 0.00 0.13 3.52 *** 0.00 0.01Satisfaction with Instructors 64.36 21.05 0.20 *** 0.00 0.00 0.08 2.21 * 0.00 0.01Confidence in Math and Science Skills
72.53 17.10 0.23 *** 0.01 0.00 0.12 3.48 ** 0.00 0.01
Confidence in Professional and Interpersonal Skills
69.93 16.33 -0.15 *** -0.02 0.00 -0.23 -6.84 *** -0.02 -0.01
Perceived Importance of Professional and Interpersonal Skills
67.06 17.51 0.15 *** 0.01 0.00 0.09 2.65 ** 0.00 0.01
n=859R-square: .294Adjusted R-square: .258
95% Confidence
Coefficients at Final Model

Exploring the Engineering Student Experience 100
Table 11.8 Senior Plans to Pursue a Non-Engineering Job After Graduation (NonEngJob): Student-Level Predictors at Final Model with All Variables Entered
MeanStd. Dev. r b
Std. Error Beta t
Lower Bound
Upper Bound
DV: Plans to pursue a non-engineering job 1.71 1.13
(Constant) 2.30 0.33 6.90 *** 1.64 2.95
Gender: Male 0.69 0.46 -0.08 * -0.05 0.09 -0.02 -0.53 -0.22 0.12Racial/Ethnic Background: URM 0.20 0.40 -0.02 0.23 0.12 0.08 1.81 -0.02 0.47Mother's Education 3.12 1.64 0.08 * -0.01 0.02 -0.01 -0.24 -0.05 0.04Family Income 2.07 1.00 0.08 ** 0.03 0.04 0.03 0.76 -0.05 0.11Financial Motivation 66.56 24.74 0.00 0.00 0.00 0.00 0.13 0.00 0.00Parental Influence Motivation 14.03 24.18 0.12 *** 0.00 0.00 0.09 2.55 * 0.00 0.01Social Good Motivation 75.66 22.25 -0.08 ** 0.00 0.00 0.07 1.67 0.00 0.01Mentor Influence Motivation 37.71 26.02 0.05 0.00 0.00 0.05 1.34 0.00 0.00Intrinsic Psychological Motivation 80.03 21.21 -0.20 *** -0.01 0.00 -0.15 -2.90 ** -0.01 0.00Intrinsic Behavioral Motivation 83.84 23.15 -0.20 *** 0.00 0.00 -0.08 -1.85 -0.01 0.00Exposure to Engineering Profession
2.08 1.01 -0.09**
-0.16 0.04 -0.15 -3.92 *** -0.25 -0.08
Academic Involvement: Engineering
65.81 19.97 -0.16***
0.00 0.00 -0.08 -2.42 * -0.01 0.00
Frequency of Interaction with Instructors
45.16 20.94 -0.08**
0.00 0.00 -0.01 -0.39 0.00 0.00
Frequency of Engineering Extracurricular Participation
1.24 0.99 -0.06 -0.12 0.04 -0.11 -3.07 ** -0.20 -0.04
Research Experience 0.50 0.50 -0.04 -0.14 0.08 -0.06 -1.79 -0.29 0.01Frequency of Non-engineering Extracurricular Participation
2.22 0.90 0.19***
0.18 0.05 0.14 3.96 *** 0.09 0.27
Self-reported Gains in Knowledge of Engineering Since Entering College
2.51 0.58 -0.10**
-0.07 0.07 -0.04 -1.06 -0.21 0.06
GPA on 100 Point Scale 68.24 20.22 -0.03 0.00 0.00 0.04 1.06 0.00 0.01Satisfaction with Instructors 64.36 21.05 -0.06 * 0.00 0.00 0.01 0.34 0.00 0.00Confidence in Math and Science Skills
72.53 17.10 -0.14***
0.00 0.00 -0.08 -2.09 * -0.01 0.00
Confidence in Professional and Interpersonal Skills
69.93 16.33 0.12***
0.01 0.00 0.14 3.87 *** 0.00 0.01
Perceived Importance of Professional and Interpersonal Skills
67.06 17.51 -0.05 0.00 0.00 -0.03 -0.81 -0.01 0.00
n=859R-square: .209Adjusted R-square: .168
Coefficients at Final Model95%
Confidence
NOTE: This table shows regression coefficients for student-level variables in the final model (all variables entered). Coefficients for 20 institutional dummy variables are not presented/are available upon request. R-square at Model 1 (with entry of institutional dummy variables) = .086, F = 3.927(20,838), p<.001. ***p<.001, **p<.01, *p<.05

Exploring the Engineering Student Experience 101
Table 11.9 Senior Plans to Attend Non-Engineering Graduate School (nonEngGS): Student-Level Predictors at Final Model with All Variables Entered
NOTE: This table shows regression coefficients for student-level variables in the final model (all variables entered). Coefficients for 20 institutional dummy variables are not presented/are available upon request. R-square at Model 1 (with entry of institutional dummy variables) = .100, F = 4.652(20,837), p<.001. ***p<.001, **p<.01, *p<.05
MeanStd. Dev. r b
Std. Error Beta t
Lower Bound
Upper Bound
DV: Plans to attend non-engineering graduate school 1.76 1.23
(Constant) 1.36 0.36 3.75 *** 0.65 2.08
Gender: Male 0.70 0.46 -0.09 ** -0.14 0.09 -0.05 -1.49 -0.33 0.05Racial/Ethnic Background: URM 0.19 0.40 0.05 0.16 0.14 0.05 1.15 -0.11 0.43Mother's Education 3.12 1.64 0.05 0.01 0.03 0.01 0.30 -0.04 0.06Family Income 2.07 1.00 0.06 -0.02 0.05 -0.01 -0.37 -0.11 0.07Financial Motivation 66.63 24.68 0.03 0.00 0.00 -0.02 -0.59 0.00 0.00Parental Influence Motivation 14.04 24.19 0.07 * 0.00 0.00 0.02 0.68 0.00 0.00Social Good Motivation 75.65 22.26 -0.02 0.01 0.00 0.10 2.29 * 0.00 0.01Mentor Influence Motivation 37.69 26.03 0.06 0.00 0.00 0.01 0.26 0.00 0.00
Intrinsic Psychological Motivation 80.01 21.21 -0.16 *** -0.01 0.00 -0.21 -3.91 *** -0.02 -0.01
Intrinsic Behavioral Motivation 83.82 23.16 -0.11 *** 0.00 0.00 0.00 0.06 0.00 0.00Exposure to Engineering Profession
2.08 1.01 0.10 ** 0.03 0.05 0.02 0.66 -0.06 0.12
Academic Involvement: Engineering
65.80 19.97 -0.11 *** 0.00 0.00 -0.07 -2.14 * -0.01 0.00
Frequency of Interaction with Instructors
45.10 20.87 -0.03 0.00 0.00 -0.04 -1.15 -0.01 0.00
Frequency of Engineering Extracurricular Participation
1.24 0.99 0.08 ** 0.02 0.04 0.02 0.47 -0.07 0.11
Research Experience 0.50 0.50 0.03 -0.02 0.08 -0.01 -0.21 -0.18 0.15Frequency of Non-engineering Extracurricular Participation
2.22 0.90 0.17 *** 0.06 0.05 0.05 1.29 -0.03 0.16
Self-reported Gains in Knowledge of Engineering Since Entering College
2.50 0.58 0.02 0.03 0.08 0.01 0.38 -0.12 0.18
GPA on 100 Point Scale 68.22 20.23 -0.01 0.00 0.00 0.01 0.31 0.00 0.01Satisfaction with Instructors 64.32 21.03 -0.10 ** 0.00 0.00 -0.05 -1.48 -0.01 0.00Confidence in Math and Science Skills
72.55 17.09 -0.06 * 0.00 0.00 -0.02 -0.58 -0.01 0.00
Confidence in Professional and Interpersonal Skills
69.94 16.34 0.25 *** 0.02 0.00 0.24 6.61 *** 0.01 0.02
Perceived Importance of Professional and Interpersonal Skills
67.05 17.51 0.00 0.00 0.00 -0.05 -1.30 -0.01 0.00
n=858R-square: .202Adjusted R-square: .161
Coefficients at final model95%
Confidence

Exploring the Engineering Student Experience 102
First-year student regression models Two ordinary least squares regression models were also developed to examine engineering-related post-graduation plans among first-year college students. Together, the first-year and senior models were designed to shed light on how the constellation of factors that affect students’ engineering plans at college entry might shift or change by the time students graduate. However, these are cross-sectional analyses where the causal order of variables is ambiguous, and statements about student change over time are inferential. Differences between first-year and senior models may be due to a host of factors that reflect both the dynamic patterns of student development and cohort and design effects. In addition, only a subset of independent variables in the senior models was included in the first-year models due to a smaller sample of first-year student respondents (as listed in Table 11.5). Adjusted R-square values are lower in these models (Tables 11.10 and 11.11) as compared to those in the senior models, perhaps in part due to fewer independent variables and a smaller sample size. Lower R-square values may also reflect the fact that students’ plans in the first year of college might be more undefined and “unanchored” than are those among students four years later. Indeed, rates of “unsure” responses are higher among first-year students than among seniors when asked about employment and graduate school options (see Figure 11.3). Moreover, it is likely that many of the first-year students in our sample had not yet officially declared engineering as their major (unless admitted to an engineering program at time of matriculation, for example), whereas all seniors were declared engineering majors (some with a second major in an engineering or non-engineering field); thus, greater uncertainty and less “predictability” among first-year students might be expected.

Exploring the Engineering Student Experience 103
Table 11.10 First-Year Student Plans to Pursue Engineering Work After Graduation (EngJob): Student-Level Predictors at Final Model with All Variables Entered
MeanStd. Dev. r b
Std. Error Beta t
Lower Bound
Upper Bound
DV: Plans to pursue engineering work (rescaled) 46.08 6.68
(Constant) 36.94 1.87 19.73 *** 33.26 40.62
Gender: Male 0.64 0.48 0.04 -0.58 0.52 -0.04 -1.12 -1.60 0.44Racial/Ethnic background: URM 0.19 0.39 0.09 ** 0.10 0.75 0.01 0.14 -1.37 1.58Family Income 2.20 0.94 -0.15 *** -0.56 0.26 -0.08 -2.19 * -1.07 -0.06Financial Motivation 68.95 24.55 0.07 * 0.02 0.01 0.06 1.70 0.00 0.04Parental Influence Motivation 15.77 24.52 -0.09 ** -0.03 0.01 -0.11 -3.01 ** -0.05 -0.01Social Good Motivation 77.12 21.79 0.22 *** 0.01 0.01 0.02 0.37 -0.02 0.03Mentor Influence Motivation 37.70 25.00 0.09 ** 0.00 0.01 0.01 0.18 -0.02 0.02Intrinsic Psychological Motivation 80.48 20.48 0.35 *** 0.06 0.02 0.18 2.98 ** 0.02 0.09Intrinsic Behavioral Motivation 81.04 22.33 0.35 *** 0.06 0.01 0.20 4.17 *** 0.03 0.09Frequency of Interaction with Instructors
36.24 19.86 0.05 0.00 0.01 0.00 -0.06 -0.03 0.02
Frequency of Non-engineering Extracurricular Participation
2.14 0.90 -0.06 * -0.41 0.27 -0.06 -1.55 -0.93 0.11
Confidence in Math and Science Skills
72.14 17.37 0.07 * 0.00 0.01 -0.01 -0.17 -0.03 0.03
Confidence in Professional and Interpersonal Skills
66.38 16.37 0.09 ** 0.02 0.02 0.05 1.35 -0.01 0.05
n=706R-square: .247Adjusted R-square: .210
Coefficients at Final Model95%
Confidence
NOTES: 1. This table shows regression coefficients for student-level variables in the final model (all variables
entered). Coefficients for 20 institutional dummy variables are not presented/are available upon request. R-square at Model 1 (with entry of institutional dummy variables) = .104, F = 3.972(20,685), p<.001.
2. Due to the skewed nature of the dependent variable, this item was recoded so that responses better approximated a normal distribution. An inverse normal transformation was applied to the midpoints of the cumulative percentages at or below successive response choices.
***p<.001, **p<.01, *p<.05

Exploring the Engineering Student Experience 104
Table 11.11 First-Year Student Plans to Attend Engineering Graduate School (EngGS): Student-Level Predictors at Final Model with All Variables Entered
MeanStd. Dev. r b
Std. Error Beta t
Lower Bound
Upper Bound
DV: Plans to attend engineering graduate school 2.32 1.00
(Constant) 1.53 0.29 5.32 *** 0.96 2.09
Gender: Male 0.64 0.48 0.00 -0.11 0.08 -0.05 -1.35 -0.26 0.05Racial/Ethnic background: URM 0.19 0.39 0.25 *** 0.41 0.12 0.16 3.52 *** 0.18 0.63Family Income 2.20 0.94 -0.11 ** -0.02 0.04 -0.02 -0.62 -0.10 0.05Financial Motivation 68.95 24.55 -0.13 *** 0.00 0.00 -0.11 -2.82 ** -0.01 0.00Parental Influence Motivation 15.77 24.52 -0.09 ** 0.00 0.00 -0.03 -0.76 0.00 0.00Social Good Motivation 77.12 21.79 0.11 ** 0.00 0.00 -0.04 -0.82 -0.01 0.00Mentor Influence Motivation 37.70 25.00 0.03 0.00 0.00 -0.03 -0.73 0.00 0.00Intrinsic Psychological Motivation 80.48 20.48 0.27 *** 0.01 0.00 0.18 2.93 ** 0.00 0.01Intrinsic Behavioral Motivation 81.04 22.33 0.22 *** 0.00 0.00 0.08 1.70 0.00 0.01Frequency of Interaction with Instructors
36.24 19.86 0.11 ** 0.00 0.00 0.04 1.04 0.00 0.01
Frequency of Non-engineering Extracurricular Participation
2.14 0.90 -0.08 * -0.11 0.04 -0.10 -2.62 ** -0.19 -0.03
Confidence in Math and Science Skills
72.14 17.37 0.10 ** 0.01 0.00 0.11 2.73 ** 0.00 0.01
Confidence in Professional and Interpersonal Skills
66.38 16.37 0.01 0.00 0.00 0.00 -0.01 0.00 0.00
n=706R-square: .205Adjusted R-square: .166
Coefficients at Final Model Confidence
Interval for b
NOTE: This table shows regression coefficients for student-level variables in the final model (all variables entered). Coefficients for 20 institutional dummy variables are not presented/are available upon request. R-square at Model 1 (with entry of institutional dummy variables) = .102, F = 3.873(20,685), p<.001. ***p<.001, **p<.01, *p<.05

Exploring the Engineering Student Experience 105
Findings from the models: An overview Table 11.12 lists the statistical significance of the coefficient for each student-level independent variable in each regression analysis, holding all other variables constant. It also highlights those that are significant at p<.001 in at least one model; these will be described in more detail in the next section. Here we provide an overview of selected top findings. Two predictors across the four senior models have consistent, often strong, and opposite directions of effect. They are confidence in professional/interpersonal skills and intrinsic psychological motivation. All else being equal, intrinsic psychological motivation characterizes students who may be leaning towards engineering, and away from non-engineering; and confidence in professional/interpersonal skills characterizes students who may be leaning away from engineering, and towards non-engineering. We probe these variables further in Chapter 12, asking the question: What about students who have both—high levels of social, leadership, public-speaking, and business confidence and high levels of intrinsic appreciation for and enjoyment of engineering work? Given that these are two highly valued characteristics of current and future engineers, what do our data tell us about their prospects for engineering persistence, relative to students who have more of one and less of the other, or students who have lower levels of both? Two additional variables were significant predictors in the first-year models of engineering employment and engineering graduate school plans. These are intrinsic behavioral motivation and URM status. First-year students with high intrinsic behavioral motivation are significantly more likely to be thinking about an engineering job, a finding that complements a similar relationship among seniors between engineering employment and intrinsic psychological motivation. First-year URM students are significantly more likely than are non-URM students to consider engineering graduate school. Interestingly, among seniors of comparable backgrounds, there is no URM/non-URM difference. Why might this difference narrow over time? How can we better capitalize on this interest? It is also interesting to note other variables that had no or weak predictive power in any of the four senior or two first-year models. Such is the case with parental, social good, and mentor motivation. It is also the case with frequency of interaction and satisfaction with instructors, and with engineering extracurricular participation and research. However, while these variables did not uniquely predict post-graduation plans (in fully adjusted models), they may be significant for students who are selecting an engineering major to begin with, or in students’ overall outlook on college. How these various factors influence different groups may be important to identify as well; for example, in Chapter 6 we saw that mentor motivation to study engineering was greater for women than for men. This underscores the importance of examining interaction effects in future work.

Exploring the Engineering Student Experience 106
Table 11.12 Statistical Significance of Independent Variables in the Four Senior and Two First-Year Models
Student-Level Independent Variables
Seniors EngJob
Seniors EngGS
Senior NonEngJob
Seniors NonEngGS FY EngJob FY EngGS
Gender: Male ns ns ns ns ns nsRacial/Ethnic Background: URM ns ns ns ns ns ***(+)Mother's Education ns ns ns ns ns n/aFamily Income ns ns ns ns *(-) nsFinancial Motivation ***(+) ns ns ns ns **(-)Parental Influence Motivation **(-) ns * (+) ns **(-) nsSocial Good Motivation ns ns ns * (+) ns nsMentor Influence Motivation
* (-) ns ns ns ns nsIntrinsic Psychological Motivation ***(+) **(+) **(-) ***(-) **(+) **(+)Intrinsic Behavioral Motivation * (+) ns ns ns *** nsExposure to Engineering Profession ***(+) ns ***(-) ns n/a n/aAcademic Involvement: Engineering ***(+) ns *(-) *(-) n/a n/aFrequency of Interaction with Instructors ns ns ns ns ns nsFrequency of Engineering Extracurricular Participation ns **(+) **(-) ns n/a n/aResearch Experience ns *(+) ns ns n/a n/aFrequency of Non-engineering Extracurricular Participation ns ns ***(+) ns ns **(-)Self-reported Gains in Knwoledge of Engineering Since Entering College ** (+) ns ns ns n/a n/aGPA on 100 Point Scale **(-) ***(+) ns ns n/a n/aSatisfaction with Instructors ns *(+) ns ns n/a n/aConfidence in Math and Science Skills ns **(+) *(-) ns ns ** (+)Confidence in Professional and Interpersonal Skills ***(-) ***(-) ***(+) ***(+) ns nsPerceived Importance of Professional and Interpersonal Skills ** (+) **(+) ns ns n/a n/a (+) or (-) indicates a positive or negative relationship between independent and dependent variables, respectively. Highlight indicates independent variable that will be discussed in Section 11.3. *** p<.001, **p<.01, *p<.05, ns=not significant, n/a=not applicable

Exploring the Engineering Student Experience 107
11.3 Detailed Description of Findings from the Models We now present a more detailed description of the predictors that are significant at p<.001 in at least one model, summarizing their patterns and directions of effects across models4. These variables are among the strongest predictors in a given model. How do they operate within and across models? Do they operate suggestively and consistently towards engineering and away from non-engineering? Because we describe the results of the final models with all variables entered, we essentially discuss the “effect” of a given variable while holding all other variables constant, i.e., its “net predictive power” among students of comparable backgrounds. However, we also examine the simple correlations between independent and dependent variables where appropriate, in order to identify once-significant relationships that have been explained away by other variables with more powerful unique effects. By looking at simple correlations, we are further able to triangulate the findings and implications from one model with those from another so as to identify overall trends in post-graduation plans. It is important to remember that students’ plans may not be mutually exclusive; as described earlier, students are often considering multiple options that span engineering and non-engineering fields. Therefore, in our discussion of these models, we focus on predictive patterns across models that inform our understanding of which college experiences and student characteristics might increase or decrease the likelihood of “leaning towards” engineering overall. In other words, are there predictors across the models that consistently point toward engineering options and away from non-engineering options? Findings across models are assessed to triangulate and validate an emerging profile of “engineering persisters.” In the discussion below we examine senior model predictors, and then first-year model predictors, treating each group (and the patterns therein) separately, but making connections across them to create a broader picture of engineering plans and pathways and how relationships might change over time. The predictors for discussion—student characteristics, experiences, and environments of interest—include:
Senior Models: • Confidence in Professional/Interpersonal Skills • Intrinsic Psychological Motivation • Exposure to the Engineering Profession • Financial Motivation • Academic Involvement: Engineering • GPA
4 For the purpose of this discussion, we use the significance of the t-statistic (which is the unstandardized regression coefficient divided by its standard error) to “pull out” predictors; p<.001 is a stringent cut-off in part driven by the nested nature of our dataset, as described in Appendix IV. However, we also evaluate both unstandardized and standardized regression coefficients, as well as confidence intervals and simple correlation coefficients (Pearson’s r), to contextualize significance and interpret the practical size of effects. Moreover, we are interested in overall trends (experiences or characteristics that move students towards or away from engineering in totality) in addition to significance at p<.001. For instance, if the standardized coefficient for a predictor has a large absolute value but reaches significance at p<.01 in one model, and p<.001 in other models, in consistent directions, we treat this as fairly compelling evidence of an “overall trend”.

Exploring the Engineering Student Experience 108
• Extracurricular Participation: Non-Engineering Activities First-Year Models:
• Intrinsic Behavioral Motivation • URM Status
Senior student models
Table 11.13 Independent Variable: Confidence in Professional/Interpersonal Skills
***p<.001 (highlighted), **p<.01, *p<.05, ns=not significant
Confidence in professional/interpersonal skills (Table 11.13) is the only independent variable to have unique predictive power across all four senior models at p<.001, with a very consistent directional pattern: it is a positive predictor of plans for non-engineering work and non-engineering graduate school, and a negative predictor of plans for engineering work and engineering graduate school. In other words, among seniors with comparable background characteristics and college experiences, those with higher levels of professional/interpersonal confidence are more likely to consider non-engineering work after graduation; they are also more likely to consider a graduate program in a non-engineering field. By contrast, they are less likely than their peers to consider engineering work after graduation; and they are less likely to consider engineering graduate school. If students with stronger leadership, business, and social self-concepts are seeing non-engineering options in their future more so than are students who do not rate themselves highly in these areas, and therefore are less likely to consider post-graduate engineering options, what are the implications for the engineering workforce? Moreover, is it reasonable to suggest that other career options—business, law, and the like—are simply pulling these highly confident students towards more diverse applications of engineering skills, or is engineering, as it is currently conceived and practiced, actually pushing these students away?
Conf. Prof/Interp. b=
CI-lower
CI-upper S.E.= Beta= t= p
EngJob -0.059 -0.091 -0.027 0.016 -0.121 -3.606 ***NonEngJob 0.010 0.005 0.015 0.002 0.140 3.874 ***EngGradSch -0.018 -0.023 -0.013 0.003 -0.233 -6.836 ***NonEngGradSch 0.018 0.013 0.023 0.003 0.239 6.611 ***

Exploring the Engineering Student Experience 109
Table 11.14 Independent Variable: Intrinsic Psychological Motivation
***p<.001 (highlighted), **p<.01, *p<.05, ns=not significant Seniors who possess higher levels of intrinsic psychological motivation to study engineering—e.g., they “feel good” when they are doing engineering work, they think engineering is “fun”—are more likely to consider engineering work after graduation. These students are less likely, by contrast, to consider attending a graduate program in a non-engineering field. This pattern is replicated in the remaining two models, albeit reaching significance at p<.01; students who derive personal satisfaction from doing engineering work are more likely to consider engineering graduate school, and are less likely to consider a non-engineering job. Thus, greater intrinsic psychological motivation appears to characterize those students who are leaning towards engineering (and away from non-engineering) when thinking about their future career paths. The pattern is the exact opposite of that for confidence in professional/interpersonal skills, when other variables are controlled for; the simple correlation between these two measures is positive but small (r=.069, p<.05).
Table 11.15 Independent Variable: Exposure to the Engineering Profession
***p<.001 (highlighted), **p<.01, *p<.05, ns=not significant Exposure to professional engineering workplaces and projects emerges as a significant predictor in two of the four models: it is a positive predictor of plans for engineering work, and a negative predictor of plans for non-engineering work after graduation. Thus, above and beyond the characteristics that might bring students to these types of experiences in the first place, the experience itself—in the form of an internship, paid position, or co-op—may well reinforce and even build interest in engineering practice, and in doing so, help students rule out non-engineering employment options. Put differently, exposure to the field might cement an engineering focus. Alternately, perhaps students who identify less with engineering do not avail themselves of these types of professional experiences, hence the negative relationship between exposure and plans for non-engineering work. We note that this variable has no unique predictive power in models of students’ graduate school plans, whether inside or outside of engineering; that is, students’ graduate school aspirations may develop somewhat independently of internships and co-ops.
Intri. Psych. b=CI-
lowerCI-
upper S.E.= Beta= t= pEngJob 0.070 0.034 0.107 0.019 0.188 3.780 ***NonEngJob -0.008 -0.014 -0.003 0.003 -0.154 -2.896 **EngGradSch 0.008 0.002 0.014 0.003 0.136 2.701 **NonEngGradSch -0.012 -0.018 -0.006 0.003 -0.209 -3.913 ***
Exposure b=CI-
lowerCI-
upper S.E.= Beta= t= pEngJob 1.339 0.798 1.880 0.276 0.170 4.860 ***NonEngJob -0.165 -0.247 -0.082 0.042 -0.147 -3.923 ***EngGradSch -0.003 -0.087 0.082 0.043 -0.002 -0.059 nsNonEngGradSch 0.031 -0.060 0.121 0.046 0.025 0.664 ns

Exploring the Engineering Student Experience 110
Table 11.16 Independent Variable: Financial Motivation
***p<.001 (highlighted), **p<.01, *p<.05, ns=not significant Among students with comparable demographic and academic backgrounds, financial motivation is a relatively strong positive predictor of plans to work in an engineering job after graduation. It has no unique predictive power in the three remaining models, and, in fact, has weak or non-significant simple correlations with each of these dependent variables. Studying engineering as a means to a well-paying job, therefore, plays a salient role in students’ engineering-specific career plans, but is unrelated to other kinds of career plans and the likelihood of attending graduate school. Put differently, the role of financial motivation in pointing students towards or away from engineering overall is unclear.
Table 11.17 Independent Variable: Academic Involvement: Engineering Courses
***p<.001 (highlighted), **p<.01, *p<.05, ns=not significant Students who are involved in their engineering coursework—attending all scheduled courses, turning in assignments on time, turning in assignments that reflect their “best work”—are more likely to consider an engineering job after graduation than are students with higher rates of academic truancy and disengagement. Involvement in engineering coursework has a much weaker but opposite (negative) relationship with plans for non-engineering work and non-engineering graduate school. Thus, lower levels of involvement in engineering classes might characterize students who are looking ahead towards other options; higher levels of involvement might signal students who are more invested in engineering. The simple correlation between academic involvement: engineering and plans to attend engineering graduate school is significant and positive (r=.130, p<.001), but this relationship disappears once other variables enter the model. It is interesting that academic involvement: engineering does not, in the end, carry much unique weight in these regressions. In other words, it is less a driver per se, and more of a correlate of other driving characteristics like intrinsic psychological motivation (r=.098, p<.01).
Fin. Motivation b=CI-
lowerCI-
upper S.E.= Beta= t= pEngJob 0.047 0.027 0.067 0.010 0.146 4.589 ***NonEngJob 0.000 -0.003 0.003 0.002 0.005 0.134 nsEngGradSch -0.001 -0.004 0.002 0.002 -0.024 -0.750 nsNonEngGradSch -0.001 -0.004 0.002 0.002 -0.020 -0.587 ns
Academic Involvement b=
CI-lower
CI-upper S.E.= Beta= t= p
EngJob 0.047 0.022 0.072 0.013 0.118 3.711 ***NonEngJob -0.005 -0.008 -0.001 0.002 -0.083 -2.421 *EngGradSch 0.002 -0.002 0.006 0.002 0.029 0.913 nsNonEngGradSch -0.005 -0.009 0.000 0.002 -0.073 -2.137 *
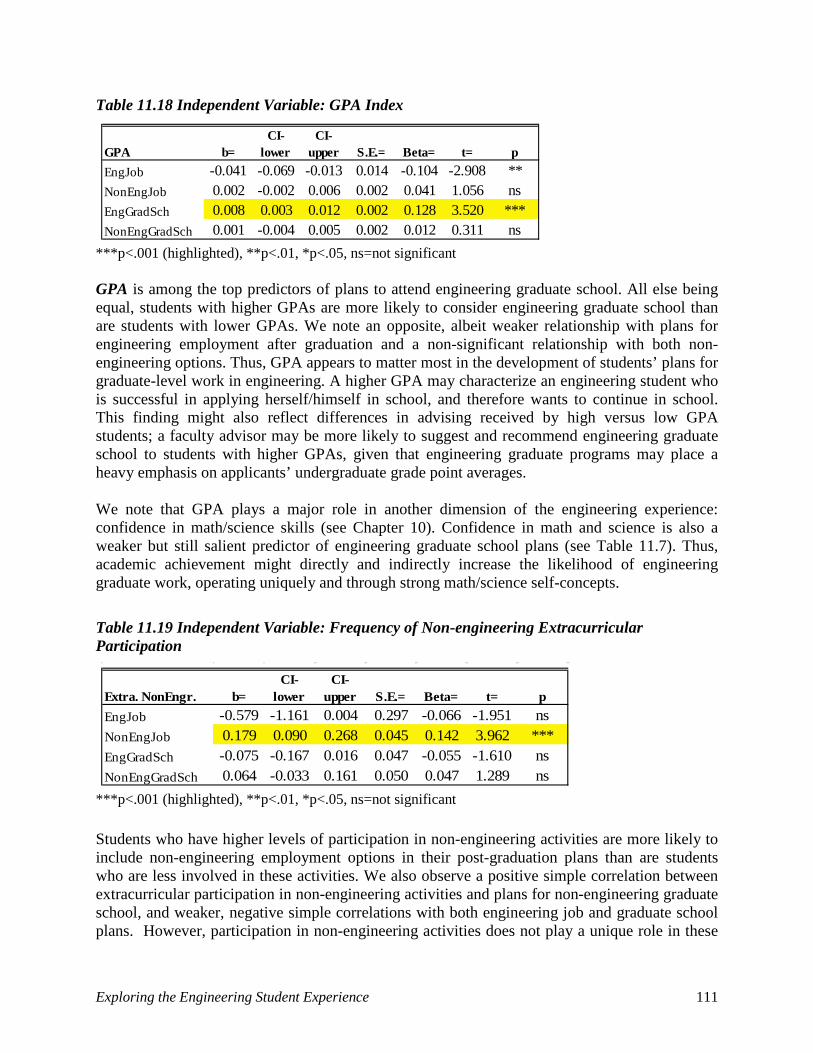
Exploring the Engineering Student Experience 111
Table 11.18 Independent Variable: GPA Index
***p<.001 (highlighted), **p<.01, *p<.05, ns=not significant GPA is among the top predictors of plans to attend engineering graduate school. All else being equal, students with higher GPAs are more likely to consider engineering graduate school than are students with lower GPAs. We note an opposite, albeit weaker relationship with plans for engineering employment after graduation and a non-significant relationship with both non-engineering options. Thus, GPA appears to matter most in the development of students’ plans for graduate-level work in engineering. A higher GPA may characterize an engineering student who is successful in applying herself/himself in school, and therefore wants to continue in school. This finding might also reflect differences in advising received by high versus low GPA students; a faculty advisor may be more likely to suggest and recommend engineering graduate school to students with higher GPAs, given that engineering graduate programs may place a heavy emphasis on applicants’ undergraduate grade point averages. We note that GPA plays a major role in another dimension of the engineering experience: confidence in math/science skills (see Chapter 10). Confidence in math and science is also a weaker but still salient predictor of engineering graduate school plans (see Table 11.7). Thus, academic achievement might directly and indirectly increase the likelihood of engineering graduate work, operating uniquely and through strong math/science self-concepts.
Table 11.19 Independent Variable: Frequency of Non-engineering Extracurricular Participation
***p<.001 (highlighted), **p<.01, *p<.05, ns=not significant Students who have higher levels of participation in non-engineering activities are more likely to include non-engineering employment options in their post-graduation plans than are students who are less involved in these activities. We also observe a positive simple correlation between extracurricular participation in non-engineering activities and plans for non-engineering graduate school, and weaker, negative simple correlations with both engineering job and graduate school plans. However, participation in non-engineering activities does not play a unique role in these
GPA b=CI-
lowerCI-
upper S.E.= Beta= t= pEngJob -0.041 -0.069 -0.013 0.014 -0.104 -2.908 **NonEngJob 0.002 -0.002 0.006 0.002 0.041 1.056 nsEngGradSch 0.008 0.003 0.012 0.002 0.128 3.520 ***NonEngGradSch 0.001 -0.004 0.005 0.002 0.012 0.311 ns
Extra. NonEngr. b=CI-
lowerCI-
upper S.E.= Beta= t= pEngJob -0.579 -1.161 0.004 0.297 -0.066 -1.951 nsNonEngJob 0.179 0.090 0.268 0.045 0.142 3.962 ***EngGradSch -0.075 -0.167 0.016 0.047 -0.055 -1.610 nsNonEngGradSch 0.064 -0.033 0.161 0.050 0.047 1.289 ns

Exploring the Engineering Student Experience 112
three models, while controlling for all other variables. It is possible that students with lower levels of engineering interest seek out these kinds of activities during college, and/or these activities reinforce waning interest in a career path that includes engineering options only, thereby introducing students to more diverse applications of engineering knowledge. As noted earlier, more research is needed to probe these types of activities more deeply. What is it about the experience that pulls students (who are perhaps “ready” to be pulled) towards non-engineering areas? To what extent do students who are frequently involved in non-engineering activities (and later, non-engineering careers) still find their engineering skills and backgrounds useful? We also note that participation in non-engineering extracurricular activities was a major predictor of professional/interpersonal confidence among first-year and senior students (see Chapter 10, Section 10.2). Thus, a nexus of non-engineering activities during college, non-engineering plans post-graduation, and confidence in professional/interpersonal skills seems to emerge from these data, where strong social confidence and participation in activities outside of engineering programs may reinforce one another over time with the net result being a higher level of interest in non-engineering careers at the point of graduation. Disentangling “cause and effect” is not possible with our data; it is likely that professional/interpersonal confidence and non-engineering involvement act uniquely, jointly, and simultaneously in the development of students’ plans. First-year student models Table 11.20 Independent Variable: Intrinsic Behavioral Motivation
***p<.001 (highlighted), **p<.01, *p<.05, ns=not significant Although intrinsic psychological motivation is a positive predictor of plans to pursue engineering employment among first-year students, as it is among seniors, intrinsic behavioral motivation is actually the stronger predictor of the two in this model, holding all other variables constant. Perhaps this is unsurprising given that first-year students might think about engineering, and link it to future plans, in more concrete terms (e.g., “I like building, therefore I would like to continue doing engineering work after graduation”). Intrinsic behavioral motivation is positively correlated with plans for engineering graduate work among first-year students as well, but carries less unique predictive power in this model (net controls).
Intri. Behavioral b=
CI-lower
CI-upper S.E.= Beta= t= p
EngJob 0.059 0.031 0.087 0.014 0.197 4.168 ***EngGradSch 0.004 -0.001 0.008 0.002 0.082 1.696 ns

Exploring the Engineering Student Experience 113
Table 11.21 Independent Variable: URM Status
***p<.001 (highlighted), **p<.01, *p<.05, ns=not significant URM status emerges as a positive predictor of first-year students’ plans to attend a graduate program in engineering, even after controlling for other variables in the model, including both school and student-level characteristics, which explain a significant proportion of variance in the dependent variable. That is, first-year URM students are significantly more likely than are their non-URM peers to consider engineering graduate work, all else being equal. Notably, the simple correlation between URM status and plans to attend engineering graduate school is also positive among seniors (r=.154, p<.001), but the correlation coefficient is smaller than it is among first-years, and the relationship loses significance over the course of the regression, i.e., there are no URM/non-URM differences in engineering graduate school plans among seniors of comparable backgrounds. Indeed, none of our demographic variables have unique predictive power in any of our four senior models. In other words, among senior engineering majors, academic and extracurricular experiences, self-perceptions, and attitudes towards engineering are more directly related to future plans than are demographic characteristics. However, these relationships might depend on students’ gender, socioeconomic background, racial/ethnic background, and so on; we begin to explore these interactions below.
Do top senior predictors vary by gender? A look at interaction effects For every regression analysis of students’ post-graduation plans, a follow-up regression was conducted to examine possible interaction effects between statistically significant predictors (p<.001) and gender, after controlling for the 20 institutional dummy variables and main effects. Few interaction terms were significant, and of those that were, none reached significance at p<.001. Of those that were significant:
• The interaction between gender and GPA was statistically significant in the senior model of engineering graduate school plans (b=.010, SE=.004, t=2.738, p<.01). This indicates that the positive relationship between GPA and plans to attend an engineering graduate program may be stronger for men than for women.
• The interaction between gender and intrinsic psychological motivation was statistically significant in the senior model of plans to attend non-engineering graduate school (b=.007, SE=.003, t=2.137, p<.05). This indicates that the negative relationship between psychological motivation to study engineering and plans to attend a non-engineering graduate program may be stronger for women than for men.
While suggestive, these interactions should be interpreted cautiously. These analyses controlled for institutional dummy variables, main effects of gender and the “top predictors,” and interactions between gender and “top predictors,” excluding all other control variables. Future
URM Status b=CI-
lowerCI-
upper S.E.= Beta= t= pEngJob -0.583 -1.373 1.581 0.519 -0.042 -1.123 nsEngGradSch 0.406 0.180 0.632 0.115 0.159 3.523 ***

Exploring the Engineering Student Experience 114
analyses might examine the significance of these interaction effects in a fully adjusted model (i.e., after controlling for these other variables). Moreover, it is possible that other, weaker predictors might interact with gender, which could shed light on gender differences in patterns of persistence through the engineering pipeline. Subsequent research will address these interactions (and other two- and three-way interactions) in full.
Additional thoughts on demographic (non-)variation in post-graduation plans As noted, among the variables with weak to no predictive power in the senior models are all four of the demographic variables (gender, URM status, mother’s education, and family income). This means that any observed relationship between each of these measures and the dependent variable is explained by differences in college experiences and environments. As the simple correlations suggest, these variables are often weakly related to the dependent variables to begin with, indicating that men and women, URM students and non-URM students, and students from varying socioeconomic backgrounds have a similar range of ideas and plans for their future regardless of variations in environments or experiences. This might be expected among a sample of students who have all declared engineering majors four or five years into college (and are close to graduation). Sorting and (self-) selection mechanisms of entry into engineering programs and the types of career options that are available to engineering majors can reduce variation in plans by gender, minimize differences by URM status, and so on. Nonetheless, those demographic variations that do persist and influence future plans perhaps indirectly, e.g., students who report higher family incomes tend to have higher levels of social confidence, which in turn characterizes those seniors who are may be thinking more expansively about post-graduation options than are others, must be investigated more deeply. These include the variations that we have traced throughout this report (Chapters 5-11). The questions for educators are: why should demographic variations and interactions exist at all, and what do these patterns mean for future members of the engineering workforce?
11.4 Findings: Students’ Post-Graduation Plans and What Contributes to Them The aim of this chapter was to explore engineering students’ post-graduation plans: how many are planning on engineering work, how many are thinking about non-engineering graduate school, are they considering multiple options, which factors might indicate a student’s direction, and so on. The chapter started by describing students’ responses to four questions about employment plans (in engineering and non-engineering jobs) and graduate school plans (in engineering and non-engineering fields). We examined our data by gender, academic standing, and URM status. We then went on to develop regression models in order to see which demographic characteristics and educational experiences might be significant predictors of a particular direction. Below we summarize key findings and their implications for practice, drawing from both the descriptive work in Section 11.1 and the regression models in Section 11.2 to present a series of pictures of students’ post-graduation plans.

Exploring the Engineering Student Experience 115
Post-graduation directions: Most seniors positive on engineering jobs In the APPLES sample, approximately 80 percent of seniors say “yes” to engineering work, while 20 percent are unsure or leaning away. The fact that such a high percentage reports plans to enter the type of work their degree aims to prepare them for is reassuring, and we note that this number is consistent with prior research (Sheppard & Silva, 2001). At the same time, we wonder why 20 percent of seniors intending to finish an engineering degree are either turning away from a future in engineering or remain unsure. What fraction of these students have long planned to use engineering as a stepping stone or a means to enter another field, such as medicine, law, or business? How many of these students have been “turned off” by engineering along their academic pathways, never really got energized about engineering, or were not able to obtain an engineering job offer they were excited about? Although our data provide a window into the characteristics and experiences of students who are less likely to say “yes,” in response to these questions future research must address these issues in greater depth, with greater specificity. Understanding why students who have committed four (or more) years of college to engineering ultimately walk away from the field, and responding with well-designed programs aimed at retention, will be critical to build up and strengthen the next generation of the engineering workforce. Notable for this discussion, our regression models suggest that one particular college experience may be particularly influential in students’ job decisions: exposure to professional engineering environments through co-ops and internships. All things being equal, those students who report more exposure to such environments are more likely to be looking towards engineering employment after graduation. While those students who are less interested in engineering may intentionally avoid co-op and internship experiences, we should also consider the possibility that had these students actually participated in an internship, their career decisions may have been swayed. This is a possibility that merits exploration in future longitudinal research.
Post-graduation directions: Forty percent considering engineering graduate work The percentage of students planning on engineering graduate school remains constant at 40 percent among first-year students and seniors. In contrast, students not planning to pursue engineering graduate school increases from 19.2 percent among first-years to 31.1 percent among seniors (this increase is balanced by a decline in “unsures”). Between first and senior years, a significant number of students may be ruling out engineering graduate school. We found that among seniors, the top predictors of engineering graduate school plans are GPA and intrinsic psychological motivation, and the top negative predictor is confidence in professional and interpersonal skills. Research experience weakly predicts engineering graduate school plans, whereas exposure to the profession, academic involvement, and frequency of interaction with instructors have no unique predictive power. Are students, by the time they reach their senior year, gaining a more realistic view of themselves in relationship to engineering graduate school? Or are they excited to leave school, enter the engineering work world, and begin earning an income?

Exploring the Engineering Student Experience 116
Post-graduation directions: Seniors still unsure and have a combination of plans While the proportion of seniors who are “unsure” about their plans to enter into engineering work is only 8.4 percent, approximately one-quarter of seniors are “unsure” about their plans related to engineering graduate school, and non-engineering jobs or graduate school. In other words, one in four seniors is uncertain about how these options might fit into his or her future. This is to be expected of students as they enter their “odyssey years,” defined as the decade of wandering and exploration that frequently occurs between adolescence and adulthood (Brooks, 2007). We also need to recognize that current students, who are often described as the “Net Generation” or “Millennials (Oblinger & Oblinger, 2005; Pew Research Center, 2010) , engage differently in not only their education, but also their futures as compared to prior generations (see Chubin, et al., 2008). As seniors, many are still figuring out their interests, what job opportunities are out there, and what new opportunities might emerge. A question for those who advise these students and design the programs and infrastructures that support their education is: Are we equipping students with the necessary tools and skills to productively question, define, and navigate their professional pathways? About one-third of seniors have an “engineering-only” focus when looking ahead. Upwards of 60 percent of them are considering some combination of engineering and non-engineering jobs and/or graduate school. This may be because some are still defining their paths and are leaving options open (and per above, have a fair degree of uncertainty about what’s next), while others may have a defined path that incorporates work inside and outside of engineering. Additional exploration is needed to better understand how students conceptualize their engineering education in relation to multifaceted or “hopscotch” pathways beyond college. We also note that seniors, as a group relative to first year students, are broadening their career interests. This may reflect today’s professional reality: students no longer have the luxury of setting their sights solely on one career path.
The faces of tomorrow’s professionals: URM graduate school plans Notably, engineering graduate school plans differ between URM and non-URM students. Among first-years, URM students express significantly more interest in attending engineering graduate school than do non-URM students (65.3% vs. 37.8%), and URM status is a predictor of engineering graduate school plans in a fully adjusted regression model. By senior year, proportionately more URM students still include engineering graduate school in their future plans, but URM status is no longer a statistically significant predictor when other measures are controlled. What is behind these differences and trends? How are higher levels of professional/interpersonal confidence and lower GPAs of senior URM women (as described in Chapters 8 and 10) coming into play? How do differences in socioeconomic status figure into the picture (particularly when recalling the differences between URM and non-URM students described in Chapter 9)? And why isn’t increased interest in engineering graduate school among URM seniors translating into actual graduate school enrollment, since a gap remains between the proportions of URM students in undergraduate and graduate engineering programs? How can we better capitalize on high levels of interest among prospective URM majors in the first college year?

Exploring the Engineering Student Experience 117
Also important is the finding that more senior URM students than senior non-URM students (67.3% versus 56.3%) are considering multiple options that span engineering and non-engineering. Not only does this suggest that URM students may have broader interests but the engineering profession may need to work harder to retain these individuals among its ranks.
The faces of tomorrow’s professionals: Women’s plans are similar to men’s, but… Similar percentages of women and men are planning on engineering work and graduate school. However, men are slightly more likely to focus on engineering pathways only (when looking at all combinations of plans), while women are considering non-engineering options at a slightly higher rate (more importantly, gender differences in non-engineering plans do not persist after controlling for other background characteristics and college experience measures). Further work is needed to understand not only how students conceptualize their future careers in specific terms, but how these conceptualizations might vary by gender, particularly given the few numbers of women in the engineering profession. Do differing conceptions of one’s own talents, options, and abilities, combined with differing perceptions of and experiences in the field of engineering itself, translate into selecting out of certain professional environments early on? Findings from the NSF-funded Project On Women Engineers’ Retention (POWER): A Research Survey for Women Engineers should contribute to our understanding of these issues (http://www.nsfpower.org/index.html). Key factors in plans Among the college experience, motivational, and demographic variables we explored in relation to post-graduation plans, two stood out in all four senior models: intrinsic psychological motivation and confidence in professional and interpersonal skills. Considering how these two variables relate to students’ post-graduation plans brings to light new ways of looking at student pathways, as will be discussed in Chapter 12. Intrinsic psychological motivation: This variable is statistically significant in all four of our senior regression models. It positively predicts interest in engineering options, and negatively predicts interest in non-engineering options. This makes sense: individuals who are excited by engineering want to keep doing engineering. Where does psychological interest and motivation come from? What can K-12 education, communities, and families do to promote enjoyment in engineering thinking? How might engineering be conceptualized and practiced in ways that invite certain groups in? Confidence in professional and interpersonal skills: This variable is also significant in all senior models, but the direction of its effect is opposite that of intrinsic psychological motivation. How might confidence in professional/interpersonal skills and the perceived importance of these skills in engineering interact? All else being equal, perceived importance of these skills is a positive predictor of plans for engineering employment and graduate school (p<.01), while confidence is a negative predictor, even as the two measures are positively correlated (see Chapter 10). Is the negative relationship between social confidence and engineering plans stronger among students who do not ascribe importance to these skills in engineering work? In addition, if students with lower professional and interpersonal confidence are more likely to pursue engineering, how does this continue to promote stereotypes of engineers and engineering

Exploring the Engineering Student Experience 118
work, and how does it reinforce the types of work that engineers actually do? Does this limit the adaptability and capacity of engineering in new social and global contexts?

Exploring the Engineering Student Experience 119
Chapter 12: A different way to look at students Chapter 11 demonstrates that, all else being equal, seniors who have higher levels of psychological motivation to study engineering are more likely to lean towards engineering options and less likely to lean towards non-engineering options post-graduation. Moreover, seniors who have higher levels of professional and interpersonal confidence are less likely to lean towards engineering options and more likely to lean towards non-engineering options post-graduation. The engineering profession, in other words, may draw students who have strong engineering identities, but also students who have lower levels of confidence in business, communication, and leadership skills. It may be losing students who enjoy engineering less on an intrinsic level, and those students who see themselves as strong communicators and leaders. This has led us to wonder how these two important dimensions work together in the context of career plans, and college experiences more generally: • Are students with high levels of psychological motivation and low levels of professional and
interpersonal confidence more likely to consider engineering paths than are students with low levels of psychological motivation and high levels of professional and interpersonal confidence? In other words, do the findings from our regression models hold when we look at discrete combinations of characteristics?
• What are the post-graduation plans of students with high levels of both psychological motivation and confidence in professional and interpersonal skills? How are their educational experiences similar to or different from those of other students?
• What are the post-graduation plans of students with low levels of both psychological motivation and confidence in professional and interpersonal skills? How are their educational experiences similar to or different from those of other students?
To address these questions, we examined differences and similarities between seniors in each of four groups (high levels of psychological motivation and low levels of professional/interpersonal confidence, high levels of psychological motivation and high levels of professional/interpersonal confidence, and so on—see Table 12.1). This four-group framework provides a new lens through which to envision and map the engineering student landscape. As this chapter will show, we can gain new insights into the college experience by categorizing students along these dimensions, and identify ways that educational practice can be improved to better prepare future engineers. Table 12.1 The Four Groups Defined
Group Number
Group label
Intrinsic Psychological
Motivation (M)
Confidence in Professional/
Interpersonal Skills (C)
1 M/C At or above mean At or above mean
2 M/c At or above mean Below mean
3 m/C Below mean At or above mean
4 m/c Below mean Below mean

Exploring the Engineering Student Experience 120
12.1 Group Demographics In developing this new framework, we first assessed how many seniors in our dataset are both highly (or not highly) psychologically motivated and confident in their professional and interpersonal skills, and how many are high on one measure but low on the other. We used the senior mean on each of these variables as the cut-off points to create our four groups (mean=79.63, SD=21.38, N=1100 for intrinsic psychological motivation [M] and mean=69.47, SD=16.51, N=1127 for professional and interpersonal skills confidence [C]; Table 12.1 shows how groups were calculated using the cut-off points). As listed in Table 12.2, APPLES seniors are distributed fairly equally across groups. Table 12.2 also shows that the proportion of women varies little by group with one exception: women comprise a greater proportion of students in Group 4 as compared with Group 3 (p<.01). There are proportionally more underrepresented racial/ethnic minority (URM) students in Groups 1 and 2 (the two groups with at or above-average psychological motivation) as compared with Groups 3 and 4 (the two groups with below average psychological motivation). Students in Group 3 report higher family income as compared to students in Groups 2 and 4. Students in Group 1 fall in the middle of this family income spectrum. (For the one-way ANOVA of family income by group, no pairs of means are significantly different at p<.001, although the overall F test is significant at p<.001.) Table 12.2 Demographic Characteristics of the Motivation/Confidence Groups
Group Label M mean [1]
C Mean [2]
Number of APPLES Seniors
% Women [3]
% URM [4]
Mean Family Income [5]
1 M/C 95.9 83.1 310 28.1 26.1 2.03 2 M/c 95.2 56.4 269 27.9 23.4 1.94 3 m/C 61.9 82.4 252 25.0 14.9 2.28 4 m/c 61.7 54.9 267 36.0 11.2 1.95
[1] F (3, 1094) = 601.552, p<.001 [2] F (3, 1094) = 762.160, p<.001 [3] Chi-square (3, N = 1090) = 8.079, p<.05 [4] Chi-square (3, N = 998) = 24.084, p<.001 [5] F (3, 1075) = 6.460, p<.001 Table 12.3 summarizes differences in group distribution by URM status for women and men separately. Non-URM senior men are equally distributed across the four groups, whereas non-URM women are slightly more likely to be found in Group 4. Both URM women and men have a much stronger presence in Groups 1 and 2 than in Groups 3 and 4.

Exploring the Engineering Student Experience 121
Table 12.3 Distribution of Seniors by Motivation/Confidence Groupings, URM Status, and Gender
Women [1] Men [2]
Group Label Non-URM URM Non-URM URM
1 M/C 24.8% 35.6% 26.5% 40.3% 2 M/c 21.7% 30.1% 23.7% 29.4% 3 m/C 19.6% 19.2% 26.0% 16.8% 4 m/c 33.9% 15.1% 23.9% 13.4% 100% 100% 100% 100%
[1] Chi-square (3, N=303) = 10.722, p<.05 [2] Chi-square (3, N=693) = 16.097, p<.01 Percentages may not add to 100% due to rounding. We explored the distribution of majors across groups and found that seniors in Groups 3 and 4 are almost five times as likely as the seniors in Group 2 to major in Industrial Engineering (IE) (13.1% and 12.4% versus 2.6%, respectively, p<.001). Even seniors in Group 1 (8.4%) are more likely to be in IE than are those in Group 2 (p<.01). Future research will explore differences and similarities among students by group and major to assess if and how field of engineering study plays into the group patterns that we describe below. We also investigated the possibility of significant between-school differences in the distribution of seniors across groups. At every institution, the cross-tabulation of M Low/High by C Low/High was statistically non-significant (p>.05)1.
12.2 Key Variables by Group We now consider how our four groups differ from one another with respect to the study’s key variables, anticipating that these differences may give us insights into how the college experience varies for students beyond such demographic “markers” as gender, URM status, and academic standing. These insights might also highlight improvements to educational practice that are otherwise hidden. We were selective about which variables to focus on in this preliminary exploration of the engineering landscape, initially looking at those variables that had predictive power in the four models of seniors’ post-graduation plans (Chapter 11) and/or in the model of seniors’ professional and interpersonal confidence (Chapter 10). As shown below, grouping seniors by psychological motivation and professional/interpersonal confidence seems to have some traction; on virtually every variable, one or more of the groups is significantly different from the others.
1 It is important to keep in mind that some institutions have small student samples when we look at seniors only. In addition, we used a conservative continuity correction to assess the significance of the associations for these 2x2 cross-tabulations. When looking at the less conservative Pearson’s chi-square, the cross-tabulation at one of the 21 schools reaches significance at p<.05. Future research will examine more closely the school-level contexts and effects among the larger samples of seniors and juniors.

Exploring the Engineering Student Experience 122
In the presentation below, we start with a summary of group differences across the variables in our study. We then create a profile of students in each group based on these differences. Within each group, we look at how mean scores compare with the overall senior average, and characterize the students in a group as being “above,” “below,” or “at” the senior average. We also note when means are at the endpoints of the range, referring to the “top” or “bottom” scores. After presenting these summative profiles, we provide more detailed analyses of group means, variable-by-variable, for interested readers.
Group 1 (M/C): The High Involvement Group The seniors in Group 1, the High Intrinsic Psychological Motivation, High Professional/Interpersonal Confidence Group (M/C), are consistently at the top of the range on measures of extracurricular participation and knowledge of engineering. (Extracurricular participation includes both engineering and non-engineering activities, as well as co-op, internship and research experiences; knowledge of engineering consists of self-reported gains in knowledge and perceived importance of key engineering skills.) These students are among the most highly motivated and carry the highest mean scores on intrinsic behavioral motivation, social good motivation, and mentor motivation. They have the highest level of faculty interaction, and are at the top of the range on confidence in math and science skills. Given these high levels of participation in multiple aspects of engineering and collegiate life, these students are described as the High Involvement Group.
Group 4 (m/c): The Low Involvement Group The seniors in Group 4, the Low Intrinsic Psychological Motivation, Low Professional/Interpersonal Confidence Group (m/c), are consistently at the bottom of the range on measures of extracurricular participation and knowledge of engineering. These students are among the least motivated (when looking at measures of intrinsic behavioral, social good, and mentor motivation), report interacting less with faculty than do students in other groups, and have the lowest level of confidence in their math and science skills. Given their low level of participation, these students are described as the Low Involvement Group.
Group 2 (M/c): The Average Involvement, Engineering Focused Group The seniors in Group 2, the High Intrinsic Psychological Motivation, Low Professional/Interpersonal Confidence Group (M/c), report average engineering extracurricular participation and knowledge of engineering (again, “average” denotes proximity to the “grand mean” among all seniors). They report interacting with faculty at the average level, and have average levels of math/science confidence. These students are among the most motivated, with scores on measures of intrinsic behavioral and social good motivation on par with those among Group 1 students. Given their average level of participation and high level of motivation to study engineering, we refer to these students as the Average Involvement, Engineering Focused Group.
Group 3 (m/C): The Average Involvement, Non-Engineering Focused Group The seniors in Group 3, the Low Intrinsic Psychological Motivation, High Professional/Interpersonal Confidence Group (m/C), are near the mean on extracurricular participation, except in the case of non-engineering extracurricular activities, where they are at the top of the range. They also report average knowledge of engineering (except for below-

Exploring the Engineering Student Experience 123
average scores on perceived importance of math/science skills), average interaction with faculty, and average math/science confidence. These students are among the least motivated to study engineering (when looking at intrinsic behavioral, social good, and mentor measures), similar to students in Group 4. Given their average level of engineering participation, high level of participation on non-engineering activities, and low level of motivation to study engineering, these students are described as the Average Involvement, Non-Engineering Focused Group. Table 12.4 Characterizing the Motivation/Confidence Groups
Group Number
Group Label
Group Characterization
1 M/C High involvement
2 M/c Average involvement: engineering focused
3 m/C Average involvement: non-engineering focused
4 m/c Low involvement
The group profiles: What they might tell us about engineering seniors Table 12.4 summarizes the way we have characterized each group based on distinct patterns in mean scores. The emergent picture is that students in Groups 1 and 4 are “polar opposites” on many measures. Students in Group 1 are highly involved with engineering and non-engineering activities outside of the classroom, are more motivated to study engineering, and are more confident in both their professional/interpersonal and math/science skills. They appear to be developing a multifaceted, broad understanding of engineering work. In contrast, students in Group 4 are less involved with engineering and non-engineering activities, less motivated, and less confident. However, we note that on certain course-related measures—GPA, academic involvement in engineering classes, and sense of curricular overload—students in Groups 1 and 4 are similar. Thus, students in Group 4 (relative to those students in Group 1) may be hard for faculty to spot, since they do not differentiate themselves based on these “routine” academic characteristics. On many measures, students in Groups 2 and 3 are between students in Groups 1 and 4. They report average involvement in their engineering courses and extracurricular activities, and average interaction with instructors. However, these two groups also have important distinctions. Looking at motivation in the aggregate, students in Group 2 are highly motivated to study engineering, whereas those in Group 3 are less so. Students in Group 3 are heavily involved in non-engineering activities, more so than are students in Groups 2 and 4. Later in this chapter, we will see what some of the consequences of these variations may be. Mean differences by group: Detailed findings Now we turn to a detailed presentation of differences by group. For most analyses, we ran one-way ANOVAs to examine the means by group. Using post hoc comparisons, we examined which pairs of means were significantly different at p<.001 (Table 12.5). Where appropriate, we

Exploring the Engineering Student Experience 124
examined frequencies instead of means, and examined differences by way of chi-squares and z-tests for independent proportions (again using p<.001 as our guide for reporting and discussion unless otherwise noted). The following tables highlight where differences are statistically significant with the numbers at the top of the range of scores indicated in bold, and numbers at the bottom of the range are underlined. Table 12.5 The Coursework Experience
On average, students have similar levels of involvement in their engineering coursework regardless of group (no pairs of means are significantly different at p<.05, although the overall F statistic is significant at p<.05) (see Table 12.5). At the same time, students in Group 4—those students with lower levels of both psychological motivation and professional/interpersonal confidence—report lower levels of interaction with instructors than do students in Group 1 and Group 2. Table 12.6 Out-of–Classroom Activities
Senior Mean
M/C: Group 1
M/c: Group 2
m/C: Group 3
m/c: Group 4 F Statistic
Frequency of Interaction with Instructors 44.7 50.5 45.2 44.0 37.1 F (3,1086)=20.461, p<.001 [1]
Academic Involvement - Engineering 65.6 67.8 66.8 63.8 63.6 F (3,1081)=3.208, p<.05 [2]
[1] Groups 1, 2 > Group 4 [2] None significantly different
Variable mean scores are presented on a scale of 0-100.
Senior Mean
M/C: Group 1
M/c: Group
2
m/C: Group
3
m/c: Group
4 F StatisticFrequency of Engineering Extracurricular Participation 40.7 46.0 41.7 40.7 33.3 F (3,1091)=7.304, p<.001 [1]
Frequency of Non-engineering Participation 73.3 78.0 68.0 80.0 67.0 F (3,1091)=13.596, p<.001 [2]
Exposure to the Engineering Profession 67.7 75.0 65.3 71.3 58.7 F (3,1092)=12.699, p<.001 [3]
[1] Group 1 > Group 4[2] Groups 1, 3 > Groups 2, 4[3] Group 1 > Groups 2, 4
Variable mean scores presented on a scale of 0-100.

Exploring the Engineering Student Experience 125
Table 12.7 Research Experience (percentages)
As noted in Tables 12.6 and 12.7, Group 4 students report lower levels of participation in extracurricular engineering and non-engineering activities, lower levels of exposure to co-op and internship experiences, and fewer engineering research experiences than do students in one or more other groups. Indeed, just over one-third of the students in Group 4 report participating in engineering research, versus over 50 percent of students in all other groups (Table 12.7). By contrast, Group 1 students have generally higher levels of activity than do students in every other group, and the difference is always significantly greater relative to Group 4. Groups 2 and 3 are similar on three of the four activities listed in Tables 12.6 and 12.7; they differ on frequency of participation in non-engineering activities, with Group 3 students reporting significantly higher levels of involvement in this area. Students across the four groups report similar GPAs and sense of curricular overload. In terms of overall satisfaction, students in Group 1 are the most satisfied with their college experience, and those in Group 4 are the least satisfied (Table 12.8). Table 12.8 Overall Outcomes of College
Senior Mean
M/C: Group
1M/c:
Group 2
m/C: Group
3
m/c: Group
4 Chi-squareResearch Experience
49.2 58.1 50.8 52.0 35.7 Chi-square=30.108 (df=3), p<.001 [1]
[1] Groups 1, 2, 3 > Group 4
Senior Mean
M/C: Group
1
M/c: Group
2
m/C: Group
3
m/c: Group
4 F StatisticGPA Index 68.2 69.6 68.3 67.6 67.0 F (3,1087)=.923, p>.05 [1]Overall Satisfaction
71.3 77.3 72.3 71.3 63.7 F (3,1080)=18.5, p<.001 [2]
Curricular Overload 53.6 53.8 53.6 51.9 54.2 F (3,1088)=.691, p>.05 [1]Variable mean scores presented on a scale of 0-100.[1] None[2] Groups 1, 2 > Group 4

Exploring the Engineering Student Experience 126
Table 12.9 Motivation to Study Engineering
Turning to differences in motivation by group (Table 12.9), not only do students in Groups 1 and 2 have higher levels of psychological motivation than do students in Groups 3 and 4, they also have higher levels of behavioral and social good motivation to study engineering (recall the inter-correlations among these motivation measures in Chapter 6). Levels of financial and parental motivation are comparable across all four groups. Mentor motivation is significantly higher among Group 1 students as compared to Group 4 students. Table 12.10 Self-reported Gains in Knowledge of Engineering Since Entering College
Students in Groups 2 and 3 report similar gains in knowledge of engineering practice since matriculating college (Table 12.10). Group 1 students report greater gains (relative to Groups 2 and 3 students), whereas students in Group 4 report fewer gains (relative to Groups 2 and 3 students). This puts Groups 1 and 4 students at the opposite ends of the range for self-rated knowledge acquisition.
Senior Mean
M/C: Group 1
M/c: Group
2
m/C: Group
3
m/c: Group
4 F StatisticIntrinsic Psychological 79.6 95.9 95.2 61.9 61.7 F (3,1094)=601.552, p<.001 [1]Intrinsic Behavioral 83.8 94.2 93.8 73.1 71.4 F (3,1080)=101.129, p<.001 [1]Social Good 74.3 86.7 84.8 62.6 61.1 F (3,1091)=131.476, p<.001 [1]Financial 65.2 65.4 62.3 66.8 67.4 F (3,1086)=2.145, p>.05 [2]Mentor Influence 36.4 42.4 37.4 35.8 29.4 F (3,1067)=12.002, p<.001 [3]Parental Influence 13.8 11.7 14.0 15.3 14.4 F (3,1092)=1.162, p>.05 [2]Variable mean scores presented on a scale of 0-100.[1] Groups 1, 2 > Groups 3, 4[2] None[3] Group 1 > Group 4
Senior Mean
M/C: Group
1
M/c: Group
2
m/C: Group
3
m/c: Group
4 F StatisticSelf-reported Gains in Knowledge of Engineering Since Entering College
82.7 90.0 82.3 82.0 74.7 F (3,1093)=31.935, p<.001 [1]
Variable mean scores presented on a scale of 0-100.[1] Group 1 > Groups 2, 3, 4; Groups 1, 2, 3 > Group 4

Exploring the Engineering Student Experience 127
Table 12.11 Perceived Importance
Students in Groups 1 and 2 ascribe high importance to math and science skills in professional engineering practice. Students in Group 1 are particularly likely to view math/science skills as important relative to students in Groups 3 and 4 (Table 12.11). Students in Groups 1 and 3 ascribe high importance to professional and interpersonal skills, especially as compared to students in Group 4. Also noteworthy is that Group 1 students tend to place more importance on professional and interpersonal skills in engineering than do students in Group 2. Table 12.12 Confidence
Looking at confidence in math/science skills (Table 12.12), students in Groups 1 and 2 have comparable levels of confidence, and these students tend to have higher levels of math/science confidence than do students in Group 4. Students in Group 1 have greater confidence than do those in Group 3 as well. Differences in professional/interpersonal confidence between groups are inherent to this landscape.
Senior Mean
M/C: Group
1
M/c: Group
2
m/C: Group
3
m/c: Group
4 F StatisticPerceived Importance of Math/Science Skills
79.7 84.4 80.9 75.7 77.4 F (3,1093)=12.824, p<.001 [1]
Perceived Importance of Professional/ Interpersonal Skills
66.5 72.4 64.8 66.8 60.8 F (3,1094)=22.55, p<.001 [2]
Variable mean scores presented on a scale of 0-100.[1] Group 1> Groups 3,4[2] Group 1> Groups 2, 4; Group 3 > Group 4
Senior Mean
M/C: Group
1
M/c: Group
2
m/C: Group
3
m/c: Group
4 F StatisticConfidence in Math/Science Skills 72.4 77.7 73.0 70.6 67.1 F (3,1093)= 20.182, p<.001 [1]
Confidence in Professional/ Interpersonal Skills 69.5 83.1 56.4 82.4 54.9 F (3,1094)= 762.160, p<.001 [2]
Variable mean scores presented on a scale of 0-100.[1] Group 1 > Groups 3, 4[2] Groups 1, 3> Groups 2, 4

Exploring the Engineering Student Experience 128
12.3 Post-Graduation Plans by Motivation/Confidence Groupings In Chapter 11, we explored the post-graduation plans of seniors—how many were considering engineering options, non-engineering options, multiple options, as well as how many were unsure about their plans. We also considered variations in plans by gender and URM status. In the current section, we explore these questions as they might relate to students’ psychological motivation and confidence in professional and interpersonal skills through our four-group framework. We ran three types of analyses to explore the post-graduation plans of students in the groups. Below, we describe each set and related findings.
1. Frequency of responses to the four post-graduation options listed on the survey. We examined the percentage of students who are considering each of the four post-graduation options by group. The results are listed in Table 12.13. Several things are striking about these results:
• While there is a proportional range of students who are considering engineering work across groups (72.2% to 91.1%), even the 72.2 percent indicates a large number of students who are including engineering employment as part of their post-graduation plans. A similar percentage is not opting for engineering graduate school; the percent answering “probably/definitely yes” varies by over a factor of 2, ranging from 24.6 percent in Group 3 to 58.7 percent in Group 2.
• For each of the four post-graduation options, Group 2 and Group 3 are on the opposite ends of the range. The largest percentage of students who are considering engineering work and graduate school are found in Group 2; the largest percentage of students who are considering non-engineering work and graduate school are found in Group 3. The fact that these two groups are so very different on post-graduation plans contrasts with patterns in their respective collegiate and engineering experiences. As noted in Section 12.2, Groups 2 and 3 have average engineering involvement, interaction with faculty, and math/science confidence. One important exception is participation in non-engineering activities (Group 3>Group 2, p<.001); another is the difference in motivation levels (with Group 2 trending towards higher levels, and Group 3, towards lower levels).
• On plans to pursue non-engineering work and to attend engineering or non-engineering graduate school, roughly 25 percent of students in any group marked “unsure.” The percent marking “unsure” regarding engineering work is considerably less, ranging from 6.3 percent (Group 2) to 12 percent (Group 4).

Exploring the Engineering Student Experience 129
Table 12.13 Post-Graduation Plans of Seniors by Group (percentages)
2. A regression model. We ran an ordinary least squares regression analysis on plans for engineering work (EngJob) to test the “effect” of being in one group versus another (see Table 12.14). We selected Group 2—students with high levels of psychological motivation and low levels of professional/interpersonal confidence—as our reference group for students in Groups 1, 3, and 4. For this regression, all variables (except, of course, intrinsic psychological motivation and confidence in professional/interpersonal skills) were identical to those in Table 11.5 (Chapter 11); we entered our three dichotomous group variables in the final model, holding all other variables constant. All else being equal, seniors in Groups 1 and 3 are less likely to plan on engineering work after graduation as compared to seniors in Group 2 (albeit these effects reach significance at p<.01 only); there is no statistical difference between seniors in Groups 2 and 4. Thus, despite generally higher percentages of students in both Groups 1 and 2 who report considering engineering employment (see Table 12.13), once college experiences are controlled for—those factors that are often common to students in both groups—seniors in Group 1 may be less likely than their peers in Group 2 to consider engineering employment as a “definite.” The difference between students in Groups 2 and 3 is perhaps unsurprising given their opposite patterns in Table 12.13.
Percent among
all seniors
M/C: Group
1
M/c: Group
2
m/C: Group
3
m/c: Group
4
Is the overall chi-
square significant?
Probably/definitely not 7.1 2.6 17.9 11.6Unsure 6.5 6.3 9.9 12.0
Probably/definitely yes 81.9 86.5 91.1 72.2 76.4 ***
Probably/definitely not 49.0 56.5 34.5 45.3Unsure 24.2 27.1 27.4 27.7
Probably/definitely yes 26.6 26.8 16.4 38.1 27.0 ***
Probably/definitely not 27.1 16.4 50.0 34.1Unsure 25.5 24.9 25.4 32.6
Probably/definitely yes 42.0 47.4 58.7 24.6 33.3 ***
Probably/definitely not 43.2 56.7 28.2 44.6Unsure 21.9 27.2 23.4 31.1
Probably/definitely yes 30.5 34.8 16.0 48.4 24.3 ***
Plans to work in a non-engineering job
Plans to attend engineering graduate school
Plans to attend non-engineering graduate school
Plans to work in an engineering job

Exploring the Engineering Student Experience 130
Table 12.14 Senior Plans to Pursue Engineering Work After Graduation and the Role of Motivation/Confidence Groups: Student-Level Predictors at Final Model with All Variables Entered
NOTES: 1. This table shows regression coefficients for student-level variables in the final model (all
variables entered). Coefficients for 20 institutional dummy variables are not presented/are available upon request. R-square at Model 1 (with entry of institutional dummy variables) = .121, F=5.787 (20,838) p<.001.
2. Due to the skewed nature of the dependent variable, this item was recoded so that responses better approximated a normal distribution. An inverse normal transformation was applied to the midpoints of the cumulative percentages at or below successive response choices.
***p<.001, **p<.01, *p<.05
MeanStd. Dev. r b
Std. Error Beta t
Lower Bound
Upper Bound
DV: Plans to pursue engineering work (rescaled)
49.45 7.95
(Constant) 36.13 2.50 14.46 *** 31.23 41.03
Gender: Male 0.69 0.46 0.10 ** -0.02 0.58 0.00 -0.03 -1.15 1.11Racial/Ethnic Background: URM 0.20 0.40 0.09 ** -0.39 0.83 -0.02 -0.48 -2.02 1.23Mother's Education 3.12 1.64 -0.12 *** -0.04 0.16 -0.01 -0.26 -0.36 0.27Family Income 2.07 1.00 -0.13 *** -0.36 0.27 -0.05 -1.32 -0.90 0.18Financial Motivation 66.56 24.74 0.19 *** 0.04 0.01 0.13 4.09 *** 0.02 0.06Parental Influence Motivation 14.03 24.18 -0.11 *** -0.03 0.01 -0.10 -3.24 ** -0.05 -0.01Social Good Motivation 75.66 22.25 0.17 *** 0.01 0.01 0.03 0.72 -0.02 0.04Mentor Influence Motivation 37.71 26.02 -0.04 -0.02 0.01 -0.06 -1.95 -0.04 0.00Intrinsic Behavioral Motivation 83.84 23.15 0.29 *** 0.05 0.01 0.15 4.01 *** 0.03 0.08Exposure to Engineering Profession 2.08 1.01 0.19 *** 1.25 0.28 0.16 4.51 *** 0.71 1.80Academic Involvement: Engineering 65.81 19.97 0.20 *** 0.05 0.01 0.12 3.80 *** 0.02 0.07Frequency of Interaction with Instructors
45.16 20.94 0.09 ** 0.01 0.01 0.03 0.92 -0.01 0.04
Frequency of Engineering Extracurricular Participation
1.24 0.99 -0.01 -0.05 0.26 -0.01 -0.18 -0.57 0.47
Engineering Research 0.50 0.50 -0.04 -0.74 0.51 -0.05 -1.45 -1.74 0.26Frequency of Non-engineering Extracurricular Participation
2.22 0.90 -0.11 ** -0.62 0.30 -0.07 -2.10 * -1.21 -0.04
Self-reported Gains in Knowledge of Engineering Since Entering College
2.51 0.58 0.21 *** 1.30 0.47 0.09 2.79 ** 0.39 2.21
GPA on 100 Point Scale 68.24 20.22 -0.06 -0.04 0.01 -0.10 -2.88 ** -0.07 -0.01Satisfaction with Instructors 64.36 21.05 0.07 * 0.00 0.01 0.00 0.05 -0.02 0.03Confidence in Math and Science Skills 72.53 17.10 0.12 *** 0.03 0.02 0.07 2.09 * 0.00 0.06Perceived Importance of Professional and Interpersonal Skills
67.06 17.51 0.17 *** 0.04 0.01 0.09 2.83 ** 0.01 0.07
Group 1: High psychological, high professional/interpersonal 0.29 0.45 0.07 * -2.05 0.68 -0.12 -3.03 ** -3.38 -0.72
Group 3: Low psychological, high professional/interpersonal 0.23 0.42 -0.16 *** -2.65 0.79 -0.14 -3.35 ** -4.20 -1.10
Group 4: Low psychological, low professional/interpersonal 0.23 0.42 -0.09 ** -1.22 0.78 -0.06 -1.55 -2.76 0.32
Reference group: Group 2
n=859R-square: .297Adjusted R-square: .260
95% Confidence Interval for b
Coefficients at Final Model
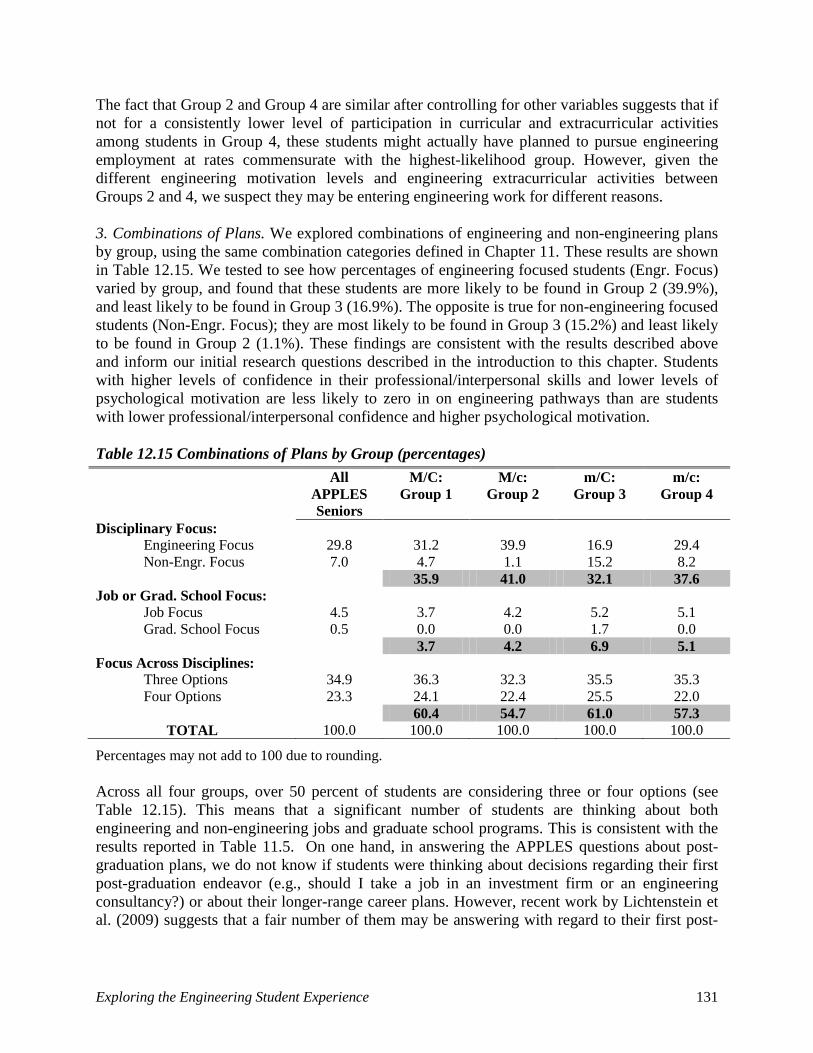
Exploring the Engineering Student Experience 131
The fact that Group 2 and Group 4 are similar after controlling for other variables suggests that if not for a consistently lower level of participation in curricular and extracurricular activities among students in Group 4, these students might actually have planned to pursue engineering employment at rates commensurate with the highest-likelihood group. However, given the different engineering motivation levels and engineering extracurricular activities between Groups 2 and 4, we suspect they may be entering engineering work for different reasons. 3. Combinations of Plans. We explored combinations of engineering and non-engineering plans by group, using the same combination categories defined in Chapter 11. These results are shown in Table 12.15. We tested to see how percentages of engineering focused students (Engr. Focus) varied by group, and found that these students are more likely to be found in Group 2 (39.9%), and least likely to be found in Group 3 (16.9%). The opposite is true for non-engineering focused students (Non-Engr. Focus); they are most likely to be found in Group 3 (15.2%) and least likely to be found in Group 2 (1.1%). These findings are consistent with the results described above and inform our initial research questions described in the introduction to this chapter. Students with higher levels of confidence in their professional/interpersonal skills and lower levels of psychological motivation are less likely to zero in on engineering pathways than are students with lower professional/interpersonal confidence and higher psychological motivation. Table 12.15 Combinations of Plans by Group (percentages) All
APPLES Seniors
M/C: Group 1
M/c: Group 2
m/C: Group 3
m/c: Group 4
Disciplinary Focus: Engineering Focus 29.8 31.2 39.9 16.9 29.4 Non-Engr. Focus 7.0 4.7 1.1 15.2 8.2
35.9 41.0 32.1 37.6 Job or Grad. School Focus:
Job Focus 4.5 3.7 4.2 5.2 5.1 Grad. School Focus 0.5 0.0 0.0 1.7 0.0
3.7 4.2 6.9 5.1 Focus Across Disciplines:
Three Options 34.9 36.3 32.3 35.5 35.3 Four Options 23.3 24.1 22.4 25.5 22.0
60.4 54.7 61.0 57.3 TOTAL 100.0 100.0 100.0 100.0 100.0
Percentages may not add to 100 due to rounding. Across all four groups, over 50 percent of students are considering three or four options (see Table 12.15). This means that a significant number of students are thinking about both engineering and non-engineering jobs and graduate school programs. This is consistent with the results reported in Table 11.5. On one hand, in answering the APPLES questions about post-graduation plans, we do not know if students were thinking about decisions regarding their first post-graduation endeavor (e.g., should I take a job in an investment firm or an engineering consultancy?) or about their longer-range career plans. However, recent work by Lichtenstein et al. (2009) suggests that a fair number of them may be answering with regard to their first post-

Exploring the Engineering Student Experience 132
graduation endeavor. If so, there is still considerable flux in career pathways even on the eve of graduation.
Using the characterization labels defined in Table 12.4, we summarize students’ post-graduation plans by group below:
Group 2 (M/c): The Average Involvement, Engineering Focused Group The highest percentages of students planning on an engineering job and engineering graduate school are found in Group 2 (91.1% and 58.7%, respectively, Table 12.13). In addition, this group has the highest percentage of students who are engineering-only focused (39.9%), and the lowest percentages of students planning on non-engineering work or graduate school (16.4% and 16.0%, respectively, Table 12.13). Students in this group, with high motivation to study engineering, and large numbers reporting engineering work and graduate school plans, seem to be on an engineering career trajectory. This group has a relatively high percentage of both URM women and men students (30.1% and 29.4%, respectively, Table 12.3).
Group 3 (m/C): The Average Involvement, Non-Engineering Focused Group The highest percentages of students planning on a non-engineering job and non-engineering graduate school are found in Group 3 (Table 12.13). In addition, this group has the highest percentage of students who are non-engineering-only focused (15.2%, Table 12.15) and the lowest percentages of students planning on engineering work or graduate school. The regression results (Table 12.14) are consistent with these findings: all things being equal, students in this group are less likely to lean towards engineering work relative to students in Group 2. Another distinguishing feature of this group, particularly relative to Group 2, is that students report the highest perceived family income (Table 12.2), suggesting some SES distinction between groups (although we note mother’s and father’s educations are not different across the groups [data not presented in this chapter] and income is only one dimension of SES).
Group 1 (M/C): The High Involvement Group The percentages of students planning on engineering work or engineering graduate school in Group 1 are slightly lower than those in Group 2, but slightly higher than those in Group 3. At the same time, the percentages of Group 1 students planning on non-engineering work or graduate school are slightly higher than are those in Group 2, and slightly lower than those in Group 3. Collectively, this suggests that students in Group 1 are thinking more broadly about their post-graduation options than students in Group 2 (more engineering focused) and Group 3 (more non-engineering focused). According to our regression modeling, all things being equal, students in this group will be less likely to lean towards engineering work relative to students in Group 2. This is of concern for the engineering workforce on at least two fronts. First, these students combine both interest in engineering with confidence in professional and interpersonal skills, a highly desirable combination of attributes that engineering needs. Second, this group has a higher representation of URM students, a population that remains underrepresented in engineering. That Group 1 students would turn away from engineering work (relative to Group 2) should give us pause—why would these particularly talented students be less likely to consider this pathway?

Exploring the Engineering Student Experience 133
Group 4 (m/c): The Low Involvement Group Like students in Group 1, these students fall between Group 2 and Group 3 in their post-graduation plans. We might apply the same interpretation to this as we did with Group 1 students, namely that Group 4 students are thinking broadly about their post-graduation options. However, given the relatively low level of motivation these students exhibit to study engineering, we might alternately interpret this as signaling that these students are not particularly excited or energized about their post-graduation plans. Our regression modeling shows that, all things being equal, students in this group will tend to behave similarly to those in Group 2 with regard to pursuing an engineering job. 12.4 Implications for Practice: Developing Professional Skills and Career Plans We now consider the implications for educational practice as suggested by the group-based differences in college experiences and post-graduation plans. How can engineering education be improved given what we have learned?
Learning to see oneself in engineering Our findings indicate those who are most confident in their professional and interpersonal skills (students in Groups 1 and 3) are less likely to head towards engineering work once we take into account various other activities. However, employers increasingly say that these skills are critical for success in today’s engineering workplace given engineering’s emergence as a social and technical activity. What actions can programs, professional societies, and industry take to better enable more engineering students to see how their skills can be utilized and valued in the engineering workforce? Are students, through their classroom, extra-curricular, and co-curricular activities, able to develop a realistic understanding of how technical and professional skills come into play in making engineering work happen? Are they able to develop a picture of how their skills can be brought to bear in engineering work?
Professional and interpersonal skill development We placed seniors with below-average confidence in professional and interpersonal skills in Groups 2 and 4; these groups account for about 50 percent of our senior sample. These students also tend to attribute lower levels of importance to such skills in engineering work. All else being equal, these students are considering engineering employment more so than are students in Groups 1 and 3. How can programs help all students develop confidence in these critical professional and interpersonal skills, as well as an appreciation for these skills? Would more involvement in engineering and non-engineering extra-curricular activities be useful for some students? How can we help students see the connections between activities inside and outside of the classroom that emphasize or utilize communications skills, their development of these abilities, as well as their confidence in them? What role might SES play in the development of students’ social confidence, and how might engineering programs address gaps in confidence-building experiences?

Exploring the Engineering Student Experience 134
Heading away from engineering While the overall percentage of seniors focused exclusively on non-engineering endeavors in their post-graduate plans is only seven percent, we know little about why these seniors are heading towards non-engineering options after investing in an intensive undergraduate engineering education. If it is because they see engineering problem-solving as a skill that makes them better prepared for graduate work or employment in other areas, we might be pleased. If, on the other hand, students are focusing on non-engineering endeavors because their engineering studies have disillusioned them about engineering, then we should work to understand and mitigate the sources of disillusionment. Are seniors who are exclusively non-engineering focused seeing engineering as a means to an end, or are they searching out other options because they have discovered that engineering is not for them? Or perhaps they have discovered during their undergraduate studies another employment sector that is more attractive, where they can still use or leverage their engineering skills? Longitudinal research, drawing from additional data on campus recruiting patterns, students’ course-taking patterns, the nature of faculty members’ professional backgrounds and advising, and so on, is needed to explore these pathways and choices more fully.
Helping students think through multiple options Our data show that many seniors across all four groups are considering both engineering and non-engineering options as part of their post-graduation plans. How are students getting advice and input on how well various options fit their interests, talents and goals? Who is providing them with input about how to put together a career plan that might include, over its 20 to 30 year span, jobs inside and outside of engineering? Are students being challenged to think adaptively (particularly in hard economic times) about what their professional life might look like? How might academic programs, career centers, professional societies, and even employers better support students who are planning their career trajectories?
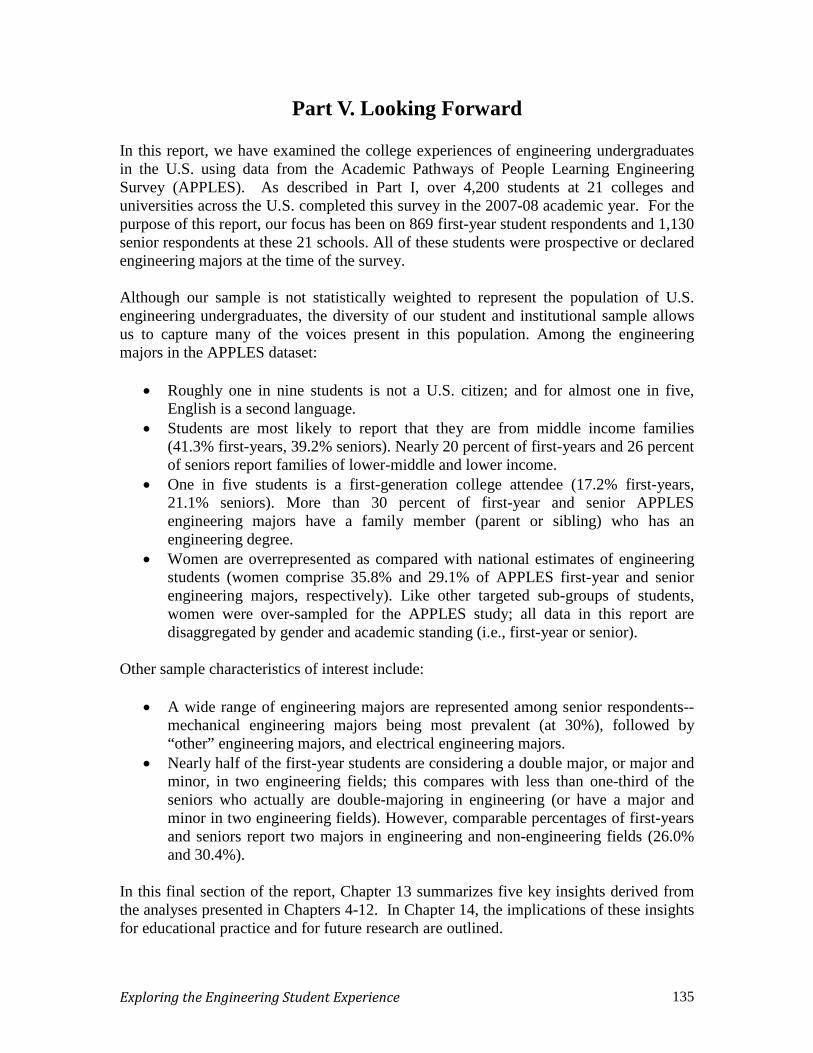
Exploring the Engineering Student Experience 135
Part V. Looking Forward
In this report, we have examined the college experiences of engineering undergraduates in the U.S. using data from the Academic Pathways of People Learning Engineering Survey (APPLES). As described in Part I, over 4,200 students at 21 colleges and universities across the U.S. completed this survey in the 2007-08 academic year. For the purpose of this report, our focus has been on 869 first-year student respondents and 1,130 senior respondents at these 21 schools. All of these students were prospective or declared engineering majors at the time of the survey. Although our sample is not statistically weighted to represent the population of U.S. engineering undergraduates, the diversity of our student and institutional sample allows us to capture many of the voices present in this population. Among the engineering majors in the APPLES dataset:
• Roughly one in nine students is not a U.S. citizen; and for almost one in five, English is a second language.
• Students are most likely to report that they are from middle income families (41.3% first-years, 39.2% seniors). Nearly 20 percent of first-years and 26 percent of seniors report families of lower-middle and lower income.
• One in five students is a first-generation college attendee (17.2% first-years, 21.1% seniors). More than 30 percent of first-year and senior APPLES engineering majors have a family member (parent or sibling) who has an engineering degree.
• Women are overrepresented as compared with national estimates of engineering students (women comprise 35.8% and 29.1% of APPLES first-year and senior engineering majors, respectively). Like other targeted sub-groups of students, women were over-sampled for the APPLES study; all data in this report are disaggregated by gender and academic standing (i.e., first-year or senior).
Other sample characteristics of interest include:
• A wide range of engineering majors are represented among senior respondents--mechanical engineering majors being most prevalent (at 30%), followed by “other” engineering majors, and electrical engineering majors.
• Nearly half of the first-year students are considering a double major, or major and minor, in two engineering fields; this compares with less than one-third of the seniors who actually are double-majoring in engineering (or have a major and minor in two engineering fields). However, comparable percentages of first-years and seniors report two majors in engineering and non-engineering fields (26.0% and 30.4%).
In this final section of the report, Chapter 13 summarizes five key insights derived from the analyses presented in Chapters 4-12. In Chapter 14, the implications of these insights for educational practice and for future research are outlined.


Exploring the Engineering Student Experience 136
Chapter 13: Five key takeaways
In the prior chapters of this report, we considered what APPLES could tell us about the educational experiences of first-year and senior women and men studying engineering (Chapter 5). We also explored what motivates these students to choose engineering (Chapter 6), how they report learning about engineering (Chapter 7), and what their post-graduation plans look like (Chapter 11). We examined how gender, underrepresented racial/ethnic minority (URM) status, and socioeconomic status (SES) might affect the engineering college experience (Chapters 8 and 9). Each of these chapters ended with a short summary that references specific findings. If the prior chapters were about “studying the trees,” this chapter is about “describing the forest” of an engineering education. The five key insights described below draw upon and connect the detailed analyses presented in prior chapters, and aim to develop a wide-angle view of critical aspects of the engineering student experience.
13.1 Key Insight #1: Primary Interest Comes From Within Engineering students are principally studying engineering because they are psychologically and behaviorally motivated by the subject, and because they see that engineers can affect social good. They are also motivated by the perceived financial rewards of engineering work (though its strength is less than that of the other three). Mentors and parents are far less influential motivators, though we note that mentors are a stronger motivational source for women than for men. (Chapter 6) These sources of motivation appear to be similar among first-year students and seniors, suggesting that students’ motivations to pursue engineering may take shape early in their educational experience. There is, however, evidence to suggest that motivation may be reinforced by certain college experiences such as frequency of interaction with instructors, involvement in extracurricular engineering activities, and engineering co-op and internship experiences. There is also evidence that the strength of some motivational factors varies across sub-fields within engineering. Multivariate regression models indicate that motivation is linked to measures of engineering and non-engineering job and graduate school plans even after controlling for other variables that might shape students’ perceived pathways. Students with higher financial and psychological motivation to study engineering are more likely to consider engineering work post-graduation, and students with higher psychological motivation are more likely to consider engineering graduate school. Perhaps unsurprisingly, low psychological motivation predicts post-graduation plans in non-engineering fields (Chapter 11). Simple correlations indicate that high levels of psychological motivation are linked to intention to complete an engineering major among first-year students (Chapter 6).

Exploring the Engineering Student Experience 137
13.2 Key Insight #2: Learning About Engineering Linked to Multiple Sources Students report learning about engineering from multiple sources; nearly three out of four seniors identify work-related experiences—co-op, internships, employment—as a source, and two out of three identify school-related experiences. All else being equal, these work-related experiences are strongly linked to having post-graduation plans that include an engineering job (and conversely, we see low exposure to the profession connected to post-graduation plans in non-engineering work). With regard to school-related experiences, we found that such items as frequency of interaction and satisfaction with instructors (and, to a smaller extent, exposure to team-based projects) are correlated with self-reported gains in engineering knowledge for both first-year and senior men. Extracurricular involvement also plays a role in the college experience; both first-year students and seniors ascribe a high level of importance to involvement in non-engineering extracurricular activities, and are more involved in these types of activities as compared with engineering extracurricular activities (Chapter 5). This non-engineering extracurricular involvement is particularly interesting in light of the finding that it is the strongest positive predictor of students’ confidence in professional and interpersonal skills in a multivariate regression model (involvement in engineering research and extracurricular activities are also significant but weaker predictors). (Chapter 10)
13.3 Key Insight #3: Professional and Interpersonal Skills Play Out in Surprising Ways Today’s technical work, where engineers increasingly interact with a variety of individuals from around the globe, demands well-developed professional and interpersonal skills. Therefore, our finding that engineering seniors are more confident in these types of social or “soft” skills than are first-year students is encouraging. (Chapter 10) At the same time, our findings suggest that engineering seniors are no more likely than are first-year students to ascribe importance to these skills in professional engineering work. And as noted above, confidence in these skills during students’ college years is more tightly tied to their involvement in non-engineering activities than engineering activities. (Chapters 7 and 10) We also found that among seniors of comparable demographic and academic backgrounds, those who are more confident in these skills are more likely to have plans for non-engineering work and/or graduate school, whereas those who are less confident often report seeking engineering work and/or graduate school . This pattern is of concern, as these are among the skills critically needed to successfully practice engineering. While it is true that confidence is not the same as competence, we would argue that confidence in these skills is a desired “meta-skill” itself. (Chapters 10 and 11)
Exploring the Engineering Student Experience 138
13.4 Key Insight #4: Intrinsic Psychological Motivation and Confidence in Professional and Interpersonal Skills—Two Telling Variables Using the top two predictors in our models of seniors’ post-graduation plans—intrinsic psychological motivation and confidence in professional/interpersonal skills—we created four groups of students which has emerged into a powerful framework within which to categorize and understand undergraduate engineering experiences (Chapter 12). Students who are highly confident in their professional/interpersonal skills and psychologically motivated are more involved in extracurricular activities, and in co-op, internships, and research experiences, than are other students. They are also more satisfied with college overall and report greater gains in knowledge since entering college. URM students are more likely to be in this group. These students are also more likely to lean away from engineering work in post-graduation planning as compared to students with high motivation but lower confidence. We do not know whether the confidence and motivation factors of this highly involved group of students propel them to be so involved, or whether their involvement builds and reinforces their confidence and motivation. Students in the low involvement group—students with lower levels of confidence in professional/interpersonal skills and lower levels of psychological motivation—are less active in extracurricular activities and report less interaction with faculty than the high involvement group. These less involved students may be more difficult for faculty to identify since their GPAs and levels of class/course involvement are similar to the high involvement group. The low involvement group’s less frequent interaction with faculty may also make them less visible to faculty instructors and advisors.
13.5 Key Insight #5: Demographics Matter—But How Much? On most APPLES measures, the experiences of women and men engineering students are similar. This may not be entirely unexpected, as those who choose to study engineering are a self-selected group, and by senior year they have shared many of the same environments and contexts (although we do not know if the full range of these experiences affect women and men in the same way). We do note, however, that compared to men, women are more involved in engineering and non-engineering extracurricular activities throughout their college career. They also express a greater level of curriculum overload. (Chapter 5) And while senior women and men report similar gains in engineering knowledge, senior men are more confident in their open-ended problem solving skills than are senior women. (Chapter 10) Many experiences measured on the APPLES instrument are similar for URM and non-URM students. Notable differences are in the areas of perceived importance of professional and interpersonal skills (with URM seniors ascribing more importance to these skills), and intrinsic psychological motivation (with URM senior men exhibiting more of this motivation than non-URM senior men). We see mostly similar levels of involvement in engineering (and non-engineering) extracurricular activities for URM and

Exploring the Engineering Student Experience 139
non-URM women, both as first-years and as seniors. In contrast, URM men are consistently more involved in engineering extracurricular activities than are non-URM men. We note that there are socioeconomic differences between the URM and non-URM students in the APPLES dataset; these need to be taken into account when explaining any variations by URM status. (Chapters 8 and 9) Men’s and women’s post-graduation plans are largely the same. However, men are more likely to be “engineering only” focused in these plans. URM and non-URM students are similar in post-graduation plans, except on plans to attend engineering graduate school. URM students express greater interest in this pathway than do non-URM students; among first-years, this difference holds even after controlling for other background measures, motivation measures, and academic experiences. (Chapter 11) Despite generally moderate demographic variation in our data, the few numbers of women and students of diverse racial/ethnic and socioeconomic backgrounds in engineering schools (and by extension, engineering work) suggest that there is something different about the attractiveness and/or the experience of engineering for these groups as compared with students in majority groups. Our data do not capture students’ perceptions of engineering prior to college, or even in the first semester of their first year, i.e., we do not know who selects out of an engineering major before college-level coursework begins. We also wonder if those few differences that do exist in our sample point to gaps or disparities that take on increasing salience over time.

Exploring the Engineering Student Experience 140
Chapter 14: Implications for practice and new questions
The findings derived from looking at APPLES’ first-year and senior students have implications for educational practice. They suggest ways that education might be changed in order to graduate students who are more confident in key skills, more knowledgeable about the profession for which they are being trained, and more committed to working in that profession. Our findings also suggest new research questions. The implications of our findings and future research directions are organized according to the five takeaways described in Chapter 13 and presented below.
14.1 Key Insight #1: Primary Interest Comes From Within
Implications for Educational Practice • Remembering that students are motivated to study engineering for a variety of
reasons/factors, consider how to capitalize on this in the classroom (by connecting to students’ enjoyment of thinking in engineering ways), in homework assignments (by engaging their interest in building and doing), and outside of the classroom (through mentoring relationships and extracurricular projects).
• Help students identify what excites them about engineering, and advise them in their planning for coursework, extracurricular activities and co-op/internship experiences that allow them to realize that excitement.
New Research Questions • How does motivation to study engineering influence various college experiences?
How do various college experiences support, sustain, or diminish motivation? Which demographic factors influence the motivation picture? Is there a developmental aspect to motivation?
• What is it about interactions with faculty and involvement in engineering extracurricular activities that reinforce certain types of motivation for some students?
• What is it about subfields within engineering that draw different types of students who are motivated in different ways? How are differences between subfields reinforced by differences between the people that populate them (and vice versa)?
• Thinking beyond the college setting, which activities and experiences motivate middle and high school students’ interests in engineering? To what extent must these activities and experiences create both intrinsic and extrinsic connections to engineering to be effective?
14.2 Key Insight #2: Learning About Engineering Linked to Multiple Sources
Implications for Educational Practice • Include experiences in the classroom that help students draw connections among
the various concepts they are learning, the range of courses they are taking, as well as among their coursework, extracurricular involvement, and work

Exploring the Engineering Student Experience 141
experiences. Challenge them to develop a more integrated understanding of how the component parts of engineering combine into engineering practice.
• Offer opportunities for students to see how varied engineering work can be (even though it draws from a finite set of core skills and ideas) as well as the diverse backgrounds of the individuals who practice engineering. These opportunities might include field trips or in-class guest speakers or panels.
New Research Questions • What factors do students consider in selecting which extracurrular activities to be
involved in? How do they connect these informal experiences with their in-class learning? How can schools of engineering incorporate and support well-designed extracurricular activities?
• Do students who are better able to connect ideas across courses and between school and work perform better in school? Is their transition to work easier?
• What characterizes significant and positive co-op and internship experiences?
14.3 Key Insight #3: Professional and Interpersonal Skills Play Out in Surprising Ways
Implications for Educational Practice • Consider how to better communicate to students through examples, homework
assignments, field trips, alumni guests, etc. the critical role that professional/interpersonal skills play in successful engineering practice.
• Design exercises and project assignments that provide students with multiple opportunities to practice and hone (with feedback) these critical professional/interpersonal skills.
New Research Questions • What is it about students’ perceptions of engineering that tends to draw students
who are less confident in their professional/interpersonal skills to engineering jobs? Why are those who are more confident drawn to non-engineering jobs?
• What contributes to the higher confidence in professional/interpersonal skills of URM women? What might this suggest for building confidence in students more generally?
• How are confidence in professional/interpersonal skills and involvement in specific types of non-engineering extracurricular activities related? What can we learn from these relationships that might suggest how to strengthen the impact of various engineering activities on professional/interpersonal confidence?
• What is it about family income that is related to confidence in professional and interpersonal skills?
• How are confidence and competence related?
Exploring the Engineering Student Experience 142
14.4 Key Insight #4: Intrinsic Psychological Motivation and Confidence in Professional and Interpersonal Skills—Two Telling Variables
Implications for Educational Practice • Consider how to draw out students who are less confident in their social skills and
less motivated to study engineering by challenging/advising/spurring them to consider how to combine circular and non-curricular experiences into their education.
New Research Questions • How might students who are highly motivated to study engineering and who are
less confident in their social skills gain more from their engineering extracurricular involvement? Are changes in how these students engage in these activities needed? Or is redesign/reorganization of the activities themselves required?
• For those students leaning away from engineering in their post-graduation plans and who are less motivated to study engineering and more confident in their professional/interpersonal skills, are they moving away from engineering or are they being drawn to something else they enjoy more?
14.5 Key Insight #5: Demographics Matter—But How Much?
Implications for Educational Practice • Consider offering a variety of extracurricular, co-op/internship and research
experiences for students, as well as creating an advising system that helps them match their interests to these activities.
• Provide students with a variety of models of engineers and engineering work, and ask them reflective questions that help them connect their interests, talents and dreams to engineering.
• Offer students encouragement and feedback; engineering education is hard work, and its pace and intensity can be overwhelming for some.
New Research Questions • How do gender, ethnicity/race and SES connect with regard to images and
perceptions of engineers and engineering work? In what ways do various images/perceptions influence the college experience? Do these images/perceptions affect post-graduation plans?
• How can we better prepare all of our students to assess their interests and skills, and enter the job market based on an increased awareness and more accurate self-assessment of who they are? How can students be introduced to reflective practices and career-planning strategies early on and throughout their college career?
• How does parental background affect interest in engineering employment and graduate study? Do engineering parents affect the academic pathways of their children? What is the nature of the relationship between SES and interest in engineering?

Exploring the Engineering Student Experience 143
• How do the post-graduation plans of engineering majors vary by major, institutional selectivity, and the major declaration process (i.e., whether students declare their major at time of college matriculation or after more exposure to the undergraduate engineering curriculum)?
• How many students who express interest in engineering graduate school actually go on to attend graduate school? What factors influence the transition to graduate work? Which supports facilitate attending graduate school?

Exploring the Engineering Student Experience 144
Part VI. References
ABET. (October 31, 2010). Criteria for accrediting engineering programs, Effective for evaluations during the 2010-2011 accreditation cycle. Baltimore, MD: ABET, Engineering Accreditation Commission. Retrieved August 1, 2010, from http://www.abet.org/Linked%20Documents-UPDATE/Criteria%20and%20PP/E001%2010-11%20EAC%20Criteria%201-27-10.pdf
Adelman, C. 1998. Women and men of the engineering path: A model for analyses of undergraduate careers. Washington, DC: U.S. Department of Education: National Institute for Science Education. American Society for Engineering Education. (2004, 2006). Engineering College Profiles and Statistics. Retrieved August 1, 2010, from http://profiles.asee.org/ Assessing Women in Engineering (AWE) Project. (2005). AWE Research Overviews: Family Influence. Retrieved August 1, 2010, from http://www.engr.psu.edu/awe/misc/ARPs/Family_03_17_05.pdf
Astin, A.W. (1993). What matters in college? Four critical years revisited (1st ed.). San Francisco, CA: Jossey-Bass.
Besterfield-Sacre, M., Atman, C.J., & Shuman, L.J. (1995, June). How freshman attitudes change in the first year. In Proceedings of the American Society for Engineering Education Annual Conference and Exposition, Anaheim, CA.
Besterfield-Sacre, M., Atman, C.J., & Shuman, L.J. (1997). Characteristics of freshman engineering students: Models for determining student attrition in engineering. Journal of Engineering Education, 86(2), 139-149.
Brooks, D. (2007, October 9). The Odyssey Years. New York Times. Retrieved August 1, 2010, from http://www.nytimes.com/2007/10/09/opinion/09brooks.html
Burtner, J. (1994). The use of discriminant analysis to investigate the influence of non-cognitive factors on engineering school persistence. Journal of Engineering Education, 94(1), 335-338.
Chang, M.J., Sharkness, J., Newman, C.B., & Hurtado, S. (2010, May). What matters in college for retaining aspiring scientists and engineers. Paper presented at the annual meeting of the American Educational Research Association, Denver, CO. Retrieved August 1, 2010, from http://heri.ucla.edu/nih/downloads/AERA__Retention_Chang_Sharkness_Newman_Hurtado_Final.pdf
Chen, H.L., Lattuca, L.R., & Hamilton, E. (2008). Conceptualizing engagement: Contributions of faculty to student engagement in engineering. Journal of Engineering Education, 97(3), 339-353.

Exploring the Engineering Student Experience 145
Chubin, D., Donaldson, K., Olds, B. & Fleming, L. (2008). Educating Generation Net – Can U.S. engineering woo and win the competition for talent?. Journal of Engineering Education, 97(3), 245-257.
Donaldson, K., Chen, H.L., Toye, G., & Sheppard, S.D. (2007, October). Targeting undergraduate students for surveys: Lessons from the Academic Pathways of People Learning Engineering Survey (APPLES). In Proceedings of the ASEE/ISEE Frontiers in Education Annual Conference and Exposition, Milwaukee, WI.
Donaldson, K. & Sheppard, S. (2007). A snapshot of American undergraduate engineering institutions: National sampling for the Academic Pathways of People Learning Engineering Survey (APPLES) (CAEE Technical Report Series: CAEE-TR-08-05). Seattle, WA: Center for the Advancement of Engineering Education.
Donaldson, K., Chen, H.L., Toye, G., Clark, M., & Sheppard, S. (2008a, October). Scaling up: Taking the Academic Pathways of People Learning Engineering Survey (APPLES) national. In Proceedings of the ASEE/ISEE Frontiers in Education Annual Conference and Exposition, Saratoga Springs, NY.
Donaldson, K., Lichtenstein, G., & Sheppard, S.D. (2008b, June). Socioeconomic status and the undergraduate experience: Preliminary findings from four American universities. In Proceedings of the American Society for Engineering Education Annual Conference, Pittsburgh, PA.
Dym, C., Agogino, A., Eris, O., Frey, D. & Leifer, L. (2005). Engineering design thinking, teaching, and learning. Journal of Engineering Education, 94(1), 103-120.
Eccles, J. S., & Wigfield, A. (2002). Motivational beliefs, values, and goals. Annual Review of Psychology, 53(1), 109-132. Eris, O., Chachra, D., Chen, H.L., Sheppard, S., Ludlow, L., Rosca, C., Bailey, T., & Goye, G. (in press). Outcomes of a longitudinal administration of the persistence in engineering survey. Journal of Engineering Education. Guay, F., Vallerand, R.J., & Blanchard, C. (2000). On the assessment of situational intrinsic and extrinsic motivation: The Situational Motivation Scale (SIMS). Motivation and Emotion, 24(3), 175-213. Hearn, J.D. (1988). Attendance at higher-cost colleges: Ascribed, socioeconomic, and academic influences on student enrollment patterns. Economics of Education Review, 7(1), 65-76. Hellerstein, J.K. & Morrill, M.S. (2010, April 22). Dads and daughters: The changing impact of fathers on women’s occupational choices. Retrieved August 1, 2010, from http://www4.ncsu.edu/~msmorril/HellersteinMorrill_DadsDaughters.pdf
Higher Education Research Institute. (2010a). Degrees of success: Bachelor’s degree completion rates among initial STEM majors. Los Angeles, CA: Higher Education Research Institute.

Exploring the Engineering Student Experience 146
Higher Education Research Institute. (2010b). Your First College Year Survey 2003. Retrieved August 1, 2010, from http://www.heri.ucla.edu/researchersToolsCodebooks.php
Huang, G., Taddese, N., & Walter, E. (2000). Entry and persistence of women and minorities in college science and engineering education (No. NCES 2000601). Washington, D.C.: National Center for Education Statistics.
Knight, D.W., Carlson, L.E., & Sullivan, J. (2007, June). Improving engineering student retention through hands-on, team-based, first-year design projects. In Proceedings of the Annual International Conference on Research in Engineering Education, Honolulu, HI. Kuh, G.D., Kinzie, J., Schuh, J.H., Whitt, E.J., & Associates. (2005). Student success in college: Creating conditions that matter. San Francisco, CA: Jossey-Bass.
Leppel, K., Williams, M.L., & Waldauer, C. (2001). The impact of parental occupation and socioeconomic status on choice of college major. Journal of Family and Economic Issues, 22(4), 373-394.
Lichtenstein, G., McCormick, A.C., Sheppard, S., & Puma, J. (2009, April). Retention is not the problem: A national study of academic persistence and engagement of undergraduate engineers compared to other majors. Paper presented at the annual meeting of the American Educational Research Association, San Diego, CA.
Nicholls, G.M., Wolfe, H., Besterfield-Sacre, M., Shuman, L.J. & Larpkiattaworn. S. A method for identifying variables for predicting STEM enrollment. Journal of Engineering Education, 96 (1), 33-44.
Oblinger, D.C. & Oblinger, J.L. (2005). Educating the Net Generation. Retrieved August 1, 2010, from http://www.educause.edu/educatingthenetgen
Ohland, M.W., Sheppard, S.D., Lichtenstein, G., Eris, O., Chachra, D., & Layton, R.A. (2008). Persistence, engagement, and migration in engineering programs. Journal of Engineering Education, 97(3), 259-278.
Otto, E., Chen, H.L., & Sheppard, S.D. (2010, June). Students improving: Identifying factors that seem to matter. In Proceedings of the American Society for Engineering Education Annual Conference, Louisville, KY.
Parikh, S., Chen, H.L., Donaldson, D., & Sheppard, S. (2009, June). Does major matter? A look at what motivates engineering students in different majors. In Proceedings of the American Society for Engineering Education Annual Conference, Austin, TX.
Pascarella, E.T., Cruce, T., Umbach, P.D., Wolniak, G.C., Kuh, G.D., Carini, R.M., Haye, J.C., Gonyea, R.M., & Zhao, C. (2006). Institutional selectivity and good practices in undergraduate education: How strong is the link?. The Journal of Higher Education, 77(2), 251-285.
Pascarella, E.T. & Terenzini, P.T. (2005). How college affects students: A third decade of research. San Francisco, CA: Jossey-Bass.

Exploring the Engineering Student Experience 147
Pew Research Center. (2010). Millennials: A portrait of Generation Next. Confident. Connected. Open to Change. Retrieved August 1, 2010, from http://pewsocialtrends.org/assets/pdf/millennials-confident-connected-open-to-change.pdf
Ryan, R., & Deci, E. (2000). Intrinsic and extrinsic motivations: Classic definitions and new directions. Contemporary Educational Psychology, 25, 54-67.
Sax, L.J., Astin, A.W., & Astin, H.S. (2008). The gender gap in college: Maximizing the developmental potential of women and men. San Francisco, CA: Jossey-Bass.
Schuman, L.J., Delaney, C., Wolfe, H., Scalise, A., & Besterfield-Sacre, M. (1999, June). Engineering attrition: Students’ characteristics and educational initiatives. In Proceedings of the American Society of Engineering Education Annual Conference and Exposition, Charlotte, NC.
Seymour, E. & Hewitt, N.M. (1994). Talking about leaving: Factors contributing to high attrition rates among science, mathematics & engineering undergraduate majors: Final report to the Alfred P. Sloan Foundation on an ethnographic inquiry at seven institutions. Bounder, CO: University of Colorado, Ethnography and Assessment Research, Bureau of Sociological Research.
Seymour, E., & Hewitt, N.M. (1997). Talking about leaving: Why undergraduates leave the sciences. Boulder, CO: Westview Press.
Sheppard, S.D., & Silva, K. (2001, October). Descriptions of engineering education: Faculty, student, and engineering-practitioner perspectives. In Proceedings of the ASEE/ISEE Frontiers in Education Annual Conference, Reno, NV.
U.S. Department of Education. (2008). National Center for Education Statistics Glossary. Retrieved March 31, 2008, from http://nces.ed.gov/programs/coe/glossary/s.asp

Exploring the Engineering Student Experience 148
Part VII. Appendices
I.1 The Academic Pathways of People Learning Engineering Survey (APPLES) Instrument
I.2 Descriptions of the Major Declaration Process and Institutional Selectivity Characteristics
I.3 Definitions of APPLES Engineering Majors and Other Majors
II.1 Means and Standard Deviations of Core Constructs
II.2 Simple Correlation Coefficients: First-Year Students
II.3 Calculating APPLES Multi-Item Variables
IV Methodological Notes for Regressions


Exploring the Engineering Student Experience
Appendix I.1
The Academic Pathways of People Learning Engineering Survey (APPLES) Instrument

phpESP, v1.6.1 http://caee-aps.stanford.edu/phpESP/admin/manage.php
1 of 4 1/30/2008 9:33 AM
debug
p h p E S P
Survey Design
Help
This is a preview of how this survey will look. In the preview the survey navigation buttons are inactive, use the section
number buttons to view different sections. Some navigation buttons may not appear on your final survey, depending on
what access it is assigned. The survey will use the background color of the document in which it is embedded. If you have
no further changes click Finish at the bottom of this page.
Section: 1 2 3 4 5 6 7
ACADEMIC PATHWAYS OF PEOPLE LEARNING ENGINEERING SURVEY
(APPLES)
PAGE 1 OF 7
For best viewing results, please maximize your browser window.
QUESTIONS MARKED WITH A * ARE REQUIRED.
*1. What school are you currently attending?
INSERT NAME OF SCHOOL
Other:
I prefer not to answer
*2. What is your current academic standing?
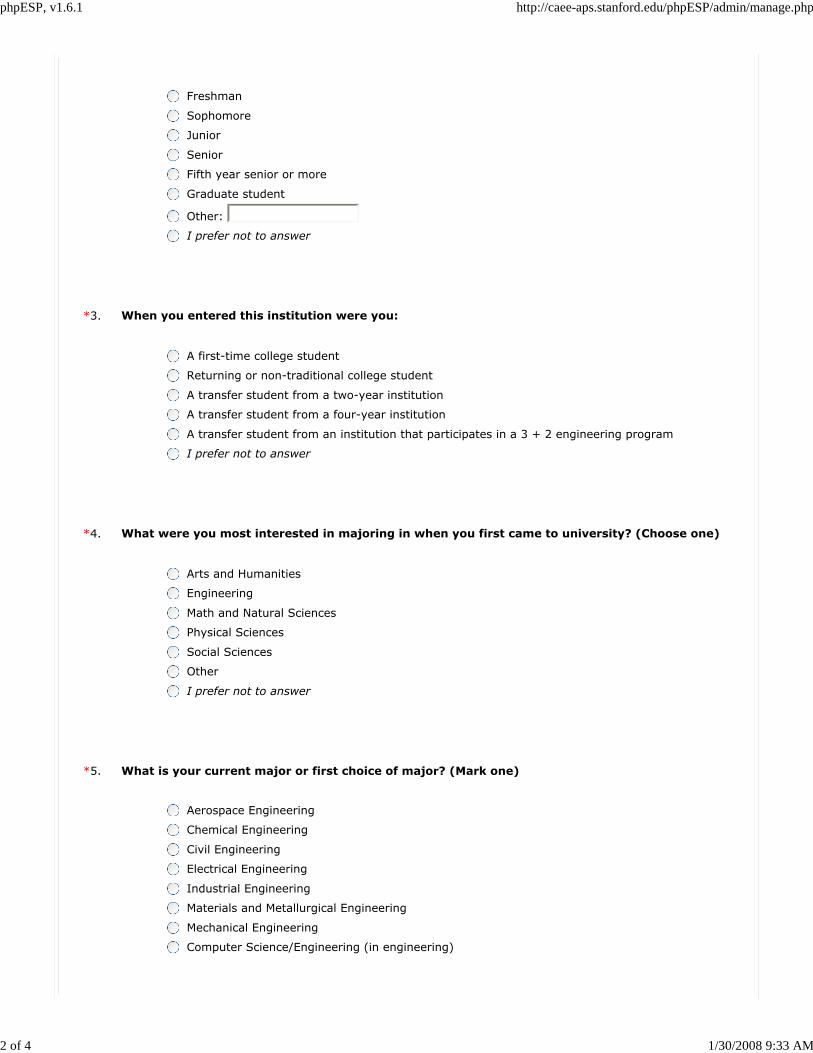
phpESP, v1.6.1 http://caee-aps.stanford.edu/phpESP/admin/manage.php
2 of 4 1/30/2008 9:33 AM
Freshman
Sophomore
Junior
Senior
Fifth year senior or more
Graduate student
Other:
I prefer not to answer
*3. When you entered this institution were you:
A first-time college student
Returning or non-traditional college student
A transfer student from a two-year institution
A transfer student from a four-year institution
A transfer student from an institution that participates in a 3 + 2 engineering program
I prefer not to answer
*4. What were you most interested in majoring in when you first came to university? (Choose one)
Arts and Humanities
Engineering
Math and Natural Sciences
Physical Sciences
Social Sciences
Other
I prefer not to answer
*5. What is your current major or first choice of major? (Mark one)
Aerospace Engineering
Chemical Engineering
Civil Engineering
Electrical Engineering
Industrial Engineering
Materials and Metallurgical Engineering
Mechanical Engineering
Computer Science/Engineering (in engineering)

phpESP, v1.6.1 http://caee-aps.stanford.edu/phpESP/admin/manage.php
3 of 4 1/30/2008 9:33 AM
Computer Science (non-engineering)
Other Engineering:
Arts and Humanities
Math and Natural Sciences
Physical Sciences
Social Sciences
Other Non-Engineering:
I prefer not to answer
*6. What is your second choice of major or second major/minor?(Mark one or N/A if not applicable)
Aerospace Engineering
Chemical Engineering
Civil Engineering
Electrical Engineering
Industrial Engineering
Materials and Metallurgical Engineering
Mechanical Engineering
Computer Science/Engineering (in engineering)
Computer Science (non-engineering)
Other Engineering:
Arts and Humanities
Math and Natural Sciences
Physical Sciences
Social Sciences
Other Non-Engineering:
N/A
Undecided
I prefer not to answer
*7. Do you intend to complete a major in engineering?

phpESP, v1.6.1 http://caee-aps.stanford.edu/phpESP/admin/manage.php
4 of 4 1/30/2008 9:33 AM
Definitely not
Probably not
Not sure
Probably yes
Definitely yes
I prefer not to answer
*8. Do you intend to practice, conduct research in, or teach engineering for at least 3 years after
graduation?
Definitely not
Probably not
Not sure
Probably yes
Definitely yes
I prefer not to answer
PAGE 1 OF 7
Save Next Page
The survey title and other general fields are on the General tab. Individual survey questions are added and modified on the
Questions tab. Questions may be re-ordered or deleted from the Order tab. You may see a preview of your survey at any
time, by going to the Preview tab. If you have no further changes click Finish to go back to the Management Interface.
Click here to open the Help window.
General Questions Order Preview Finish

phpESP, v1.6.1 http://caee-aps.stanford.edu/phpESP/admin/manage.php
1 of 4 1/30/2008 9:33 AM
debug
p h p E S P
Survey Design
Help
This is a preview of how this survey will look. In the preview the survey navigation buttons are inactive, use the section
number buttons to view different sections. Some navigation buttons may not appear on your final survey, depending on
what access it is assigned. The survey will use the background color of the document in which it is embedded. If you have
no further changes click Finish at the bottom of this page.
Section: 1 2 3 4 5 6 7
ACADEMIC PATHWAYS OF PEOPLE LEARNING ENGINEERING SURVEY
(APPLES)
PAGE 2 OF 7
For best viewing results, please maximize your browser window.
QUESTIONS MARKED WITH A * ARE REQUIRED.
*9. We are interested in knowing why you are or were studying engineering. Please indicate below
the extent to which the following reasons apply to you:
Not a
Reason
Minimal
Reason
Moderate
Reason
Major
Reason
I prefer
not to
answer
Technology plays an important role in solving
society’s problems
Engineers make more money than most
other professionals
My parent(s) would disapprove if I chose a
major other than engineering
Engineers have contributed greatly to fixing
problems in the world
Engineers are well paid
My parent(s) want me to be an engineer
An engineering degree will guarantee me a
job when I graduate
A faculty member, academic advisor,
teaching assistant or other university
affiliated person has encouraged and/or

phpESP, v1.6.1 http://caee-aps.stanford.edu/phpESP/admin/manage.php
2 of 4 1/30/2008 9:33 AM
inspired me to study engineering
A non-university affiliated mentor has
encouraged and/or inspired me to study
engineering
A mentor has introduced me to people and
opportunities in engineering
I feel good when I am doing engineering
I like to build stuff
I think engineering is fun
Engineering skills can be used for the good of
society
I think engineering is interesting
I like to figure out how things work
*10. Please indicate how strongly you disagree or agree with each of the statements:
Disagree
Strongly Disagree Agree
Agree
Strongly
I prefer
not to
answer
Creative thinking is one of my strengths
I am skilled at solving problems that can
have multiple solutions
A mentor has supported my decision to
major in engineering
*11. Rate yourself on each of the following traits as compared to your classmates. We want the
most accurate estimate of how you see yourself.
Lowest
10%
Below
Average Average
Above
Average
Highest
10%
I prefer
not to
answer
Self confidence (social)
Leadership ability
Public speaking ability
Math ability
Science ability
Communication skills
Ability to apply math and science
principles in solving real world
problems
Business ability
Ability to perform in teams
Critical thinking skills
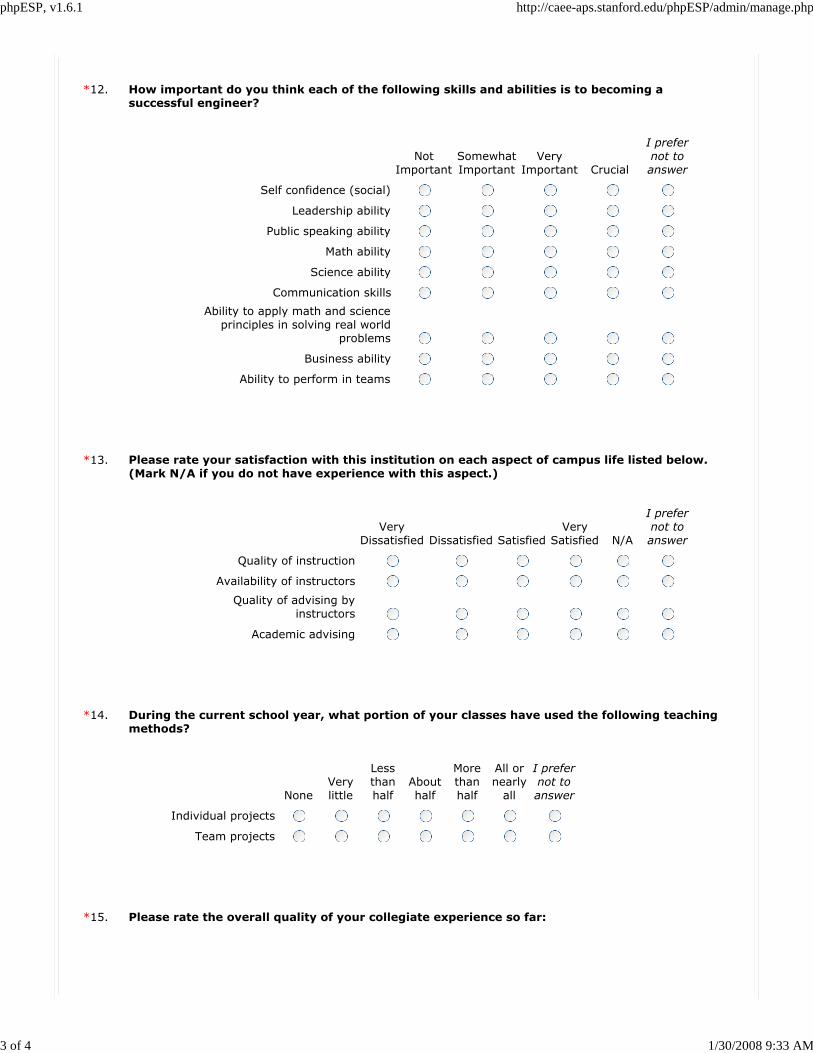
phpESP, v1.6.1 http://caee-aps.stanford.edu/phpESP/admin/manage.php
3 of 4 1/30/2008 9:33 AM
*12. How important do you think each of the following skills and abilities is to becoming a
successful engineer?
Not
Important
Somewhat
Important
Very
Important Crucial
I prefer
not to
answer
Self confidence (social)
Leadership ability
Public speaking ability
Math ability
Science ability
Communication skills
Ability to apply math and science
principles in solving real world
problems
Business ability
Ability to perform in teams
*13. Please rate your satisfaction with this institution on each aspect of campus life listed below.
(Mark N/A if you do not have experience with this aspect.)
Very
Dissatisfied Dissatisfied Satisfied
Very
Satisfied N/A
I prefer
not to
answer
Quality of instruction
Availability of instructors
Quality of advising by
instructors
Academic advising
*14. During the current school year, what portion of your classes have used the following teaching
methods?
None
Very
little
Less
than
half
About
half
More
than
half
All or
nearly
all
I prefer
not to
answer
Individual projects
Team projects
*15. Please rate the overall quality of your collegiate experience so far:

phpESP, v1.6.1 http://caee-aps.stanford.edu/phpESP/admin/manage.php
4 of 4 1/30/2008 9:33 AM
Very dissatisfied
Dissatisfied
Satisfied
Very satisfied
I prefer not to answer
PAGE 2 OF 7
Previous Page Save Next Page
The survey title and other general fields are on the General tab. Individual survey questions are added and modified on the
Questions tab. Questions may be re-ordered or deleted from the Order tab. You may see a preview of your survey at any
time, by going to the Preview tab. If you have no further changes click Finish to go back to the Management Interface.
Click here to open the Help window.
General Questions Order Preview Finish

phpESP, v1.6.1 http://caee-aps.stanford.edu/phpESP/admin/manage.php
1 of 4 1/30/2008 9:33 AM
debug
p h p E S P
Survey Design
Help
This is a preview of how this survey will look. In the preview the survey navigation buttons are inactive, use the section
number buttons to view different sections. Some navigation buttons may not appear on your final survey, depending on
what access it is assigned. The survey will use the background color of the document in which it is embedded. If you have
no further changes click Finish at the bottom of this page.
Section: 1 2 3 4 5 6 7
ACADEMIC PATHWAYS OF PEOPLE LEARNING ENGINEERING SURVEY
(APPLES)
PAGE 3 OF 7
For best viewing results, please maximize your browser window.
QUESTIONS MARKED WITH A * ARE REQUIRED.
*16. Think about the engineering, math or science classes you are taking/have taken during the
current school year. Indicate how often you:
(Mark N/A if you have not taken any engineering related classes.)
Never Rarely Occasionally Frequently N/A
I prefer
not to
answer
Came late to engineering
class
Skipped engineering class
Turned in engineering
assignments that did not
reflect your best work
Turned in engineering
assignments late

phpESP, v1.6.1 http://caee-aps.stanford.edu/phpESP/admin/manage.php
2 of 4 1/30/2008 9:33 AM
*17. Think about the liberal arts classes (not engineering, math, or science classes)you are
taking/have taken during the current school year. Indicate how often you:
(Mark N/A if you have not taken any liberal arts classes.)
Never Rarely Occasionally Frequently N/A
I prefer
not to
answer
Came late to liberal arts
class
Skipped liberal arts class
Turned in liberal arts
assignments that did not
reflect your best work
Turned in liberal arts
assignments late
*18. How well are you meeting the workload demands of your coursework?
I am meeting all of the demands easily
I am meeting all of the demands, but it is hard work
I am meeting most of the demands, but cannot meet some
I can meet some of the demands, but cannot meet most
I cannot meet any of the demands
I prefer not to answer
*19. How stressed do you feel in your coursework right now?
No stress
Moderately low stress
Moderate stress
Moderately high stress
High stress
I prefer not to answer
*20. During the current school year, how much pressure have you felt with each of the following?
No
Pressure
Moderately
Low Pressure
Moderate
Pressure
Moderately
High Pressure
High
Pressure
I prefer
not to
answer
Course load (amount
of course material
being covered)

phpESP, v1.6.1 http://caee-aps.stanford.edu/phpESP/admin/manage.php
3 of 4 1/30/2008 9:33 AM
Course pace (the rate
at which the course
material is being
covered)
Balance between social
and academic life
*21. During the current school year, how often have you interacted with your instructors (faculty,
teaching assistants) in your engineering, math, or science classes (e.g. by phone, e-mail, IM,
or in person)?
(Mark N/A if you have not taken any engineering, math, or science classes this year.)
Never Rarely Occasionally Often
Very
often N/A
I prefernot to
answer
Instructors during class
Instructors during office hours
Instructors outside of class or
office hours
*22. Some people are involved in non-engineering activities on or off campus, such as hobbies, civic
or church organizations, campus publications, student government, social fraternity or
sorority, sports, etc. How important is it for you to be involved in these kind of activities?
Not important
Somewhat important
Very important
Essential
I prefer not to answer
*23. How often are you involved in the kinds of non-engineering activities described above?
Never
Rarely
Occasionally
Frequently
I prefer not to answer

phpESP, v1.6.1 http://caee-aps.stanford.edu/phpESP/admin/manage.php
4 of 4 1/30/2008 9:33 AM
*24. What is your level of involvement in student engineering activities such as engineering clubs or
societies?
No involvement
Limited involvement
Moderate involvement
Extensive involvement
I prefer not to answer
*25. Since coming to college, have you had any research experience(s)? (Mark one)
No
Yes, in engineering related areas
Yes, in non-engineering related areas
Yes, in both engineering and non-engineering related areas
I prefer not to answer
PAGE 3 OF 7
Previous Page Save Next Page
The survey title and other general fields are on the General tab. Individual survey questions are added and modified on the
Questions tab. Questions may be re-ordered or deleted from the Order tab. You may see a preview of your survey at any
time, by going to the Preview tab. If you have no further changes click Finish to go back to the Management Interface.
Click here to open the Help window.
General Questions Order Preview Finish

phpESP, v1.6.1 http://caee-aps.stanford.edu/phpESP/admin/manage.php
1 of 4 1/30/2008 9:33 AM
debug
p h p E S P
Survey Design
Help
This is a preview of how this survey will look. In the preview the survey navigation buttons are inactive, use the section
number buttons to view different sections. Some navigation buttons may not appear on your final survey, depending on
what access it is assigned. The survey will use the background color of the document in which it is embedded. If you have
no further changes click Finish at the bottom of this page.
Section: 1 2 3 4 5 6 7
ACADEMIC PATHWAYS OF PEOPLE LEARNING ENGINEERING SURVEY
(APPLES)
PAGE 4 OF 7
For best viewing results, please maximize your browser window.
QUESTIONS MARKED WITH A * ARE REQUIRED.
*26. Before college, how much knowledge did you have about the engineering profession?
No knowledge
Limited knowledge
Moderate knowledge
Extensive knowledge
I prefer not to answer
*27. Since entering college, how much knowledge have you gained about the engineering
profession?
No knowledge
Limited knowledge
Moderate knowledge
Extensive knowledge
I prefer not to answer

phpESP, v1.6.1 http://caee-aps.stanford.edu/phpESP/admin/manage.php
2 of 4 1/30/2008 9:33 AM
*28. How much exposure have you had to a professional engineering environment as a visitor,
intern, or employee?
No exposure
Limited exposure
Moderate exposure
Extensive exposure
I prefer not to answer
*29. How did you gain your knowledge about the engineering profession? (Mark all that apply)
From being a visitor
From being a co-op student or intern
From being an employee
From a family member
From a close friend
From school-related experiences (i.e., a professor or class)
Other:
I prefer not to answer
*30. Do any of your immediate family members (parents, siblings) hold an engineering degree?
No
Yes
I prefer not to answer
31. Do you see yourself continuing in an engineering major?
No - I am NOT majoring or planning to major in engineering
Yes
I prefer not to answer
*32. Do you see yourself pursuing a career in engineering?

phpESP, v1.6.1 http://caee-aps.stanford.edu/phpESP/admin/manage.php
3 of 4 1/30/2008 9:33 AM
Definitely not
Probably not
Not sure
Probably yes
Definitely yes
I prefer not to answer
*33. How likely is it that you would do each of the following after graduation?
Definitely
not
Probably
not
Not
sure
Probably
yes
Definitely
yes
I prefer
not to
answer
Work in an engineering job
Work in a non-engineering job
Go to graduate school in an
engineering discipline
Go to graduate school outside of
engineering
*34. Do you have any concerns about your ability to finance your college education?
None (I am confident that I will have sufficient funds)
Some (but I probably will have sufficient funds)
Major (I have funds but will graduate with significant debt)
Extreme (not sure if I will have sufficient funds to complete college)
I prefer not to answer
*35. What is your cumulative grade point average?
A or A+ (i.e., 3.9 or above on a 4.0 scale)
A- (3.5-3.8)
B+ (3.2-3.4)
B (2.9-3.1)
B- (2.5-2.8)
C+ (2.2-2.4)
C (1.9-2.1)
C- or lower (less than 1.5)
I prefer not to answer
PAGE 4 OF 7

phpESP, v1.6.1 http://caee-aps.stanford.edu/phpESP/admin/manage.php
1 of 4 1/30/2008 9:34 AM
debug
p h p E S P
Survey Design
Help
This is a preview of how this survey will look. In the preview the survey navigation buttons are inactive, use the section
number buttons to view different sections. Some navigation buttons may not appear on your final survey, depending on
what access it is assigned. The survey will use the background color of the document in which it is embedded. If you have
no further changes click Finish at the bottom of this page.
Section: 1 2 3 4 5 6 7
ACADEMIC PATHWAYS OF PEOPLE LEARNING ENGINEERING SURVEY
(APPLES)
PAGE 5 OF 7
For best viewing results, please maximize your browser window.
QUESTIONS MARKED WITH A * ARE REQUIRED.
*36. Your sex:
Female
Male
I prefer not to answer
*37. What is your racial or ethnic identification? (Mark all that apply)
American Indian or Alaska Native
Asian or Asian American
Black or African American
Hispanic or Latino/a
Native Hawaiian or Pacific Islander
White
Other:

phpESP, v1.6.1 http://caee-aps.stanford.edu/phpESP/admin/manage.php
2 of 4 1/30/2008 9:34 AM
I prefer not to answer
*38. How old are you? (Mark one)
17 or younger
18-19
20-23
24-29
30-39
40-55
over 55
I prefer not to answer
*39. Are you:
A U.S. Citizen
A Permanent Resident of the U.S.
Other
I prefer not to answer
*40. Were you born in the United States?
Yes
If no, at what age did you immigrate to the U.S:
I prefer not to answer
*41. Did one or more of your parents/guardians immigrate to the United States?
Yes
No
I prefer not to answer

phpESP, v1.6.1 http://caee-aps.stanford.edu/phpESP/admin/manage.php
3 of 4 1/30/2008 9:34 AM
*42. Is English your first language?
Yes
No
I prefer not to answer
*43. Are you a first-generation college student (first in your immediate family to attend
college)?
Yes
No
I prefer not to answer
*44. Are you enrolled primarily as a:
Full-time student
Part-time student
I prefer not to answer
*45. Which of the following best describes where you are living now while attending college?
Dormitory or other campus housing
Residence (house, apartment, etc.) within walking distance of the institution
Residence (house, apartment, etc.) within driving distance of the institution
I prefer not to answer
*46. Would you describe your family as: (Mark one)
High income
Upper-middle income
Middle income
Lower-middle income
Low income
I prefer not to answer

phpESP, v1.6.1 http://caee-aps.stanford.edu/phpESP/admin/manage.php
4 of 4 1/30/2008 9:34 AM
*47. What is the highest level of education that your mother completed? (Mark one)
Did not finish high school
Graduated from high school
Attended college but did not complete degree
Completed an Associate degree (AA, AS, etc.)
Completed a Bachelor degree (BA, BS, etc.)
Completed a Masters degree (MA, MS, etc.)
Completed a Doctoral or Professional degree (JD, MD, PhD, etc.)
Don't know or not applicable
I prefer not to answer
*48. What is the highest level of education that your father completed? (Mark one)
Did not finish high school
Graduated from high school
Attended college but did not complete degree
Completed an Associate degree (AA, AS, etc.)
Completed a Bachelor degree (BA, BS, etc.)
Completed a Masters degree (MA, MS, etc.)
Completed a Doctoral or Professional degree (JD, MD, PhD, etc.)
Don't know or not applicable
I prefer not to answer
PAGE 5 OF 7
Previous Page Save Next Page
The survey title and other general fields are on the General tab. Individual survey questions are added and modified on the
Questions tab. Questions may be re-ordered or deleted from the Order tab. You may see a preview of your survey at any
time, by going to the Preview tab. If you have no further changes click Finish to go back to the Management Interface.
Click here to open the Help window.
General Questions Order Preview Finish

phpESP, v1.6.1 http://caee-aps.stanford.edu/phpESP/admin/manage.php
1 of 2 1/30/2008 9:34 AM
debug
p h p E S P
Survey Design
Help
This is a preview of how this survey will look. In the preview the survey navigation buttons are inactive, use the section
number buttons to view different sections. Some navigation buttons may not appear on your final survey, depending on
what access it is assigned. The survey will use the background color of the document in which it is embedded. If you have
no further changes click Finish at the bottom of this page.
Section: 1 2 3 4 5 6 7
ACADEMIC PATHWAYS OF PEOPLE LEARNING ENGINEERING SURVEY
(APPLES)
PAGE 6 OF 7
For best viewing results, please maximize your browser window.
QUESTIONS MARKED WITH A * ARE REQUIRED.
*49. Of the twenty-three design activities below, please put a check mark next to the SIX MOST
IMPORTANT.
Abstracting
Brainstorming
Building
Communicating
Decomposing
Evaluating
Generating alternatives
Goal setting
Identifying constraints
Imagining
Iterating
Making decisions
Making trade-offs

phpESP, v1.6.1 http://caee-aps.stanford.edu/phpESP/admin/manage.php
2 of 2 1/30/2008 9:34 AM
Modeling
Planning
Prototyping
Seeking information
Sketching
Synthesizing
Testing
Understanding the problem
Using creativity
Visualizing
I prefer not to answer
PAGE 6 OF 7
Previous Page Save Next Page
The survey title and other general fields are on the General tab. Individual survey questions are added and modified on the
Questions tab. Questions may be re-ordered or deleted from the Order tab. You may see a preview of your survey at any
time, by going to the Preview tab. If you have no further changes click Finish to go back to the Management Interface.
Click here to open the Help window.
General Questions Order Preview Finish

phpESP, v1.6.1 http://caee-aps.stanford.edu/phpESP/admin/manage.php
1 of 1 1/30/2008 9:34 AM
debug
p h p E S P
Survey Design
Help
This is a preview of how this survey will look. In the preview the survey navigation buttons are inactive, use the section number buttons toview different sections. Some navigation buttons may not appear on your final survey, depending on what access it is assigned. The surveywill use the background color of the document in which it is embedded. If you have no further changes click Finish at the bottom of this
page.
Section: 1 2 3 4 5 6 7
ACADEMIC PATHWAYS OF PEOPLE LEARNING ENGINEERING SURVEY
(APPLES)
PAGE 7 OF 7
For best viewing results, please maximize your browser window.
50. Is there anything you want to tell us about your experiences in engineering that we haven't already askedyou about?
PAGE 7 OF 7
Previous Page Save Submit Survey
The survey title and other general fields are on the General tab. Individual survey questions are added and modified on the Questions tab.Questions may be re-ordered or deleted from the Order tab. You may see a preview of your survey at any time, by going to the Preview
tab. If you have no further changes click Finish to go back to the Management Interface.Click here to open the Help window.
General Questions Order Preview Finish


Exploring the Engineering Student Experience
Appendix I.2
Descriptions of the Major Declaration Process and Institutional Selectivity Characteristics

I.2 Descriptions of Institutional Selectivity and Major Declaration Process
Institutional Selectivity Institutional selectivity is the most common single criterion to make inferences about the “quality” of the undergraduate education one receives. It provides a measure of the role of peers and interactions with other students in understanding the educational impact of the institution (Pasacrella et al., 2006). For the APPLES analyses, institutional selectivity was operationalized based on the SAT Math and Critical Reading scores of students at each institution using data provided by the Integrated Postsecondary Education Data System (IPEDS, http://nces.ed.gov/IPEDS/). This formula was based on: 1) the score on the SAT Math test in Fall 2007 that 75% of enrolled first-time students scored at or above; and 2) the score on the SAT Critical Reading test in Fall 2007 that 75% of enrolled first-time students scored at or above. The specific formula was as follows:
.25*(SAT 75th% Institution’s Critical Reading score) + .75*(SAT 75th% Institution’s Math score)
Because these scores are representative of the general student population at the institution, we decided to weight the scores in favor of the math score since it’s likely that students with higher math scores would be more likely to be interested in pursuing an engineering major. However, we also wanted to acknowledge the overall student by including the critical reading score and not basing the institutional selectivity solely on the math score. Data for each school was collected via the College Navigator interface on the website of the National Center for Education Statistics sponsored by the U.S. Department of Education, Institute of Education Sciences (http://nces.ed.gov/collegenavigator/?q=stanford&s=all&id=243744). The institutional selectivity score was calculated for each of the 21 institutions in our sample. It is important to note that the score was calculated for each institution using the overall 75th percentile math and critical reading scores of all first-time students attending the institution, and not individual student SAT scores. For one of the institutions only ACT scores were available. An approximate conversion of ACT to SAT scores was made using the table used by the University of California (http://www.universityofcalifornia.edu/admissions/undergrad_adm/paths_to_adm/freshman/scholarship_reqs.html) and referencing a College Board report (http://professionals.collegeboard.com/research/pdf/rr9901_3913.pdf). Each of the schools was ranked according to their institutional selectivity score. A median split at the 50th percentile was made to divide the institutions into two groups:
Low selectivity [n=1426 respondents]: 11 institutions High selectivity [n=2840 respondents]: 10 institutions

Major Declaration Process Preliminary analyses from the Persistence in Engineering (PIE) questionnaires during the sophomore and junior years and semi-structured interviews conducted with the APS longitudinal cohort first highlighted the differences between how students were admitted into the engineering majors and programs. Relative to our research focus on academic persistence, we were struck by the fact that the decision to NOT persist in engineering may be due to the school or department’s decision and not the individual student’s. This observation led our research team to explore who exactly comprised our “non-persister” group and sparked our interest in further differentiating institutional differences based on school and programmatic admissions policies in to the engineering major. From our investigation, we arrived at three categories comprising the Major Declaration Process or MDP:
1. Student is accepted to institution in school of engineering or for specific engineering major (or accepted to a technical school that has ONLY engineering majors) [12 institutions, n=2,582]
2. Student accepted to institution without specifying a major (free to declare any major as long as minimum requirements of major are met) [8 institutions, n=1,283]
3. Student accepted to institution then needs to apply (usually sophomore year) to an engineering major [1 institution, n=131; Not included in the APPLES2 analyses]
Example institutions and admissions policies for each of these three categories are described in greater detail below. Category 1: Student is accepted to the institution in school of engineering or for specific engineering major (or accepted to a technical school that has ONLY engineering majors) At the University of Minnesota, freshmen are admitted into one of six colleges including the Institute of Technology (IT) that includes 11 engineering majors. Applicants are considered for admission to their first-choice college and then their second choice and/or a college that best matches their academic interests. (http://admissions.tc.umn.edu/AdmissionInfo/fresh_requirements.html) Once students are admitted to the Institute of Technology, they follow a first-year program in fundamentals course that is required for most IT degrees. During their junior or senior years, student must apply for admission to IT upper division status after successfully completing or being registered for the courses designated for their major. (http://www.it.umn.edu/prospective/freshman_experience.html) The University of Minnesota and technically focused institutions such as the Colorado School of Mines do ask students to specify their area of interest when they are admitted to the university. Should a student decide to change his or her mind later on, he/she would need to reapply to the non-engineering major in a different department or school, or if the school does not offer other

majors (such as switching from engineering to a humanities & sciences major), that student may need to transfer to a different institution entirely. Category 2: Student is accepted to institution without specifying a major (free to declare any major as long as minimum requirements of major are met) The admissions policy at Stanford University states: “All undergraduates apply and are admitted to the university as a whole. Stanford believes strongly in the benefits of a broad-based education, so students are encouraged to sample widely from the abundant array of course offerings, and are not required to declare a major until the beginning of junior year.” http://soe.stanford.edu/admissions/index.html
Although prospective engineering majors are invited to explore majors that may be of interest to them, the School of Engineering website does remind students to keep in mind that before declaring an engineering major, they will need to have taken substantial amounts of mathematics, science, and fundamental engineering coursework. First year students are also encouraged to take a freshman seminar in order to get a feel for what hands-on engineering work is like. http://soe.stanford.edu/prospective_students/under_apply.html Category 3: Student is accepted to the institution and then needs to apply (usually sophomore year) to an engineering major At the University of Washington, if an interest in engineering is indicated on the student’s UW application, he/she is automatically assigned pre-engineering status. As a pre-engineering major, students spend the first one to three years taking required courses in math, chemistry, physics, English composition, and engineering fundamentals, along with some general education courses. Once these prerequisite courses have been completed, the student can apply for admission to one or more engineering programs. http://www.engr.washington.edu/curr_students/admissions/preengr.html The degree of competitiveness for each UW engineering program is described here: http://www.engr.washington.edu/curr_students/admissions/admitstats.html Each department application’s essay questions are described here: http://www.engr.washington.edu/uapp/essay_questions.phtml

Exploring the Engineering Student Experience
Appendix I.3
Definitions of APPLES Engineering Majors and Other Majors

I.3 Definitions of APPLES Engineering Majors and Other Majors Of the 4,266 respondents to the APPLES survey, 3,911 are classified as engineering majors and 340 represent other majors. The remaining 15 respondents were coded as missing data. Our definition of engineering majors is based on responses to two questions:
Q5: What is your current major or first choice of major? Q6: What is your second choice of major or second major/minor?
The responses to these two questions were coded as an engineering major, non-engineering major, or missing data based on the following categorizations: Engineering Majors Other Majors
• Aerospace Engineering • Arts and Humanities • Chemical Engineering • Computer Science (non-engineering) • Civil Engineering • Math and Natural Sciences • Computer Science/Engineering (in
engineering) • Physical Sciences • Electrical Engineering • Social Sciences • Industrial Engineering • Other Non-Engineering • Materials and Metallurgical Engineering • Other Non-Engineering: Business • Mechanical Engineering • Other Non-Engineering: Science, • Other Engineering Technology, Math (STM) • Other Engineering: Agricultural Engineering • Other Engineering: BioX Engineering Missing Data • Other Engineering: Construction Engineering • I prefer not to answer • Other Engineering: Engineering Math &
Physics • Undecided
• Other Engineering: Engineering Operations Research (OR) and Business
• N/A (Q6 only) • Student skipped the question
• Other Engineering: Environmental Engineering • Other Engineering: General Engineering • Other Engineering: Nuclear Engineering • Other Engineering: Ocean Engineering
Combinations of responses to Q5 and Q6 were calculated in order to construct 9 mutually exclusive groups. These groups were then assigned to the Engineering and Other Major categories using the following criteria: Engineering Majors [N=3,911]
• Q5: Engineering Major and Q6: Other Major [n=1044] • Q5: Other Major and Q6: Engineering Major [n=113]

• Q5: Engineering Major and Q6: Engineering Major [n=1438] • Q5 only: Engineering Major (Q6 was skipped, marked I prefer not to answer, undecided,
or N/A) [n=1310] • Q6 only: Engineering Major (Q5 was skipped, marked I prefer not to answer, undecided,
or N/A) [n=6] Other Majors [N=340]
• Q5: Other Major and Q6: Other Major [n=182] • Q5 only: Other Major (Q6 was skipped, marked I prefer not to answer, undecided, or
N/A) [n=155] • Q6 only: Other Major (Q5 was skipped or marked I prefer not to answer) [n=3]
Missing [N=15] NOTES • This definition of engineering majors is based on both questions 5 and 6. One consideration
about Q6 is that there is ambiguity in how the question is phrased; it is unclear whether the response to Q6 is a second choice of a major, a minor, or a second major. This question should be revised in future APPLES deployments. We note that if only Q5 was used in defining engineering majors, the total number would change from N=3911 to N=3792.
• The response options for Q5 and Q6 included two open-ended options for “Other Engineering major” and “Other Non-Engineering major” for students to fill in if there major was not in the original list. These responses were then recoded into ten additional engineering major categories and three non-engineering major categories. Specific notes about the recoding process are below:
o Undecided/Undeclared Engineering majors are included under General Engineering. General Engineering also includes those engineering majors who specifically state "general engineering" as well as "freshman engineering" or "something related to engineering." Other Engineering includes those engineering majors whose categories do not fall under our main groupings and are too small to create a new category for.
o Fuel Cell and Hybrid Technology Minor at one school, described on their website as: "Our approach provides an inter-disciplinary curriculum that includes courses from Chemistry, Electrical Engineering, Mechanical Engineering, and Business." is coded as Other Engineering.
o Agricultural and Biological Engineering at one school which includes Food Process Engineering is coded as Agricultural Engineering (and not BioX Engineering).
o In cases where it appears the student has listed two engineering majors such as "Other Engineering: Biosystems and Agricultural Engineering " the first major listed is the assigned category -- in this case BioX Engineering and not Agricultural Engineering.
o "Other Engineering: Sustainability Engineering, Sustainable Energy, Sustainable Engineering Design" are currently coded as Environmental Engineering.
o "Other Engineering: Polymer" is recoded as Materials and Metallurgical Engineering. o "Other Engineering: Renewable Energy Systems" is recoded as Other Engineering:
Environmental Engineering. o "Other Engineering: Software Engineering" is recoded as Other Engineering and
NOT Computer Science/Engineering.

o Where possible, "Other" fill-in-the-blank responses have been reassigned into one of our defined categories within Engineering or Non-Engineering; for example: "Other Non-Engineering: Mechanical Engineering Technology" is recoded as "Mechanical Engineering."
Reference: Pascarella, E.T., Cruce, T., Umbach, P.D., Wolniak, G.C., Kuh, G.D., Carini, R.M., Haye, J.C., Gonyea, R.M., & Zhao, C. (2006). Institutional selectivity and good practices in undergraduate education: How strong is the link?. The Journal of Higher Education, 77(2), 251-285.

Exploring the Engineering Student Experience
Appendix II.1
Means and Standard Deviations of Core Constructs

Appendix II.1 Means and Standard Deviations of Core Constructs Table II.1a Means and Standard Deviations of Core Constructs, First-Year and Senior Women and Men
Sig. FY gender difference?
n Mean SD n Mean SD n Mean SD n Mean SDFinancial Motivation 309 67.5 25.3 551 68.6 24.4 ns 323 66.2 25.3 788 64.9 25.3Parental Influence Motivation 311 15.9 24.9 555 15.4 23.8 ns 326 16.7 27.1 792 12.6 22.9Social Good Motivation 305 77.0 21.8 555 76.4 22.6 ns 322 74.6 23.3 784 74.1 23.3Mentor Influence Motivation 294 40.8 25.2 529 35.3 24.7 ** 318 42.0 26.9 771 33.9 25.6Intrinsic Psychological Motivation 303 79.5 21.0 548 81.1 20.4 ns 321 77.7 23.5 771 80.2 20.4Intrinsic Behavioral Motivation 305 76.7 24.2 544 83.9 20.8 *** 319 76.1 27.3 763 86.9 20.6Knowledge of Engineering Before College 311 46.1 20.0 556 50.1 22.2 ** 326 40.3 21.5 795 43.0 22.0Self-reported Gains in Knowledge of Engineering Since Entering College 311 65.7 18.8 554 67.1 21.0 ns 325 82.0 18.8 795 83.0 19.8
q29sourcesum 311 2.1 1.1 557 1.9 1.1 ns 326 2.3 1.2 795 2.3 1.3Perceived Importance of Math/Science Skills 311 87.6 15.1 555 86.6 16.2 ns 326 81.4 18.4 794 79.2 18.2Perceived Importance of Professional/Interpersonal Skills 311 70.3 16.4 555 67.2 18.8 * 326 69.9 17.7 795 65.2 17.7
Confidence in Math/Science Skills 310 69.8 17.3 554 73.1 17.8 ** 326 70.1 17.1 793 73.4 17.0Confidence in Professional/Interpersonal Skills 310 66.6 16.6 552 65.9 16.3 ns 326 69.3 15.2 792 69.4 17.0Confidence in Solving Open-Ended Problems 310 73.9 15.0 554 76.1 15.1 * 324 75.6 14.5 793 79.7 15.2Exposure to Project-Based Leaning: Individual Projects 311 3.1 1.4 552 61.4 28.8 ns 323 59.4 28.4 794 59.4 27.2
Exposure to Project-Based Leaning: Team Projects 311 2.9 1.3 552 52.8 26.6 * 323 70.0 25.8 794 62.6 26.2
Frequency of Interaction with Instructors 310 36.1 20.2 549 35.0 20.0 ns 323 46.5 22.4 790 43.8 20.5Satisfaction with Instructors 282 71.3 16.8 511 73.1 16.9 ns 306 63.5 21.0 758 64.2 21.0Curriculum Overload 309 56.8 17.4 552 49.3 18.6 *** 324 57.3 18.2 790 52.1 19.3Pressure to Balance Social and Academic Lives 309 2.4 1.2 555 42.7 24.3 *** 326 53.2 23.6 791 47.9 25.0Academic Involvement - Liberal Arts Courses 296 75.6 18.2 515 72.0 20.8 * 283 62.9 22.8 716 60.4 22.9Academic Involvement - Engineering Courses 294 78.0 15.6 532 76.5 17.4 ns 322 64.7 20.3 785 65.9 19.8Frequency of Engineering Extracurricular Participation 310 36.0 28.7 552 25.7 27.3 *** 326 50.7 34.0 792 36.3 31.7
Importance of Non-engineering Extracurricular Participation 311 61.3 29.4 556 56.8 30.3 * 325 65.0 32.0 791 59.3 34.0
Frequency of Non-engineering Extracurricular Participation 311 76.3 27.3 555 68.3 30.8 *** 324 78.0 27.4 794 71.3 31.5
Exposure to Engineering Profession 309 32.8 31.0 553 35.4 31.7 ns 324 69.0 31.9 795 67.0 35.1Overall Satisfaction 310 79.0 19.2 551 77.7 20.3 ns 321 73.3 21.3 786 70.7 23.1GPA Index (on a scale of 0-100) 291 69.2 23.3 526 70.4 22.5 ns 325 67.8 21.2 789 68.4 19.8***p<.001 **p<.01 *p<.05 ns=not significant
First-Year Women First-Year Men SeniorWomen Senior Men

Table II.1b Means and Standard Deviations of Core Constructs, First-Year Students by URM Status and Gender
n Mean SD n Mean SD n Mean SD n Mean SDFinancial Motivation 225 68.1 24.5 60 68.0 26.0 412 68.8 24.6 89 69.8 25.1Parental Influence Motivation 226 17.7 26.1 61 12.8 21.8 416 15.1 23.1 88 16.9 27.7Social Good Motivation 223 77.0 22.4 58 77.2 19.2 415 75.5 22.6 89 80.0 20.8Mentor Influence Motivation 214 40.8 24.6 56 41.2 26.7 398 34.8 24.3 86 39.1 28.0Intrinsic Psychological Motivation 220 77.9 22.1 59 84.6 16.6 410 79.9 20.6 87 85.3 19.2Intrinsic Behavioral Motivation 221 74.5 25.5 60 82.5 19.3 405 83.1 20.5 88 85.0 22.2Knowledge of Engineering Before College 226 45.9 20.0 61 47.5 23.9 415 50.2 22.0 89 51.7 24.1Self-reported Gains in Knowledge of Engineering Since Entering College 226 64.7 18.9 61 69.0 20.1 415 65.7 20.6 88 72.0 21.4
Mean Number of Sources of Knowledge 226 2.1 1.1 61 1.7 0.9 416 1.9 1.1 89 1.9 1.1Perceived Importance of Math/Science Skills 226 87.0 15.0 61 90.2 14.8 415 86.1 16.4 88 87.4 16.6Perceived Importance of Professional/Interpersonal Skills 226 69.5 15.8 61 73.9 18.1 415 65.0 18.6 89 75.2 17.8
Confidence in Math/Science Skills 225 70.4 17.1 61 66.3 18.3 414 73.1 17.9 89 72.4 16.0Confidence in Professional/Interpersonal Skills 226 67.2 15.9 60 64.4 18.0 414 65.2 16.4 88 66.9 16.4Confidence in Solving Open-Ended Problems 226 74.3 15.1 60 72.0 15.7 415 75.9 15.1 88 76.1 16.1Exposure to Project-Based Leaning: Individual Projects 226 63.2 28.0 61 58.7 29.9 412 63.0 28.5 89 55.6 29.5
Exposure to Project-Based Leaning: Team Projects 226 59.1 25.6 61 50.5 25.7 412 51.8 26.0 89 57.8 28.0
Frequency of Interaction with Instructors 225 35.7 18.5 61 38.9 25.4 413 34.2 19.3 87 39.9 22.6Satisfaction with Instructors 206 71.3 16.3 54 71.0 15.9 385 72.5 16.4 81 74.4 19.7Curriculum Overload 224 57.5 16.2 61 54.7 21.0 412 50.1 18.3 89 47.3 20.0Pressure to Balance Social and Academic Lives 224 48.8 22.7 61 46.8 25.5 414 43.0 24.1 89 44.0 24.0Academic Involvement - Liberal Arts Courses 216 76.6 16.8 57 72.2 22.8 387 72.5 20.2 78 69.9 19.9Academic Involvement - Engineering Courses 214 77.3 16.2 56 80.1 13.9 395 76.4 16.8 87 77.0 16.2Frequency of Engineering Extracurricular Participation 225 35.0 27.9 61 39.3 1.0 414 24.0 0.8 89 34.5 28.6
Importance of Non-engineering Extracurricular Participation 226 61.7 30.4 61 59.6 0.7 415 56.0 0.9 89 60.3 29.2
Frequency of Non-engineering Extracurricular Participation 226 76.7 27.1 61 74.3 0.8 414 69.0 0.9 89 66.0 27.5
Exposure to Engineering Profession 225 31.4 28.9 60 38.9 1.1 413 34.7 0.9 88 39.8 33.8Overall Satisfaction 226 82.0 18.6 60 69.0 0.5 411 78.3 0.6 88 75.3 19.9GPA Index (on a scale of 0-100) 210 70.7 22.4 58 65.0 25.1 399 72.4 21.7 82 61.5 23.5
First-Year Non-URM Women First-Year URM Women
First-Year Non-URM Men First-Year URM Men

Table II.1c Means and Standard Deviations of Core Constructs, Seniors by URM Status and Gender
n Mean SD n Mean SD n Mean SD n Mean SDFinancial Motivation 231 66.1 25.6 75 66.1 26.0 587 65.4 24.8 122 67.8 24.5Parental Influence Motivation 233 16.0 26.9 75 16.4 27.5 591 13.8 23.7 122 10.7 22.2Social Good Motivation 230 72.5 23.8 74 79.7 21.2 587 72.8 23.6 119 82.9 19.8Mentor Influence Motivation 227 42.6 26.4 73 41.1 28.2 575 33.7 25.1 120 35.7 27.1Intrinsic Psychological Motivation 230 75.9 24.1 73 83.9 21.0 575 78.8 20.9 119 87.2 16.4Intrinsic Behavioral Motivation 229 75.1 27.1 72 80.8 28.2 565 86.5 20.5 120 89.4 17.8Knowledge of Engineering Before College 233 39.5 21.8 75 42.2 20.7 594 43.5 21.7 122 42.1 22.6Self-reported Gains in Knowledge of Engineering Since Entering College 233 81.7 19.0 75 84.3 17.6 594 82.0 19.7 122 87.7 19.7
q29sourcesum 233 2.4 1.2 75 2.2 1.2 594 2.3 1.3 122 2.2 1.3Perceived Importance of Math/Science Skills 233 80.2 18.0 75 84.6 19.0 593 78.7 18.5 122 82.5 17.1Perceived Importance of Professional/Interpersonal Skills 233 67.2 17.6 75 78.7 14.2 594 63.9 17.4 122 72.4 17.5
Confidence in Math/Science Skills 233 70.4 17.2 75 70.0 16.7 593 73.0 17.1 122 76.0 16.3Confidence in Professional/Interpersonal Skills 233 67.7 14.8 75 73.9 15.3 592 69.2 17.4 122 70.5 15.7Confidence in Solving Open-Ended Problems 232 74.9 14.4 74 78.3 14.6 592 79.3 15.4 122 81.3 14.5Exposure to Project-Based Leaning: Individual Projects 231 58.7 28.6 75 62.4 27.7 593 59.0 27.2 122 61.4 25.7
Exposure to Project-Based Leaning: Team Projects 231 69.4 25.1 75 73.6 26.1 593 62.5 25.8 122 66.9 26.3
Frequency of Interaction with Instructors 231 45.2 22.4 75 49.1 22.4 590 43.1 21.1 122 46.2 17.8Satisfaction with Instructors 217 65.1 21.2 72 58.7 21.1 567 63.6 20.8 118 67.3 22.1Curriculum Overload 232 57.5 18.1 74 56.9 18.5 593 52.6 18.6 121 49.1 21.7Pressure to Balance Social and Academic Lives 233 53.8 22.6 75 52.0 25.5 593 48.6 24.2 121 44.6 27.2Academic Involvement - Liberal Arts Courses 201 63.5 23.0 68 60.8 22.2 533 61.0 22.1 111 58.5 27.2Academic Involvement - Engineering Courses 233 64.4 20.5 72 66.1 20.6 587 66.3 19.5 119 66.0 20.9Frequency of Engineering Extracurricular Participation 233 49.5 34.1 75 53.0 34.7 591 34.6 31.8 122 44.0 30.4
Importance of Non-engineering Extracurricular Participation 232 64.7 32.8 75 64.4 30.2 590 59.5 34.2 122 58.2 33.4
Frequency of Non-engineering Extracurricular Participation 231 79.7 26.1 75 72.0 31.0 593 72.3 31.4 122 66.0 31.9
Exposure to Engineering Profession 232 68.7 32.1 75 72.0 31.0 594 68.0 35.1 122 63.1 35.3Overall Satisfaction 230 74.6 20.4 73 68.0 24.5 587 70.6 23.2 122 71.9 22.7GPA Index (on a scale of 0-100) 233 71.0 20.0 74 57.7 23.0 590 68.9 19.5 122 65.3 19.9
Senior Non-URM Women Senior URM Women Senior Non-URM Men Senior URM Men

Table II.2a Simple Correlation Coefficients: Academic Experiences Among First-Year Women

Table II.2b Simple Correlation Coefficients: Academic Experiences Among First-Year Men

Appendix II.3. Calculating APPLES2 Multi-Item Variables Survey items and internal consistency Multi-item variables were developed over successive administrations of the Persistence in Engineering (PIE) survey, based prior research on factors that influence the engineering college experience and persistence as described in Chapter 1. Individual survey items that comprise each multi-item variable are listed below. Footnotes show the scale for each individual item. Cronbach’s alpha values are listed in parentheses. For full text of survey questions, see the APPLES survey instrument in Appendix I.1 (the survey question number of each item is listed in far left column).
1. Motivation: Financial (α=.81) 9b. Reason: Engineers make more money than most other professionals1 9e. Reason: Engineers are well paid1 9g. Reason: An engineering degree will guarantee me a job when I graduate1
2. Motivation: Parental Influence (α=.83) 9c. Reason: My parents would disapprove if I chose a major other than engineering1 9f. Reason: My parents want me to be an engineer1
3. Motivation: Social Good (α=.77) 9a. Reason: Technology plays an important role in solving society's problems1 9d. Reason: Engineers have contributed greatly to fixing problems in the world1 9n. Reason: Engineering skills can be used for the good of society1
4. Motivation: Mentor Influence (α=.77) 9h. Reason: A faculty member, academic advisor, teaching assistant or other
university affiliated person has encouraged and/or inspired me to study engineering1
9i. Reason: A non-university affiliated mentor has encouraged and/or inspired me to study engineering1
9j. Reason: A mentor has introduced me to people and opportunities in engineering1 10c. Agree/disagree: A mentor has supported my decision to major in engineering2
5. Motivation: Intrinsic Psychological (α=.75) 9k. Reason: I feel good when I am doing engineering1
9m. Reason: I think engineering is fun1 9o. Reason: I think engineering is interesting1
6. Motivation: Intrinsic Behavioral (α=.72) 9l. Reason: I like to build stuff1 9p. Reason: I like to figure out how things work1
7. Confidence in Math and Science Skills (α=.80) 11d. Confidence: Math ability3

11e. Confidence: Science ability3
11g. Confidence: Ability to apply math and science principles in solving real world problems3
8. Confidence in Professional and Interpersonal Skills (α=.82) 11a. Confidence: Self confidence (social)3
11b. Confidence: Leadership ability3
11c. Confidence: Public speaking ability3 11f. Confidence: Communication skills3
11h. Confidence: Business ability3
11i. Confidence: Ability to perform in teams3
9. Confidence in Solving Open-Ended Problems (α=.65)
10a. Agree/disagree: Creative thinking is one of my strengths2
10b. Agree/disagree: I am skilled at solving problems with multiple solutions2
11j. Confidence: Critical thinking skills3
10. Perceived Importance of Math and Science Skills (α=.80)
12d. Perceived importance: Math ability4
12e. Perceived importance: Science ability4
12g. Perceived importance: Ability to apply math and science principles in solving real world problems4
11. Perceived Importance of Professional and Interpersonal Skills (α=.82)
12a. Perceived importance: Self confidence (social)4
12b. Perceived importance: Leadership ability4
12c. Perceived importance: Public speaking ability4
12f. Perceived importance: Communication skills4
12h. Perceived importance: Business ability4
12i. Perceived importance: Ability to perform in teams4
12. Curriculum Overload (α=.82)
18. How well are you meeting the workload demands of your coursework?5
19. How stressed do you feel in your coursework right now?6
20a. During the current year, how much pressure have you felt with course load?7
20b. During the current year, how much pressure have you felt with course pace?7
20c. During the current year, how much pressure have you felt with balance between social and academic life?7
13. Academic Involvement—Liberal Arts Courses (α=.75)
17a. Frequency: Came late to liberal arts class (reverse-coded)8
17b. Frequency: Skipped liberal arts class (reverse-coded)8
17c. Frequency: Turned in liberal arts assignments that did not reflect your best work (reverse-coded)8
17d. Frequency: Turned in liberal arts assignments late (reverse-coded)8
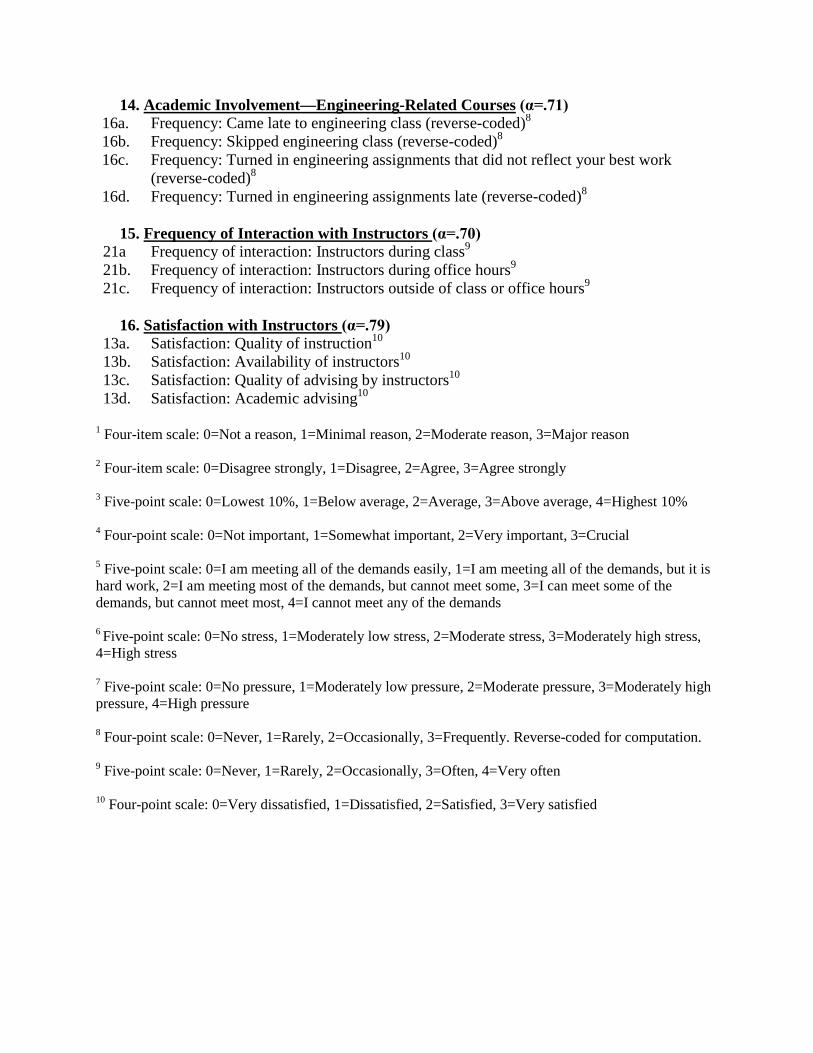
14. Academic Involvement—Engineering-Related Courses (α=.71) 16a. Frequency: Came late to engineering class (reverse-coded)8 16b. Frequency: Skipped engineering class (reverse-coded)8 16c. Frequency: Turned in engineering assignments that did not reflect your best work
(reverse-coded)8 16d. Frequency: Turned in engineering assignments late (reverse-coded)8
15. Frequency of Interaction with Instructors (α=.70)
21a Frequency of interaction: Instructors during class9
21b. Frequency of interaction: Instructors during office hours9 21c. Frequency of interaction: Instructors outside of class or office hours9
16. Satisfaction with Instructors (α=.79)
13a. Satisfaction: Quality of instruction10
13b. Satisfaction: Availability of instructors10 13c. Satisfaction: Quality of advising by instructors10
13d. Satisfaction: Academic advising10
1 Four-item scale: 0=Not a reason, 1=Minimal reason, 2=Moderate reason, 3=Major reason 2 Four-item scale: 0=Disagree strongly, 1=Disagree, 2=Agree, 3=Agree strongly 3 Five-point scale: 0=Lowest 10%, 1=Below average, 2=Average, 3=Above average, 4=Highest 10% 4 Four-point scale: 0=Not important, 1=Somewhat important, 2=Very important, 3=Crucial 5 Five-point scale: 0=I am meeting all of the demands easily, 1=I am meeting all of the demands, but it is hard work, 2=I am meeting most of the demands, but cannot meet some, 3=I can meet some of the demands, but cannot meet most, 4=I cannot meet any of the demands 6 Five-point scale: 0=No stress, 1=Moderately low stress, 2=Moderate stress, 3=Moderately high stress, 4=High stress 7 Five-point scale: 0=No pressure, 1=Moderately low pressure, 2=Moderate pressure, 3=Moderately high pressure, 4=High pressure 8 Four-point scale: 0=Never, 1=Rarely, 2=Occasionally, 3=Frequently. Reverse-coded for computation. 9 Five-point scale: 0=Never, 1=Rarely, 2=Occasionally, 3=Often, 4=Very often 10 Four-point scale: 0=Very dissatisfied, 1=Dissatisfied, 2=Satisfied, 3=Very satisfied
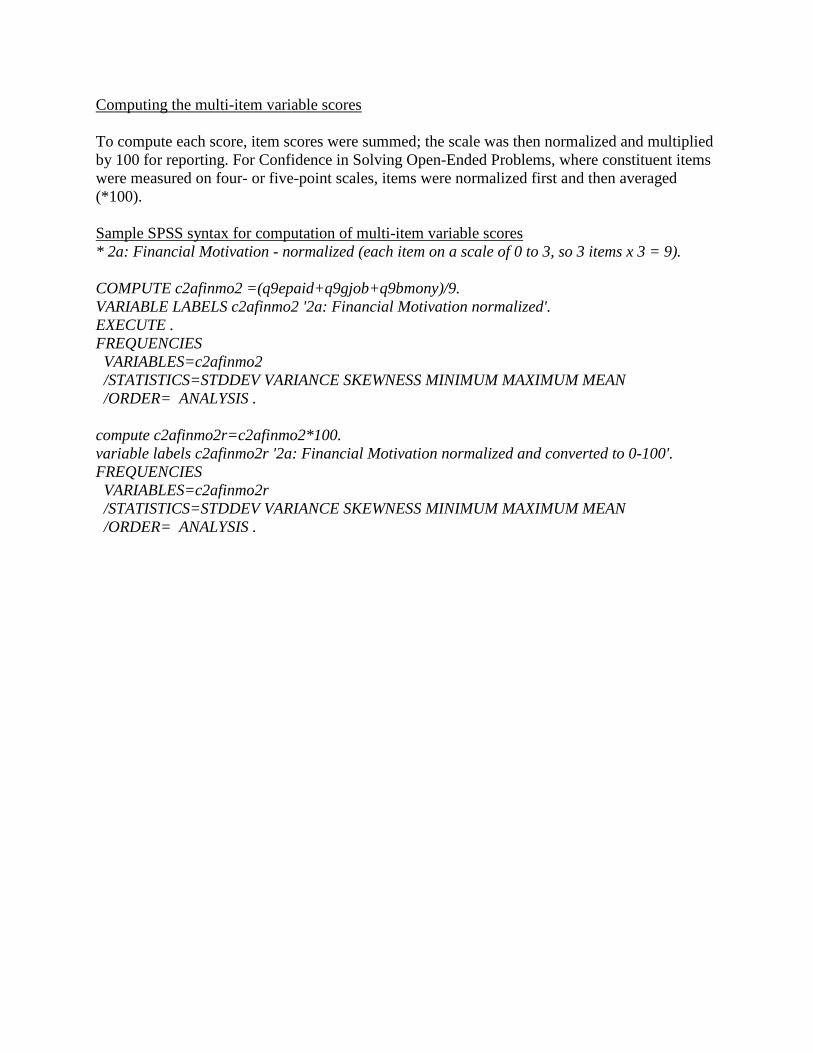
Computing the multi-item variable scores To compute each score, item scores were summed; the scale was then normalized and multiplied by 100 for reporting. For Confidence in Solving Open-Ended Problems, where constituent items were measured on four- or five-point scales, items were normalized first and then averaged (*100). Sample SPSS syntax for computation of multi-item variable scores * 2a: Financial Motivation - normalized (each item on a scale of 0 to 3, so 3 items x 3 = 9). COMPUTE c2afinmo2 =(q9epaid+q9gjob+q9bmony)/9. VARIABLE LABELS c2afinmo2 '2a: Financial Motivation normalized'. EXECUTE . FREQUENCIES VARIABLES=c2afinmo2 /STATISTICS=STDDEV VARIANCE SKEWNESS MINIMUM MAXIMUM MEAN /ORDER= ANALYSIS . compute c2afinmo2r=c2afinmo2*100. variable labels c2afinmo2r '2a: Financial Motivation normalized and converted to 0-100'. FREQUENCIES VARIABLES=c2afinmo2r /STATISTICS=STDDEV VARIANCE SKEWNESS MINIMUM MAXIMUM MEAN /ORDER= ANALYSIS .

Exploring the Engineering Student Experience
Appendix II.2
Simple Correlation Coefficients: First-Year Students
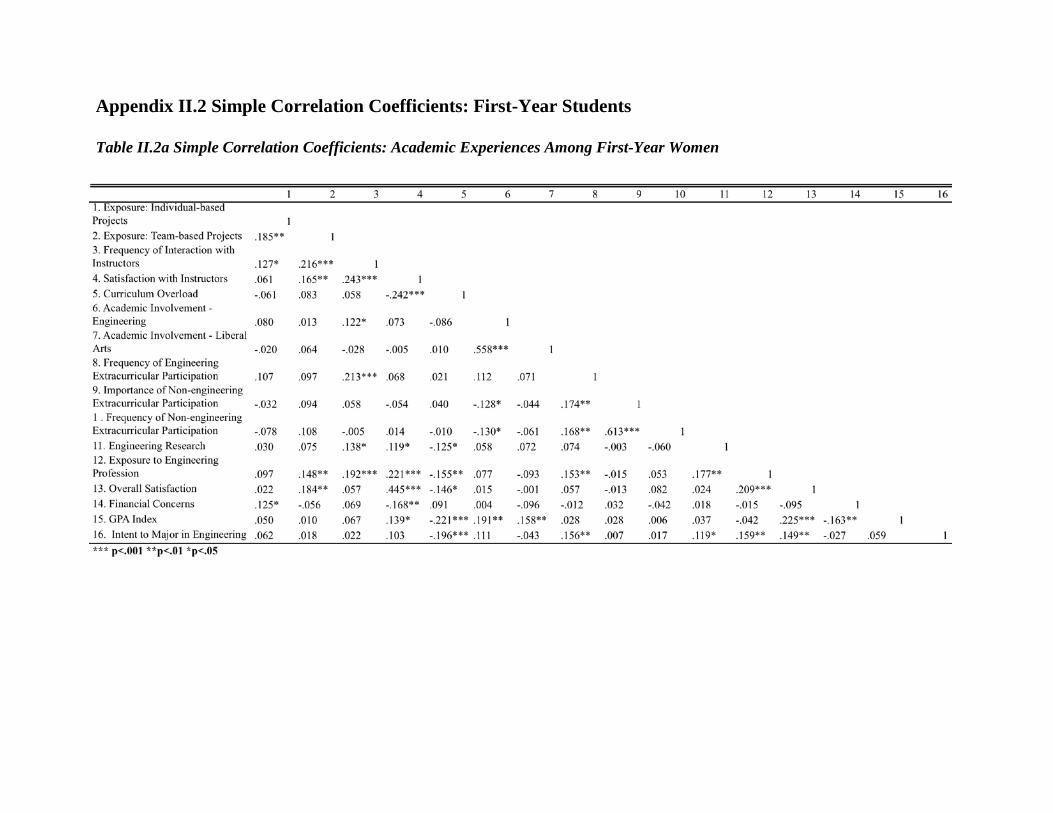
Appendix II.2 Simple Correlation Coefficients: First-Year Students Table II.2a Simple Correlation Coefficients: Academic Experiences Among First-Year Women

Table II.2b Simple Correlation Coefficients: Academic Experiences Among First-Year Men


Exploring the Engineering Student Experience
Appendix II.3
Calculating APPLES Multi-Item Variables

Appendix II.3 Calculating APPLES Multi-Item Variables
Survey items and internal consistency Multi-item variables were developed over successive administrations of the Persistence in Engineering (PIE) survey, based prior research on factors that influence the engineering college experience and persistence as described in Chapter 1. Individual survey items that comprise each multi-item variable are listed below. Footnotes show the scale for each individual item. Cronbach’s alpha values are listed in parentheses. For full text of survey questions, see the APPLES survey instrument in Appendix I.1 (the survey question number of each item is listed in far left column).
1. Motivation: Financial (α=.81) 9b. Reason: Engineers make more money than most other professionals1 9e. Reason: Engineers are well paid1 9g. Reason: An engineering degree will guarantee me a job when I graduate1
2. Motivation: Parental Influence (α=.83) 9c. Reason: My parents would disapprove if I chose a major other than engineering1 9f. Reason: My parents want me to be an engineer1
3. Motivation: Social Good (α=.77) 9a. Reason: Technology plays an important role in solving society's problems1 9d. Reason: Engineers have contributed greatly to fixing problems in the world1 9n. Reason: Engineering skills can be used for the good of society1
4. Motivation: Mentor Influence (α=.77) 9h. Reason: A faculty member, academic advisor, teaching assistant or other
university affiliated person has encouraged and/or inspired me to study engineering1
9i. Reason: A non-university affiliated mentor has encouraged and/or inspired me to study engineering1
9j. Reason: A mentor has introduced me to people and opportunities in engineering1 10c. Agree/disagree: A mentor has supported my decision to major in engineering2
5. Motivation: Intrinsic Psychological (α=.75) 9k. Reason: I feel good when I am doing engineering1
9m. Reason: I think engineering is fun1 9o. Reason: I think engineering is interesting1
6. Motivation: Intrinsic Behavioral (α=.72) 9l. Reason: I like to build stuff1 9p. Reason: I like to figure out how things work1

7. Confidence in Math and Science Skills (α=.80) 11d. Confidence: Math ability3
11e. Confidence: Science ability3
11g. Confidence: Ability to apply math and science principles in solving real world problems3
8. Confidence in Professional and Interpersonal Skills (α=.82) 11a. Confidence: Self confidence (social)3
11b. Confidence: Leadership ability3
11c. Confidence: Public speaking ability3 11f. Confidence: Communication skills3
11h. Confidence: Business ability3
11i. Confidence: Ability to perform in teams3
9. Confidence in Solving Open-Ended Problems (α=.65)
10a. Agree/disagree: Creative thinking is one of my strengths2
10b. Agree/disagree: I am skilled at solving problems with multiple solutions2
11j. Confidence: Critical thinking skills3
10. Perceived Importance of Math and Science Skills (α=.80)
12d. Perceived importance: Math ability4
12e. Perceived importance: Science ability4
12g. Perceived importance: Ability to apply math and science principles in solving real world problems4
11. Perceived Importance of Professional and Interpersonal Skills (α=.82)
12a. Perceived importance: Self confidence (social)4
12b. Perceived importance: Leadership ability4
12c. Perceived importance: Public speaking ability4
12f. Perceived importance: Communication skills4
12h. Perceived importance: Business ability4
12i. Perceived importance: Ability to perform in teams4
12. Curriculum Overload (α=.82)
18. How well are you meeting the workload demands of your coursework?5
19. How stressed do you feel in your coursework right now?6
20a. During the current year, how much pressure have you felt with course load?7
20b. During the current year, how much pressure have you felt with course pace?7
20c. During the current year, how much pressure have you felt with balance between social and academic life?7

13. Academic Involvement—Liberal Arts Courses (α=.75) 17a. Frequency: Came late to liberal arts class (reverse-coded)8
17b. Frequency: Skipped liberal arts class (reverse-coded)8
17c. Frequency: Turned in liberal arts assignments that did not reflect your best work (reverse-coded)8
17d. Frequency: Turned in liberal arts assignments late (reverse-coded)8
14. Academic Involvement—Engineering-Related Courses (α=.71)
16a. Frequency: Came late to engineering class (reverse-coded)8 16b. Frequency: Skipped engineering class (reverse-coded)8 16c. Frequency: Turned in engineering assignments that did not reflect your best work
(reverse-coded)8 16d. Frequency: Turned in engineering assignments late (reverse-coded)8
15. Frequency of Interaction with Instructors (α=.70)
21a Frequency of interaction: Instructors during class9
21b. Frequency of interaction: Instructors during office hours9 21c. Frequency of interaction: Instructors outside of class or office hours9
16. Satisfaction with Instructors (α=.79)
13a. Satisfaction: Quality of instruction10
13b. Satisfaction: Availability of instructors10 13c. Satisfaction: Quality of advising by instructors10
13d. Satisfaction: Academic advising10
1 Four-item scale: 0=Not a reason, 1=Minimal reason, 2=Moderate reason, 3=Major reason 2 Four-item scale: 0=Disagree strongly, 1=Disagree, 2=Agree, 3=Agree strongly 3 Five-point scale: 0=Lowest 10%, 1=Below average, 2=Average, 3=Above average, 4=Highest 10% 4 Four-point scale: 0=Not important, 1=Somewhat important, 2=Very important, 3=Crucial 5 Five-point scale: 0=I am meeting all of the demands easily, 1=I am meeting all of the demands, but it is hard work, 2=I am meeting most of the demands, but cannot meet some, 3=I can meet some of the demands, but cannot meet most, 4=I cannot meet any of the demands 6 Five-point scale: 0=No stress, 1=Moderately low stress, 2=Moderate stress, 3=Moderately high stress, 4=High stress 7 Five-point scale: 0=No pressure, 1=Moderately low pressure, 2=Moderate pressure, 3=Moderately high pressure, 4=High pressure 8 Four-point scale: 0=Never, 1=Rarely, 2=Occasionally, 3=Frequently. Reverse-coded for computation. 9 Five-point scale: 0=Never, 1=Rarely, 2=Occasionally, 3=Often, 4=Very often 10 Four-point scale: 0=Very dissatisfied, 1=Dissatisfied, 2=Satisfied, 3=Very satisfied

Computing the multi-item variable scores To compute each score, item scores were summed; the scale was then normalized and multiplied by 100 for reporting. For Confidence in Solving Open-Ended Problems, where constituent items were measured on four- or five-point scales, items were normalized first and then averaged (*100). Sample SPSS syntax for computation of multi-item variable scores * 2a: Financial Motivation - normalized (each item on a scale of 0 to 3, so 3 items x 3 = 9). COMPUTE c2afinmo2 =(q9epaid+q9gjob+q9bmony)/9. VARIABLE LABELS c2afinmo2 '2a: Financial Motivation normalized'. EXECUTE . FREQUENCIES VARIABLES=c2afinmo2 /STATISTICS=STDDEV VARIANCE SKEWNESS MINIMUM MAXIMUM MEAN /ORDER= ANALYSIS . compute c2afinmo2r=c2afinmo2*100. variable labels c2afinmo2r '2a: Financial Motivation normalized and converted to 0-100'. FREQUENCIES VARIABLES=c2afinmo2r /STATISTICS=STDDEV VARIANCE SKEWNESS MINIMUM MAXIMUM MEAN /ORDER= ANALYSIS .


Exploring the Engineering Student Experience
Appendix IV
Methodological Notes for Regressions
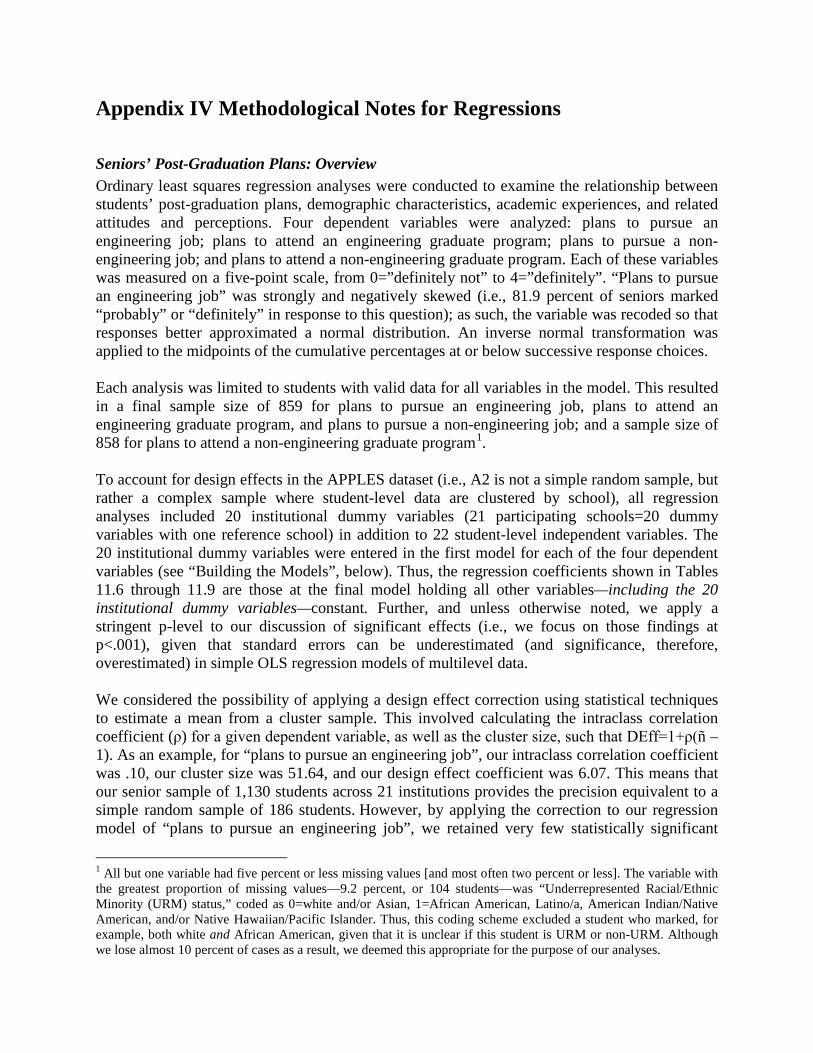
Appendix IV Methodological Notes for Regressions Seniors’ Post-Graduation Plans: Overview Ordinary least squares regression analyses were conducted to examine the relationship between students’ post-graduation plans, demographic characteristics, academic experiences, and related attitudes and perceptions. Four dependent variables were analyzed: plans to pursue an engineering job; plans to attend an engineering graduate program; plans to pursue a non-engineering job; and plans to attend a non-engineering graduate program. Each of these variables was measured on a five-point scale, from 0=”definitely not” to 4=”definitely”. “Plans to pursue an engineering job” was strongly and negatively skewed (i.e., 81.9 percent of seniors marked “probably” or “definitely” in response to this question); as such, the variable was recoded so that responses better approximated a normal distribution. An inverse normal transformation was applied to the midpoints of the cumulative percentages at or below successive response choices. Each analysis was limited to students with valid data for all variables in the model. This resulted in a final sample size of 859 for plans to pursue an engineering job, plans to attend an engineering graduate program, and plans to pursue a non-engineering job; and a sample size of 858 for plans to attend a non-engineering graduate program1. To account for design effects in the APPLES dataset (i.e., A2 is not a simple random sample, but rather a complex sample where student-level data are clustered by school), all regression analyses included 20 institutional dummy variables (21 participating schools=20 dummy variables with one reference school) in addition to 22 student-level independent variables. The 20 institutional dummy variables were entered in the first model for each of the four dependent variables (see “Building the Models”, below). Thus, the regression coefficients shown in Tables 11.6 through 11.9 are those at the final model holding all other variables—including the 20 institutional dummy variables—constant. Further, and unless otherwise noted, we apply a stringent p-level to our discussion of significant effects (i.e., we focus on those findings at p<.001), given that standard errors can be underestimated (and significance, therefore, overestimated) in simple OLS regression models of multilevel data. We considered the possibility of applying a design effect correction using statistical techniques to estimate a mean from a cluster sample. This involved calculating the intraclass correlation coefficient (ρ) for a given dependent variable, as well as the cluster size, such that DEff=1+ρ(ñ – 1). As an example, for “plans to pursue an engineering job”, our intraclass correlation coefficient was .10, our cluster size was 51.64, and our design effect coefficient was 6.07. This means that our senior sample of 1,130 students across 21 institutions provides the precision equivalent to a simple random sample of 186 students. However, by applying the correction to our regression model of “plans to pursue an engineering job”, we retained very few statistically significant
1 All but one variable had five percent or less missing values [and most often two percent or less]. The variable with the greatest proportion of missing values—9.2 percent, or 104 students—was “Underrepresented Racial/Ethnic Minority (URM) status,” coded as 0=white and/or Asian, 1=African American, Latino/a, American Indian/Native American, and/or Native Hawaiian/Pacific Islander. Thus, this coding scheme excluded a student who marked, for example, both white and African American, given that it is unclear if this student is URM or non-URM. Although we lose almost 10 percent of cases as a result, we deemed this appropriate for the purpose of our analyses.

predictors, and we judged the correction too conservative and not wholly appropriate for our regression models. Future analyses of APPLES data will employ hierarchical linear modeling techniques to address clustering and generate more robust standard errors, examining the effects of both student and institutional characteristics simultaneously. Seniors’ Post-Graduation Plans: Building the Models For the purpose of this report, we present and discuss regression coefficients for all student-level variables in the final model. However, variables were blocked and tested hierarchically, such that demographic characteristics, for instance, were controlled before academic experiences. This corresponds to a total of six successive models for each dependent variable: Model 1
1. 20 institutional dummy variables Model 2
1. 20 institutional dummy variables 2. Student demographic characteristics: gender, URM status, mother’s education, family
income Model 3
1. 20 institutional dummy variables 2. Student demographic characteristics: gender, URM status, mother’s education, family
income 3. Student motivation for studying engineering: financial, parental, social good, mentor,
intrinsic psychological, intrinsic behavioral Model 4
1. 20 institutional dummy variables 2. Student demographic characteristics: gender, URM status, mother’s education, family
income 3. Student motivation for studying engineering: financial, parental, social good, mentor,
intrinsic psychological, intrinsic behavioral 4. Student academic experiences: Exposure to engineering profession, academic
involvement in engineering, frequency of interaction with instructors, extracurricular participation in engineering activities, engineering research, extracurricular participation in non-engineering activities
Model 5
1. 20 institutional dummy variables 2. Student demographic characteristics: gender, URM status, mother’s education, family
income 3. Student motivation for studying engineering: financial, parental, social good, mentor,
intrinsic psychological, intrinsic behavioral 4. Student academic experiences: exposure to engineering profession, academic
involvement in engineering, frequency of interaction with instructors, extracurricular

participation in engineering activities, engineering research, extracurricular participation in non-engineering activities
5. Student academic factors gains in engineering knowledge since entering college, GPA, satisfaction with instructors
Model 6 (final model, 42 independent variables)
1. 20 institutional dummy variables 2. Student demographic characteristics: gender, URM status, mother’s education, family
income 3. Student motivation for studying engineering: financial, parental, social good, mentor,
intrinsic psychological, intrinsic behavioral 4. Student academic experiences: exposure to engineering profession, academic
involvement in engineering, frequency of interaction with instructors, extracurricular participation in engineering activities, engineering research, extracurricular participation in non-engineering activities
5. Student academic factors: gains in engineering knowledge since entering college, GPA, satisfaction with instructors
6. Student affective measures and “outcomes”: confidence in math and science skills, confidence in professional and interpersonal skills, perceived importance of professional and interpersonal skills to engineering
The development of our hierarchical models was partly guided by Astin’s Input-Environment-Outcome model of student assessment, which stipulates that in order to assess the unique relationship between students’ experiences on campus and key educational outcomes, we must control for students’ characteristics at time of college entry. This allows for more unbiased estimates of environmental impact, given that students to some degree self-select their college environments and experiences. Both Astin’s Input-Environment-Outcome model and other theories of student development guided our selection of independent variables. We were interested in the role of both curricular and extracurricular measures of student involvement in campus life, given that both can lead to positive outcomes in learning, personal growth, and persistence (our survey items were focused on engineering-based curricular and extracurricular activities, rather than non-engineering activities). We opted to forego analysis of “knowledge sources” and major (whether specific field or simply “single versus double major”) in these models, in order to bring focus and definition to our scope; future analyses will consider these variables more extensively. These analyses also were exploratory in nature. That is, we did not test specific a priori hypotheses in our regression models; rather, we hoped to learn more about the interrelationships between our core constructs, and build statistically robust regression models in doing so. This means that over the course of our analyses, we tested several independent variables that did not “make it” into our final set of models because they did not add to the overall strength of the models (i.e., they did not add to significant changes in R-square, and had small, nonsignificant regression coefficients)—and in most cases, did not have strong simple correlations with the dependent variable(s) either. We were also limited in the total number of independent variables that we could test in any one model, given our sample size and the inclusion of 20 institutional
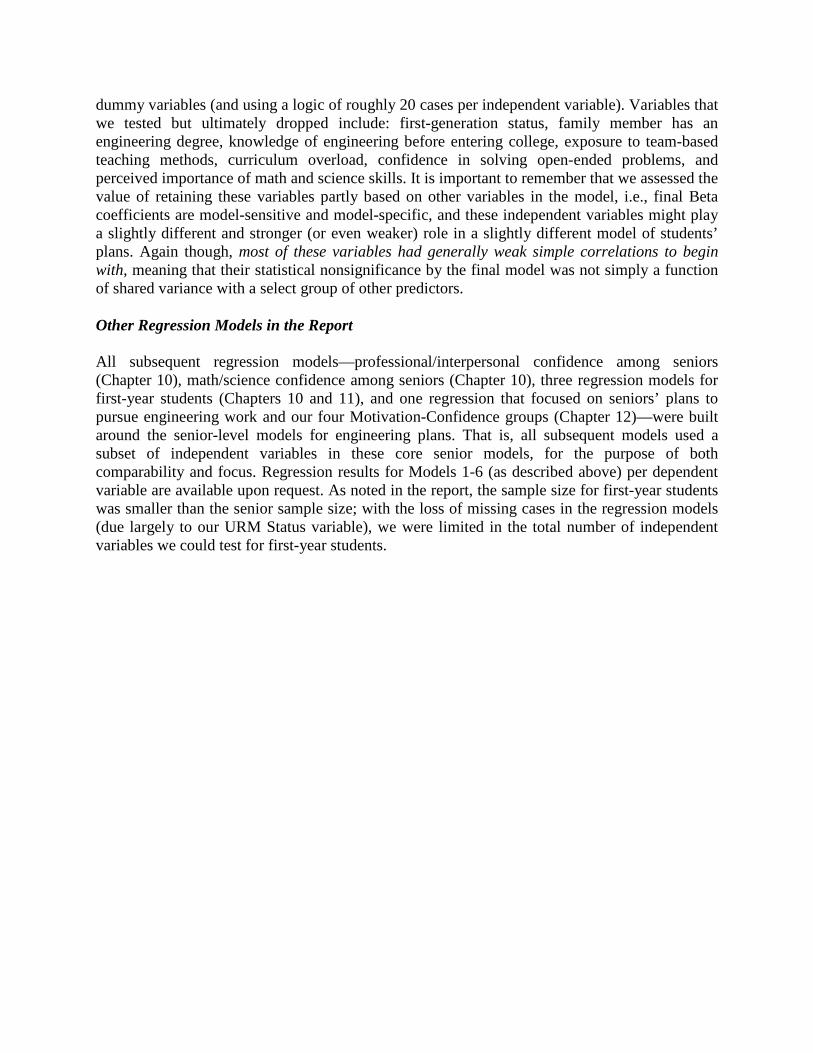
dummy variables (and using a logic of roughly 20 cases per independent variable). Variables that we tested but ultimately dropped include: first-generation status, family member has an engineering degree, knowledge of engineering before entering college, exposure to team-based teaching methods, curriculum overload, confidence in solving open-ended problems, and perceived importance of math and science skills. It is important to remember that we assessed the value of retaining these variables partly based on other variables in the model, i.e., final Beta coefficients are model-sensitive and model-specific, and these independent variables might play a slightly different and stronger (or even weaker) role in a slightly different model of students’ plans. Again though, most of these variables had generally weak simple correlations to begin with, meaning that their statistical nonsignificance by the final model was not simply a function of shared variance with a select group of other predictors. Other Regression Models in the Report All subsequent regression models—professional/interpersonal confidence among seniors (Chapter 10), math/science confidence among seniors (Chapter 10), three regression models for first-year students (Chapters 10 and 11), and one regression that focused on seniors’ plans to pursue engineering work and our four Motivation-Confidence groups (Chapter 12)—were built around the senior-level models for engineering plans. That is, all subsequent models used a subset of independent variables in these core senior models, for the purpose of both comparability and focus. Regression results for Models 1-6 (as described above) per dependent variable are available upon request. As noted in the report, the sample size for first-year students was smaller than the senior sample size; with the loss of missing cases in the regression models (due largely to our URM Status variable), we were limited in the total number of independent variables we could test for first-year students.