exploring the extended continental shelf · pdf filefrontier” for offshore resource...
TRANSCRIPT

EXPLORING THE EXTENDED CONTINENTAL SHELF
Robert van de Poll, CANADIAN
International Manager, Law of the Sea,
Fugro N.V., Leidschendam, The Netherlands
Clive Schofield, AUSTRALIAN
Director of Research,
Australian National Centre for Ocean Resources and Security (ANCORS),
University of Wollongong, Australia
International Workshop on Further Consideration of the Implementation of Article 82 of
the United Nations Convention on the Law of the Sea
Beijing, 26-30 November 2012

Disclaimer
• Every effort has been made to ensure the accuracy of
the graphics/figures contained in this presentation and
the accompanying paper. Nevertheless, these are
necessarily:
Illustrative
Indicative
Independent
Preliminary
• It is requested that the figures contained in this paper are
not quoted without the permission of the authors
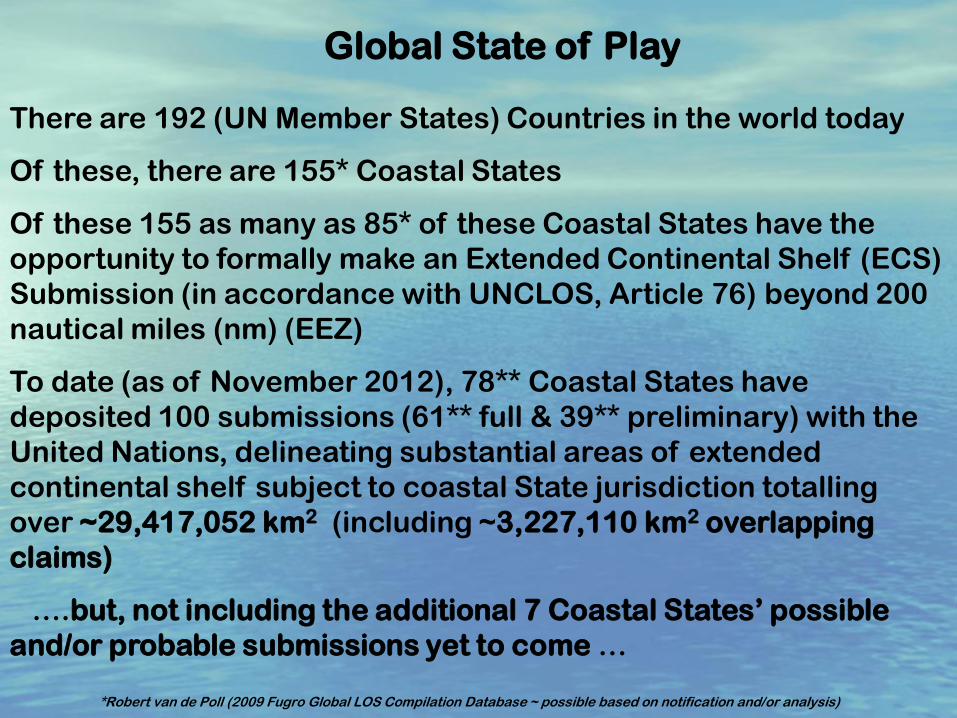
Global State of Play
There are 192 (UN Member States) Countries in the world today
Of these, there are 155* Coastal States
Of these 155 as many as 85* of these Coastal States have the
opportunity to formally make an Extended Continental Shelf (ECS)
Submission (in accordance with UNCLOS, Article 76) beyond 200
nautical miles (nm) (EEZ)
To date (as of November 2012), 78** Coastal States have
deposited 100 submissions (61** full & 39** preliminary) with the
United Nations, delineating substantial areas of extended
continental shelf subject to coastal State jurisdiction totalling
over ~29,417,052 km2 (including ~3,227,110 km2 overlapping
claims)
….but, not including the additional 7 Coastal States’ possible
and/or probable submissions yet to come …
*Robert van de Poll (2009 Fugro Global LOS Compilation Database ~ possible based on notification and/or analysis)
**United Nations Website ~ deposited as of October 2012

State of Play in the Asia-Pacific Region
Of the 78** submitting States, 17*** fall within the Asia-Pacific
Region, encompassing 4,423,471 km2 of possible/probable
extended continental shelf areas.
Overlapping submissions are likely to occur in 12 areas covering a
total area of approximately ~1,168,513 km2, equating to ~26.4% of
total extended continental shelf areas in the Asia-Pacific
Extended continental shelf areas set to become the “Next Frontier” for offshore resource exploration / exploitation for
decades to come.
Offshore resource development implications in the Asia-Pacific
highlighted here focus on Oil & Gas, Gas Hydrates and Seabed
Mining.
**United Nations Website ~ deposited as of October 2012
***Only 16 of the 17 Countries being reviewed supplied claimed Areas
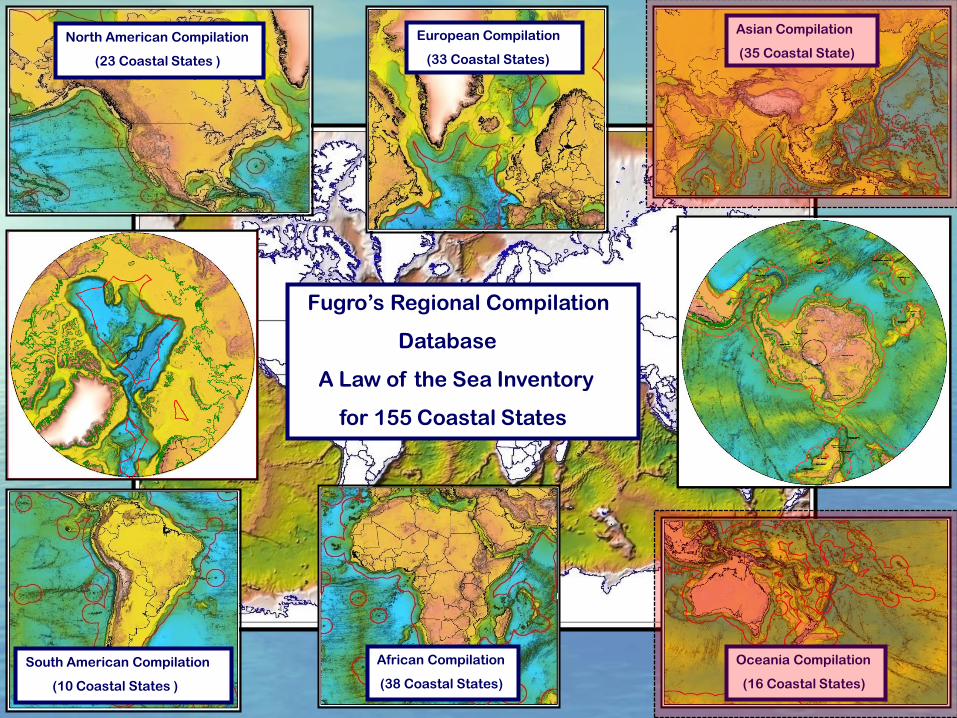
North American Compilation
(23 Coastal States )
Fugro’s Regional Compilation
Database
A Law of the Sea Inventory
for 155 Coastal States
Oceania Compilation
(16 Coastal States)
Asian Compilation
(35 Coastal State)
African Compilation
(38 Coastal States)
European Compilation
(33 Coastal States)
South American Compilation
(10 Coastal States )
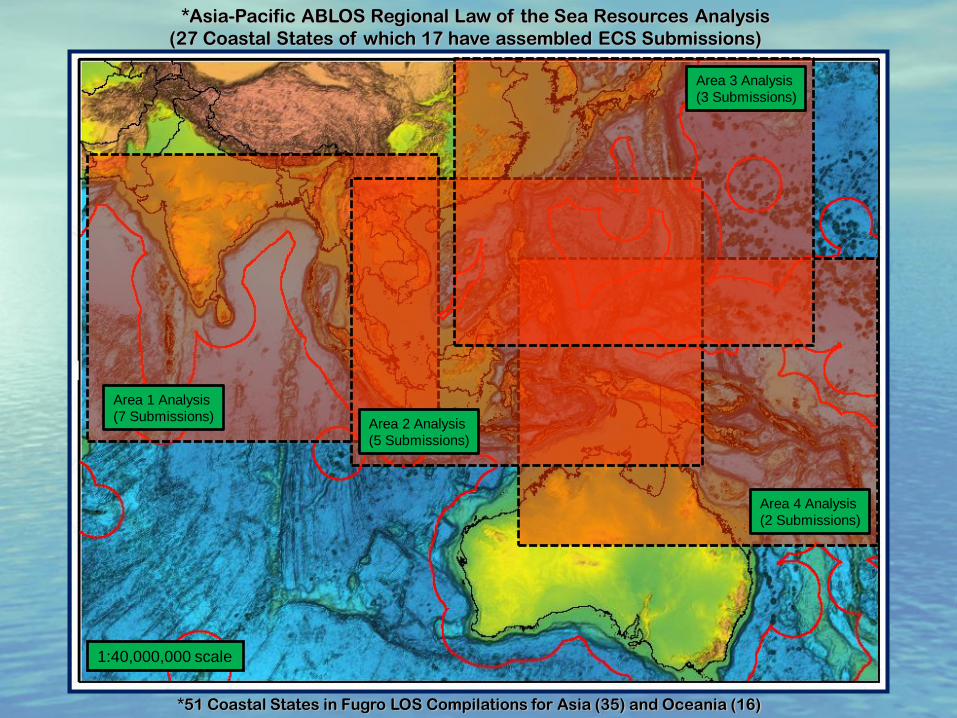
*Asia-Pacific ABLOS Regional Law of the Sea Resources Analysis
(27 Coastal States of which 17 have assembled ECS Submissions)
*51 Coastal States in Fugro LOS Compilations for Asia (35) and Oceania (16)
1:40,000,000 scale
Area 1 Analysis
(7 Submissions)
Area 4 Analysis
(2 Submissions)
Area 2 Analysis
(5 Submissions)
Area 3 Analysis
(3 Submissions)

Area #1 (Arabian Sea / Bay of Bengal ~ 1:18,000,000 scale)
7 ECS Submissions : (Pakistan, India, Maldives, Sri Lanka , Bangladesh, Myanmar (Burma) , Indonesia (Partial)
Maritime Space
(EEZ waters)
5,745,161 km2 Maritime Boundary Agreements
(11 (64.7%))
Maritime Boundary (NO Agreements)
(6 (35.3%)) Pakistan’s Claim
India’s Claim
Maldives Claim
Sri Lanka’s Claim
Bangladesh’s Claim
Myanmar’s Claim
Indonesia’s Claim
UNCLOS (Article 76)
“7 Continental Shelf Claims”
(Submissions = 2,804,007 km2)
ECS Submissions
“3x Overlaps”
(720,647 km2)
Seabed Resources: Oil & Gas
Offshore Concession Blocks
(1,966,597 km2)
~ 34% of EEZ waters
Contentious Blocks Issues
Pakistan’s Claim
India’s Claim
Maldives Claim
Sri Lanka’s Claim
Bangladesh’s Claim
Indonesia’s Claim
Myanmar’s Claim
Seabed Resources: Gas Hydrates
(10 known Locations)
Pakistan’s Claim
India’s Claim
Maldives Claim
Sri Lanka’s Claim
Bangladesh’s Claim
Indonesia’s Claim
Myanmar’s Claim

Area #2 (South China Sea ~ 1:18,000,000 scale)
6 ECS Submissions : (Malaysia, Vietnam, China (Partial), Brunei, Philippines, Palau)
Maritime Boundary Agreements
(12 (36.4%))
Maritime Boundary (NO Agreements)
(21 (63.6%))
Maritime Space
(EEZ waters)
10,797,285 km2
Philippines's Claim
China’s Possible Claim ??
Malaysia’s & Vietnam’s
(Joint) Claim Palau’s Claims
Vietnam’s Claim
Philippines’s
Possible Claim ??
Brunei’s (Assumed) Claim
UNCLOS (Article 76)
“5 Continental Shelf Claims”
(Submissions = 454,429 km2)
ECS Submissions
“1x Overlaps”
(8,044 km2)
Contentious Blocks Issues
Malaysia’s & Vietnam’s
(Joint) Claim
Vietnam’s Claim
Brunei’s (Assumed) Claim
Philippines's Claim
Palau’s Claims
China’s Possible Claim ??
Philippines’s
Possible Claim ??
Seabed Resources: Oil & Gas
Offshore Concession Blocks
(3,446,886 km2)
~ 32% of EEZ waters
Seabed Resources: Gas Hydrates
(6 known Locations)
Malaysia’s & Vietnam’s
(Joint) Claim
Vietnam’s Claim
Brunei’s (Assumed) Claim
Philippines's Claim
Palau’s Claims
China’s Possible Claim ??
Philippines’s
Possible Claim ??

Area #3 (East China Sea / Yellow Sea / Sea of Japan / Philippine Sea ~ 1:18,000,000 scale)
3 ECS Submissions : (China (Partial), South Korea, Japan)
Maritime Space
(EEZ waters)
4,152,195 km2
Maritime Boundary Agreements
(3 (25%))
Maritime Boundary (NO Agreements)
(9 (75%))
China’s Claim (No Area)
Japan’s Claims
South Korea’s Claim
ECS Submissions
“2x Overlaps”
(245,915 km2)
UNCLOS (Article 76)
“2 Continental Shelf Claims”
(Submissions = 760,208 km2)
(No Area supplied by China)
Seabed Resources: Oil & Gas
Offshore Concession Blocks
(1,253,049 km2)
~ 30% of EEZ waters
Contentious Blocks Issues
China’s Claim (No Area)
Japan’s Claims
South Korea’s Claim
Seabed Resources: Gas Hydrates
(6 known Locations)
China’s Claim (No Area)
Japan’s Claims
South Korea’s Claim
Gas Hydrate Reservoirs around Japan
(aprox. 500m – 4500m water depth)
*Gas in place Estimate 71 – 471 TCF
(**aprox. 149,122 km2 (geodetic))
(*Source: Hydrate Energy International (HEI-2008))
(Source: Map interpreted from JAPEX)
1:9,000,000 scale

Area #4 (South Pacific / Coral Sea ~ 1:18,000,000 scale)
*2 ECS Submissions : (Federated States of Micronesia (FSM), Papua New Guinea (PNG))
Maritime Space
(EEZ waters)
7,298,126 km2
Maritime Boundary Agreements
(8 (61.5%))
Maritime Boundary (NO Agreements)
(5 (38.5%))
FSM’s Claims PNG’s Claims
UNCLOS (Article 76)
“*2 Continental Shelf Claims”
(Submissions = 413,827 km2)
(*Partial ~ Both have additional “Joint” claim)
ECS Submissions
“2x Overlaps”
(193,907 km2)
Seabed Resources: Oil & Gas
Offshore Concession Blocks
(418,232 km2)
~ 6% of EEZ waters
FSM’s Claims PNG’s Claims
Seabed Resources: Gas Hydrates
(2 known Locations)
FSM’s Claims PNG’s Claims
Seabed Resources: Seabed Mining
Offshore Concession Blocks
(479,440 km2)
~ 7% of EEZ waters
FSM’s Claims PNG’s Claims
Nautilus Minerals “Solwara-1”
1600 meters water depth
(*Production expected ~2014)
(Source: Nautilus)

Entire Asia-Pacific Study Area ~ 1:40,000,000 scale
*17 ECS Submissions Summary
Maritime Space
(EEZ waters)
27,992,767 km2
(Geodetic)
75 Maritime Boundaries (Studied Countries)
34 Agreements (Total Length = 12,053km)
41 Non-Agreements (Total Length = 15,523km)
54.7% Un-resolved and/or In Dispute
(Globally 59.5% Un-resolved and/or In Dispute)
UNCLOS (Article 76)
“*17 Continental Shelf Claims”
(Submissions = 4,432,471 km2)
(*Full & Preliminary, some partial, no area for China yet)
ECS Submissions
“12x Overlaps”
(1,168,513 km2)
(Aprox. 26.4%)
Seabed Resources: Oil & Gas
Offshore Concession Blocks
(7,084,764 km2)
~ 25.3% of EEZ waters
Seabed Resources: Gas Hydrates
(27 known Locations)
Current Gas Hydrates Estimates in
this Regional Coverage Area
*~4715 TCF Gas (~786 BBOE)
(**197 year Gas Energy Supply for USA)
(*Source : Hydrate Energy International (HEI ~ 2011)
(**Source : 2011 EIA , USA used 24TCF Gas in 2011)
Seabed Resources: Seabed Mining
Offshore Concession Blocks
(479,440 km2)
~ 1.7% of EEZ waters
Asia-Pacific ABLOS Resources Summary ~ 1:40,000,000 scale)
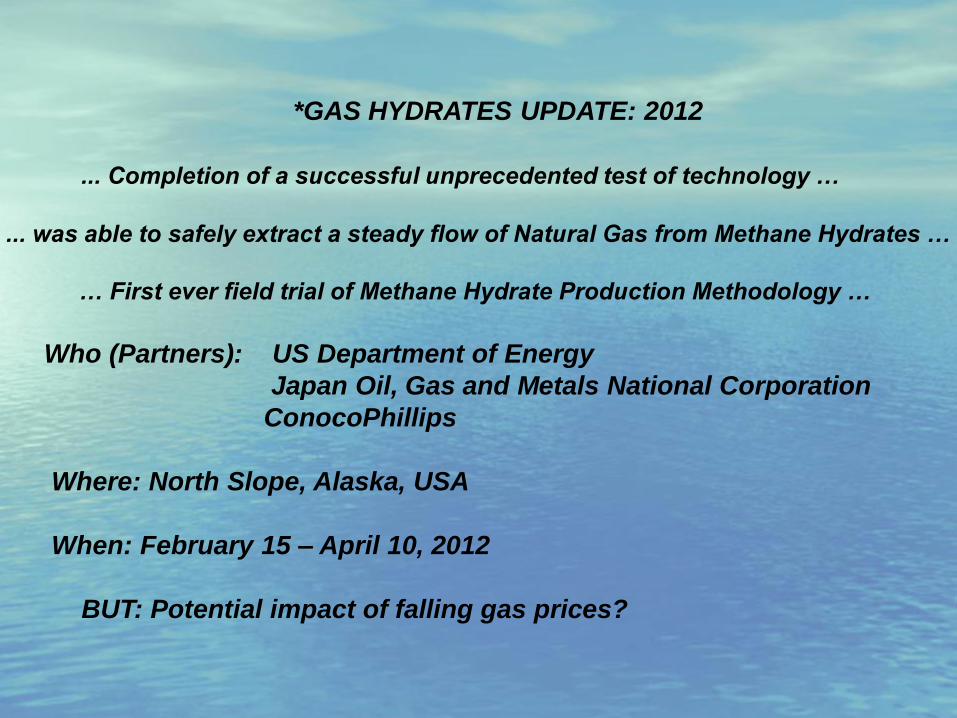
*GAS HYDRATES UPDATE: 2012
... Completion of a successful unprecedented test of technology …
... was able to safely extract a steady flow of Natural Gas from Methane Hydrates …
… First ever field trial of Methane Hydrate Production Methodology …
Who (Partners): US Department of Energy
Japan Oil, Gas and Metals National Corporation
ConocoPhillips
Where: North Slope, Alaska, USA
When: February 15 – April 10, 2012
BUT: Potential impact of falling gas prices?
*http://energy.gov/articles/us-japan-complete-successful-field-trial-methane-hydrate-production-technologies

Estimates of Global deep-sea resources’ value
In 2000, the International Seabed Authority (ISA) estimated the potential of eight non-living
resources (including oil & gas and gas hydrates) within the Extended Legal Continental
Shelf regions (ECLS) worldwide to be US$ 11,934 trillions (June 2000 commodity prices).*
Oil & Gas likely to lead the way:
• Global deepwater capital expenditure 2012-2016 forecast: US$232 billion
• 90% more than 2007-2011
• At least 12 States have issued or defined areas for future bid rounds seawards of 200nm
limit
Only likely to become more significant as:
• On-shore/shallow water resources plateau and decline, demand continues to escalate and
commodity prices rise
*http://energy.gov/articles/us-japan-complete-successful-field-trial-methane-hydrate-production-technologies
The Next Frontier:
Global Importance to securing the Resources
of the Extended Continental Shelf

Gulf of Thailand
5800 – 7800 MBOE
China & Japan
500 MBOE
China, Vietnam, Taiwan, Malaysia,
Brunei and Philippines ( Reed Bank )
200 -300 MBOE
China & Vietnam
400 MBOE
China & Vietnam
300 MBOE
China, Vietnam, Taiwan, Malaysia,
Brunei and Philippines (Spratly Islands)
8000 - 10 000 MBOE
Vietnam &
Indonesia
(Unitization)
400 MBOE
Brunei & Malaysia
1000 - 2000
MBOE
Indonesia &
Malaysia
1000 MBOE
Australia &
Indonesia
2400 MBOE
Australia & Timor
300 MBOE (JPDA)
1800 MBOE (S&T)
SOURCES:
Bishopp, Prescott, Woodmac, CERA
(Note: Ultimate Recovery Figures)
Total Ultimate Potential
(22.1 BBOE – 27.2 BBOE)
NOTE: This slide was presented in 2010 at an
Asian Oil & Gas Conference
*Latest Oil Reserves
USA Oil Reserves = 22.45 BBOE
UK Oil Reserves = 4.50 BBOE
27.2 BBOE is more the USA & UK Reserves
(Tied up in Maritime Boundary Disputes)
*http://www.nationalmaster.com/graph/ene_oil_res-energy-oil-reserves
NOTE: All Boundaries are for illustrative purposes only
Thank You
Questions ???
ROBERT VAN DE POLL
International Manager Law of the Sea
Fugro N.V.
Leidschendam
The Netherlands
CLIVE SCHOFIELD
Director of Research
Australian National Centre for Ocean
Resources and Security (ANCORS)
University of Wollongong
Australia