exploring the impact of the rac program on hospitals
TRANSCRIPT
Exploring the Impact of the RAC Program on Hospitals Nationwide
Results of AHA RACTrac Survey, 3rd Quarter 2010
November 15, 2010

2
RAC 101
• Centers for Medicare & Medicaid Services (CMS) Recovery Audit Contractor (RACs) conduct automated reviews of Medicare payments to health care providers—using computer software to detect improper payments. RACs also conduct complex reviews of provider payments—using human review of medical records and other medical documentation to identify improper payments to providers.
• Improper payments include:– incorrect payment amounts;– incorrectly coded services (including Medicare Severity diagnosis-related
group (MS-DRG) miscoding;– non-covered services (including services that are not reasonable and
necessary); and– duplicate services.
• All four RACs were authorized to begin conducting Medical Necessity Reviews (MNR) in August of 2010.
2

RACTrac Background
• AHA created RACTrac—a free, web-based survey—in response to a lack of data provided by CMS on the impact of the RAC program on America's hospitals.– Hospitals use AHA’s online survey application, RACTrac (accessed at
www.aharactrac.com), to submit their data regarding the impact of the RAC program.
– Survey questions are designed to collect cumulative RAC experience data,from the inception of a hospital’s RAC activity through the 3rd quarter of 2010.
– Survey registration information and RACTrac support can be accessed at [email protected] or 1-888-722-8712.
• Note: When reviewing charts that reference previous quarter activity, please keep in mind that changes are attributable to changes in RAC activity as well as increases in the number of hospitals submitting data to RACTrac.
3
4
Executive Summary
• Nearly 1700 hospitals have participated in RACTrac since we began collecting data in January of 2010.
• Nearly two thirds of the participating hospitals reported experiencing RAC activity.
• RACs are primarily engaging in complex reviews.• $42 million in denied claims have been reported since the first quarter of 2010.• Nearly half of all hospitals with RAC activity reported receiving at least one
underpayment determination.• 46% of hospitals reported appealing at least one RAC denial.• Of the claims that have completed the appeals process, 38% were overturned in
favor of the provider.• 72% of responding hospitals report that the RAC program impacted their
organization in the first quarter of 2010—whether they experienced RAC reviews or not.
4
RACTrac Participation
6
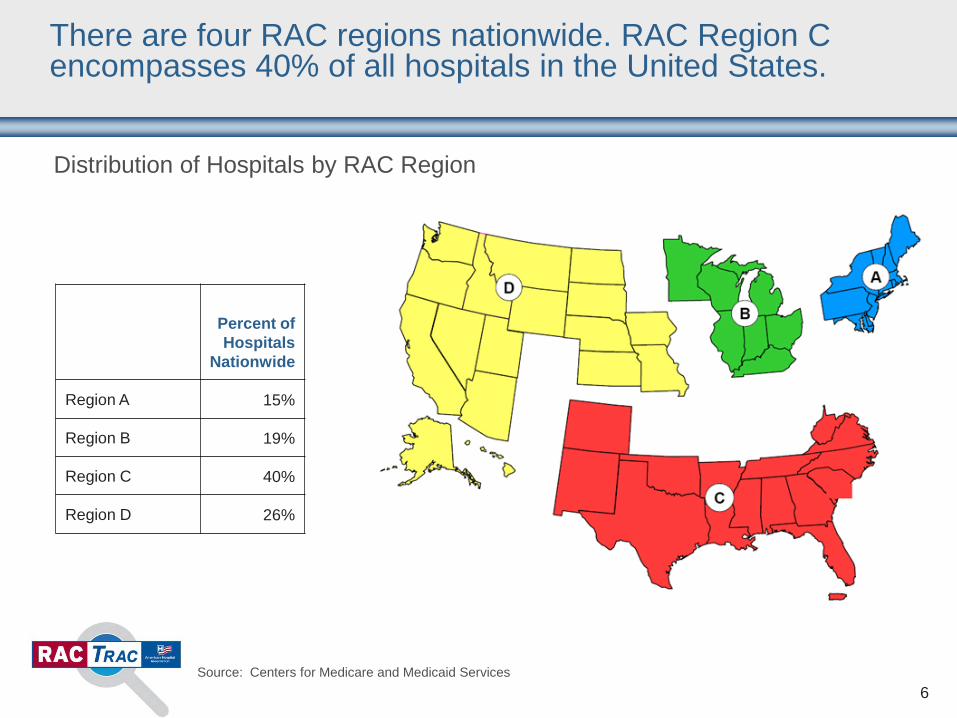
There are four RAC regions nationwide. RAC Region C encompasses 40% of all hospitals in the United States.
Distribution of Hospitals by RAC Region
Source: Centers for Medicare and Medicaid Services
Percent of Hospitals
Nationwide
Region A 15%
Region B 19%
Region C 40%
Region D 26%
7
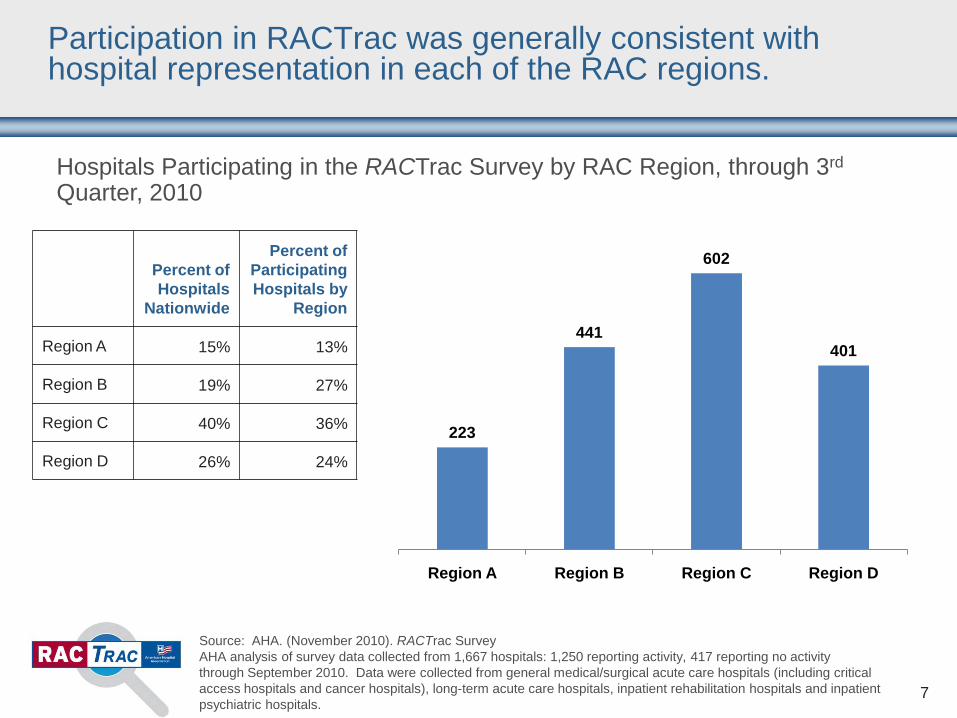
Source: AHA. (November 2010). RACTrac SurveyAHA analysis of survey data collected from 1,667 hospitals: 1,250 reporting activity, 417 reporting no activitythrough September 2010. Data were collected from general medical/surgical acute care hospitals (including critical access hospitals and cancer hospitals), long-term acute care hospitals, inpatient rehabilitation hospitals and inpatient psychiatric hospitals.
Participation in RACTrac was generally consistent with hospital representation in each of the RAC regions.
Hospitals Participating in the RACTrac Survey by RAC Region, through 3rd
Quarter, 2010
Percent of Hospitals
Nationwide
Percent of Participating Hospitals by
Region
Region A 15% 13%
Region B 19% 27%
Region C 40% 36%
Region D 26% 24%
223
441
602
401
Region A Region B Region C Region D

RAC Activity

9
Source: AHA. (November 2010). RACTrac SurveyAHA analysis of survey data collected from 1,667 hospitals: 1,250 reporting activity, 417 reporting no activitythrough September 2010. Data were collected from general medical/surgical acute care hospitals (including critical access hospitals and cancer hospitals), long-term acute care hospitals, inpatient rehabilitation hospitals and inpatient psychiatric hospitals.
Three-fourths of participating hospitals are experiencing RAC activity.
Percent of Responding Hospitals Experiencing RAC Activity, through 3rd Quarter 2010
Experiencing RAC Activity
75%
No RAC Activity25%
10
Source: AHA. (November 2010). RACTrac SurveyAHA analysis of survey data collected from 1,667 hospitals: 1,250 reporting activity, 417 reporting no activitythrough September 2010. Data were collected from general medical/surgical acute care hospitals (including critical access hospitals and cancer hospitals), long-term acute care hospitals, inpatient rehabilitation hospitals and inpatient psychiatric hospitals.
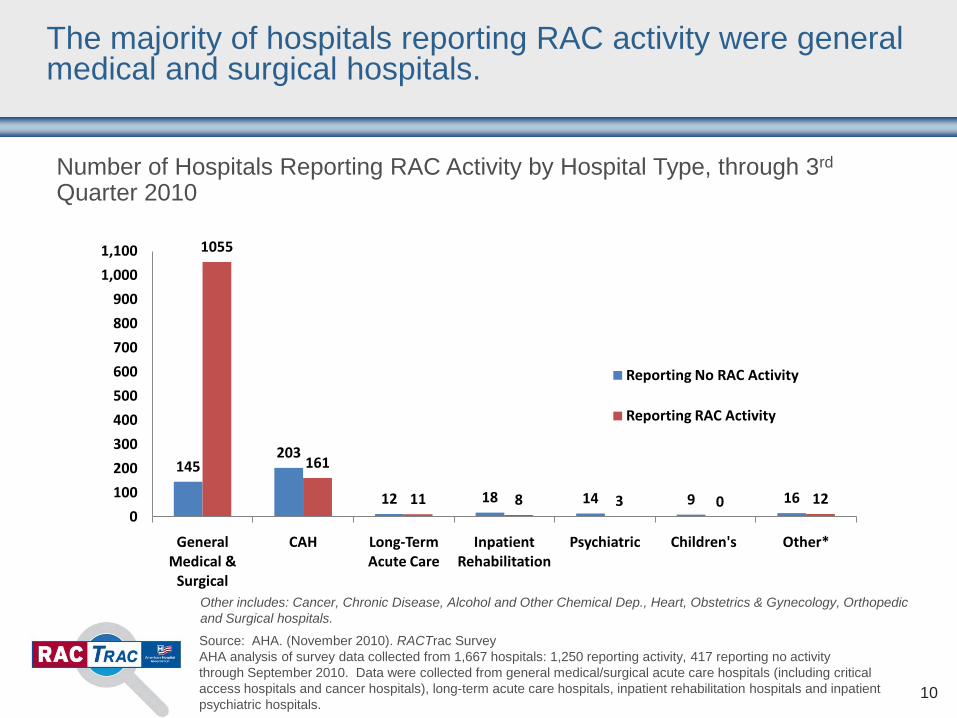
Other includes: Cancer, Chronic Disease, Alcohol and Other Chemical Dep., Heart, Obstetrics & Gynecology, Orthopedic and Surgical hospitals.
Number of Hospitals Reporting RAC Activity by Hospital Type, through 3rd
Quarter 2010
145203
12 18 14 9 16
1055
161
11 8 3 0 120
100
200
300
400
500
600
700
800
900
1,000
1,100
General Medical &
Surgical
CAH Long-Term Acute Care
Inpatient Rehabilitation
Psychiatric Children's Other*
Reporting No RAC Activity
Reporting RAC Activity
The majority of hospitals reporting RAC activity were general medical and surgical hospitals.

11
Source: AHA. (November 2010). RACTrac SurveyAHA analysis of survey data collected from 1,667 hospitals: 1,250 reporting activity, 417 reporting no activitythrough September 2010. Data were collected from general medical/surgical acute care hospitals (including critical access hospitals and cancer hospitals), long-term acute care hospitals, inpatient rehabilitation hospitals and inpatient psychiatric hospitals.
Non-Teaching
Rural
< 200 beds
Teaching(8%)
Urban
200-399 beds 400+ beds
Different types and sizes of hospitals reported that they were subject to RAC review.
Types of Hospitals Reporting RAC Activity, through 3rd Quarter 2010
1,25
0 H
ospi
tals
Rep
ortin
g R
AC A
ctiv
ity
(64%) (23%)
(42%) (58%)
(92%)
(13%)

12
Source: AHA. (November 2010). RACTrac SurveyAHA analysis of survey data collected from 1,667 hospitals: 1,250 reporting activity, 417 reporting no activitythrough September 2010. Data were collected from general medical/surgical acute care hospitals (including critical access hospitals and cancer hospitals), long-term acute care hospitals, inpatient rehabilitation hospitals and inpatient psychiatric hospitals.
82
266
368
256
145
311
456
338
Region A Region B Region C Region D
All Activity through Quarter 2, 2010
All Activity through Quarter 3, 2010
RAC Region C had the highest number of hospitals reporting RAC activity…
Number of Responding Hospitals Reporting RAC Activity by Region, through 3rd Quarter 2010
States By RAC Region
Region A: Connecticut, Delaware, District of Columbia, Maine, Maryland, Massachusetts, New Hampshire, New Jersey, New York, Pennsylvania, Rhode Island, and Vermont
Region B: Illinois, Indiana, Kentucky, Michigan, Minnesota, Ohio, and Wisconsin
Region C: Alabama, Arkansas, Colorado, Florida, Georgia, Louisiana, Mississippi, New Mexico, North Carolina, Oklahoma, South Carolina, Tennessee, Texas, Virginia, West Virginia, Puerto Rico, and U.S. Virgin Islands
Region D: Alaska, Arizona, California, Hawaii, Idaho, Iowa, Kansas, Missouri, Montana, North Dakota, Nebraska, Nevada, Oregon, South Dakota, Utah, Washington, Wyoming, Guam, American Samoa, and Northern Marianas

13
Source: AHA. (November 2010). RACTrac SurveyAHA analysis of survey data collected from 1,667 hospitals: 1,250 reporting activity, 417 reporting no activitythrough September 2010. Data were collected from general medical/surgical acute care hospitals (including critical access hospitals and cancer hospitals), long-term acute care hospitals, inpatient rehabilitation hospitals and inpatient psychiatric hospitals.
…but RAC Region D had a higher percentage of participating hospitals reporting RAC activity.
Percent of Participating Hospitals Reporting RAC Activity, by Region,through 3rd Quarter, 2010
46%
69%74% 77%
65%71%
76%
84%
Region A Region B Region C Region D
All Activity through Quarter 2, 2010
All Activity through Quarter 3, 2010

RAC Reviews
15
Source: AHA. (November 2010). RACTrac SurveyAHA analysis of survey data collected from 1,667 hospitals: 1,250 reporting activity, 417 reporting no activitythrough September 2010. Data were collected from general medical/surgical acute care hospitals (including critical access hospitals and cancer hospitals), long-term acute care hospitals, inpatient rehabilitation hospitals and inpatient psychiatric hospitals.
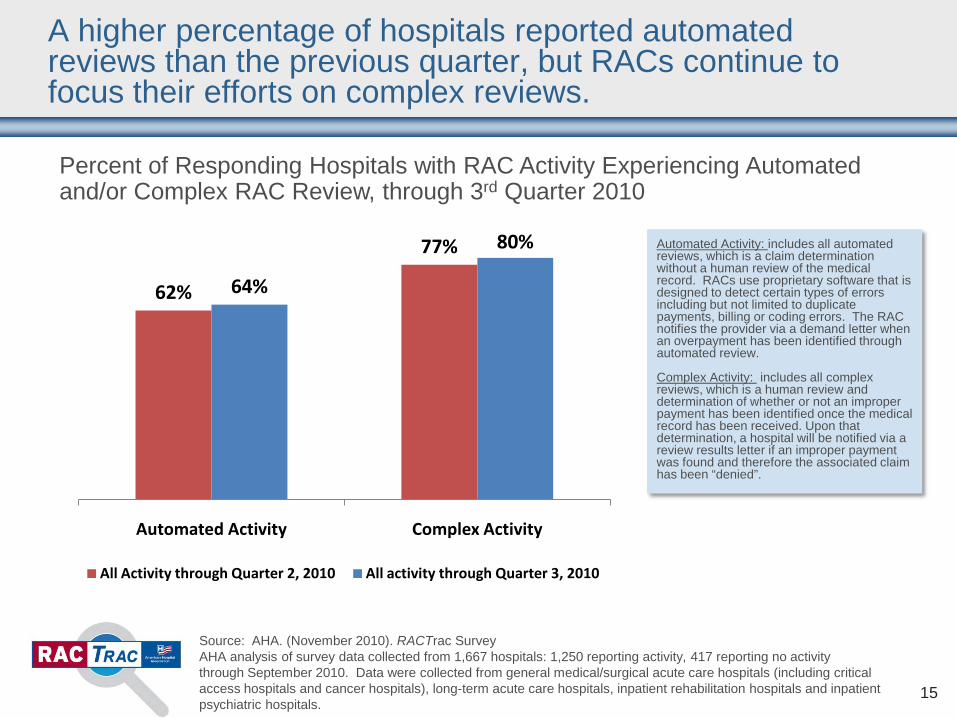
62%
77%
64%
80%
Automated Activity Complex Activity
All Activity through Quarter 2, 2010 All activity through Quarter 3, 2010
A higher percentage of hospitals reported automated reviews than the previous quarter, but RACs continue to focus their efforts on complex reviews.
Percent of Responding Hospitals with RAC Activity Experiencing Automated and/or Complex RAC Review, through 3rd Quarter 2010
Automated Activity: includes all automated reviews, which is a claim determination without a human review of the medical record. RACs use proprietary software that is designed to detect certain types of errors including but not limited to duplicate payments, billing or coding errors. The RAC notifies the provider via a demand letter when an overpayment has been identified through automated review.
Complex Activity: includes all complex reviews, which is a human review and determination of whether or not an improper payment has been identified once the medical record has been received. Upon that determination, a hospital will be notified via a review results letter if an improper payment was found and therefore the associated claim has been “denied”.
16
Source: AHA. (November 2010). RACTrac SurveyAHA analysis of survey data collected from 1,667 hospitals: 1,250 reporting activity, 417 reporting no activitythrough September 2010. Data were collected from general medical/surgical acute care hospitals (including critical access hospitals and cancer hospitals), long-term acute care hospitals, inpatient rehabilitation hospitals and inpatient psychiatric hospitals.
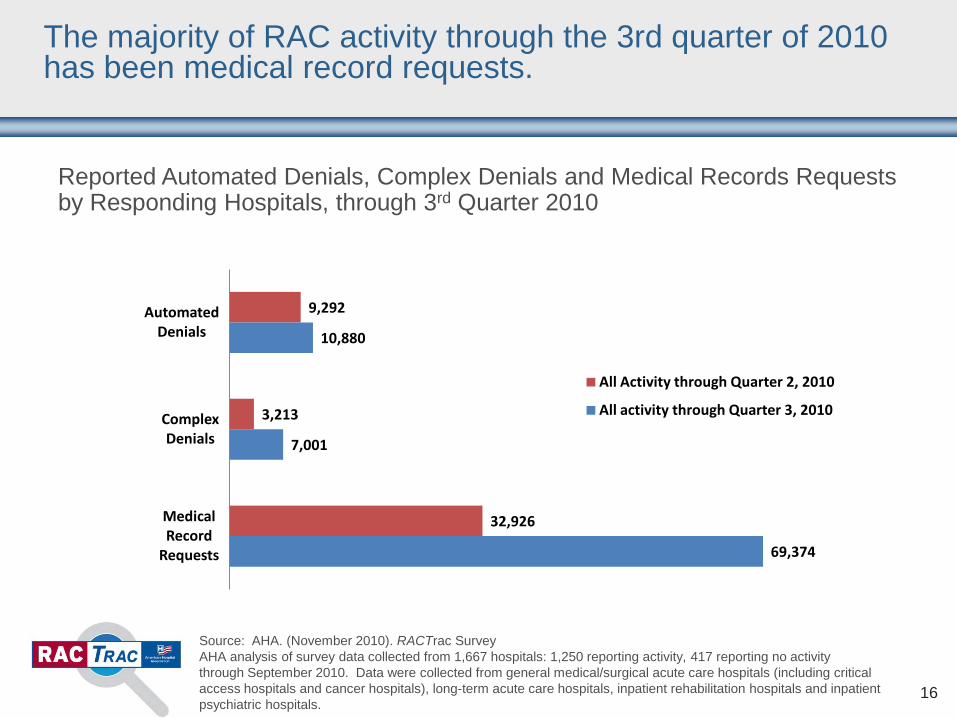
The majority of RAC activity through the 3rd quarter of 2010 has been medical record requests.
Reported Automated Denials, Complex Denials and Medical Records Requests by Responding Hospitals, through 3rd Quarter 2010
9,292
3,213
32,926
10,880
7,001
69,374
AutomatedDenials
ComplexDenials
MedicalRecord
Requests
All Activity through Quarter 2, 2010
All activity through Quarter 3, 2010

17
Source: AHA. (November 2010). RACTrac SurveyAHA analysis of survey data collected from 1,667 hospitals: 1,250 reporting activity, 417 reporting no activitythrough September 2010. Data were collected from general medical/surgical acute care hospitals (including critical access hospitals and cancer hospitals), long-term acute care hospitals, inpatient rehabilitation hospitals and inpatient psychiatric hospitals.
Region B experienced, on average, 50% more medical records requested per reporting hospital.
Number of Medical Records Requested from Responding Hospitals With Complex Medical Record RAC Activity, through 3rd Quarter 2010
Average Number of Medical Record Requests per Reporting
Hospital
Region A 87
Region B 120
Region C 85
Region D 66
7,873
26,899 26,316
8,286
0
5,000
10,000
15,000
20,000
25,000
30,000
Region A Region B Region C Region D

18
Source: AHA. (November 2010). RACTrac SurveyAHA analysis of survey data collected from 1,667 hospitals: 1,250 reporting activity, 417 reporting no activitythrough September 2010. Data were collected from general medical/surgical acute care hospitals (including critical access hospitals and cancer hospitals), long-term acute care hospitals, inpatient rehabilitation hospitals and inpatient psychiatric hospitals.
Among responding hospitals, $970 million in Medicare payments were targeted for medical record requests through the 3rd quarter of 2010.
Medicare Payments Associated with Medical Records Requested from Responding Hospitals, through 3rd Quarter 2010, in Millions
$41
$142
$214
$35
$109
$319
$414
$128
$0
$50
$100
$150
$200
$250
$300
$350
$400
$450
Region A Region B Region C Region D
Mill
ions
All Activity through Quarter 2, 2010
All Activity through Quarter 3, 2010
19
Source: AHA. (November 2010). RACTrac SurveyAHA analysis of survey data collected from 1,667 hospitals: 1,250 reporting activity, 417 reporting no activitythrough September 2010. Data were collected from general medical/surgical acute care hospitals (including critical access hospitals and cancer hospitals), long-term acute care hospitals, inpatient rehabilitation hospitals and inpatient psychiatric hospitals.
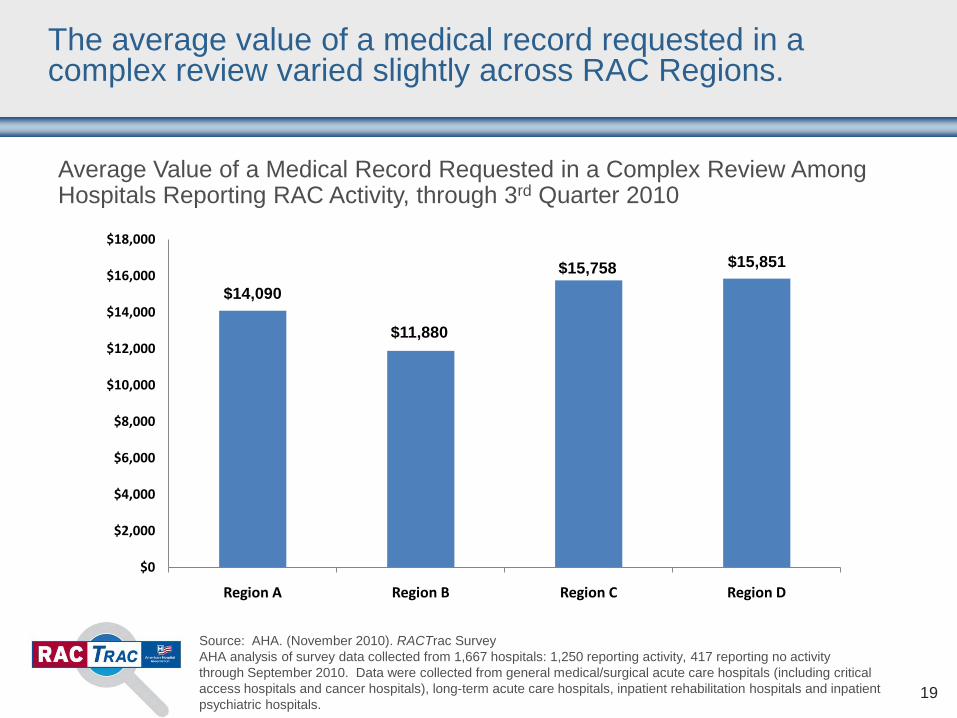
The average value of a medical record requested in a complex review varied slightly across RAC Regions.
Average Value of a Medical Record Requested in a Complex Review Among Hospitals Reporting RAC Activity, through 3rd Quarter 2010
$14,090
$11,880
$15,758 $15,851
$0
$2,000
$4,000
$6,000
$8,000
$10,000
$12,000
$14,000
$16,000
$18,000
Region A Region B Region C Region D

RAC Denials
21
Source: AHA. (November 2010). RACTrac SurveyAHA analysis of survey data collected from 1,667 hospitals: 1,250 reporting activity, 417 reporting no activitythrough September 2010. Data were collected from general medical/surgical acute care hospitals (including critical access hospitals and cancer hospitals), long-term acute care hospitals, inpatient rehabilitation hospitals and inpatient psychiatric hospitals.
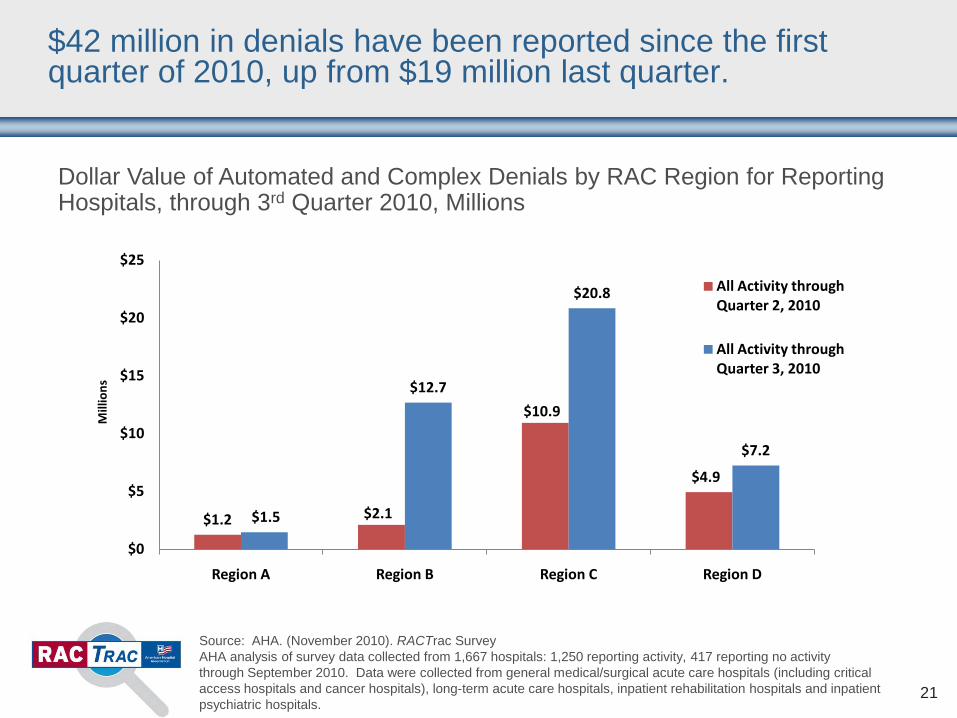
$42 million in denials have been reported since the first quarter of 2010, up from $19 million last quarter.
Dollar Value of Automated and Complex Denials by RAC Region for Reporting Hospitals, through 3rd Quarter 2010, Millions
$1.2 $2.1
$10.9
$4.9
$1.5
$12.7
$20.8
$7.2
$0
$5
$10
$15
$20
$25
Region A Region B Region C Region D
Mill
ions
All Activity through Quarter 2, 2010
All Activity through Quarter 3, 2010
22
Source: AHA. (November 2010). RACTrac SurveyAHA analysis of survey data collected from 1,667 hospitals: 1,250 reporting activity, 417 reporting no activitythrough September 2010. Data were collected from general medical/surgical acute care hospitals (including critical access hospitals and cancer hospitals), long-term acute care hospitals, inpatient rehabilitation hospitals and inpatient psychiatric hospitals.
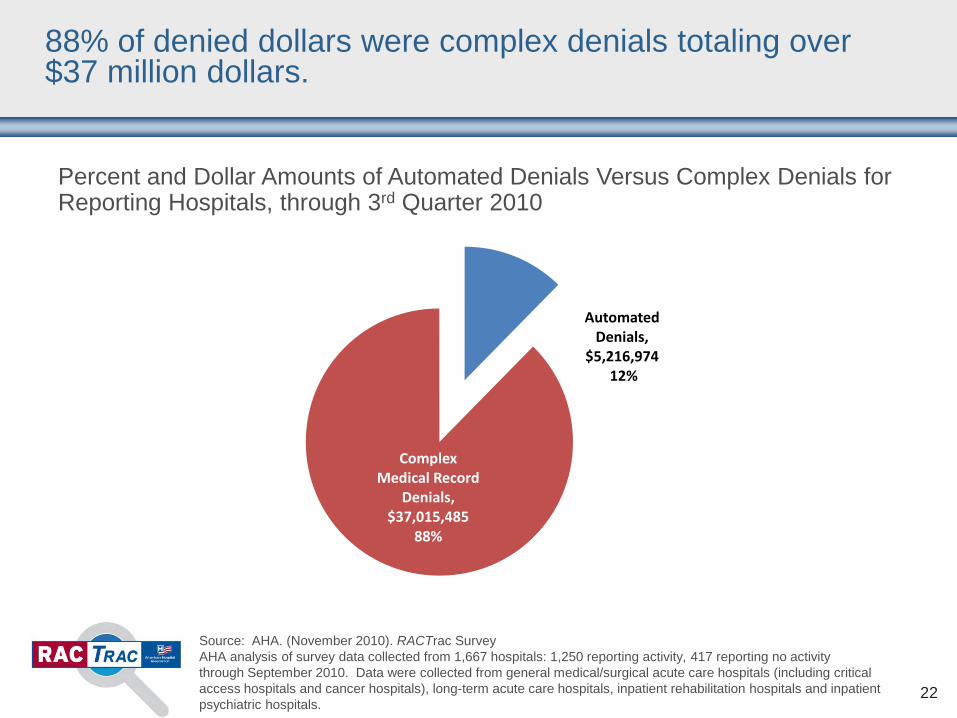
Percent and Dollar Amounts of Automated Denials Versus Complex Denials for Reporting Hospitals, through 3rd Quarter 2010
Automated Denials,
$5,216,974 12%
Complex Medical Record
Denials, $37,015,485
88%
88% of denied dollars were complex denials totaling over $37 million dollars.

23
Source: AHA. (November 2010). RACTrac SurveyAHA analysis of survey data collected from 1,667 hospitals: 1,250 reporting activity, 417 reporting no activitythrough September 2010. Data were collected from general medical/surgical acute care hospitals (including critical access hospitals and cancer hospitals), long-term acute care hospitals, inpatient rehabilitation hospitals and inpatient psychiatric hospitals.
Regions B and C account for more than 80% of all reported denials.
Percent of Automated and Complex Denials by RAC Region for Reporting Hospitals, through 3rd Quarter 2010
2%
45%
38%
15%
Region A
Region B
Region C
Region D
24
Source: AHA. (November 2010). RACTrac SurveyAHA analysis of survey data collected from 1,667 hospitals: 1,250 reporting activity, 417 reporting no activitythrough September 2010. Data were collected from general medical/surgical acute care hospitals (including critical access hospitals and cancer hospitals), long-term acute care hospitals, inpatient rehabilitation hospitals and inpatient psychiatric hospitals.
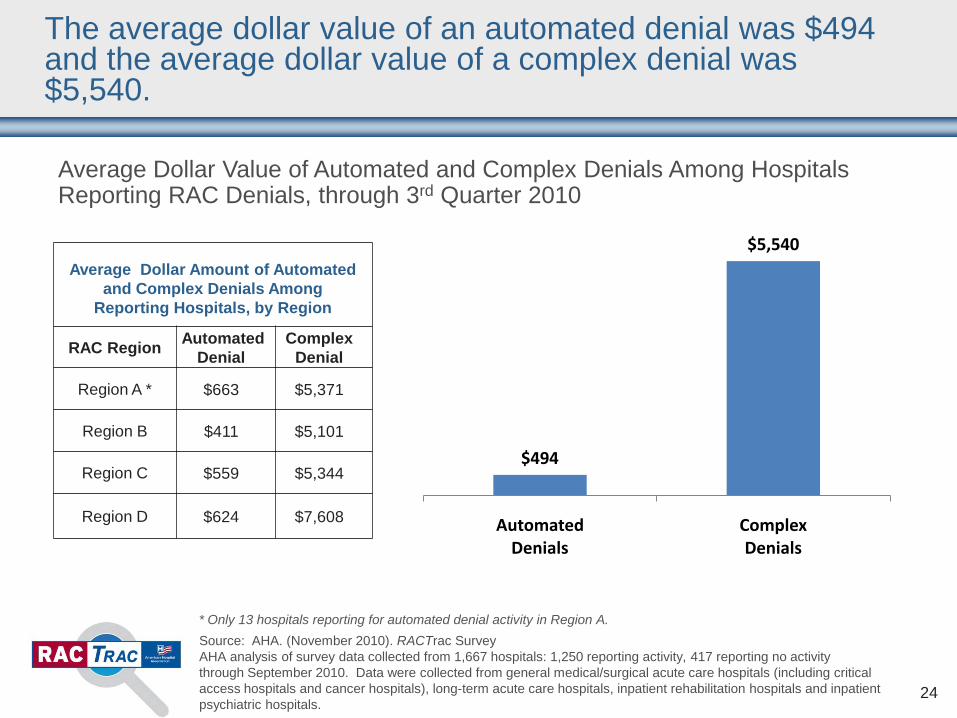
Average Dollar Value of Automated and Complex Denials Among Hospitals Reporting RAC Denials, through 3rd Quarter 2010
Average Dollar Amount of Automated and Complex Denials Among
Reporting Hospitals, by Region
RAC Region AutomatedDenial
Complex Denial
Region A * $663 $5,371
Region B $411 $5,101
Region C $559 $5,344
Region D $624 $7,608
$494
$5,540
Automated Denials
Complex Denials
* Only 13 hospitals reporting for automated denial activity in Region A.
The average dollar value of an automated denial was $494 and the average dollar value of a complex denial was $5,540.

25
Source: AHA. (November 2010). RACTrac SurveyAHA analysis of survey data collected from 1,667 hospitals: 1,250 reporting activity, 417 reporting no activitythrough September 2010. Data were collected from general medical/surgical acute care hospitals (including critical access hospitals and cancer hospitals), long-term acute care hospitals, inpatient rehabilitation hospitals and inpatient psychiatric hospitals.
94% of hospitals reported automated denials in the outpatient service area and 84% of hospitals reported complex denials in the inpatient service area.
Percent of Responding Medical/Surgical Acute Hospitals with RAC Activity Experiencing Denials by Type of Service, 3rd Quarter 2010Survey participants were asked to select all areas targeted for denials
28%
84%
3%11%
94%
24%
2% 4%
Inpatient Outpatient Psych/Rehab/SNF Other (Phys Services, DME)
Automated Denials
Complex Denials
26
Source: AHA. (November 2010). RACTrac SurveyAHA analysis of survey data collected from 1,667 hospitals: 1,250 reporting activity, 417 reporting no activitythrough September 2010. Data were collected from general medical/surgical acute care hospitals (including critical access hospitals and cancer hospitals), long-term acute care hospitals, inpatient rehabilitation hospitals and inpatient psychiatric hospitals.
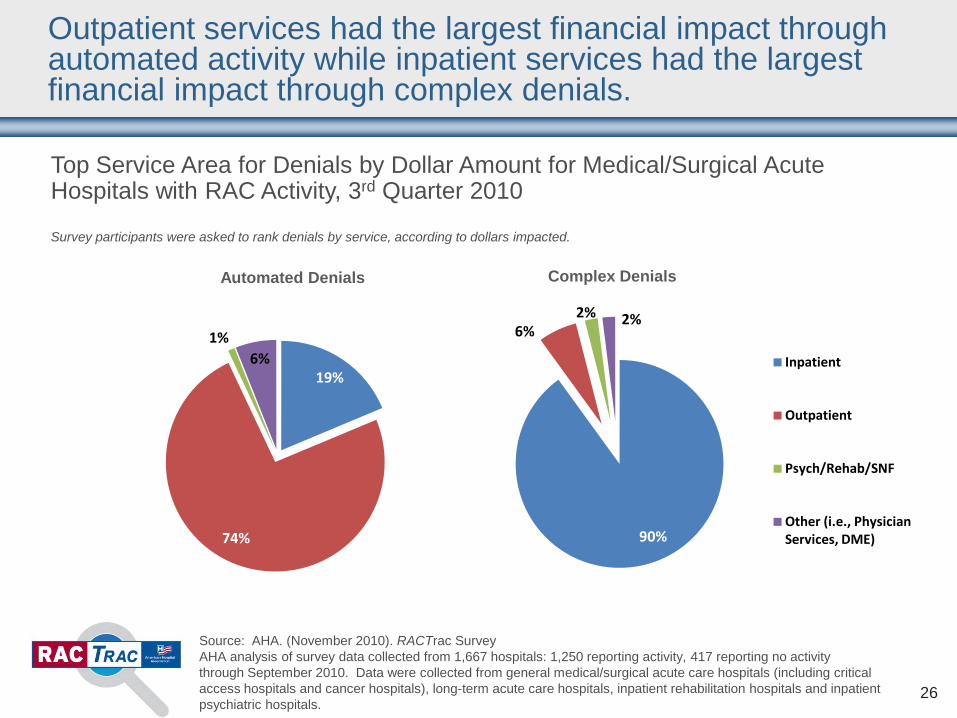
Outpatient services had the largest financial impact through automated activity while inpatient services had the largest financial impact through complex denials.
Top Service Area for Denials by Dollar Amount for Medical/Surgical Acute Hospitals with RAC Activity, 3rd Quarter 2010
Survey participants were asked to rank denials by service, according to dollars impacted.
Automated Denials Complex Denials
19%
74%
1%6%
90%
6%2% 2%
Inpatient
Outpatient
Psych/Rehab/SNF
Other (i.e., Physician Services, DME)

Automated RAC Denials

28
Source: AHA. (November 2010). RACTrac SurveyAHA analysis of survey data collected from 1,667 hospitals: 1,250 reporting activity, 417 reporting no activitythrough September 2010. Data were collected from general medical/surgical acute care hospitals (including critical access hospitals and cancer hospitals), long-term acute care hospitals, inpatient rehabilitation hospitals and inpatient psychiatric hospitals.
Percent of Responding Hospitals with RAC Activity Experiencing Automated Denials, by Reason, 2nd and 3rd Quarter 2010Survey participants were asked to select all reasons for denial.
87%
10%5% 6%
22%
85%
9% 6%13%
20%
Outpatient Coding/Billing
Duplicate Claim Inpatient Coding Discharge Disposition
Other
Quarter 2, 2010
Quarter 3, 2010
85% of responding hospitals with automated activity cited outpatient coding/billing as a reason for denial.

29
Source: AHA. (November 2010). RACTrac SurveyAHA analysis of survey data collected from 1,667 hospitals: 1,250 reporting activity, 417 reporting no activitythrough September 2010. Data were collected from general medical/surgical acute care hospitals (including critical access hospitals and cancer hospitals), long-term acute care hospitals, inpatient rehabilitation hospitals and inpatient psychiatric hospitals.
Top Reason for Automated Denials by Dollar Amount for Hospitals with RAC Activity, 3rd Quarter 2010
Survey participants were asked to rank denials by reason, according to dollars impacted.
Automated denials for outpatient billing errors had the largest financial impact on reporting hospitals.
52%
5%
6%
10%
11%
16%
Outpatient Billing Error
Inpatient Coding Error (MSDRG)
Duplicate Payment
Outpatient Coding Error
Incorrect Discharge Status
All Other
30
Source: AHA. (November 2010). RACTrac SurveyAHA analysis of survey data collected from 1,667 hospitals: 1,250 reporting activity, 417 reporting no activitythrough September 2010. Data were collected from general medical/surgical acute care hospitals (including critical access hospitals and cancer hospitals), long-term acute care hospitals, inpatient rehabilitation hospitals and inpatient psychiatric hospitals.
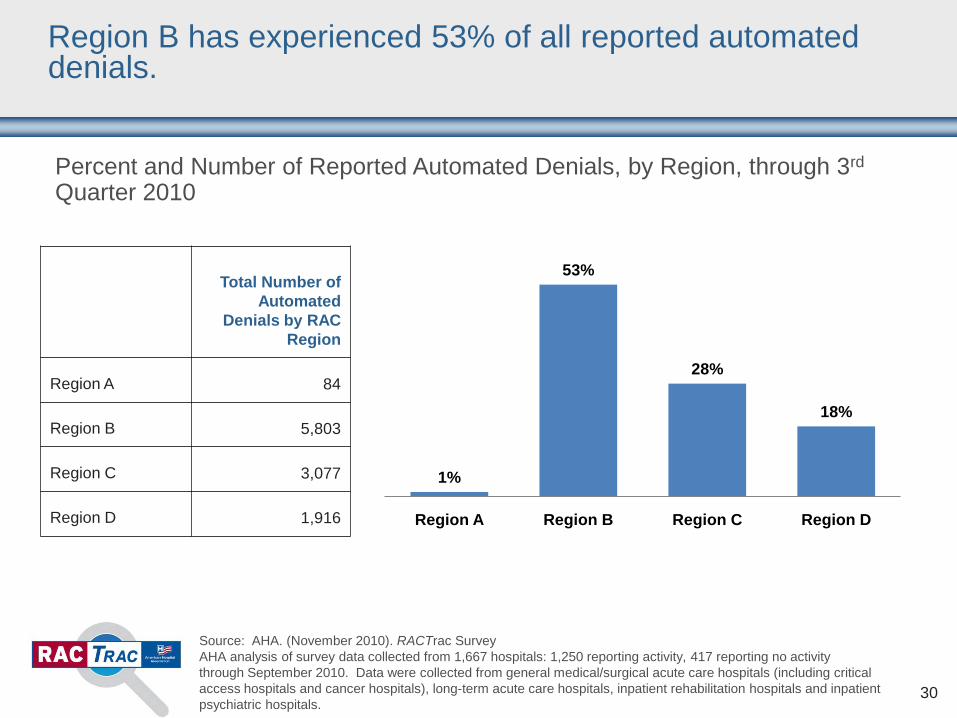
Percent and Number of Reported Automated Denials, by Region, through 3rd
Quarter 2010
Region B has experienced 53% of all reported automated denials.
Total Number of Automated
Denials by RAC Region
Region A 84
Region B 5,803
Region C 3,077
Region D 1,916
1%
53%
28%
18%
Region A Region B Region C Region D
31
Source: AHA. (November 2010). RACTrac SurveyAHA analysis of survey data collected from 1,667 hospitals: 1,250 reporting activity, 417 reporting no activitythrough September 2010. Data were collected from general medical/surgical acute care hospitals (including critical access hospitals and cancer hospitals), long-term acute care hospitals, inpatient rehabilitation hospitals and inpatient psychiatric hospitals.
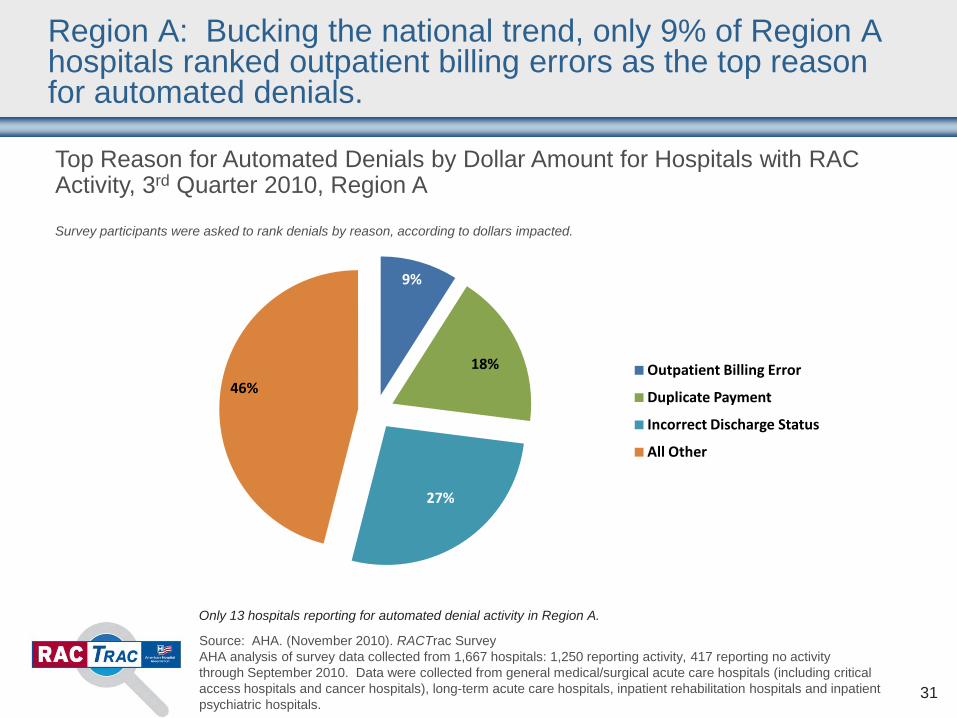
Top Reason for Automated Denials by Dollar Amount for Hospitals with RAC Activity, 3rd Quarter 2010, Region A
Survey participants were asked to rank denials by reason, according to dollars impacted.
Region A: Bucking the national trend, only 9% of Region A hospitals ranked outpatient billing errors as the top reason for automated denials.
Only 13 hospitals reporting for automated denial activity in Region A.
9%
18%
27%
46%Outpatient Billing Error
Duplicate Payment
Incorrect Discharge Status
All Other
32
Source: AHA. (November 2010). RACTrac SurveyAHA analysis of survey data collected from 1,667 hospitals: 1,250 reporting activity, 417 reporting no activitythrough September 2010. Data were collected from general medical/surgical acute care hospitals (including critical access hospitals and cancer hospitals), long-term acute care hospitals, inpatient rehabilitation hospitals and inpatient psychiatric hospitals.
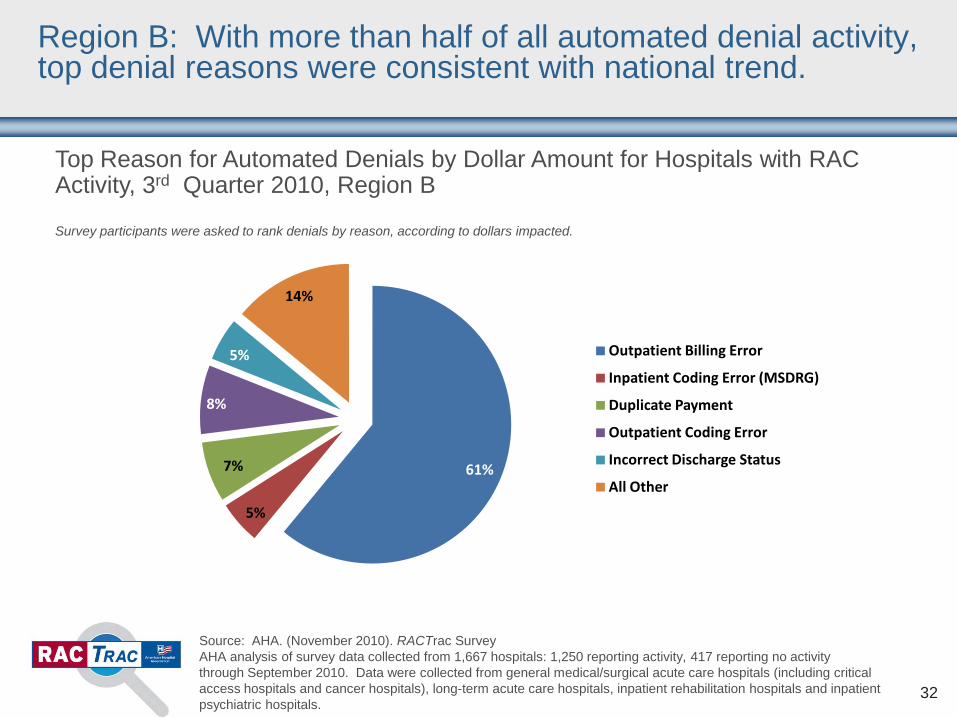
Top Reason for Automated Denials by Dollar Amount for Hospitals with RAC Activity, 3rd Quarter 2010, Region B
Survey participants were asked to rank denials by reason, according to dollars impacted.
Region B: With more than half of all automated denial activity, top denial reasons were consistent with national trend.
61%
5%
7%
8%
5%
14%
Outpatient Billing Error
Inpatient Coding Error (MSDRG)
Duplicate Payment
Outpatient Coding Error
Incorrect Discharge Status
All Other

33
Source: AHA. (November 2010). RACTrac SurveyAHA analysis of survey data collected from 1,667 hospitals: 1,250 reporting activity, 417 reporting no activitythrough September 2010. Data were collected from general medical/surgical acute care hospitals (including critical access hospitals and cancer hospitals), long-term acute care hospitals, inpatient rehabilitation hospitals and inpatient psychiatric hospitals.
Top Reason for Automated Denials by Dollar Amount for Hospitals with RAC Activity, 3rd Quarter 2010, Region C
Survey participants were asked to rank denials by reason, according to dollars impacted.
Region C: 60% of hospitals reported outpatient billing error as the top reason for automated denials.
60%
7%
5%
9%
19%
Outpatient Billing Error
Inpatient Coding Error (MSDRG)
Duplicate Payment
Outpatient Coding Error
All Other
34
Source: AHA. (November 2010). RACTrac SurveyAHA analysis of survey data collected from 1,667 hospitals: 1,250 reporting activity, 417 reporting no activitythrough September 2010. Data were collected from general medical/surgical acute care hospitals (including critical access hospitals and cancer hospitals), long-term acute care hospitals, inpatient rehabilitation hospitals and inpatient psychiatric hospitals.
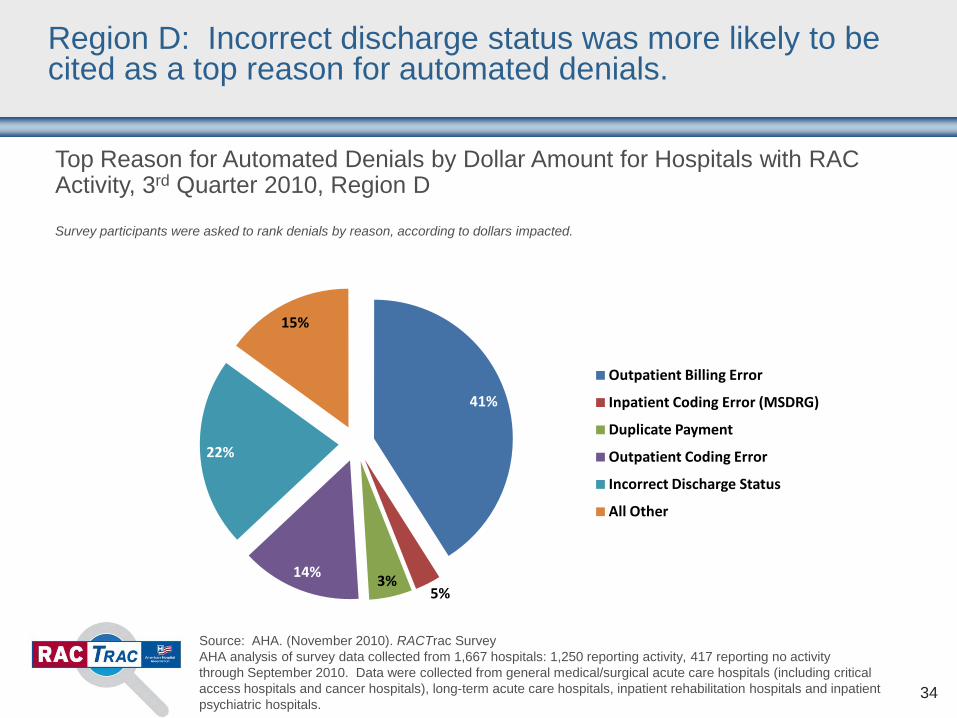
Top Reason for Automated Denials by Dollar Amount for Hospitals with RAC Activity, 3rd Quarter 2010, Region D
Survey participants were asked to rank denials by reason, according to dollars impacted.
Region D: Incorrect discharge status was more likely to be cited as a top reason for automated denials.
41%
3%5%
14%
22%
15%
Outpatient Billing Error
Inpatient Coding Error (MSDRG)
Duplicate Payment
Outpatient Coding Error
Incorrect Discharge Status
All Other

Complex RAC Denials
36
Source: AHA. (November 2010). RACTrac SurveyAHA analysis of survey data collected from 1,667 hospitals: 1,250 reporting activity, 417 reporting no activitythrough September 2010. Data were collected from general medical/surgical acute care hospitals (including critical access hospitals and cancer hospitals), long-term acute care hospitals, inpatient rehabilitation hospitals and inpatient psychiatric hospitals.
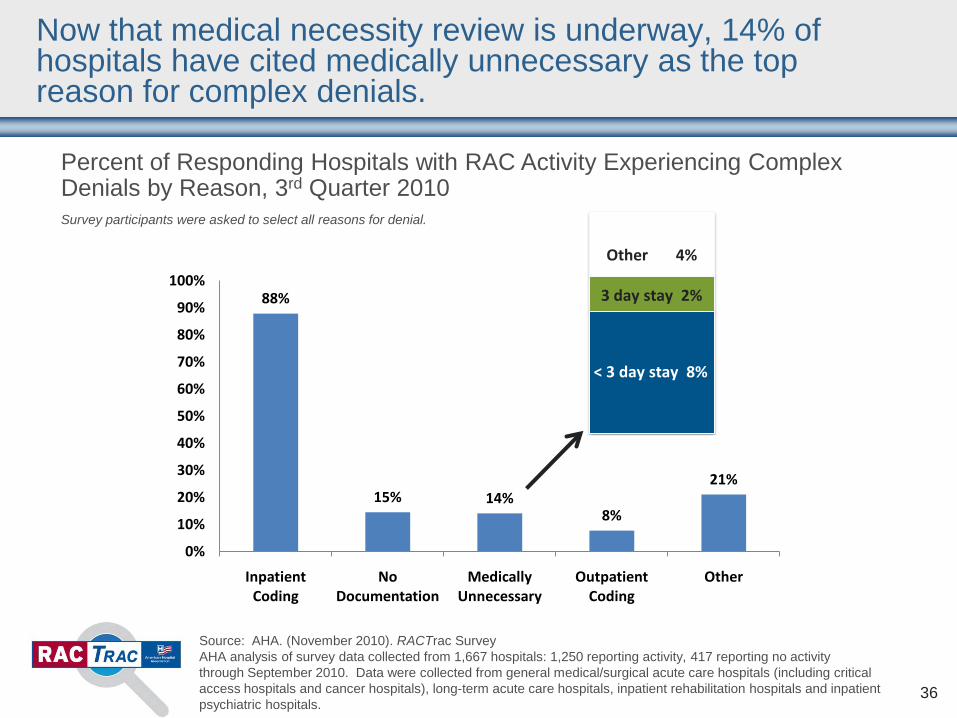
88%
15% 14%8%
21%
0%
10%
20%
30%
40%
50%
60%
70%
80%
90%
100%
Inpatient Coding
No Documentation
Medically Unnecessary
Outpatient Coding
Other
Other 4%
< 3 day stay 8%
3 day stay 2%
Percent of Responding Hospitals with RAC Activity Experiencing Complex Denials by Reason, 3rd Quarter 2010Survey participants were asked to select all reasons for denial.
Now that medical necessity review is underway, 14% of hospitals have cited medically unnecessary as the top reason for complex denials.

37
Source: AHA. (November 2010). RACTrac SurveyAHA analysis of survey data collected from 1,667 hospitals: 1,250 reporting activity, 417 reporting no activitythrough September 2010. Data were collected from general medical/surgical acute care hospitals (including critical access hospitals and cancer hospitals), long-term acute care hospitals, inpatient rehabilitation hospitals and inpatient psychiatric hospitals.
Top Reason for Complex Denials by Dollar Amount for Hospitals with RAC Activity, 3rd Quarter 2010
Survey participants were asked to rank denials by reason, according to dollars impacted.
Incorrect MS-DRG or other coding error represented the top reason by dollars for complex denials for 82% of hospitals.
82%
1%4%
2% 11%
Incorrect MS-DRG or Other Coding Error
Incorrect APC or Other Outpatient Coding Error
No or Insufficient Documentation in the Medical Record
Medically Unnecessary
All Other
38
Source: AHA. (November 2010). RACTrac SurveyAHA analysis of survey data collected from 1,667 hospitals: 1,250 reporting activity, 417 reporting no activitythrough September 2010. Data were collected from general medical/surgical acute care hospitals (including critical access hospitals and cancer hospitals), long-term acute care hospitals, inpatient rehabilitation hospitals and inpatient psychiatric hospitals.
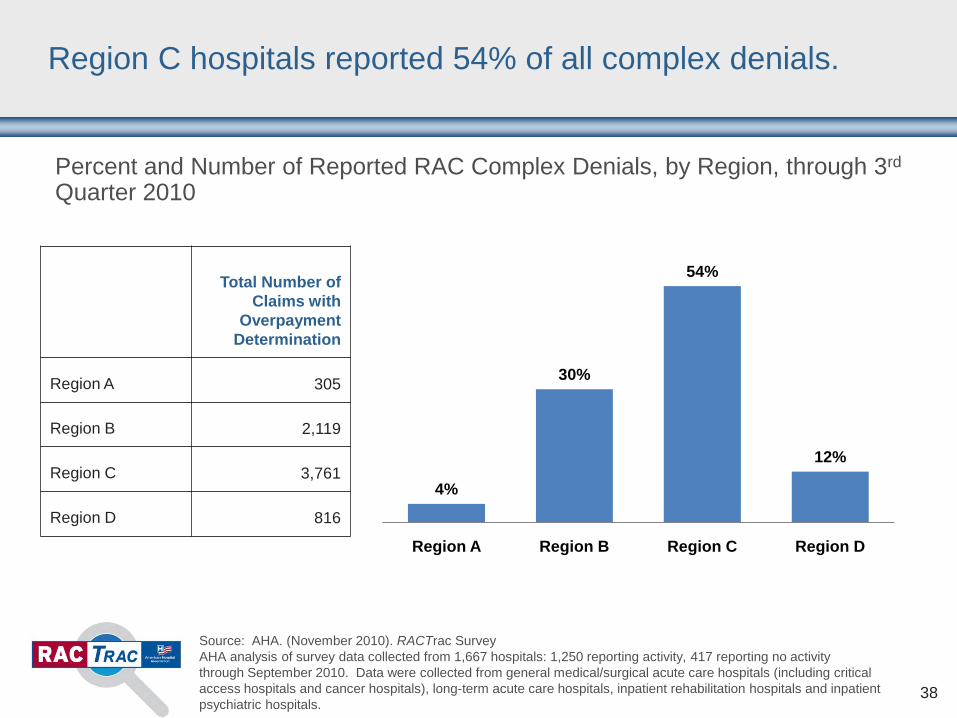
Percent and Number of Reported RAC Complex Denials, by Region, through 3rd
Quarter 2010
Region C hospitals reported 54% of all complex denials.
Total Number of Claims with
Overpayment Determination
Region A 305
Region B 2,119
Region C 3,761
Region D 816
4%
30%
54%
12%
Region A Region B Region C Region D

39
Source: AHA. (November 2010). RACTrac SurveyAHA analysis of survey data collected from 1,667 hospitals: 1,250 reporting activity, 417 reporting no activitythrough September 2010. Data were collected from general medical/surgical acute care hospitals (including critical access hospitals and cancer hospitals), long-term acute care hospitals, inpatient rehabilitation hospitals and inpatient psychiatric hospitals.
Top Reason for Complex Denials by Dollar Amount for Hospitals with RAC Activity, 3rd Quarter 2010, Region A
Survey participants were asked to rank denials by reason, according to dollars impacted.
Region A: The dominant reason for complex denials was incorrect MS-DRG or other coding errors.
79%
2%5%
14%
Incorrect MS-DRG or Other Coding Error
Incorrect APC or Other Outpatient Coding Error
No or Insufficient Documentation in the Medical Record
All Other

40
Source: AHA. (November 2010). RACTrac SurveyAHA analysis of survey data collected from 1,667 hospitals: 1,250 reporting activity, 417 reporting no activitythrough September 2010. Data were collected from general medical/surgical acute care hospitals (including critical access hospitals and cancer hospitals), long-term acute care hospitals, inpatient rehabilitation hospitals and inpatient psychiatric hospitals.
Top Reason for Complex Denials by Dollar Amount for Hospitals with RAC Activity, 3rd Quarter 2010, Region B
Survey participants were asked to rank denials by reason, according to dollars impacted.
Region B: For the first time, hospitals are reporting denials for services determined by the RAC to be medically unnecessary.
82%
2%
2%14%
Incorrect MS-DRG or Other Coding Error
No or Insufficient Documentation in the Medical Record
Medically Unnecessary
All Other
41
Source: AHA. (November 2010). RACTrac SurveyAHA analysis of survey data collected from 1,667 hospitals: 1,250 reporting activity, 417 reporting no activitythrough September 2010. Data were collected from general medical/surgical acute care hospitals (including critical access hospitals and cancer hospitals), long-term acute care hospitals, inpatient rehabilitation hospitals and inpatient psychiatric hospitals.
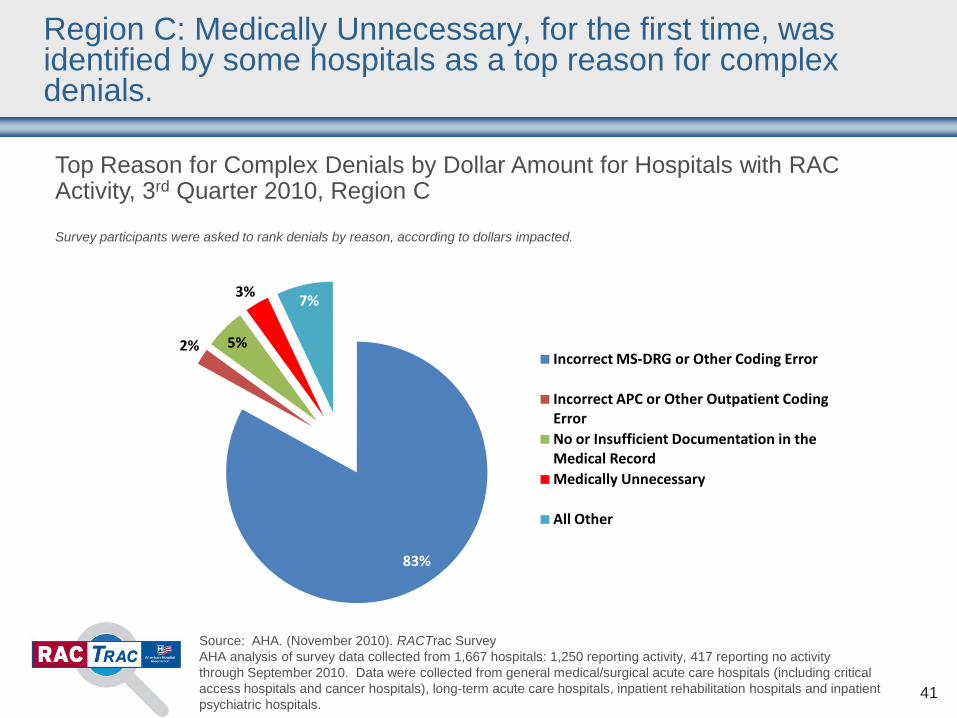
Top Reason for Complex Denials by Dollar Amount for Hospitals with RAC Activity, 3rd Quarter 2010, Region C
Survey participants were asked to rank denials by reason, according to dollars impacted.
Region C: Medically Unnecessary, for the first time, was identified by some hospitals as a top reason for complex denials.
83%
2% 5%
3% 7%
Incorrect MS-DRG or Other Coding Error
Incorrect APC or Other Outpatient Coding ErrorNo or Insufficient Documentation in the Medical RecordMedically Unnecessary
All Other

42
Source: AHA. (November 2010). RACTrac SurveyAHA analysis of survey data collected from 1,667 hospitals: 1,250 reporting activity, 417 reporting no activitythrough September 2010. Data were collected from general medical/surgical acute care hospitals (including critical access hospitals and cancer hospitals), long-term acute care hospitals, inpatient rehabilitation hospitals and inpatient psychiatric hospitals.
Top Reason for Complex Denials by Dollar Amount for Hospitals with RAC Activity, 3rd Quarter 2010, Region D
Survey participants were asked to rank denials by reason, according to dollars impacted.
Region D: Incorrect MS-DRG or other coding error was the top reason for denial with no hospitals reporting medically unnecessary as a top reason.
81%
7%
12%
Incorrect MS-DRG or Other Coding Error
Incorrect APC or Other Outpatient Coding Error
All Other

Underpayments

44
Source: AHA. (November 2010). RACTrac SurveyAHA analysis of survey data collected from 1,667 hospitals: 1,250 reporting activity, 417 reporting no activitythrough September 2010. Data were collected from general medical/surgical acute care hospitals (including critical access hospitals and cancer hospitals), long-term acute care hospitals, inpatient rehabilitation hospitals and inpatient psychiatric hospitals.
Nearly half of all hospitals with RAC activity reported receiving at least one underpayment determination.
Percent of Hospitals Reporting Underpayment Determinations, By Region, through 3rd Quarter 2010
62%
38%
50%44% 46%
Region A Region B Region C Region D Nationwide
45
Source: AHA. (November 2010). RACTrac SurveyAHA analysis of survey data collected from 1,667 hospitals: 1,250 reporting activity, 417 reporting no activitythrough September 2010. Data were collected from general medical/surgical acute care hospitals (including critical access hospitals and cancer hospitals), long-term acute care hospitals, inpatient rehabilitation hospitals and inpatient psychiatric hospitals.
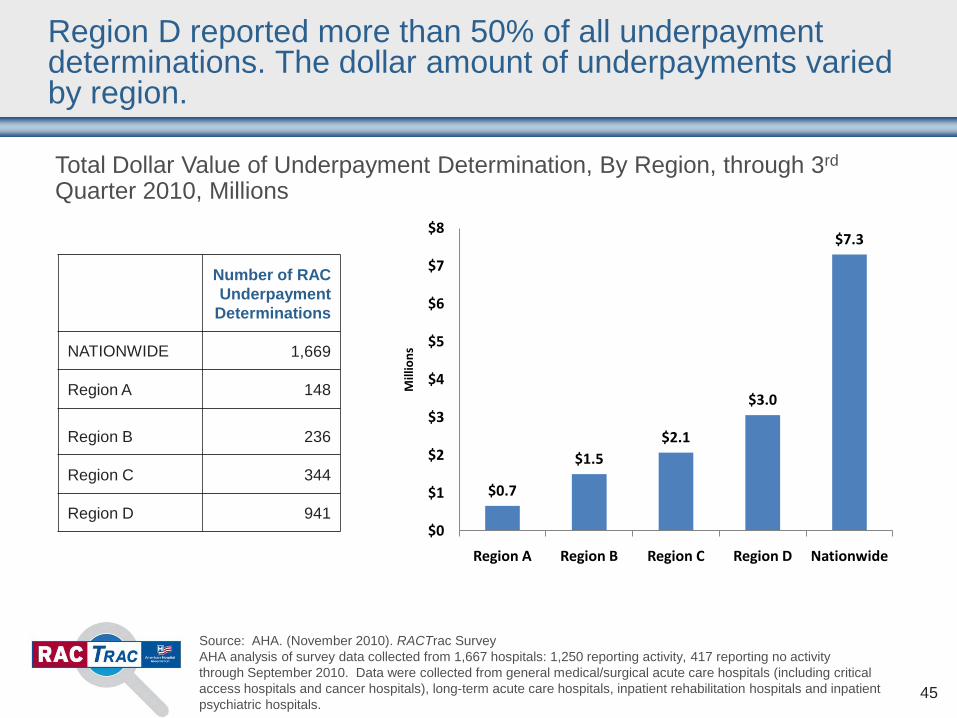
Total Dollar Value of Underpayment Determination, By Region, through 3rd
Quarter 2010, Millions
Region D reported more than 50% of all underpayment determinations. The dollar amount of underpayments varied by region.
Number of RAC Underpayment
Determinations
NATIONWIDE 1,669
Region A 148
Region B 236
Region C 344
Region D 941$0.7
$1.5$2.1
$3.0
$7.3
$0
$1
$2
$3
$4
$5
$6
$7
$8
Region A Region B Region C Region D Nationwide
Mill
ions
46
Source: AHA. (November 2010). RACTrac SurveyAHA analysis of survey data collected from 1,667 hospitals: 1,250 reporting activity, 417 reporting no activitythrough September 2010. Data were collected from general medical/surgical acute care hospitals (including critical access hospitals and cancer hospitals), long-term acute care hospitals, inpatient rehabilitation hospitals and inpatient psychiatric hospitals.
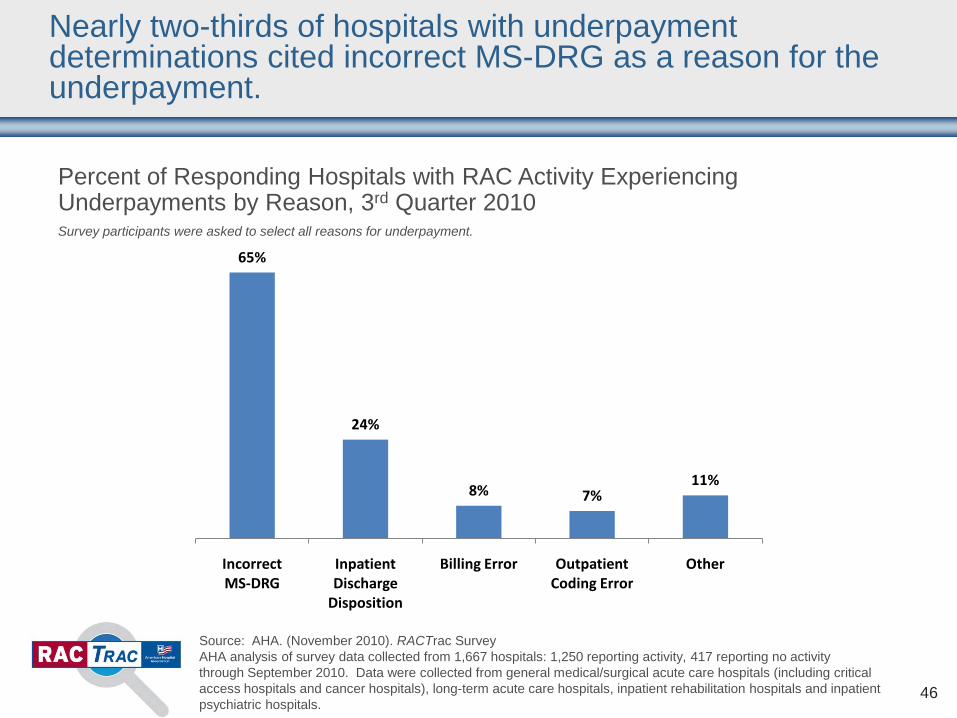
Nearly two-thirds of hospitals with underpayment determinations cited incorrect MS-DRG as a reason for the underpayment.
Percent of Responding Hospitals with RAC Activity Experiencing Underpayments by Reason, 3rd Quarter 2010Survey participants were asked to select all reasons for underpayment.
65%
24%
8% 7%11%
Incorrect MS-DRG
Inpatient Discharge
Disposition
Billing Error Outpatient Coding Error
Other
Appeals

48
Source: AHA. (November 2010). RACTrac SurveyAHA analysis of survey data collected from 1,667 hospitals: 1,250 reporting activity, 417 reporting no activitythrough September 2010. Data were collected from general medical/surgical acute care hospitals (including critical access hospitals and cancer hospitals), long-term acute care hospitals, inpatient rehabilitation hospitals and inpatient psychiatric hospitals.
78%
81%
89%
86%
84%
22%
19%
11%
14%
16%
Region A
Region B
Region C
Region D
Nationwide
Not Appealed
Appealed
Total Number of Automated and Complex Denials Appealed by Hospitals with RAC Activity, by Region, through 3rd Quarter 2010
Hospitals reported appealing 16% of RAC denials available* for appeal.
* Available for appeal means that the hospital received a demand letter for this claim, either as a result of automated or complex review.
Total Number of
Denials Available* for Appeal
Percent of Appealed
Denials
NATIONWIDE 17,881 16%
Region A 389 22%
Region B 7,922 19%
Region C 6,838 11%
Region D 2,732 14%

49
Source: AHA. (November 2010). RACTrac SurveyAHA analysis of survey data collected from 1,667 hospitals: 1,250 reporting activity, 417 reporting no activitythrough September 2010. Data were collected from general medical/surgical acute care hospitals (including critical access hospitals and cancer hospitals), long-term acute care hospitals, inpatient rehabilitation hospitals and inpatient psychiatric hospitals.
Total Dollar Value, Percent and Average Number of Appealed Claims for Hospitals with Automated or Complex RAC Denials, through 3rd Quarter 2010, Millions
Hospitals reported appealing denials totaling $8.6 million in value and 46% of hospitals reported appealing at least one RAC denial.
Percent of Hospitals
with Any
AppealedDenials
Average Number of Appealed
Denials per Hospital
NATIONWIDE 46% 8.1
Region A 45% 3.8
Region B 56% 12.7
Region C 43% 6.4
Region D 39% 5.0
$0.4
$2.3
$5.1
$0.8
$0
$1
$2
$3
$4
$5
$6
Region A Region B Region C Region D
Mill
ions

50
Source: AHA. (November 2010). RACTrac SurveyAHA analysis of survey data collected from 1,667 hospitals: 1,250 reporting activity, 417 reporting no activitythrough September 2010. Data were collected from general medical/surgical acute care hospitals (including critical access hospitals and cancer hospitals), long-term acute care hospitals, inpatient rehabilitation hospitals and inpatient psychiatric hospitals.
Summary of Appeal Rate and Determinations in Favor of the Provider, for Hospitals with RAC Activity, through 3rd Quarter 2010
Of the claims that have completed the appeals process, 38% were overturned in favor of the provider. 1,475 claims are still in the appeals process.
Appealed
Percent of Denials
Appealed
Number of Claims Pending Appeals
Determination
Number of Claims Withdrawn from Appeals Process
Number of Denials Overturned in the Appeals Process
Percent of Appealed Denials
Overturned
NATIONWIDE 2,773 16% 1,475 165 1,064 38%
Region A 87 22% 69 3 13 15%
Region B 1,527 19% 672 50 780 51%
Region C 777 11% 531 75 139 18%
Region D 382 14% 203 37 132 35%
The data does not reflect the outcome of appeals currently still in the appeals process, therefore the overturn rate may increase as more appeals complete the appeals process. Due to survey submission marginal error, total appeals may be slightly greater than the sum of pending/withdrawn/overturned appeals.
51
Source: AHA. (November 2010). RACTrac SurveyAHA analysis of survey data collected from 1,667 hospitals: 1,250 reporting activity, 417 reporting no activitythrough September 2010. Data were collected from general medical/surgical acute care hospitals (including critical access hospitals and cancer hospitals), long-term acute care hospitals, inpatient rehabilitation hospitals and inpatient psychiatric hospitals.
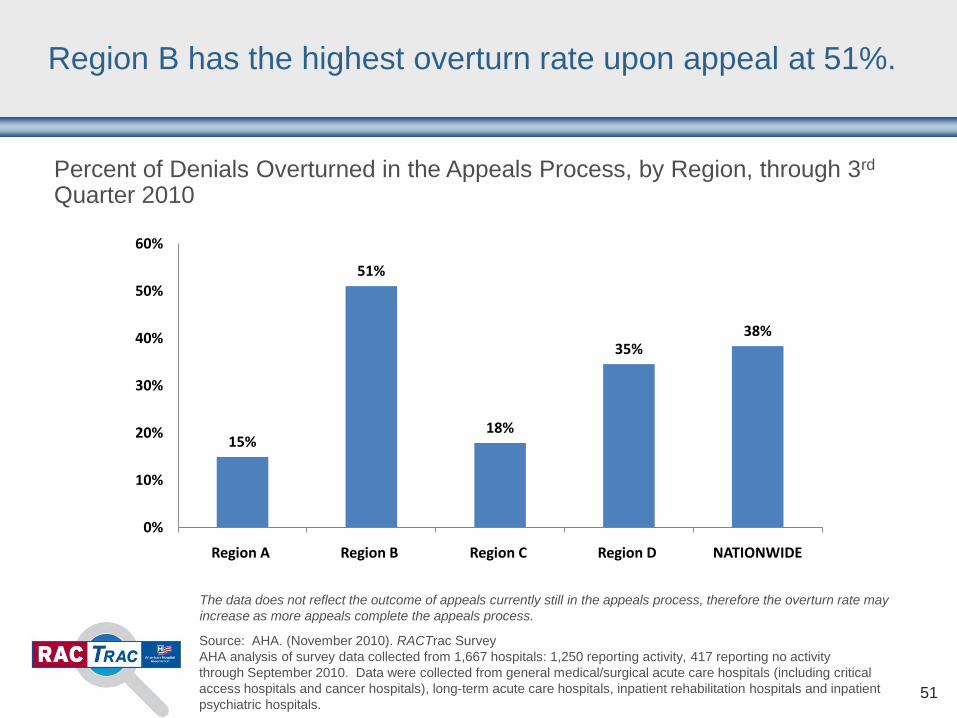
Percent of Denials Overturned in the Appeals Process, by Region, through 3rd
Quarter 2010
Region B has the highest overturn rate upon appeal at 51%.
The data does not reflect the outcome of appeals currently still in the appeals process, therefore the overturn rate may increase as more appeals complete the appeals process.
15%
51%
18%
35%38%
0%
10%
20%
30%
40%
50%
60%
Region A Region B Region C Region D NATIONWIDE
52
Source: AHA. (November 2010). RACTrac SurveyAHA analysis of survey data collected from 1,667 hospitals: 1,250 reporting activity, 417 reporting no activitythrough September 2010. Data were collected from general medical/surgical acute care hospitals (including critical access hospitals and cancer hospitals), long-term acute care hospitals, inpatient rehabilitation hospitals and inpatient psychiatric hospitals.
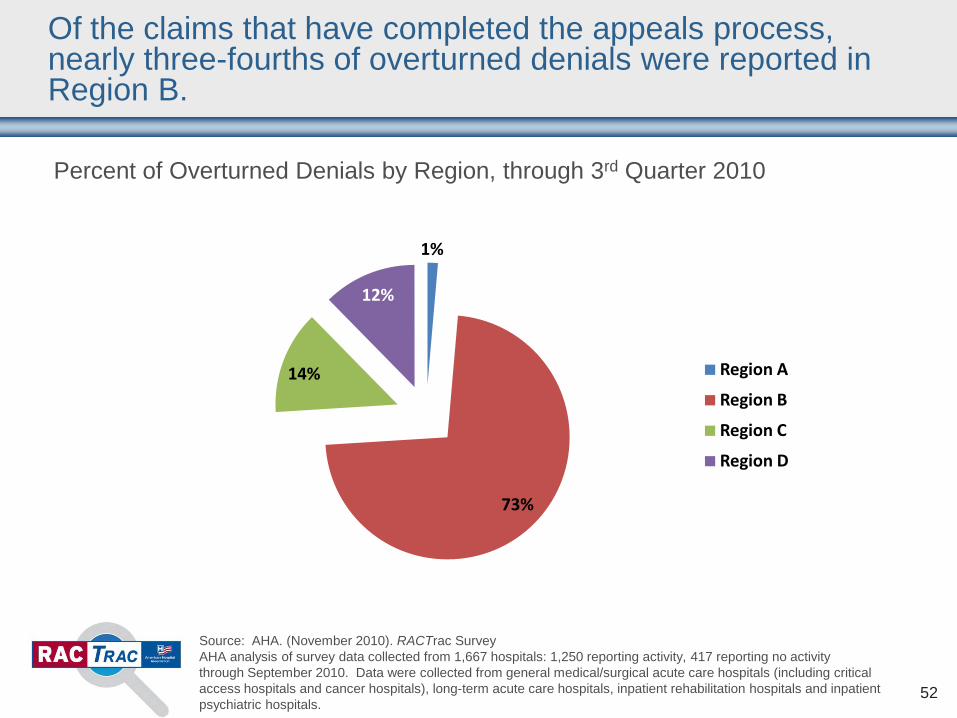
Percent of Overturned Denials by Region, through 3rd Quarter 2010
Of the claims that have completed the appeals process, nearly three-fourths of overturned denials were reported in Region B.
1%
73%
14%
12%
Region A
Region B
Region C
Region D

53
Source: AHA. (November 2010). RACTrac SurveyAHA analysis of survey data collected from 1,667 hospitals: 1,250 reporting activity, 417 reporting no activitythrough September 2010. Data were collected from general medical/surgical acute care hospitals (including critical access hospitals and cancer hospitals), long-term acute care hospitals, inpatient rehabilitation hospitals and inpatient psychiatric hospitals.
Value of Denials Overturned in the Appeals Process, by Region, through 3rd
Quarter 2010
Hospitals reported a total of $1.7 million in overturned denials, with $1 million in Region C alone.
$89,863
$466,854
$1,030,297
$136,037
$1,723,051
$0
$250,000
$500,000
$750,000
$1,000,000
$1,250,000
$1,500,000
$1,750,000
Region A Region B Region C Region D Nationwide
Administrative Burden

55
Source: AHA. (November 2010). RACTrac SurveyAHA analysis of survey data collected from 1,667 hospitals: 1,250 reporting activity, 417 reporting no activitythrough September 2010. Data were collected from general medical/surgical acute care hospitals (including critical access hospitals and cancer hospitals), long-term acute care hospitals, inpatient rehabilitation hospitals and inpatient psychiatric hospitals.
72% of responding hospitals reported that RAC impacted their organization this quarter and 51% reported increased administrative costs.
Impact of RAC on Responding Hospitals* by Type of Impact, 3rd Quarter 2010
51%
28% 27%
21%18%
14%
1%
7%
0%
10%
20%
30%
40%
50%
60%
Increased administrative
costs
No impact Initiated a new internal task
force
Employed additional
staff/Hiring
Additional administrative role of clinical
staff
Modified admission
criteria
Had to make cutbacks
Other
Includes responding hospitals with and without RAC activity
56
Source: AHA. (November 2010). RACTrac SurveyAHA analysis of survey data collected from 1,667 hospitals: 1,250 reporting activity, 417 reporting no activitythrough September 2010. Data were collected from general medical/surgical acute care hospitals (including critical access hospitals and cancer hospitals), long-term acute care hospitals, inpatient rehabilitation hospitals and inpatient psychiatric hospitals.
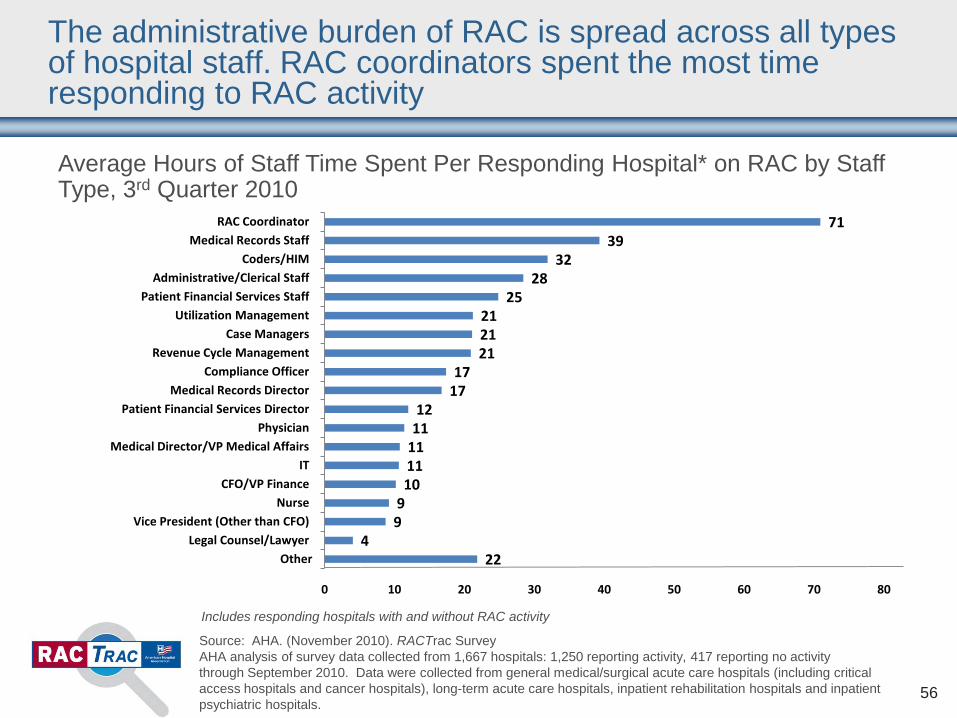
7139
3228
25212121
1717
1211
111110
99
422
0 10 20 30 40 50 60 70 80
RAC Coordinator Medical Records Staff
Coders/HIM Administrative/Clerical Staff
Patient Financial Services Staff Utilization Management
Case Managers Revenue Cycle Management
Compliance Officer Medical Records Director
Patient Financial Services Director Physician
Medical Director/VP Medical Affairs IT
CFO/VP Finance Nurse
Vice President (Other than CFO) Legal Counsel/Lawyer
Other
The administrative burden of RAC is spread across all types of hospital staff. RAC coordinators spent the most time responding to RAC activity
Average Hours of Staff Time Spent Per Responding Hospital* on RAC by Staff Type, 3rd Quarter 2010
Includes responding hospitals with and without RAC activity
57
Source: AHA. (November 2010). RACTrac SurveyAHA analysis of survey data collected from 1,667 hospitals: 1,250 reporting activity, 417 reporting no activitythrough September 2010. Data were collected from general medical/surgical acute care hospitals (including critical access hospitals and cancer hospitals), long-term acute care hospitals, inpatient rehabilitation hospitals and inpatient psychiatric hospitals.
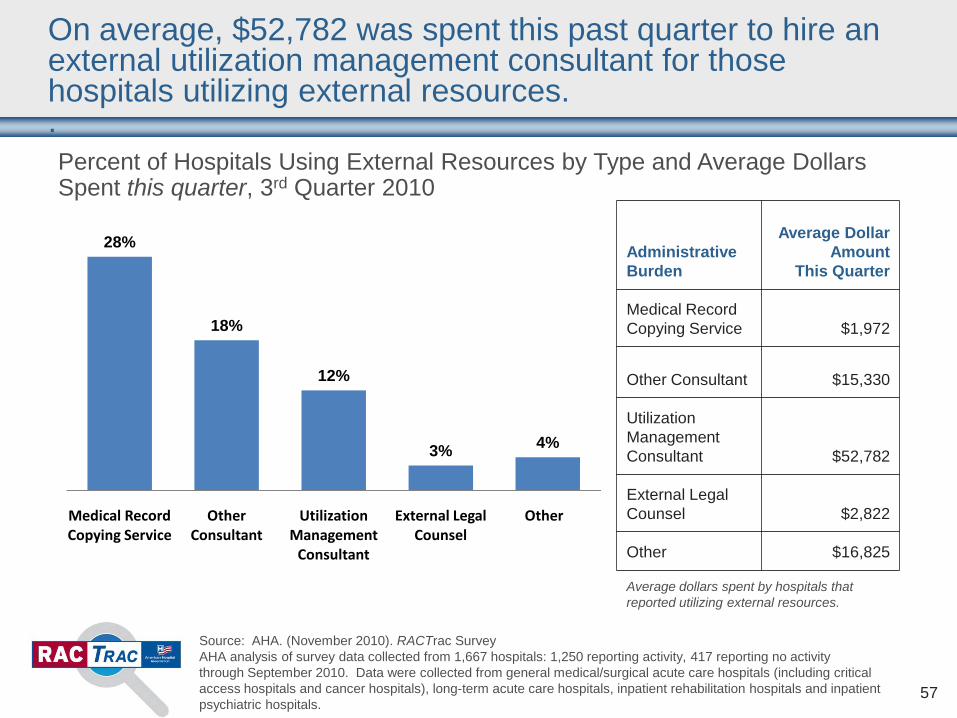
On average, $52,782 was spent this past quarter to hire an external utilization management consultant for those hospitals utilizing external resources..Percent of Hospitals Using External Resources by Type and Average Dollars Spent this quarter, 3rd Quarter 2010
AdministrativeBurden
Average Dollar Amount
This Quarter
Medical Record Copying Service $1,972
Other Consultant $15,330
Utilization Management Consultant $52,782
External LegalCounsel $2,822
Other $16,825
28%
18%
12%
3% 4%
Medical Record Copying Service
Other Consultant
Utilization Management
Consultant
External Legal Counsel
Other
Average dollars spent by hospitals that reported utilizing external resources.
For more information visit AHA’s RACTrac website:
http://www.aha.org/aha/issues/RAC/ractrac.html