exploring the kinetics of chemical reactions using...
TRANSCRIPT

Exploring the Kinetics ofChemical ReactionsUsing Simulations
with STELLA
Scott A. SinexPrince George’s Community College
Submitted as part of the BLT Summer Design Instituteat University of Maryland College Park
17-28 July 2000

1BTL 2000
UNIT TITLE: Exploring the Kinetics of Chemical Reactions UsingSimulations with STELLA
Unit goal: To introduce the concept of how fast or the speed of a chemical reactionand the factors that influence the speed or rate of a reaction. Simple reaction pathwaysare investigated initially then multiple pathways including reversible reactions areexplored.
Grade Level (K-16): freshman college chemistry high school AP chemistry
General Subject Area(s): chemical kinetics
Minimum time required for the unit: 3 weeks
Concepts learned across all unit modules: deriving the rates of a reactions fromconcentration-time data, determining the rate law or equation for a reaction, andinvestigating the factors that influence the rate of a reaction. Also examining reversiblechemical reactions and the concept of chemical equilibrium
Standards addressed by unit modules:1. National Science Education Standards for content standards (9-12)
î content standard A science as inquiry î content standard B in physical science.
2. Praxis II - chemistry: content knowledge 3. Maryland High School Core Learning Goal -
î goal 1 - skills and processes î goal 4 - chemistry
4. National Educational Technology Standards - î standard 3 - Technology productivity tools î standard 5 - Technology research tools
Technology needed in unit modules: graphing calculators (or Excel), STELLA*Modeling software. The actual STELLA models required for each module are included.
* A run-only version of STELLA is available free from High Performance SystemsInc. at http://www.hps-inc.com
Technology-enhanced instructional strategies employed: modeling of data using the graphing calculator or Excelmodels and simulations using STELLA

2BTL 2000
Title of Each Module:Module 1 - The Speed of Chemical Reactions
Module 2 - Investigating the Rate of a Chemical Reaction and the Variablesthat Influence Rate
Module 3 - Simulating and Investigating Kinetics with STELLA
Module 4 - Discovering the Nature of Reversible Chemical Reactions
Module 5 - Exploring Chemical Equilibrium through Simulations with STELLA
Module 6 - Kinetics of Consecutive and Competing Reactions with STELLA
Module 7 - Putting it All Together and Then Some - an Assessment Activity
Unit Culminating Activity: This is done in Module 7 - Putting it All Together and ThenSome - an Assessment Activity where a series of questions explore the concepts andmodels introduced in modules 1 to 6 plus examines a STELLA model simulation ofcompeting equilibria, a situation not covered in the modules but a natural extension ofthe material.
Unit Author: Scott A. Sinex (Prince George’s Community College)e-mail: [email protected]

3BLT 2000
MODULE 1
Module Title: THE SPEED OF CHEMICAL REACTIONS
Estimated time to complete: 1 hour
Module objectives: To observe the speed of a simple reaction and to consider someinfluences on the speed
Concept(s) learned in this module: rate of reaction and observing factors thatinfluence it
Standards addressed in this module (Praxis, K-12):1. National Science Education Standards for content standards (9-12) - content
standard A science as inquiry and content standard B in physical science. 2. Praxis II - chemistry: content knowledge 3. Maryland High School Core Learning Goal - goal 1 - skills and processes and
goal 4 - chemistry
Technology-enhanced instructional strategies utilized in this module: none
Components Brief description of module activities StudentGrouping*
Materials/ Technology
Engagement observe the reaction of an Alka-Seltzer inwater reaction
smallgroup
Alka-Seltzertablets,beakers
Exploration consider how speed of reaction and howreactants and products change duringreaction
smallgroup
none
Explanation following the speed from the fizzing smallgroup
none
Extension hot water - cold water speed differencesand the crushing of the table
smallgroup
none
Evaluation examining a graph of data and sketchinganother
individual none
*Student grouping: Individual, paired, small group, whole class, etc.
Expected module outcomes: To observe how the speed of a reaction changes withtime and some influences on this speed
Performance-based assessment of module outcomes: Examine data for theproduction of a reaction product and sketch how a reactant changes with time over areaction.

4BLT 2000
MODULE 1 - THE SPEED OF CHEMICAL REACTIONS
EngagementPlace an Alka-Seltzer tablet into a container of water. Observe the system carefullyuntil the tablet completely disappears. Describe what you observed.
ExplorationThe Alka-Seltzer tablet contains the two solids sodium bicarbonate, NaHCO3, and citricacid, H3Citrate. The chemical reaction of the Alka-Seltzer tablet in water, where the twosolids are soluble, is given below:
3NaHCO3 (aq) + H3Citrate (aq) ! Na3Citrate (aq) + 3H2O + 3 CO2 (g)
How could you tell the reaction was slowing down?
How did the amounts of sodium bicarbonate and citric acid change with time?
ExplanationThe reactants, sodium bicarbonate and citric acid, start at a high amount orconcentration and decrease in amount as the reaction proceeds. The products, sodiumcitrate and carbon dioxide, increases in amount as the reaction occurs. The slowingdown of the rate of reaction can be seen as the fizzing or production of carbon dioxidegas slows.
ExtensionPlace a whole tablet into hot water, how does it compare to results from cool or tapwater?

5BLT 2000
Production of Oxygen Gas
0
10
20
30
40
50
0 5 10 15 20
Time (seconds)
Pre
ssur
e (m
m H
g)
If you crushed an Alka-Seltzer tablet and placed it into water, what would happencompared to a whole tablet? (Try the experiment.)
EvaluationConsider the graph of the pressure of oxygen gas from the decomposition of hydrogenperoxide and the addition of catalase given below:
2H2O2 (aq) ! 2H2O + O2 (g)
Offer an explanation of the rate of reaction based on the graph.
Data from: http://mdk12.org/practices/support_success/hsa/biology/enzyme_activity
Sketch and label the axes a graph showing how the concentration of H2O2 wouldchange.

6BLT 2000
MODULE 2
Module Title: INVESTIGATING THE RATE OF A CHEMICAL REACTIONAND THE VARIABLES THAT INFLUENCE RATE
Estimated time to complete: 2-3 hours
Module objectives: Calculate the rate from concentration vs. time data and derive therate law. Determine the influence of temperature, activation energy, and catalyst on therate.
Concept(s) learned in this module: determining rate from concentration-time data,how to derive rate law, factors that influence the rate of reaction
Standards addressed in this module (Praxis, K-12):1. National Science Education Standards for content standards (9-12) - content
standard A science as inquiry and content standard B in physical science. 2. Praxis II - chemistry: content knowledge 3. Maryland High School Core Learning Goal - goal 1 - skills and processes and
goal 4 - chemistry 4. National Educational Technology Standards - standard 3 - Technology
productivity tools and standard 5 - Technology research tools
Technology-enhanced instructional strategies utilized in this module:modeling of data using the graphing calculator or Excelmodels and simulations using STELLA
Components Brief description of module activities StudentGrouping*
Materials/ Technology
Engagement questions on how to get horses, cars andcomputers to go faster
smallgroup
none
Exploration analysis of concentration-time data,deriving a rate law, and examining factorsthat influence rate
smallgroup
graphingcalculator,STELLA
Explanation how the rate is influenced byconcentration, order, temperature,activation energy, and catalyst
smallgroup
none
Extension another way to analyze concentration-timedata and derive a rate law
smallgroup
graphingcalculator

7BLT 2000
Evaluation graphical interpretation Individual graphingcalculator
*Student grouping: Individual, paired, small group, whole class, etc.
Expected module outcomes: be able to derive rate law from concentration-time data,understand what factor influence the rate of a reaction
Performance-based assessment of module outcomes: interpret data and graphs ofconcentration against time

8BLT 2000
MODULE 2 - INVESTIGATING THE RATE OF A CHEMICAL REACTIONAND THE VARIABLES THAT INFLUENCE RATE
EngagementHow could you get a horse you were riding to go faster?
How could you get a car you were riding in to go faster?
How could you get a computer to go faster?
How could you get a chemical reaction to go faster? List any factors you think wouldinfluence the rate or speed of a chemical reaction?
On a plot of concentration of a startingsubstance against time, how would you tellthe difference between a substance thatreacts slowly from one that reacts quickly? Illustrate on the graph.
ExplorationNow let’s plot some real data for the first-order rearrangement of methyl isonitrile tomethyl nitrile as given by the reaction below:
CH3-NC (g) ö CH3-CN (g)

9BLT 2000
Plot the data given in the table below, which were collected at 215oC in a one litervessel.
Time Concentrationof CH3-NC
Concentration of CH3-CN
Sum ofA + B
0 ksec 16.5 mM
2 11.0
5 5.91
8 3.14
12 1.37
15 0.736
Sketch the curves for this data on your plot above. How do they agree with your initialsketch?
Now let’s calculate the rate of the reaction. This is the slope of a tangent line at a pointon the concentration against time curve. We will oversimplify it here by calculating theslope between each pair of data points.
Fill in the columns of the table given below. On the TI-83, use [2nd] [LIST] OPS, thenselect ÄList to calculate the differences as ÄList (Ln).
Time Concentrationof CH3-NC
Ätime Äconc. Äconc/Ätime
averagetime*
averageconc.**
0 ksec 16.5 mM
2 11.0
5 5.91
8 3.14
12 1.37
15 0.736
* Time + Ätime/2 ** Conc + Äconc./2
The slope or change in concentration divided by the change in time is the rate at the

10BLT 2000
− =∆∆conc.
timenow a positive number
average time for the two points used to calculate the slope. What are the units of therate?
How does the rate vary over time?
The rate is negative because the concentration of the reactant is decreasing over time. For a reactant disappearing we write:
Plot the rate against average time for the reaction. Sketch and label the graph below.
Does the rate of the reaction depend on the concentration of CH3-NC? Explain why orwhy not.
As the concentration of CH3-NC decreases, the rate of the disappearance of CH3-NCdecreases as well.
Let’s explore the relationship between rate and concentration. Plot a graph of rateagainst concentration. Sketch and label the graph axes below.
What type of relationship is their between rateand concentration? Perform an appropriateregression.
The slope of the linear relationship between rate and concentration is the rate constant,k, for this first-order reaction. Write an equation in terms of the variables. This is the

11BLT 2000
rate law for this reaction.
What are the units of the rate constant, k?
An alternate method of calculation is given as an extension of this module.
The order of reaction has to do with the power of the concentration term(s) in the ratelaw:
Rate = k(X)n
where (X) is the concentration of X and n is the power or order. For n =1, the reactionis first order. We will explore the effect of order or the value of n shortly.
To ignite the natural gas on your stove or gas furnace, what has to happen?
CH4 (g) + 2O2 (g) ö CO2 (g) + 2H2O (g)
The speed or the rate of a chemical reaction is influenced by a number of variables. What might some of these variables be? List some possible influences on the rate of areaction.
Let’s explore the variation of the initial rate of reaction using a STELLA model. Theinitial rate is the rate at the start of the reaction, when the initial concentrationessentially still holds. Like a horse race, the initial rate is the rate of reaction just out ofthe starting gate. Call up the model “Temp_Ea_Rate” on the computer. We willexamine the influence of three variables: concentration and order, activation energy(the kick to get the reaction started), and temperature. For each variable you will needto vary the variable over the total range - set it low and move it in five intervals to thehigh end or vice versa. Do this one variable at a time, while setting the other variablesto their typical value - click on the U on the slider.
How does concentration influence initial rate?
Does order influence the relationship for concentration? If so, how?

12BLT 2000
How does temperature influence initial rate?
How does activation energy (Ea) influence initial rate?
A catalyst is a substance that lowers the activation energy of a reaction by changing themechanism or pathway of the reaction. The catalyst is not consumed in the reaction. What does this do to the rate of the reaction?
ExplanationThe effect of a change in concentration and order was discussed above with theintroduction of the rate law. An increase in concentration increases the rate of areaction as seen by the increased negative slope of the rate against concentration plotin this first-order example. A change in order changes the behavior of the graph, asorder increases the rate increases (we will explore this further in the next module.).
When the order is zero, the rate is equal to the rate constant and the startingconcentration does not influence the rate since (A)0 = 1: Rate = rate constant
The variables of temperature and activation energy influence the rate constant, k, in therate law. As seen above in the STELLA model, increasing the temperature increasesthe rate, while decreasing the activation energy increases the rate. The activationenergy is a constant for any reaction pathway. The catalyst changes the activationenergy by altering the pathway or mechanism to one with a lower activation energy andhence, faster rate.
ExtensionPerform an exponential regression on the concentration against time data, place theregression equation into the function editor, [Y=], and plot the curve as Y1. How welldoes it fit the data?
Now let’s have the calculator determine the rate of change of this curve. Earlier you did

13BLT 2000
the slope between pairs of data points! The TI-83 will find the slope of a tangent line atmany places along the curve (or regression function) and then plot it. Press [Y=] andplace the cursor at Y2 and then press [(-)] [MATH] and select nDeriv. Complete the lineas: -nDeriv (Y1, X, X) Use [X,T,è,n] to get the X and [VARS] Y-VARS the FUNCTIONto get Y1. Then press [GRAPH] to plot (it will a little time).
This will determine the numerical derivative or the slope Y1 at numerous points along Y1
as X varies over all the X values. The calculator determines the slope of the function,Y1 at many pairs of points that are very close together on the original function. Howdoes the curve fit your earlier Äconc/Ätime against average time data?
Now press [Y=] and go to Y3 and add this line: Y3 = Y2/Y1
Press [GRAPH]. What is the result?
How are rate and concentration related? Write an equation in terms of the variablesplotted.
How does this method compare to your earlier calculation?
Which method do you think is the better calculation? Why?
EvaluationFor a first order reaction, how could you easily double the rate of reaction? Explain.
For a zeroth order reaction does the statement “the rate is independent ofconcentration” make sense? Explain.
Third order reactions are very rare, how would they compare in rate to second orderreactions?
Plot the following data and determine the order of the reaction.

14BLT 2000
12:14 PM Fri, Jul 14, 2000
0.00 3.00 6.00 9.00 12.00 15.00
Time
1:
1:
1:
0.00
50.00
100.00
1: Concentration A 2: Concentration A
1
1
11 1
2
22 2
Graph 2 (Comparisons for A)
time concentration time concentration
0 minutes 1.0 M 5 0.49
1 0.90 6 0.40
2 0.79 7 0.30
3 0.70 8 0.19
4 0.61 9 0.099
What is the difference in the graphs of concentration A for run 1 and 2 involving thesame reaction?

15BLT 2000
12:05 PM Fri, Jul 14, 2000
0.00 3.00 6.00 9.00 12.00 15.00
Time
1:
1:
1:
2:
2:
2:
0.00
50.00
100.00
1: Concentration A 2: Concnetration B
1
1
11 1
2
22 2 2
Graph 1 (Concentration vs Time)
Interpret the graph of concentration against time given below.

16BLT 2000
MODULE 3
Module Title: SIMULATING AND INVESTIGATING KINETICS WITH STELLA
Estimated time to complete: 2-3 hours
Module objectives: graphical determination of the order of a reaction
Concept(s) learned in this module: zeroth, first, and second order reactions
Standards addressed in this module (Praxis, K-12):1. National Science Education Standards for content standards (9-12) - content
standard A science as inquiry and content standard B in physical science. 2. Praxis II - chemistry: content knowledge 3. Maryland High School Core Learning Goal - goal 1 - skills and processes and
goal 4 - chemistry 4. National Educational Technology Standards - standard 3 - Technology
productivity tools and standard 5 - Technology research tools
Technology-enhanced instructional strategies utilized in this module:modeling of data using the graphing calculator or Excelmodels and simulations using STELLA
Components Brief description of module activities StudentGrouping*
Materials/ Technology
Engagement how does concentration -time graphchange
smallgroup
none
Exploration graphical analysis of STELLA simulationresults
smallgroup
STELLA
Explanation equations for the various orders ofreactions
smallgroup
none
Extension/Evaluation
treating data to arrive at a rate law Individual graphingcalculator
*Student grouping: Individual, paired, small group, whole class, etc.
Expected module outcomes: derive relationships for various orders of reactions
Performance-based assessment of module outcomes: be able to analyze data todetermine the order of a reaction

17BLT 2000
MODULE 3 - SIMULATING AND INVESTIGATING KINETICS WITH STELLA
EngagementLet’s consider how the concentration of a reactant, A, is influenced by the order of thereaction. The reaction is given by:
x A ö products where x is thecoefficient (x $1).
How is the concentration of A going to behave as thereaction proceeds? Sketch a prediction.
How would you characterize the slope of yourprediction?
ExplorationNow we want to consider what the rate law is for the disappearance of A. Here aresome possibilities given in the table. Notice these relationships do not contain time asa variable. The rate or Äconcentration/Ätime is negative due to the reactant beingconsumed in the reaction.
Order Rate Law
zero R = k(A)0
first R = k(A)1
second R = k(A)2
where R = rate of reaction, k = rate constant, and (A) = molar concentration of A.
Bring up the STELLA model “kinetics_order_of_reaction” on the computer to examinehow concentration behaves with time and address the following questions:
1. Run the model and thensketch and label the threecurves, which show thebehavior for each possibleorder. Which order consumesthe reactant the fastest? Labelthe initial or startingconcentration of A as Ao.

18BLT 2000
Time
Time
Time
How does changing the starting concentrationinfluence the curves? Sketch and label tworuns of the model at different startingconcentrations.
How does changing the rate constant, k,influence the curves? Sketch and label two runsof the model.
How do you determine the rate of the reaction?
2. What does taking the log of concentration for the first order reaction do to thegraph? This plot is log (A) against time.
Illustrate on the graph and explain how thiscurve is influenced by changing: í starting concentration?
í rate constant?
How do you determine the rate constant?
The initial (Ao) is now log (Ao) at the y-intercept. Label on the graph above.

19BLT 2000
Time
Time
3. What happens to a second order reaction when1/(A) is plotted against time?
Illustrate on the graph and explain how this curveis influenced by changing: í starting concentration?
í rate constant?
The y-intercept of the plot is the 1/(Ao). Label on graph above.
How do you determine the rate constant?
4. For the zero order plot, what happens to the rate when starting concentration ischanged?
What happens to the rate when the rateconstant is changed?
How do you determine the rate constant?

20BLT 2000
ExplanationHere are the characteristics of zero, first, and second order reactions for a reaction ofthe following:
aA ! products with a rate law: rate = k(A)n
where (A) is the concentration of A at any time, t, (Ao) is the concentration of A at time =0 or the initial concentration and n is the order of the reaction.
Order, n Rate Law Relationship ofconcentrationagainst time
Linear Ploty = mx + b
slopem
interceptb
zeroth, n = 0
rate k= (A) kt (A )o= − + (A) against t -k (Ao)
first, n =1
rate k(A)=log
(A)
(A )
kt
2.303o
=− log (A) against
t -k 2.303
log (Ao)
second, n = 2
rate k(A)2= 1
(A)kt
1
(A )0
= +1/(A) against t k 1/(Ao)
You should have deduced this information from the plots and changing variables studyperformed using the STELLA models. By plotting concentration against time data andtrying the various transformations on your graphing calculator, you can determine theorder of a reaction.

21BLT 2000
Extension/EvaluationConsider the decomposition of gaseous N2O5:
2N2O5 (g) ö 4NO2 (g) + O2 (g)
Find the order of the reaction by the graphical approach outlined above using your TI-83 graphing calculator. You will want to perform linear regressions and use the r2 valueto help judge best-fit. The highest r2 would be the best-fit linear model and thus yieldthe order of the reaction.
Rate = k(N2O5)n What is the value of n?
Time,minutes
(N2O5)
0 0.160M
2 0.080
4 0.040
6 0.020
8 0.010
10 0.0050
Explain your choice.
Type of Plot r2 for linearregression
concentration vs. time
log concentration vs.time
1/concentration vs.time

22BLT 2000
Now consider the uncatalyzed decomposition of hydrogen iodide:
2HI (g) ö H2 (g) + I2 (g)
Again using the graphical approach, what is the value of n in the rate law? Rate =k(HI)n
Time,hours
Concentration HI,M
0 1.00
2 0.50
4 0.33
6 0.25
8 0.20
Explain your choice.
In the presence of gold, where the gold surface acts as a catalyst, the rate becomesindependent of (HI). What is the rate law in the catalyzed case?
STELLA Modeling Software is a product of High Performance Systems. The modelsused here are modifications of models developed by the Maryland Virtual High SchoolCoreModels Program.

23BLT 2000
MODULE 4
Module Title: DISCOVERING THE NATURE OF REVERSIBLE CHEMICALREACTIONS
Estimated time to complete: 2-3 hours
Module objectives: to introduce the nature of forward and backward reactions
Concept(s) learned in this module: reverse reaction, net reaction rate, equilibrium,equilibrium constant
Standards addressed in this module (Praxis, K-12):1. National Science Education Standards for content standards (9-12) - content
standard A science as inquiry and content standard B in physical science. 2. Praxis II - chemistry: content knowledge 3. Maryland High School Core Learning Goal - goal 1 - skills and processes and
goal 4 - chemistry 4. National Educational Technology Standards - standard 3 - Technology
productivity tools and standard 5 - Technology research tools
Technology-enhanced instructional strategies utilized in this module:models and simulations using STELLA
Components Brief description of module activities StudentGrouping*
Materials/ Technology
Engagement following a simple reactions progress smallgroup
none
Exploration simulation of forward and backwardreaction progress, equilibrium
smallgroup
STELLA
Explanation defining equilibrium and equilibriumconcentration
smallgroup
STELLA
Extension relating rate constants and equilibriumconstants
smallgroup
none
Evaluation sketching graphs of a simple reaction Individual none
*Student grouping: Individual, paired, small group, whole class, etc.

24BLT 2000
Expected module outcomes: understanding the nature of reversible reactions and thedynamic concept of equilibrium from the kinetics of forward and backward reactions
Performance-based assessment of module outcomes: understanding the graphicalbehavior of equilibrium systems, judging the extent of reaction

25BLT 2000
A Bk f →
MODULE 4 - DISCOVERING THE NATURE OF REVERSIBLE CHEMICALREACTIONS
EngagementConsider the simple gas phase reaction that goes to completion:
where kf is the rate constant for this first-order reaction.
If 1.0 mole of A is placed into a 1.0L vessel, as A reacts B appears. Complete thetable.
Mole A Mole B Mole A +Mole B
1.0
0.9
0.7
0.5
0.3
0.1
0
Predict by sketching a graph of concentration against time showing both A and B andremembering this is a first-order reaction.

26BLT 2000
Akf
Xkb
B
ExplorationNow let’s look at this reaction using a STELLA model “reversible reaction” where wecan adjust kf. Notice a second rate constant, kb, set at zero.
Sketch and label the graph below for three different values of kf.
Does your earlierprediction graph agree with this plot?
How does the value of kf influence the rate of disappearance of A?
How does the value of kf influence the rate of appearance of B?
Now let’s add a twist to this reaction. Suppose that the reaction can also go in thereverse direction or that B converts back to A. We can write this as shown below:
where kf is the forward rate constant for A going to B and kb is the backward rateconstant for B going back to A.

27BLT 2000
Sketch and label graphs for the following three situations.
kf > kb kf = kb kf < kb
Do any of the graphs for the disappearance of A reach zero? Why not?
As time passes what do the concentrations of A and B do?
The concentrations of both A and B level off to a constant non-zero value. The time ittakes to reach these constant levels varies with the choice of the rate constants.
Suppose we look at the rate of change of the concentration against time graph. This islike finding the slope between two points on the curve at a great number of pairs ofpoints. See illustration of this below.
Place an X on the steepest slopesegment.

28BLT 2000
slope 'ÄYÄX
'Y1&Y2
X1&X2
'Äconcentration
Ätime' rate
The slope of a line or the rate of disappearance of A is given by:
The STELLA model will plot the rate of disappearance of A or forward rate and the rateof appearance of B, backward rate.
Sketch and label the three situations:
kf > kb kf = kb kf < kb
As time passes, what happens to the forward rate and backward rate?
Notice on these plots that the NET rate (forward rate - backward rate) is also given. What does it show?
ExplanationThe NET rate reaches zero, which gives the appearance that the reaction stops, butthis is not true. The forward and backward rates become equal at the same time thatthe concentrations leveled out.
The reaction has reached equilibrium when the forward rate equals the backward rate. Notice on the graphs that this occurs at a positive value. The forward and backwardreactions did NOT stop! They have reached a state of dynamic equilibrium.

29BLT 2000
Keq '(B)(A)
'kf
kb
The concentrations of A and B are constant. The STELLA model will calculate andgraph the ratio of concentrations. What about the ratio of the concentrations of B overthe concentration of A or (B)/(A)?
What do you notice about the (B)/(A) and kf/kb?
The equilibrium constant , Keq, is given by
which occurs when the forward rate = backward rate.
ExtensionReactants are favored when Keq is small or large.
Products are favored when Keq is small or large.
What is Keq if the rate constants are equal?
For the simple reaction A W B, describe the composition for the situation of equal rateconstant.
Equilibrium occurs when theforward rate = backward rate.

30BLT 2000
EvaluationSketch and label the following graphs for a system that comes to equilibrium fromstarting condition where the concentration of A2 is greater than zero and B2 is zero:
A2 W B2
a. Show concentrations of A2 and B2 against time
From your graph, what is the relative value of the equilibrium constant?
b. show forward, backward and net rates against time
Did the reaction really stop? Explain why or why not.

31BLT 2000
MODULE 5
Module Title: EXPLORING CHEMICAL EQUILIBRIUM THROUGH SIMULATIONSWITH STELLA
Estimated time to complete: 2-3 hours
Module objectives: exploring factors that influence systems going to equilibrium
Concept(s) learned in this module: effects of changing concentration ,volume,starting point (reactants only or products only, mixed), how rate constants influence theequilibrium constant
Standards addressed in this module (Praxis, K-12):1. National Science Education Standards for content standards (9-12) - content
standard A science as inquiry and content standard B in physical science. 2. Praxis II - chemistry: content knowledge 3. Maryland High School Core Learning Goal - goal 1 - skills and processes and
goal 4 - chemistry 4. National Educational Technology Standards - standard 3 - Technology
productivity tools and standard 5 - Technology research tools
Technology-enhanced instructional strategies utilized in this module:models and simulations using STELLA
Components Brief description of module activities StudentGrouping*
Materials/ Technology
Engagement how is equilibrium constant influence byrate constants
smallgroup
none
Exploration STELLA simulation of equilibrium systemsand they are influenced by concentration,volume, Keq, kf, and kb
smallgroup
STELLA
Explanation how the rate constants influence the valueof the equilibrium constant
smallgroup
none
Extension a disturbed equilibrium smallgroup
none
Evaluation graphical interpretation of data Individual none
*Student grouping: Individual, paired, small group, whole class, etc.

32BLT 2000
Expected module outcomes: how the rate constants influence the value of theequilibrium constant and starting concentration and volume influence the equilibriumconcentrations
Performance-based assessment of module outcomes: interpretation of graphicalresults based on various ratios of the rate constants
33BLT 2000
K(B)
(A)
k
keqforward
reverse
= =
MODULE 5 - EXPLORING CHEMICAL EQUILIBRIUM THROUGHSIMULATIONS WITH STELLA
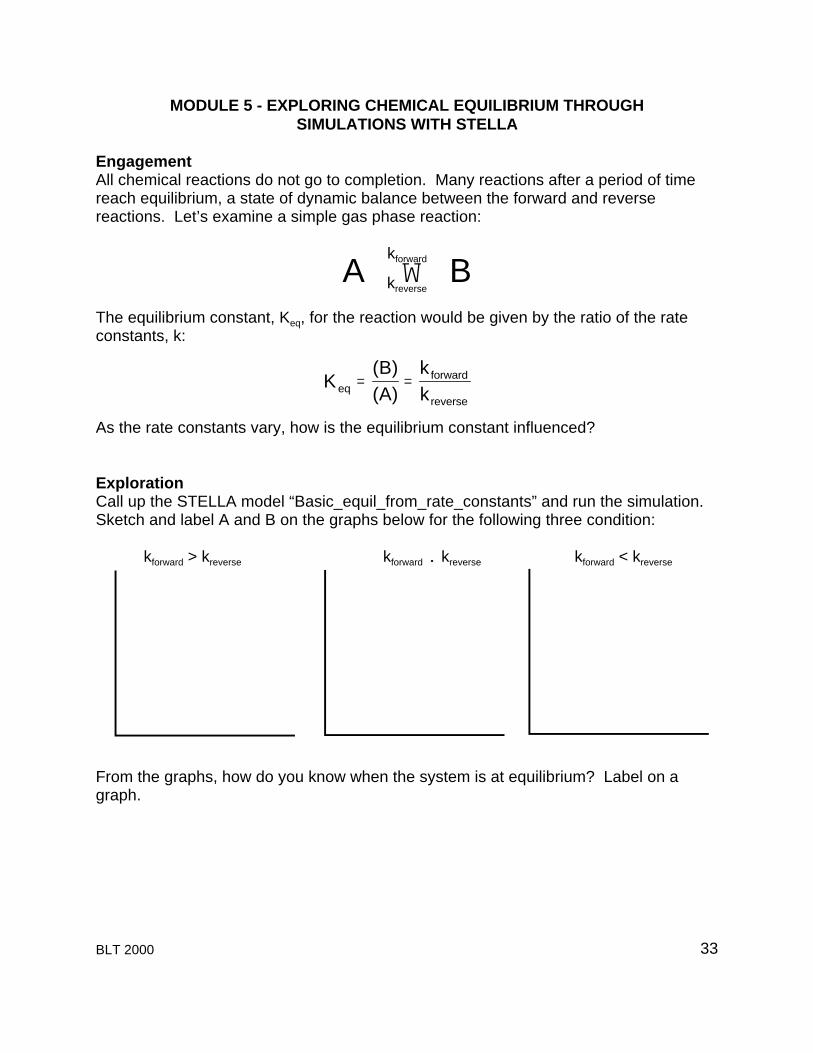
EngagementAll chemical reactions do not go to completion. Many reactions after a period of timereach equilibrium, a state of dynamic balance between the forward and reversereactions. Let’s examine a simple gas phase reaction:
kforward
A W Bkreverse
The equilibrium constant, Keq, for the reaction would be given by the ratio of the rateconstants, k:
As the rate constants vary, how is the equilibrium constant influenced?
ExplorationCall up the STELLA model “Basic_equil_from_rate_constants” and run the simulation. Sketch and label A and B on the graphs below for the following three condition:
kforward > kreverse kforward . kreverse kforward < kreverse
From the graphs, how do you know when the system is at equilibrium? Label on agraph.

34BLT 2000
If you change the starting concentration of A,how does the graph change?
For changing concentrations, does the value ofthe equilibrium constant change?
Describe how can you change the value of theequilibrium constant?
Once a system comes to equilibrium, how does the equilibrium constant behave overtime?
What is the difference between the following two situations where Keq = 2?
kf = 2 kf = 0.2kb = 1 kb = 0.1
Now close the above model and click on “Don’t Save” and then open the model“Equil_system_HI” which uses the reaction:
2HI (g) W H2 (g) + I2 (g)
This model lets you vary the concentration of the reactant and/or the two products. Thevolume of the container can also be changed. The results can be viewed as a concentrationverses time graph. Run the default model whereonly 1.0 mole of HI is placed into a 1-L vessel. Sketch and label (HI, H2, and I2) the graphbelow.
Does changing the volume of the vessel change the equilibrium constant?

35BLT 2000
Kk
keqf
b
=
Run the model with 1.0 mole of all three substances in a 1-L vessel. Sketch and labelthe graph below.
Does the reaction come to equilibrium? Explain.
Run the model with 0.01 mole HI and 1.0 mole of both products in a 1-L vessel. Sketchand label the graph below.
Does the reaction come to equilibrium from thereverse direction, starting with lots of products? How do you know?
Are there lots of products and little reactant? Explain why or why not.
Now close the model and click on “Don’t Save.”
ExplanationSince the equilibrium constant, K, is given by the following ratio of rate constants, k:

36BLT 2000
We can construct the following table that summarizes the results you investigatedabove with the STELLA models.
Reaction is Rate constants Equilibrium constant
product-favored kf > kb Keq > 1
reactant-favored kf < kb Keq < 1
~equal mix of both kf ~ kb Keq ~ 1
Equilibrium can be achieved from either direction, starting with all reactants or allproducts. Equilibrium concentrations are influenced by the starting concentrations butthe equilibrium constant is NOT changed. For the HI reaction above the volume doesnot influence the equilibrium because there are an equal number of molecules on bothsides of the reaction.
ExtensionSuppose a system like one of the above was at equilibrium and then disturbed by theaddition of one of the components. Show an example with a disturbance labeled on thegraph.
Predict and show on the graph how the systemwould respond and return to a new equilibrium.
Does the value of the equilibrium constantchange?
Explain why or why not.
Evaluation
37BLT 2000
4:33 PM Tue, Aug 08, 2000
0.00 1.00 2.00 3.00 4.00 5.00
Time
1:
1:
1:
2:
2:
2:
0.00
0.50
1.00
1: Conc A 2: Conc B
1
1
1
1
1
2
2
2
22
Graph 1: p1 (Concentration vs. Ti…
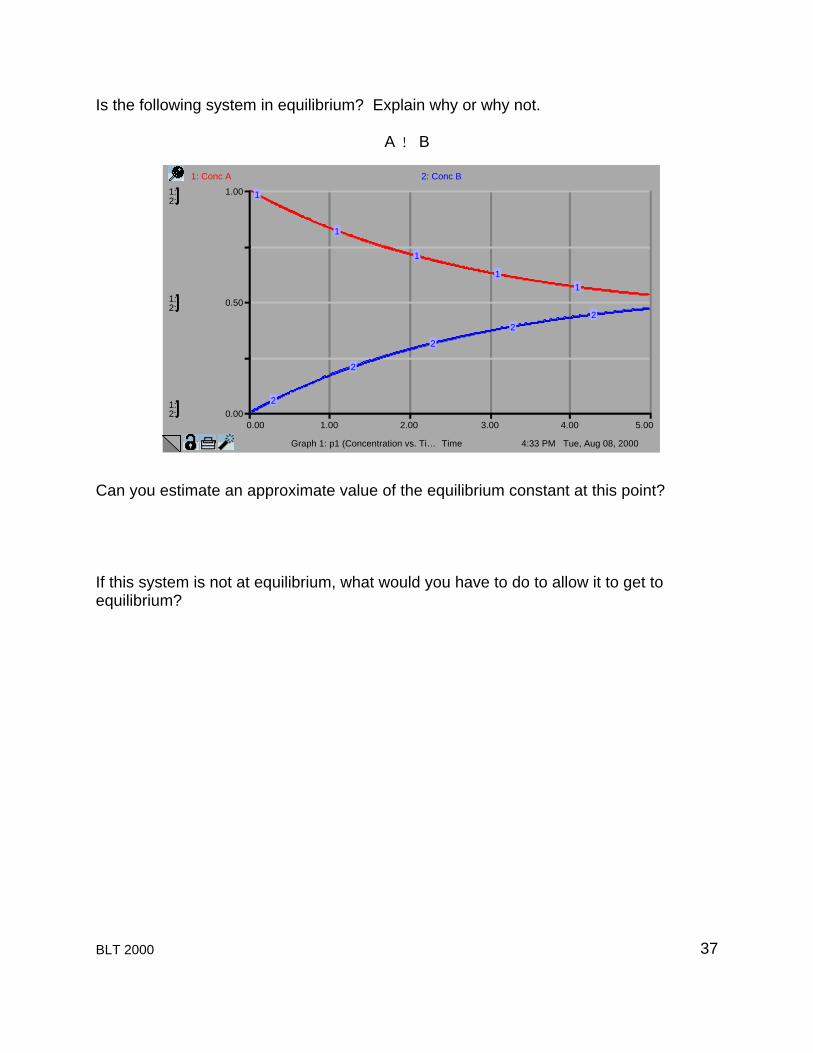
Is the following system in equilibrium? Explain why or why not.
A ! B
Can you estimate an approximate value of the equilibrium constant at this point?
If this system is not at equilibrium, what would you have to do to allow it to get toequilibrium?

38BLT 2000
MODULE 6
Module Title: KINETICS OF CONSECUTIVE AND COMPETING REACTIONSUSING STELLA
Estimated time to complete: 2-3 hours
Module objectives: introduction to competing and consecutive reactions
Concept(s) learned in this module: competing and consecutive reactions and howthe rate constants control the overcome of the products
Standards addressed in this module (Praxis, K-12):1. National Science Education Standards for content standards (9-12) - content
standard A science as inquiry and content standard B in physical science. 2. Praxis II - chemistry: content knowledge 3. Maryland High School Core Learning Goal - goal 1 - skills and processes and
goal 4 - chemistry 4. National Educational Technology Standards - standard 3 - Technology
productivity tools and standard 5 - Technology research tools
Technology-enhanced instructional strategies utilized in this module:models and simulations using STELLA
Components Brief description of module activities StudentGrouping*
Materials/ Technology
Engagement review of a single step reaction smallgroup
none
Exploration competing and consecutive reactionmodels in STELLA
smallgroup
STELLA
Explanation comparison of competing and consecutivereactions
smallgroup
none
Extension/Evaluation
addition of an equilibrium step to the firststep of a consecutive reaction - asimulation with STELLA
smallgroup
STELLA
*Student grouping: Individual, paired, small group, whole class, etc.
Expected module outcomes: an understanding of competing and consecutivereactions
Performance-based assessment of module outcomes: how an additional step(addition of an equilibrium step to the first step of a consecutive reaction) influences theoverall reaction

39BLT 2000
A Ck1 →
A B Ck k1 2 → →
MODULE 6- KINETICS OF CONSECUTIVE AND COMPETING REACTIONSUSING STELLA
EngagementConsider the simple first-order reaction below with a rate constant k1.
How do the rates compare for the disappearance ofA to the appearance of C?
What would a graph of concentration against timelook like (consider both A and C)? Sketch and labela graph.
ExplorationNow call up the STELLA™ model, “What_is_going_on” and run it for a number ofdifferent rate constants. Does it confirm you graph above assuming the simplereaction?
However, notice that the experimental results do not match the simple single stepreaction that we assumed was the case. The production of C is not as fast and fallsbelow the single step model. Something else must be going on in our reaction. Let’sexplore some possibilities.
Consider the following two-step reaction:
Each step is controlled by the first order rate constant, k, for the particular step. Thistype of multi-step reaction is called consecutive reactions. This type of reaction isvery important for many reactions especially in organic chemistry. The substance Bcould be an intermediary in a mechanism. Using STELLA™, we want to explore thistwo-step reaction to see how the rates of each step control the final product, C.

40BLT 2000
Think about how the rate constants, k1 and k2, are going to control the reaction for thefollowing situations.
Both are very small?
Both are very large?
One is large and the other is small?
Now call up the STELLA™ model, “Two_Step_Reaction” and run it. You can adjust therate constants, k1 and k2, with the two different sliders. Set-up the following five runsand sketch and label the four curves on the graphs for them. As you run these fivecases, think about what controls the overall rate of reaction.
k1 > k2 k1 = 0; k2 any value
k1 any value; k2 = 0 k1 = k2
41BLT 2000
AB
C
k1
k 2
k1 < k2
How is the overall rate of reaction influenced by the two rate constants, k1 and k2?
Summarize are the two rate constants control the rate of production of the product, C
On all the graphs for any run was a fourth line: “A + B + C” What does this linedemonstrate? Explain.
Now consider the following two first order reactions that both consume reactant A:
These two reactions are called competing reactions. Each reaction is controlled bythe first order rate constant, k.

42BLT 2000
How is this set of reactions different from the two consecutive reactions discussedabove?
Now call up the STELLA™ model, “Two_Competing_Reactions” and run it. You canadjust the rate constants, k1 and k2, with the two different sliders. Set-up the same fiveruns and sketch and label the four curves on the graphs for them. As you run thesefive cases, think about what controls the final product. Competing reactions are alsovery important such as unwanted side reactions during a synthesis of one compound orisomeric products (two or more different isomers such as cis and trans or positionalplacement on a molecule) are produced.
k1 > k2 k1 = 0; k2 any value
k1 any value; k2 = 0 k1 = k2

43BLT 2000
k1 < k2
What controls the final product?
Are B and C produced in proportional amounts? Why or why not?
Does the law of conservation of matter hold for competing reactions?
How do the competing reactions differ from the consecutive reactions in the productionof the final product material?

44BLT 2000
A B Ck
k k
3
12
← → →
ExplanationThe table below compares consecutive and competing reactions.
Property CONSECUTIVEREACTIONS
COMPETINGREACTIONS
final product single product with nointermediate if enough
time is allowed
mixed product thatdepends on the difference
in the rate constants
rate controlling step slowest step controlsoverall rate
major product isassociated with step with
larger rate constant orfaster rate
effect of temperaturechange
composition of product isunchanged
overall production rate ischanged
composition of productschange proportion sincerate constant change at
different rates
initial reactant totally consumed totally consumed
In any reaction or series of reactions, the law of conservation of matter MUST alwaysbe obeyed!
Extension/EvaluationWhat would happen in consecutive reactions, such as A ö B ö C, if an equilibrium wasestablished between A and B as shown by the case below:
Would this influence the production of C? Explain why or why not.
Now call up the STELLA™ model, “Two_Step_Reaction_with_equil” and run it. Youcan adjust the rate constants, k1, k2, and k3, with the three different sliders. The newfirst-order rate constant k3 is for the establishment of the equilibrium between A and B. Run the model with k3 = 0 to see the original case of no backward reaction. Thenexplore the effect of increasing k3. Adjust the other rate constants to see that youranswer is universal.

45BLT 2000
Keq = k1k3
Sketch and label a graph showing how the extent of equilibrium (Keq >> 1, Keq > 1, Keq =1, Keq < 1, Keq << 1) influences the production of C.
For an industrial preparation reaction, what would the overall effect be on yourproduction schedule?
For an industrial preparation involving competing reactions an unwanted product can beproduced. How can you change the proportion of the products? (Hint: how can youinfluence rate constants?)

46BLT 2000
MODULE 7
Module Title: PUTTING IT ALL TOGETHER AND THEN SOME: AN ASSESSMENTACTIVITY
Estimated time to complete: 2-3 hours
Module objectives: Assesses the concepts and models introduced in modules 1 to 6plus examines a STELLA model simulation of competing equilibria, a situation notcovered in the modules but a natural extension of the material.
Concept(s) learned in this module: examining a system of competing equilibria
Standards addressed in this module (Praxis, K-12):1. National Science Education Standards for content standards (9-12) - content
standard A science as inquiry and content standard B in physical science. 2. Praxis II - chemistry: content knowledge 3. Maryland High School Core Learning Goal - goal 1 - skills and processes and
goal 4 - chemistry 4. National Educational Technology Standards - standard 3 - Technology
productivity tools and standard 5 - Technology research tools
Technology-enhanced instructional strategies utilized in this module:modeling of data using the graphing calculator or Excelmodels and simulations using STELLA
Components Brief description of module activities StudentGrouping*
Materials/ Technology
Evaluation Assesses concepts from modules 1 to 6plus the ability to extend knowledge to newsituation
individual graphingcalculator,STELLA
*Student grouping: Individual, paired, small group, whole class, etc.
Expected module outcomes: assessment of student knowledge from previousmodules
Performance-based assessment of module outcomes: Assessment of knowledge ofchemical kinetics

47BLT 2000
MODULE 7 - PUTTING IT ALL TOGETHER AND THEN SOME: AN ASSESSMENT ACTIVITY
Feel free to run any of the models or use a graphing calculator to help address thequestions.
1. From the graph given below starting with compound A, is the reactionconsecutive or competing? Explain.
What is the composition of the final products?
2. Consider the box below which shows the composition at about midway throughthe reaction.
At this point can you decide if thereaction of A is consecutive orcompeting? Justify your answer.

48BLT 2000
3. In competing reactions, changing the temperature changes the proportion of thetwo products. Why?
4. In a reaction of the type below, does compound A get totally consumed? Explainwhy or why not.
A º B 6 C
Does an equilibrium between A and B ever get established? Explain.

49BLT 2000
5. From the concentration verses time data given below for a reaction notcompletely finished, is the reaction consecutive or competing? Explain.
Time (A) (B) (C)
0 1.00 0.00 0.00
0.50 0.72 0.25 0.03
1.00 0.59 0.31 0.10
1.50 0.51 0.31 0.18
2.00 0.45 0.29 0.26
2.50 0.41 0.27 0.33
3.00 0.37 0.24 0.39
3.50 0.33 0.22 0.45
4.00 0.30 0.20 0.50
4.50 0.27 0.18 0.55
5.00 0.25 0.16 0.59
5.50 0.22 0.15 0.63
6.00 0.20 0.13 0.66
6.50 0.18 0.12 0.70
7.00 0.17 0.11 0.72
7.50 0.15 0.10 0.75
8.00 0.14 0.09 0.77
8.50 0.12 0.08 0.80
9.00 0.11 0.07 0.81
9.50 0.10 0.07 0.83
10.00 0.09 0.06 0.85

50BLT 2000
6. Go to the computer and examine the STELLA model on “Competing_Equilbria”that illustrates the situation below:
How does this model for competing equilibria differ from any of the othercompeting or consecutive reactions examined earlier?
Do the competing equilibria actually achieve a state of equilibrium? If so, explainhow you determined this.
51BLT 2000
ADDITIONAL WEB-BASED RESOURCES
Two natural extension activities to go with this unit produced as part of the BLT project(http://education.umd.edu/blt)
ó Radioactive Decay by Doria Hillsmanó Enzyme Kinetics by George Morse
Maryland Virtual High School CoreModeling Program http://mvhs1.mbhs.edu/
Chemical kinetics simulatorhttp://
TI-Graphing Calculatorhttp://education.ti.com
Data Handling and Analysis on the TI-82/83/83Plus Graphing Calculator: A Resourcefor Science and Mathematics Student by J.L. McClure, S.A. Sinex, and B.A. Gage,PGCC Press (2000), 18 pp. (Download as pdf file athttp://academics.pg.cc.md.us/psc/TI83_booklet.pdf)