exploring the link between orking papers public s pending...
TRANSCRIPT

WBI Working Papers
Exploring the Link BetweenPublic Spending and PovertyReductionLessons from the 90s
Vera Wilhelm and Ignacio Fiestas

Exploring the Link Between Public Spending and Poverty Reduction: Lessons from the 90s
Vera Wilhelm and Ignacio Fiestas
World Bank Institute Washington, D.C.

Copyright © 2005 The International Bank for Reconstruction and Development/The World Bank 1818 H Street, N.W. Washington, D.C. 20433, U.S.A. The World Bank enjoys copyright under protocol 2 of the Universal Copyright Convention. This material may nonetheless be copied for research, educational, or scholarly purposes only in the member countries of The World Bank. Material in this series is subject to revision. The findings, interpretations, and conclusions expressed in this document are entirely those of the author(s) and should not be attributed in any manner to the World Bank, to its affiliated organizations, or the members of its Board of Executive Directors or the countries they represent. Exploring the Link Between Public Spending and Poverty Reduction: Lessons from the 90s Vera Wilhelm and Ignacio Fiestas 2005. 42 pages. Stock No. 37252
Contents
Acknowledgments iv
Executive Summary v
Introduction 1
Public Spending for Growth and Poverty Reduction 2
What is Guiding Public Spending Allocations? 4
What Determines the Impact of Public Spending on Growth and Poverty Reduction? 5
GOVERNMENT SPENDING, GROWTH AND POVERTY REDUCTION 5
EFFICIENCY AND EFFECTIVENESS OF SPENDING 5
Public Expenditures in the OPPG Country Case Studies 9
WHAT HAPPENED TO PUBLIC SPENDING IN THE 1990S? 9
DID THE POOR BENEFIT FROM PUBLIC SPENDING IN THE 1990S? 13
DID OUTCOMES IMPROVE IN THE NINE COUNTRIES AND DID SPENDING MOVE IN LINE WITH OUTCOMES? 16
WHAT EXPLAINS THE VARIABLE IMPACT OF SPENDING ON OUTCOMES? 19
Is There a Link Between Spending, Poverty Reduction and Growth? 23
Summary Findings 30
IMPLICATIONS FOR DONORS 31
Annex 1: Data Limitations 33
Annex 2: Analyzing the Impact of Public Spending on Growth and Poverty Reduction: Methodologies
and Limitations 34
Annex 3: Statistical Appendix 36
Bibliography 38
iii

2 Wilhelm and Fiestas
Acknowledgments*
This paper was prepared by Vera Wilhelm (Senior Economist, PRMPR) and Ignacio Fiestas (JPA, PRMPR). It is part of the “Operationalizing Pro-Poor Growth (OPPG) program” initiated in 2003 by the World Bank, DFID, BMZ (KFW/GTZ) and AFD to better understand the options facing policy makers seeking to better link the poor to the growth process. We would like to thank Lionel Demery for important contributions to this paper in the area of benefit incidence analysis and country specific analysis, in particular for Uganda, as well as useful comments and suggestions. We would also like to thank Louise Cord for her support and guidance. Helpful comments were also provided by Daniel Alker (BMZ), Marc Raffinot (AFD) and Sudhir Shetty (Sec-tor Manager, PRMPR). Jae Shin Yang (Program Assistant) helped to improve the format and appear-ance of the paper.
* Views expressed in this paper are those of the authors only.
iv

Executive Summary The allocation of the budget is a key instrument for governments to promote economic development and reduce absolute poverty. Its role has become even more prominent in recent years as donor sup-port to HIPC debt relief and the implementation of national poverty reduction strategies has been made conditional on the increase of spending labelled as “pro-poor”. Public spending has the potential to affect growth and poverty reduction in two ways: it can raise the overall growth performance of the economy, and it can increase the chance of the poor to contribute to the growth process (mainly by strengthening human capabilities and reducing transaction costs). The critical challenge is how to strike the right balance between spending that focuses primarily on growth and spending that aims at reducing poverty. But it is difficult to quantify the impact of public spending as its effects are com-plex and may vary depending on the composition of growth, policies and country conditions. This paper, explores how the composition of public spending and the manner in which the public re-sources are spent may have affected the ability of poor people to connect to growth in the 1990s. Fol-lowing a brief review of the principles guiding public spending and some factors determining the im-pact of public spending on the poor, it examines the evolution of the composition of expenditures in nine countries, the extent to which social sector expenditures were captured by the poor, and factors that were likely to affect the efficiency and effectiveness of expenditures in achieving improved sector outcomes. The paper also provides an overview of different analytical approaches simulating the im-pact of public spending on growth and poverty reduction. It finds that in a period of declining overall spending in per capita terms, spending increased most sig-nificantly in non-productive sectors (except for education). Moreover, spending in sectors that are generally seen as pro-poor tended to benefit the richer quintiles of the population (except for primary education), although there are large variations across countries. As the effect of spending is found to vary from country to country and to depend largely on the right composition and mix of spending, in-stitutional factors and capacity constraints, the paper concludes by questioning the usefulness of track-ing “poverty reducing expenditures”. It recommends the deepening and consolidation of analytical methods assessing trade-offs between expenditure allocations across sectors, and the sharpening of institutional analysis tools allowing a better understanding of how initial conditions, institutional con-straints and lags play out in a country and affect the impact of public spending. Finally, more policy oriented PERs that are informed by poverty assessments and PSIA as well as spatial poverty analysis could also help to build government capacity for analysis in this area.
v

Introduction Allocating the budget is perhaps the central arena for operationalizing pro-poor growth. Yet it has proved one of the most elusive challenges. Back in 1940, the political scientist Valdimer O. Key pre-sented the basic budgeting problem: ‘On what basis shall it be decided to allocate x dollars to activity A instead of activity B’ (Key, 1940). In the context of the modern challenge of promoting pro-poor growth, this problem is as real and contemporary as ever. What can be said about the growth and pov-erty reduction effects of a dollar spent in one sector compared with another? Since Key’s challenge, the literature has progressed along two broad complementary lines of enquiry. The first is the response of the economics profession, which has sought to apply the principles of economics to provide a ra-tionale for public spending and is needed to inform public policy about how the level and composition of budget allocations can affect growth and poverty. The second has viewed the budget allocation process as a political issue, and understanding the institutional and political context in which budget decisions are made and implemented is seen as critical for achieving better outcomes.
This paper explores how the composition of public spending and the manner in which the public re-sources are spent may have affected the ability of poor people to connect to growth. Following a brief review of the principles guiding public spending and some factors determining the impact of public spending on the poor, it examines the evolution of the composition of expenditures in nine countries1 in the 1990s, the extent to which social sector expenditures were captured by the poor, and factors that were likely to affect the efficiency and effectiveness of expenditures in achieving improved sector out-comes. The paper also provides an overview of different approaches simulating the impact of public spending on growth and poverty reduction in a few countries including some of our case study coun-tries (Ghana, India, Uganda, Vietnam, and Zambia).
1 The nine countries are: Bangladesh, Bolivia, Brazil, El Salvador, India, Romania, Tunisia, Uganda and Zambia.
1

2 Wilhelm and Fiestas
Public spending for growth and poverty reduction Public spending can affect growth and poverty reduction in two ways: it can raise the overall growth performance of the economy, and it can increase the chance of the poor to contribute to the growth process (mainly by strengthening human capabilities and reducing transaction costs). Both types of expenditures may reduce poverty, but in the case of more growth oriented expenditures, the poverty impact is usually more indirect. For both types of expenditures, the impact on poverty levels is likely to be experienced with a time lag. The critical challenge is how to strike the right balance between spending that focuses primarily on growth and spending that aims at reducing poverty. While there is no clear answer to this question, it may be useful to review recent thinking and experience with public spending.
The 1990s brought a new paradigm for fighting poverty (World Bank, 1990) with emphasis on strengthening capabilities of the poor and an increased focus on the non-income dimensions of pov-erty. Public intervention was supposed to follow a twofold strategy, promoting labor-intensive growth and investment in human capital via primary health care, primary education and targeted social spend-ing to reduce poverty, thus, avoiding a trade off between growth and poverty reduction. The experi-ence of the East Asian Miracle economies with their high investment in human capital (first, universal primary education, followed by the increasing availability of secondary education and skill building) resonated well with this view (World Bank, 1993). Later in the decade, public investment in infra-structure was emphasized as a means for poverty reduction by facilitating access to markets and reduc-ing the high transactions costs of poor households (World Bank, 1994).
Over the last decade, social sector expenditures (defined as expenditures for social security, health and education) increased relative to other productive spending (i.e. infrastructure, agriculture) as docu-mented by the nine case studies discussed below and other regional studies2. More recently, policy initiatives such as HIPC and PRSPs have encouraged countries to identify and track expenditures that are pro-poor, often leading to a focus on social sector spending (Williamson and Canagarajah, 2003).
Finally, the Millennium Development Goals3 adopted in 2000 also encouraged social sector spending by broadening poverty objectives to include non-income dimensions. In their aspirations to meet MDG related goals, countries may focus too much on achieving individual targets rather than pursuing inte-grated cross-sectoral policies - taking into account the impact of interventions on other targets. This calls for a better understanding of the multi-sectoral nature of interventions and development goals (Leipziger, Fay, Wodon and Yepes, 2003); and more evidenced based analysis on what steps need to be taken to achieve these goals.
Concerns are also being raised that the observed shift to social sector expenditures was implemented in an ad hoc manner without a better understanding of how different expenditure options help to ad-dress country specific bottlenecks to growth; and without a rigorous economic analysis of their pro-jected impact on poverty and growth (Paternostro, Rajaram and Tiongson, 2004). There are also con- 2 See section 5 below. This finding is also confirmed for 17 countries in Latin America where annual social spending per capita increased on average 50 percent between 1990-91 and 1998-1999, although the exact magni-tude of the increase in public social pending differed among the 17 countries. (ECLAC, 2001). 3 The eight MDGs are: eradicate extreme poverty and hunger, achieve universal primary education, promote gender equality and empower women, reduce child mortality, improve maternal health, combat HIV/AIDS, ma-laria and other diseases, ensure environmental sustainability, and develop a global partnership for development (http://www.developmentgoals.org).
Exploring the Link Between Public Spending and Poverty Reduction 3
cerns that necessary public investment in infrastructure has been constrained by fiscal stabilization programs to the detriment of economic growth (Easterly and Serven, 2003; IMF, 2004). Finally, there is a growing recognition in many countries that the effectiveness of public expenditures directed to the poor was undermined by weak targeting, elite capture, and an overall poor quality of the public service delivery mechanisms (World Bank, 2004a).
The main questions emerging from the above discussion are how public spending affects sectoral does and broader development objectives, and what the underlying factors that influence that impact are. As the following section will illustrate, answering these questions within and across countries proves difficult empirically because of large variation in initial country conditions, the complex chain of link-ages, the time lags involved and the interdependence among development outcomes (Paternostro et al., 2004).

4 Wilhelm and Fiestas
What is guiding public spending allocations? The broad principles for guiding public expenditure allocations are based on the need to address mar-ket failure (public goods, externalities) to promote growth, and improve distribution and reduce pov-erty through public interventions.4 The sources of market failure commonly identified in the literature are: the absence of competitive markets, the existence of positive or negative externalities in consump-tion and production, the undersupply of public goods by the market, imperfect information on produc-tion and consumption opportunities and coordination failures.5 However, the notion of what consti-tutes a public good may change over time (i.e., the provision of universal schooling by the state was established only in the 20th century, while prior to that the sector was dominated by mostly religious private providers), and what is considered a market failure may vary with country conditions (i.e., in-vestment in utilities in poor countries).
Also, few expenditures fall nicely under one category (market failure) or another (improved distribu-tion) and many have both an effect on growth and poverty reduction, particularly when the medium term impact of growth on poverty reduction is considered (i.e. primary education is a public good with significant positive externalities, and it also can redress asset inequality, when provided to children from poor households).6 Where the poor are particularly hard hit by market failure (e.g., access to credit), “win-win” possibilities can arise, and government intervention may lead to both a more effi-cient and a more equitable allocation of resources.
Many studies have attempted to analyze the impact of government spending (education, health, infra-structure, agriculture, or a combination thereof) on economic growth and poverty reduction7. Their results vary significantly in terms of the detected effect and efficiency of different expenditure catego-ries in various countries, as the impact of public spending is limited by various factors and constraints. However, a clear understanding of these factors is needed to determine if, and how to intervene.
4 Also referred to as the “welfarist” approach, compared to the “social justice” approach that justifies public in-tervention based on the right to access some basic need or capability when market forces fail to ensure such ac-cess. For a more detailed discussion of the two approaches see Fan and Coady (2004). 5 For detailed references see Fan and Coady (2004) and literature review by Paternostro et al. (2004); and Foz-zard (2001). 6 There is significant empirical evidence showing that improved education is correlated with both faster growth and lower income inequality Datt and Ravallion (2002); Lundberg and Squire (2003).7 For the analysis of the composition of government spending on economic growth see Devarajan, Swaroop, and Zou 1997); an overview of recent studies trying to assess both the impact of spending on growth and poverty reduction see Table 2 in section V.

Exploring the Link Between Public Spending and Poverty Reduction 5
What determines the impact of public spending on growth and poverty reduction?
Government spending, growth and poverty reduction As illustrated in diagram 1 (right side), government spending is driven by the objective to positively affect growth and/or poverty reduction as a result of improved provision of social services, public goods spending in agriculture, and infrastructure access. Whether this objective is achieved depends on country specific conditions and other factors which will be discussed below. One important factor affecting the relationship between spending and outcomes is the role of public non-spending interven-tions (regulatory framework, not shown in diagram as covered by institutions) and private sector inter-ventions (i.e. the role of public private partnership, private provision of services also not included in diagram), which can affect the level of service provision to the poor.
The relationship between growth and spending runs in both directions, particularly with growth and sectoral outcomes, in that higher growth leads to better sectoral outcomes (improved schools, health indicators, road access, etc.) and that improved sectoral outcomes also lead to better growth (in par-ticular investment in education and infrastructure is associated with higher growth rates). Similarly, improved access to sectoral services and goods leads to greater poverty reduction, but higher poverty reduction may also increase the demand for improved sectoral outcomes. As indicated on the left side of diagram 1, resource allocation may be based on various motives (economic, social, political); it is generally bound by a budget constraint and the objective to maximize outcomes through an appropri-ate level and effective composition of spending, while taking into account the feasibility of interven-tions due to institutional and other constraints. This leads to a closer look at the factors determining the efficiency and effectiveness of spending.
Efficiency and effectiveness of spending Level of spending. Little agreement exists in the literature on the appropriate level of public spending and its impact on sector outcomes, growth and poverty reduction. Empirical studies on the long run relationship between public spending and economic development confirm Wagner’s law of public spending (as a percentage of GNP) increasing with economic growth, but are less consistent in sup-porting the hypothesis that rising public expenditures cause national income to rise and have often yielded conflicting views (Aschauer, 1989; Barro, 1990; Dritsakis and Adamopoulos, 2004).8 Other studies emphasize that large governments cause heavy tax burden9 and crowd out private sector in-vestment, and show that a reduction in the size of government, especially in a situation of existing
8 The relationship between size of government and rates of growth, Barro (1990) found that increased resources devoted to non-productive public services is associated with lower per capita growth. Tanzi and Zee (1997) found no relationship between government size and economic growth. Aschauer’s empirical results indicate that public capital stock is substantially more important in determining the productivity than is the flow of public spending and that the basic stock of infrastructure has the greatest impact on productivity. A recent study by Dritsakis and Adamopoulos (2004) discusses the long-term relationship for the Greek economy confirming Wagner’s law but showing a less clear relationship between spending and long-run growth. 9 Large public sectors can create trade-offs, as government spending needs to be financed either though borrow-ing, or equitable taxation and cost recovery. The outcome will determine the overall impact, as distortionary and inefficient taxation systems are a burden on pro-poor growth. Also, high taxes discourage economic activity and are seen as largely ineffective in redistributing income and wealth (De Ferranti, Perry, Ferreira and Walton 2004). As we lack sufficient information on the financing of public spending in the case study countries dis-cussed below, we will not pursue this point further.

6 Wilhelm and Fiestas
large debt/deficits is associated with increasing economic growth (Perotti, 1999; Vedder and Galla-way, 1998). A recent study trying to measure the efficiency of public spending in health and education using data from 140 countries concludes that countries with higher expenditure levels and large wage bills (as percent of total budget) show lower efficiency scores (Herrera and Pang, 2004). An earlier study on spending efficiency by Afonso, Schuknecht and Tanzi (2003), exploring public sector per-formance in 23 OECD countries, concludes that countries with small public sectors realized the high-est overall performance for their spending.
Specific country conditions, such as urbanization, demographics, and regional poverty patterns can also play an important role in the efficiency of public expenditures. Herrera and Pang (2004) find that countries with high levels of urbanization show higher efficiency scores for public spending, while high HIV/AIDS prevalence and inequality tend to go in hand with less efficient spending.
Diagram 1
Complementarity of spending across sectors10. Expenditure policy interventions can be complemen-tary in two ways as they can either enhance or diminish the desired outcome. First, the benefits of higher expenditure on a particular sector may not be fully realized unless expenditure on other sectors is increased. For example, Leipziger et al. (2003) find that better access to basic infrastructure services (water and sanitation) has an important role in improving child health outcomes, a finding that we see confirmed in most of the country case studies. The Uganda PER 2003, for instance, found access to safe water to be a proximate determinant for infant mortality, with water and sanitation being one of three sectors (including health and education) that help to improve the performance of mortality inci-dence. Similarly, the construction of rural roads is critical for access to education (Van de Walle, 2000) and education investment may enhance the marginal return of irrigation projects (Van de Walle, 1996). A related point is the necessity of sufficient human capital to realize the benefits of infrastruc-ture investments. For example, the Asian Development Bank (2002) finds that the ability of the poor to make significant economic use of roads depends on their asset base, skills, etc. These findings have
10 Section draws on Paternostro et al. (2004).

Exploring the Link Between Public Spending and Poverty Reduction 7
important implications for the combination and sequencing of public spending across sectors and at the subsectoral level.
Spending priorities within sectors11. Better targeting of services is essential for reaching the poor. Al-though governments devote about a third of their budgets to health and education, relatively little is spent on those services that reach the poor12. Public spending on health and education is typically en-joyed by the non-poor (World Bank, 2004a). In Nepal, 46 percent of education spending accrues to the richest fifth, and only 11 percent reaches the poorest. In India, the richest fifth receives three times the curative health care subsidy of the poorest fifth (Peters et al., 2002). In Morocco, only 11 percent of the poorest fifth have access to safe water while everybody in the richest quintile does (World Bank, 2004a). Although public subsidies to higher education have been falling (measured by public spending per student), resource allocation is still biased against primary and lower secondary education in many countries (Thomas et al., 2000).
This is surprising, as a highly skewed distribution of education tends to be associated with reduced per capita income growth and higher inequality,13 even after controlling for labor and physical capital.14 When a large part of the population is not educated, low productivity of the labor force discourages investment in physical capital, and economic growth suffers (Lopez, Thomas and Wang, 1998).
Institutional quality, understood as the existence of rules and their enforcement, plays an important role in shaping the growth prospects for the poor. Knack (2001) shows that institutional quality is as-sociated with rapid growth of the poorest quintile and with reduced inequality. Dollar and Kraay (2002) find that countries with better governance tend to have faster growth in the poorest quintile than poorly governed countries, a finding that also emerges for the nine country case studies referred to below (Azfar, 2004). Analyzing regions in Indonesia, Sadler and Akhmadi (2004) indicate that re-gions with better institutions experience higher rates of poverty reduction, results that are also con-firmed for regions in India (Besley et al, 2004).
A country’s institutional setting (i.e., rules of the game) also determines the feasibility of policy inter-ventions, due to administrative, political and social factors which may favor one choice of instruments over another (e.g., opposition against land transfers but acceptance of subsidy schemes for landless poor. Finally, high quality public sector institutions (e.g., a qualified and results oriented civil service) go along with improved public service delivery, due to enhanced capacity, better incentives for public service providers and more accountability.
In some countries, transferring responsibilities for service delivery to lower tiers of the administration or communities have had a positive impact on public service delivery, but this is not always the case. In El Salvador’s Community-Managed Schools Program (Educo), parent’s associations have the right to hire and fire teachers. That, together with monthly visits to the school by the parents’ associations, has reduced teacher and student absenteeism, improving student performance. In contrast, in Roma-
11 Section draws on findings in World Bank, 2004a. 12 Quote from World Bank, 2004a which also applies to the nine case studies discussed below. 13 Menezes-Filho (2004) finds that unequal access to education explains inequality in Brazil in terms of wage differentials and estimates that 30-50 percent of wage differentials could be eliminated for education was evenly distributed. 14 This study is based on a panel data set of 12 countries with data from 1970 to 1994. These results are based on a model of fixed-effects which allows for education distribution effects using standard deviation of the log of education. All coefficients are significant at the 5% level.

8 Wilhelm and Fiestas
nia, decentralizing social assistance has weakened the ability and incentives of local councils to deliver cash transfers to the poor.15
Poor quality of services, on the other hand, disproportionately hurts the poor and limits their future earning abilities due to lack of skills or health. In addition to poor quality, weak demand and use - due to limited knowledge, poor access or cultural factors and social attitudes - also affect the impact of public spending and often explain the poor link between public spending and outcomes (World Bank, 2004a; Thomas et al., 2000). These considerations stress the importance of a good understanding of the nature and capacity of existing institutions, which are highly country and sector specific and, thus, require an equally specific public policy response.
Lags16. Finally, the impact of public expenditures on income growth is subject to lags as outcomes may be achieved in a direct or indirect way. While well targeted transfer schemes usually have a direct and immediate impact on the poor by raising their incomes, targeted investment in education has a lagged effect via improved educational attainment, thus increasing the chances of the poor to partici-pate in the growth process in the future. Targeted infrastructure investments can have both, a direct and immediate effect on income as well as an indirect lagged effect via human capital formation (i.e. clean water effect on health outcomes). Investments in agricultural research can lead to increased pro-ductivity which directly affects the income of poor farmers, or can have an indirect effect on the poor through cheaper food or higher wages as a result of increased demand for farm and non-farm employ-ment in rural areas (Fan et al., 1999).
The following section will focus on public spending in nine of the countries covered by the pro-poor growth case studies, covering areas that have been associated with significant effects on growth and poverty reduction (education, health, infrastructure, agriculture).17
15 World Bank, 2002, Romania: Local Service Delivery Study. 16 This section draws on Paternostro et al. (2004). 17 For references see table 2 and 3 and Mosely P., J. Hudson and A. Verschoor (2004).

Exploring the Link Between Public Spending and Poverty Reduction 9
Public expenditures in the OPPG country case studies Scope of the review. Keeping in mind the above mentioned constraints and the complex relationship of public expenditures and growth, the following section limits itself to a review of nine country case studies for which data is available, including a more in depth assessment of public expenditure issues in four countries (Bangladesh, El Salvador, Uganda and Vietnam). Based on observations from these countries, this section will try to establish whether poor households benefited from public spending during the 1990s and to what extent public expenditures were able to help poor households participate in and contribute to growth. To answer this question, the following four sub-questions are explored: (1) Did the level and composition of spending change? (2) Did the poor benefit from public spending in the 1990s, particularly in education and health? (3) Did sectoral outcomes improve in the 1990s, particularly in sectors which benefited from expanded resource flow, and (4) If not, what were some of the constraints?
This section draws evidence from the 14 OPPG country case studies. Due to data limitations, spending trends have only been analyzed for 9 countries. Benefit incidence data on health and education is only available for six countries and data on access to water for ten countries. Data on outcomes is available for most countries. The analysis of this data combines different methodologies. The first subsection presents fiscal trends in nine countries based on the Global Finance Statistics database of the IMF. The following subsection analyses the impact of public expenditures on the poor through benefit incidence analysis based on data obtained from Demery (2004a). Subsection three illustrates the relationship between government spending on education and health and selected outcome indicators through a small-sample regression analysis. It also uses OPPG country experiences combined with outcome data to illustrate how the impact of public expenditures varies depending on the country’s initial conditions.
What happened to public spending in the 1990s? Public expenditures by central governments decreased slightly over the 1990s. This happened against a background of increasing macro-economic and fiscal stability.18 Public expenditures in the nine countries where we have data for both the late 80s (1985-89) and late 90s (1995-99), slightly de-creased from a median of 16.5 percent to 15.8 percent of GDP, with central government expenditures falling significantly in three countries (Brazil, Tunisia, Romania). 19
18 Inflation in the nine countries decreased from a median of 38.5 percent at the end of the 1980s to 8.8 percent at the end of the 1990s. In the same time frame, the median fiscal deficit also declined from 4.9 percent to 3.4 per-cent of GDP. 19 It is important to note that the analysis is based on the analysis of central government data only. For more de-tail on data limitations, see Annex 1. Tables with data are found in Annex 3.
10 Wilhelm and Fiestas
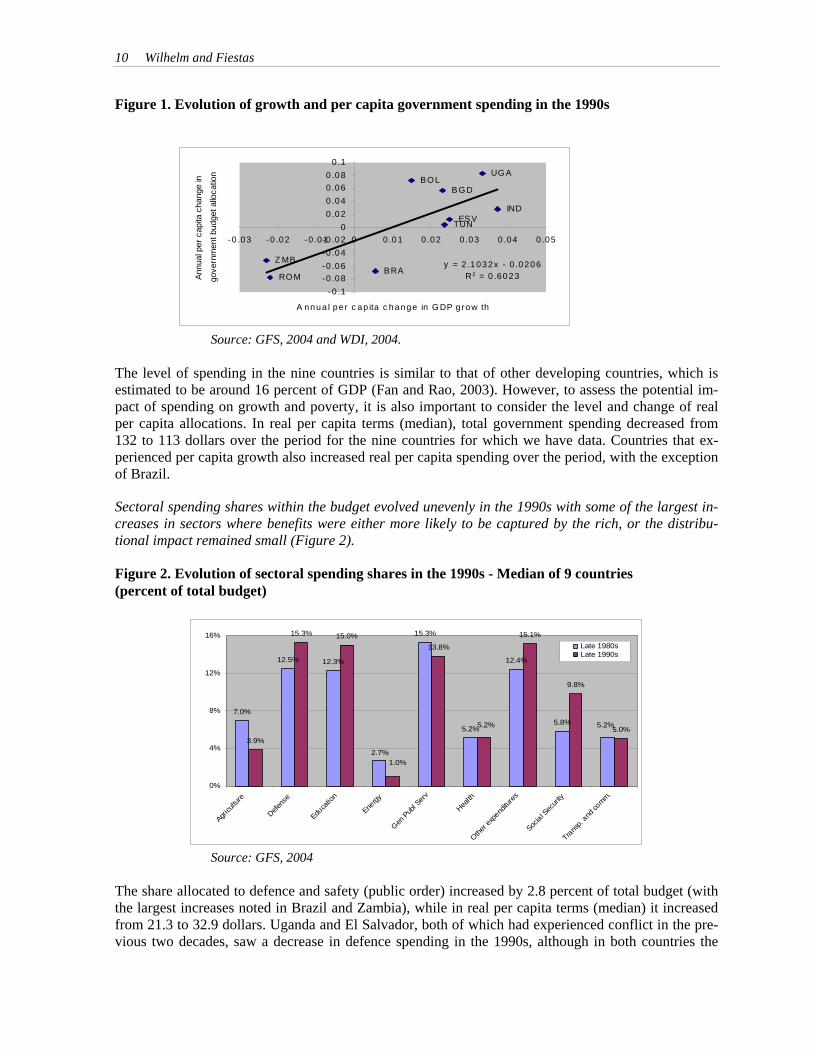
Figure 1. Evolution of growth and per capita government spending in the 1990s
B GDBOL
BRA
ES VIND
RO M
TUN
UG A
Z MB y = 2 .1032x - 0 .0206R2 = 0 .6023
-0 .1-0 .08-0 .06-0 .04-0 .02
00 .020 .040 .060 .08
0 .1
-0 .03 -0 .02 -0 .01 0 0 .01 0 .02 0 .03 0 .04 0 .05
A nnua l pe r c ap ita c hange in G DP g row th
Annu
al p
er c
apita
cha
nge
in
gove
rnm
ent b
udge
t allo
catio
n
Source: GFS, 2004 and WDI, 2004. The level of spending in the nine countries is similar to that of other developing countries, which is estimated to be around 16 percent of GDP (Fan and Rao, 2003). However, to assess the potential im-pact of spending on growth and poverty, it is also important to consider the level and change of real per capita allocations. In real per capita terms (median), total government spending decreased from 132 to 113 dollars over the period for the nine countries for which we have data. Countries that ex-perienced per capita growth also increased real per capita spending over the period, with the exception of Brazil.
Sectoral spending shares within the budget evolved unevenly in the 1990s with some of the largest in-creases in sectors where benefits were either more likely to be captured by the rich, or the distribu-tional impact remained small (Figure 2).
Figure 2. Evolution of sectoral spending shares in the 1990s - Median of 9 countries (percent of total budget)
7.0%
12.5% 12.3%
15.3%
5.2%
12.4%
5.8%
3.9%
15.3% 15.0%13.8%
15.1%
9.8%
5.0%5.2%
2.7%
5.2%
1.0%
0%
4%
8%
12%
16%
Agricu
lture
Defens
e
Educa
tion
Energy
Gen P
ubl S
erv
Health
Other e
xpend
iture
s
Social S
ecuri
ty
Trans
p. and
comm.
Late 1980sLate 1990s
Source: GFS, 2004
The share allocated to defence and safety (public order) increased by 2.8 percent of total budget (with the largest increases noted in Brazil and Zambia), while in real per capita terms (median) it increased from 21.3 to 32.9 dollars. Uganda and El Salvador, both of which had experienced conflict in the pre-vious two decades, saw a decrease in defence spending in the 1990s, although in both countries the

Exploring the Link Between Public Spending and Poverty Reduction 11
share remained high, at 19 and 25 percent respectively. Whether spending on defence and public order is beneficial for growth and poverty reduction largely depends on the country context (in Jamaica, for example, an estimated 4 percent of GDP are lost annually due to crime and violence). When model-ling the effect of different types of spending on GDP growth, Fan and Rao (2003) find a positive rela-tionship for defence and GDP in Asia but no growth promoting effect for Africa or Latin America. For Sub-Saharan Africa, Lofgren and Robinson (2004) find that defence spending negatively affects growth and poverty reduction.
The median share of education expenditures rose from 12.3 to 15 percent with the largest increases in the shares for Romania, Uganda, Tunisia and Zambia. However, in per capita terms, (median) expen-diture on education decreased slightly for the nine countries from 15.4 to 14.5 dollars. For the four countries with subsectoral data on education (Bangladesh, Uganda, El Salvador, Vietnam), primary education accounted for the majority of education expenditures, given the importance attributed to universal primary education. Reflecting a major policy push towards primary education in Uganda, primary education expenditures rose from 36 percent of the total education expenditures in 1990 to 69 percent in 2000. In El Salvador, primary education expenditures rose from 59 percent in 1996 to 67 percent of education expenditures in 2000.
Health expenditures as a share of total expenditures remained stable at 5.2 percent of total budget, ris-ing mainly in Uganda and Zambia, although in real per capita terms (median) they decreased from 9.1 to 7.2 dollars. From the countries with available data on subsectoral health expenditures, primary health expenditures increased in Uganda as part of the Poverty Eradication Plan, and in Bangladesh, where special emphasis was placed on rural primary care and family planning. Tertiary care expendi-tures increased in El Salvador, while there was little evidence of a major budget shift in the composi-tion of the health sector budget in Vietnam.
Agriculture (particularly in Zambia) declined from 7 percent to 3.8 percent over the period (6.9 to 3.8 dollars in real per capita terms) while infrastructure spending (defined as transport and communica-tion) as a share of total budget remained stable (and declined from 7.1 to 6 dollars in real per capita terms). The focus of agriculture spending appears to vary across four countries for which we have subsectoral spending data. In Vietnam it was increasingly in irrigation, in Uganda it was in extension services, and in Bangladesh, following significant investments in irrigation and new crop develop-ment, expenditures increased in the late 1990s in fisheries, livestock and forestry. The share of infra-structure expenditures remained stable, although it did increase significantly in Uganda and Bangla-desh. Large declines in expenditure shares were experienced in general services (Bangladesh, Zam-bia), and energy and mining (Romania).
Social security expenditures as a share of total expenditures (median) went up by 4 percent, from 5.8 to 9.8 percent (5.1 to 17.9 in real per capita terms), but were at least in part directed to the richer quintiles of the population. They rose significantly in Bangladesh reaching 23.5 percent of total budget, Bolivia (reaching 17.5 percent), and Brazil (reaching 16 percent). Given the small size of the formal sector, a good part of the social insurance spending is likely to benefit the elite and retired civil service. In Brazil, for example, retirement pensions, which are very regressive (Table 1), account for nearly half of the expenses grouped under the general heading of social expenditures.
12 Wilhelm and Fiestas
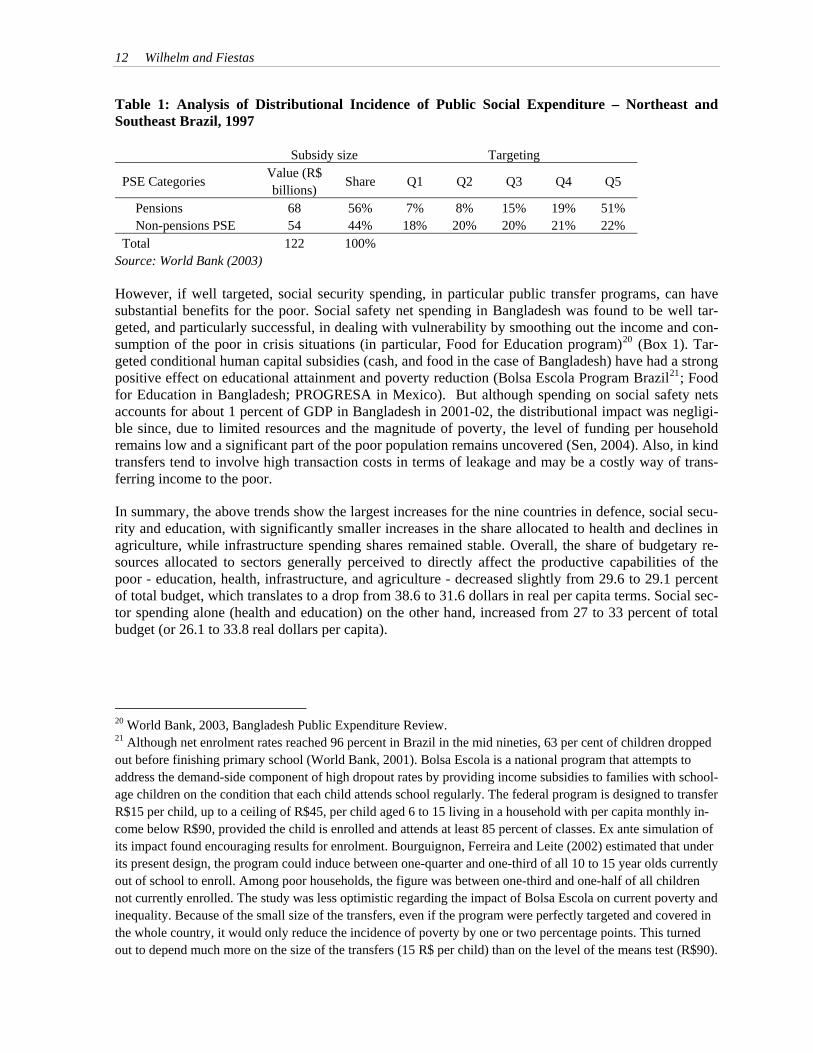
Table 1: Analysis of Distributional Incidence of Public Social Expenditure – Northeast and Southeast Brazil, 1997
Subsidy size Targeting
PSE Categories Value (R$ billions) Share Q1 Q2 Q3 Q4 Q5
Pensions 68 56% 7% 8% 15% 19% 51% Non-pensions PSE 54 44% 18% 20% 20% 21% 22% Total 122 100%
Source: World Bank (2003) However, if well targeted, social security spending, in particular public transfer programs, can have substantial benefits for the poor. Social safety net spending in Bangladesh was found to be well tar-geted, and particularly successful, in dealing with vulnerability by smoothing out the income and con-sumption of the poor in crisis situations (in particular, Food for Education program)20 (Box 1). Tar-geted conditional human capital subsidies (cash, and food in the case of Bangladesh) have had a strong positive effect on educational attainment and poverty reduction (Bolsa Escola Program Brazil21; Food for Education in Bangladesh; PROGRESA in Mexico). But although spending on social safety nets accounts for about 1 percent of GDP in Bangladesh in 2001-02, the distributional impact was negligi-ble since, due to limited resources and the magnitude of poverty, the level of funding per household remains low and a significant part of the poor population remains uncovered (Sen, 2004). Also, in kind transfers tend to involve high transaction costs in terms of leakage and may be a costly way of trans-ferring income to the poor.
In summary, the above trends show the largest increases for the nine countries in defence, social secu-rity and education, with significantly smaller increases in the share allocated to health and declines in agriculture, while infrastructure spending shares remained stable. Overall, the share of budgetary re-sources allocated to sectors generally perceived to directly affect the productive capabilities of the poor - education, health, infrastructure, and agriculture - decreased slightly from 29.6 to 29.1 percent of total budget, which translates to a drop from 38.6 to 31.6 dollars in real per capita terms. Social sec-tor spending alone (health and education) on the other hand, increased from 27 to 33 percent of total budget (or 26.1 to 33.8 real dollars per capita).
20 World Bank, 2003, Bangladesh Public Expenditure Review. 21 Although net enrolment rates reached 96 percent in Brazil in the mid nineties, 63 per cent of children dropped out before finishing primary school (World Bank, 2001). Bolsa Escola is a national program that attempts to address the demand-side component of high dropout rates by providing income subsidies to families with school-age children on the condition that each child attends school regularly. The federal program is designed to transfer R$15 per child, up to a ceiling of R$45, per child aged 6 to 15 living in a household with per capita monthly in-come below R$90, provided the child is enrolled and attends at least 85 percent of classes. Ex ante simulation of its impact found encouraging results for enrolment. Bourguignon, Ferreira and Leite (2002) estimated that under its present design, the program could induce between one-quarter and one-third of all 10 to 15 year olds currently out of school to enroll. Among poor households, the figure was between one-third and one-half of all children not currently enrolled. The study was less optimistic regarding the impact of Bolsa Escola on current poverty and inequality. Because of the small size of the transfers, even if the program were perfectly targeted and covered in the whole country, it would only reduce the incidence of poverty by one or two percentage points. This turned out to depend much more on the size of the transfers (15 R$ per child) than on the level of the means test (R$90).

Exploring the Link Between Public Spending and Poverty Reduction 13
Box 1: Food for Education in Bangladesh
The food-for-education (FFE) program in Bangladesh was introduced in July 1993 with the objective to increase school enrolment of poor children in primary schools. Households receive 15kg of food grains (mainly wheat) per month per child if they enrol their children in primary school. The maximum a household can receive is 20 kg of food grains. The average transfer received by beneficiaries was $2.4 per month, equivalent to 4 percent of the poor’s total monthly consumption. The total program budget was $77 million in 2000 giving on average $36 per beneficiary student per annum. Overall the targeting of the program is moderately effective in that 60 percent of the transfers go to “poor” households, i.e. those falling into the bottom half of the rural income distribution. However, most (if not all) of this performance is due to community targeting with geographic targeting being relatively neutral. Education impacts seem to be high, especially given the relatively low transfer level. Ahmed and del Ninno (2002) found that attendance in FFE schools increased by 35 percent per school over the two-year period when the FFE program was first introduced. Enrolment of girls jumped by 44 percent compared to an increase in non-FFE schools of 2.5 percent. These impressive results declined somewhat in subsequent years, partly due to ca-pacity constraints in participating schools. Still, FFE schools continued to have higher enrolment rates, signifi-cantly higher attendance and lower drop out rates 22 (Ahmed and Billah, 1994; Ravallion and Wodon, 2000). However, as most targeted food programs, FEE suffers from relatively high leakages and high costs associated with distributing food (estimated at $1.6 for every $1 delivered to beneficiaries). An analysis by Ahmed et al. (2004) indicates that total leakage from under-coverage and short rationing in FFE programs ranges between 16.3 and 20.3 percent of the total food grain allotment. For these reasons the FEE has been increasingly con-verted into cash stipend schemes over recent years. Did the poor benefit from public spending in the 1990s? In terms of expenditure incidence, there is significant evidence that the poor have benefited from ex-penditures in primary health and primary education, while it appears that they benefited significantly less from spending on secondary education and infrastructure. With respect to education, the available data suggests that primary education expenditure benefited the poor, whereas spending on secondary education did not. The benefit incidence analysis for education spending in the six countries where we have data, indicates that while poor households (defined here as those in the bottom quintile) were benefiting disproportionately from primary education expenditures (Figure 3), secondary education mostly benefited the rich (Figure 4). This is due, in part, to the fact that the poorest households typi-cally have disproportionate numbers of children of primary school age. An exception is Burkina Faso where 28 percent of total subsidies for primary education went to the richest quintile, while the poorest quintile received just 14 percent of total subsidies.
Poorer households did not benefit greatly from secondary school spending. For the countries with data, only in Ghana did the poorest households benefit to any significant extent from public spending on secondary schooling. In the other three countries (Uganda, Indonesia and Vietnam), the share of the secondary budget accessed by the poorest 20 percent of the population is low (ranging between 6 and 13 percent). In Burkina Faso, 41 percent of subsidies benefited the richest quintile while the poorest quintile received only 9 percent of total subsidies. In Uganda, the share of secondary school spending going to the poorest quintile actually declined by almost half during the 1990s, while in In- 22 The net primary enrolment rate in villages having FFE programs is 8.5 percent higher than in corresponding villages without these programs (World Bank, 2004a).

14 Wilhelm and Fiestas
donesia and Vietnam the targeting of secondary school spending improved, through from a very low base (Figure 4).
Figure 3. Benefit incidence of public spending on education by poorest and richest quintiles dur-ing late 1990s in selected countries (percent of total spending in subsector)
22
6
24
12
20 19
25
13
24
6
26
9
14
39
14
25
17
23
13
26
12
37
12
29
0
10
20
30
40
prim
ary
seco
ndar
y
prim
ary
seco
ndar
y
prim
ary
seco
ndar
y
prim
ary
seco
ndar
y
prim
ary
seco
ndar
y
prim
ary
seco
ndar
y
Bangladesh Bolivia Ghana Indonesia Uganda Vietnam
poorest richest
Source: Demery, 2004a
Figure 4. Benefit incidence of secondary education spending in early and late 1990s by poorest and richest quintiles (percent of total spending in subsector)
1 1
6
1 71 9
5
1 3
59
3 2
3 7
2 02 3
4 2
2 6
4 7
2 9
0
1 0
2 0
3 0
4 0
5 0
Ea r ly 9 0 s L a te 9 0 s Ea r ly 9 0 s L a te 9 0 s Ea r ly 9 0 s L a te 9 0 s Ea r ly 9 0 s L a te 9 0 s
Ug a n d a G h a n a In d o n e s ia V ie tn a m
p o o r e s t r ic h e s t
Source: Demery, 2004a
The relatively low access of poor children to secondary education is a critical policy issue. For in-stance in India secondary school enrolment is shown to have a positive relationship with growth of state per capita income (Trivedi, 2002)23, 24. Dabla-Norris and Matovu (2002) find that increasing
23 Trivedi (2002) examines whether secondary school enrolment rates are related to economic growth across the period 1965-1992. His main findings show that there is a positive and significant relationship between both male and female enrolment rates and the annual rate of growth in per capita state income. 24 Sen, B. (2004) finds that household per capita expenditure in rural areas in Bangladeshis the highest when the household head has attained secondary education, while the household expenditure in urban areas increased more with years of tertiary education received by the head of the household. This leads to the conclusion that secondary education is an important factor for poor households in rural areas to move out of poverty. This find-ing is also confirmed in the Brazil OPPG country case study that allows for cross-state comparisons. Menezes-

Exploring the Link Between Public Spending and Poverty Reduction 15
spending on primary and secondary education in Ghana has significant macro-economic and poverty reduction benefits, even if this comes at the expense of infrastructure investment. If secondary school-ing is indeed important for participation of the poor in the growing sectors of the economy, then it seems unlikely that education spending in the 1990s did provide an opportunity for an escape from poverty, and a substantial increase in secondary enrolment for students from the poorest quintile would be required.
The available data suggests that health care spending benefits the wealthier households more than the poorer households. In all countries but Bolivia and Uganda, the richest quintile gains between 30 per-cent and more than two times as much as the bottom quintile of health expenditures (Figure 5). The benefit incidence analysis seems particularly anti-poor in Ghana and Bangladesh (in Ghana the richest quintile is more than two times as likely to benefit from health expenditures as the bottom quintile and this share remained stagnant in the 1990s). However, there have been improvements in the use of pub-licly subsidized health facilities by the poorest households in Uganda and Indonesia.
Figure 5. Benefit incidence of health spending in early and late 1990s by poorest and richest quintile (percent of total spending in subsector)
17
24
12 13 12
1816
2121
16
31 3129
2326
17
0
5
10
15
20
25
30
35
Ear ly90s
Late 90s Ear ly90s
Late 90s Ear ly90s
Late 90s Ear ly90s
Late 90s Ear ly90s
Late 90s
Uganda Ghana Indones ia Banglades h Boliv ia
poores t r ic hes t
Source: Demery, 2004a
A more mixed trend shows when focusing on primary health spending. Among the six countries for which we have data, in half of them the poorest quintile benefits more than the richest one, whilst in the other half the benefits are mostly received by the richest quintile. The benefit incidence analysis is again particularly anti-poor in Ghana (the richest quintile is three times more likely to benefit than the poorest) and Bangladesh. On the contrary, it is very pro-poor in India and Vietnam (in both cases the poorest quintile is two times more likely to enjoy the benefits of primary health care than the richest quintile).
Infrastructure investments also show a disproportionate tendency to benefit the richest segments of a country. For example, in Zambia only 20 percent of the poorest households have access to an im-proved water source, compared to nearly 50 percent for the top quintile. In Bolivia, 50 percent of the bottom quintile has access to an improved water source compared to 92 percent for the top quintile. Among the countries with data, only in Bangladesh is access to water practically universal at 97 per- Filho (2004) confirms that both the initial level of outcomes and the change in educational outcomes have an impact on growth and poverty. States like Piaui (PI) and Maranhão (MA) having the lowest levels of schooling in 1981 also show the lowest values of the growth-elasticity of poverty. Similarly, states with the lowest levels of human capital improvements like Ceará (CE) and Bahia (BA) also had the smallest change in the value of pro-poor growth. In contrast, states like São Paulo (SP), Rio de Janeiro (RJ) and Santa Catarina (SC), with high lev-els of schooling show high values for the growth elasticity of poverty.
16 Wilhelm and Fiestas
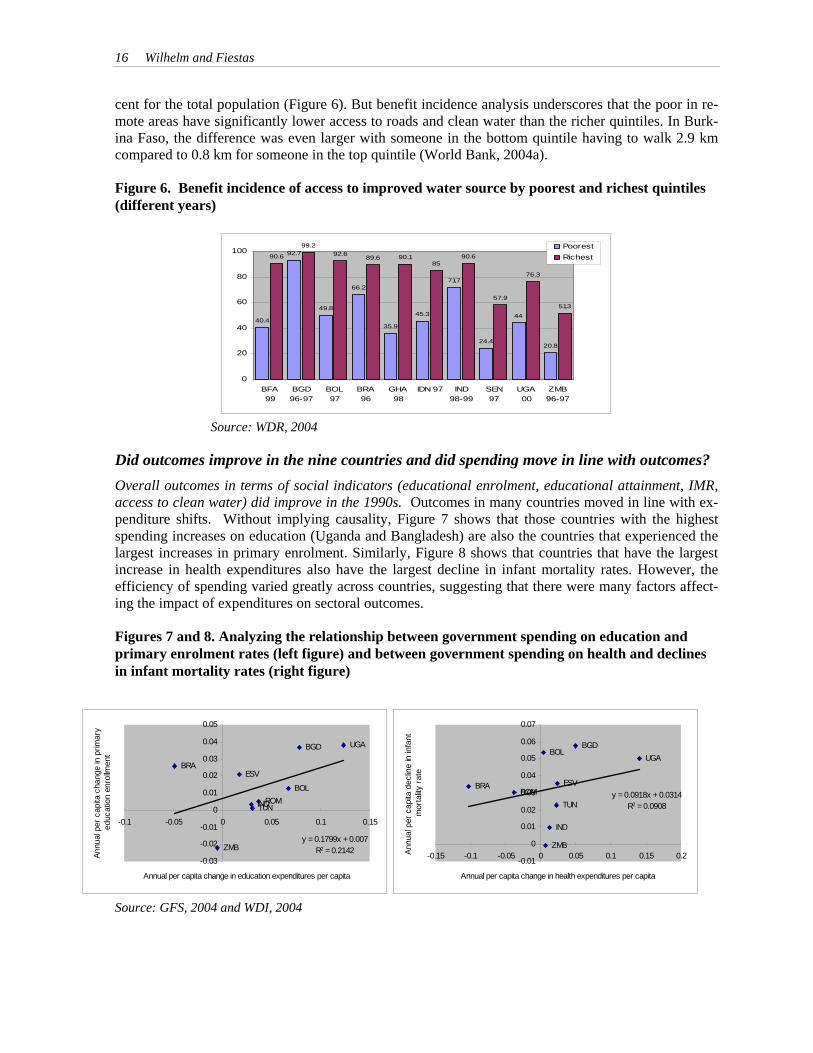
cent for the total population (Figure 6). But benefit incidence analysis underscores that the poor in re-mote areas have significantly lower access to roads and clean water than the richer quintiles. In Burk-ina Faso, the difference was even larger with someone in the bottom quintile having to walk 2.9 km compared to 0.8 km for someone in the top quintile (World Bank, 2004a).
Figure 6. Benefit incidence of access to improved water source by poorest and richest quintiles (different years)
40.4
92.7
49.8
66.2
35.9
45.3
71.7
24.4
44
20.8
90.6
99.292.6
89.6 90.185
90.6
57.9
76.3
51.3
0
20
40
60
80
100
BFA99
BGD96-97
BOL97
BRA96
GHA98
IDN 97 IND98-99
SEN97
UGA00
ZMB96-97
Poorest Richest
Source: WDR, 2004
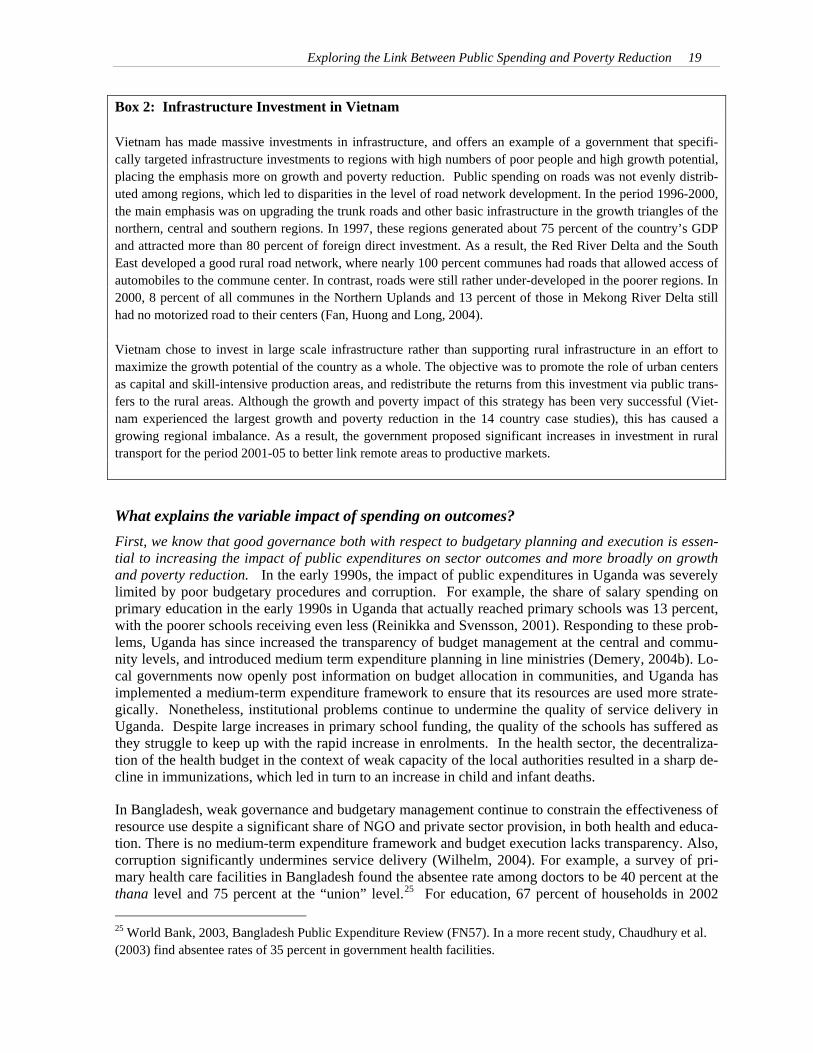
Did outcomes improve in the nine countries and did spending move in line with outcomes? Overall outcomes in terms of social indicators (educational enrolment, educational attainment, IMR, access to clean water) did improve in the 1990s. Outcomes in many countries moved in line with ex-penditure shifts. Without implying causality, Figure 7 shows that those countries with the highest spending increases on education (Uganda and Bangladesh) are also the countries that experienced the largest increases in primary enrolment. Similarly, Figure 8 shows that countries that have the largest increase in health expenditures also have the largest decline in infant mortality rates. However, the efficiency of spending varied greatly across countries, suggesting that there were many factors affect-ing the impact of expenditures on sectoral outcomes.
Figures 7 and 8. Analyzing the relationship between government spending on education and primary enrolment rates (left figure) and between government spending on health and declines in infant mortality rates (right figure)
BGD
BOL
BRAESV
INDROMTUN
UGA
ZMBy = 0.1799x + 0.007
R2 = 0.2142-0.03
-0.02
-0.01
0
0.01
0.02
0.03
0.04
0.05
-0.1 -0.05 0 0.05 0.1 0.15
Annual per capita change in education expenditures per capita
Annu
al p
er c
apita
cha
nge
in p
rimar
y ed
ucat
ion
enro
llmen
t
BGDBOL
BRA ESV
IND
ROMTUN
UGA
ZMB
y = 0.0918x + 0.0314R2 = 0.0908
-0.01
0
0.01
0.02
0.03
0.04
0.05
0.06
0.07
-0.15 -0.1 -0.05 0 0.05 0.1 0.15 0.2
Annual per capita change in health expenditures per capita
Annu
al p
er c
apita
dec
line
in in
fant
m
orta
lity ra
te
Source: GFS, 2004 and WDI, 2004

Exploring the Link Between Public Spending and Poverty Reduction 17
In a few countries, such as Ghana, increased spending was accompanied by improved outcomes of enrolment and attainment levels. A recent OED evaluation of basic education in Ghana based on household survey data, shows that by 2000, over 90 percent of Ghanaians aged 15 and above had at-tended school (75 percent in 1990) and 92 percent of those entering grade 1 completed grade 9, as drop out rates have been falling, and overall test scores improved significantly (World Bank, 2004b). This is mainly attributed to the greater availability and quality of classrooms and instruction materials, improved teacher supervision and training. Still, educational outcomes in Ghana are very uneven, as poorly resourced poor communities (rural and urban) show no or little improvements.
In other countries, like Bangladesh and Uganda, higher enrolment has not led to significant increases in educational attainment (Figure 9 and 10), which is mainly attributed to weak sector institutions in term of capacity and governance. A case in point is Brazil, where in 1996, in spite of having almost universal net enrolment (primary and secondary), surveys revealed that only 66 percent of young adults (18 years) had completed fourth grade, 43 percent completed eighth grade, and only 25 percent finished secondary school (World Bank, 2003).
Figure 9. Percentage point change in gross enrolment rates between late 1980s and late 1990s
37
18
52
16
5 3
-8
4
16
-2
59
4
-25
26
39
69
5
-3
915
-14
4
37
3
23
6
-40
-20
0
20
40
60
80
BGD BOL BRA BFA G HA IND IDN RO M S EN T UN UG A V NM Z M B
Perc
enta
ge p
oint
cha
nge
in g
ross
enr
ollm
ent Pr imary S ec ond a ry
Source: WDI, 2004 Note: Mean gross education enrolment rates in 1998-2001 compared with 1985-1990 (for Uganda and Zambia, the latest secondary enrolment rate used is 1996).
Figure 10. Average years of schooling of population over 15 years of age, for 12 country cases, 1980, 1990 and 2000
9.5
5.6
5.5
5.2
5.1
5.0
5.0
4.9
3.9
3.5
2.6
2.6
9.4
5.0
4.2
4.3
4.1
4.0
3.0
4.0
3.6
3.3
2.2
2.3
7.8
4.6
3.9
3.2
3.3
3.7
2.9
3.1
3.4
1.8
1.9
2.2
0 2 4 6 8
ROM
BOL
ZMB
ESV
IND
IDN
TUN
BRA
GHA
UGA
BGD
SEN
10
1980
1990
2000
Source: Barro-Lee, 2004

18 Wilhelm and Fiestas
For health, indicators (measured by the infant mortality rate) improved in all countries (Figure 11), with the exception of Zambia, which saw a very small decline. Countries with the highest per capita health care spending (Tunisia, Romania and El Salvador) experience the lowest incidence of infant deaths. At the other end of the scale, African countries such as Uganda have very low per capita health spending and experience high levels of infant deaths. Clearly there are some striking exceptions. Bangladesh achieved a remarkable decline in infant mortality (from 96 to 54 infant deaths per thou-sand between 1990 and 2000) despite spending of only $2 per head in real terms. Similarly, Bolivia in the first half of the nineties achieved a remarkable decline in infant mortality despite low central gov-ernment spending (possibly compensated by increased spending at the subnational level and private spending).
Figure 11. Infant mortality rate in case countries, 1990 and 2000 (deaths per 1000 live births)
118
101
93
90
78
96
84
87
46
50
60
38
41
27
107
102
85
80
62
54
68
62
34
35
35
23
22
19
0 20 40 60 80 100 120
BFA
ZMB
UGA
SEN
GHA
BGD
IND
BOL
ESV
BRA
IDN
VNM
TUN
ROM1990 2000
Source: WDI, 2004 Overall, a number of infrastructure outcomes have improved between 1990 and 2000. The percentage of population with access to an improved source of water has increased in all countries (Figure 12). Vietnam and Ghana experienced the largest increases, 22 and 20 percentage points respectively. How-ever, out of all the countries only in Bangladesh more than 90 percent of the population has access to clean water. Other indicators such as road density (total km of roads/surface area) also show im-provements in most countries. The highest level of road density is measured in Bangladesh, India and Romania (they also experienced the largest increases during the 1990s). But the impact of infrastruc-ture investment on the poor largely depends on where they occur (Box 2).
Figure 12. Access to clean water in country cases, 1990 and 2000 (percentage of the population)
97
87
84
83
80
78
78
77
77
73
64
58
52
42
94
83
68
71
75
72
71
55
66
53
52
0
45
0
0 20 40 60 80 100
BGD
BRA
IND
BOLTUN
SEN
IDNVNM
ESV
GHA
ZMBROM
UGA
BFA
Improved w ater source (% of population w ith access)2000 1990
Source: WDI, 2004
Exploring the Link Between Public Spending and Poverty Reduction 19
Box 2: Infrastructure Investment in Vietnam Vietnam has made massive investments in infrastructure, and offers an example of a government that specifi-cally targeted infrastructure investments to regions with high numbers of poor people and high growth potential, placing the emphasis more on growth and poverty reduction. Public spending on roads was not evenly distrib-uted among regions, which led to disparities in the level of road network development. In the period 1996-2000, the main emphasis was on upgrading the trunk roads and other basic infrastructure in the growth triangles of the northern, central and southern regions. In 1997, these regions generated about 75 percent of the country’s GDP and attracted more than 80 percent of foreign direct investment. As a result, the Red River Delta and the South East developed a good rural road network, where nearly 100 percent communes had roads that allowed access of automobiles to the commune center. In contrast, roads were still rather under-developed in the poorer regions. In 2000, 8 percent of all communes in the Northern Uplands and 13 percent of those in Mekong River Delta still had no motorized road to their centers (Fan, Huong and Long, 2004). Vietnam chose to invest in large scale infrastructure rather than supporting rural infrastructure in an effort to maximize the growth potential of the country as a whole. The objective was to promote the role of urban centers as capital and skill-intensive production areas, and redistribute the returns from this investment via public trans-fers to the rural areas. Although the growth and poverty impact of this strategy has been very successful (Viet-nam experienced the largest growth and poverty reduction in the 14 country case studies), this has caused a growing regional imbalance. As a result, the government proposed significant increases in investment in rural transport for the period 2001-05 to better link remote areas to productive markets. What explains the variable impact of spending on outcomes? First, we know that good governance both with respect to budgetary planning and execution is essen-tial to increasing the impact of public expenditures on sector outcomes and more broadly on growth and poverty reduction. In the early 1990s, the impact of public expenditures in Uganda was severely limited by poor budgetary procedures and corruption. For example, the share of salary spending on primary education in the early 1990s in Uganda that actually reached primary schools was 13 percent, with the poorer schools receiving even less (Reinikka and Svensson, 2001). Responding to these prob-lems, Uganda has since increased the transparency of budget management at the central and commu-nity levels, and introduced medium term expenditure planning in line ministries (Demery, 2004b). Lo-cal governments now openly post information on budget allocation in communities, and Uganda has implemented a medium-term expenditure framework to ensure that its resources are used more strate-gically. Nonetheless, institutional problems continue to undermine the quality of service delivery in Uganda. Despite large increases in primary school funding, the quality of the schools has suffered as they struggle to keep up with the rapid increase in enrolments. In the health sector, the decentraliza-tion of the health budget in the context of weak capacity of the local authorities resulted in a sharp de-cline in immunizations, which led in turn to an increase in child and infant deaths.
In Bangladesh, weak governance and budgetary management continue to constrain the effectiveness of resource use despite a significant share of NGO and private sector provision, in both health and educa-tion. There is no medium-term expenditure framework and budget execution lacks transparency. Also, corruption significantly undermines service delivery (Wilhelm, 2004). For example, a survey of pri-mary health care facilities in Bangladesh found the absentee rate among doctors to be 40 percent at the thana level and 75 percent at the “union” level.25 For education, 67 percent of households in 2002 25 World Bank, 2003, Bangladesh Public Expenditure Review (FN57). In a more recent study, Chaudhury et al. (2003) find absentee rates of 35 percent in government health facilities.
20 Wilhelm and Fiestas
reported difficulties in getting “free” textbooks, and the lack and poor quality of educational inputs have a significant impact on the quality of education.26 In Zambia, poor service delivery and spending declines have been partly attributed to the cash rationing system of the budget (infrastructure, health).27 This highlights the importance of public financial management reform and capacity building in particular in countries with weak budget institutions.28
On the other hand, a number of countries have made significant progress in improving the quality of public services by increasing sub-national capacity and autonomy. In Bolivia, new participatory insti-tutions29 were established to participate in municipal planning and oversee accountability of fiscal transfers to the local governments. Although they are still unequal across the country, there is evidence that municipal expenditures are increasingly focused on basic needs and local development, and there are examples of emerging partnerships between municipalities and the private sector (mostly in rural areas)30. In the education sector of Brazil, more clearly defined responsibilities between federal, state, and municipal governments and direct funding of schools contributed to increased school autonomy and significant improvements in public education, including a massive expansion of primary education and a reduction in the regional differences in enrolment rates. Institutional reforms in El Salvador that transferred resources and decision making to local communities were accompanied by significantly improved education outcomes in line with increased spending (World Bank, 2004a). In Vietnam, the impressive outcomes in social sectors are partly attributed to the increased discretion that was given to both provinces and subnational spending units over budgets. Public expenditure management has been strengthened over recent years, although significant shortcomings prevail, such as the lack of medium term planning and weak management information systems.31
Second, another possible explanation determining the link between public spending and development outcomes is the importance of complementarity and sequencing of spending packages. The benefits of higher expenditure on a particular sector may not be fully realized unless expenditure on other sectors is increased.32 As the analysis above underscores, spending in the 90s increased primarily for social security and education and, to a lesser extent, health, while resources for infrastructure and agriculture remained stable and declined respectively. However, outcomes critically depend on the right composi-tion of spending packages which is illustrated by Figure 13, showing how lower infant mortality goes hand in hand with improved access to clean water.
26 World Bank, 2003, Bangladesh: Public Expenditure Review. 27 World Bank, 2001, Zambia - Public expenditure review: public expenditure, growth and poverty - a synthesis. 28 Building on the HIPC exercise, a multi donor Public Expenditure and Financial Accountability (PEFA) Initia-tive has developed a expanded monitoring framework of country public expenditure performance, which also promotes donor harmonization of public financial management capacity building support (World Bank 2005b). 29 Organizaciones Territoriales de Base (OTB) and Comités de Vigilancia (CVS) (Source: FN 29) 30 World Bank, 1999, Bolivia Public Expenditure Review. 31 World Bank, 2004, Vietnam - Managing Public Expenditure for Poverty Reduction and Growth Public. 32 For a discussion of the importance of clean water and sanitation in improving health outcomes see Leipziger et al. (2003) and Van de Walle (2000) on the importance of rural roads for education.

Exploring the Link Between Public Spending and Poverty Reduction 21
Figure 13. Lower infant mortality rates go in hand with improvements in access to clean water – 12 countries
-8%
-6%
-4%
-2%
0%
2%
4%
BGD BOL BRA ESV GHA IND IDN SEN TUN UGA V NM ZM B
Annu
al p
erce
ntag
e ch
ange
, 199
0-20
00
A ccess to c lean w ater (% of population) IMR
Source: WDI, 2004
Much of the impressive decline in the infant mortality rate (from 96 to 54 deaths per 1000 live births in Bangladesh and from 60 to 35 deaths per 1000 live births in Bolivia) has been attributed to the role of private NGOs and the remarkable access to clean water (97 percent of the population has access to a clean water source in Bangladesh).
Similarly, investments in the rural economy, for example in Bangladesh and Uganda, need to be sup-ported by access to basic infrastructure services, to have an effect on economic growth and poverty reduction. Lack of access to electricity in these countries poses a major constraint on the rural poor as availability of electricity is one of the factors most strongly correlated with poverty. In Uganda house-holds with initial access to electricity experienced consumption and income growth of 6 and 3.5 per-centage points higher than those without electricity. In the areas where electricity was available, there were also significant indirect impacts (e.g., through higher labor demand) reducing the probability of households falling into poverty. Poor rural households in Bangladesh with access to electricity earned a 14 percent higher income than their counterparts in villages with no electricity, while those living in villages with good transport facility were able to obtain an additional 13 percent income.
The right composition of expenditures is also important within sectors to achieve the desired outcome. This becomes apparent when assessing the lack of current expenditures needed to maintain the value of capital investment, particularly in the roads sector. In Vietnam for example, where many new roads were built, high investment in an expanding road network was not accompanied by adequate current expenditure allocations for operation and maintenance, often leading to rising costs for rehabilitation and resurfacing a few years later. Similarly, Sen (2004) mentions that, in Bangladesh, after large in-vestments in rural roads “the rural road network has reached a level where it would be more appropri-ate to invest in quality rather than network expansion”.
Spending priorities may also change over time, as intermediate outcomes are achieved. For a number of countries sequenced spending patterns emerge from primary to higher levels of education. Bangla-desh, having introduced a mass education program in 1980, and Vietnam, having achieved primary enrolment rates of almost 90 percent in the early nineties, prioritized secondary education in the 1990s. The share allocated to primary education fell in Bangladesh from 49 to 40 percent between 1991/92 and 1999/00, and in Vietnam from 40 percent to 36 percent between 1992 and 1998 as a per-cent of the education budget. Similarly, in Brazil universal primary enrolment was achieved in 1990,

22 Wilhelm and Fiestas
but secondary enrolment remained low (38%). Over the decade of the nineties, however, secondary enrolment became universal.
Finally, it has to be kept in mind that factors other than spending can affect public service provision. This is particularly true for the involvement of the private sector, as shown in the case of Bangladesh. There, the increase in primary and secondary school enrolment can not be attributed primarily to pub-lic sector spending. The disaggregated analysis for the increase in primary education over the period 1988/89 to 1997/98 shows that almost the entire increase in primary education was due to non-government schools which increased from 16 percent of primary schools to 38 percent over the period. For secondary education, the data shows that 95 percent of secondary schools were run by NGOs or the private sector with government subsidies (Ahmed et al., 2004). Also, in Bangladesh, the im-provements in health indicators have been attributed largely to private and NGO sector involvement, as they came at a time when public spending on health declined (due to budget under-run; similar find-ings apply to Bolivia due to significant private sector involvement).33
33 World Bank, 2003, Bangladesh: Development Policy Review; World Bank, 1999, Bolivia: Public Expenditure Review.
Exploring the Link Between Public Spending and Poverty Reduction 23
Is there a link between spending, poverty reduction and growth? As discussed above, there are many factors that affect the ability of public spending to improve sec-toral outcomes, such as targeting, institutional quality, the provision of complementary goods, and the role of non-governmental organizations and the private sector. We now explore the relationship be-tween spending and growth and poverty reduction. As we lack sufficient data for our nine country cases to explore the link between spending and pro poor growth, we consult recent analytical work covering at least a few of our countries. We will first review recent literature to establish which tools are generally used to analyze this link and, based on those, try to establish which the relevant sectors for achieving poverty reduction and economic growth are. We will then have a closer look at two of the studies which show the relative impact of spending on different sectors.
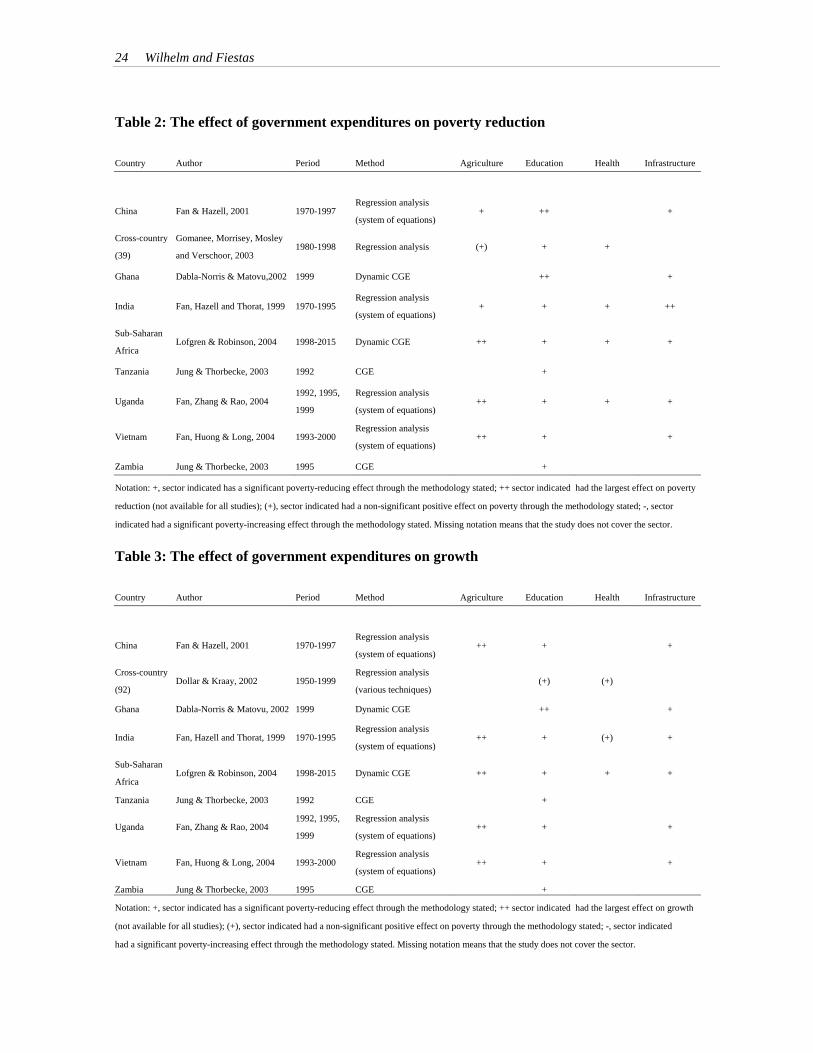
Main findings on the impact of spending across countries. Using different econometric and statistical methods, a number of country studies34 have explored the link between public expenditure in different sectors and growth and poverty reduction (Tables 2 and 3). A cursory look at the main findings reveals that investing in agriculture, education and infrastructure has a positive effect on poverty reduction and growth. Overall, investing in agriculture seems to yield the highest returns in terms of both growth and poverty reduction. In comparison, investing in health also has a positive effect on poverty reduction, but the impact on growth is much weaker.
A closer look at the selected studies confirms that
• Agriculture spending appears to have a very significant effect on both poverty reduction and growth. However, these results must be taken with caution as the four studies by Fan et al. de-fine growth as rural income growth. In other words, the effect of agriculture expenditure over overall growth might not be that significant.
• Education is consistently analyzed in all studies with the same result: education expenditure is shown to have a positive effect on both poverty reduction and growth, with one exception. Dollar and Kraay (2002), using cross-country econometrics, found that education expenditure was not significant for growth.
• According to most studies, health seems to have a positive impact on poverty reduction, but may not have the same impact on growth (two out of the three studies that analyzed the impact of health expenditures find that its impact on growth is not significant and only one finds that it has a positive impact).
• Infrastructure spending is consistently analyzed in most papers and it seems to have a positive impact on both poverty reduction and growth.
34 Most studies analyze the impact of public expenditures on both growth and poverty reduction. The only excep-tion is the two cross-country regression papers. Gomanee et al. (2003) only analyzes the effect on poverty reduc-tion, whilst Dollar and Kraay (2002) the effect on growth.
24 Wilhelm and Fiestas
Table 2: The effect of government expenditures on poverty reduction Country Author Period Method Agriculture Education Health Infrastructure
China Fan & Hazell, 2001 1970-1997 Regression analysis
(system of equations) + ++ +
Cross-country
(39)
Gomanee, Morrisey, Mosley
and Verschoor, 2003 1980-1998 Regression analysis (+) + +
Ghana Dabla-Norris & Matovu,2002 1999 Dynamic CGE ++ +
India Fan, Hazell and Thorat, 1999 1970-1995 Regression analysis
(system of equations) + + + ++
Sub-Saharan
Africa Lofgren & Robinson, 2004 1998-2015 Dynamic CGE ++ + + +
Tanzania Jung & Thorbecke, 2003 1992 CGE +
Uganda Fan, Zhang & Rao, 2004 1992, 1995,
1999
Regression analysis
(system of equations) ++ + + +
Vietnam Fan, Huong & Long, 2004 1993-2000 Regression analysis
(system of equations) ++ + +
Zambia Jung & Thorbecke, 2003 1995 CGE +
Notation: +, sector indicated has a significant poverty-reducing effect through the methodology stated; ++ sector indicated had the largest effect on poverty
reduction (not available for all studies); (+), sector indicated had a non-significant positive effect on poverty through the methodology stated; -, sector
indicated had a significant poverty-increasing effect through the methodology stated. Missing notation means that the study does not cover the sector.
Table 3: The effect of government expenditures on growth Country Author Period Method Agriculture Education Health Infrastructure
China Fan & Hazell, 2001 1970-1997 Regression analysis
(system of equations) ++ + +
Cross-country
(92) Dollar & Kraay, 2002 1950-1999
Regression analysis
(various techniques) (+) (+)
Ghana Dabla-Norris & Matovu, 2002 1999 Dynamic CGE ++ +
India Fan, Hazell and Thorat, 1999 1970-1995 Regression analysis
(system of equations) ++ + (+) +
Sub-Saharan
Africa Lofgren & Robinson, 2004 1998-2015 Dynamic CGE ++ + + +
Tanzania Jung & Thorbecke, 2003 1992 CGE +
Uganda Fan, Zhang & Rao, 2004 1992, 1995,
1999
Regression analysis
(system of equations) ++ + +
Vietnam Fan, Huong & Long, 2004 1993-2000 Regression analysis
(system of equations) ++ + +
Zambia Jung & Thorbecke, 2003 1995 CGE +
Notation: +, sector indicated has a significant poverty-reducing effect through the methodology stated; ++ sector indicated had the largest effect on growth
(not available for all studies); (+), sector indicated had a non-significant positive effect on poverty through the methodology stated; -, sector indicated
had a significant poverty-increasing effect through the methodology stated. Missing notation means that the study does not cover the sector.

Exploring the Link Between Public Spending and Poverty Reduction 25
These results should be qualified in several ways. First, the selected papers have been chosen non-randomly based on the criteria that they analyze the effects of public spending on both growth and poverty reduction. And they do not pretend to form an exhaustive list. Second, only the studies by Fan et al. and Lofgren and Robinson (2004) look simultaneously across sectors (agriculture, education, health, and infrastructure). The other studies analyze a more limited number of sectors. Hence, we cannot compare these studies to reach conclusions on the relative importance of one sector over the other. Third, as already mentioned above, Fan et al. use rural income growth as the independent vari-able, which could lead to an overestimation of, for example, the impact of agricultural expenditures on overall growth.
Main findings on the relative impact of spending. We now take a closer look at the findings of two selected studies (Lofgren and Robinson; Fan et al.) on the relative impact of sectoral spending. The dynamic CGE model by Lofgren and Robinson (2004) for Sub-Saharan Africa allows to evaluate the impact that one specific policy has on the economy as a whole; the regression model by Fan et al for India (Fan, Hazel and Thorat, 1999), Uganda (Fan, Zhang and Rao, 2004) and Vietnam (Fan, Huong and Long, 2004) simultaneously evaluates the impact of sectoral expenditure on growth and poverty reduction. Both methodologies allow to rank spending priorities depending on the primary policy ob-jective. They both conclude that investing in agriculture brings the highest levels of growth and pov-erty reduction. However, the dynamic CGE study shows that investment in human capital (defined as education and health) yields higher returns in terms of both growth and poverty reduction than infra-structure. In contrast, Fan et al. find that investment in infrastructure causes more growth and poverty reduction than education.35
The CGE study simulates the effect of a reallocation of government demand into alternative priority areas (agriculture, human capital, and infrastructure) while keeping the real growth of total govern-ment demand constant. The paper simulates several different scenarios, from an increase only in agri-culture or human capital, to a combined increased in all sectors. Several conclusions emerge:
• An increase of public spending in human capital (education and health), agriculture or infra-structure has a positive effect on growth and an even larger effect on poverty reduction.
• Investments in agriculture have the highest impact on poverty reduction. Alternatively, invest-ing in human capital only leads to half the decrease in poverty.
• There are no significant differences in terms of the impact of any of these sector investments for growth.
• Investment in defence negatively affects growth and poverty reduction. In conclusion, if the objective is to achieve growth, investment in either agriculture, human capital or infrastructure (or even a combination of the three) will bring very similar returns. However, if the ob-jective is poverty reduction, investment in agriculture is likely to be most effective, followed by in-vestments in human capital and infrastructure.
The regression model used by Fan et al. for Uganda, Vietnam and India, also assesses the impact of subsectoral expenditures. The results suggest that there are no major differences when ranking expen-
35 As mentioned in Annex 2, the dynamic CGE model takes into account time lags given the scope of the simula-tion (1998-2015). On the other hand, the extent to which the regression models take into account time lags de-pends on the length of the time series. Data availability for the India study goes back to 1970, so time lags are empirically taken into account. However, in Vietnam and Uganda the lack of long-term time series data on re-gional public expenditures and other indicators, such as infrastructure, does not allow this.

26 Wilhelm and Fiestas
ditures according to their impact on poverty reduction and growth (as measured by agricultural pro-ductivity). For example, in Vietnam the greatest returns in terms of growth and poverty reduction came from agricultural research and development followed by investments in telephones and educa-tion, while in Uganda agricultural research and development was also the most significant subsector, followed by feeder roads and education. The results in India also show that government spending on productivity-enhancing investments (especially agricultural research and extension), rural roads and education targeted directly to the rural poor, all contribute to reductions in rural poverty, and at the same time lead to increased agricultural productivity.
There were some slight differences in the relative ranking of expenditures depending on the objective being either growth or poverty reduction. For instance in Uganda murram and tarmac roads were not important for growth, but they were significant for poverty reduction (fourth place after education). Similarly in India, irrigation was the third most important investment in terms of growth, but had a smaller impact on poverty reduction.
With respect to regions, there was significant divergence in all three countries on where governments should allocate their marginal resources depending on whether the priority is poverty reduction or growth. For example, in rural Uganda, the greatest gains in terms of growth (agricultural productivity) came from increased spending in the West region, while the North regions generally scored the lowest. In contrast, in terms of the impact on rural poverty, investments in the North brought the greatest re-turns (even, considering the indirect impact of growth on poverty) with investments in the central re-gion offering the smallest returns to poverty reduction. In Vietnam (Table 4), the relative returns to agricultural productivity for the different types of investments varied across regions, with the Red River Delta having the highest returns for irrigation, roads, electricity, but education yielding the high-est returns in the Southeast region. Similarly for poverty reduction, returns were highest in the South-east for education and irrigation, in the north central region for roads, and in the Red River Delta for electricity.
Table 4: Marginal returns to government investment in Vietnam
Agriculture R&D Irrigation Roads Electricity Telephone Education Benefit-cost ratio Whole country 11.00 0.76 3.50 2.49 6.73 5.34 Northern Uplands 0.38 2.17 0.90 2.46 Red River Delta 0.73 3.79 25.99 5.41 North Central 0.40 3.80 1.81 2.62 Central Coast 0.38 2.83 3.25 3.20 Highlands 0.51 3.60 0.87 5.10 Southeast 2.39 3.84 5.86 12.10 Mekong River Delta 0.67 3.96 2.11 5.39 Number of poor reduced per billion dong Whole country 246.52 23.29 102.52 90.71 207.38 164.60 Northern Uplands 21.67 118.56 62.07 141.34 Red River Delta 14.28 70.79 495.58 106.42 North Central 26.84 241.36 136.07 175.11 Central Coast 23.39 167.01 67.30 198.89 Highlands 15.08 101.13 31.09 151.11 Southeast 50.18 76.41 149.27 253.46 Mekong River Delta 10.23 57.43 37.75 82.39
Source: Fan, S., P.L. Huong, and T.Q. Long (2004)

Exploring the Link Between Public Spending and Poverty Reduction 27
In summary, investments in specific sectors such as agriculture, education and infrastructure appear to be important for both growth and poverty reduction, although some trade-offs may exist. Contrary to spending trends observed in the nineties, it seems that social sector spending is not the only or most important driver of poverty reduction and growth, but investment in agriculture and infrastructure are equally important. However, it seems that different regions within a country may call for different sec-toral investments to achieve the highest returns in terms of poverty reduction and growth. It is impor-tant to note, however, that these findings very much depend on the specific country context and the different specifications of the models being used.
For future research the challenge lies in deepening the analysis by going beyond the analysis of aggre-gate sector spending across countries and gaining a better understanding of the impact of sectoral and subsectoral spending packages.36 For this purpose, collecting better data and the refining of method-ologies to assess the relative impact of sectoral and subsectoral spending will be essential, taking into account the country context and specificity. This would also help to improve existing mechanism for the tracking of pro-poor spending under the HIPC initiative that is heavily focused on social sector spending. An example of the potential and limitations of pro-poor expenditure tracking mechanisms and the importance of evidenced based analysis provide Uganda (Box 3)
Box 3: The role of Uganda’s poverty fund and need for evidence based analysis 37
Uganda’s virtual poverty fund (PAF) was created to protect items of expenditure considered central to the pov-erty reduction effort of the government. PAF programs grew from 17.5% to 37% of a rapidly expanding gov-ernment budget between 1997/8 and 2002/3. The government guarantees all budgeted resources in full for dis-bursement to PAF programs, regardless of resource shortfalls. The PAF also reinforced the focus on the results of government’s programs. A system of activity-based budget reporting was introduced in local government for PAF conditional grants, which is highly important as over a third of spending in Uganda is performed by local authorities. Five percent of all PAF resources were set aside for oversight institutions and local government to improve monitoring and accountability. Over time, the PAF has also contributed to the mobilization of sector-specific donor resources through budget support, by providing donors with a level of comfort in terms of alloca-tion, implementation and transparency, which enabled the shift from project to budget and SWAP support. In spite of this progress, however, uneven line ministry capacities in performing strategic budget planning and monitoring outcomes have led to a bias in spending allocation with the effect of crowding out weaker sectors (agriculture, infrastructure) that are important for growth and poverty reduction. To address this bias, Uganda has made significant progress in using evidence based analysis and information to determine spending allocations. The government has sponsored a series of surveys such as household surveys and demographic and health surveys, in addition to expenditure tracking studies and service delivery survey pro-viding information on the effectiveness of government services. Although to date relatively few sector plans draw on ex ante impact analysis, research and analysis are becoming more important. The increase in budget allocations to the water sector, for example, was a response the findings of living standards surveys. Tracking surveys in education highlighted the failure of resources to reach the institutions in charge of service delivery. The government responded with a public information campaign that led to increased flow of funds due to in-creased accountability and oversight. Recent increases in infant and child mortality are causing revisions in budgetary arrangements for health care, especially the funding of the country’s vaccination program. Again, while progress has been made, it has not yet resulted in shifts in the budget allocations between sectors, but rather been limited to intra-sectoral changes. But the flow and monitoring of information from the government to the citizens through the media and government postings and from the communities to the government through surveys and participatory poverty assessments have helped to improve budget composition.
36 See Annex 2 for more details on limitations of existing methodologies. 37 This box is prepared using material drawn from Demery, 2004b.

28 Wilhelm and Fiestas
Also, better information on spatial incidence of public expenditures, i.e. the combination of expendi-ture data on allocation and execution with geographical incidence of poverty, may be useful. Recent research explores the use of poverty maps combined with fiscal, infrastructure and agroclimatic data as a tool for guiding expenditure allocations at the decentralized level. (Box 4). Use of these tools, or a combination thereof, could enable governments to better determine where to spend the extra dollar with maximum effect, as could a focus on expenditure policies for poverty reduction in Public Expen-diture Reviews.
Box 4: Poverty and geographic dimensions of public spending In recent years, the use of poverty maps as an instrument to improve targeting of public expenditures has in-creased significantly. As shown by Baker and Grosh (1994) and Ravallion and Wodon (1997),38 they are an effi-cient instrument to reduce leakages to the non-poor by targeting increasingly smaller areas. Several countries use them to help target expenditures. For example, Panama’s Social Investment Fund has used poverty maps to tar-get investment in schools, health centers, and roads toward the country’s poorest districts.39 Also in Guatemala the Secretariat for Planning and Programming use poverty mapping for ranking projects proposed for funding according to geographic criteria.40
Recent research has addressed two aspects that limited the use of poverty maps for the allocation of public spending. First, improvements in the methodology 41 now allow creating poverty maps at very low levels of dis-aggregation (cities, towns, villages). Second, improvements in expenditure tracking allow to better trace the geo-graphic incidence of expenditures. As a result of these developments, future decisions on expenditure allocations might be more easily guided to areas where the poverty impact is likely to be high. This approach has been tried with the help of current expenditure data in Madagascar showing that the regressiveness of salary components in education was due to the systematic misallocation of teachers in primary education towards the richer and more urban areas, whereas poorer areas had more schools but few teachers. As a result, the 20001/02 PRPS provided that 5,000 new primary school teachers should be allocated not only to rural areas but also areas with high pu-pil/teacher ratio. This type of analysis could provide a baseline for monitoring changes of public spending over time and is espe-cially relevant for countries engaging in a decentralization process. In this context, the combined use of poverty maps with public expenditure and administrative data could also inspire competition between jurisdictions, which has been found to be an important factor stimulating change.42 The approach could also be used to iden-tify priority areas for capital spending, and thus have the potential to provide guidance for programming sectoral budgets. However, the combined use of poverty maps and fiscal/administrative data proves to be difficult for investment budgets in many countries, as classification systems and the expenditure tracking process do not al-low to monitor capital spending at the decentralized level. Public expenditure management reform pursued un-der the HIPC and PRSP processes, advancing program budgeting, may help to address this problem in the future.
38 Baker and Grosh (1994) find that targeting smaller areas improved efficiency and reduced poverty by a greater amount that universal cov-erage or other alternative methods. Ravallion and Wodon (1997) show that in Bangladesh a household’s geographic profile is a more signifi-cant indicator of poverty than the household’s characteristics 39 Henninger and Snel, 2002, Where are the poor? Experiences with the Development and Use of Poverty Maps, World Resources Institute, Washington D.C. 40 Idem 41 For information on the methodology of spatial mapping, see Hentschel et al. (2000); Elbers, Lanjouw and Lanjouw (2002) 42 Besley and Case, 1995, "Incumbent Behavior: Vote Seeking, Tax Setting, and Yardstick Competition," American Economic Review, 85:1.
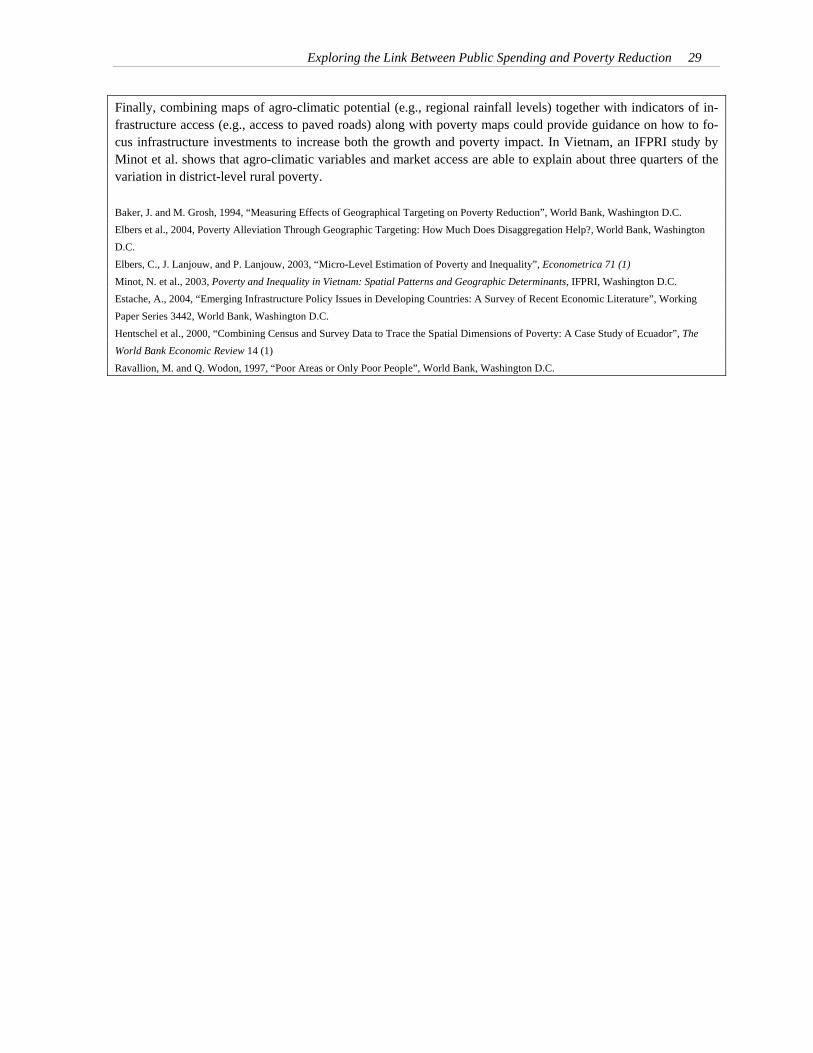
Exploring the Link Between Public Spending and Poverty Reduction 29
Finally, combining maps of agro-climatic potential (e.g., regional rainfall levels) together with indicators of in-frastructure access (e.g., access to paved roads) along with poverty maps could provide guidance on how to fo-cus infrastructure investments to increase both the growth and poverty impact. In Vietnam, an IFPRI study by Minot et al. shows that agro-climatic variables and market access are able to explain about three quarters of the variation in district-level rural poverty. Baker, J. and M. Grosh, 1994, “Measuring Effects of Geographical Targeting on Poverty Reduction”, World Bank, Washington D.C. Elbers et al., 2004, Poverty Alleviation Through Geographic Targeting: How Much Does Disaggregation Help?, World Bank, Washington D.C. Elbers, C., J. Lanjouw, and P. Lanjouw, 2003, “Micro-Level Estimation of Poverty and Inequality”, Econometrica 71 (1) Minot, N. et al., 2003, Poverty and Inequality in Vietnam: Spatial Patterns and Geographic Determinants, IFPRI, Washington D.C. Estache, A., 2004, “Emerging Infrastructure Policy Issues in Developing Countries: A Survey of Recent Economic Literature”, Working Paper Series 3442, World Bank, Washington D.C. Hentschel et al., 2000, “Combining Census and Survey Data to Trace the Spatial Dimensions of Poverty: A Case Study of Ecuador”, The World Bank Economic Review 14 (1) Ravallion, M. and Q. Wodon, 1997, “Poor Areas or Only Poor People”, World Bank, Washington D.C.

30 Wilhelm and Fiestas
Summary findings In reviewing the experience with public expenditures in nine of our countries, with a more in depth analysis in a few, we find that overall spending levels (as a percentage of GDP and in per capita terms) declined over the analyzed period. However, large (although variable across countries) spend-ing increases occurred in sectors that are more likely to be captured by the rich. Spending trends in sectors commonly associated with growth and poverty reduction (education, health, infrastructure and agriculture) were mixed when spending was defined as a share of GDP, and declined in per capita terms.
Social sector spending, in particular for education, increased as a percent of GDP but declined on a per capita basis. Incidence analysis shows that while spending on primary education benefited the poorest quintiles, most of the benefits of secondary education were captured by the rich. Health ex-penditures remained stable as a percent of GDP but declined in per capita terms and tended to benefit the rich quintiles of the population more then the poor, although progress has been made in a number of countries (El Salvador, Vietnam, India, and recently Uganda). Similarly, spending shares on infra-structure remained stable with a small decline in real per capita spending. Analysis for a few countries shows that investment in water and sanitation mostly benefited the rich. Spending on agriculture de-clined both as a share of GDP and in per capita terms.
While outcomes improved overall (in particular, enrolment rates, infant mortality rate and access to water), there was no clear link to spending patterns. While more spending tended to go hand in hand with some improved sectoral outcomes (for example enrolment rates), spending patterns generally did not fully explain improved outcomes or the lack thereof (Figures 7 and 8). Other factors appear to be important such as the role of the private sector, the quality of institutions (Uganda, Bangladesh, Ghana), and the composition and complementarity of spending.
Moreover, while improved outcomes are important correlates of growth and poverty reduction in the literature over the long run, over the short period covered by this study, they did not emerge as a defin-ing indicator in determining a country’s poverty reduction, as was to be expected43. Other than lags, some of the possible explanations for the weak link between spending, sectoral outcomes and poverty reduction could reflect poor targeting (e.g. social sector spending in Ghana; secondary education and health in most countries), lack of complementary goods within and across sectors (e.g. lack of O&M in roads sector in most countries and lack of electricity in rural areas in Bangladesh and Uganda with effect on productive sectors; lack of secondary education in Uganda), poor quality of service delivery to the poor (e.g. weak institutions in Uganda, Bangladesh, Ghana, Zambia) as well as other factors not related to public expenditures (such as other public policy measures affecting the functioning of mar-kets, how spending is financed , etc.).
Reviewing a number of studies that assess the link between public spending, poverty reduction and growth, we conclude that expenditure priorities are highly country specific and go well beyond the recently observed focus on social sectors discussed above. It appears that investing in agriculture, education and infrastructure has a positive effect on both, poverty reduction and growth. In compari-son, investing in health also has a positive effect on poverty reduction, but the impact on growth is much weaker. However, this is not to say that public spending should be limited to these sectors. Where government spending brings the highest return in terms of poverty reduction and growth very much depends on the specific country situation. For example, public policy to improve governance
43 Note, we did not try to establish such a relationship with statistical or econometric methods due to data limita-tions.

Exploring the Link Between Public Spending and Poverty Reduction 31
and control corruption is likely to be a priority in Ghana and Bangladesh (the latter experiencing an estimated annual loss of 2-3 percent of GDP due to poor governance and weak institutions44), which disproportionately affect the poor as a result of low quality public services. On the other hand, in a country like Jamaica, investing in public order clearly emerges as a priority, as four percent of GDP are estimated to be forgone due to lost productivity, health expenditures, public and private spending on security and various losses due to crime.
The composition of public spending is important for outcomes and may vary, depending on whether the main objective of a country’s development strategy is growth or poverty reduction. This may lead to trade-offs in terms of efficiency and equity considerations or in some cases provide the opportunity to benefit from a “win-win” situation. In Tunisia, for example, high and poorly targeted food subsi-dies which reached more than 5 percent of GDP or 20 percent of total investment in the early eighties are likely to have caused significant opportunity costs in terms of productive investments. In contrast, “win-win” situations emerged in cases where government spending seemed likely to have had both, a growth promoting and a poverty reducing effect (food for work in Bangladesh; labor intensive pro-grams in El Salvador; investment in rural infrastructure and farm productivity in Indonesia (Timmer, 2004).
Implications for donors The above findings highlight the importance and need for rigorous country specific analysis of public resource allocations across and within sectors, which could help to evaluate the marginal returns on different types of government spending. It also puts into question the usefulness of tracking “poverty reducing expenditures” as they vary from country to country and their effectiveness depends largely on the right composition, institutional factors and capacity constraints.
Evidenced based analysis. Using a combination of different approaches may allow deriving more solid evidence on the potential return of alternative combinations of public resources.45 (Discussed in more detail in Annex C) and may be a way to address some of the limitations associated with the different models and techniques. 46
Also, more evidence is needed on how to optimize spending packages at the subnational level. This requires improved availability of sub-national data linked to enhanced statistical capacity building and the improved performance of public financial management systems. Various efforts in these areas are underway47 and may enable the collection of better and more comprehensive data at the country level that allow assessing trade-offs between expenditure allocations across sectors, and estimate the relative returns on public spending. More policy oriented PERs that are informed by poverty assessments and PSIA as well as spatial poverty analysis could also help to build government capacity for analysis in this area.
44 Rahman, Kisunko, and Kapoor (2000) 45 This approach was used in the work of Mosley, Hudson and Verschoor (2004) when trying to construct a “pro-poor expenditure index”. Using four different methods (benefit incidence, labor intensity, regression and CGE) they try to establish in which sectors the expansion of expenditures is likely to be poverty reducing. 46 For limitations of incidence analysis see Demery (2003) and for in country regressions see Klitgaard (2004). 47 For an overview of statistical and PFM capacity building initiatives visit: http://web.worldbank.org/WBSITE/EXTERNAL/DATASTATISTICS/SCBEXTERNAL/0,,contentMDK:20100922~hlPK:981211~menuPK:229526~pagePK:229544~piPK:229605~theSitePK:239427,00.html and http://www.pefa.org/index2.htm
32 Wilhelm and Fiestas
Institutional analysis. Finally, a better understanding is needed on how the combination of initial con-ditions, institutional constraints and lags play out in a country and affect the impact of public spend-ing. This should be facilitated by the amelioration and consolidation of existing tools that have been developed to assess capacity, institutional constraints and the politics of managing reform, and the im-pact of policy reforms on the poor.48
48 For an overview of tools and techniques to assess public sector governance and institutions see http://info.worldbank.org/etools/library/latestversion.asp?82355 and http://www-wbweb.worldbank.org/prem/pas/test/capacity/toolsoverview.htm; for PSIA see http://www.worldbank.org/psia; also Box 3 on use of poverty maps.

Exploring the Link Between Public Spending and Poverty Reduction 33
ANNEX 1 Data limitations The depth and robustness of the analysis presented below is severely constraint by the limited avail-ability of data on expenditures and sectoral outcomes during the 1990s. Government finance data come from national sources and reflect each country's budgetary and accounting practices. As a result, government finance statistics tend to vary significantly from country to country. The only comparable data across countries on public expenditure can be found at the IMF Global Finance Statistics data-base. Although in general GFS data covers central, state and local government data, consistent data for the 14 OPPG countries is only available for Central Government Budgetary Accounts and data for the late 1980s through the late 1990s is only available for nine countries (Bangladesh, Bolivia, Brazil, El Sal-vador, India, Romania, Tunisia, Uganda and Zambia). Expenditure data is only presented by aggre-gated sectors (education; health; transports and communication; general public services; defence; agri-culture, forestry, fishing & hunting). This limits considerably the cross-country analysis of who bene-fits from this expenditure as there is no data on subsectoral spending (i.e., no differentiation in the education sector on the spending that goes to primary, secondary or tertiary education). Only being able to use Central Government data implies ignoring a large part of public expenditure that takes place at the local or provincial level. The bias is even larger in those countries that have gone through important fiscal decentralization processes. For example, Bolivia channelled HIPC I and II entirely through municipalities to fund priority investments, mostly in the social sectors and infra-structure. They are not reflected in the data that has been presented to make the number comparable across countries. To be able to have a somewhat better understanding of how social spending affected outcomes at the country level we did a more in-depth analysis for Bangladesh, El Salvador, Uganda and Vietnam as subsectoral incidence data and incidence analysis was available.

34 Wilhelm and Fiestas
ANNEX 2 Analyzing the impact of public spending on growth an poverty reduction: methodologies and limitations The econometrically-based literature has typically tried to unravel the determinants of growth by rely-ing on cross-country regressions of a measure of GDP on a set of variables that are viewed as potential determinants. In recent years, data availability has permitted alternative approaches, including time-series analysis, analysis at the single-country level, and estimation of simultaneous-equation systems, which have mitigated some of the econometric problems faced by cross-section regressions (Easterly and Levine, 2001). The series of studies by Fan and others (see table 1) uses time-series data to estimate the relationship between public expenditure components in rural areas on both rural income growth and poverty reduc-tion. A number of critical issues emerge when looking at these reduced form regressions. In the first place, the robustness of the results is often sensitive to the empirical strategy employed and the coun-tries and time period covered by the sample. Another important constraint is the lack of reliable data. This problem, common to all methodologies used to analyze the impact of public expenditures on growth and poverty, makes it difficult to evaluate the impacts of various investments and undermines the reliability of policy recommendations. A recent trend in the literature is the use of computable general equilibrium (CGE) models. CGE mod-els form a class of models where production activities, factors, and institutions and their links are fully specified. They include the modelling of all markets and macroeconomic components and can be ei-ther static or dynamic. The dynamic CGE is an extension of the static model by incorporating time and the influence of economic openness and government spending on factor productivity. This allows to take into consideration trickle-down effects and to observe potential trade-offs among the different policies to implement. Moreover, given that the impact of investments in human capital or infrastruc-ture on growth and poverty reduction comes up in different time horizons (shorter term for infrastruc-ture and longer term for education and health), it also seems most appropriate to use a dynamic CGE to disentangle the short and long-run effects. In fact, the study by Lofgren and Robinson (2004) uses a dynamic CGE to analyze the structural mechanisms through which public policy affects growth and poverty. However, CGE models are technically demanding and data-intensive. Some critics argue that structural parameters are difficult to estimate. In fact, data limitations have at times forced analysts to borrow parameters from studies done for other countries. This becomes analogous to a cross-country regression approach. No approach is likely to be perfect because of the range of growth and poverty impacts which are con-ceivable, and the complex chain of linkages, time lags and the interdependence of development out-comes. However, country regressions and CGE models are the most common tools used to establish the links between expenditure components and poverty reduction. Other methodologies, such as the benefit incidence analysis, have been used more frequently as they are less complex and have lower data requirements. Benefit incidence analysis helps to clarify whether expenditure components indeed reach their intended beneficiary. They are typically used to assess the efficiency and equity of the al-location of resources within sectors and, to a very limited extend, across sectors. A strand of the bene-fit incidence literature has attempted to gauge the net impact of government interventions, combining both the expenditure and tax incidence to estimate the net incidence of fiscal policy.49 49 See for example Toye and Jackson (1996).

Exploring the Link Between Public Spending and Poverty Reduction 35
However, each of these tools has severe limitations 50 and rather than using one approach it may be useful to draw from various tools and techniques to get a more comprehensive view on the potential return of alternative allocations of public resources.51 Therefore, to provide a better understanding of the impact of public investment across sectors, it may be useful to complement regression analysis with general-equilibrium in order to allow the analysis go beyond a specific sector focus. For example, in Fan et al. the objective would be to analyze not only how government investments affect the agri-cultural sector and rural areas, but also the other sectors and urban areas. Moreover, adding benefit incidence analysis would allow us to determine who benefits from the increased public spending.
50 For the limitations of incidence analysis see Demery (2003) and for in country regressions see Klitgaard (2004). 51 This approach was used in the work of Mosley, Hudson and Verschoor (2004) when trying to construct a “pro-poor expenditure index”. Using four different methods (benefit incidence, labor intensity, regression and CGE) they try to establish in which sectors the expansion of expenditures is likely to be poverty reducing.

36 Wilhelm and Fiestas
ANNEX 3 Statistical appendix
Table 1a: Budget allocation as a share of total GDP1985-1989 1995-1999
Bangladesh 9.60% 12.70%Bolivia 8.86% 15.79%Brazil 23.12% 11.02%El Salvador 13.52% 11.95%India 16.46% 15.05%Romania 32.52% 18.70%Tunisia 31.21% 25.73%Uganda 11.59% 17.47%Zambia 26.15% 19.92%Median 16.46% 15.79%Average 19.22% 16.48%
Table 1b: Level of total per capita budget allocation1985-1989 1995-1999
Bangladesh 25.66 45.52Bolivia 71.42 146.91Brazil 986.97 499.41El Salvador 179.75 203.89India 47.17 62.62Romania 619.23 286.90Tunisia 541.44 564.87Uganda 25.25 57.80Zambia 132.63 79.89Median 132.63 113.40Average 292.17 187.61
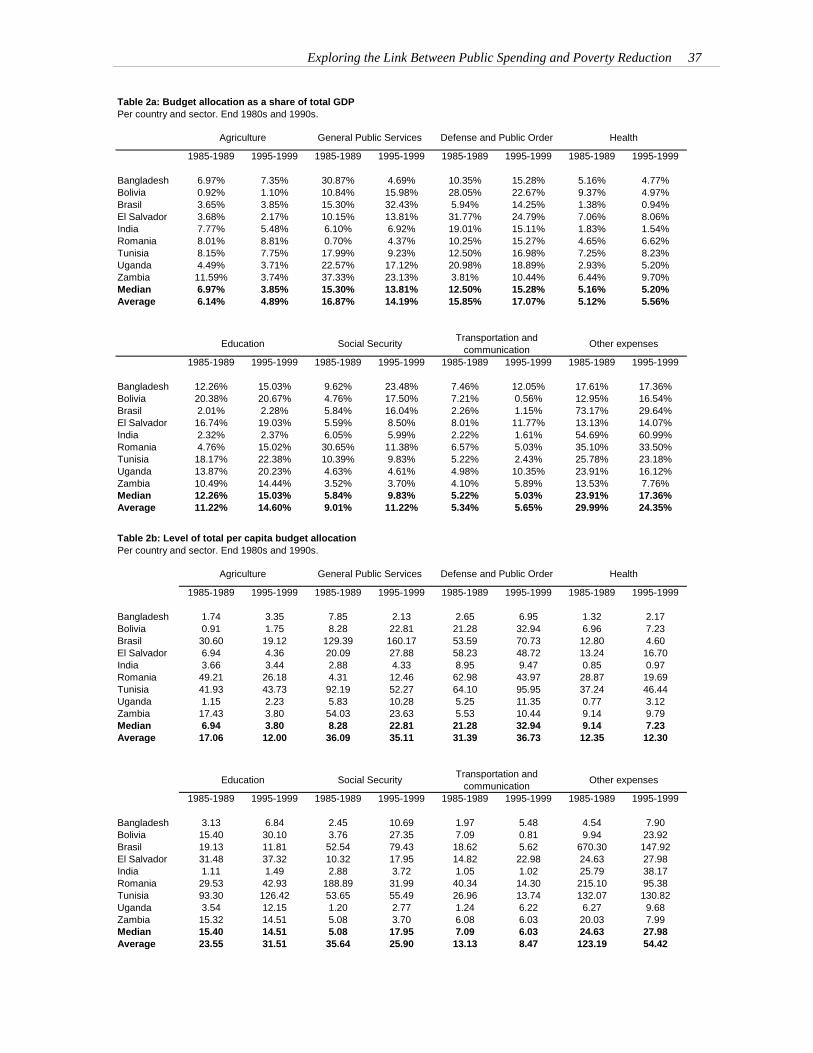
Exploring the Link Between Public Spending and Poverty Reduction 37
Table 2a: Budget allocation as a share of total GDP Per country and sector. End 1980s and 1990s.
1985-1989 1995-1999 1985-1989 1995-1999 1985-1989 1995-1999 1985-1989 1995-1999
Bangladesh 6.97% 7.35% 30.87% 4.69% 10.35% 15.28% 5.16% 4.77%Bolivia 0.92% 1.10% 10.84% 15.98% 28.05% 22.67% 9.37% 4.97%Brasil 3.65% 3.85% 15.30% 32.43% 5.94% 14.25% 1.38% 0.94%El Salvador 3.68% 2.17% 10.15% 13.81% 31.77% 24.79% 7.06% 8.06%India 7.77% 5.48% 6.10% 6.92% 19.01% 15.11% 1.83% 1.54%Romania 8.01% 8.81% 0.70% 4.37% 10.25% 15.27% 4.65% 6.62%Tunisia 8.15% 7.75% 17.99% 9.23% 12.50% 16.98% 7.25% 8.23%Uganda 4.49% 3.71% 22.57% 17.12% 20.98% 18.89% 2.93% 5.20%Zambia 11.59% 3.74% 37.33% 23.13% 3.81% 10.44% 6.44% 9.70%Median 6.97% 3.85% 15.30% 13.81% 12.50% 15.28% 5.16% 5.20%Average 6.14% 4.89% 16.87% 14.19% 15.85% 17.07% 5.12% 5.56%
1985-1989 1995-1999 1985-1989 1995-1999 1985-1989 1995-1999 1985-1989 1995-1999
Bangladesh 12.26% 15.03% 9.62% 23.48% 7.46% 12.05% 17.61% 17.36%Bolivia 20.38% 20.67% 4.76% 17.50% 7.21% 0.56% 12.95% 16.54%Brasil 2.01% 2.28% 5.84% 16.04% 2.26% 1.15% 73.17% 29.64%El Salvador 16.74% 19.03% 5.59% 8.50% 8.01% 11.77% 13.13% 14.07%India 2.32% 2.37% 6.05% 5.99% 2.22% 1.61% 54.69% 60.99%Romania 4.76% 15.02% 30.65% 11.38% 6.57% 5.03% 35.10% 33.50%Tunisia 18.17% 22.38% 10.39% 9.83% 5.22% 2.43% 25.78% 23.18%Uganda 13.87% 20.23% 4.63% 4.61% 4.98% 10.35% 23.91% 16.12%Zambia 10.49% 14.44% 3.52% 3.70% 4.10% 5.89% 13.53% 7.76%Median 12.26% 15.03% 5.84% 9.83% 5.22% 5.03% 23.91% 17.36%Average 11.22% 14.60% 9.01% 11.22% 5.34% 5.65% 29.99% 24.35%
Other expensesSocial Security Transportation and communication
Agriculture Defense and Public Order Health
Education
General Public Services
Table 2b: Level of total per capita budget allocationPer country and sector. End 1980s and 1990s.
1985-1989 1995-1999 1985-1989 1995-1999 1985-1989 1995-1999 1985-1989 1995-1999
Bangladesh 1.74 3.35 7.85 2.13 2.65 6.95 1.32 2.17Bolivia 0.91 1.75 8.28 22.81 21.28 32.94 6.96 7.23Brasil 30.60 19.12 129.39 160.17 53.59 70.73 12.80 4.60El Salvador 6.94 4.36 20.09 27.88 58.23 48.72 13.24 16.70India 3.66 3.44 2.88 4.33 8.95 9.47 0.85 0.97Romania 49.21 26.18 4.31 12.46 62.98 43.97 28.87 19.69Tunisia 41.93 43.73 92.19 52.27 64.10 95.95 37.24 46.44Uganda 1.15 2.23 5.83 10.28 5.25 11.35 0.77 3.12Zambia 17.43 3.80 54.03 23.63 5.53 10.44 9.14 9.79Median 6.94 3.80 8.28 22.81 21.28 32.94 9.14 7.23Average 17.06 12.00 36.09 35.11 31.39 36.73 12.35 12.30
1985-1989 1995-1999 1985-1989 1995-1999 1985-1989 1995-1999 1985-1989 1995-1999
Bangladesh 3.13 6.84 2.45 10.69 1.97 5.48 4.54 7.90Bolivia 15.40 30.10 3.76 27.35 7.09 0.81 9.94 23.92Brasil 19.13 11.81 52.54 79.43 18.62 5.62 670.30 147.92El Salvador 31.48 37.32 10.32 17.95 14.82 22.98 24.63 27.98India 1.11 1.49 2.88 3.72 1.05 1.02 25.79 38.17Romania 29.53 42.93 188.89 31.99 40.34 14.30 215.10 95.38Tunisia 93.30 126.42 53.65 55.49 26.96 13.74 132.07 130.82Uganda 3.54 12.15 1.20 2.77 1.24 6.22 6.27 9.68Zambia 15.32 14.51 5.08 3.70 6.08 6.03 20.03 7.99Median 15.40 14.51 5.08 17.95 7.09 6.03 24.63 27.98Average 23.55 31.51 35.64 25.90 13.13 8.47 123.19 54.42
Education Social Security Transportation and communication Other expenses
Agriculture General Public Services Defense and Public Order Health
38 Wilhelm and Fiestas
Bibliography Afonso, A. L. Schuhknecht and V. Tanzi, 2003, “Public Sector Efficiency: An International Compari-
son”. Working paper 242, European Central Bank, Frankfurt. Ahmed, A. U., and C. del Ninno, 2002, “The Food for Education Program in Bangladesh: An Evalua-
tion of its Impact on Educational Attainment and Food Security”, IFPRI Food Consumption and Nutrition Division Discussion paper no. 138
Ahmed A.U., C. del Ninno, and O. H. Chowdhury, 2004, “Investing in Children through the Food for
Education Program,” in Dorosh, P. et al (eds.), The 1998 Floods and Beyond: Towards Com-prehensive Food Security in Bangladesh, The University Press Limited.
Ahmed, A.U. and K.Billah, 1994, Food for Education in Bangladesh: An Early Assessment. FMRSP-
IFPRI, Dhaka. Al-Faris, A. F., 2002, “Public Expenditure and Economic Growth in the Gulf Cooperation Council
Countries,” Applied Economics (UK), Vol. 34, No. 9. Asian Development Bank, 2002, “Impact of Rural Roads on Poverty Reduction: A Case Study Based
Analysis,” ADB Operations Evaluation Department, Manila. Aschauer, D., 1989, “Is public expenditure productive?”, Journal of Monetary Economics, 23. Azfar, O., 2004, “Institutions and Poverty Reduction”, mimeo, World Bank. Paper prepared for the
OPPG Work Program. Barro, J.R. ,1990, “Government spending in simple model of endogenous growth”, Journal of politi-
cal economy, 20 (2). Barro, Robert J. and Jong-Wha Lee, 2004, “International Data on Educational Attainment: Updates
and Implications”, CID Working Paper no. 42, Center for International Development at Har-vard University.
Besley and Case, "Incumbent Behavior: Vote Seeking, Tax Setting, and Yardstick Competition,"
American Economic Review, 85:1 (1995), pp.25-45. Besley, T., R. Burgess, and B. Esteve-Volart, 2004, “Operationalising Pro-Poor Growth: India Case
Study”. Paper prepared for the OPPG Work Program. Bourguignon, F., F. Ferreira, and P. Leite, 2002, “Ex-Ante Evaluation of Conditional Cash Transfer
Programs: The Case of Bolsa Escola”. World Bank, Washington D.C. Chaudhury, N. and J. S. Hammer, 2003, “Ghost Doctors - Absenteeism in Bangladeshi Health Facili-
ties,” Policy Research Working Paper 3065. Dabla-Morris E. and J. M. Matovu, 2002, “Composition of Government Expenditures and Demand for
Education in Developing Countries”, IMF Working Paper 02/78, Washington DC.

Exploring the Link Between Public Spending and Poverty Reduction 39
Datt, G. and M. Ravallion, 2002, “Is India’s Economic Growth Leaving the Poor Behind?”, Journal of Economic Perspectives, Vol. 16.
De Ferranti, D., G. E. Perry, F. Ferreira, and M. Walton, 2004, “Inequality in Latin America, Breaking
with History?,” World Bank Latin American and Caribbean Studies, Chapter 9. The World Bank, Washington DC.
Dehn, J., R. Reinikka, and J. Svensson, 2003, “Survey Tools for Assessing Performance in Service
Delivery,” in Bourguignon, Francois and Luiz A. Pereira da Silva, eds, The impact of eco-nomic policies on poverty and income distribution: evaluation techniques and tools. The World Bank, Washington DC.
Demery, L., 2003, “Analyzing the Incidence of Public Spending,” in Bourguignon, Francois and Luiz
A. Pereira da Silva, eds, The impact of economic policies on poverty and income distribution: evaluation techniques and tools. The World Bank, Washington DC.
Demery, L., 2004a, “Public spending, quality of life and pro-poor growth. Overview of 14 case study
countries”, mimeo, World Bank. Demery, L., 2004b, “Public spending and pro-poor growth in Uganda”, mimeo, World Bank. Devarajan, S., V. Swaroop, and H. Zou, 1997, “The composition of public expenditure and economic
growth”. Journal of Monetary Economics, 37. Dollar, D. and A. Kraay, 2002, “Growth is Good for the Poor,” Journal of Economic Growth, 7, 195-
225. Dritsakis, N. and A. Adamopoulos, 2004, “A Causal Relationship between Government Spending and
Economic Development: an Empirical Examination of the Greek Economy,” Applied Econom-ics (UK), Vol. 36, No. 5: pp. 457-464.
Easterly, W. and L. Serven, 2003, The Limits of Stabilization: Infrastructure, Public Deficits, and Growth in Latin America, Stanford University Press.
Economic Commission for Latin America and the Caribbean, 2001, Panorama Social 2000-2001.
Santiago: ECLAC. Fan S. and P. Hazel, 2001, “Returns to Public Investments in the Less-favored Areas of India and
China”, American Journal of Agricultural Economics, Vol. 83(5). Fan S., P.L.Huong, and T.Q. Long, 2004, “Government spending and poverty reduction in Vietnam”,
International Food Policy Research Institute, Washington, DC. Fan S., P. Hazel, S. Thorat, 1999, “Linkages between Government Spending, Growth, and Poverty in
Rural India”, Research Report 110, International Food Policy Research Institute, Washington DC.
Fan, S., and N. Rao. 2003, “Public Spending in Developing Countries: Trend, Determination and Im-
pact” EPTD Discussion Paper No. 99, International Food Policy Research Institute, Washing-ton, DC.

40 Wilhelm and Fiestas
Fan S., X. Zhang, and N. Rao, 2004, “Public Expenditure, Growth, and Poverty Reduction in Rural Uganda”, DSGD Discussion Paper 4, International Food Policy Research Institute, Washing-ton, DC.
Fozzard, A., 2001, “The Basic Budgeting Problem, Approaches to Resource Allocation in the Public
Sector and their Implications for Pro-Poor Budgeting,” Working Paper No. 147, Overseas De-velopment Institute, London.
Gomanee, K., O. Morrissey, P. Mosley and A. Verschoor, 2003, “Aid, Pro-Poor Government Spend-
ing and Welfare”. CREDIT Research Paper No. 03/03, University of Nottingham. Herrera, S. and G. Pang, 2004, “Efficiency of Public Spending in Developing Countries: An Effi-
ciency Frontier Approach”, mimeo, World Bank. Internal Monetary Fund, 2004, “Public Investment and Fiscal Policy,” IMF Board Paper, International
Monetary Fund, Washington DC. Jung, H.S. and E. Thorbecke, 2003, “The Impact of Public Education Expenditure on Human Capital,
Growth, and Poverty in Tanzania and Zambia: A General Equilibrium Approach”, Journal of Policy Modeling, Vol. 25(8) (November).
Key, V. O., 1940, “The Lack of a Budget Theory,” American Political Science Review 34 (6):
pp.1137-1144. Klitgaard, R., 2004, “On Infrastructure and Development,” Document prepared for the Planning
Workshop “Infrastructure in East Asia: The Way Forward”. Manila, January 2004. Knack, S., 2001, “Security of Property Rights and “Pro Poor” growth”, mimeo, World Bank . Leipziger, D., M. Fay, Q. Wodon, and T. Yepes, 2003, “Achieving the Millennium Development
Goals, The Role of Infrastructure,” Policy Research Paper No. 3163. The World Bank, Wash-ington DC.
Lofgren and Robinson, 2004, “Public Spending, Growth and Poverty Alleviation in Sub-Saharan Af-
rica: A Dynamic General Equilibrium Analysis”. Mimeo, International Food Policy Research Institute, Washington, D.C.
Lopez, R., V. Thomas, and Y. Wang, 1998, “Addressing the Education Puzzle: The Distribution of
Education and Economic Reform,” Policy Research Working Paper No. 2031. The World Bank, Washington D.C.
Lundberg M. and L. Squire, 2003, “The Simultaneous Evolution of Growth and Inequality,” The Eco-
nomic Journal, 2003, 113, 326-344. Menezes-Filho, N., 2004, “Has Economic Growth Been Pro-Poor in Brazil? Why?”, Paper prepared
for the OPPG Work Program. Mosley, P., J. Hudson, and A. Verschoor, 2004, “Aid, Poverty Reduction and the ‘New Condition-
ality’,” The Economic Journal, 114 (June), F217-243, Royal Economic Society, Oxford.
Exploring the Link Between Public Spending and Poverty Reduction 41
Nkusu, M., 2004, “Financing Uganda’s Poverty Reduction Strategy: Is Aid Causing More Pain than Gain?,” IMF Working Paper 04/170, International Monetary Fund, Washington DC.
Paternostro, S., A. Rajaram, and E. R. Tiongson, 2005, “How Does the Composition of Public Spend-
ing Matters?,” Policy Research Working Paper 3555, The World Bank, Washington DC. Perotti, R., 1999, “Fiscal Policies in Good Times and Bad,” Quarterly Journal of Economics, Novem-
ber 1999, vol. 114, no. 4. Peters, D., A. Yazbeck, R. Sharma, G. Ramana, L. Pritchett, and A. Wagstaff, 2002, “Better Health
Systems for India’s Poor: Findings, Analysis, and Options,” Health, Nutrition, and Population Series. The World Bank, Washington DC.
Rahman, A. G. Kisunko and K. Kapoor, 2000, “Estimating the Effect of Corruption”. Policy Research
Working paper 2479, The World Bank, Washington DC. Ravallion, M. and G. Datt, 1999, “When Is Growth Pro-Poor? Evidence from the Diverse Experiences
of India’s States,” Policy Research Working Paper No. 2263. The World Bank, Washington DC.
Ravaillon, M. and Q. Wodon, 2000, Does Child Labor Displace Schooling? Evidence on Behavioral
Responses to an Enrolment Subsidy, Economic Journal, Vol. 110 (462): 158-175. Reinikka, R. and J. Svensson, 2001, “Explaining Leakage of Public Funds,” Policy Research Working
Paper 2709. The World Bank, Washington DC. Sen, B., 2004, “Operationalizing Pro-Poor Growth: Bangladesh as a case study”. Paper prepared for
the OPPG Work Program. Tanzi, V. and H. Zee, 1997, Fiscal policy and long-run growth. IMF staff papers 44(2): 179-209.
United Nations Educational and Scientific Cultural Organizations Institute for Statistics, De-cember 1999 (Http:/unescostat.unesco.org)
Thomas, V., M. Dailami, A. Dhareshwar, D. Kaufmann, N. Kishor, R. López, and Y. Wang, 2000,
The Quality of Growth, The World Bank and Oxford University Press. Timmer, P., 2004, “Operationalizing Pro-Poor Growth: Indonesia”. Paper prepared for the OPPG
Work Program. Toye, J. and C. Jackson, 1996, “Public Expenditure Policy and Poverty Reduction,” IDS Bulletin,
Vol. 27, No. 1. Trivedi, K., 2002, “Educational Human Capital and Levels of Income: Evidence from States in India,
1965-92”, mimeo, University of Oxford. Van de Walle , D., 1996, “Infrastructure and Poverty in Vietnam”, LSMS Study WP 121. The World
Bank, Washington DC. Van de Walle, D., 2000, “Choosing rural road investments to help reduce poverty”, Policy Research
Working Paper 2458. The World Bank, Washington DC.
42 Wilhelm and Fiestas
Vedder, R. K. and L. E. Gallaway, 1998, “Government Size and Economic Growth,” prepared for the Joint Economic Committee, University of Ohio.
Wilhelm, V., 2004, Public Spending for Poverty Reduction in Bangladesh, mimeo, World Bank. Williamson, T. and S. Canagarajah, 2003, “Is There a Place for Virtual Poverty Funds in Pro-Poor
Public Spending Reform? Lessons from Uganda’s PAF,” Development Policy Review, Vol. 21, No. 4: pp. 449-480.
World Bank, 1990, Poverty, World Development Report. The World Bank, Washington DC. _____, 1993, East Asian Miracle . The World Bank, Washington DC. _____, 1994, Infrastructure for Development, World Development Report . The World Bank, Wash-
ington DC. _____, 1996, Bangladesh: Rural Infrastructure Strategy Study, University Press Limited, Dhaka. World Bank, 2003, Brazil - Inequality and Economic Development, Report No. 24487-BR. Washing-
ton DC. _____, 2004a, Making Services Work for Poor People, World Development Report. World Bank,
Washington DC. _____, 2004b, Books Buildings, and Learning Outcomes, OED, World Bank, Washington D.C. _____, 2005a, A Better Investment Climate for Everyone, World Development Report . The World
Bank, Washington DC. _____, 2005b, Update on the Assessments and Implementation of Action Plans to Strengthen Capacity
of HIPCs to Track Poverty-Reducing Public Spending, Document prepared by the IMF’s Fis-cal Affairs Department and the World Bank’s Poverty Reduction and Economic Management Group. Washington, D.C.