exploring the value of energy disaggregation through...
TRANSCRIPT

Nipun Batra, Amarjeet Singh, Kamin Whitehouse14 May 2016
Exploring The Value of Energy Disaggregation
through actionable feedback
1

General eco feedback vs Actionable Feedback
Eco feedback
Misc.22%
Light10%
Fridge11%
HVAC56%

General eco feedback vs Actionable Feedback
Eco feedback
Misc.22%
Light10%
Fridge11%
HVAC56%

General eco feedback vs Actionable Feedback
Eco feedback
Misc.22%
Light10%
Fridge11%
HVAC56%
Pow
er (
W)
0175350525700
Pow
er (
W)
0175350525700
Home 1
Home 2
Actionable feedback
Fridge consumption over 24 hours
Misc.22%
Light10%
Fridge11%
HVAC56%

General eco feedback vs Actionable Feedback
Eco feedback
Misc.22%
Light10%
Fridge11%
HVAC56%
Pow
er (
W)
0175350525700
Pow
er (
W)
0175350525700
Home 1
Home 2
Actionable feedback
Fridge consumption over 24 hours
Misc.22%
Light10%
Fridge11%
HVAC56%
High power state

General eco feedback vs Actionable Feedback
Eco feedback
Misc.22%
Light10%
Fridge11%
HVAC56%
Pow
er (
W)
0175350525700
Pow
er (
W)
0175350525700
Home 1
Home 2
Actionable feedback
Fridge consumption over 24 hours
Misc.22%
Light10%
Fridge11%
HVAC56%
High power state
High power state

General eco feedback vs Actionable Feedback
Ecofeedback
Misc.22%
Light10%
Fridge11%
HVAC56%
Pow
er (
W)
0175350525700 Home 2
Actionable feedback
Fridge consumption over 24 hours
Your fridge defrosts too much, wasting 30% energy
Misc.22%
Light10%
Fridge11%
HVAC56%

Approach overview- How to give feedbackPo
wer
(W
)
0
175
350
525
700
Specific features of trace to infer why energy usage is high
Length of duty cycles

Approach overview- How to give feedbackPo
wer
(W
)
0
175
350
525
700
Specific features of trace to infer why energy usage is high
Actual power value

Feedback methods on Fridge and HVAC
Both appliances commonly found across homes
Others38%
Fridge8%
HVAC54%

Evaluation overviewSubmetered
traces
Pow
er
(W)
0350700
Submeter sensor

Can we give such feedback?Disaggregated
traces
Pow
er
(W)
0350700
NILM
Householdaggregate
Submetered traces
Pow
er
(W)
0350700
Submeter sensor
020004000
020004000
Smart meter

Do disaggregated traces provide features needed for providing feedback?
Disaggregated traces
Pow
er
(W)
0350700
NILM
Householdaggregate
Submetered traces
Pow
er
(W)
0350700
Submeter sensor
020004000
020004000
Smart meter

0
125
250
375
500
Fridge is a duty cycle based appliance; compressor turns ON and OFF
periodically

Defrost cycles occurs periodically and consume high amount of power
0
125
250
375
500

0
125
250
375
500
Defrost introduces heat increasing ON duration of next cycles

Fridge usage increases compressor ON durations (and reduce compressor OFF
durations)
0
125
250
375
500

Night hours typically have “baseline” usage
0
175
350
525
700Baseline duty % = Median
duty % in the night

Defrost energy
0
175
350
525
700
Defrost energy = Energy consumed in defrost state + Extra energy consumed in next few compressor cycles

Defrost energy
0
175
350
525
700
Defrost energy = Energy consumed in defrost state + Extra energy consumed in next few compressor cycles

Usage energy
0
175
350
525
700
Usage energy = Extra energy consumed over
baseline

Experimental setupWiki Energy data set
1. 97 fridges2. 58 HVAC

13 out of 95 homes can be given feedback based on usage energy saving
upto 23% fridge energy

13 out of 95 homes can be given feedback based on usage energy saving
upto 23% fridge energy
NILM algorithms show poor accuracy in identifying homes which can be given feedback based on usage energy

17 out of 95 homes can be given feedback on excess defrost saving upto
25% fridge energy

Such feedback can’t be given with disaggregated traces, since these techniques
fare poorly on defrost detection.

Benchmark NILM algorithms on our data set give accuracy comparable or better than
state-of-the-artKolter 2012
Parson 2012Parson 2014
Batra 2014CO
FHMMHart
Error Energy %
0 17.5 35 52.5 70

0
125
250
375
500
“Average” error in energy would be low even if NILM predicted this
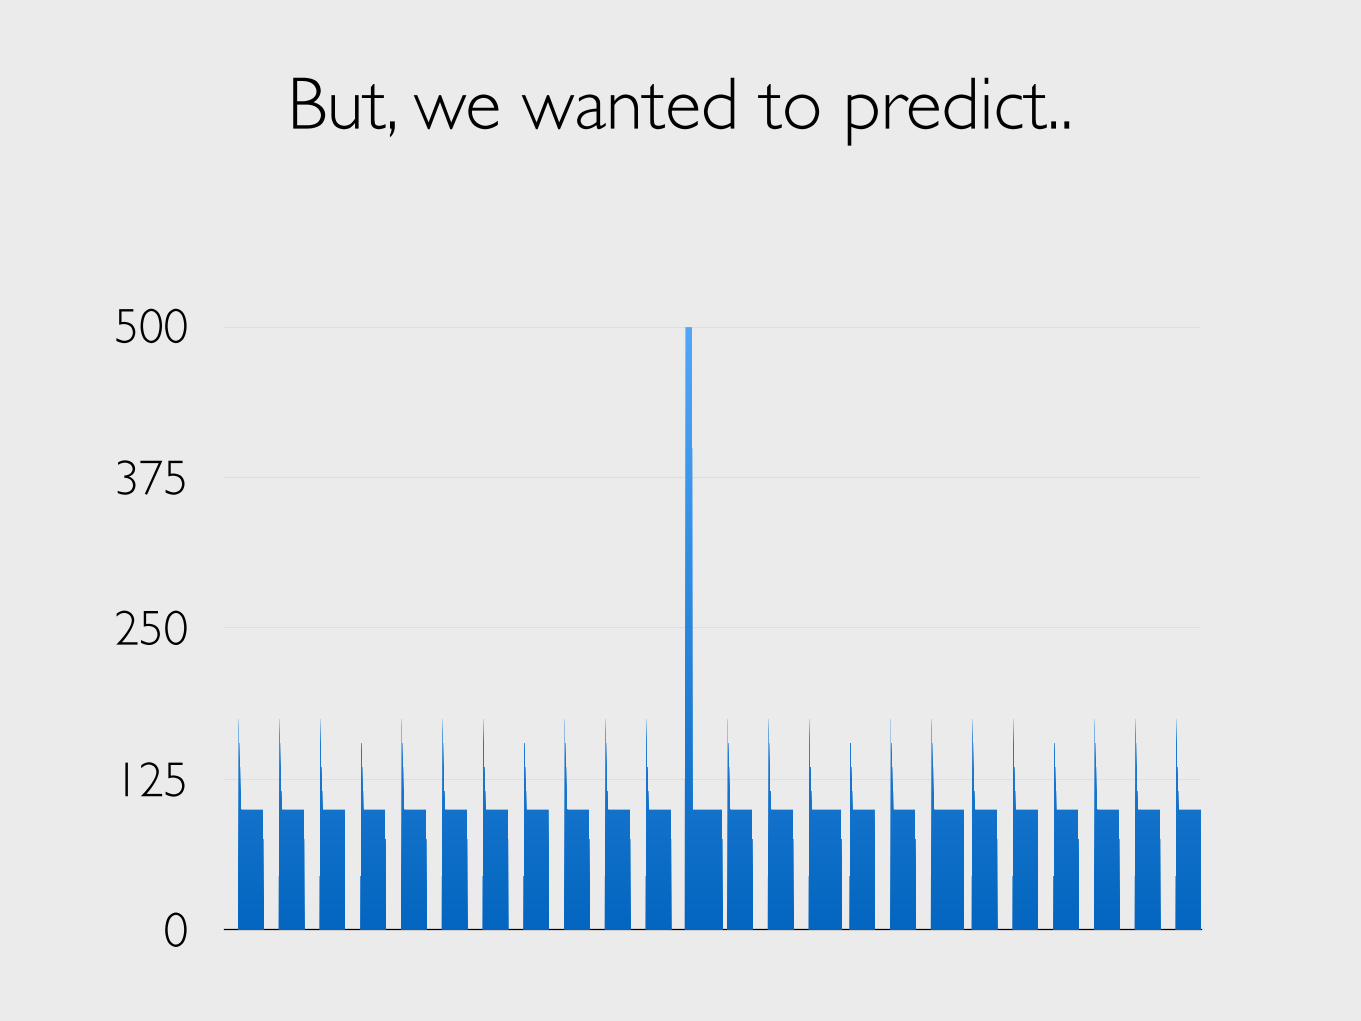
But, we wanted to predict..
0
125
250
375
500

It’s the details that we care about
0
125
250
375
500

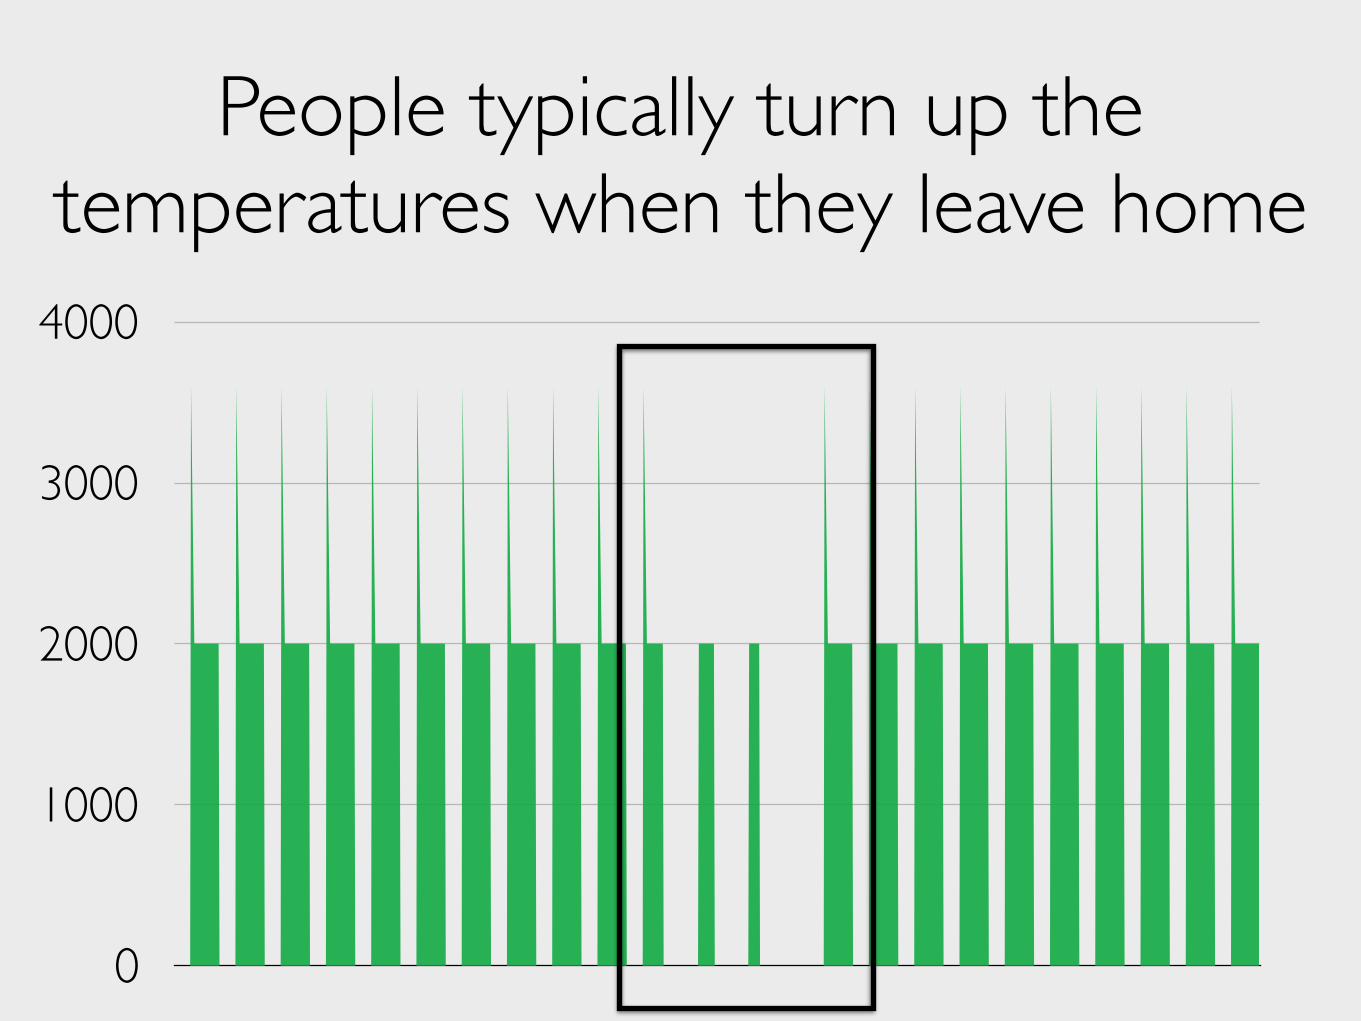
Like fridge, HVAC duty cycles to maintain the set temperature
0
1000
2000
3000
4000

As temperature increases during the day, more energy required to cool the home
0
1000
2000
3000
4000
0
1000
2000
3000
4000
People typically turn up the temperatures when they leave home

Reco
mm
ende
d M
in. Te
mp
(F)
7779818385
2 4 6 8 10 12 14 16 18 20 22 24
EnergyStar.gov recommended HVAC setpoint schedule
Sleep Morning Work Evening

Reco
mm
ende
d M
in. Te
mp
(F)
7779818385
2 4 6 8 10 12 14 16 18 20 22 24
Setpoint schedule score
Sleep Morning Work Evening

Reco
mm
ende
d M
in. Te
mp
(F)
7779818385
2 4 6 8 10 12 14 16 18 20 22 24
Setpoint schedule score
Sleep
Sleep score = 1 if sleep temp. > 82, (82-temp.)/4 if 78<sleep temp. <82 0 otherwise

Learning HVAC setpoint
01000200030004000
7785
5 10 15 20
HVAC trace
Weather
Learnt setpoint

Giving feedback
7785
5 10 15 20
Features from HVAC trace
6975
5 10 15 200
1000200030004000
7785
5 10 15 20
Learnt setpointDon’t need feedback
Need feedback

84% accuracy on giving feedback using submetered traces
39

NILM methods give 15-30% worse accuracy for feedback
40

Benchmark NILM algorithms on our data set give accuracy comparable or better than
state-of-the-art
Batra 2014
CO
FHMM
Hart
Error Energy %
0 7.5 15 22.5 30

Erro
r in
pred
ictio
n of
m
inute
s of H
VAC
usag
e (%
)
0
6
12
18
24
Hart FHMM CO
NightMorning
Morning hours which have lesser NILM accuracy are important for HVAC feedback

Conclusions
Appliance level data does enable actionable energy saving feedback

Conclusions
Appliance level data does enable actionable energy saving feedback
BUT Results show that we need to revisit the metrics by which we measures progress