exploring trade dynamics between russia and turkey - denis varaksin - icis base oil london 2016
TRANSCRIPT
EXPLORING TRADE DYNAMICS
BETWEEN RUSSIA AND TURKEY
Denis Varaksin
Base Oils and Slack Wax Project Manager
DYM Resources GmbH
The 20th ICIS World Base Oils & Lubricants Conference
17-19 February 2016 London, UK
2
AgendaPresentation key points
Friends of FoesComplicated relationships between Russia
and Turkey, impact on base oils flows
DYM Resources GmbH
Niche oil products supplies
New Group II and III productionTaneco refinery startup review, running rates
and export routes
Russian market overviewRussian base oils capacities & closures
Export routes and dynamics
Modernisation plansRussian refineries modernisation plans and
impact on future base oils exports
N.Novgorod shut down impactConsequences of latest base oils unit closure,
refinery place in Russian base oil universe
CIS refinery reviewTurkembashi, Fergana, Baku and Naftan
refineries summary

3
Russia vs TurkeyMacroeconomics comparison of ex-friends
Turkey
• Population 78 mln
• GDP $722 bl
• GDP growth: + 4.2%
• Car sales: +26%
• Industrial growth: +4.4%
Russia
• Population: 146 mln
• GDP: $1236 bl
• GDP growth: -3.7% (decline)
• Car sales: -36% (decline)
• Industrial growth: -3.4% (decline)

Problem beginningTurkey took down Russian bomber Su-24,
that violated Turkey airspace for 17 seconds
according to Turkey.
Seventeen seconds awayPolitics impact on trade flows
2015
4
•Russia and Turkey had 12 wars, from 1568 to 1918 two countries were fighting each other for 69 years in total•Turkey is number one holiday destination for Russian tourists as well as big consumer of Russian Oil & Gas
AftermathRussia imposed sanctions against Turkish
companies working in Russia
Sanctions limited trading of fruits and vegetables (Turkey
accounted for 4% of Russian imports). Oil and gas trade was
not sanctioned, but some difficulties occurred for money
transfers and dealing with Turkish companies. Additional
sanctions may be imposed from both sides
2016
24 November
5
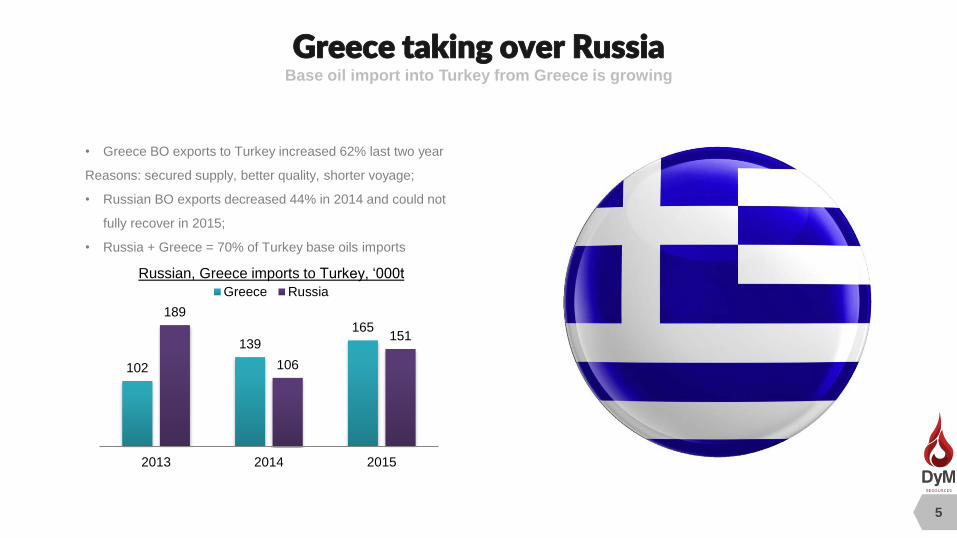
Greece taking over RussiaBase oil import into Turkey from Greece is growing
• Greece BO exports to Turkey increased 62% last two year
Reasons: secured supply, better quality, shorter voyage;
• Russian BO exports decreased 44% in 2014 and could not
fully recover in 2015;
• Russia + Greece = 70% of Turkey base oils imports
PERANCIS
SPANYOL
102
139
165189
106
151
2013 2014 2015
Russian, Greece imports to Turkey, ‘000t
Greece Russia

6
Russia & CIS base oils market recapLukoil is by far biggest base oil producer
Active producers
• Russia & CIS have 3mln tons per year capacity
• 90%+ is Group I mineral oils
• Since 2010 closed 1.1 mln t/yr BO units
• Plants located far from export outlets
Recent shutdowns
Producer Location Capacity, 000t/yr
Lukoil Volgograd 550
Lukoil Perm 440
Rosneft Novokuibyshevsk 350
Rosneft Angarsk 250
Rosneft/Gazprom Yaroslavl 250
Gazprom Omsk 240
Bashneft Ufa 220
Tatneft Nizhnekams 190
Uzbekneftegaz Fergana 200
Naftan Novopolotsk 195
Azerneftyag Baku 100
TRC Turkmenbashi 80
Location Date of closure Capacity, 000t/yr
Ryazan 2010 280
Orsk end of 2012 195
Kremenchug early 2012 370
N.Novgorod 2Q 2015 250

7
Russian base oils exports dynamicsRussian base oils export fell 13% in 2015
1,44
1,30
1,151,23
1,08
0,94
0,7
0,8
0,9
1
1,1
1,2
1,3
1,4
1,5
2010 2011 2012 2013 2014 2015
-13%
Key facts:
• Export dropped at highest pace since 2009
• Exports fell both by rail and river means of transport
• Volumes dropped 35% since 2010 despite rebound in 2013
• Russia is loosing presence in South-East Asia, India, UAE
Reasons:
• Lower demand from export markets
• Strong domestic demand due to import replacement
• Perm refinery faced production issues
• N.Novgorod base oil unit closure
-12%
+7%
-12%
-10%
8
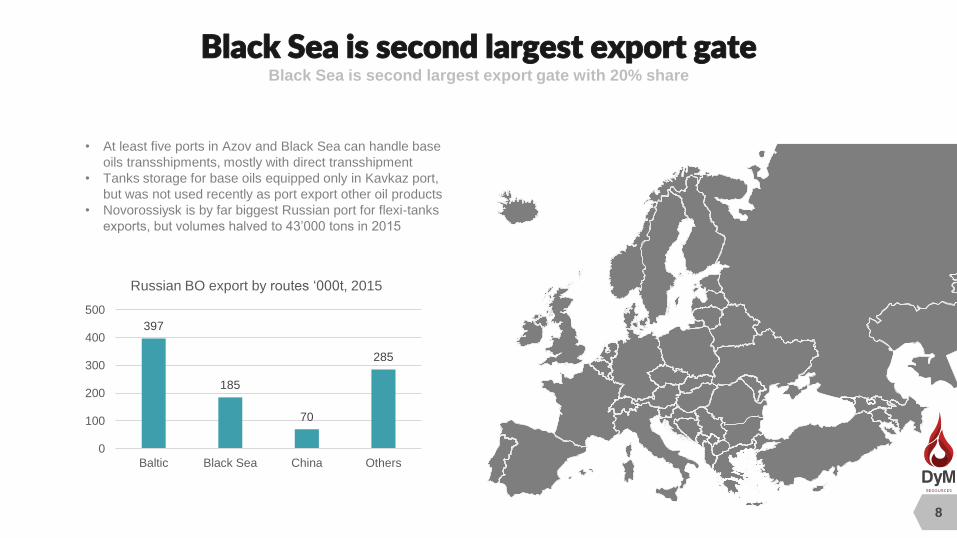
Black Sea is second largest export gateBlack Sea is second largest export gate with 20% share
• At least five ports in Azov and Black Sea can handle base
oils transshipments, mostly with direct transshipment
• Tanks storage for base oils equipped only in Kavkaz port,
but was not used recently as port export other oil products
• Novorossiysk is by far biggest Russian port for flexi-tanks
exports, but volumes halved to 43’000 tons in 2015
PERANCIS
SPANYOL
397
185
70
285
0
100
200
300
400
500
Baltic Black Sea China Others
Russian BO export by routes ‘000t, 2015

Russian BO export5 refineries controls 80% of BO export
9
GazpromActively decreasing
exports and focusing on
domestics finished lubes
market and CIS countries.
LukoilExport share decreased to
less than 50%, had to
change logistic scheme in
Back Sea due to sanctions
against Theodosia port, not
exporting through floating
storage
RosneftNovokuibyshevsk refinery exports
to CIS and Baltic. Angarsk
normally loads to China, but
was actively exporting to Baltic
Sea and Ukraine due to weak
China demand in 2015.
Volgograd35%
Novokuibyshevsk12%Omsk
11%
Perm11%
Angarsk11%
Yaroslavl4%
Ufa3%
Taneco0.5%
Others13%
Russian base oils export by refineries, 2015

10
Volgograd: Russian giant guarding Black Sea Biggest Russian base oils unit supplies to Turkey
• Volgograd 550’000 base oils unit is the biggest in Russia and CIS
• Refinery exports mainly SN 150, SN 500 and SN 900
• Only refinery in Russia exporting by river (Volgo-Don channel)
• Lukoil produces group III base oils in Volgograd (55’000t/yr
capacity, very high viscosity index, but has color)
Plant info
386
403
423
385
326
300
350
400
450
2011 2012 2013 2014 2015
Vogograd base oils export, '000t
Latvia16%
Romania6%
River30%Temryuk
13%
Eisk7%
Novo11%
Ukraine11%
Finland1%
Others5%
Volgograd export by destinations

11
Lukoil shuts 250’000t per year base oil unitVictim of low margins and high competition
Production and exports stopped in April 2015
Refinery accounted for 17% of Lukoil BO output
N.Novgorod loaded mainly light SN 150 grade
N.Novgorod refinery
139
89
94
72
15
‘00
0 t
70
0
140
2011 2012 2013 2014 2015
Svetly70%
Latvia8%
Belorussia
7%
Ukraine6%
Lithuania4%
Novo 3%Others2%
N.Novgorod was exported 70% though Lukoil’s
terminal in port Svetly (Kaliningrad region)
About 3% went to Novorossiisk port for flexi
containers export
12
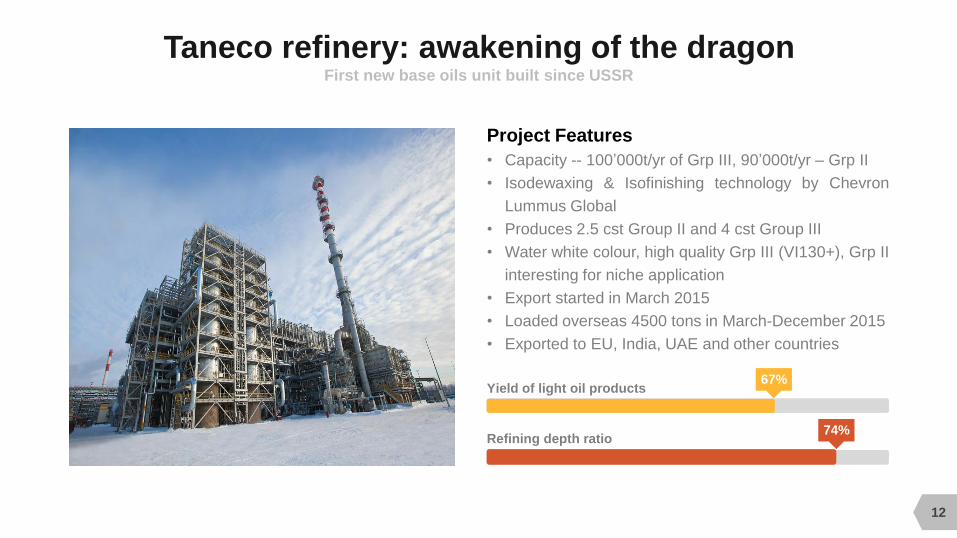
Taneco refinery: awakening of the dragonFirst new base oils unit built since USSR
• Capacity -- 100’000t/yr of Grp III, 90’000t/yr – Grp II
• Isodewaxing & Isofinishing technology by Chevron
Lummus Global
• Produces 2.5 cst Group II and 4 cst Group III
• Water white colour, high quality Grp III (VI130+), Grp II
interesting for niche application
• Export started in March 2015
• Loaded overseas 4500 tons in March-December 2015
• Exported to EU, India, UAE and other countries
Project Features
Yield of light oil products
Refining depth ratio
67%
74%

MODERNIZATION– WE WILL DO IT ONE DAY
13
Lukoil• Volgograd might be partly
convert to Group III by 2019,
• Perm scheduled to partly
partly to Grp II by 2021
Rosneft• Novokuibyyshevsk planned to
convert to Grp II/III by 2018
• Angarsk may add Group II
capacity by 2019/20
Gazprom• Yaroslavl* is undergoing
modernization to add Grp III
by 2017
• Omsk scheduled after 2021
BashneftBashneft at the moment has
no decided on its upgrading
program, most likely 3-5 years
production will be unchanged
*50% owned by Rosneft

14
Capacity to produce 80kt per year; average production of 2.5-3kt
of SN 180 and 2.5-3kt of SN 350 per month;
Group I+ product; almost Group II on new catalyst (VI above 100,
saturates 92+);
High Quality: bright color (0.5), low sulphur (below 0.03%), high
Viscosity Index;
Bulk cargo size from 1500mt to 3000mt, RTC parcels from 500
tons; exports to Iran, Central Asia and Black Sea;
Slack Wax production stopped in 2014, refinery is able to produce
up to 1500 tons of mixed slack wax per month;
3.7% tax for import into Turkey and Europe since Jan 2016;
Turkmenistan base oils :
hidden treasures
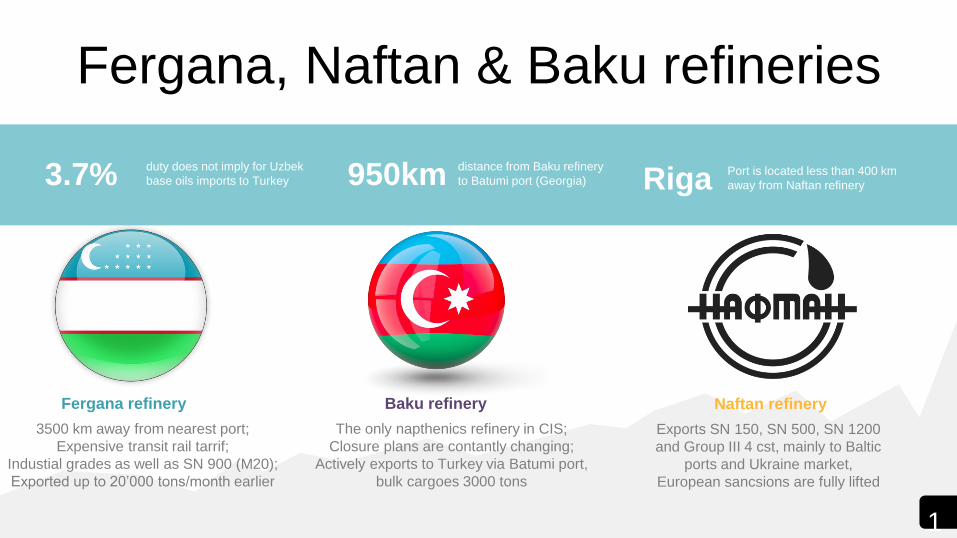
Fergana, Naftan & Baku refineries
3.7% duty does not imply for Uzbek
base oils imports to Turkey 950km distance from Baku refinery
to Batumi port (Georgia) Riga Port is located less than 400 km
away from Naftan refinery
Fergana refinery
3500 km away from nearest port;
Expensive transit rail tarrif;
Industial grades as well as SN 900 (M20);
Exported up to 20’000 tons/month earlier
Baku refinery
The only napthenics refinery in CIS;
Closure plans are contantly changing;
Actively exports to Turkey via Batumi port,
bulk cargoes 3000 tons
Naftan refinery
Exports SN 150, SN 500, SN 1200
and Group III 4 cst, mainly to Baltic
ports and Ukraine market,
European sancsions are fully lifted
1
5

16
DYM Resources GmbHNiche oil products supplies
Product rangeFocused on niche oil products: base oils
Group I, II and III; slack waxes;
petrochemicals; petroleum coke, etc.
Ideas to actions
LogisticsDoor to door services due to expertise with rail
tank cars, tanker loading, flexi and ISO tank
containers.
GeographyGeographic specialization: sourcing from
Russian Federation, CIS and Europe,
supplying globally.
Financing Financial flexibility to satisfy Producers and
support Buyers. Experienced with L/Cs, long-
term capital intense projects.
QualityHigh quality standards on all stages – from
product inspection at Producer’s plant up to
the unloading at Buyer’s facility.
LocationsHeadquarters in Berlin, Germany, although –
DYM team presence in Middle & Central Asia,
Central and Eastern Europe.

FEEL FREE TO
CONTACT US
THANKS FOR YOUR
Tel. +49 (176) 8601 5325
DYM Resources GmbH
Chorinerstr. 65, 10119 Berlin
ATTENTION!