exploring trade finance - citibank · exploring trade finance sameer sehgal, head of global trade,...
TRANSCRIPT

Exploring Trade Finance
Sameer Sehgal, Head of Global Trade, Europe, Middle East
and Africa
In the Context of the MacroEnvironment

Agenda
• Global Macro Trends and Environment
• Digitisation Trends Overview
• Regulation and Compliance Trends Overview
• Possible Implications of Basel III
• Case Studies
1. Global Macro Trends
and Environment

Polling Question #1
What is the your sentiment on the macroeconomic environment over the next year?
A. Will improve
B. Will stay as is
C. Will worsen

Polling Question #2
What is your sentiment on the geopolitical situation over the next year?
A. Will improve
B. Will stay as is
C. Will worsen

Environment
• Easy Money: With accommodative monetary policies and asset purchase programs, the market has been flushed with liquidity for an extended period now. Even while the Fed has begun tapering, l iquidity stil l remains abundant. ECB lowered interest rates. European Banks continue to focus on Trade as short -term lending driving spreads down in addition the UK government is supporting trade through bespoke programmes. Quantitative easing announced in Europe, sovereign bond buying programme of €60 billion a month, which would come to €1.1 tri l l ion through 2016.
• Interest Rates: On a global basis interest rates are the lowest they have ever been. There is talk of US and UK int. rates moving up but on t he short-term trade front there is minimum impact expected.
• Macroeconomic slowdown: Germany with its Export surplus reducing first time in years. China’s growth rate of 7.1% lowest since 2009 global financial crisis 6.6%. Oil prices stabilise around $50, 50% drop YoY March15 vs. ’14. Shale oil companies facing credit crunch.
• Geopolitical Risks: Sovereign concerns around Russia, Ukraine, Syria and Iraq. Russia and Ukraine crisis has created enormous stress globally. Gh ana facing FX concerns earlier in 2014, Ebola in West Africa, Nigerian presidential elections took place in March, UK general elections in May. Turkey, Portuga l, Spain elections later in the year. Post Greek parliamentary elections – exit EU?
• Basel III Impact: Banks are seeing a delayed fl ight to quality with non-investment grade credit being priced aggressively. Banks are focusing on revenues with asset spreads coming into sharper focus. New US Rules announced bringing the following two areas in -line with global standards – calculation of supplementary leverage ratio and one Year Floor on Maturity when calculating capital.
1. 1. Source: Business Insider; Political Violence Index 2015;
2. 2. Emerging Markets includes Asia, LatAm and CEEMA. World Bank, BEA, WTO, BIS, CIRA, Citi GPS Global Perspectives and Solutio ns.
Globalisation v s.
State Support Urbanisation
Conv ergence and
Digitalisation Commodities Regulation
Political Instability Index 20151 5-year Baltic Dry Index 2009–2015 Total SWIFT Messages Sent (In Millions)
10-Year US Treasury Yield Historical Daily WTI Spot Price (US$ per Barrel)
World Trade Flows2
Libya Sudan
C.A.R DR Congo
Yemen
Somalia
Syria
Iraq
Afghanistan
Myanmar Nigeria
Extreme Risk High Risk Medium Risk Low Risk No Data
4% YoY Drop
Total Trade Flows US$4T US$13T US$37T US$122T US$287T
Emerging Market Trade Flows
32% 33% 55% 69% 75%
4.27
2.05
3.69
1.62
1.9
0.0
1.0
2.0
3.0
4.0
5.0
2008 2010 2012 2014
540
2,277
662
4,507
0
1,000
2,000
3,000
4,000
5,000
2009 2010 2011 2012 2013 2014 2015
4.88
4.66 4.66
4.81
4.63
4.4
4.5
4.6
4.7
4.8
4.9
5.0
2010 2011 2012 2013 2014
105.34
52.41
0
20
40
60
80
100
120
140
160
2004 2006 2008 2010 2012
47% 50%34%
21% 17%
13% 8%16%
17% 19%
21% 17%11%
10% 8%
6%4%
6%
5%5%
13% 21%33%
47% 51%
Apr 2015
Apr 2015
Abundant liquidity caused massive spread declines in 2013 and 2014. Intense competition in world of two extremes (Liquidity vs. Trade). Trade industry is at an inflection point.

A Continuing Challenging Environment
US 2007–2008
Credit and Liquidity Crisis Aggressive risk taking by highly
leveraged FIs Loose credit policies fueled rise in
consumer debt and home prices Caused global recession as financial
markets seized Required massive amounts
of fiscal stimulus, bank bailouts and bank b/s recapitalisation
US now experiencing modest recovery
Euro 2009–2011
Sovereign Debt/Bank Crisis Deficit spending led to rising
government debt Significant sovereign downgrades
with spillover impact on banks who held sovereign debt
Fiscal austerity and credit crunch led to EU recession
Required massive amounts of bailouts within the EU for governments and banks, many of which were nationalised
Challenges linger but an absence of new bad news
Emerging Markets 2013/2014
Slowdown and Volatility Recent decline in EM GDP growth
and stock indexes FX rates plunge for
Brazil, Russia and India Triggered by collapse of G10 imports
and China slowdown – tighter US fiscal policy will take a toll
Many EMs have responded by fueling rapid credit growth, loosening fiscal policy and launching new infrastructure projects
What is Going to be Next? 2015 Onwards
Uncertain Outlook Secular Stagnation Stalling Globalisation Lowflation Commodity prices FX and Monetary Policies Geopolitical Risks/Political Elections China slowdown Eurozone/Greece
4 World GDP Growth (Annual %) (1961–2013)
Boom
Recession
Volumes and
Spreads
are down
1
2
3
3 2 1
(3.0)
(2.0)
(1.0)
0.0
1.0
2.0
3.0
4.0
5.0
6.0
7.0
8.0
1961
1963
1965
1967
1969
1971
1973
1975
1977
1979
1981
1983
1985
1987
1989
1991
1993
1995
1997
1999
2001
2003
2005
2007
2009
2011
2013
Global Economic Output over the past 50 years shows a downward trend, with deeper recessions and week growth periods.

Trends that are Shaping the World
Past (1990) Present Future (2017–2020)
USA JPN
DEU
USA CHN
JPN
CHN USA
IND
17% 26% 33%
Exports share of GDP Exports share of GDP Exports share of GDP
Largest world economies Largest world economies Largest world economies
43% world population in cities 52% world population in cities 60% world population in cities
9% world population >60 y ears old 11% world population >60 y ears old 17% world population >60 y ears old (2030
Mobile broadband subscriptions: None Mobile broadband subscriptions: 1.4bn Mobile broadband subscriptions: 5bn (2017)
Internet users: Nominal Web browser introduced in 1992
Internet users: 2.4bn 34% global penetration
Internet users: 3.5bn (2017) 50% global penetration
0 1.4bn 5bn
Urbanisation
Globalisation
Regulation
Increasingly complex banking rules passed at an escalating pace in the past 13 y ears, with indications that pace will continue …
Since 2000 – FACTA, US Patriot Act, SEPA, USAPA Certificate Benchmarking Dodd-Frank Act, Durbin Amendment, Payment Services Directive II, Recovery &Resolution Planning, Basel II
Digitisation
Key Themes
More Cross-Border than domestic
More Urban than Rural Aging Population
Channels redefined
More and diverse Regulation Safer, less proprietary and less speculative
Note: Primary Sources: EIU, Roland Berger, United Nations Statistics, Forrester Research, Citi Analysis.
Major New Regulation passed every 15–20 y ears
1950 – Of f ice of Foreign Asset Control 1970 – Bank Secrecy Act 1986 – Money Laundering Control Act

Quantitative Easing (‘QE’) and Negative Interest Rates
Key Updates 22 January – ECB announced the ‘QE’
programme under which it will buy €60 billion of public and private debt securities per month, until end-September 2016 and a sustained adjustment in the path of inflation is seen
Will this QE be enough? ‒ We estimate €1 trillion balance sheet
expansion could add 1pp to nominal GDP growth
‒ Inflation is likely to remain still well below target
Bank of England first rate increase now expected for early 2016
Recent Central Bank rate cuts in Europe ‒ 15 January – Swiss National Bank
moved its deposit rate for CHF to negative 75bps
‒ 6 February – Danish Central Bank moved its deposit rate for DKK to negative 75bps
‒ 18 March – Sweden Central Bank moved its repo rate to negative 25bps
EUR, CHF, DKK and SEK Rates 31 October 2014 – 19 March 2015
Points to Ponder
Benchmarks have Moved
1
Documentation
2
Trapped Liquidity
3
Note: EUR, CHF Libor o/n; DKK Denmark’s National bank Deposit Rate; Swedish Central Bank Repo Rate.
Source: Citi Research February 2015.
(1.20)
(1.10)
(1.00)
(0.90)
(0.80)
(0.70)
(0.60)
(0.50)
(0.40)
(0.30)
(0.20)
(0.10)
0.00
0.10
0.20
31-O
ct-
14
07-N
ov-1
4
14-N
ov-1
4
21-N
ov-1
4
28-N
ov-1
4
05-D
ec-1
4
12-D
ec-1
4
19-D
ec-1
4
26-D
ec-1
4
02-J
an-1
5
09-J
an-1
5
16-J
an-1
5
23-J
an-1
5
30-J
an-1
5
06-F
eb-1
5
13-F
eb-1
5
20-F
eb-1
5
27-F
eb-1
5
06-M
ar-
15
13-M
ar-
15
CHF EUR DKK SEK

Trade Business Trends
Liquidity Coverage
Ratio has Challenged
Correspondent
Banking Model
Compliance
Increasingly Complex
and Expensive
Supplementary
Leverage Ratio has
become a Constraint
Basel III is Forcing
us to Reinvent how
we Use our
Balance Sheets
Increased Sovereign
and Credit Risk
Market Pricing
is Unrealistic
Trade
Business
Trends
Trade industry is at an inflection point – we must adapt and collaborate to remain relevant.

Polling Question #3
What think will be the main macro driver in the next 12 months?
A. Interest Rates
B. Oil Price
C. Emerging Markets Economic Slowdown
D. Political Transition

2. Digitisation Trends Overview

There is Massive Disruption along the Value Chain
1
1
(US$2.3bn) (US$150mn)
(US$180mn)
1 LEJU
(US$400mn) (US$3.2bn)
(US$950mn) (US$125mn)
(US$347mn)
1
(US$150mn)
(US$350mn) (US$200mn)
1
The New Entrants Traditional Prov iders
~US$50bn acquisition/ investments since Jan 2013
Student Loan Corp
Potential Payment Targets 1
(US$586mn)
(US$250mn) (US$1.1bn)
1
(US$532mn)
In-time Retail Group1
(US$700mn)
(US$75mn)
1
(US$70mn)
1
(US$1.1bn)
(US$19bn)
(US$160mn) (US$1.9bn)
91 Wireless
For certain technology giants, their ability to disrupt the payment ecosystem may occur through commoditisation of the payment function, rather than through disintermediation/acquisitions
Source: Company fi lings, MergerMarket, CapIQ and FactSet.
1. Represents minority investment.

Digital Trends have Completely Reshaped Other Industries
Digital Trend: Mobile
Digital World Physical World
PCs
Tablets
CAGR
56%
12%
73%
Smartphones
Disrupted Industry: Physical vs. Digital Market Share (US, over 10 Years)
44%
Average
Share
Shift
Founded
(Streaming)
Launch
Source: http://etc-digital.org/digital-trends/mobile-devices/tablets/
1%
7%
22%
7%
10%
18%20%
2%
6%
0%
5%
10%
15%
20%
25%
2004 2005 2006 2007 2008 2009 2010 2011 2012 2013
Insta
lled D
evic
es a
s a
% o
fG
lobal P
opula
tio
n
0
10
20
30
40
50
60
70
80
90
100
0 1 2 3 4 5 6 7 8 9 10
Physic
al M
ark
et S
hare
(%, V
alu
e)
Year of Disruption
Travel Video Newspaper
Music Best Fit

Polling Question #4
Traditional Trade is mainly paper based – Do you see a transition to a fully automated/digitized STP approach for Trade transactions?
A. Yes
B. No

Optical Character Recognition (OCR) – The Way Forward
Today’s Process
▼ Paper-based, manual process
▼ Prone to typos when processing
▼ More volume = more people required to process
Tomorrow’s Process
▲ Automated text extraction
▲ Reduces human error
▲ Generates capacity
OCR

Mobile Capabilities: Citi’s Trade Advisor
Immediate information at the press of a button • Provides real-time details on the status of
Letters of Credit, Document Presentations, Collections and Open Account Transactions
Available anywhere and everywhere
• Free of charge to banks, importers, exporters and virtually any party involved in a trade transaction processed by Citi
• Counterparties of clients can find out the same information without having to call the client or Citi
• Browser-based solution, allowing for access from any device that can connect to the internet – no smartphone requirements or app downloading necessary
Simple but advanced search options for fast, accurate results
• Only five simple search fields are required before transaction information can be searched
• Additionally, users can find out the status of Amendments, Bill Payments, and Courier Details
Cu
sto
mis
ab
le C
olo
r S
ch
em
e
Logo
Here

Efficiency
Declining margins
• Convert from fixed to variable costs
• Gain access to a global network to capture end to end transactional flows
Infrastructure Needs
• Limited flexibility to move to lower cost locations
Technology Requirements
• Legacy back office platforms are still in use
• In house expertise to manage a complex system conversion is not readily available
Regulatory Environment
• Cause for concern with regards to Basel III, AML, KYC, etc.
• Manual processing exposes greater risk for error
Need to Enhance Revenues
• New products and additional revenue streams
• Improve speed to market of new product offerings
• New products have high fixed and other hidden costs
Technology Requirements
• Client-facing systems are difficult to integrate
• Total technology commitment to upgrade is not justified by the ROI
• Implement new capabilities (open account trading, TSU, Payment Investigations, etc.)
Operational and Technical Expertise
• Expertise to support new capabilities
Increase Number of Products Improve Efficiency

Choosing the Right Strategy
• Build vs. Buy Decisions
– Core functionality that cannot be outsourced: Assess upfront costs of developing and maintaining infrastructure in house
– Build infrastructure
– Partnership for add-on services
• Partnerships can Provide
– Shorter time to market for new products
– Variable cost structures
– Leverage “best of breed” solutions
– Eliminate the need for upgrades based on various industry and regulatory changes
– Define your objective for partnership upfront
• Define your objectives upfront

3. Regulation and Compliance
Trends Overview

Compliance is Increasingly Complex and Expensive
The total amount spent on remediation can be equivalent to the fine itself, considering expenses related to hiring of external counsel and consultants, technology improvements, staffing, etc.
… With Heavy Fines for Compliance Errors Recently Banks have Paid US$5 Billion in Penalties
Penalised
Fines and forfeitures
paid in US sanctions-violations and
money-laundering cases, in mill ions
Increasingly Complex Banking Rules Passed at an Escalating Pace …
US Foreign Account Tax
Compliance Act (FATCA) USA PATRIOT Act
2001
Money Laundering
Control Act
1986
Office of Foreign
Asset Control
1950
Bank Secrecy Act
1970 2013
USAPA Certificate
Benchmarking
2010
Dodd-Frank Law
E.U. Fourth Money
Laundering Directive
Coming
Soon 2011
HSBC 2012
Standard Chartered 2012
ING Bank 2012
Credit Suisse 2009
ABN Amro 2010
Lloyds 2009
Barclays 2010
Bank of Tokyo-Mitsubishi 2012/2013
Clearstream Banking 2014
Royal Bank of Scotland 2013
Source: Department of Justice, OFAC fil ings; The Wall Street Journal.
100
152
259
298
350
500
536
619
667
US$1,921 Million
Continued strengthening of KYC, AML and other regulatory increase the time, cost and risk of Trade – investments in large scale technology to address compliance requirements is the only practical solution.

Decade of Regulatory and Industry Changes
Figure from World Payments Report, 2012, pg 22, issued by Capgemini, RBS and EFMA
We are Living in the Decade of Regulation
Start of the Initiative/Regulation (If 2010) S
Intermediate Point/Milestone I
End of the Initiative/Regulation E
KRIIs Previously Cited in WPR 2011
KRIIs Introduced in WPR 2012
Elapsed Time
Systemic
Risk Reduction
and Control
Standardisation
2011 2012
From
2013 to 2015
From
2016 to 2018 > 2019
Transparency
of Services
Convergence
Basel III I E
E
E E
E I
E
E
E
E
I E
S
Innovation

Basel III – Overview
2011 2012 2013 2014 2015 2016 2017 2018 2019
Capital Framework
Minimum Common Equity (CET1) 2.0% 2.0% 3.5% 4.0% 4.5% 4.5% 4.5% 4.5% 4.5%
Deductions from CET11 NA NA NA 20% 40% 60% 80% 100% 100%
Minimum Tier 1 Capital 4.5% 5.5% 6.0% 6.0% 6.0% 6.0% 6.0%
Minimum Total Capital 8.0% 8.0% 8.0% 8.0% 8.0% 8.0% 8.0% 8.0% 8.0%
Capital Conservation Buffer (CCB) NA NA NA NA NA 0.625% 1.25% 1.875% 2.5%
Min. Total Capital and CCB 8.0% 8.0% 8.0% 8.0% 8.0% 8.625% 9.25% 9.875% 10.5%
Counter Cyclical Buffer
(If Triggered)
Up to 0.625% Up to
1.25%
Up to
1.875%
Up to
2.5%
Additional Loss Absorbency
for Systematic Importance2
1–2.5%
or 3.5%
Maximum Total Capital for G-SIB
including Counter Cyclical Buffer 16.5%
Leverage Ratio3 3% 3%
Liquidity Ratio
Liquidity Coverage Ratio (LCR)4 ≥60% ≥70% ≥80% ≥90% ≥100%
Net Stable Funding Ratio (NSFR)4 >100% >100%
Observation Period
Observation Period
Parallel Run with Disclosures 2015+
Phase in
Basel III Overview
Signif icantly Increases Quality and
Quantity of Capital
Differentiates Global Systemically
Important Banks to Address “Too
Big to Fail” – G-SIBs
Adds New Measures for Liquidity
and Leverage
Still a Work in Progress and to be
Phased-in over Six Years,
Starting 2013
1 2 3 4
TLAC will Apply as
Additional G-SIB
Requirement from 2019
1. Deferred Tax Assets (DTA), Mortgage Servicing Rights (MSRs) and equity ownership of other financial institutions is capped each at 10% of CET1 and combined at 15% of
CET1; phased out completely by 2018; 2. Additional requirement is for CET1 for G-SIBs; proposed 25 June 2011. Additional 1% is required for banks in the 2.5% category who
increase their systematic importance; 3. Test run at 3% during observation period before figure set for 2018+; 4. Proposed bu t not final ratio.
Basel III introduces radical changes in capital rules, new liquidity and leverage ratios as well as additional rules for global systemically important banks, making capital expensive and capital deployment finite.

Regulatory Arbitrage
US Proposal Global Basel III EU Proposal
Capital Phase-out
Faster phase-out of non-qualifying capital (3 vs. 5 years)1
TARP preferred stock continue to qualify as add’l Tier 1 Capital
5 year phase-out for non-qualifying capital starting in 2014
Same as Global Standards
Countercyclical Capital Buffer
Applies only to Advanced Approach Banks2
2.5% Common Equity Tier 1 Capital for all banks
Same as Global Standards
Approach to Calculating RWA
Large Banks2 – Standard and Advanced approaches
Small Banks – Standard only
Large Banks – Advanced approach Small Banks – Standard approach
Same as Global Standards
Leverage Ratio
Existing 4% Tier 1 capital ratio with Credit Conversion Factor for off-balance sheet assets like LCs
And also adds Global Standard for Large banks
Min 3% of tier 1 capital of a combination of ALL on- and off- balance sheet assets
Min 3% of tier 1 capital ratio with Credit Conversion Factor for off-balance sheet assets
Liquidity
LCR has been adopted in 2014 and is in force since Jan 2015. NSFR is going to be consulted on by the agencies this year and is expected to be applicable from 2019.
New liquidity ratios (LCR and NSFR) LCR has been adopted as in being phased in from 2015, in line with Basel III transition approach
Tenor Appears to exempt only Trade L/Cs
from 1 year floor; previously exempted all Trade instruments
1 year floor, except Trade L/Cs Broader definition of Trade instruments that are exempt from one year floor
GSIB Surcharges
No specifics yet but indications there may be extra capital req’d for banks >US$50 billion assets
Additional 1–2.5% Common Equity Tier 1 Capital req’d for 29 named banks
Same as Global Standards
However, divergence occurring in opposite directions
1. Per Collins Amendment for banks over US$15 bill ion in assets; 2. For banks with over US$250 bill ion in total assets or more than US$10 billion in on-balance
sheet foreign exposure.

4. Possible Implications of Basel III

Assets and Liabilities
Uses
Cash and Cash
Equiv alents
Trading Account
Assets
Loans
Other Assets
Conclusions
Pricing is increasing
Immense focus on Corporate Deposits (Price up)
Immense competition in the assets space (Flight to Quality/price down)
Leads to an interesting squeeze towards efficiency and productivity
Banks Balance Sheet might reduce
Sources
Deposits
Central Banks
Money Markets
Inv estment Portf olio
Asset Distribution
Consolidation
Convergence
Balance Sheet
Optimisation
Alternative Sources
of Funding
Originate to
Distribute
Industry Trends
1
2
3
4
5
1 2 3
4 5
– Operations/OCR
– Balance Sheet
Raising Debt
Raising Equity
Trade Assets
Inv estment (Short and
Long-term)

Top 3 Trade Banks, Including Citi, are Driving Consolidation
Source: Oliver Wyman report on Trade Market dynamics for market size; Top 10 Trade Bank size based on financial disclosures o r estimates; Note: Citi figures include
CCB and Trade SBLCs.
Trade Market Share
Drivers of Consolidation
Scale needed for cost efficiency
Global network required to serve client’s global
supply chain
Required investment in technology and infrastructure
Regulatory complexity and capital rules
Access to USD funding
Portfolio choices by banks to focus on
core businesses
7% 9% 11% 11% 12%
8%
10%10% 10% 10%
85%81% 79% 80% 79%
0%
10%
20%
30%
40%
50%
60%
70%
80%
90%
100%
2008 2009 2010 2011 2012
Top 3 Trade Banks Trade Banks Ranked 4–10 Rest of Trade Bank Market
Citi Doubled Its Market Share to 3.5%
Trade Market Growth
CAGR
2008–2012
Market
Share Gain
Overall Market 1.8% NA
Banks Not Top 10 (0.3)% -7 points
Trade Banks No.4–10 7.4% +2 points
Top 3 Trade Banks
(Including Citi)
16.9% +5 points
Citi 19.5% +1.6 points

Polling Question #5
Have you seen a pricing change due to Basel III?
A. Yes
B. No

Basel III Presents a Challenge to Banks
New Regulatory Regime will Trigger Change
• Pricing will rise: Banks will eventually need to price to cover increased costs of holding more capital, liquidity and long-term funding. Margins on short-term working capital financing facilities may increase by 25–100%
• Available bank credit will shrink: Banks without global scale will struggle to meet returns on short-term financing to support their clients’ trade flows. Banks that do not consider Trade a core business will re-allocate capital elsewhere
• Sub-investment grade borrowers will be hit hardest: SME suppliers and distributors, particularly in EM, will be challenged to support their customers’ and vendors’ sales growth objectives
• Relief may come from non-bank investors entering the Trade market: Insurance companies, pension funds and other investors not subject to Basel III are beginning to recognise the attractiveness of Trade assets, offering potential liquidity for well-structured deals
Significantly More Capital, Liquidity Required under Basel III
Year 2014 2016 2019
Minimum Total Capital 8.0 8.6 10.5
Counter-cyclical Buffer
(If Triggered)
0.0 0.6 2.5
Additional Capital for
Global banks
0.0 0.0 1–3.5
Total Capital, Maximum 8.0 9.5 16.5
Minimum Liquidity Ratio NA 70 100
Minimum Net Stable
Funding Ratio
NA NA 100
A 370 bps 60 bps 75–115 bps
BB– 370 bps 310 bps 400–650 bps
Basel I 8% Capital
Basel II 8%
Capital2
Basel III 10.5–16.5%
Capital2
Basel III Impact on Working Capital Pricing (Margin on 6 Month Loan by Credit Rating)3
1. Assumes 50% efficiency rate. 2. Assumes advanced approach. 3. Assumes 1 year floor on tenor for Basel III. 4. Assumes bank is large enough to require 25% AVC and is
from a non OECD country.
Banks will increase pricing to meet required returns. Few have fully priced-in Basel III already. The biggest impact will be on Small-Medium Sized Enterprises (SME), especially in Emerging Markets.

Polling Question #6
Do you believe that ‘Convergence’ will happen i.e. few Banks provide processing services?
A. Yes
B. No
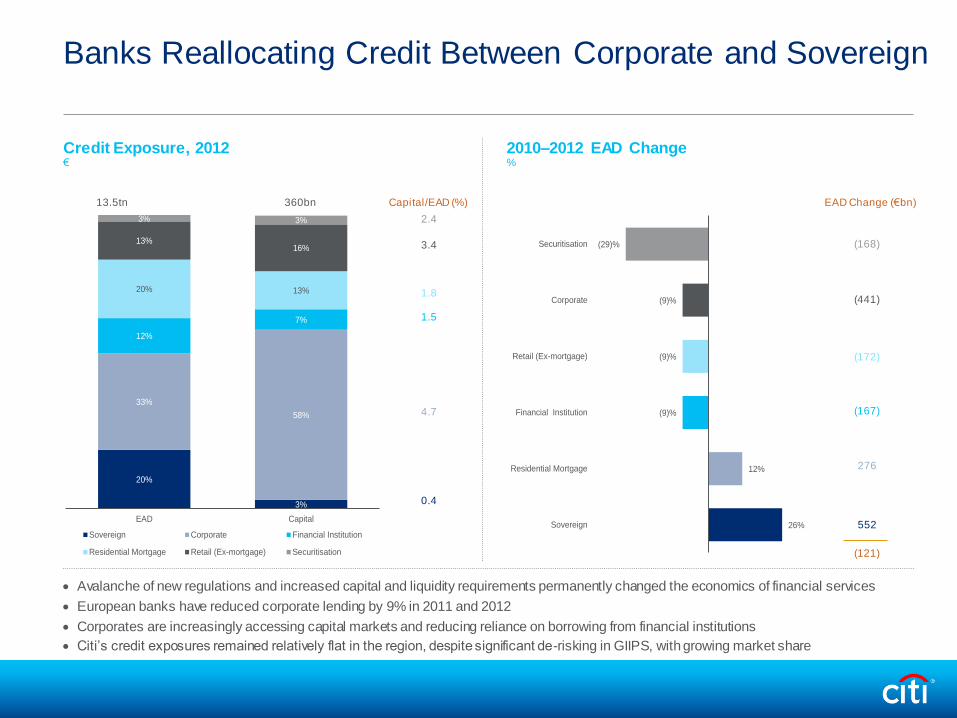
Banks Reallocating Credit Between Corporate and Sovereign
(168)
(441)
(172)
(167)
276
552
(121)
EAD Change (€bn) Capital/EAD (%)
2.4
3.4
1.8
1.5
4.7
0.4
Avalanche of new regulations and increased capital and liquidity requirements permanently changed the economics of financial services
European banks have reduced corporate lending by 9% in 2011 and 2012
Corporates are increasingly accessing capital markets and reducing reliance on borrowing from financial institutions
Citi’s credit exposures remained relatively flat in the region, despite significant de-risking in GIIPS, with growing market share
20%
3%
33%
58%
12%
7%
20% 13%
13%16%
3% 3%
EAD Capital
Sovereign Corporate Financial Institution
Residential Mortgage Retail (Ex-mortgage) Securitisation
26%
12%
(9)%
(9)%
(9)%
(29)%
Sovereign
Residential Mortgage
Financial Institution
Retail (Ex-mortgage)
Corporate
Securitisation
13.5tn 360bn
Credit Exposure, 2012 €
2010–2012 EAD Change %

Polling Question #7
What do you think will be the biggest challenge of Basel III?
A. Internal Implementation Costs
B. Pricing and Returns
C. Regulatory Arbitrage
D. Any Other

5. Case Studies

Club Loans – Bridging the Global to the Local
The Big Picture
Extensive funding need of local players
Spread wars
Intention to liquidity diversification
Abundant trade flows
Limited access to global markets
Dependency on inward liquid flows
Flexibility to adapt new structures
Execution Model – Benefits
Upfront fee, skim fee and margin enhancement
Leverage of Distribution Team
Single and larger financing facility
Introduction to new investors other than core relationships
Optimisation of capital by distributing risk effectively
Close partnership with Sales, Product and Banking teams
Convenience for FIs
PR coverage and branding opportunities
Structure
FI Client Citi
Participation Agreement
Bilateral Trade Agreement
Financing Request
Bank B Bank C Bank A Bank D
“Club” Structure

Export and Agency Finance (EAF)
Borrower SPV set up for the transaction
Lessee Company A
Lead Arranger Citi
Lender Company B
Guarantor Company C
ECA Multiples
Facility Amount Confidential
Tenor 10+ years
Purpose To finance acquisition of two A320–
214 Airbus aircraft
Signing Date June 2013
Citi’s Role
Mandated Lead Arranger
Advisor
Facility Agent
Transaction Highlights
• Company A is a flag carrier airline and operates both domestically and internationally. Company A aims to become a major player in the
global market
• Citi was mandated as Advisor and Lead Arranger for the ECA backed financing of two A320 aircraft
• In an Advisory capacity, Citi assisted Company A throughout the ECA process, with a view of achieving the optimal financing structure
• Agency D acted as fronting Agency for the European ECAs, seeking reinsurance from International Agencies
• The loan facility benefited from a sovereign guarantee
Innovations
• The loan facility enables Company A to continue its fleet renewal and expansion plan in an effort to better meet the demand of passenger and cargo transport
• Despite turbulent market conditions and uncertain
political situation in the country, Citi in its capacity as MLA and as sole advisor of this facility, brought in Company B to provide competitive financing for both aircraft
• This transaction adds to Citi’s dominant position in
aviation financing in the EMEA Region
Citi, acting as the Mandated Lead Arranger closed ECA-fronted financing for the acquisition of two (2) Airbus A320 aircraft, delivered in February and April 2013.
Company A – Export L/Cs, including
Documentation Preparation
Deal Structure • Requirement was to handle around 10,000+ sales
orders in a year
• Requirement under the structure included L/Cs advising, document preparation, negotiation and scrutiny of documents, payment services and confirmations of Letters of Credit
Replication • Clients who have the need for an end to end solution
for their Export L/Cs processing not wanting to substantially increase their in-house operations capabilities
Key Takeaways
• Company A is a key franchise name and this is a trophy deal to have with this name
• This deal – being a pilot as well – can be replicated to other big names
Company • Company A
Client Need • Company A was mandated to maximise downstream
integration and therefore leading to significant ramping up of L/Cs volumes in a short period. Since the customer did not have the necessary infrastructure and expertise in handling these flows, they were looking for a bank to partner with who would provide them with their Export L/Cs needs which included Document preparation. They were relying on the partner bank with the requisite expertise and know-how to handle these substantial new flows without any disruption to their business
Origination • RFP was floated and 10+ banks both international
and regional banks were competing
(6b) Citi Engages with Counterparties
to Prepare Third-party Documents
(4) L/Cs Advised to Company A
(6a) Citi Engages with Supplier to Prepare First Party Documents
Counterparties
(Shipping Agent, Surveyor, Chamber of Commerce, etc.)
(8) Documents
(2) L/Cs Opening Application (9) Payment
(11) Payment
(1)
Co
mm
erc
ial
Co
ntr
act
(5)
Sh
ipm
en
t
of G
oo
ds
Applicant Issuing Bank
(3)
Imp
ort
L/
Cs
Issu
ed
(7)
Do
cu
me
nts
Co
lla
ted
an
d D
isp
atc
he
d
(10
) P
aym
en
t
Company A

Target Operating Model for Insourcing
Processing Unit
Architecture
Group Processing/ Client Servicing Windows
Group Customers
Internal Data Layer
Presentation Layer
Transaction Inquiries
Transaction initiation
Product inquiries
Reporting
Image retrieval
Event notifications
Other communications
Inquiries Web Front-end/ Client on Boarding
Information Data
Warehouse
System A
Global Imaging Server
Interfaces
SWIFT
G/L
DDA
Credit
Help Desk
Window 1
Window 2
Public Internet
Window 1
White Labelled CitiDirect
Product Processors
Extranet/ Leased
Line
Scanning of Paper Items
Registration
Touch-points/Handoffs Group Involvement
Release of Transactions Initiated via CitiDirect
Group staff approves and releases transactions to Citi for further processing
Scanning of Non-electronic Applications, Amendments and Other Non-electronic Client Communication
If a Group client does not use CitiDirect and communicates instructions via other methods agreed between Company A and the client, Group staff would need to scan these items into System A for further processing by Citi
Document Release Citi’s Penang RPC will coordinate with Group staff the release of documents to the applicant. Similarly, Citi’s Penang RPC will coordinate the release of documents pertaining to inward collections, after receiving instructions from Group staff
Handling of Transaction Inquiries
Group service staff will field all client transaction inquiries. Group will have access to Citi’s back-office capabilities on System A to access real-time transaction details and generate MIS reports
Handling of Technical Questions from White-labeled Front End Users
Citi will train Group staff to handle general queries related to CitiDirect and customer on-boarding
Customer Model

Company A – AR Financing
Deal Structure
• Deal was structured on a master agreement approved globally b/w Citi and Company A (same applicable locally)
‒ Deal Size: Confidential
‒ Obligors: Major global Telecom companies
‒ Uncommitted, Limited Recourse, disclosed AR finance
‒ Quarterly invoice discounting: Confidential
‒ Booking vehicle: Confidential
Company
• Company A is a leading communication services and equipment provider to several major global Telecom companies
Client Need
• Company A is selling a material amount of AR globally on quarterly basis and write out tenders to several banks (10+). The main purpose of the sale is to achieve Balance Sheet optimization by converting the ARs into Cash.
Origination
• TTS Trade and Banking teams have been actively pursuing Company A to participate in the AR Finance program
Major Global
Telecom Companies
Payment at Maturity
(via Company A collection account) Assignment of Receivables
Discounted Funds
2
Sale of goods
4
3 5
1
AR Finance
Agreement signed
Company A
Key Takeaways
• Selling AR to Citi can be an efficient tool for clients to achieve Balance Sheet enhancement – a very important goal for many corporates
• Quarter end and Year-end AR sale can be the most important
• Main focus is on the bilateral (1 seller - 1 buyer) AR purchase transactions with low complexity to ensure short execution time
• Credit support is crucial

Thank you
