explosives removal from groundwater of the iowa army ... 1—introduction 1 explosives and...
TRANSCRIPT
Technical Report EL-98-13 December 1998
US Army Corps of Engineers Waterways Experiment Station
Explosives Removal from Groundwater of the Iowa Army Ammunition Plant in Continuous- Flow Laboratory Systems Planted with Aquatic and Wetland Plants
by Elly P. H. Best, AScI Jerry L. Miller, Herb L. Fredrickson, Steven L. Larson, WES Mark E. Zappi, Mississippi State University Ted H. Streckfuss, Omaha District
Approved For Public Release; Distribution Is Unlimited
DT1C QUALITY INSPECTED 4
Prepared for U.S. Army Engineer District, Omaha
The contents of this report are not to be used for advertising, publication, or promotional purposes. Citation of trade names does not constitute an official endorsement or approval of the use of such commercial products.
The findings of this report are not to be construed as an official Department of the Army position, unless so desig- nated by other authorized documents.
® PRINTED ON RECYCLED PAPER

Technical Report EL-98-13 December 1998
Explosives Removal from Groundwater of the Iowa Army Ammunition Plant in Continuous- Flow Laboratory Systems Planted with Aquatic and Wetland Plants by Elly P. H. Best
AScI Corporation 3402 Wisconsin Avenue, Ste #5 Vicksburg, MS 39180
Jerry L. Miller, Herb L. Fredrickson, Steven L. Larson
U.S. Army Corps of Engineers Waterways Experiment Station 3909 Halls Ferry Road Vicksburg, MS 39180-6199
Mark E. Zappi
Department of Chemical Engineering Mississippi State University Starkville, MS 39762
Ted H. Streckfuss
U.S. Army Engineer District, Omaha 215 North 17th Street Omaha, NE 68102-4978
Final report
Approved for public release; distribution is unlimited
Prepared for U.S. Army Engineer District, Omaha 215 North 17th Street, Omaha, NE 68102-4978
US Army Corps of Engineers Waterways Experiment Station
HEADQUARTERS BUILDING
AREA OF RESERVATION > 2 7 so km
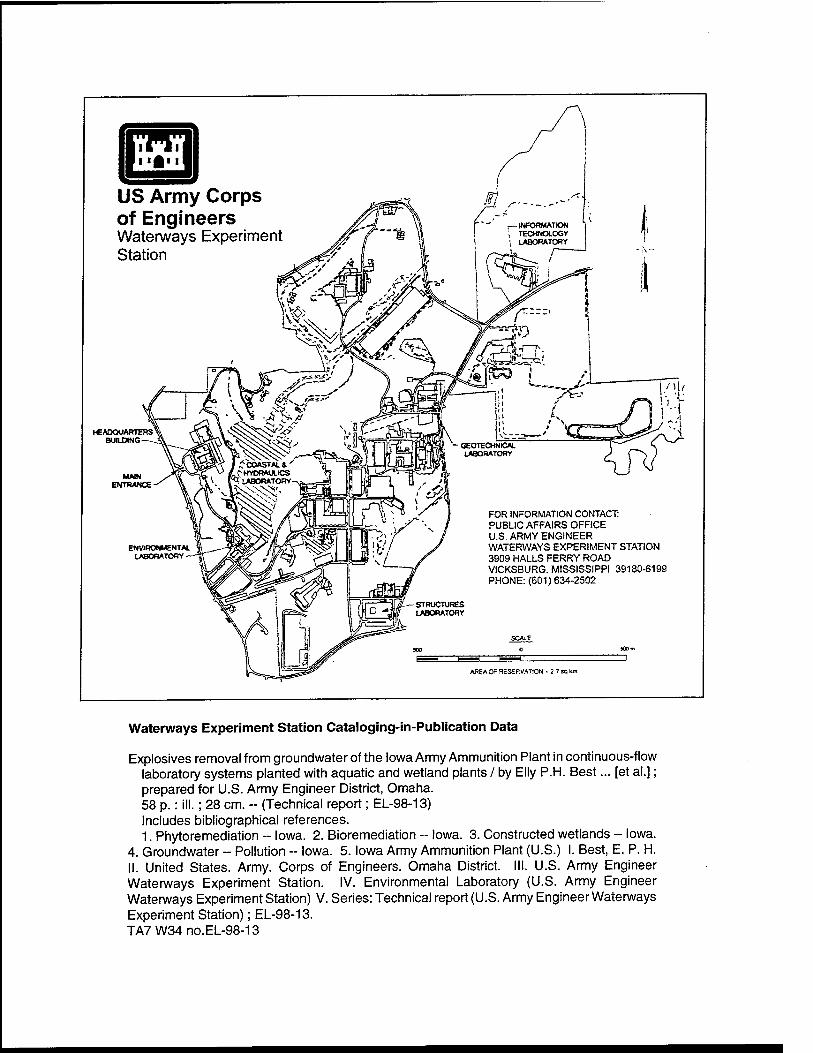
Waterways Experiment Station Cataloging-in-Publication Data
Explosives removal from groundwater of the Iowa Army Ammunition Plant in continuous-flow laboratory systems planted with aquatic and wetland plants / by Elly P.H. Best... [et al.]; prepared for U.S. Army Engineer District, Omaha. 58 p.: ill.; 28 cm. - (Technical report; EL-98-13) Includes bibliographical references. 1. Phytoremediation - Iowa. 2. Bioremediation - Iowa. 3. Constructed wetlands -- Iowa.
4. Groundwater - Pollution - Iowa. 5. Iowa Army Ammunition Plant (U.S.) I. Best, E. P. H. II. United States. Army. Corps of Engineers. Omaha District. III. U.S. Army Engineer Waterways Experiment Station. IV. Environmental Laboratory (U.S. Army Engineer Waterways Experiment Station) V. Series: Technical report (U.S. Army Engineer Waterways Experiment Station); EL-98-13. TA7W34 no. EL-98-13

Contents
Preface v
1—Introduction 1
Explosives and Phytoremediation 1 Phytoremediation of Explosives-Contaminated Groundwater from
the Iowa Army Ammunition Plant 2
2—Material and Methods 4
Plant Material 4 Groundwater 4 Sediment 5 Microbial Seed 5 Experimental Design 5 Experimental Conditions 6 Experimental Procedures and Sampling 6 Analyses 7
Explosives in water 7 Explosives in plant material and sediment 8 Alkalinity, macronutrients, calcium, and manganese in water 8 Macronutrients, ions, CEC, bulk density, and organic matter in
sediment 9 Chlorophyll fluorescence 9
Data Analysis 9 Determination of Dose-Response Curves to TNT and RDX in
Hydroponics 10
3—Results and Discussion 11
Concentrations of Explosives and Degradation Products in Water: Effects of Plant Species and Amendments on Removal 11
Explosives Removal: Constants and Periods Required to Reach Target Levels of TNT and RDX 12
Dissolved Oxygen Concentration in Water and Redox Potential in the Sediments 16
Explosives and Degradation Products in Plant Material and Sediments 17 Plant Health and Growth 17 Dose-Response Curves to TNT and RDX in Hydroponics 19
ill
Conclusions 21
Explosives Removal 21 Explosives Residues 21 Plants 22
References 23
Appendix A: Abbreviations Al
Appendix B: Analytical Specifications Bl
Figures 1-7
Tables 1-13
SF298
IV
Preface
The work reported here was conducted as part of the U.S. Army Engineer District, Omaha (CENWO), project "Optimization of Constructed Phytore- mediation Systems for Treatment of Contaminated Groundwater at the Iowa Army Ammunition Plant" involving the CENWO as the lead agency, with the U.S. Army Engineer Waterways Experiment Station (WES), Vicksburg, MS, providing technical support. The project encompassed two treatability studies and supporting laboratory experiments. The Wetlands Phytoremediation Team was composed of engineers and scientists from both WES and the U.S. Environ- mental Protection Agency (USEPA) and the Uplands Phytoremediation Team of researchers from WES, USEPA, and the University of Iowa. The Design Assistance Team provided the expertise during the design activities and was composed of the CENWO and both technology teams. This project was largely funded by the Omaha District (CENWO). The Strategic Environmental Research and Development Program (SERDP) provided additional financial support.
Principal Investigator for this study was Mr. Jerry L. Miller, Environmental Application Branch, Environmental Engineering Division (EED), Environmental Laboratory (EL), WES. The report was prepared by Dr. Elly. P. H. Best, AScI Corp., with contributions of Dr. Herb L. Fredrickson, Ecosystem Processes and Effects Branch (EPEB), Environmental Processes and Effects Division (EPED), EL, and Dr. Mark E. Zappi, Department of Chemical Engineering, Mississippi State University, MS. Mr. Ted H. Streckfuss, CENWO, contributed significantly to the concept of the study.
Technical reviews were provided by Dr. Doug Gunnison, EPED, and Mr. Tommy Myers, EED. Mr. Myers significantly contributed to applying mathematical techniques to the data with the goal to make them available for wetland design purposes. Technical assistance was provided by Ms. Anne B. Stewart, AScI Corp., and Mr. Robbie Godwin, EPED, EL. Analysis of explo- sives and TNT degradation products in water was performed by Ms. Margaret Richmond, AScI Corp. Analysis of explosives and degradation products in plants was performed by Dr. Steven L. Larson, Environmental Chemistry Branch (EE-C), EL. Nutrients, metals, and ions in water were determined by the Lewisville Aquatic Ecosystem Facility, Texas. Various components in the sediments were determined by Ms. Susan Fox, AScI Corp., and EE-C, EL.
This study was conducted at WES under the general supervision of Dr. John W. Keeley, Director, EL; Mr. Norman R. Francingues, Chief, EED; Mr. Donald L. Robey, Chief, EPED; and Dr. Richard E. Price, Chief, EPEB.
At the time of publication of this report, Commander of WES was COL Robin R. Cababa, EN.
This report should be cited as follows:
Best, E. P. H., Miller, J. L., Fredrickson, H. L., Larson, S. L., Zappi, M. E., and Streckfuss, T. H. (1998). "Explosives removal from groundwater of the Iowa Army Ammunition Plant in Continuous- Flow Laboratory Systems Planted with Aquatic and Wetland Plants." Technical Report EL-98-13, U.S. Army Engineer Water- ways Experiment Station, Vicksburg, MS.
VI
1 Introduction
Explosives and Phytoremediation
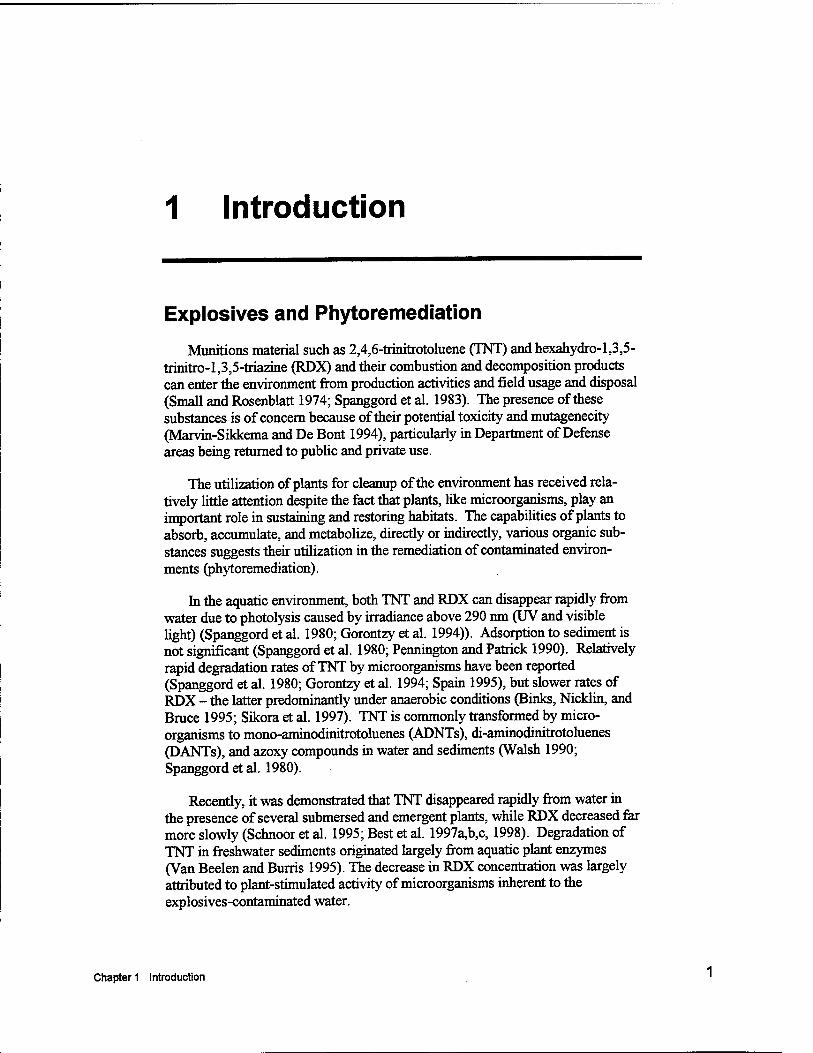
Munitions material such as 2,4,6-trinitrotoluene (TNT) and hexahydro-1,3,5- trinitro-l,3,5-triazine (RDX) and their combustion and decomposition products can enter the environment from production activities and field usage and disposal (Small and Rosenblatt 1974; Spanggord et al. 1983). The presence of these substances is of concern because of their potential toxicity and mutagenecity (Marvin-Sikkema and De Bont 1994), particularly in Department of Defense areas being returned to public and private use.
The utilization of plants for cleanup of the environment has received rela- tively little attention despite the fact that plants, like microorganisms, play an important role in sustaining and restoring habitats. The capabilities of plants to absorb, accumulate, and metabolize, directly or indirectly, various organic sub- stances suggests their utilization in the remediation of contaminated environ- ments (phytoremediation).
In the aquatic environment, both TNT and RDX can disappear rapidly from water due to photolysis caused by irradiance above 290 run (UV and visible light) (Spanggord et al. 1980; Gorontzy et al. 1994)). Adsorption to sediment is not significant (Spanggord et al. 1980; Pennington and Patrick 1990). Relatively rapid degradation rates of TNT by microorganisms have been reported (Spanggord et al. 1980; Gorontzy et al. 1994; Spain 1995), but slower rates of RDX - the latter predominantly under anaerobic conditions (Binks, Nicklin, and Bruce 1995; Sikora et al. 1997). TNT is commonly transformed by micro- organisms to mono-aminodinitrotoluenes (ADNTs), di-aminodinitrotoluenes (DANTs), and azoxy compounds in water and sediments (Walsh 1990; Spanggord et al. 1980).
Recently, it was demonstrated that TNT disappeared rapidly from water in the presence of several submersed and emergent plants, while RDX decreased far more slowly (Schnoor et al. 1995; Best et al. 1997a,b,c, 1998). Degradation of TNT in freshwater sediments originated largely from aquatic plant enzymes (Van Beelen and Burns 1995). The decrease in RDX concentration was largely attributed to plant-stimulated activity of microorganisms inherent to the explosives-contaminated water.
Chapter 1 Introduction
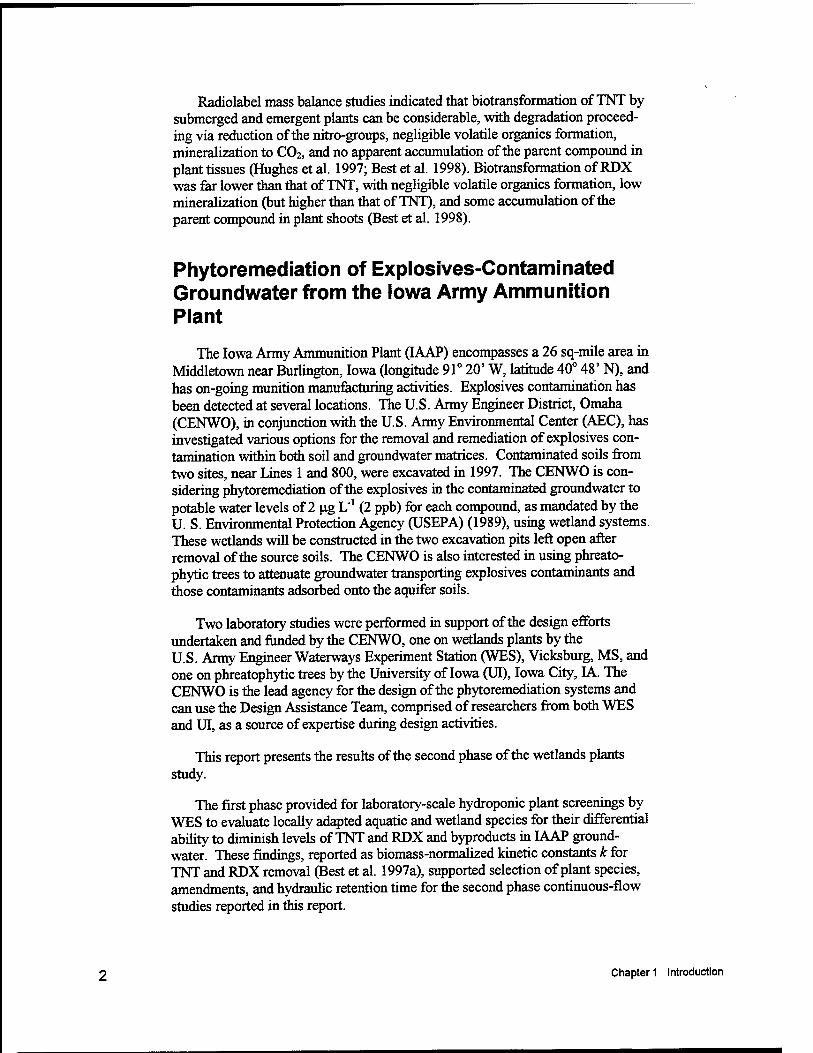
Radiolabel mass balance studies indicated that biotransformation of TNT by submerged and emergent plants can be considerable, with degradation proceed- ing via reduction of the nitro-groups, negligible volatile organics formation, mineralization to C02, and no apparent accumulation of the parent compound in plant tissues (Hughes et al. 1997; Best et al. 1998). Biotransformation of RDX was far lower than that of TNT, with negligible volatile organics formation, low mineralization (but higher than that of TNT), and some accumulation of the parent compound in plant shoots (Best et al. 1998).
Phytoremediation of Explosives-Contaminated Groundwater from the Iowa Army Ammunition Plant
The Iowa Army Ammunition Plant (IAAP) encompasses a 26 sq-mile area in Middletown near Burlington, Iowa (longitude 91° 20' W, latitude 40° 48' N), and has on-going munition manufacturing activities. Explosives contamination has been detected at several locations. The U.S. Army Engineer District, Omaha (CENWO), in conjunction with the U.S. Army Environmental Center (AEC), has investigated various options for the removal and remediation of explosives con- tamination within both soil and groundwater matrices. Contaminated soils from two sites, near Lines 1 and 800, were excavated in 1997. The CENWO is con- sidering phytoremediation of the explosives in the contaminated groundwater to potable water levels of 2 p.g L"1 (2 ppb) for each compound, as mandated by the U. S. Environmental Protection Agency (USEPA) (1989), using wetland systems. These wetlands will be constructed in the two excavation pits left open after removal of the source soils. The CENWO is also interested in using phreato- phytic trees to attenuate groundwater transporting explosives contaminants and those contaminants adsorbed onto the aquifer soils.
Two laboratory studies were performed in support of the design efforts undertaken and funded by the CENWO, one on wetlands plants by the U.S. Army Engineer Waterways Experiment Station (WES), Vicksburg, MS, and one on phreatophytic trees by the University of Iowa (UI), Iowa City, IA. The CENWO is the lead agency for the design of the phytoremediation systems and can use the Design Assistance Team, comprised of researchers from both WES and UI, as a source of expertise during design activities.
This report presents the results of the second phase of the wetlands plants study.
The first phase provided for laboratory-scale hydroponic plant screenings by WES to evaluate locally adapted aquatic and wetland species for their differential ability to dimmish levels of TNT and RDX and byproducts in IAAP ground- water. These findings, reported as biomass-normalized kinetic constants k for TNT and RDX removal (Best et al. 1997a), supported selection of plant species, amendments, and hydraulic retention time for the second phase continuous-flow studies reported in this report.
Chapter 1 Introduction

The second phase was aimed at quantifying the ability of two submersed and one emergent macrophyte species, adapted to lentic habitats in Iowa, to phytore- mediate site explosives-contaminated groundwater when planted in site sediment under continuous-flow, mixed, laboratory conditions. Species evaluated were the submersed Ceratophyllum demersum L. (coontail), Potamogeton nodosus Poir. (American pondweed), and the emergent Sagittaria latifolia Willd. (common arrowhead). Unplanted sediment, operated under similar hydraulic loading, served as a control. The effects of amendment with nitrogen and an explosives- degrading microbial seed on explosives removal were quantified. The hydraulic retention time was 30 days. The study was conducted during the first half of the growth season, May to July 1996. Plant health was followed by measuring relative growth rate and chlorophyll fluorescence. Toxicity of TNT and RDX, respectively, to submersed and emergent plants was evaluated by determining their dose-response curves to concentration ranges of parent compounds in hydroponic culture.
Results from both phases will be used as a basis for design calculations concerning basin configuration, hydraulic retention times (HRTs), and appropriate amendments for both wetlands near the Lines 1 and 800 sites.
Chapter 1 Introduction
2 Materials and Methods
Plant Material
Two submerged and one emergent plant species evaluated for ability to degrade explosives in continuous-flow systems containing IAAP groundwater were selected from the 10 native species screened in previous batch experiments (Best et al. 1997a,b). The species were chosen based on the three criteria of having the ability to: (a) decrease the TNT concentration in IAAP groundwater, (b) decrease the RDX concentration in IAAP groundwater, and (c) complete their hfe cycle completely submersed or rooted in continuously submerged sediments. The species are listed in Table 1.
American pondweed and coontail were obtained from the Lewisville Aquatic Ecosystem Facility (LAERF). Common arrowhead was purchased from the Rocky Shoals Aquatic Nursery, Fairburn, GA. Plants for evaluation were col- lected during the second week of April 1996. Submersed plants were received as unrooted (coontail) or rooted (pondweed) apical shoots. Emergent plants were received as unrooted tubers. Upon arrival they were planted in N-amended Brown Lake sediment, submersed in a low-alkalinity solution (Smart and Barko 1985), and held in monocultures in a WES greenhouse until use. Brown Lake is a local pond at WES. Plants were kept in monoculture for 2 to 3 weeks for the continuous-flow, and for 3 to 12 weeks for the dose-response incubations. All culture solutions were aerated to enhance mixing and facilitate air/water carbon dioxide exchange.
Groundwater
Explosives-contaminated groundwater used for screening originated from site Monitoring Wells G18, G19, and G20. The water was transported to WES in three stainless steel 208-L drums at the beginning of May and stored in a cold room (5 °C) until used for testing. The barrel contents were fully mixed in a 1,200-L stainless steel tank prior to use in the experiment. Explosives in this groundwater were determined biweekly concurrently with determinations made in the treatment reactors. Nutrients were determined at the beginning and end of the experiment. Each time, 1 L of the influent was sampled and deep-frozen until analyzed at LAERF. Alkalinity, pH, NtL-N were analyzed in unfiltered samples, while total dissolved solids (TDS), N03-N, total-phosphorus (Total-P),
Chapter 2 Materials and Methods

ortho-phosphorus (P04-P), sulphate (S04), calcium (Ca), and manganese (Mn) were analyzed in 0.45-um filtered water samples. The chemical composition of the groundwater is listed in Table 2; abbreviations of explosives are listed in Appendix A. RDX is the primary contaminant with TNT and trinitrobenzene (TNB) also being of concern.
Sediment
Sediment used as a control in the experiment originated from Stump Lake, IAAP. It was excavated at the beginning of September, transferred into polypro- pylene 19-L buckets, transported to WES, and stored in a cold room (5 °C). It was prepared for the experiment by decanting the water from each bucket and fully blending the remaining contents using a mechanical mixer. Dry weight was determined from a 34-g wet weight sample. The chemical composition of this sediment is listed in Table 3. This sediment is low in organic matter (77 g kg DW"1) and cation exchange capacity (CEC); (34 meq 100 g DW"1). Portions of 2 kg wet weight (FW), representing 1.030 L per reactor, were included in the experiment.
Microbial Seed
The microbial seed, used as one of the amendments, originated from a 1.5-year-old continuous culture originally inoculated with three different fresh- water and marine sediments and soils from four different Department of Defense (DoD) munitions plants. At the time of use, this culture was growing in an M8 salts medium containing A9 trace elements solution and 100 mg 26DNT L"1. It exhibited an ability to degrade TNT and DNT, and to mineralize TNT under aerobic conditions. Isolates from this consortium included a Sphingomonas bacterium and an unidentified fungus (Gunnison et al. 1996,1997).
Experimental Design
This experiment was aimed at evaluating the effects of three plant species, without or with amendment (nitrogen, microbial seed), on explosives concen- trations under continuous-flow, mixed (by aeration), conditions at 25 °C. Groundwater with sediment, both unamended or amended, served as controls. Two amendments were evaluated: (a) nitrogen (N) to a final concentration of 50 mg N03-N L"1 groundwater, supplied as KNO3 to the water at a frequency of once in a 2-week period (added to unplanted sediment and sediment planted with each species), and (b) microbial seed to a final dilution of 10 times, at the begin- ning of the experiment (added to unplanted sediment and sediment planted with coontail). All treatment/amendment combinations were replicated three times. The total number of reactors in this experiment was 30 units.
Chapter 2 Materials and Methods
Experimental Conditions
The evaluation was carried out over a 49-day incubation period, 14 May to 2 July 1996. The experiment was conducted in a large walk-in controlled environment growth chamber set at 25 °C. Experimental units were 15-x 15-x 60-cm glass aquaria (reactors) for sediment planted with submersed plants and 15- x 15- x 37.5-cm aquaria for unplanted sediment and sediment planted with emergent plants. After test materials were placed in them, the reactors were filled with groundwater to a final water depth of 40 cm for submersed plants and 15 cm for emergent plants and controls.
Each experimental unit received groundwater from one central 208-L stain- less steel drum via an individual, self-priming, calibrated pump, and constant volume was maintained by gravity overflow. All experimental units had the same hydraulic retention time of 30 days. The reactors with sediment planted with submersed plants had inflow rates of 300 mL d"1 on a total volume of 9 L (excluding sediment), and those with unplanted sediment and sediment planted with arrowhead of 113 mL d"1 on a total volume of 3.375 L (excluding sediment). Rate of inflow of each system was maintained by calibrated pumps. Pumping systems were composed of a model No QG6 pump drive, a Ql SSY pump head, and a Q485 dial indicator (Fluid Metering, Oyster Bay, NY). AU units were aerated and operated simultaneously. The contents of the influent drum were replenished regularly. Teflon tubing was used to connect groundwater drum, experimental units, and effluent collection buckets.
Submersed plants were incubated as approximately 15-cm apical shoots at a density of 2 to 4 g fresh weight L"1, yielding six plants or 15 to 34 g plant mate- rial per aquarium. As emergent aquatics were expected to have one-third to one- half of their biomass above the water surface, about two to three times as much plant mass was incubated than used with submersed species. Emergent plants were incubated as seedlings at a density of 25 to 39 g FW L'1, yielding three plants or 84 to 130 g plant material per reactor.
High pressure sodium and metal halide lamps provided a full photosynthetic spectrum at 800 uE m"2 s"1 at 22.5 cm above the water surface. Irradiance approximated 50 percent ofthat in the field. Auto-timers provided a day length ofl4hr.
Experimental Procedures and Sampling
Influent to each reactor was sampled at 7, 14, 21, 28, 35, 42, and 49 days for explosives analysis. At each sampling event, 100 mL of water was collected using a 50-mL glass beaker and decanted into a glass bottle with a teflon-lined cap. Water samples were refrigerated (5 CC) in the dark until further processing, which usually occurred within 24 hr of collection. Dissolved oxygen concen- trations were measured within the reactors using a Model 59 YSI 02 meter and electrode (Yellow Springs, OH). The redox potential was measured at two sediment depths, 5 and 10 cm, using platinum electrodes permanently inserted in the sediment (Bohn 1971; Faulkner, Patrick, and Gambrell 1989). The difference
Chapter 2 Materials and Methods

in potential between these electrodes and a reference electrode was measured. Chlorophyll fluorescence of shoots (submersed species) or leaves (arrowhead) was measured to assess potential plant stress due to exposure to the contaminated groundwater.
Evapotranspiration was considerable and, consequently, extra groundwater had to be added to keep the reactor volumes at the required levels. These inci- dentally added groundwater volumes were not measured in the current study, but they were estimated from evapotranspiration rates measured in the preceding batch incubations (Best et al. 1997a), where rates of 0.6 mm d"1 were found for submersed plants and sediments and of 2.6 mm d"1 for emergent plants. Esti- mates of water lost by evapotranspiration, being equal to the water volumes to be added to the treated water quantities calculated above, were 0.0135 L d*1 for the submersed plants and sediment, and 0.0585 L d"1 for the emergent arrowhead. These rates increased the treated groundwater quantities by 4.5 percent for coon- tail and pondweed, by 52 percent for arrowhead, and by 12 percent for implanted sediment per HRT.
After the final water sampling, plant materials were removed and weighed. A dry:fresh weight (DW:FW) ratio was determined for each species by drying a weighed portion of material in a ventilated oven at 70 °C until constant weight was attained and reweighing. Relative growth rates were calculated by taking the natural log (In) transform of final plant DW divided by initial DW, and dividing by the 49 days of incubation (growth assumed to proceed exponentially). Sedi- ment was removed, weighed, placed in glass jars, and kept refrigerated until analysis.
Analyses
Explosives in water
Water samples, 100-mL, were concentrated using solid phase extraction (SPE); (Waters RDX cartridges, catalog no. 47220). Explosives were eluted in acetonitrile. The samples were evaporated almost to dryness using N2 redis- solved in a 2-mL mixture of acetonitrile:water (50/50 v/v), and analyzed using high performance liquid chromatography (HPLC) according to EPA Method 8330 (USEPA 1990; Jenkins et al. 1995). Concentration was by a factor of 50. HPLC separations were performed on a Hewlett-Packard 1090 Series 2/M with ChemStation (Pascal Series) liquid Chromatograph equipped with a diode array detector (Series 2), PV5 ternary solvent delivery system, thermostatically controlled column compartment, autosampler, autoinjector, reverse phase analytical C18 column (5 \i, 100- x 4.6-mm inner diameter), and Octyl Decyl Silane guard column (5 n, 20- x 4.0-mm inner diameter). The column compart- ment was operated at 40 °C and the flow rate of the mobile phase was 1.5 mL min"1. The composition of the mobile phase was 68 percent 20 mM NH4CI and a 32 percent mixture of methanol and n-butanol (98:2, respectively). The tested analytes included: 2,6DANT; 2,4DANT; RDX; TNB; 1,4DNB; 1,3DNB; NB; TNT; 2ADNT; 4ADNT; 2,4DNT; 2,6DNT; 2NT; 4NT; and 3NT. The
Chapter 2 Materials and Methods

explosives detection limit was 2 (ig L'1 (100 ug L"1 without SPE). The com- pounds used for the calibrations are listed in Appendix B. Azoxy compounds were not measured.
Explosives in plant material and sediment
Levels of explosives and the metabolic/degradation products of TNT and RDX were determined in plants and sediments at the end of the incubation period. Plant samples were quick-frozen in liquid N2 and ground into a fine powder. Two-g FW portions were extracted in 10-ml acetonitrile by an 18-hr sonication in a water-cooled (5-°C) ultrasonic bath. Samples were then centri- fiiged and left to sit for 1 hr. The extract supernatant (5 mL) was placed on a cleanup column prepared by layering 0.5 g of Florisil and 0.5 g of neutral alumi- num. The column was washed with another 5 mL of acetonitrile and the result- ing extract was diluted 1:1 with deionized water and analyzed by HPLC (EPA Method 8330 (USEPA 1990)). The tested analytes included: HMX; RDX; TNB; 1,3DNB; NB; TNT; 2ADNT; 4ADNT; 2,4DNT; 2,6DNT; 2NT; 4NT; 3NT; and Tetryl. Sediments were analyzed similarly, without grinding. Recent radiolabel mass balance studies in aquatic plants (Best et al. 1998) indicated that for TNT and RDX, 20 to 30 percent of the plant-absorbed 14C was extractable by aceto- nitrile, and 10 to 15 percent after cleanup by Florisil. The explosives detection limits ranged from 0.041 to 0.324 ug g FW"1 in soft tissues of submersed and emergent plants and from 0.5 to 2.0 ug g FW"1 in sediment.
Alkalinity, macronutrients, calcium, and manganese in water
The pH meter was calibrated with known buffer solutions (American Public Health Association, (APHA) 1992). Alkalinity was determined titrimetrically, as CaC03 (APHA 1992, No. 2320-B). NH4-N was measured using a selective ion electrode and meter (Orion 95-12/Orion 940; APHA 1992, No. 4500-NH3-G).
For the remaining analyses, the water samples were filtered over a 0.45-um Gelman GN-6 filter. Total Dissolved Solids (TDS) were determined by succes- sively evaporating the water of a 100-mL sample to dryness at 105 °C and weighing the residue (APHA 1992, No. 2540-C). NO3-N was measured using HPLC (Fa.Waters; APHA 1992, No. 4500-NO3-G). SRP was measured spectro- photometrically using a Shimadzu 1201 UVATS Single Beam Spectrophoto- meter (APHA 1992, No. 4500-PE). S04 was measured turbidimetrically (HACH Ratio turbidimeter; APHA 1992, No. 4500-SO4-B). The concentrations of total Ca and Mn were determined by Atomic Absorption Spectrophotometry after acidification with 1:1 HC1 to pH<2 (Varian Model SpectrAA-10; APHA 1992, No. 3500-Ca).
g Chapter 2 Materials and Methods
Macronutrients, ions, CEC, bulk density, and organic matter in sediment
Total Kjeldahl-nitrogen (N) and phosphorus (P) were determined from soil digests according to the same method as used for water. Exchangeable ammon- ium was extracted from the soil with 1 M NaCl and filtered. The filtrate was analyzed colorimetrically for ammonia via the salicilate method using a Lachat System (QuikChem Method No. 12-107-06-2-A, 1988). Available P was extracted using a dilute hydrochloric acid fluoride modified Bray extraction procedure and was analyzed colorimetrically via the ascorbic acid method using a Lachat System (QuikChem Method No. 12-115-01-1-A, 1988). Metals (Fe, Mg, and Mn) were determined as follows: 1 to 2 g dry soil aliquots were digested in nitric acid/hydrogen peroxide at 95 °C followed by reflux with hydro- chloric acid (USEPA SW-846 (USEPA 1990), Method 3050) and measured using inductively coupled plasma (ICP) analysis ( USEPA SW-846 (USEPA 1990), Method 6010). The CEC was determined in samples treated with sodium acetate followed by an isopropyl wash and back-extracted with ammonium acetate. The sodium concentration was then measured by ICP to obtain equivalents of cations.
Bulk density and moisture content were determined gravimetrically by dry- ing a known quantity of fresh weight to constant dry weight at 105 °C (Allen et al. 1974). Concentrations of organic matter were determined by loss on ignition at 550 °C. Total Organic Carbon (TOC) was measured using nondispersive infrared spectrometry (APHA 1992, method 5310 D).
Chlorophyll fluorescence
Chlorophyll fluorescence was measured of shoots of submersed and attached leaves of emergent plants in the reactors. Chlorophyll parameters (F0, fluores- cence after a dark adaptation period; Fm, maximal fluorescence; Fv, variable fluorescence, where Fv = Fm-F0Ti/2, half-rise time from F0 to Fm) were measured using a portable fluorescence meter (CF-1000 Chlorophyll Fluorescence Mea- suring System, Morgan, Andover, MA). Intact leaves of both stressed and con- trol plants were clamped in a small cuvette and adapted to darkness for 5 min prior to the measurement of chlorophyll fluorescence to maximize oxidation of the primary quinone electron acceptor pool of photosystem II (PSII) and to allow any rapidly recovering fluorescence quenching to fully relax. Measurements were made on the upper surface of the shoots (submersed) or the three apical leaves (emergent plants). Chlorophyll was excited for 5 sec by actinic light with a photon flux density of 200 umol m"2 s"1.
Data Analysis
Statistical analysis of explosives concentrations in the groundwater was carried out on the TNT and RDX data separately, using STATGRAPHICS Plus (Version 7; Statistical Graphics Corporation, Bitstream Inc., Cambridge, MA): analysis of variance (ANOVA) and multiple range tests. Significance was tested
Chapter 2 Materials and Methods

at the 95 percent confidence level. Where log transformation was required of data on nitrobody concentrations that were below detection, the detection level of 2 ug L"1 was used rather than zero. The data points representing all sampling times were included in ANOVA comparisons among treatments and amendments to identify those treatments and amendments with significantly lower concentra- tions over the entire incubation period.
Of all data from HPLC analysis of water samples, only those samples thought to have been incorrectly prepared for analysis or misinjected during HPLC ('empty chromatograms') were excluded. These amounted to two samples out of 265, or 0.8 percent.
Curve fitting to the RDX concentration data of an equation derived for zero- order kinetics of RDX in a mixed system under unsteady conditions, taking evapotranspiration into account, was performed using MATHCAD Plus (Version 6; Mathsoft Inc., Cambridge, MA).
Determination of Dose-Response Curves to TNT and RDX in Hydroponics
Dose-response curves to TNT and RDX, respectively, were determined for coontail, pondweed, and arrowhead. This was done to evaluate the toxicity of TNT and RDX to the plant species tested. The evaluation was carried out over 27-day periods in hydroponic culture. The experiment was conducted in the same walk-in controlled environment chamber as the continuous-flow experi- ment. Experimental units were 1-L glass Mason jars. The jars were filled with 0.8 L M-medium (Hillman 1961), amended with 40 mg bicarbonate-C L"1 and with the appropriate volume of a stock solution containing TNT or RDX. The medium was refreshed weekly, and for TNT the explosives concentration was increased midweekly. All jars were aerated. Measures aimed at preventing excessive algal growth were adding 50 g acid-washed and autoclaved fine gravel and wrapping the jars in aluminum foil leaving only the top open. Submersed species were incubated as a variable number of 15-cm apical shoots and emer- gent species as three intact plants. Density ranged from 1 to 40 g FW L"1 or 1 to 32 g FW per jar. All incubations were done in triplicate. Two separate runs were made, involving concentrations of 0, 0.5, 1, and 2 mg L"1 TNT or RDX, respec- tively. This range was chosen since a concentration >5 mg TNT L" proved lethal to all plants tested.
1 Q Chapter 2 Materials and Methods
3 Results and Discussion
Concentrations of Explosives and Degradation Products in Water: Effects of Plant Species and Amendments on Removal
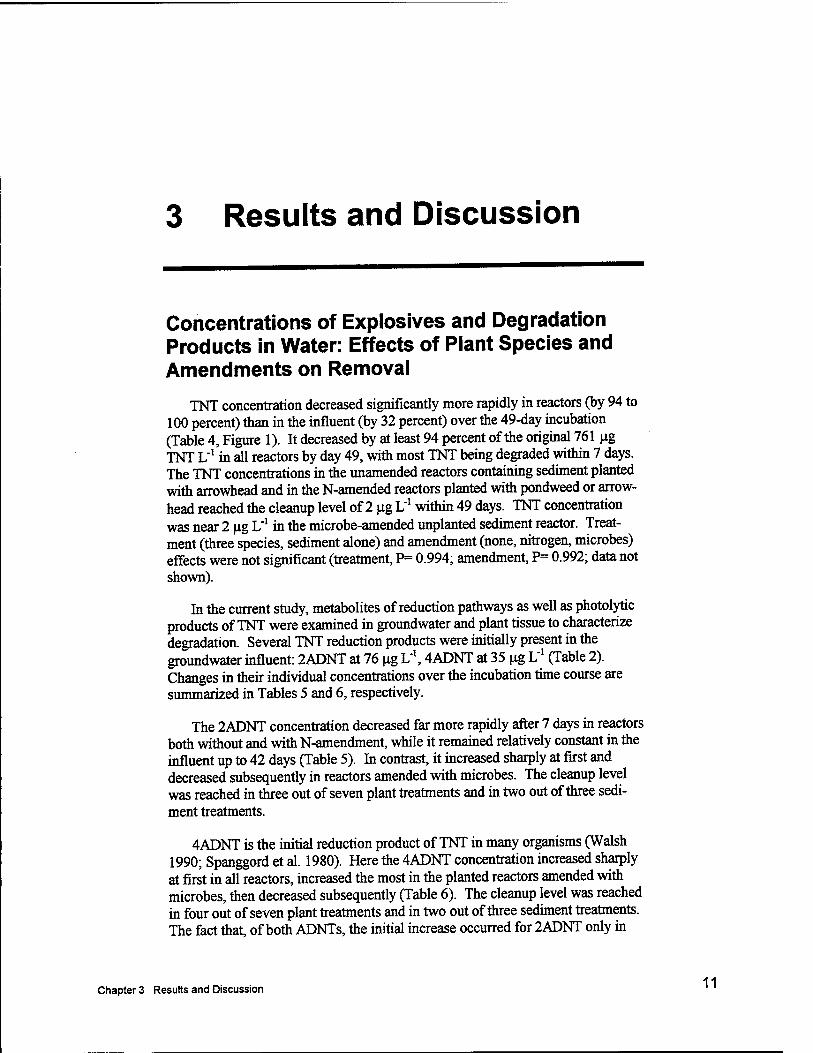
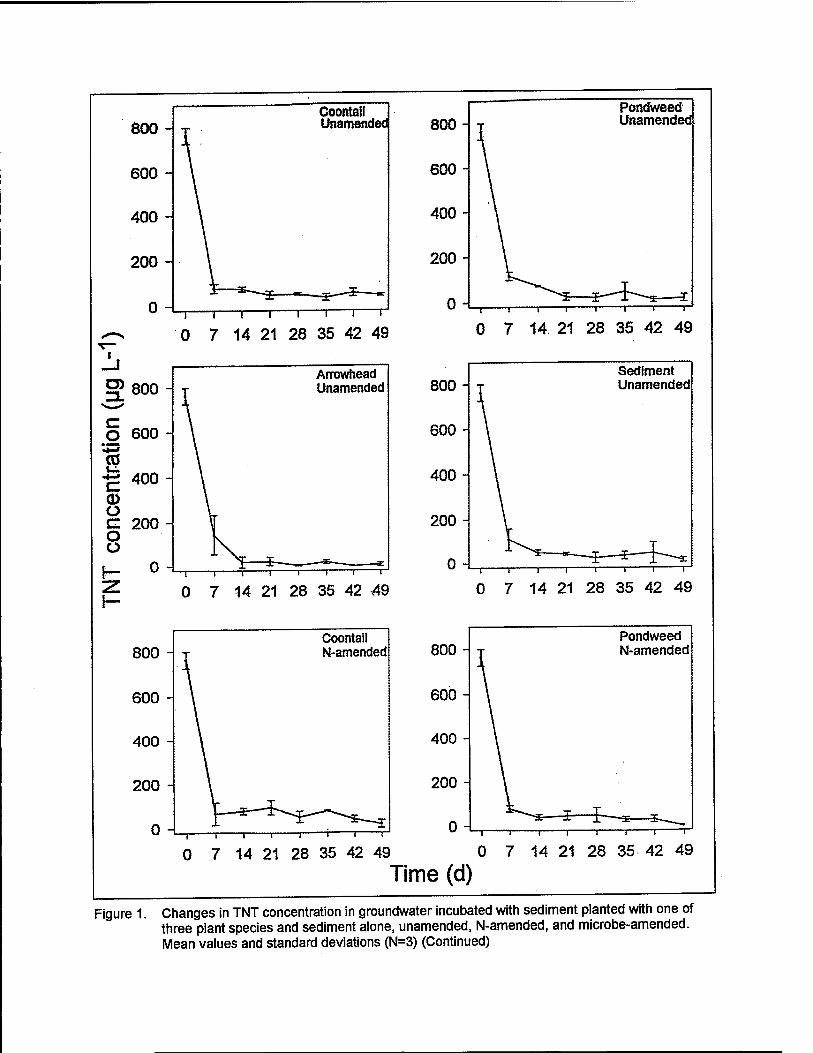
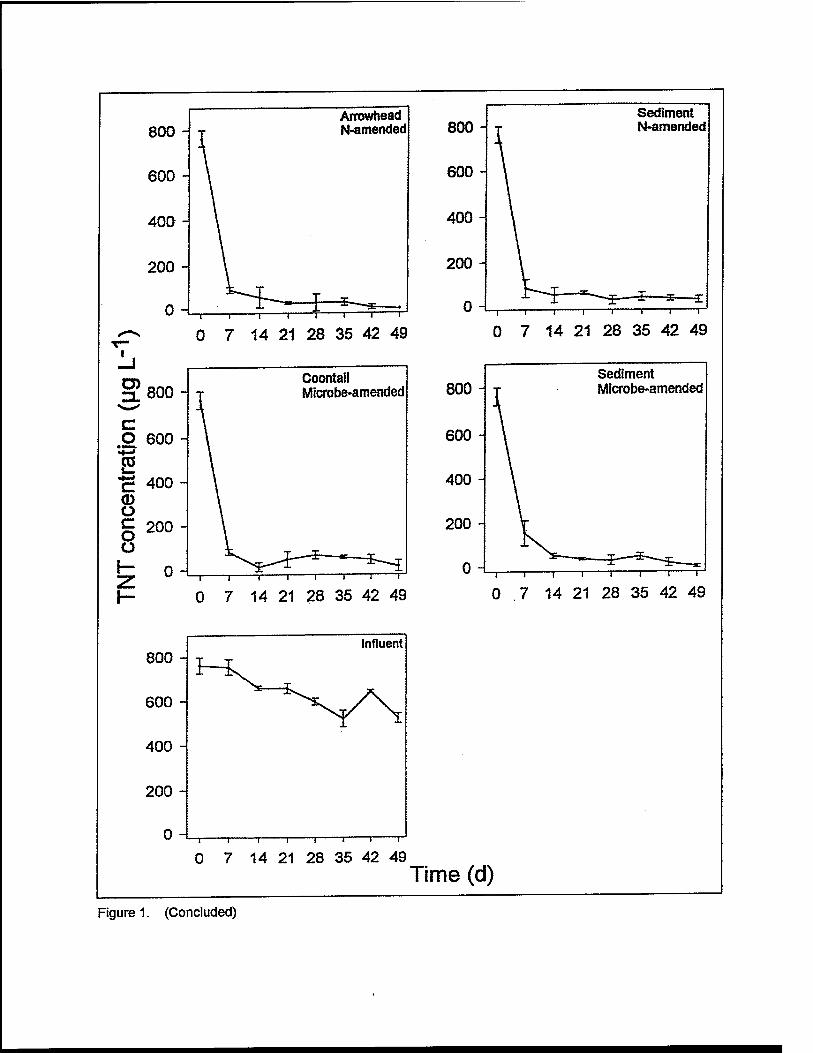
TNT concentration decreased significantly more rapidly in reactors (by 94 to 100 percent) than in the influent (by 32 percent) over the 49-day incubation (Table 4, Figure 1). It decreased by at least 94 percent of the original 761 ug TNT L"1 in all reactors by day 49, with most TNT being degraded within 7 days. The TNT concentrations in the unamended reactors containing sediment planted with arrowhead and in the N-amended reactors planted with pondweed or arrow- head reached the cleanup level of 2 ug L"1 within 49 days. TNT concentration was near 2 ug L"1 in the microbe-amended unplanted sediment reactor. Treat- ment (three species, sediment alone) and amendment (none, nitrogen, microbes) effects were not significant (treatment, P= 0.994; amendment, P= 0.992; data not shown).
In the current study, metabolites of reduction pathways as well as photolytic products of TNT were examined in groundwater and plant tissue to characterize degradation. Several TNT reduction products were initially present in the groundwater influent: 2ADNT at 76 ug L'1,4ADNT at 35 ug L"1 (Table 2). Changes in their individual concentrations over the incubation time course are summarized in Tables 5 and 6, respectively.
The 2ADNT concentration decreased far more rapidly after 7 days in reactors both without and with N-amendment, while it remained relatively constant in the influent up to 42 days (Table 5). In contrast, it increased sharply at first and decreased subsequently in reactors amended with microbes. The cleanup level was reached in three out of seven plant treatments and in two out of three sedi- ment treatments.
4ADNT is the initial reduction product of TNT in many organisms (Walsh 1990; Spanggord et al. 1980). Here the 4ADNT concentration increased sharply at first in all reactors, increased the most in the planted reactors amended with microbes, then decreased subsequently (Table 6). The cleanup level was reached in four out of seven plant treatments and in two out of three sediment treatments. The fact that, of both ADNTs, the initial increase occurred for 2ADNT only in
Chapter 3 Results and Discussion 11
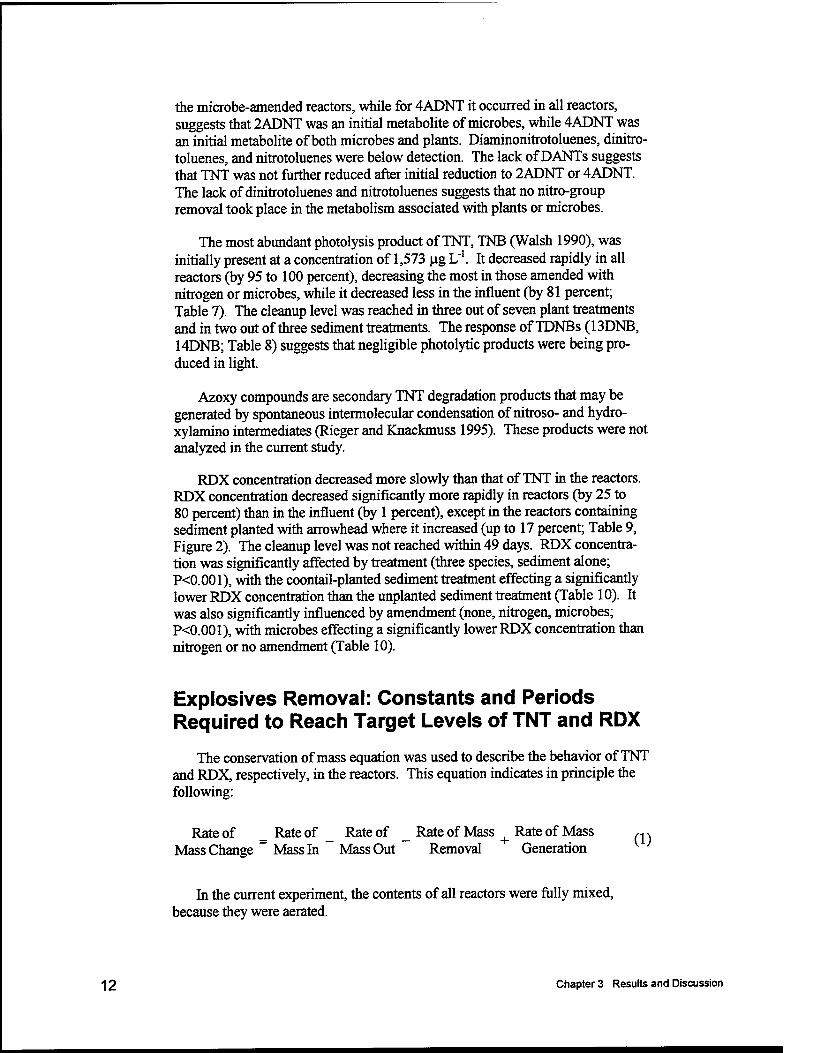
the microbe-amended reactors, while for 4ADNT it occurred in all reactors, suggests that 2ADNT was an initial metabolite of microbes, while 4ADNT was an initial metabolite of both microbes and plants. Diaminonitrotoluenes, dinitro- toluenes, and nitrotoluenes were below detection. The lack of DANTs suggests that TNT was not further reduced after initial reduction to 2ADNT or 4ADNT. The lack of dinitrotoluenes and nitrotoluenes suggests that no nitro-group removal took place in the metabolism associated with plants or microbes.
The most abundant photolysis product of TNT, TNB (Walsh 1990), was initially present at a concentration of 1,573 \ig L"1. It decreased rapidly in all reactors (by 95 to 100 percent), decreasing the most in those amended with nitrogen or microbes, while it decreased less in the influent (by 81 percent; Table 7). The cleanup level was reached in three out of seven plant treatments and in two out of three sediment treatments. The response of TDNBs (13DNB, 14DNB; Table 8) suggests that negligible photolytic products were being pro- duced in light.
Azoxy compounds are secondary TNT degradation products that may be generated by spontaneous intermolecular condensation of nitroso- and hydro- xylamino intermediates (Rieger and Knackmuss 1995). These products were not analyzed in the current study.
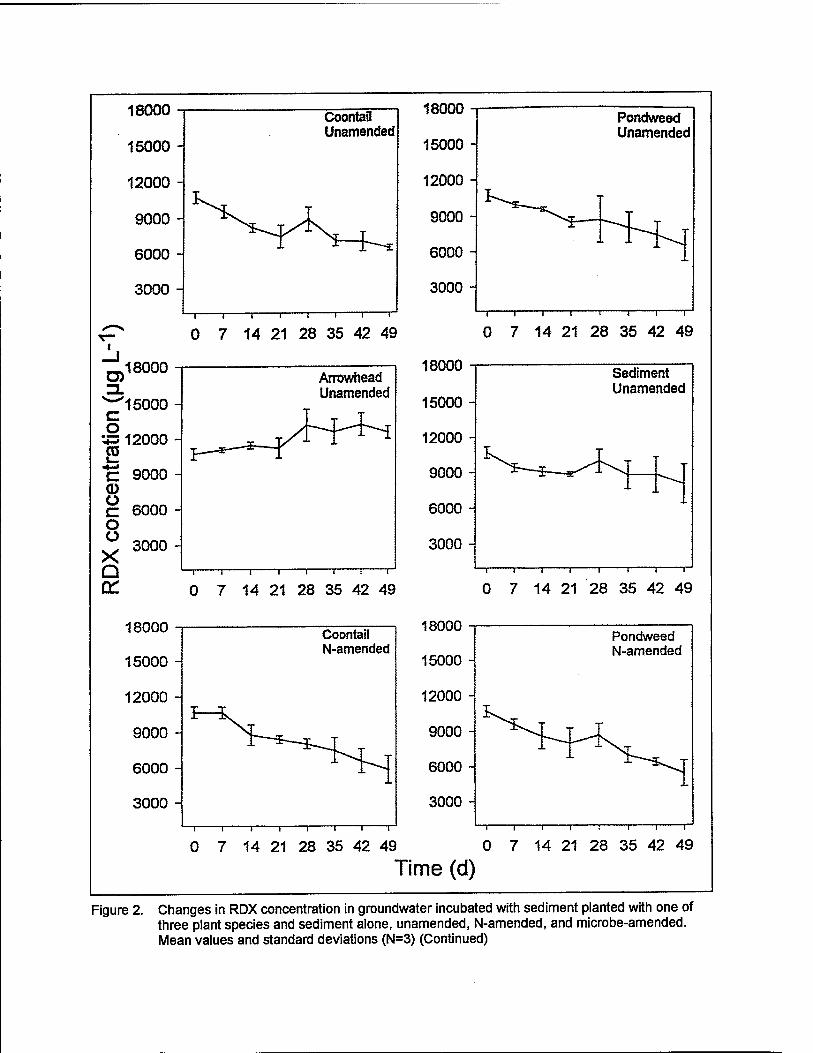
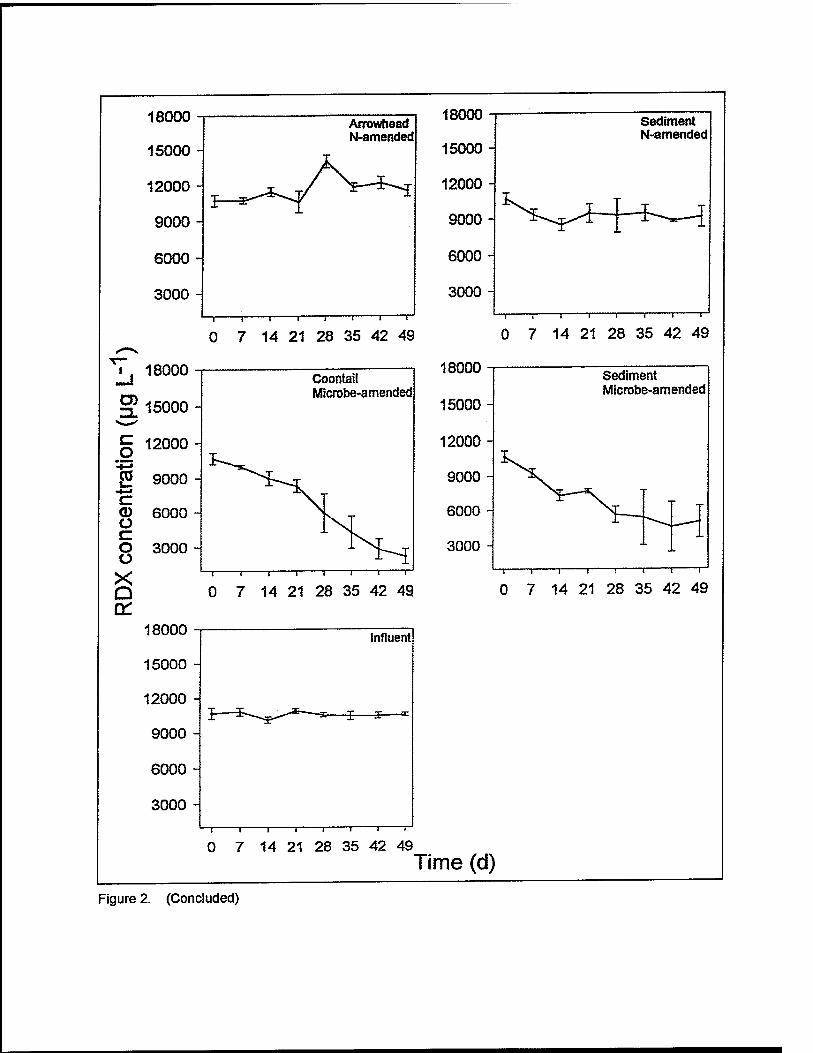
RDX concentration decreased more slowly than that of TNT in the reactors. RDX concentration decreased significantly more rapidly in reactors (by 25 to 80 percent) than in the influent (by 1 percent), except in the reactors containing sediment planted with arrowhead where it increased (up to 17 percent; Table 9, Figure 2). The cleanup level was not reached within 49 days. RDX concentra- tion was significantly affected by treatment (three species, sediment alone; PO.001), with the coontail-planted sediment treatment effecting a significantly lower RDX concentration than the unplanted sediment treatment (Table 10). It was also significantly influenced by amendment (none, nitrogen, microbes; PO.001), with microbes effecting a significantly lower RDX concentration than nitrogen or no amendment (Table 10).
Explosives Removal: Constants and Periods Required to Reach Target Levels of TNT and RDX
The conservation of mass equation was used to describe the behavior of TNT and RDX respectively, in the reactors. This equation indicates in principle the following:
Rate of _ Rate of _ Rate of _ Rate of Mass Rate of Mass „. Mass Change ~ Mass In Mass Out Removal Generation
In the current experiment, the contents of all reactors were fully mixed, because they were aerated.
12 Chapter 3 Results and Discussion

The TNT data show (Table 4; Figure 1) that the TNT concentration decreased exponentially (first-order kinetics). Moreover, steady state was reached in the reactors, indicating that the rate of mass change was zero at that time. Therefore, the following equation is applicable to the behavior of the TNT mass in the reactors:
C= £ (2) (l + X-x-Ev-x)
where
C = TNT concentration in effluent, mg L"1
C, = average TNT concentration in influent, mg L"1
X = first-order removal constant, d"1
x = hydraulic retention time, d
Ev = evaporation constant, d"1
The removal constant was made explicit, by rearranging terms in Equation 2. It was calculated using:
X = iA-I + £, (3) T C T
X was calculated by substituting for Ci the average TNT influent concentration (0.641 mg L"1), for C the average TNT concentration for the last two data points (Table 4), for x the hydraulic retention time (30 days), and for Ev the estimated evapotranspiration constants (0.0015 d"1 for coontail and pondweed planted sediment, 0.0200 d"1 for arrowhead planted sediment, and 0.0040 d"1 for implanted sediment reactors).
For the same, fully mixed conditions, the time required to reach the target level of 0.002 mg TNT L"1 was calculated by making this parameter explicit in Equation 2. It was calculated using:
'C, O J. X
L.=KC XJr (4)
X
where
U = period of time for which calculation is performed
Chapter 3 Results and Discussion ' ^
tt was calculated by substituting for C, the TNT influent concentration (0.761 mg TNT L"1), for C the target effluent concentration (0.002 mg TNT L"1), for Ey values as given above, and for X the values calculated using Equation 3.
Different mass conservation equations apply to different hydraulic condi- tions. Plug-flow conditions are common in wetlands and are often assumed to exist in formulating design criteria. The following equation pertains to TNT mass following first-order kinetics and reaching steady state, under plug-flow conditions.
C = Ci.e^-X)Z (5)
For plug-flow conditions, the time required to reach the target level of 0.002 mg TNT L"1 was calculated by making this parameter explicit using Equation 5. It was calculated using:
(Ev-V (6)
U was calculated by substituting for Q the TNT influent concentration (0.761 mg TNT L"1), for C the target effluent concentration (0.002 mg TNT L"1), for Ev the values as given above, and for X the values calculated using Equation 3.
The RDX data show (Table 9; Figure 2) that the RDX concentration decreased linearly (zero-order kinetics). Moreover, steady state was not reached in the reactors. Assuming zero-order kinetics and complete-mix hydraulics, the following equation is applicable to the behavior of the RDX mass in the reactors.
C = A + (Ci-A)-e-Bx (7)
where
A = -rf - (8) --1 x
B = --Ev (9) T
K = zero-order removal rate, mg L" d"
The removal rate, K, was found by fitting the best curve through Equation 7 compared to the measured data, after substituting for C, the RDX influent con- centration (10.698 mg L"1), for C the average RDX concentration for the last two
14 Chapter 3 Results and Discussion

data points (Table 9), for x the hydraulic retention time (30 days), and for Ev the estimated evapotranspiration constants (of 0.0015 d"1 for coontail and pondweed planted sediment, 0.0200 d"1 for arrowhead planted sediment, and 0.0040 d"1 for implanted sediment reactors). Fitted and measured curves are presented in Figure 3.
For the same, fully mixed conditions, the time required to reach the target level of 0.002 mg RDX L'1 was calculated by making this parameter explicit in Equation 7. It was expected to be calculated using:
1 B
rC-A^ (10)
It was attempted to calculate tt by substituting for C, the RDX influent concentration (10.698 mg RDX L"1), for C the target effluent concentration (0.002 mg RDX L*1), for Ev values as given above, and for K the values calcu- lated using Equation 7. However, since the term (C - A/Q - A) is negative in all cases, U could not be defined. Thus, the target level of 0.002 mg RDX L"1 is never attained in these reactors under mixed conditions.
Different mass conservation equations apply to different hydraulic condi- tions. Plug-flow conditions are common in wetlands and are often assumed to exist in formulating design criteria. The following equation pertains to RDX mass following zero-order kinetics and without reaching steady state, under plug- flow conditions:
C=- E,-t
(11) v J
For plug-flow conditions, the time required to reach the target level of 2 ug RDX L"1 was calculated by making this parameter explicit in Equation 11. It was calculated using:
t= In c K ^
EV
V
K (12)
tt was calculated by substituting for C, the RDX influent concentration (10.698 mg RDX L"1), for C the target RDX concentration (0.002 mg RDX L"1), for Ev values as given above, and for X the values calculated using Equation 7. However, since the term (C - K/£^)/(C, - K/EV) is negative for the arrowhead- planted sediment reactors, tt could not be defined for these cases. Thus, the target level of 0.002 mg RDX L"1 is never attained in arrowhead-planted reactors under plug-flow conditions.
The results of the calculations, carried out using the given equations, are presented in Table 11. For TNT, removal constants decreased in the order of
Chapter 3 Results and Discussion 15

arrowhead> pondweed> sediment> coontail, ranging from 8.533 to 0.375 d"\ Using these removal constants, cleanup periods of 45 to 1,015 days were calcu- lated for unamended treatments, periods of 63 to 520 days for N-amended treatments, and periods of 217 to 588 days for microbe-amended treatments under fully mixed conditions. Cleanup periods were greatly reduced under plug- flow conditions, ranging from 1 to 16 days. The extremely rapid decrease in TNT concentration suggested by a cleanup period of 1 day was confirmed to exist in earlier batch incubations with aquatic or wetland plants (Best et al. 1997b).
For RDX, removal rates were higher in planted than in implanted sediment reactors, unamended as well as N-amended, but they were equal in planted and unplanted sediment reactors when amended with microbes. Removal rates ranged from 0.28 to 0.13 mg L"1 d'1. RDX cleanup levels were not reached under fully mixed conditions. Cleanup periods under plug-flow conditions ranged from 79 to 200 days for submersed species and unplanted sediment treatments. An RDX cleanup period for the arrowhead treatment could not be calculated. In the latter case, RDX was removed to a considerable extent, as was demonstrated by the removal rates of 0.14 and 0.18 mg L"1 d"1. However, due to the higher than estimated evapotranspiration rate of this species, the amount of water leaving the reactors always exceeded the amount of RDX and caused the aqueous RDX concentration in the reactor to increase.
Dissolved Oxygen Concentration in Water and Redox Potential in Sediments
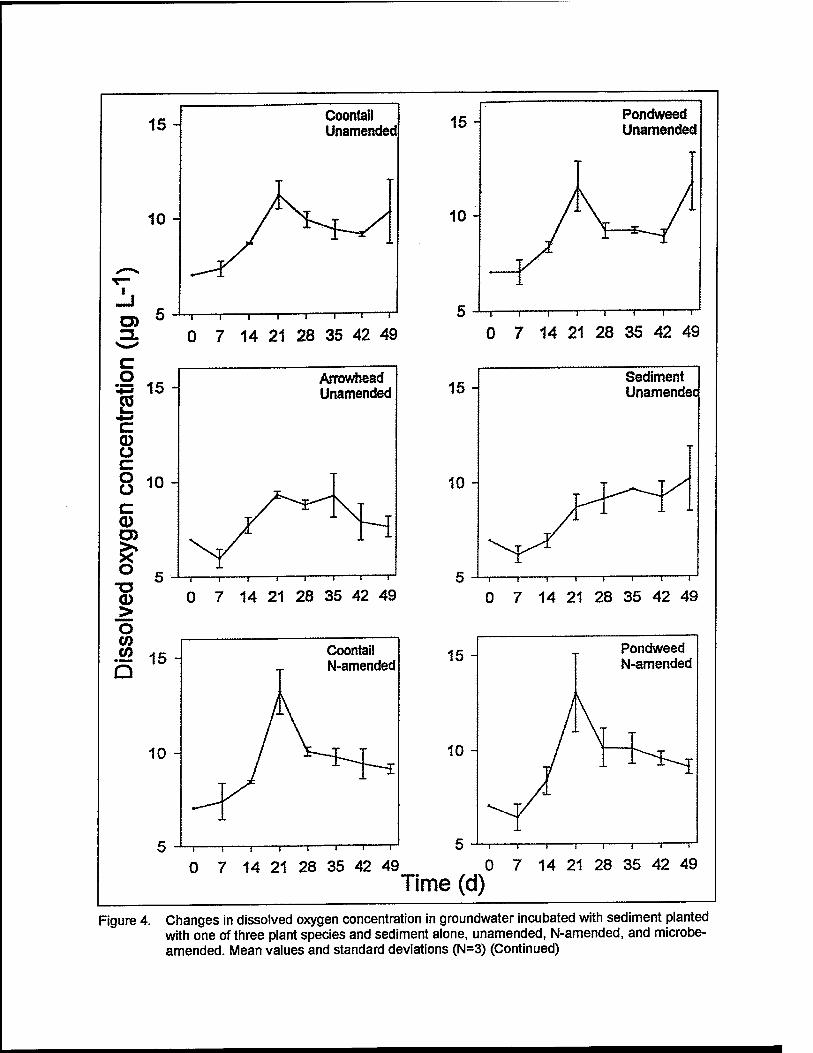
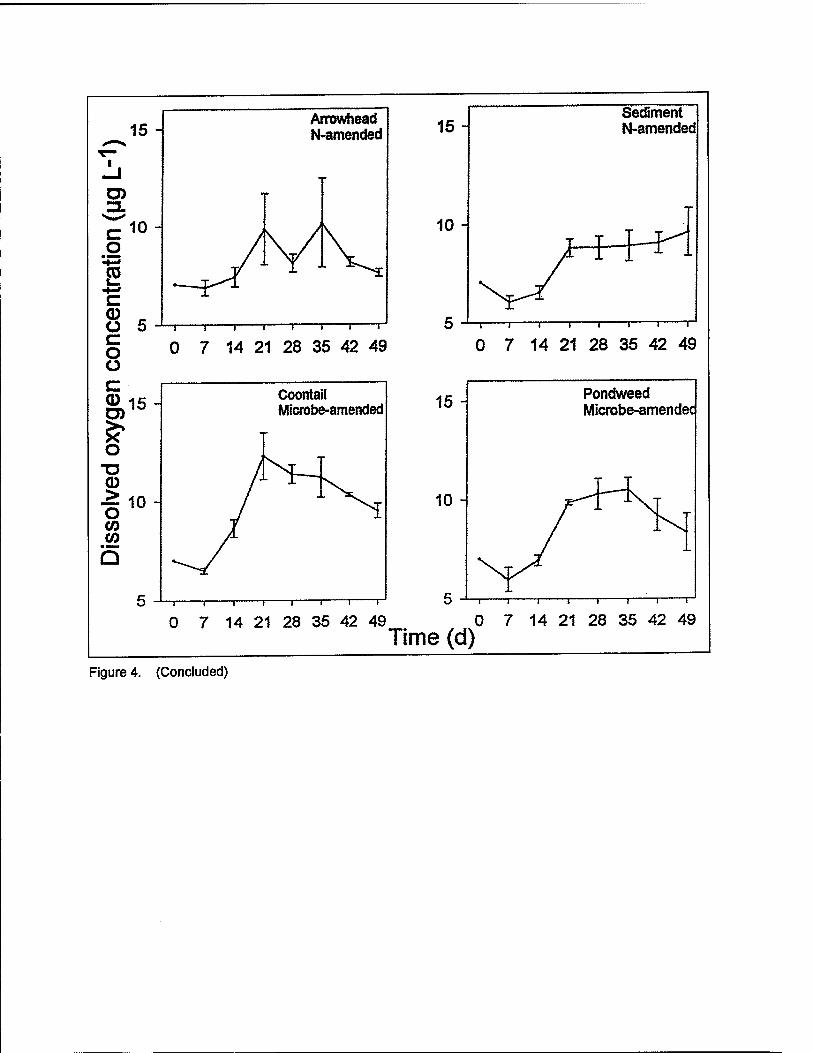
Dissolved oxygen concentrations in the water increased significantly during incubation. They varied between 8 and 15 mg 02 L*1. High values were reached during algal blooms in the N-amended reactors (Figure 4).
Redox potential (Eh) decreased steadily from 0 to < -200mV in the sediments of the submersed plant treatments and in the microbe-amended unplanted sedi- ment treatment. It fluctuated and covered a far wider range in the arrowhead and other unplanted sediment treatments (Figure 5). In the case of arrowhead, these fluctuations may have been caused by oxygen evolving from the roots (Chen and Barko 1988). In all unplanted sediment treatments, algae (phytoplanktonic and filamentous) were abundantly present. However, in some of the latter reactors sprouting pondweed seedlings may have contributed to oxygenation of the sedi- ment. The redox potential at a 5-cm sediment depth may have influenced con- taminant removal mechanisms at the sediment surface involving adsorption and biotransformation by microorganisms. Changes in Eh indicate changes in elec- tron acceptor speciation, in that an Eh change from 100 mV to -100 mV involves a shift in electron acceptors from Fe3+ to sulphate, and to -250 mV to carbon dioxide and organic acids (Faulkner and Richardson 1989). Since the survival and activity of different bacteria(l groups) depends on electron acceptors, changes in Eh may change species composition and physiological activity within consortia.
1 g Chapter 3 Results and Discussion

Explosives and Degradation Products in Plant Material and Sediments
TNT and known TNT degradation products were below detection in plant material and sediment at the end of the incubation (Table 12). The lack of TNT degradation products in the plant material is contrary to earlier results demon- strating 4ADNT in pondweed, and TNT, 2ADNT, and 4ADNT in arrowhead after a 10-day, hydroponic, incubation (Best et al. 1997a,b). This may be explained by the fact that the current incubation period was longer (49 versus 10 days), so that TNT and known TNT degradation products formed initially in or outside the plants decreased to levels below detection later on. Other explanations may be that TNT has been metabolized to unknown products.
RDX was found in all plants in low concentrations, i.e., maximally 1.7 mg kg DW1 in arrowhead shoots. Higher concentrations have been measured in arrowhead roots (7 mg kg DW"1) and reed canary grass shoots (10 mg kg DW"1) at the Line 1 site of the IAAP prior to excavation (Schneider et al. 1995). RDX concentrations in plants were also low compared to those in water. A mononitroso-analog of RDX (MNX) was found in concentrations that were lower than those of RDX in pondweed and arrowhead roots. RDX was found in almost all sediments, except those of the pondweed treatment and those amended with microbes (Table 12). Lack of RDX in the latter three cases sug- gests strong degradation of RDX and/or conversion to unknown products in these sediments due to microbial activity and stimulated by pondweed. MNX occurred only in the sediment of the N-amended, implanted sediment treatment (Table 12).
The presence of RDX in all plants in concentrations that were low compared to those in water and the presence of only one known RDX degradation product (MNX) may indicate that the plants exhibited low RDX uptake rates. Other explanations may be that RDX was metabolized in or outside the plants largely to unknown products, or that the absorbed RDX degradation products were non- extractable in acetonitrile.
Plant Health and Growth
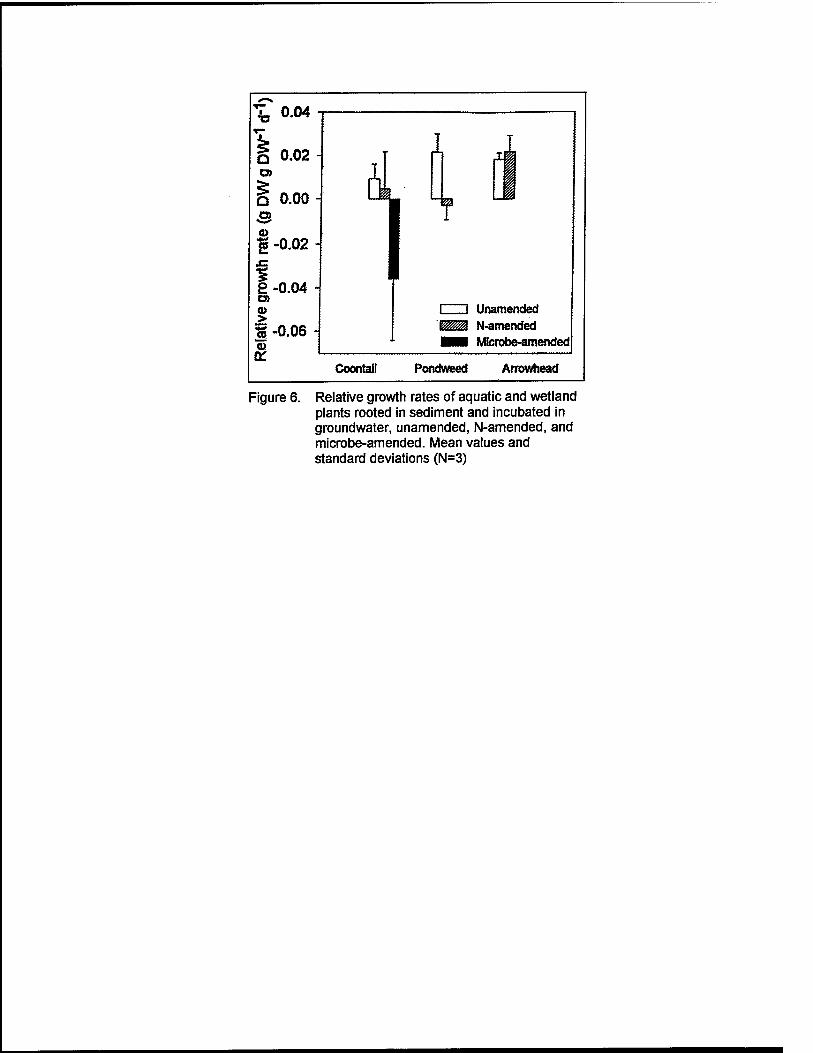
Relative growth rates were low in plants incubated without amendment (Fig- ure 6). Normal relative growth rates under natural conditions are in the order of 0.03 to 0.04 g DW g DW d"1 for coontail (net, on ash-free dry weight basis; Best and Dassen 1987), 0.062 for a similar pondweed species, sago pondweed (net, on dry weight basis; Madsen and Adams 1988) and 0.083 g DW g DW d"1 for arrowhead (net, on dry weight basis; Chen and Barko 1988). Mass loss occurred in N-amended pondweed and in microbe-amended coontail.
N-amendment stimulated algal blooms resulting in attenuation of light available for the submersed macrophytes. Coontail was relatively tolerant to these conditions due to its exceptionally rapid N scavenging and, consequently, successful competition with the algae for this element (Toetz 1971). However, pondweed proved sensitive to light attenuation. In contrast, the emergent
Chapter 3 Results and Discussion 17
arrowhead was stimulated in its growth by N, which suggests that it may have been N-limited in the reactors without N-amendment.
Microbe-amendment of coontail showed rapid colonization of the plants by microorganisms (probably fungi, since plants were wrapped in white flocculating material), initial light attenuation by cyanobacterial blooms, and partial decom- position of some weakened plants.
The low growth rates of the submersed plants were attributed largely to disturbance (frequent adjustments and sampling events) and for some coontail plants to toxicity of the RDX level in the groundwater RDX (see paragraph on Dose-Response Curves, page 19), since limitation by light or nutrients was unlikely. Irradiance was high enough to saturate photosynthesis (Van, Haller, and Bowes 1976). Nutrient levels in the groundwater were sufficient to sustain growth (Table 2; Best et al. 1997b), and amendment with N did not stimulate plant growth, indicating that N was not limiting. Aeration supplied oxygen and, through mixing, prevented the formation of unstirred water layers around the latter plants, limiting the transport of carbon and nutrients to the tissues. The low growth rate of the emergent arrowhead, however, was attributed to limitation by light and nutrients, and potential toxicity of the groundwater RDX (see paragraph on Dose-Response Curves, page 19). Irradiance was 50 percent of ambient and may not have saturated photosynthesis. Available nitrogen may have been limiting, since N-amendment stimulated plant growth.
Chlorophyll fluorescence was measured to discriminate between various components of photosynthesis in relation to contaminant-induced stress. Light energy utilized by plants is absorbed by a number of photosynthetic pigments with absorption spectra covering a large range of the available light energy. The most prominent pigments that absorb this energy are chlorophyll-a and chlorophyll-b. Approximately 3 percent of the light energy absorbed by the chlorophyll pigments is reemitted as fluorescence at 685 nm. Chlorophyll fluorescence is sensitive both to direct effects on the photosynthetic apparatus and to other physiological effects which feed back to photosynthesis. Therefore, many changes in overall bioenergetic status of the plant can be detected by a change in chlorophyll fluorescence (Miles 1990). Fluorescence measurements have the advantage of being nondestructive and noninvasive.
The standard fluorescence parameters FSFm and FJF0 were measured. Fv is the variable fluorescence; Fm the maximum fluorescence; and F0 the fluorescence after dark adaptation. Tm, the half-rise time from F0 to Fm, was also measured, because this parameter is expected to decrease in chloroplasts in which electron transport from Photosystem II is inhibited completely, e.g. in the presence of herbicides like diuron and atrazine (Renger and Schreiber 1986). However, TU2
does not change in plants that are herbicide-resistant, either through exclusion or detoxification of the herbicide. Since one of the contaminants of the tested groundwater, RDX, shares many physico-chemical characteristics with atrazine, Im was considered an important measure in the present case. The initial FJFm
ratio was similar in all plant species, 0.56 to 0.61. This ratio was lower in all plants during incubation than when growing in the greenhouse. F^Fm for coon- tail was lowest in the unamended, higher in the N-amended, and highest in the
<\ 3 Chapter 3 Results and Discussion
microbe-amended incubations (Table 13), indicating the highest energy loss at the latter amendment. The lowest FJFm ratio coincided with the highest relative growth rate (Figure 6). Similarly, for pondweed and arrowhead, the lowest FJFm
ratio coincided with the highest relative growth rate (Table 13; Figure 6). The same relationship was found for the FJF0 ratio. However, TV2 was not informa- tive (data not shown), since the average value barely changed and standard devi- ations were too large to be conclusive. The fact that Tm did not shorten in the plants tested may indicate that their resistance toward the explosives is based on exclusion or on detoxification mechanisms.
Dose-Response Curves to TNT and RDX in Hydroponics
Growth responses to ranges of explosives concentrations were determined in the same plant species as used in the continuous-flow systems (Figure 7).
TNT in concentrations <2 mg L"1 stimulated growth in most plants, with 0.5 mg TNT L"1 having the largest effect. Growth stimulation was attributed to TNT degradation products serving as indirect nitrogen source for plant growth. Toxicity of TNT to plants was determined by extrapolation of the measured rela- tive growth rates to higher concentrations, taking the standard deviations into consideration. Thus, a lethal concentration range of 6 to 7 mg TNT L"1 was esti- mated. This lethal concentration range is within the earlier published, wider, toxic range of 2 to 15 mg L"1 for aquatic plants (Schott and Worfhley 1974; Smock, Stoneburner, and Clark 1976).
RDX in concentrations <1 mg L"1 stimulated growth in all plants, but in con- centrations between 1 and 2 mg L"1, the stimulation was only in submersed species. However, RDX concentrations which stimulated growth most differed per species, being 0.5 mg RDX L"1 in coontail, >2 mg L"1 in pondweed, and 1 mg L"1 in arrowhead. Growth stimulation in the presence of RDX was, as for TNT, attributed to RDX degradation products serving as indirect nitrogen source for plant growth. Lethal concentration ranges, determined by extrapolation (see above), were 1.8 to >10 mg RDX L'1 in coontail (due to the large SD of the growth response at 2 mg L"1), and 1.5 to 2.5 mg L"1 RDX in arrowhead. Since none of the tested concentrations inhibited growth in pondweed, no lethal con- centration could be determined in this species.
Tentative aerobic pathways leading to the formation of nitrogenous sub- stances that can be utilized by plants are: (a) for TNT: partial reduction of the nitro-groups, followed by aromatic ring-cleavage and N02 formation (Rieger and Knackmuss 1995); and (b) for RDX: photolysis to N02 and the azayl radical (Spanggord et al. 1980). Nitrite is a major intermediate in ammonification in which nitrate is reduced to ammonium; die latter can directly be assimilated by plants.
From comparison of the TNT and RDX concentrations in the influent of the continuous-flow systems with the toxicity ranges derived from the dose-response curves, the following can be concluded. The influent TNT concentration of
Chapter 3 Results and Discussion 19
0.5 to 0.7 mg L"1 may have stimulated plant growth. In contrast, the influent RDX concentration of 10.6 to 10.7 mg L*: may have stimulated growth in submersed plants but inhibited that in the emergent arrowhead. Among sub- mersed species, RDX may have stimulated growth in some coontail plants but reduced growth in others (based on the large standard deviations in growth response to 2 mg RDX L"1; Figure 7). RDX stimulated growth in all pondweed plants (small standard deviations in growth responses to RDX; Figure 7). Arrowhead proved sensitive to RDX concentrations between 1.5 and 2.5 mg L":
under hydroponic conditions where roots are directly in contact with ambient water. However, arrowhead can be far less sensitive when exposed to the same RDX concentrations when rooted in sediment, where interstitial contaminant concentrations can differ significantly from those in the water column. The latter is illustrated by the substantial growth exhibited by arrowhead in the continuous- flow reactors, where it was rooted in sediment.
20 Chapter 3 Results and Discussion
4 Conclusions
Explosives Removal Removal rates for TNT and RDX were calculated for implanted sediment
and sediment planted with a singular plant species (three species). The highest removal constant for TNT was found for the emergent arrowhead. Higher removal rates for RDX were found in planted rather than in unplanted sediment treatments, unamended or N-amended. RDX removal rates were the same in unplanted and coontail-planted sediment treatments when microbe-amended.
Using these removal rates, cleanup periods to reach a 2 ug L"1 target level can be estimated for TNT in wetlands under either fully mixed or plug-flow conditions. For RDX, however, it was demonstrated that these target levels are not expected to be reached under fully mixed conditions. Target levels will be reached by unplanted sediment and sediment planted with either submersed coontail or pondweed treatments under plug-flow conditions but not by arrowhead-planted sediment treatment.
The cleanup periods reported here are expected to be typical for the plant species tested, since plants were incubated at natural densities. However, under natural conditions, plant growth, plant-inherent explosives removal, and pho- tolysis are expected to be higher due to higher irradiance.
Explosives Residues
TNT and TNT degradation products were below detection in plants and sediments. In contrast, RDX was detected in all plants and almost all sediments, except when planted with pondweed without amendment and when unplanted or coontail-planted with microbe-amendment. All RDX levels were low, being maximally 1.7 mg kg"1 dry weight in arrowhead shoots. One RDX metabolite was found in pondweed and arrowhead roots, but at lower levels than those of RDX. RDX accumulation in herbivores from ingestion of arrowhead shoots is expected to be low, since these shoots are not popular among waterfowl or macrofauna. However, accumulation may occur from ingestion of subterranean tubers, which form a favorite food source for these animals.
Chapter 4 Conclusions 21
Plants
All plant species tolerated the groundwater but showed low growth rates. Amendment with nitrogen stimulated growth of the emergent arrowhead.
22 Chapter 4 Conclusions
References
Allen, S. E., Grimshaw, H. M., Parkinson, J. A., and Quarmby, C. (1974). Chemical analysis of ecological materials, S. E. Allen et al., ed., Wiley, New York, 21-22.
American Public Health Association. (1992). Standard methods for the examination of water and wastewater, 18 ed. APHA.
Best, E. P. H., and Dassen, J. H. A. (1987). "Biomass, stand area, primary production characteristics and oxygen regime of the Ceratophyllum demersum L. population in Lake Vechten, The Netherlands," Arch. Hydrobiol/Suppl. 76, 347-367.
Best, E. P. H., Sprecher, S. L., Fredrickson, H. L., Zappi, M. E, and Larson, S. L. (1997a). "Screening submersed plant species for phytoremediation of explosives-contaminated groundwater from the Milan Army Ammunition Plant, Milan, Tennessee," Technical Report A-97-24, U.S. Army Engineer Waterways Experiment Station, Vicksburg, MS.
Best, E. P. H., Zappi, M. E., Fredrickson, H. L., Sprecher, S. L., and Miller, J. (1997b). "Screening of aquatic and wetland plant species for phytoremedia- tion of explosives-contaminated groundwater from the Iowa Ammunition Plant," Technical Report EL-97-2, U.S. Army Engineer Waterways Experiment Station, Vicksburg, MS.
Best, E. P. H., Zappi, M. E., Fredrickson, H. L., Larson, S. L., Sprecher, S. L., and Ochman, M. S. (1997c). "Fate of TNT and RDX in aquatic and wetland plant-based systems during treatments of contaminated groundwater," Ann. N.Y. Acad. Sei. 829,179-194.
Best, E. P. H., Sprecher, S. L., Larson, S. L., and Fredrickson, H. L. (1998). "Environmental behavior and fate of explosives in groundwater from the Milan Army Ammunition Plant in aquatic and wetland plants. Fate of TNT and RDX," U.S. Army Environmental Center Report SFIM-AEC-ET-CR- 97060, Aberdeen Proving Ground, MD.
Bohn,H. L. (1971). "Redoxpotentials," Soil Science 112: 39-45.
References 23

Binks, P. R, Nickiin, S., and Bruce, N. C. (1995). "Degradation of hexahydro- l,3,5-trinitro-l,3,5-triazine (RDX) by Stenotrophomonas maltophilia PB1," Appl.Environ. Microbiol. 61,1318-1322.
Chan, R. L., and Barko, J. W. (1988). "Effects of freshwater macrophytes on sediment chemistry," J. Freshw. Ecol. 4, 279-289.
Faulkner, S. P., Patrick, W. H., Jr., Gambrell, R P. (1989). "Field techniques for measuring soil parameters," Soil Soc. Amer. J. 53, 883-890.
Faulkner, S. P., and Richardson, C. J. (1989). "Physical and chemical charac- teristics of freshwater wetland soils," Constructedwetlands forwastewater treatment. Municipal, industrial and agricultural. D. A.Hammer, ed., Lewis Publishers Inc., Chesea, ML, 41-71.
Gorontzy, T., Drzyzga, 0., Kahl, M. W., Bruns-Nagel, D., Breitung, J., Von Loew, E., and Blotevogel, K. H. (1994). "Microbial degradation of explosives and related compounds," Criti. Rev. Microbiol. 20, 265-284.
Gunnison, D., Kaplan, D., Allen, A., Mello, C, Walker, J. E., and Yang, A. (1996). "Threshold for microbial utilization of 2,4,6-Trinitrotoluene," Abstracts of 96th Amer. Soc. Microbiol. Meeting, New Orleans, LA, 19-23 May 1996, 452.
Gunnison, D., Fredrickson, H. L., Kaplan, D. L., Allen, A. L., Mello, C. M., Walker, J. E., Myrick, G., Evans, W. E., and Ochman, M. (1997). "Appli- cation of continuous culture technology for the development of explosives- degrading microorganisms," Ann. N. Y. Acad. Sei. 829,230-242.
Hillman, W. S. (1961). "Experimental control of flowering in LemnalU. A relationship between medium composition and the opposite photoperiodic responses of Lemna perpusilla 6746 and Lemna gibba G3," Amer. J. Bot. 48, 413-416.
Hughes, J. B., Shanks, J., Vanderford, M, Lauritzen, J., and Bhadra, R (1997). 'Transformation of TNT by aquatic plants and plant tissue cultures," Environ. Sei. & Tech. 31, 264-270.
Jenkins, T. F., Miyares, P. H, Myers, K. F., McCormick, E. F., and Strong, A. B. (1995). "Comparison of solid phase extraction with salting-out solvent extraction for preconcentration of nitroaromatic and nitramine explosives from water," Anal. Chim. Acta 289, 69-78.
Madsen, J. D., and Adams, M. S. (1988). "The nutrient dynamics of a sub- mersed macrophyte community in a stream ecosystem dominated by Potamogetonpectinatus L.,"J. Freshw. Ecol. 4, 541-550.
Marvin-Sikkema, F. D., and De Bont, J. A. M. (1994). "Degradation of nitro- aromatic compounds by microorganisms," Appl. Microbiol. Biotechnol. 42, 499-507.
24 References
McLellan,W. L., Hartley, W. R, and Brower, M. E. (1992). Hexahydro-1,3,5- Trinitro-l,3,5-Triazine (RDX). Drinking-water health advisory: Munitions, Lewis Publishers, Boca Raton, FL, 133-180.
Miles, D. (1990). "The role of chlorophyll fluorescence as a bioassayfor assessment oftoxicity in plants," Standard Technical Publication 1091, American Society for Testing and Materials, Philadelphia, PA, 297-309.
Pennington, J., and Patrick, W. (1990). "Adsorption and desorption of 2, 4, 6- Trinitrotoluene by soils," J. Environm. Qual. 19, 559-567.
Renger, G., and Schreiber, U. (1986). "Practical applications of fluorometric methods to algae and higher plant research." J.Amesz Govindjee, and D. CFork, ed., Light emission by plants and bacteria. Academic Press Inc., New York, 587-614.
Rieger, P. G., and Knackmuss, H. J. (1995). "Basic knowledge and perspectives on biodegradation of 2,4,6-trinitrotoluene and related mtroaromatic com- pounds in contaminated soil." Biodegradation ofnitroaromatic compounds. J. C. Spain, ed., Plenum Press, New York, 1-18.
Schneider, J. F., Zellmer, S. D., Tomczyk, N. A., Rastorfer, J. R, Chen, D., and Banwart, W. L. (1995). "Uptake of explosives from contaminated soil by existing vegetation at the Iowa Army Ammunition Plant," U.S. Army Environmental Center Report No. SFIM-AEC-ET-CR-95013, Aberdeen Proving Ground, MD.
Schnoor, J. L., Licht, L. A., McCutcheon, S. C, Wolfe, N. L., and Carreira, L. H. (1995). "Phytoremediation of organic and nutrient contaminants. Pilot and full-scale studies are demonstrating the promise and limitations of using vegetation for remediating hazardous wastes in soils and sediments," Environ. Sei. & Tech. 29, 318-323.
Schott, C. D., and Worthley, E. G. (1974). "The toxicity of TNT and related wastes to an aquatic flowering plant: Lemna perpusilla Torr," Technical Report No. EB-TR-74016, Edgewood Arsenal, Aberdeen Proving Ground, MD.
Sikora, F. J., Behrends, L. L., Phillips, W. D., Coonrod, H. S, Bailey, E, and Bader, D. F. (1997). "A microcosm study on remediation of explosives- contaminated groundwater using constructed wetlands," .4««. N. Y. Acad. Sei. 829, 202-219.
Small, M. J., and Rosenblatt, D. H. (1974). "Munitions production products of potential concern - Phase Ü," Technical Report 7404. AD919031, U.S. Army Medical Bioengineering R&D Laboratory, Fort Derrick, Frederick, MD.
Smart, R M., and Barko, J. W. (1985). "Laboratory culture of submersed freshwater macrophytes on natural sediments," Aquat. Bot. 21, 251-265.
References 25

Smock, L. A., Stoneburner, D. L., and Clark, J. R. (1976). "The toxic effects of trinitrotoluene (TNT) and its primary degradation products on two species of algae and flathead minnow," Water Res. 10, 534-543.
Spain, J. C. (1995). "Bacterial degradation of nitroaromatic compounds under aerobic conditions. Biodegradation of nitroaromatic compounds," Biodegra- dation of nitroaromatic compounds. J. C. Spain, ed., Plenum Press, New York, 19-34.
Spanggord, R. J., Mill, T., Chou, T. W., Mabey, W. R , Smith, J. H, and Lee, S. (1980). "Environmental fate studies on certain munition wastewater con- stituents. Phase I. Literature review," Final Report. Contract No. DAMD17- 78-C-8081. SRI International, Menlo Park, CA.
Spanggord, R. J., Mabey, W. R., Mill, T., Chou, T. W., Smith, J. H., Lee, S, and Roberts, D. (1983). "Environmental fate studies on certain munitions waste- water constituents. Phase IV - Lagoon model studies," Final Report Phase IV. DAMD17-78-C-8081. SRI International, Menlo Park, CA.
Toetz, D.W. (1971). "Diurnal uptake of N03 andNH4 by a Ceratophyllum peri- phyton community," Limnol. Oceanogr. 16, 819-822.
U.S. Environmental Protection Agency. (1989). 'Trinitrotoluene health advisory," Office of Drinking Water, Washington, DC.
. (1990). 'Test methods for evaluating solid wastes," SW-846, 3rd
ed., Revision, Office of Solid Waste and Emergency Response, Washington, DC.
Van, T. K., Haller, W. T.3 and Bowes, G. (1976). "Comparison of the photo- synthetic characteristics of three submersed aquatic plants," Plant Physiol. 58, 761-768.
Van Beelen, P., and Bums, D.R (1995). "Reduction of the explosive 2, 4, 6- Trinitrotoluene by enzymes from aquatic sediments," Environ. Toxicol. Chem. 14,2115-2123.
Walsh, M. E. (1990). "Environmental transformation products of nitroaromatics and nitramines: Literature review and recommendations for analytical method development," Special Report 90-2, U.S. Army Engineer Cold Regions Research and Engineering Laboratory, Hanover, NH.
26 References
600 -
600
400 H
200
0 4
Coontall Unamended
T 1 1 1 1 1 1 r
0 7 14 21 28 35 42 49
S? 800 -
§ 600 *-» KS +5 400 0 Ü C 200 o Ü
0 4
Arrowhead Unamended
-i 1 1 1 1 1 i
0 7 14 21 28 35 42 49
800 -
600
Coontail N-amended
800 H
600
400
200
04
Pondweed Unamended
-i ! r 1 1 1 1 r
0 7 14 21 28 35 42 49
800
600-
400
200
Sediment Unamended
-i 1 1 1 1 1 1 r
0 7 14 21 28 35 42 49
800 - T Pondweed N-amended
600 - \
400 - \
200- \
0 - -a=—
L"f I" T— —r... —i 1 1 r1 -1 1—
0 7 14 21 28 35 42 49 0 7 14 21 28 35 42 49 Time (d)
Figure 1. Changes in TNT concentration in groundwater incubated with sediment planted with one of three plant species and sediment alone, unamended, N-amended, and microbe-amended. Mean values and standard deviations (N=3) (Continued)
Arrowhead N-amended
-£-* -I 1 1 1 1 r
0 7 14 21 28 35 42 49
Coontail Microbe-amended
-*--* T 1 i 1 1 r
0 7 14 21 28 35 42 49
800 - Influent
600 - ^V^ 400 -
200-
0 - 1—i 1 1 1 1 1 1 r1
0 7 14 21 28 35 42 49
800
600
400
200
0 -I
Sediment N-amended
I i -i -T 1 1 1 1 1 1
0 7 14 21 28 35 42 49
800 - Sediment Microbe-amended
-i 1 1 1 1 1 1 r
0 7 14 21 28 35 42 49
Time (d)
Figure! (Concluded)
18000
15000 -
12000 -
9000 -
6000
3000
.18000 ö) w15000 H c •4= 12000 -\
C 9000 - <D C 6000 -| o ^ 3000
Q
18000
15000
12000
9000
6000
3000 H
Coontaii Unamended
-T 1 1 1 1 r
0 7 14 21 28 35 42 49
Arrowhead Unamended
_, , , r
0 7 14 21 28 35 42 49
Coontaii N-amended
1 1 r
18000
15000
12000 H
9000
6000 -
3000 -
Pondweed Unamended
-i 1 1 1 1 1 1 r
0 7 14 21 28 35 42 49
18000
15000
12000 -
9000 -
6000
3000
Sediment Unamended
~\ r
0 7 14 21 28 35 42 49
15000 -
Pondweed N-amended
12000 -
9000 -
6000 - -£~*~~"3k»^ T
3000 -
■'i i i ■ "■: r- 'I i
0 7 14 21 28 35 42 49 0 7 14 21 28 35 42 49
Time (d)
Figure 2. Changes in RDX concentration in groundwater incubated with sediment planted with one of three plant species and sediment alone, unamended, N-amended, and microbe-amended. Mean values and standard deviations (N=3) (Continued)
18000
15000
12000
9000
6000
3000
Arrowhead N-amended
I—*
-T 1 1 1 1 1 1 r
0 7 14 21 28 35 42 49
i -J U) ZL
C o
c <D Ü C o Ü X Q
1ÖUUU -
15000 -
Coontai! Microbe-amended
12000 -
9000 -
6000 -
3000 -
0 7 14 21 28 35 42 49
18000
15000
12000 -
9000
6000 H
3000
Influent
-4E J S-
-i 1 1 1 1 1 1 r
0 7 14 21 28 35 42 49
18000
15000 -
12000 -
9000
6000 -
3000
Sediment N-amended
-T 1 1 1 1 1 r
0 7 14 21 28 35 42 49
18000
15000 -
3000
Sediment Microbe-amended
-i 1 1 1 1 1 1 r
0 7 14 21 28 35 42 49
Time (d)
Figure 2. (Concluded)

-8 -8 f -« ); -3
4 -8 F -8
-8 4M» • j "S . • / . o <u i «D • / F \0T E -X^ •a &
- o
-S
- ©
* t —i—i—i—
CM O CO « f IN O «0 «0
-8
, -s
. o
XI w
'•/ ■8 CO 0.
1 1
-8 - o
P - o g ' •o <r <
E , , ,-.
CM o öD a j ^ N o to «J -<r
I- ©
. -s . y -s y. fc • y^ * ^r A L.
/ -? y -9 t
■ %! 0) > o /: -s yf -s S) _ o o CO
c
■o ) -8 "o y
-8 •5
■8 o
co a> /• . o . o
03 s^ u ° c
5 / £ / E ./ 03 o s - o c ' - o T3 -^ c
o CD o n
3 T
D. (0 Ü
^ r —I 1 1—
CM O 00 «1 ■ > < ■
t CM O CO (0 1 r c 4 O <D to *t W a a:
/ -s , . o in .. y IO
1
T3 J -s y/ -3 L/ -3 ©
<^; -s / - S ^r -8 c
■<g 7? -8
. o "5 i^v
■8
. o 1 /^ -8 . o
CD
3 ■o
c o s^ - o o ' - o O * - o £ o o O 3
(> '■» O CO
<* 1 1 T
CM O «0 « 3 1
i , | , , r CM O 03 tt> V c M O 00 to T Ct a)
«■* «■• r- •— 5
papustueun
(t-1ß
pgpuauie-N
UU) UOftRHUSOUOO XQVJ
papuauiB-aqojoi|/\| to £ 3 O) u_
15
10
O)
Coontail Unamended
5 -*—i 1 1 1 1 1 1 r
0 7 14 21 28 35 42 49
C
Sl6H s c 0) o
Arrowhead Unamended
15-
10
Pondweed Unamended
-T i 1 1 1 1 1 r
0 7 14 21 28 35 42 49
15-
10
Sediment Unamendec
5 -1—i 1 1 1 1 1 1 f
0 7 14 21 28 35 42 49
15
10 -
Pondweed N-amended
1 i>5^i
5 ->—i 1 j 1 1 1 1 r1 5 -J—i 1 1 1 1 1 i r
0 7 14 21 28 35 42 49 0 7 14 21 28 35 42 49 Time (d)
Figure 4. Changes in dissolved oxygen concentration in groundwater incubated with sediment planted with one of three plant species and sediment alone, unamended, N-amended, and microbe- amended. Mean values and standard deviations (N=3) (Continued)
15 -
CD
C o ■ MM»
s c 0 ü c o Ü c 0 CO
10 -
Arrowhead N-amended
5 -*—i 1 1 1 1 1—i—
0 7 14 21 28 35 42 49
15
> O CO CO
10
Coontail Microbe-amended
i 1 r
15
10 -
Sediment N-amended
f-i
5 -1—i 1 1 1 1 1 1 r
0 7 14 21 28 35 42 49
15
10 -
Pondweed Microbe-amendec
0 7 14 21 28 35 42 49 0 7 14 21 28 35 42 49 Time (d)
Figure 4. (Concluded)

-300
-400
-500
CoontafI Unamended
14
5 cm depth 10 cm depth
—i 1 1 —I r-
21 28 35 42 49
E Arrowhead Unamended
—i 1 1 1 1 r-
14 21 28 35 42 49
Coontail N-amended
-400
-500
Pondweed Unamended
—i 1 1 1 1 r—
14 21 28 35 42 49
Sediment Unamended
—, 1 1 1 1 r-
14 21 28 35 42 49
0
-100 -|
-200
-300 H
-400
-500
Pondweed N-amended
T 1 1 1 1— -ÖUU 1 1 1 1 1 '
14 21 28 35 42 49 14 21 28 35 42 49 Time (d)
Figure 5. Changes in redox potential in sediment incubated with groundwater while planted with one of three plant species and sediment alone, unamended, N-amended, and microbe-amended. Mean values and standard deviations (N=3) (Continued)

.5* -500
Arrowhead N-amended
5 cm depth 10 cm depth
14 21 28 35 42 49
Coontail Microbe-amended
14 21 28 35 42 49
OH
-100
-200 -|
-300
-400 H
-500
0
-100
-200-|
-300
-400 -j
-500
Time (d)
Sediment N-amended
-T 1 1 1 1 r-
14 21 28 35 42 49
Sediment Microbe-amended
14 21 28 35 42 49
Figure 5. (Concluded)
0.04
S 0.02
Q 0.00 3
g -0.02 H
? S -0.04
> ^ -0.06 -\ 0) a:
1 fill
Unamended N-amended Microbe-amended
Coontail Pondweed Arrowhead
Figure 6. Relative growth rates of aquatic and wetland plants rooted in sediment and incubated in groundwater, unamended, N-amended, and microbe-amended. Mean values and standard deviations (N=3)

0.10
0.08
0.06 -
0.04 -
0.02 -
0.00 -
Coontail
1' II. i I ^-0.02
i
5 0.10 Q ö) °08
5 0.06 H Q 3-0.04 H
J2 0.02 H
x: o.oo -
—i 1 1 ! r—
0.0 0.5 1.0 1.5 2.0
Pqndweed
I
ill Www I
6 -0.02
O) CD .£ 0.10 •4-» JO Q) 0.08
CE 0.06 -
0.04 -
0.02 -
0.0 0.5 1.0 1.5 2.0
-0.02
Arrowhead
iu oioo.^M W —j 1 1 1 r—
0.0 0.5 1.0 1.5 2.0
TNT concentration (mg L~1)
-0.02 T 1 1 j r
0.0 0.5 1.0 1.5 2.0
u.iu - Pondweed
0.08 -
0.06 -
0.04 -
0.02 -
0.00 -
-0.02 -
k i
11 i i i
1 0.0 0.5 1.0 1.5 2.0
U.1U
0.08 -
Arrowhead
0.06 -
0.04 -
0.02 -
0.00 -
-0.02 - i i
1 i
CZZ2
1 1
0.0 0.5 1.0 1.5 2.0
RDX concentration (mg L_1)
Figure 7. Relative growth rates of aquatic and wetland plants in hydroponic culture and exposed to ranges of TNT and RDX concentrations, respectively. Mean values and standard deviations (N=3)
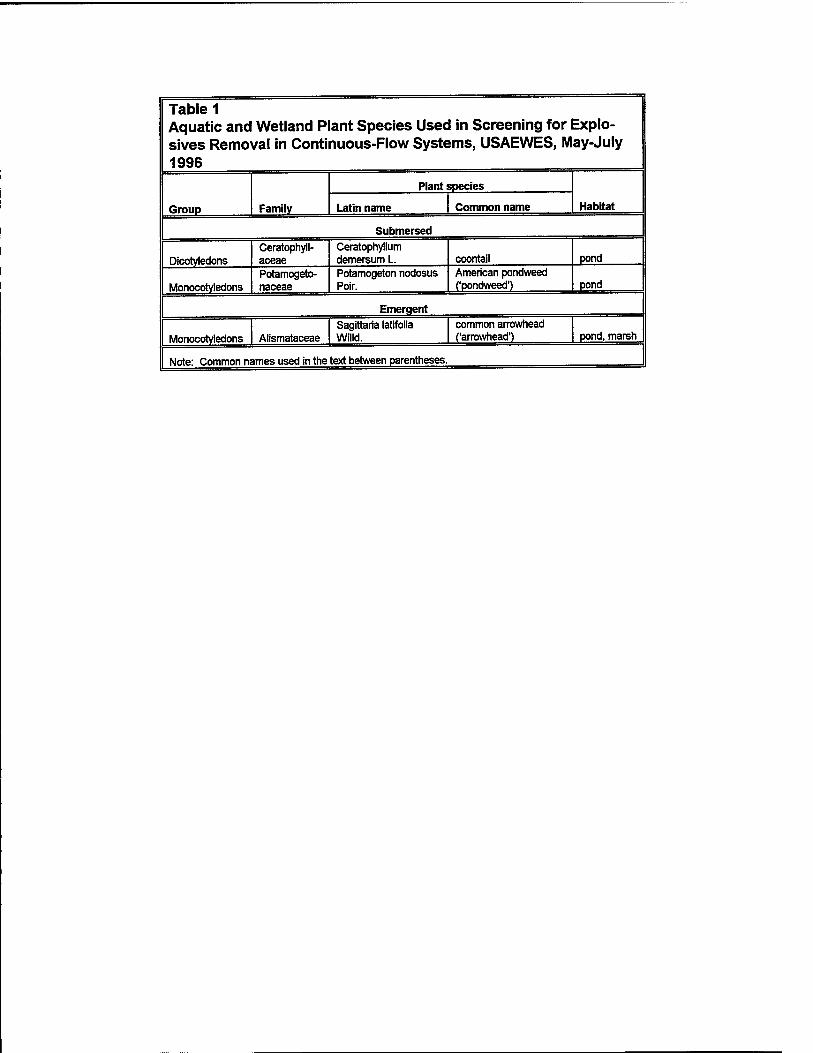
Table 1 Aquatic and Wetland Plant Species Used in Screening for Explo- sives Removal in Continuous-Flow Systems, USAEWES, May-July 1996
Group Family
Plant species
Habitat Latin name Common name
Submersed
Dicotyledons Ceratophyll- aceae
Ceratophyllum demersum L. coontail pond
Monocotyledons Potamogeto- naceae
Potamogeton nodosus Poir.
American pondweed ('pondweed') pond
Emergent
Monocotyledons Alismataceae Sagittaria latifolia Willd.
common arrowhead ('arrowhead') pond, marsh
Note: Common names used in the text between parentheses.

Table 2 Chemical Characteristics of the IAAP Groundwater Used as Influent in the Continuous-flow Systems
Parameter
Value
Initial Final
DH 7.0 + 0.0 7.6 + 0.1
Macro-, micronutrients (mg L'1)
Alkalinity 177 + 0.5 135 + 6.6
Total Dissolved Solids 81+2 693 + 20
Nitrate-nitrogen 74.8 + 1.5 66.3 + 0.9
Ammonium-nitrogen 0.26 + 0.00 0.03 + 0.00
Total-phosphorus 0.12 + 0.00 0.11+0.07
Phosphate-phosphorus 0.01 + 0.00 0.03 + 0.02
Sulfate 53.33 + 3.68 57.50+1.50
Calcium 93.10 + 1.19 74.30 + 4.49
Manganese 0.12 + 0.00 0.12 + 0.2
Explosives frig L-1>
Octahydro-1,3,5,7-tetranitro-1,3,5,7-tetrazocine (HMX) NA NA
2,6-Diamino-,4-nitro-toluene (2.6DANT) <2 <2
2,4-Diamino-,6-nitrotoluene (2.4DANT) <2 <2
Hexahydro-1,3,5-trinitro-1,3,5-triazine (RDX) 10698 + 761 10597+144
1,3,5-Trinitro-benzene (TNB) 1573 + 81 300 + 212
1,4-Dinitro-benzene (1,4DNB) <2 <2
1,3-Dinitro-benzene (1,3DNB) 41+6 21 +15
Nitrobenzene (NB) <2 <2
2,4,6-Trinitrotoluene (TNT) 761 + 36 520 ±22
2-Amino-dinitrotoluene (2ADNT) 76 + 10 34 + 49
4-Amino-, 2, 6-dinitrotoluene (4ADNT) 35 + 25 32±45 |
2,4-Dinitrotoluene (2.4DNT) <2 <2
2,6-Dinitrotoluene (2,6DNT) <2 <2
2-Nitrotoluene (2NT) <2 <2
4-Nitrotoluene (4NT) <2 <2
3-Nitrotoluene (3NT) <2 <2
Note: Mean values and standard deviations (N=3). NA, not analyzed.
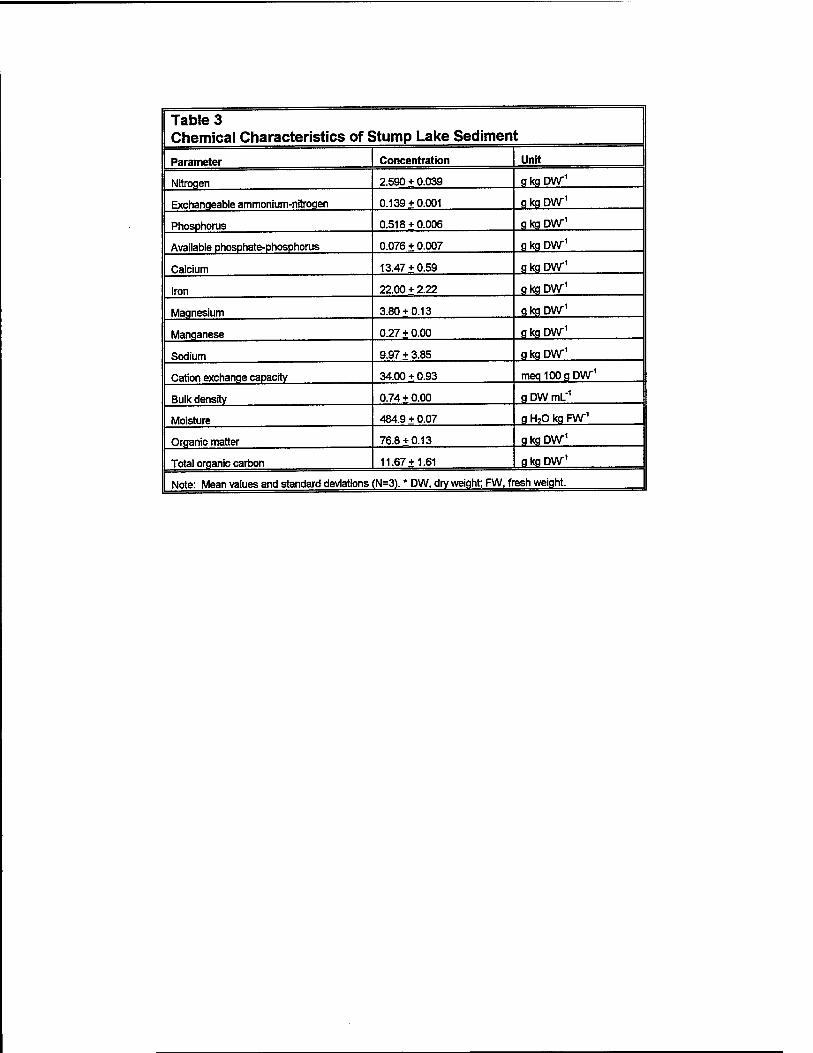
Table 3 Chemical Characteristics of Stump Lake Sediment
Parameter Concentration Unit
Nitroqen 2.590 + 0.039 g kg DW1
Exchangeable ammonium-nitrogen 0.139 + 0.001 gk9DW-1
Phosphorus 0.518 + 0.006 g kg DW1
Available phosphate-phosphorus 0.076 + 0.007 a kg DW1
Calcium 13.47 + 0.59 gkgDW-1
Iron 22.00 + 2.22 akgDW1
Magnesium 3.80 + 0.13 a kg DW1
Manganese 0.27 + 0.00 a kg DW1
Sodium 9.97 + 3.85 a kg DW1
Cation exchange capacity 34.00 + 0.93 meq 100 g DW1
Bulk density 0.74 + 0.00 g DW mL"1
Moisture 484.9 + 0.07 g H20 kg FW"1
Organic matter 76.8 + 0.13 g kg DW1
Total organic carbon 11.67 + 1.61 a ka DW1
Note: Mean values and standard deviations (N=3). * DW, dry weight; FW, fresh weight.
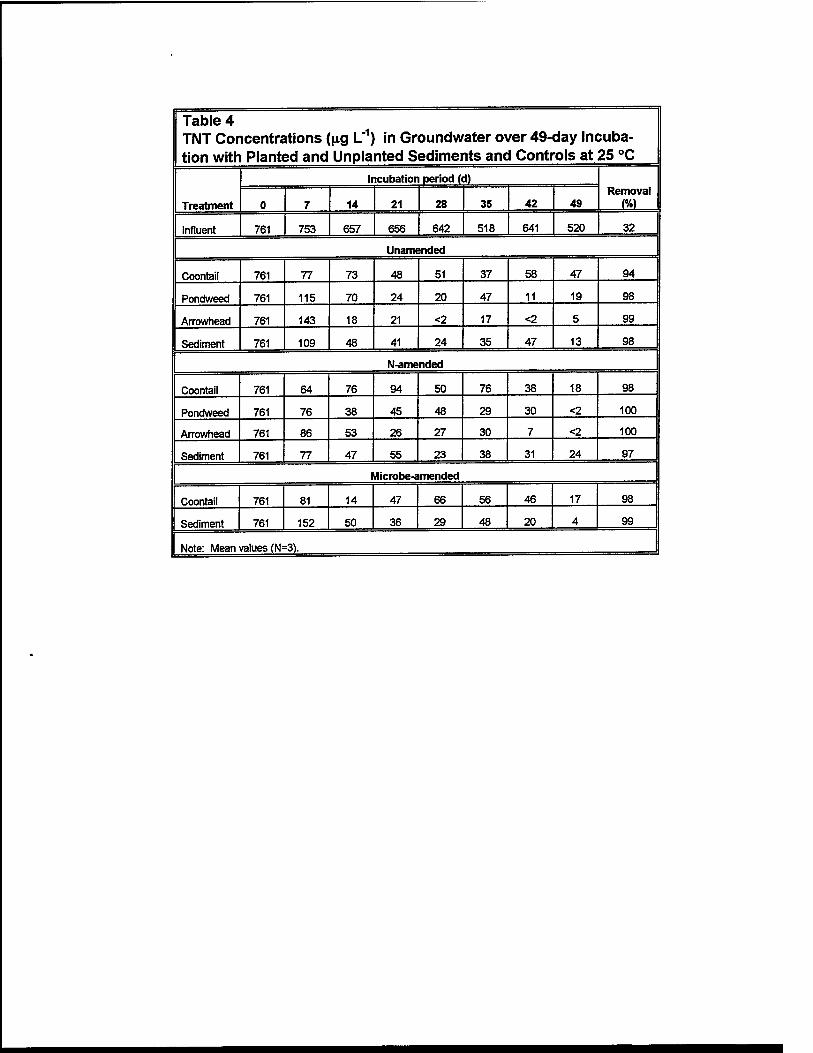
Table 4 TNT Concentrations (ng L"1) in Groundwater over 49-day Incuba- tion with Planted and Unplanted Sediments and Controls at 25 °C
Treatment
Incubation period (d) Removal
0 7 14 21 28 35 42 49
Influent 761 753 657 656 642 518 641 520 32
Unamended
Coontail 761 77 73 48 51 37 58 47 94
Pondweed 761 115 70 24 20 47 11 19 98
Arrowhead 761 143 18 21 <2 17 <2 5 99
Sediment 761 109 48 41 24 35 47 13 98
N-amended
Coontail 761 64 76 94 50 76 38 18 98
Pondweed 761 76 38 45 48 29 30 <2 100
Arrowhead 761 86 53 26 27 30 7 <2 100
Sediment 761 77 47 55 23 38 31 24 97
Microbe-amended
Coontail 761 81 14 47 66 56 46 17 98
Sediment 761 152 50 36 29 48 20 4 99
Note: Mean values (N=3).
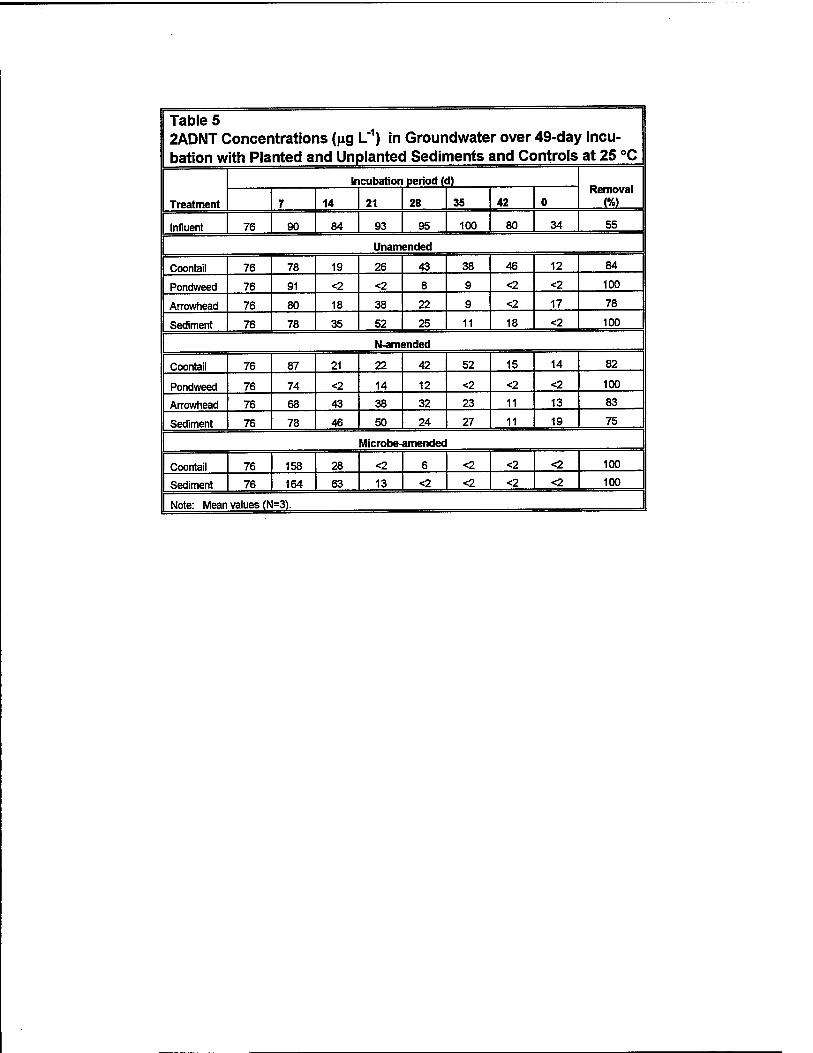
Table 5 2ADNT Concentrations (jig L"1) in Groundwater over 49-day Incu- bation with Planted and Unplanted Sediments and Controls at 25 °C
Treatment
Incubation period (d) Removal
(%) 7 14 21 28 35 42 0
Influent 76 90 84 93 95 100 80 34 55
Unamended
Coontail 76 78 19 26 43 38 46 12 84
Pondweed 76 91 <2 <2 8 9 <2 <2 100
Arrowhead 76 80 18 38 22 9 <2 17 78
Sediment 76 78 35 52 25 11 18 <2 100
N-amended
Coontail 76 87 21 22 42 52 15 14 82
Pondweed 76 74 <2 14 12 <2 <2 <2 100
Arrowhead 76 68 43 38 32 23 11 13 83
Sediment 76 78 46 50 24 27 11 19 75
Microbe-amended
Coontail 76 158 28 <2 6 <2 <2 <2 100
Sediment 76 164 63 13 <2 <2 <2 <2 100
Note: Mean values (N=3).

Table 6 4ADNT Concentrations (yg L'1) in Groundwater over 49-day Incu- bation with Planted and Unplanted Sediments and Controls at 25 °C
Treatment
Incubation period (d) Removal
(%) 0 7 14 21 28 | 35 42 49
Influent 35 36 34 I 70 71 | 76 55 32 9
Unamended
Coontail 35 103 47 47 46 31 23 4 89
Pondweed 35 77 <2 <2 9 10 <2 <2 100
An"owhead 35 94 21 21 21 19 9 10 71
Sediment 35 65 54 46 23 24 19 <2 100
N-amended
Coontail 35 127 44 54 45 35 21 12 66
Pondweed 35 62 <2 <2 <2 <2 <2 <2 100
Arrowhead 35 77 56 41 47 27 16 <2 100
Sediment 35 63 35 57 29 25 <2 10 71
Microbe-amended
Coontail 35 256 83 10 <2 <2 <2 <2 100
Sediment 35 192 74 43 <2 <2 <2 <2 100
Note: Mean values (N=3).
Table 7 TNB Concentrations (fig L"1) in Groundwater over 49-day Incuba- tion with Planted and Unplanted Sediments and Controls at 25 °C
Treatment
Incubation period (d) Removal
(%) 0 7 14 21 28 35 42 49
Influent 1573 1250 857 716 601 393 733 300 81
Unamended
Coontail 1573 69 47 41 36 33 14 2 100
Pondweed 1573 74 60 43 39 55 30 13 99
Arrowhead 1573 131 52 45 64 75 47 71 95
Sediment 1573 113 58 59 45 67 62 <2 100
N-amended
Coontail 1573 69 54 77 45 56 31 25 98
Pondweed 1573 82 54 55 72 75 46 <2 100
Arrowhead 1573 112 74 57 75 88 65 12 99
Sediment 1573 101 62 94 74 83 62 36 98
M icrobe-a mended
Coontail 1573 127 54 59 54 56 32 <2 100
Sediment 1573 196 65 64 55 64 41 <2 100
Note: Mean values (N=3).
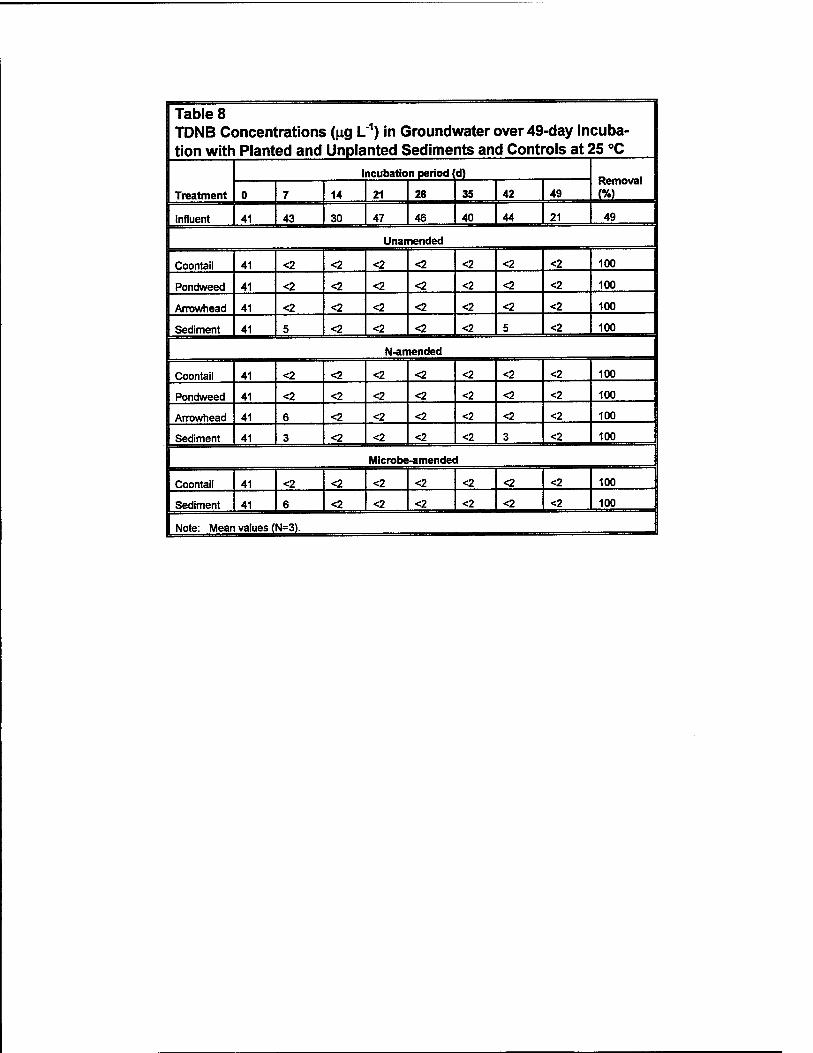
I Table 8 TDNB Concentrations (ng L"1) in Groundwater over 49-day Incuba-
I tion with Planted and Unplanted Sediments and Controls at 25 °C Incubation period (d)
Removal Treatment 0 7 14 21 28 I 35 42 49
Influent 41 43 30 47 46 I 40 44 21 49
Unamended
Coontail 41 <2 <2 <2 <2 <2 <2 <2 100
Pondweed 41 <2 <2 <2 <2 <2 <2 <2 100
Arrowhead 41 <2 <2 <2 <2 <2 <2 <2 100
Sediment 41 5 <2 <2 <2 <2 5 <2 100
N-a mended
Coontail 41 <2 <2 <2 <2 <2 <2 <2 100
Pondweed 41 <2 <2 <2 <2 <2 <2 <2 100
Arrowhead 41 6 <2 <2 <2 <2 <2 <2 100
Sediment 41 3 <2 <2 <2 <2 3 <2 100
Microbe-amended
Coontail 41 <2 <2 <2 <2 <2 <2 <2 100
Sediment 41 6 <2 <2 <2 <2 <2 <2 100
Note: Mean values (N=3).

Table 9 RDX Concentrations (jig L"1) in Groundwater over 49-day Incubation with Planted and Unplanted Sediments and Controls at 25 °C
Treatment
Incubation period (d) Removal 0 7 14 21 28 35 42 49
Influent 10698 10839 10134 10919 11210 10496 10512 10597 1
Unamended
Coontail 10698 9555 8187 7456 8888 7112 7000 6476 39
Pondweed 10698 9909 9515 8466 8653 7991 7400 6498 39
Arrowhead 10698 11035 11417 11191 13132 12605 13199 12538 -17
Sediment 10698 9409 9043 8837 9963 8767 8789 8040 25
N-amended
Coontail 10698 10658 8787 8432 8048 7495 6576 5842 45
Pondweed 10698 9613 8622 8036 8691 7024 6410 5448 49
Arrowhead 10698 10716 11444 10591 13976 11798 12184 11499 -7
Sediment 10698 9324 8480 9415 9220 9410 8792 9136 15
Microbe-amended
Coontail 10698 9995 8999 8313 5911 4267 2804 2182 80
Sediment 10698 9268 7294 7681 5618 5377 4553 5005 53
Note: Mean values (N=3).
Table 10 Treatment and Amendment Effects on RDX Concentration in Groundwater over 49-day Incubation
Factor LS Mean Homogeneous groups
Treatment
Coontail 8044 a
Pondweed 8615 ab
Sediment 8726 b
Arrowhead 11674 c
Amendment
Microbes 7225 a
Nitrogen 9479 b
None 9630 b Note: Multiple range analysis by amendment. Different letters indicate significant differences between amendments. LS Mean, variable mean at 95 percent confidence level; LSD method). ANOVA showed that both treatment and amendment significantly affected RDX concentration (P<0.001).
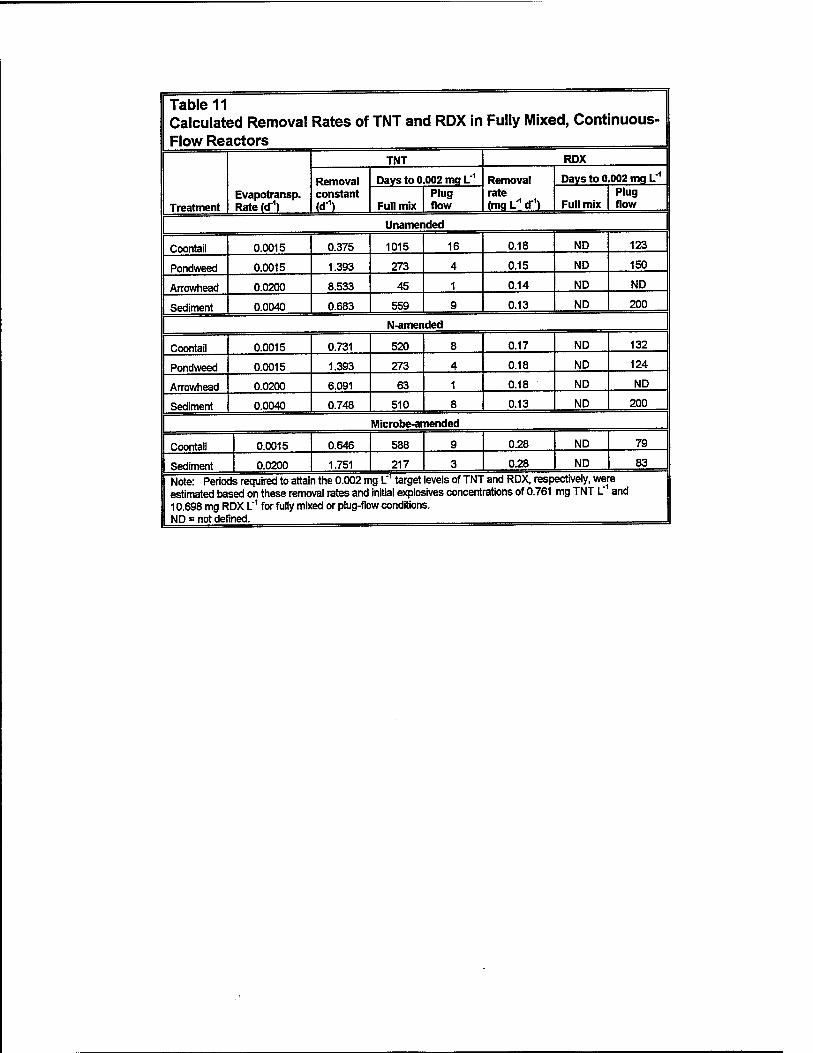
Table 11 Calculated Removal Rates of TNT and RDX in Flow Reactors
Fully Mixed, Continuous-
Treatment Evapotransp. Rate (d'1)
TNT RDX
Removal constant <d-1)
Days to 0.002 mg L'1 Removal rate <mqL-1d-1)
Days to 0.002 mg L"1
Full mix Plug flow Full mix
Plug flow
Unamended
Coontail 0.0015 0.375 1015 16 0.18 ND 123
Pondweed 0.0015 1.393 273 4 0.15 ND 150
Arrowhead 0.0200 8.533 45 1 0.14 ND ND
Sediment 0.0040 0.683 559 9 0.13 ND 200
N-amended
Coontail 0.0015 0.731 520 8 0.17 ND 132
Pondweed 0.0015 1.393 273 4 0.18 ND 124
Arrowhead 0.0200 6.091 63 1 0.18 ND ND
Sediment 0.0040 0.748 510 8 0.13 ND 200
Microbe-amended
Coontail 0.0015 0.646 588 9 0.28 ND 79
Sediment 0.0200 1.751 217 3 0.28 ND 83
Note: Periods required to attain the 0.002 mg L'1 target levels of TNT and RDX, respectively, were estimated based on these removal rates and initial explosives concentrations of 0.761 mg TNT L" and 10.698 mg RDX L"1 for fully mixed or plug-flow conditions. ND = not defined.

Table 12 Concentrations of Explosives (jig g DW1) in Plant Tissues and Sediments, and Final Plant Mass After 49-Day Incubation (Residues of TNT and known TNT degradation products were below detection)
Plant tissue/ Sediment
In contact with water RDX MNX
Final total mass incubated (QDW)
Plant tissue
Unamended
Coontail + 64 + 23 BD 3.69 + 1.34
Pondweed + 65 + 25 16 + 3 4.94+1.90
Arrowhead _ 1669 + 1029 30 + 15 22.25 + 0.39
+ 129 + 38 8 + 2
N-amended
Coontail + 73 + 32 BD 3.52 + 2.50
Pondweed + 51 +10 12 + 8 2.06 + 0.68
Arrowhead _ 904 + 182 23 + 8 18.74 + 5.84
+ 93 + 40 BD
Microbe-amended
Coontail + 40 BD 0.32 + 0.38
Sediment
Unamended
Coontail + 0.15 + 0.23 BD
Pondweed + _ BD
Arrowhead + 0.43 + 0.40 BD
Unplanted + 0.23 + 0.16 BD
N-amended
Coontail + 0.07 + 0.10 BD
Pondweed + 0.48 + 0.07 BD
Arrowhead + 2.79 ±2.03 BD
Unplanted + 1.61 +0.83 0.33 + 0.24
Microbe-amended
Coontail + BD BD
Unplanted + BD BD
Note: Mean values s and standard deviations (N=3). BD = below detection.
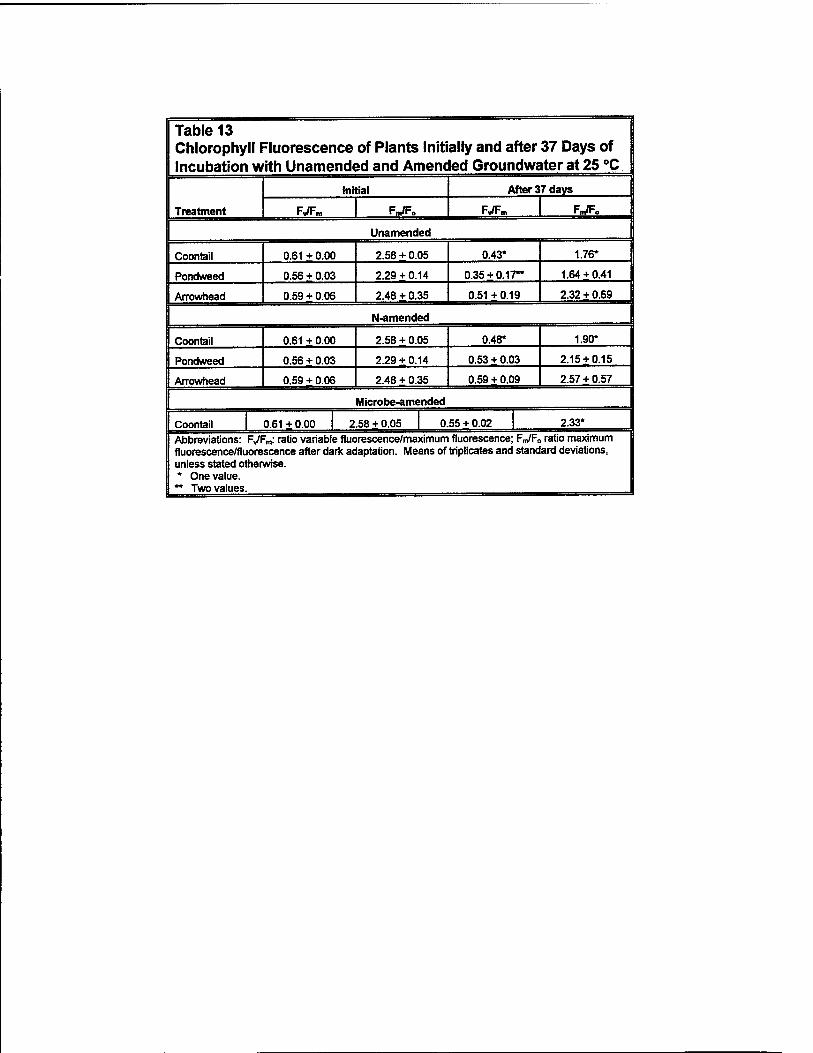
Table 13 Chlorophyll Fluorescence of Plants Initially and after 37 Days of Incubation with Unamended and Amended Groundwater at 25 °C
Treatment
Initial After 37 days
FJFm Fm/Fo FJFm Fn^Fo
Unamended
Coontail 0.61 + 0.00 2.58 + 0.05 0.43* 1.76*
Pondweed 0.56 + 0.03 2.29 + 0.14 0.35 + 0.17** 1.64 + 0.41
Arrowhead 0.59 + 0.06 2.48 + 0.35 0.51 + 0.19 2.32 + 0.69
N-amended
Coontail 0.61 + 0.00 2.58 + 0.05 0.48* 1.90*
Pondweed 0.56 + 0.03 2.29 + 0.14 0.53 + 0.03 2.15 + 0.15
Arrowhead 0.59 + 0.06 2.48 + 0.35 0.59 + 0.09 2.57 + 0.57
Microbe-amended
Coontail 0.61 + 0.00 2.58 + 0.05 0.55 + 0.02 2.33*
Abbreviations: Fv/Fm: ratio variable fluorescence/maximum fluorescence; FJF0 ratio maximum fluorescence/fluorescence after dark adaptation. Means of triplicates and standard deviations, unless stated otherwise. * One value. ** Two values.

Appendix A Abbreviations
2ADNT 2-amino-4,6-dinitrotoluene
4ADNT 4-amino-4,6-dinitrotoluene
2,4DANT 2,4-diamino-6-dinitrotoluene
2,6DANT 2,6-diamino-6-dinitrotoluene
DNB dinitrobenzene
1,3DNB 1,3-dinitrobenzene
1,4DNB 1,4-dinitrobenzene
DNT dinitrotoluene
2,4DNT 2,4-dinitrotoluene
2,6DNT 2,6-dinitrotoluene
MNX mono-nitroso analog of RDX
NB nitrobenzene
2NT 2-nitrotoluene
3NT 3-nitrotoluene
4NT 4-nitrotoluene
NT nitrotoluene
RDX hexahyd^o-l,3,5-trinitro-l,3,5-triazine
Tetryl methyl-254,6-trinitrophenylnitramine
TNB trinitrobenzene
TNT 2,4,6-trinitrotoluene
Appendix A Abbreviations A1
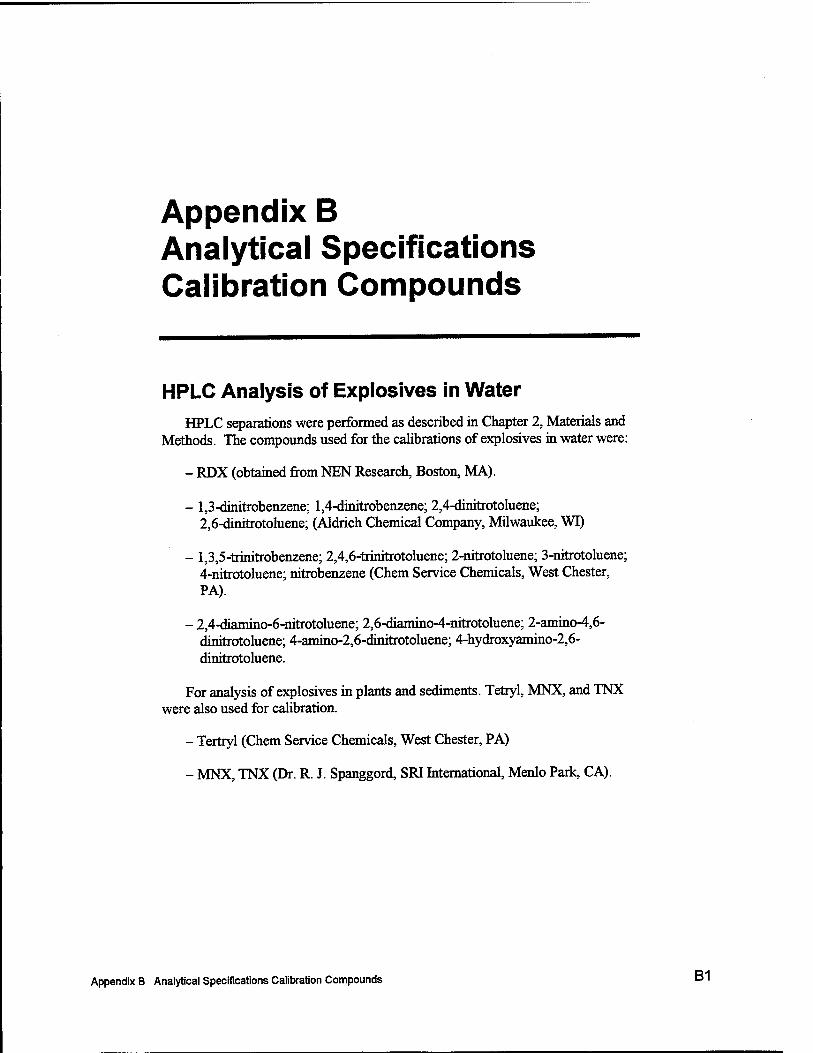
Appendix B Analytical Specifications Calibration Compounds
HPLC Analysis of Explosives in Water HPLC separations were performed as described in Chapter 2, Materials and
Methods. The compounds used for the calibrations of explosives in water were:
- RDX (obtained from NEN Research, Boston, MA).
- 1,3-dinitrobenzene; 1,4-dinitrobenzene; 2,4-dinitrotoluene; 2,6-dinitrotoluene; (Aldrich Chemical Company, Milwaukee, WI)
- 1,3,5-trinitrobenzene; 2,4,6-trinitrotoluene; 2-nitrotoluene; 3-nitrotoluene; 4-nitrotoluene; nitrobenzene (Chem Service Chemicals, West Chester, PA).
- 2,4-diamino-6-nitrotoluene; 2,6-diamino-4-nitrotoluene; 2-amino-4,6- dinitrotoluene; 4-amino-2,6-dinitrotoluene; 4-hydroxyamino-2,6- dinitrotoluene.
For analysis of explosives in plants and sediments. Tetryl, MNX, and TNX were also used for calibration.
- Tertryl (Chem Service Chemicals, West Chester, PA)
- MNX, TNX (Dr. R. J. Spanggord, SRI International, Menlo Park, CA).
Appendix B Analytical Specifications Calibration Compounds B '
REPORT DOCUMENTATION PAGE Form Approved OMB No. 0704-0188
Public reporting bunten for this collection of information is estimated to average 1 hour per response, including the time for reviewing instructions, searching existing data sources, gathering and maintaining the data needed, and completing and reviewing the collection of mformation. Send comments regarding this burden estimate or any other aspect of this ralleetionofinfbnTiahon.incUiding suggestions for reducing this burden, to Washington Headquarters Services, Directorate for Information Operations and Reports, 1215 Jefferson Davis Highway, Suite 1204, Arlington, VA 22202- 4302, and to the Office of Management and Budget, Paperwork Reduction Project (0704-0188), Washington, DC 20503.
1. AGENCY USE ONLY (Leave blank) 2. REPORT DATE
December 1998 3. REPORT TYPE AND DATES COVERED
Final report
4. TITLE AND SUBTITLE Explosives Removal from Groundwater of the Iowa Army Ammunition Plant in Continuous-Flow Laboratory Systems Planted with Aquatic and Wetland Plants
6. AUTHOR(S) Elly P. H. Best, Jerry L. Miller, Herb L. Fredrickson, Steven L. Larson, Mark E. Zappi, Ted H. Streckfuss
7. PERFORMING ORGANIZATION NAME(S) AND ADDRESS(ES)
See reverse.
9. SPONSORING/MONITORING AGENCY NAME(S) AND ADDRESS(ES)
U.S. Army Engineer District, Omaha 215 N. 17th Street Omaha, NE 68102-4978
5. FUNDING NUMBERS
8. PERFORMING ORGANIZATION REPORT NUMBER
Technical Report EL-98-13
10. SPONSORING/MONITORING AGENCY REPORT NUMBER
11. SUPPLEMENTARY NOTES
Available from National Technical Information Service, 5285 Port Royal Road, Springfield, VA 22161.
12a. DISTRIBUTION/AVAILABILITY STATEMENT
Approved for public release; distribution is unlimited.
12b. DISTRIBUTION CODE
13. ABSTRACT {Maximum 200 words) A 49-day, continuous-flow, laboratory study was performed to evaluate the ability of two submersed and one emergent
plant species to phytoremediate explosives-contaminated groundwater from the Iowa Army Ammunition Plant (IAAP), Middletown, IA. Species evaluated were the submersed Ceratophyllum demersum L. (coontail), Potamogeton nodosus Poir. (American pondweed), and the emergent Sagittaria latifolia Willd. (common arrowhead). Plants were rooted in local, IAAP, sediment under continuous-flow conditions at 25 °C. Unplanted sediment served as control. 2, 4, 6-trinitrotoluene (TNT), and hexahydro-1, 3, 5-trinitro-l,3,5-triazine (RDX) levels in groundwater were 0.8 and 10.7 mg L"1, respectively. The hydraulic retention time (HRT) was 30 days.
TNT decrease rates in groundwater did not differ significantly between unplanted and planted sediment treatments. Aqueous TNT concentrations decreased exponentially (first-order kinetics). TNT removal constants decreased in the order of arrowhead>pondweed>sediment>coontail, ranging from 0.533 to 0.375 d"1. Using these removal constants, periods to reach a cleanup level of 0.002 mg L"1 of 45 to 1,015 days were calculated for treatments under fully mixed conditions. Cleanup periods were greatly reduced under plug-flow conditions, ranging from 1 to 16 days. Final aqueous TNT and TNT degradation product levels were extremely low or below detection, while they were below detection in plants and sediments.
(Continued)
14. SUBJECT TERMS
Aquatic plant Constructed wetlands Explosives
Groundwater Kinetics Phytoremediation
RDX TNT Wetland plant
17. SECURITY CLASSIFICATION OF REPORT UNCLASSIFIED
18. SECURITY CLASSIFICATION OF THIS PAGE UNCLASSIFIED
19. SECURITY CLASSIFICATION OF ABSTRACT
15. NUMBER OF PAGES
58
16. PRICE CODE
20. LIMITATION OF ABSTRACT
NSN 7540-01-280-5500 Standard Form 298 (Rev. 2-89) Prescribed by ANSI Std. 239-18 298-102
7. (Concluded).
AScI Corporation 3402 Wisconsin Avenue, Ste 5 Vicksburg,MS 39180
U.S. Army Engineer Waterways Experiment Station 3909 Halls Ferry Road Vicksburg, MS 39180-6199
Department of Chemical Engineering Mississippi State University Starkvffle, MS 39762
USAE District, Omaha 215 N. 17* Street Omaha, NE 68102-4978
8. (Concluded).
RDX decrease rates in groundwater were significantly higher by planted than by implanted sediment treatments. RDX decrease was significantly enhanced by amendment with microbes. Aqueous RDX concentrations decreased linearly (zero- order kinetics). RDX removal rates ranged from 0.28 to 0.13 mg L"1 d"1. RDX cleanup levels were not reached under fully mixed conditions. Cleanup periods under plug-flow conditions ranged from 79 to 200 days for submersed species and implanted sediment treatments. An RDX cleanup period for the emergent arrowhead could not be calculated, since the aqueous RDX concentration in the reactors increased due to the high plant evapotranspiration rate. Final aqueous RDX levels were considerable. RDX residues were also present in all plants and almost all sediments after 49 days. Tissue and sediment RDX levels were low, being maximally 1.7 mg kg"1 dry weight in arrowhead shoots. One RDX metabolite, a mono-nitroso analog of RDX (MNX), was found at even lower concentrations in pondweed and arrowhead roots and in one unplanted N-amended sediment sample.
All plant species tolerated the groundwater, but showed low growth rates. Low growth of submersed species was attributed to frequent disturbance and of coontail partly to toxiciry of the groundwater RDX level. Low growth of the emergent arrowhead, however, was attributed to limitation by light and nutrients and potential toxiciry of the groundwater RDX level.