export performance clusters of the hungarian enterprises
TRANSCRIPT
2014, Vol. 2, No. 4 DOI: 10.15678/EBER.2014.020402
Export Performance Clusters of the Hungarian Enterprises: What Factors are Behind
the Successful Export Activities?
Annamaria Kazai Ónodi
A B S T R A C T
Objective: The objective of this paper is to provide a deeper insight into the main characteristics of Hungarian exporters between 1999 and 2013.
Research Design & Methods: The text addresses the questions how exporters can be grouped according to their export performance, what kind of groups can be identified, and what their main characteristics are. The research is based on Hungarian Competitiveness Research of 1999, 2004, 2009, 2013. Cluster analysis was selected as a key research method.
Findings: Four different clusters were identified. The most successful export-oriented companies produced more than 60% of export revenue in all databases, they had the highest export revenue, highest export intensity, and their profitability was over industry average except in 2009. Significant differences can be observed between the two groups. Leading minor exporters had significant higher profitability and better operation than minor exporters.
Implications & Recommendations: The implication of the research can be beneficial for both those studying exporters and the firms themselves. The research suggested that lower price is a less important success factor than quality, relationships, fast and flexible delivery. The applied methodology can be useful for export researchers.
Contribution & Value Added: The paper highlights the heterogeneous feature of exporters. Each cluster has special characteristics which required different analysis. The research underpins that operational excellence is necessary to export success, but it is not enough.
Article type: research paper Keywords: internationalisation; export; performance; cluster analysis;
Hungary; Hungarian Competitiveness Research Survey; JEL codes: C38, F14
Received: 20 July 2014 Revised: 15 October 2014 Accepted: 2 December 2014
Suggested citation: Kazai Ónodi, A. (2014). Export Performance Clusters of the Hungarian Enterprises: What Factors are Behind the Successful Export Activities?. Entrepreneurial Business and Economics Review, 2(4): 9-29, DOI: http://dx.doi.org/10.15678/EBER.2014.020402.
10 | Annamaria Kazai Ónodi
INTRODUCTION
Export competitiveness is crucial for each small, open economy, as well as for Hungary, where the degree of openness (the share of exports in the GDP) is about 80%. Hungarian export structure has been investigated by numerous researches (see Munkácsi, 2009a, 2009b; Czakó 2010; Katalin et al., 2013). Macroeconomic analyses provide an overall picture but for the sake of a deeper insight in export success, company level researches are needed. From the one side high export concentration characterises the economy, over 70% of export is produced by foreign-owned companies, mainly by large firms. From the other side export means a great opportunity for Hungarian small- and medium-sized companies as well.
The purpose of the paper is to provide a deeper insight into the main characteristics of the Hungarian exporters, based on the Hungarian Competitiveness Research Survey (2013, 2009, 2004, 1999). More than half of the enterprises were small or medium size in the sample. The aim of the analysis was to identify main factors and tendencies of the overall export performance.
The paper is organised in three main sections. At first, the article provides a brief literature review focusing on export performance. Secondly, it introduces the research questions and databases explored. What is more, the key research method is cluster analysis which is described. Thirdly, it provides insight into basic characteristics (size, owner structure, export volume, export intensity) of export-performance clusters. Key success factors of export activities were examined by two different methodologies. The managers’ opinion about export success factors were analysed by export performance clusters, the companies’ self-evaluations relative to industry average and the strongest competitor were compared between clusters. The final conclusions, the limitations and further research are presented at the end of the article.
LITERATURE REVIEW
Investigating export performance on national level is as important as on industry or company levels. Evaluating export competitiveness is a hot topic for small, open economies. There are different methodologies for measuring export competitiveness, for example revealed comparative advantage (RCA) or Balassa index, its modified version, the relative export advantage (RXA), Lafay index, etc. Several studies evaluate and compare export competitiveness of different countries and industries (Balassa, 1965; Gatto et al., 2011; Stojcic, Becic & Vofinic, 2012; Saboniene, 2009; Bruneckiene & Paltanaviciene, 2012; Travkina & Tvaronaviciene, 2011; Török, 2008). In case of Hungary the analyses of export performance and export structure are very important from macroeconomic perspective (see Munkácsi, 2009a, 2009b; Czakó, 2010; Bodnár et al, 2013). One of the main questions is how export competitiveness can be improved. Bruneckiene and Paltanaviciene (2012) based their national export competitiveness model on Porter’s diamond model (Porter, 1990). They grouped the influencing factors into four groups: demand for national export, conditions for production, competitiveness of export enterprises, economic cooperation enhancing environment, including political-legal, economic, social-demographic and technological environment.
Export Performance Clusters of the Hungarian Enterprises: What Factors … | 11
It is a generally accepted view that export enterprises’ competitiveness are behind
national export competitiveness. Numerous researches focused on small- and medium-sized companies’ export activities and their influencing factors. Miocevic and Crnjanak-Karanovic (2011) emphasised that cognitive and information-based capabilities are behind export performance. Stoian, Rialp and Rialp (2011) used regression analysis to investigate the export performance determinants of Spanish SMEs. They concluded that managerial foreign language skills and international business knowledge, the firms’ export commitment, technological intensity of the industry are the most influencing factors of export performance. Majocchi et al. (2005) investigated Italian SME’s and they found a positive relationship between size and export intensity. The positive correlation between the age of the firm and export performance confirm the idea that small firms need time to develop the necessary experience for the foreign market, it highlights the importance of business experience, which can be gained through personal contacts, networking activities, trials and errors. They showed the relevance of industry effects, too. Békés and Muraközy (2011), Kállay and Lengyel (2008), Kállay (2011), Szerb and Márkus (2008) and Szerb (2008) investigated the export performance of Hungarian SMEs.
Several researches dealt with one particular element of improving export activities. Cadogan et. al. (2009), as well as Leonidou et al. (2002) focused on the connection between marketing strategy and export performance. Wilkinson and Brouthers (2006) and Shamsoddoha et al. (2009) investigated the impact of different export promotion services on the international marketing efforts of small- to medium-sized enterprises.
DiPietro and Anoruo (2005) investigated the connection between creativity, innovation, and export performance. They found a positive relationship between a country’s export performance and a country’s creativity, the latter measured by its four main components: innovation, technology, technology transfer and business startups. Inzelt (2011a, 2011b) found positive correlation between innovation and internationalisation. Research of Halpern and Muraközy (2009) underpins the positive correlation between export profitability, export intensity and innovation.
Several researchers investigated the connection between profitability and export. Self-selection approach emphasised that only more productive firms engage in export activities (Bernard & Jensen, 1999), and learning by exporting approach (Navaretti & Castellani, 2004; Merino, 2012) emphasised that firms enter export markets and gain new knowledge and expertise which will improve their efficiency. Both effects were confirmed by Békés and Muraközy (2011) and Loacker (2005). Fryges and Wagner (2010) found positive correlation between profitability and export but they could not confirm self-selection effect. Grazzi (2012) concluded that exporting activity is not systematically associated with higher firms’ productivity.
Measuring export performance is a key element in multiple researches. There is no consensus about an appropriate definition and the measurement of export performance (Robertson & Chetty, 2000). Leonidou et al. (2002) listed the different metrics used by researches, namely: export proportion of sales or export intensity, export sales growth, export profit level, export sales volume, export market share, export profit contribution, return on investment, export satisfaction, perceived success, perceived export growth, perceived profitability and perceived market share. Two-thirds of overviewed studies

12 | Annamaria Kazai Ónodi
used only one metric to measure export performance. Most researches used export intensity, followed by export sales growth and export profit level, which were the most commonly used metrics. For example Robertson and Chetty (2000) used export intensity, export sales growth, export profitability, market diversification, perception of export performance five years ago, perception of current export performance, and perception of export performance in three years’ time. The use of too many metrics creates difficulty in analysing and interpreting the results. Dean et al. (2000) used only three metrics: annual export sales, export growth, export intensity.
MATERIAL AND METHODS
Research Question and Databases
Several researches have been made about Hungarian companies’ export activities from macroeconomic aspects as well as firm’s aspect. In these researches companies were grouped according to their size and owner structure. I addressed the questions how the exporters can be grouped according to their export performance, what kind of groups can be identified, what their main characteristics are. The value added of the research is that it provides a new approach for analysing export performance. The starting point was itself the export performance independently from prior expectations, not leaving out firms with less than 25% export-intensity.
The research is based on the Hungarian Competitiveness Research databases of 2013, 2009, 2004 and 1999. The main advantage of these databases is that they contain financial data as well as managerial self-evaluations. They were launched by the Competitiveness Research Centre in the Institute of Business Economics of Corvinus University of Budapest. All competitiveness research surveys had a similar structure. They contained 4 questionnaires (more than 60 pages altogether) covering following issues: top management, marketing, production, finance. As a general rule, all four surveys targeted incorporated companies with more than 50 employees to build a corporate sample, as well as keeping an eye on representativeness (in terms of staff size, geographical location, industry). The main objective was to make a database of about 300 firms in all surveys. The lowest response rate (13%) was in 2009, the number of companies in the sample became 317. The most favourable response rate can be observed in 1999 (49%), the number of companies in the sample was 325.
Understanding the main characteristics of the samples is crucial for concluding. Firms in the sample operated in different industries, except the financial sector. Processing industry dominated in all databases, although the rate of them decreased from 71% to 45%. The rate of service companies continuously increased from 21% to 34.7% but they are still under-represented due to the fact that the micro-companies were excluded from the surveys. Companies operating in construction industry, agriculture, food industry were represented in all samples. Medium-sized companies are dominating in all databases. The rate of them gradually increased; in 1999 it was 61.4 %, in 2013 - 72.7%. Parallel with this, the rate of large companies decreased from 32.4% to 16.7%. In terms of ownership structure, the domestic owned companies dominated in all databases, the rate of them was the highest in 2009 (72.6%), followed by 71.3% in 2013. The highest rate of foreign companies (23%) could be observed in 2013. The rate of state
Export Performance Clusters of the Hungarian Enterprises: What Factors … | 13
owned companies decreased to 5.7%. (For the descriptions of the samples of the questionnaire surveys of 2013, 2009, 2004, 1999 see Chikán et al, 2014, 2009, 2004, 1999; Matyusz 2011, 2014; Lesi 2005).
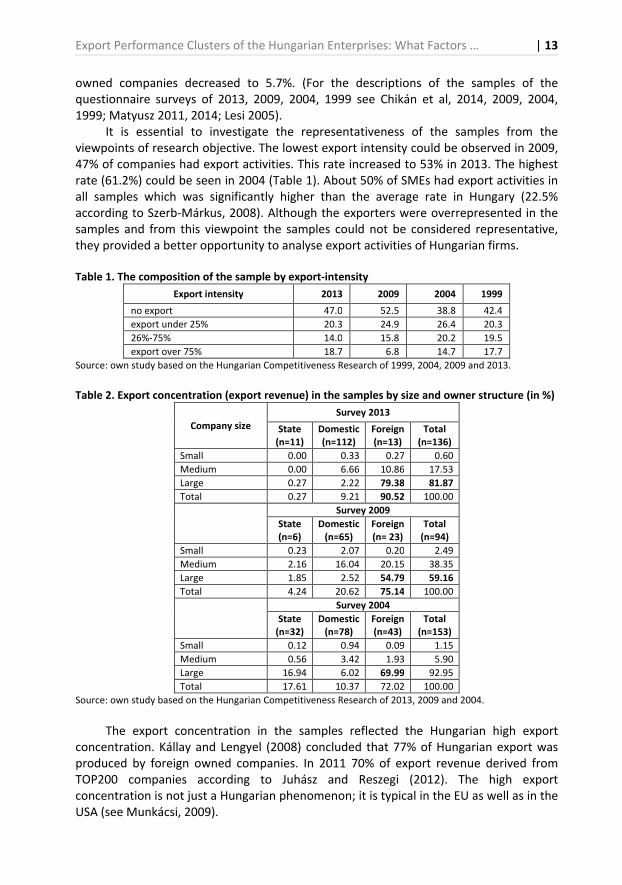
It is essential to investigate the representativeness of the samples from the viewpoints of research objective. The lowest export intensity could be observed in 2009, 47% of companies had export activities. This rate increased to 53% in 2013. The highest rate (61.2%) could be seen in 2004 (Table 1). About 50% of SMEs had export activities in all samples which was significantly higher than the average rate in Hungary (22.5% according to Szerb-Márkus, 2008). Although the exporters were overrepresented in the samples and from this viewpoint the samples could not be considered representative, they provided a better opportunity to analyse export activities of Hungarian firms.
Table 1. The composition of the sample by export-intensity
Export intensity 2013 2009 2004 1999
no export 47.0 52.5 38.8 42.4
export under 25% 20.3 24.9 26.4 20.3
26%-75% 14.0 15.8 20.2 19.5
export over 75% 18.7 6.8 14.7 17.7
Source: own study based on the Hungarian Competitiveness Research of 1999, 2004, 2009 and 2013.
Table 2. Export concentration (export revenue) in the samples by size and owner structure (in %)
Company size
Survey 2013
State (n=11)
Domestic (n=112)
Foreign (n=13)
Total (n=136)
Small 0.00 0.33 0.27 0.60
Medium 0.00 6.66 10.86 17.53
Large 0.27 2.22 79.38 81.87
Total 0.27 9.21 90.52 100.00
Survey 2009
State (n=6)
Domestic (n=65)
Foreign (n= 23)
Total (n=94)
Small 0.23 2.07 0.20 2.49
Medium 2.16 16.04 20.15 38.35
Large 1.85 2.52 54.79 59.16
Total 4.24 20.62 75.14 100.00
Survey 2004
State (n=32)
Domestic (n=78)
Foreign (n=43)
Total (n=153)
Small 0.12 0.94 0.09 1.15
Medium 0.56 3.42 1.93 5.90
Large 16.94 6.02 69.99 92.95
Total 17.61 10.37 72.02 100.00
Source: own study based on the Hungarian Competitiveness Research of 2013, 2009 and 2004.
The export concentration in the samples reflected the Hungarian high export concentration. Kállay and Lengyel (2008) concluded that 77% of Hungarian export was produced by foreign owned companies. In 2011 70% of export revenue derived from TOP200 companies according to Juhász and Reszegi (2012). The high export concentration is not just a Hungarian phenomenon; it is typical in the EU as well as in the USA (see Munkácsi, 2009).

14 | Annamaria Kazai Ónodi
In the samples the share of large foreign owned companies in total export revenue
was 54.79% in 2009, 69.99% in 2004, this rate increased to 79.38% in 2013. In 2013 the share of foreign owned companies in export revenue was 90%, parallel with this the share of domestic companies decreased to under 10% (Table 2).
Research Method – Cluster Analysis
Since the main purpose of the research was to provide a deeper insight into the export performance of Hungarian companies independently from prior expectations, cluster analysis was selected as a key research method. Cluster analysis proved to be vital because of the number of export performance metrics, expectation of objectivity and the limited number of final exporters’ group. Using only the two most generally applied export performance metrics (export volume and export intensity) would have allowed grouping firms without cluster analysis, but in this case we would have lost information about the changing direction and the profitability. K-means cluster analysis is a suitable analytical tool only when we have a large number (n >= 200) of cases. Although the databases consist of 300 or more cases, limitation derived from the rate of exporters and the incomplete questionnaires.
Export performance was placed in the centre of cluster analysis. The generally used metrics were applied for measuring export performance. Most researchers used export intensity and export revenue and so did I. For the sake of optimal results deriving from cluster analysis I created categories based on financial data. Four categories for export intensity and six categories for export revenue were used. Export sales growth is another relevant and frequently used metric of export performance. I created a three-scale metric for it, based on analysing financial data and subjective evaluation of export market change. I was only interested in the direction of the change and I did not analyse the extent of the change in export revenue. So the three-scale export growth metric refers to the following. Scale 3: there was stable growth in export revenue in the examined period confirmed by financial data and managerial evaluation. Scale 1: decreasing tendencies could be seen according to financial data and managerial evaluation. Scale 2: the results were controversial because of two reasons: during the examined period fluctuation could be seen according to financial data, or the managerial evaluation did not confirm the results of financial analysis. The fourth factor in cluster analysis was profitability. Because there was not available information about export profitability, I used managerial self-evaluation of companies’ return of investment compared to industry average (measured by 5 point Likert-scale).
The applied K-Means cluster analysis resulted in four clusters in 1999, 2004 and 2013 after several trials. On the one hand, four clusters proved to be optimal, since all clusters had so distinguishing characteristics that if we had reduced the number of clusters, some crucial characteristics would have remained hidden. On the other hand, higher cluster number would have made the analysis more difficult. The database of 2009 survey had special characteristics due to the financial crisis. The response rate was low; the characteristics of databases became slightly different. Incomplete questionnaires meant the biggest challenge; almost half of the exporters were unwilling to provide financial data. Due to this fact the cluster analysis grouped about half of the exporters in clusters. (Missing data characterised less than 5% of exporters in 2013.) For the sake of better comparability three clusters were created after running various cluster

Export Performance Clusters of the Hungarian Enterprises: What Factors … | 15
analyses in 2009. The missing fourth cluster could be identified by analysing companies left out of the cluster analysis, so the final conclusion is that four different export-performance clusters exist (For cluster centre points, see Annex 1-4).
Two main hypotheses were set in connection with clusters. Hypothesis 1: Successful export-oriented companies are significantly better than stagnant companies in regard of operation performance. Their export success is based on operation excellence.
Hypothesis 2: The weaker export performance of “Leading minors” does not result from weaker operation performance according to self-evaluation. Being competitive in domestic market is not enough for export success.
Independent samples t-test was used for hypothesis testing. This method was suitable because of the independency of clusters from one another, the investigated variables were measured at the interval or ratio level, due to the applied categorisations there are no significant outliers. The crucial point was the assumption of normal distribution.
RESULTS AND DISCUSSION
Basic Characteristics of Export-Performance Clusters
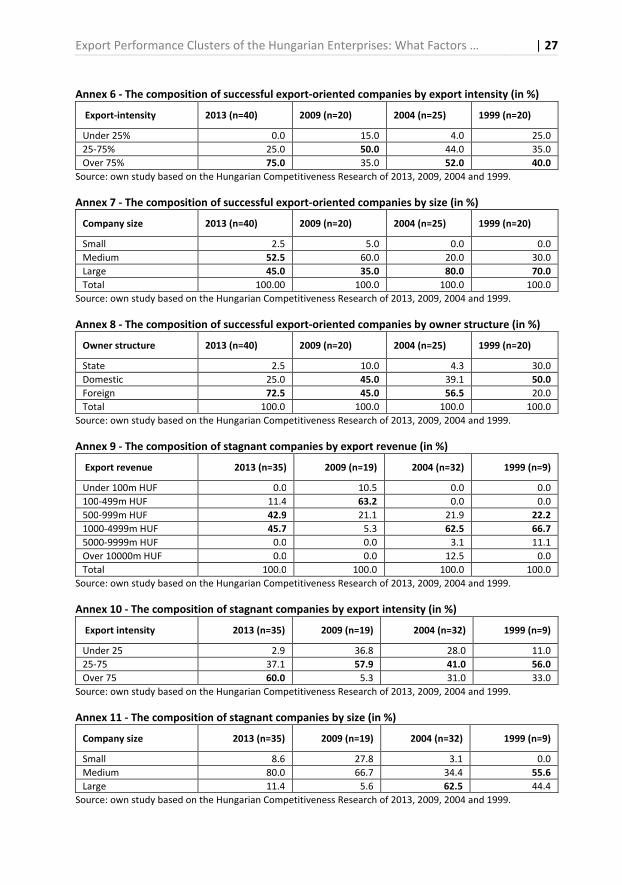
The successful export-oriented clusters were identified most obviously in all databases. This group of firms has the highest export revenue, highest export intensity and could be characterised by continuous growth. All of them have more than one billion HUF export revenue per year in 2013, 2004, 1999 and this rate was 90% in 2009. Aside from the period of financial crisis increasing export intensity could be observed. In 1999 only 40% of the firms had more than 75% export intensity, but this rate increased to 75% in 2013 (Annex 6).
The majority of the successful export-oriented firms belonged to large companies in 2004 and in 1999. Parallel with the changing characteristics of samples the proportion of large companies decreased to 45% in 2013, but compared to the average rate (16.7%), it can be seen that the large companies are still overrepresented in this cluster (Annex 7).
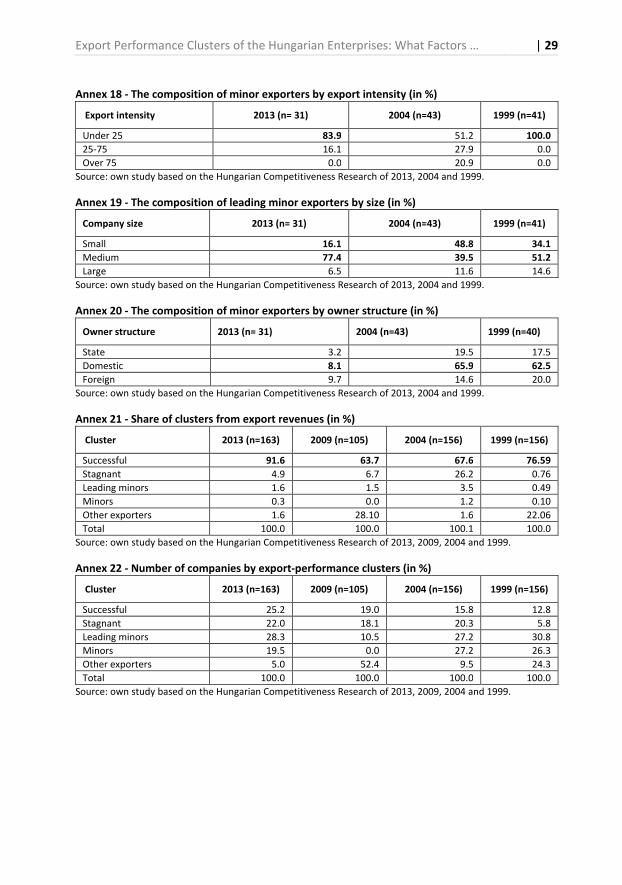
More than 75% of firms were active in the processing industry due to the characteristics of the samples, but there were some representatives of services, too. Aside from the period of financial crisis the proportion of foreign owned companies increased significantly. In 1999 their rate was only 20%, but in 2004 this subgroup became dominant (56.5%) and in 2013 72.5% of successful export-oriented companies were in majority of foreign ownership (Annex 8). In 2013 66.7% of them had one owner with 75% of shares or more, the proportion of subsidiaries was 65%. The successful export-oriented firms represented about a quarter of exporters in 2013, but their economic power was significantly higher, more than 90% of total export revenue belonged to this group. High export concentration could be observed in other years, too. The second highest concentration could be observed in 1999, when 12.8% of exporters belonged to this group and they produced 76.6% of total export revenue in the sample (Annex 21-22).
Companies belonging to the stagnant clusters lagged behind successful export-oriented companies in regard of all factors of cluster analysis. Although they had high export intensity, the highest average rate (76%) could be observed in 2013; it was

16 | Annamaria Kazai Ónodi
significantly lower than the average rate of successful export-oriented firms (84%). The majority of these firms had more than 25% export intensity in all databases (Annex 10). Due to their size their export revenue was lower than successful companies’. In 2013 and 2009 there were no companies with over 5 billion HUF export revenue, in contrast with the fact that in 2013 half of the successful export-oriented companies had more than 5 billion HUF export revenue per year (Annex 9).
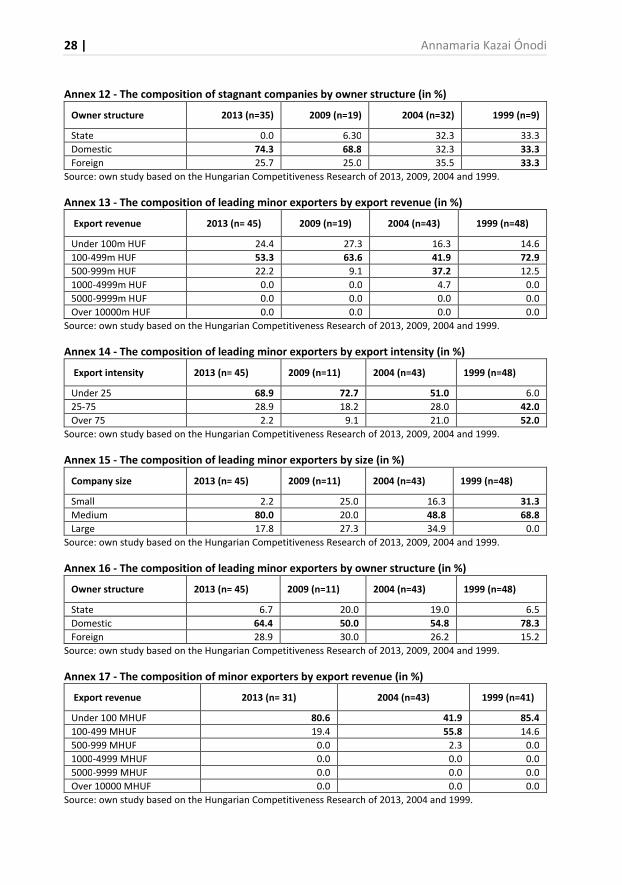
In 2004 large companies dominated (62.5%) this group which caused that the proportion of this group from export revenues was the highest (26%) in this year. In 2009 and 2013 when medium-sized companies dominated (66.7%, 80%) their share was fewer than 10% (See Annex No. 11 and 21). The majority of them were domestic owned, the highest rate (74%) could be observed in 2013. The rate of foreign owned companies decreased from 33% to 25% in 2013 (Annex 12). More than 77% of firms were active in the processing industry due to the characteristics of the samples, followed by the rate of service companies (22.9% in 2013).
The interpretation of leading minor exporters cluster meant a challenge, because the same conclusions could be drawn based on 2013, 2009, 2004 databases but in 1999 some characteristics of this cluster were a bit different. They had low annual export revenue in each year. There were no firms with more than one billion HUF export revenue in 2013, 2009, and 1999; in 2004 this rate was under 5% (Annex 13). This derived from low export intensity and company size. The majority of firms’ export intensity was under 25% in 2013, 2009 and 2004, but in 1999 half of them had more than 75% export intensity (Annex 14). Medium-sized and domestic owned companies dominated. The proportion of foreign owned companies was about 30% or less (Annex 15-16). The distinctive feature of this cluster was the high profitability except in 1999. Their share from total export revenue was under 4% in each database, although about 30% of exporters belonged to this cluster in 2013, 2004, and 1999 (Annex 21-22). More than half of them were active in the processing industry. In 2013 the rate of agricultural companies was the highest in this cluster (11%) but after processing industry, the service companies dominated (33%). More than half of these firms concentrated on local market in regard of sales and purchasing activities.
The fourth cluster is the minor exporters. They had the lowest export volume. In 2013, 80% of them had less than 100 million HUF annual export revenue (Annex 17). Their share from total export revenue was under 1.5% in each year. Their export intensity was low; more than 80% of them had export intensity under 25% in 2013 and in 1999 (Annex 18). Medium-sized companies dominated in 2013 and 1999, but in 2004 the proportion of small companies (48.8%) was higher (Annex 19). Domestic owned companies dominated. The proportion of foreign owned companied decreased from 20% to under 10% (Annex 19). The distinctive feature of this cluster was low profitability.
We have to be cautious in drawing conclusions when comparing the financial performance of export-performance clusters because profitability (self-evaluation, relative to industry average) was one of the cluster analysis’ factors, moreover it was one of the most important distinguishing features among the clusters. According to financial performance, significant differences can be observed between successful exporters and stagnant companies, as well as between leading minors and minor exporters. Successful export oriented companies’ and leading minor exporters’ profitability was over industry
Export Performance Clusters of the Hungarian Enterprises: What Factors … | 17
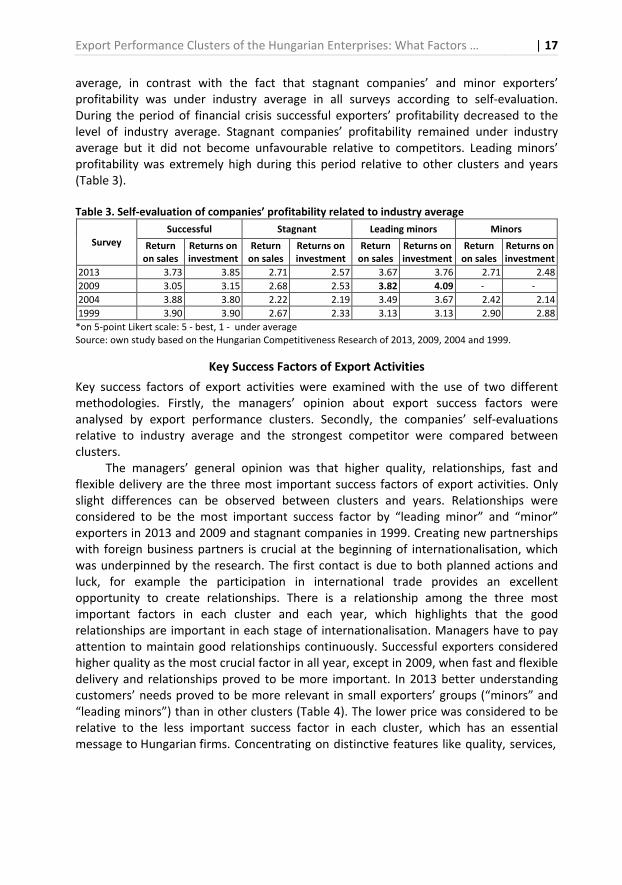
average, in contrast with the fact that stagnant companies’ and minor exporters’ profitability was under industry average in all surveys according to self-evaluation. During the period of financial crisis successful exporters’ profitability decreased to the level of industry average. Stagnant companies’ profitability remained under industry average but it did not become unfavourable relative to competitors. Leading minors’ profitability was extremely high during this period relative to other clusters and years (Table 3).
Table 3. Self-evaluation of companies’ profitability related to industry average
Survey Successful Stagnant Leading minors Minors
Return on sales
Returns on investment
Return on sales
Returns on investment
Return on sales
Returns on investment
Return on sales
Returns on investment
2013 3.73 3.85 2.71 2.57 3.67 3.76 2.71 2.48
2009 3.05 3.15 2.68 2.53 3.82 4.09 - -
2004 3.88 3.80 2.22 2.19 3.49 3.67 2.42 2.14
1999 3.90 3.90 2.67 2.33 3.13 3.13 2.90 2.88
*on 5-point Likert scale: 5 - best, 1 - under average Source: own study based on the Hungarian Competitiveness Research of 2013, 2009, 2004 and 1999.
Key Success Factors of Export Activities
Key success factors of export activities were examined with the use of two different methodologies. Firstly, the managers’ opinion about export success factors were analysed by export performance clusters. Secondly, the companies’ self-evaluations relative to industry average and the strongest competitor were compared between clusters.
The managers’ general opinion was that higher quality, relationships, fast and flexible delivery are the three most important success factors of export activities. Only slight differences can be observed between clusters and years. Relationships were considered to be the most important success factor by “leading minor” and “minor” exporters in 2013 and 2009 and stagnant companies in 1999. Creating new partnerships with foreign business partners is crucial at the beginning of internationalisation, which was underpinned by the research. The first contact is due to both planned actions and luck, for example the participation in international trade provides an excellent opportunity to create relationships. There is a relationship among the three most important factors in each cluster and each year, which highlights that the good relationships are important in each stage of internationalisation. Managers have to pay attention to maintain good relationships continuously. Successful exporters considered higher quality as the most crucial factor in all year, except in 2009, when fast and flexible delivery and relationships proved to be more important. In 2013 better understanding customers’ needs proved to be more relevant in small exporters’ groups (“minors” and “leading minors”) than in other clusters (Table 4). The lower price was considered to be relative to the less important success factor in each cluster, which has an essential message to Hungarian firms. Concentrating on distinctive features like quality, services,

18 | Annamaria Kazai Ónodi

Export Performance Clusters of the Hungarian Enterprises: What Factors … | 19
delivery time and building good partnerships which are based on trust and the reliability of product and services proved to be a better strategy in foreign market than focusing only on cost and price.
In the interest of understanding the export success better, the connection between export performance and operation characteristics was examined. Managerial self-evaluation was used for this purpose. Although self-evaluation includes several distorting factors, e.g. the phenomenon of cognitive dissonance, managers tending to overvalue their own performance, each person has his/her own subjective measurement scale (as to what is efficient/sufficient), the comparison of this subjective evaluation can provide relevant information.
Managers had to evaluate their companies’ performance relative to industry average and their strongest competitor, too. Successful export-oriented companies had significantly better self-evaluation relative to industry average than stagnant companies in regard of market share, product quality, technology, and management in 2013, 2004, and 1999. In 2013 the stagnant companies’ weakest points were the market share (the self-evaluation was under industry average) and the management. During the period of financial crisis (survey 2009) we could observe a bit different picture. Stagnant companies’ weakest point is the market share, too, but there are no significant differences in regard of management and product quality (Table 5). Relative to strongest competitors’ successful companies proved to be better than stagnant companies in each year in regard of cost efficiency and adjustment to changing customer needs. Statistically significant differences can be observed in each factor in 2013. Short delivery time, research and development expenditure proved to be more favourable in case of successful companies than stagnant companies in 2013, 2004, and 1999. Although self-evaluation might consist of several distortion factors, it is worth paying attention to the fact that stagnant companies had unfavourable self-evaluation relative to the strongest competitor in regard of competitive price in 2013, the level of research and development expenditure in each year. In 1999 stagnant companies evaluated their changing capability more unfavourable than their competitor’s capability, although significant advancement could be observed in 14 years, the differences did not disappear. We can conclude from these results that operation excellence is behind export success (Table 5).
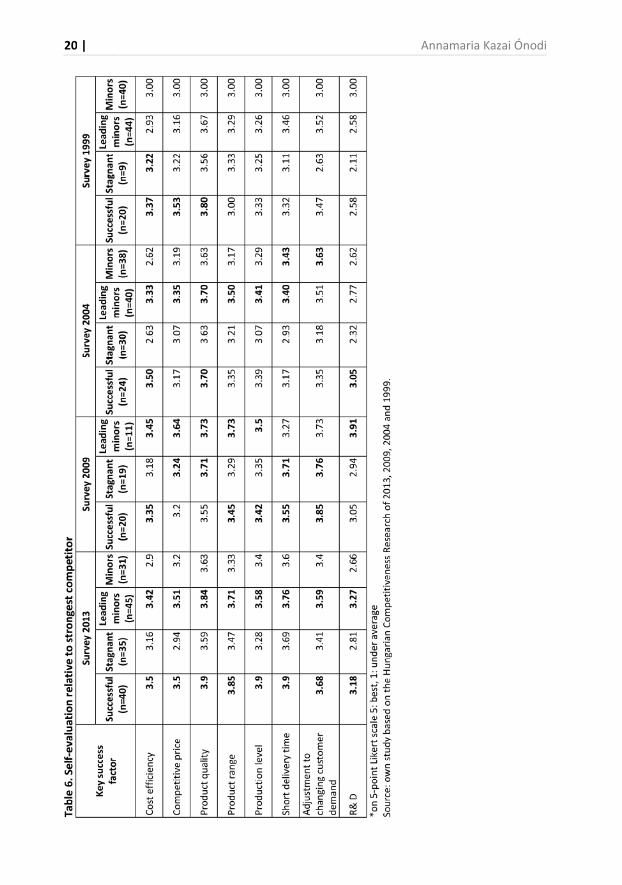
The comparison of leading minors and successful export-oriented companies provided a controversial picture. Before presenting detailed analysis it is crucial to mention that the distortion factors in this case are stronger than in the comparison of successful and stagnant companies, due to the fact that successful export-oriented companies concentrate on export market, while companies in leading minors cluster focus mainly on the domestic market, so their benchmark might be different. It is substantial to highlight that leading minors had no self-evaluation under industry average. They had as good self-evaluation as successful exporters did in regard of market share in 2013 and 2009; in regard of product quality in 2013, 2009 and 2004. There was no significant difference in regard of technology in 2013 and 2009, in this area significant improvement could be observed from 1999. In 2013 there was only one factor, management in which successful exporters’ self-evaluation relative to industry average proved to be better than leading minors’. Analysing the self-evaluation relative to the strongest competitor showed similarly controversial picture. Significant improvement
20 | Annamaria Kazai Ónodi

Export Performance Clusters of the Hungarian Enterprises: What Factors … | 21
could be observed, in 1999 and 2004 they evaluated their research and development expenditure more unfavourable than their strongest competitor’s expected level, but in 2009 and in 2013 their self-evaluation proved to be the best, it was significantly higher than successful exporters’. In 1999 one of their weakest points was the cost efficiency, relevant improvement could be observed, too, they became better than companies in stagnant and minor cluster, but in 2013 they still lagged behind successful exporters’ performance. By comparing the performance of the two clusters it cannot be concluded that weaker operational performance caused lower export performance of leading minors. They had the best self-evaluation in regard of short delivery time in 1999; competitive price, short delivery time and adjustment to changing customer demand in 2004; competitive price and product quality in 2009 (Table 6). We can conclude that being competitive in the domestic market is not enough for export success.
Minor exporters’ self-evaluation was lower than successful and leading minor exporters’, but in some aspects they were better than stagnant companies. Their weakest point was cost efficiency and research and development expenditure (Table 6).
CONCLUSIONS
The aim of the paper was to provide a deeper insight into Hungarian exporters between 1999 and 2013 based on Hungarian Competitiveness Research databases of 2013, 2009, 2004, and 1999. Export performance was the starting point of the research; it was placed in the centre of cluster analysis. Export performance was measured by export intensity, export revenue, profitability and change in export revenue which are consistent with international practice. The classification of companies was mainly based on objective financial data completed with managerial self-evaluation about export market and profitability. Cluster analysis identified four different clusters: “successful”, “stagnant”, “leading minors”, and “minors”. The “successful” cluster involved the most successful export-oriented companies. They produced more than 60% of export revenue in all databases, they had the highest export revenue, highest export intensity, and their profitability was over industry average except in 2009 due to the financial crisis. The proportion of foreign owned companies in this cluster increased significantly, 72.5% of them were in majority foreign ownership in 2013. The observed high concentration and strong foreign dominance reflected the high Hungarian export concentration. Further research is required to investigate the characteristics of corporate governance and export performance. To what extent does foreign ownership support higher efficiency and export competitiveness or will excellent company performance be attractive for foreign investors? Apart from this question the successful cluster can be a beneficial benchmark in future export research.
Stagnant companies lagged behind the successful export-oriented companies, although their export intensity was significant. Their proportion from total export revenue was under 10% in 2013. The majority of them were medium-sized domestic owned companies. The hypothesis test confirmed that weaker operational characteristics were behind the lower export performance. Their self-evaluations highlighted some areas where they lagged behind competitors and industry average too. Future research is required to investigate their growing potential, and their weak and strong points more deeply.
22 | Annamaria Kazai Ónodi
Low export revenue characterised the other two clusters, their rate of total export
revenue was fewer than 5%. The majority of them were medium-sized, domestic owned companies. Significant differences can be observed between the two groups, leading minor exporters had significant higher profitability and better operational characteristics than minor exporters. The low export performance of “minors” is consistent with the results of previous researches. They are at the beginning of internationalisation process; they may not possess the necessary knowledge, resources and capabilities for international expansion.
The “leading minors” could be characterised by low export intensity and low export volume but high profitability and operational excellence. Their self-evaluations were better than stagnant companies’ and in some cases as good as successful exporters’. Limitations of the results derived from the subjectivity of self-evaluation. Further investigation is required to confirm the existence of a group of companies which are competitive in domestic market, but whose export activities are at an early stage. This is the group of companies which are usually not paid attention to in researches because of the low export intensity. Several questions remained unanswered. What are the causes of their low export intensity? Is it in connection with the features of their business? Is there a lack of motivation or a lack of capabilities? The research underpins that operational excellence is necessary for export success, but it is not enough. The implication of the research can be beneficial for both those studying exporters and the firms themselves. The research suggested that lower price is a less important success factor than quality, relationships, fast and flexible delivery. The applied methodology can be useful for export researchers. The paper highlights the heterogeneous feature of exporters. Each cluster has special characteristics which required different analysis.
REFERENCES
Abel, I., & Czakó, E. (Eds.). (2013). Exportsiker nyomában. Budapest: Alinea kiadó.
Balassa, B. (1965). Trade Liberalization and Revealed Comparative Advantage. The Manchester
School of Economic and Social Studies, 119, 93-123.
Bernard, A. B., & Jensen, J. B. (1999). Exceptional exporter performance: cause, effect, or both? Journal of International Economics, 47(1), 1-25.
Békés, G., & Muraközi, B. (2011). Magyar gazellák: gyors növekedésű vállalatok jellemzői és
kialakulásuk elemzése Magyarországon. Műhelytanulmány: MTA Közgazdaságtudományi Inézet.
Bruneckiene, J., & Paltanaviciene, D. (2012). Measurement of Export Competitiveness of the Baltic States by Composite Index. Inzinerine Ekonomika-Engineering Economics, 23(1), 50-62.
Cadogan, J. W., Kuivalainen, O., & Sundqvist, S. (2009). Export Market-Oriented Behaviour and Export Performance: Quadratic and Moderating Effects Under Different Degrees of Market Dynamism and Internationalization. Journal of International Marketing, 17, 71-89.
Chikán, A., Czakó, E., & Zoltay Paprika, Z. (1999). Arccal a piac felé. Gyorsjelentés az 1999. évi kérdőíves felmérés eredményeiről.
Chikán, A., Czakó, E., & Zoltay Paprika, Z. (2004). Fókuszban a verseny. Gyorsjelentés a 2004. évi kérdőíves felmérés eredményeiről.
Export Performance Clusters of the Hungarian Enterprises: What Factors … | 23
Chikán, A., Czakó, E., & Zoltay Paprika, Z. (2009). A vállalati versenyképesség válsághelyzetben.
Gyorsjelentés a 2009. évi kérdőíves felmérés eredményeiről.
Chikán, A., Czakó, E., & Wimmer, Á. (2014). Kilábalás göröngyös talajon - Gyorsjelentés a 2013. évi
kérdőíves felmérés eredményeiről. Retrieved on June 1, 2014, from http://unipub.lib.uni-corvinus.hu/1528/1/BCE%20 VKK%20GYORSJELENTES%202014_2.pdf.
Czakó, E. (2010). Vállalati teljesítmények méretkategóriák szerint és a versenyképesség intézményi
és szoláltatási rendszere. In: Állami számvevőszék kutatóintézete (2010): A közszféra és a
gazdaság versenyképessége empirikus eredmények és tanulságok (pp. 69-84). április.
Dean, D.L. & Mengüç, B., & Myers, C.P. (2000). Revisiting firm characteristics, strategy and export performance relationship. Industrial Marketing Management, 29, 461-477.
DiPietro, W.R., & Anoruo, E. (2005). Creativity, innovation, and export performance. Journal of
Policy Modeling, 28, 133-138.
Fryges, H., & Wagner, J. (2010). Exports and Profitability: First Evidence for German Manufacturing
Firms. The World Economy (2010). Retrieved on June 1, 2014, from http://web.a.ebscohost.com/ehost/pdfviewer/ pdfviewer?vid=45&sid=f0b36f30-bb13-4783-924a-5f2fd9831613%40sessionmgr4003&hid=4104.
Gatto, M. D., Mauro, F., Gruber, J., & Mandel, B. R. (2011). The Revealed Competitiveness of U.S.
Exports. Board of Governors of the Federal Reserve System. International Finance Discussion Papers Number 1026 August 2011. Retrieved on June 1, 2014, from http://web.a.ebscohost.com/ehost/pdfviewer/ pdfviewer?vid=9&sid=37fa8987-7547-4838-ae42-06718cb2b65f%40sessionmgr4001&hid=4 106.
Grazzi, M. (2012). Export and Firm Performance. Evidence on Productivity and Profitability of Italian Companies. Journal of Industry, Competition and Trade, 12(4), 423-444.
Halpern, L., & Muraközy, B. (2009). Innovation, Productivity and Exports: the Case of Hungary. Műhelytanulmányok, Magyar Tudományos Akadémia, November 2009.
Inzelt, A. (2011a). Innováció- határok nélkül. Bevezető a tematikus számhoz. Külgazdaság, LV. Évf. 2011. szeptember – október, pp. 3 – 21. Retrieved on June 1, 2014, from http://www.penzugykutato.hu/files/K%C3% BClgazdas%C3%A1g%202011%20szeptember-okt%C3%B3ber.pdf.
Inzelt, A. (2011b). Innováció és nemzetközi terjeszkedés a kicsik világában. Egy e-felvétel
eredményei. Külgazdaság, LV. Évf. 2011. szeptember – október, pp. 122 – 154. Retrieved on June 1, 2014, from http://www.penzugykutato.hu/files/K%C3%BClgazdas%C3%A1g%202011 %20szeptember-okt%C3%B3ber.pdf.
Juhász, P., & Reszegi, L. (2012). Erősödő külföldi dominancia. Figyelő Top 200 kiadvány, 22-27.
Kállay, L. (2011). KKV-szektor: versenyképesség, munkahelyteremtés, szerkezetálalakítás
Műhelytanulmány. Retrieved on June 1, 2014, from http://www.szolidaritas.org/files/1/3/ kkv_versenykepesseg_-_tanulmany_-_kl_2012_03__.pdf.
Kállay, L., & Lengyel, L. (2008): A magyar kis- és középvállalatok nemzetköziesedésének főbb
jellemzői az Európai Uniós csatlakozás előtt. Vállalkozás é Innováció 2. évfolyam 1. szám 2008. I. negyedév 54-76.
Katalin, B., Molnár, G., Pellényi, G., Szabó, L., Várhegyi, J. (2013). A külkereskedelmi egyenleg
dinamikája, az export és az import alakulása. MNB-Szemle különszám 2013. okt. Retrieved on June 1, 2014, from http://www.mnb.hu/Root/Dokumentumtar/MNB/Kiadvanyok/mnbhu _mnbszemle/mnbhu_msz_20131030/bodnar.pdf.
Leonidou, C.L., Katsikeas, C.S., & Samiee S. (2002): Marketing strategy determinants of export performance: a meta-analysis. Journal of Business Research 55 (2002) 51-67.

24 | Annamaria Kazai Ónodi
Lesi, M. (2005). A 2004-es versenyképesség kutatás vállalati mintájának alapjellemzői és
reprezentativitása. Versenyképesség kutatások műhelytanulmány-sorozat, 2. kötet, BCE Versenyképesség Kutató Központ, Budapest.
Loacker, J.D. (2005). Do exports generate higher productivity? Evidence from Slovenia. Journal of
International Economics, 73, 69-68.
Majocchi, A. & Bacchiocchi, E. & Mayrhofer, U. (2005). Firm size, business experience and export intensity in SMEs: A longitudinal approach to complex relationships. International Business
Review, 14, 719-738.
Merino, F. (2012). Firm’s internationalization and productivity growth. Research in Economics, 66(4), 349-354. Retrieved on June 1, 2014, from http://www.sciencedirect.com/science/ article/pii/S109094431200035X
Miocevic, D., & Crnjanak Karanovic, B. (2011). Cognitive and Information-Based Capabilities int he Internationalization of Small and medium-Sized Enterprises: She Case of Croatian Exporters. Journal of Small Business Management, 49(4), 537-557.
Matyusz, Zs. (2011). A 2009-es versenyképességi adatfelvétel vállalati mintájának alapjellemzői és
reprezentativitása. Budapesti Corvinus Egyetem, Vállalatgazdaságtan Intézet, Versenyképesség Kutató Központ.
Matyusz, Zs. (2014). A 2013-as versenyképességi kutatás vállalati mintájának alapjellemzői és
reprezentativitása. Versenyképesség tanulmánysorozat. Retrieved on June 1, 2014, from https://webmail.uni-corvinus.hu/service/home/~/?auth=co&loc=hu_HU&id=12172&part=4.
Munkácsi, Zs. (2009a). Kik exportálnak Magyarországon? Vállalati méret és külföldi tulajdon
szerinti exportkoncentráció és a külföldi tulajdon hatása az exportorientációra. MNB-szemle. 2009. július, 22-38.
Munkácsi, Zs. (2009b). A kelet-közép-európai országok exportszerkezete és exportspecializációja. MNB-tanulmányok 81. 2009. szept.
Navaretti, G. B. & Castellani, D. (2004). Investment abroad and performance at home: the evidence
from Italian multinationals, SEPR Discussion Paper 4284.
Porter, M. E. (1990). The Competitive Advantage of Nations. New York: The Free Press.
Robertson, C., & Chetty, S. K. (2000). A contingency-based approach to understanding export performance. International Business Review, 9, 211-235.
Saboniene, A. (2009). Lithuanian Export Competitiveness: Comparison with other Baltic Sates. Inzinerine Ekonomika-Engineering Economics, 2, 49-57.
Shamsoddoha, A. K & Ali, M. Y. & Ndubisi, N. O. (2009). A Conceptualisation of Direct and Indirect Impact of Export Promotion Programs on Export Performance of SMEs and Entrepreneurial ventures. International Journal of Entrepreneurship, 13 (Special Issue). Retrieved on June 1, 2014, from http://web.a.ebscohost.com/ehost/pdfviewer/pdfviewer?vid=12&sid=f0b36f30-bb13-4783-924a-5f2fd9831613%40sessionmgr4003&hid=4104.
Stoian, M.C., Rialp, A., & Rialp, J. (2011). Export performance under the microscope: A glance through Spanish lenses. International Business Review, 20, 117-135.
Stojcic, N., Becic, M., & Vofinic, P. (2012). The Competitiveness of Exports form Manufacturing Industries in Croatia and Slovenia to the EU-15 Market: A Dynamic panel Analysis. Croatian
Economic Survey, 14(1), 69-105.
Szerb, L., & Márkus, G. (2008). Nemzetköziesedési tendenciák a kis- és közepes méretű vállalatok körében Magyarországon a 2000-es évek közepén. Vállalkozás Innováció 2. évfolyam, 2. szám 2008. I. negyedév, 36-58.

Export Performance Clusters of the Hungarian Enterprises: What Factors … | 25
Szerb, L. (2008). A hazai kis- és középvállalkozások fejlődését és növekedését befolyásoló tényezők
a 2000-es évek közepén. Vállalkozás Innováció 2. évfolyam, 2. szám 2008. II. negyedév, 1-35.
Török, Á. (2008). Export competitiveness and the catch-up process of Hungary (1996-2001): A comparative analysis with some reflections on trade theory. Competitiveness Review, 18(1/2), 131-153.
Travkina, I., & Tvaronaviciene, M. (2011). Export Competitiveness and Domestic Productivity facets: Case of Lithuania. Journal of Business Economics and Management,12 (1), 49-68.
Wilkinson, T., & Brouthers, L. E. (2006). Trade promotion and SME export performance. International Business Review, 15, 233-252.
Author
Annamaria Kazai Ónodi
Assistant Professor of the Corvinus University of Budapest (Hungary), at the Faculty of Business Administration, Institute of Business Economics. PhD in Economics and Business granted by the Corvinus University of Budapest (Hungary).
Correspondence to: Annamaria Kazai Ónodi, PhD
Corvinus University of Budapest Faculty of Business Administration,
Fővám tér 8. 1093 Budapest, Hungary
Acknowledgements and Financial Disclosure
The "In Global Competition" Competitiveness Enterprise Survey series have been designed, developed and executed under the auspices of the Competitiveness Research Centre of Faculty of Business Administration of Corvinus University of Budapest since 1996. The 2013 survey was the fifth one. The financial and administrative support of the surveys have been kindly provided by the Foundation for Business Economics Research and Education since the very first one.
Copyright and License
This article is published under the terms of the Creative Commons Attribution – NonCommercial – NoDerivs (CC BY-NC-ND 3.0) License
http://creativecommons.org/licenses/by-nc-nd/3.0/
Published by the Centre for Strategic and International Entrepreneurship – Krakow, Poland

26 | Annamaria Kazai Ónodi
APPENDIXES
Annex 1 - Cluster centre points – Successful export-oriented companies
Factor 2013 (n= 40) 2009 (n=20) 2004 (n=25) 1999
(n=20)
Export intensity (1-4 scale) 3.75 3.2 3.48 3.15
Export volume (0-6 scale) 4.85 4.25 5 4.85
Change in export volume (1-3 scale) 2.23 2.55 2.56 2.55
Profitability compared industry average (1-5 scale)
4 3 4 4
Source: own study based on the Hungarian Competitiveness Research of 2013, 2009, 2004 and 1999.
Annex 2 - Cluster centre points – Stagnant companies
Factor 2013 (n= 35) 2009 (n=19) 2004 (n=32) 1999 (n=9)
Export intensity (1-4 scale) 3.57 2.68 3.03 3.22
Export volume (0-6 scale) 3.34 2.21 4.06 3.89
Change in export volume (1-3 scale) 2.06 1.32 2.16 1,56
Profitability compared industry average (1-5 scale)
3 3 2 2
Source: own study based on the Hungarian Competitiveness Research of 2013, 2009, 2004 and 1999.
Annex 3 - Cluster centre points – Leading minor exporters
Factor 2013 (n= 45) 2009 (n=19) 2004 (n=43) 1999
(n=48)
Export intensity (1-4 scale) 2.33 2.36 2.42 3.46
Export volume (0-6 scale) 1.98 1.82 2.3 1.98
Change in export volume (1-3 scale) 2.16 1.45 2.3 2.58
Profitability compared industry average (1-5 scale)
4 4 4 3
Source: own study based on the Hungarian Competitiveness Research of 2013, 2009, 2004 and 1999.
Annex 4 - Cluster centre points – Minor exporters
Factor 2013 (n= 31) 2004 (n=43) 1999 (n=41)
Export intensity (1-4 scale) 2.16 2.7 1.76
Export volume (0-6 scale) 1.19 1.6 0.9
Change in export volume (1-3 scale) 1.68 1.7 1.63
Profitability compared industry average (1-5 scale) 2 2 3
Source: own study based on the Hungarian Competitiveness Research of 2013, 2004 and 1999.
Annex 5 - The composition of successful export-oriented companies by export revenue (in %)
Export revenue 2013 (n=40) 2009 (n=20) 2004 (n=25) 1999 (n=20)
Under 100 MHUF 0.00 0.00 0.00 0.00
100-499 MHUF 0.00 0.00 0.00 0.00
500-999 MHUF 0.00 10.00 0.00 0.00
1000-4999 MHUF 47.50 60.00 36.00 50.00
5000-9999 MHUF 20.00 25.00 28.00 15.00
Over 10000 MHUF 32.50 5.00 36.00 35.00
Total 100.00 100.00 100.00 100.00
Source: own study based on the Hungarian Competitiveness Research of 2013, 2009, 2004 and 1999.
Export Performance Clusters of the Hungarian Enterprises: What Factors … | 27
Annex 6 - The composition of successful export-oriented companies by export intensity (in %)
Export-intensity 2013 (n=40) 2009 (n=20) 2004 (n=25) 1999 (n=20)
Under 25% 0.0 15.0 4.0 25.0
25-75% 25.0 50.0 44.0 35.0
Over 75% 75.0 35.0 52.0 40.0
Source: own study based on the Hungarian Competitiveness Research of 2013, 2009, 2004 and 1999.
Annex 7 - The composition of successful export-oriented companies by size (in %)
Company size 2013 (n=40) 2009 (n=20) 2004 (n=25) 1999 (n=20)
Small 2.5 5.0 0.0 0.0
Medium 52.5 60.0 20.0 30.0
Large 45.0 35.0 80.0 70.0
Total 100.00 100.0 100.0 100.0
Source: own study based on the Hungarian Competitiveness Research of 2013, 2009, 2004 and 1999.
Annex 8 - The composition of successful export-oriented companies by owner structure (in %)
Owner structure 2013 (n=40) 2009 (n=20) 2004 (n=25) 1999 (n=20)
State 2.5 10.0 4.3 30.0
Domestic 25.0 45.0 39.1 50.0
Foreign 72.5 45.0 56.5 20.0
Total 100.0 100.0 100.0 100.0
Source: own study based on the Hungarian Competitiveness Research of 2013, 2009, 2004 and 1999.
Annex 9 - The composition of stagnant companies by export revenue (in %)
Export revenue 2013 (n=35) 2009 (n=19) 2004 (n=32) 1999 (n=9)
Under 100m HUF 0.0 10.5 0.0 0.0
100-499m HUF 11.4 63.2 0.0 0.0
500-999m HUF 42.9 21.1 21.9 22.2
1000-4999m HUF 45.7 5.3 62.5 66.7
5000-9999m HUF 0.0 0.0 3.1 11.1
Over 10000m HUF 0.0 0.0 12.5 0.0
Total 100.0 100.0 100.0 100.0
Source: own study based on the Hungarian Competitiveness Research of 2013, 2009, 2004 and 1999.
Annex 10 - The composition of stagnant companies by export intensity (in %)
Export intensity 2013 (n=35) 2009 (n=19) 2004 (n=32) 1999 (n=9)
Under 25 2.9 36.8 28.0 11.0
25-75 37.1 57.9 41.0 56.0
Over 75 60.0 5.3 31.0 33.0
Source: own study based on the Hungarian Competitiveness Research of 2013, 2009, 2004 and 1999.
Annex 11 - The composition of stagnant companies by size (in %)
Company size 2013 (n=35) 2009 (n=19) 2004 (n=32) 1999 (n=9)
Small 8.6 27.8 3.1 0.0
Medium 80.0 66.7 34.4 55.6
Large 11.4 5.6 62.5 44.4
Source: own study based on the Hungarian Competitiveness Research of 2013, 2009, 2004 and 1999.
28 | Annamaria Kazai Ónodi
Annex 12 - The composition of stagnant companies by owner structure (in %)
Owner structure 2013 (n=35) 2009 (n=19) 2004 (n=32) 1999 (n=9)
State 0.0 6.30 32.3 33.3
Domestic 74.3 68.8 32.3 33.3
Foreign 25.7 25.0 35.5 33.3
Source: own study based on the Hungarian Competitiveness Research of 2013, 2009, 2004 and 1999.
Annex 13 - The composition of leading minor exporters by export revenue (in %)
Export revenue 2013 (n= 45) 2009 (n=19) 2004 (n=43) 1999 (n=48)
Under 100m HUF 24.4 27.3 16.3 14.6
100-499m HUF 53.3 63.6 41.9 72.9
500-999m HUF 22.2 9.1 37.2 12.5
1000-4999m HUF 0.0 0.0 4.7 0.0
5000-9999m HUF 0.0 0.0 0.0 0.0
Over 10000m HUF 0.0 0.0 0.0 0.0
Source: own study based on the Hungarian Competitiveness Research of 2013, 2009, 2004 and 1999.
Annex 14 - The composition of leading minor exporters by export intensity (in %)
Export intensity 2013 (n= 45) 2009 (n=11) 2004 (n=43) 1999 (n=48)
Under 25 68.9 72.7 51.0 6.0
25-75 28.9 18.2 28.0 42.0
Over 75 2.2 9.1 21.0 52.0
Source: own study based on the Hungarian Competitiveness Research of 2013, 2009, 2004 and 1999.
Annex 15 - The composition of leading minor exporters by size (in %)
Company size 2013 (n= 45) 2009 (n=11) 2004 (n=43) 1999 (n=48)
Small 2.2 25.0 16.3 31.3
Medium 80.0 20.0 48.8 68.8
Large 17.8 27.3 34.9 0.0
Source: own study based on the Hungarian Competitiveness Research of 2013, 2009, 2004 and 1999.
Annex 16 - The composition of leading minor exporters by owner structure (in %)
Owner structure 2013 (n= 45) 2009 (n=11) 2004 (n=43) 1999 (n=48)
State 6.7 20.0 19.0 6.5
Domestic 64.4 50.0 54.8 78.3
Foreign 28.9 30.0 26.2 15.2
Source: own study based on the Hungarian Competitiveness Research of 2013, 2009, 2004 and 1999.
Annex 17 - The composition of minor exporters by export revenue (in %)
Export revenue 2013 (n= 31) 2004 (n=43) 1999 (n=41)
Under 100 MHUF 80.6 41.9 85.4
100-499 MHUF 19.4 55.8 14.6
500-999 MHUF 0.0 2.3 0.0
1000-4999 MHUF 0.0 0.0 0.0
5000-9999 MHUF 0.0 0.0 0.0
Over 10000 MHUF 0.0 0.0 0.0
Source: own study based on the Hungarian Competitiveness Research of 2013, 2004 and 1999.
Export Performance Clusters of the Hungarian Enterprises: What Factors … | 29
Annex 18 - The composition of minor exporters by export intensity (in %)
Export intensity 2013 (n= 31) 2004 (n=43) 1999 (n=41)
Under 25 83.9 51.2 100.0
25-75 16.1 27.9 0.0
Over 75 0.0 20.9 0.0
Source: own study based on the Hungarian Competitiveness Research of 2013, 2004 and 1999.
Annex 19 - The composition of leading minor exporters by size (in %)
Company size 2013 (n= 31) 2004 (n=43) 1999 (n=41)
Small 16.1 48.8 34.1
Medium 77.4 39.5 51.2
Large 6.5 11.6 14.6
Source: own study based on the Hungarian Competitiveness Research of 2013, 2004 and 1999.
Annex 20 - The composition of minor exporters by owner structure (in %)
Owner structure 2013 (n= 31) 2004 (n=43) 1999 (n=40)
State 3.2 19.5 17.5
Domestic 8.1 65.9 62.5
Foreign 9.7 14.6 20.0
Source: own study based on the Hungarian Competitiveness Research of 2013, 2004 and 1999.
Annex 21 - Share of clusters from export revenues (in %)
Cluster 2013 (n=163) 2009 (n=105) 2004 (n=156) 1999 (n=156)
Successful 91.6 63.7 67.6 76.59
Stagnant 4.9 6.7 26.2 0.76
Leading minors 1.6 1.5 3.5 0.49
Minors 0.3 0.0 1.2 0.10
Other exporters 1.6 28.10 1.6 22.06
Total 100.0 100.0 100.1 100.0
Source: own study based on the Hungarian Competitiveness Research of 2013, 2009, 2004 and 1999.
Annex 22 - Number of companies by export-performance clusters (in %)
Cluster 2013 (n=163) 2009 (n=105) 2004 (n=156) 1999 (n=156)
Successful 25.2 19.0 15.8 12.8
Stagnant 22.0 18.1 20.3 5.8
Leading minors 28.3 10.5 27.2 30.8
Minors 19.5 0.0 27.2 26.3
Other exporters 5.0 52.4 9.5 24.3
Total 100.0 100.0 100.0 100.0
Source: own study based on the Hungarian Competitiveness Research of 2013, 2009, 2004 and 1999.
