extended fatigue testing of high-usage aircraft fuselage...
TRANSCRIPT
Proceedings of the 8th Joint NASA/FAA/DoD Conference on Aging Aircraft, January 31 – February 3, 2005, Palm Springs, CA.
EXTENDED FATIGUE TESTING OF HIGH-USAGE AIRCRAFT FUSELAGE STRUCTURE
Bao R. Mosinyi FAA-Drexel Fellowship Student
FAA William J. Hughes Technical Center Atlantic City International Airport, NJ 08405, USA
John G. Bakuckas, Jr.
Airworthiness Assurance Branch FAA William J. Hughes Technical Center
Atlantic City International Airport, NJ 08405, USA
Jonathan Awerbuch, Alan C. Lau and Tein-Min Tan Department of Mechanical Engineering and Mechanics
Drexel University, Philadelphia, PA 19104, USA
Ramesh Ramakrishnan Delta Air Lines, Inc.
Atlanta, GA 30320, USA
Abstract Teardown inspections and extended fatigue testing are an effective means to determine the
structural integrity of high-time, high-usage aircraft. The Federal Aviation Administration (FAA), Delta Air Lines, and Drexel University teamed to perform teardown inspection and extended fatigue testing of a retired B727 aircraft near its design service goal of 60,000 flight cycles. Eleven fuselage panels were removed from the aircraft. In seven panels, the state of multiple-site damage (MSD) is characterized through nondestructive inspections (NDI) and fractographic examinations. For the remaining four panels, the state of MSD will be advanced through extended fatigue testing using the FAA’s Full-Scale Aircraft Structural Test Evaluation and Research facility and continuously assessed through both conventional and emerging NDI methods. This paper reports the results of extended fatigue testing of the first of four panels. The test panel was instrumented with strain gages, and quasi-static tests were conducted to ensure a proper load introduction into the panel. Crack formation during fatigue testing was monitored in real-time using high-magnification visual inspections and conventional and emerging NDI methods. To support these tests, geometric nonlinear shell analyses were conducted using the finite element method to predict the strain distributions and other parameters governing crack initiation. No cracks were detected in the panel skin test section after an additional 43,500 simulated flight cycles. The test was terminated due to extensive cracking in the load attachment points of the panel outside the test section. A posttest destructive evaluation is underway to determine if nondetectable cracks developed.
Introduction Airframe teardown inspections and extended fatigue testing are an effective means for structural
evaluations and assessments for continued airworthiness of high-time operational aircraft, particularly those approaching their design service goal (DSG). Essential information and data for evaluating airframe structures that are susceptible to widespread fatigue damage (WFD) are obtained from teardown inspections and extended fatigue testing. While the expertise and knowledge base to conduct teardown inspections are well established by the large commercial airframe original equipment manufacturers (OEM) and military sectors, comprehensive guidelines and data that are documented and available to the
Page 1 of 14 Mosinyi, et al., “Extended Fatigue Testing of High-Usage Aircraft Fuselage Structure”
Proceedings of the 8th Joint NASA/FAA/DoD Conference on Aging Aircraft, January 31 – February 3, 2005, Palm Springs, CA.
broader aviation community are lacking. The destructive testing and analysis of structure removed from retired aircraft will provide the Federal Aviation Administration (FAA) with first-hand knowledge of teardown procedures that may be conducted in support of applications for continued airworthiness certification. Experience and knowledge gained from this destructive analysis will help the FAA develop rules, policy, and advisory circulars pertaining to the prevention of WFD.
For this initiative, the FAA, Delta Air Lines (DAL), and Drexel University teamed to perform destructive evaluation, inspection, and testing of 11 lap-spliced panels removed from a retired B727 narrow-body airplane near its DSG of 60,000 flight cycles [1]. The sections removed are representative of fuselage structure susceptible to WFD identified by the Aviation Rulemaking Advisory Committee, Airworthiness Assurance Working Group [2]. The state of multiple-site damage (MSD) will be characterized through nondestructive inspections (NDI) and fractographic examinations in seven of the fuselage panels. In the remaining four panels, the state of MSD will be advanced through extended fatigue testing using the FAA’s Full-Scale Aircraft Structural Test Evaluation and Research (FASTER) facility and then assessed through NDI and destructive fractographic evaluation. These tests provide a unique opportunity for researchers to measure the incremental development of WFD from cracks that initiated as the result of revenue service operations.
This paper reports the results of the extended fatigue testing of the first of four panels. A baseline inspection using high-magnification visual methods and both conventional and emerging NDI methods revealed no cracks or damage in the panel test section due to prior aircraft in-service usage. The test panel was instrumented with strain gages, and quasi-static tests were conducted to ensure a proper load introduction into the panel. The applied loads used for the fatigue loading simulated the actual in-service usage history of the aircraft. Crack formation during the fatigue test was monitored in real-time using high-magnification visual inspection and several NDI methods. To support the tests, geometric nonlinear shell analyses were conducted using the finite element method to predict the strain distributions and other parameters governing crack formation. No cracks were detected in the skin of the panel in the test section after an additional 43,500 simulated flight cycles. Cracks did develop in the stringer-clip substructure early in the fatigue test after approximately 7500 cycles, resulting in several failures later on. After 30,000 cycles, many cracks develop in the attachment points of the panel outside the test section. Eventually, cracking in this region was so extensive that the fatigue test was terminated. A posttest destructive evaluation was started to determine if nondetectable cracks developed in the panel skin test section.
Description of Airplane and Panels Removed The aircraft selected for this program was a Boeing 727-232, serial number 20751, line number
1000, and registration number N474DA. The airplane was placed into service in 1974 and retired in 1998 to the Southern California International Airport in Victorville, CA. While in service, the airplane accumulated 59,497 flight cycles and 66,412 flight hours and was near its DSG. The airplane was retired prior to the issuance of Airworthiness Directive (AD) 99-04-22, mandating inspections and repairs for inner layer cracking of the lap joints of the B727, thus the AD inspections and repairs were not made on this aircraft. The airplane was owned and operated exclusively by DAL, was well maintained and stored, and has a well-documented and accessible service history. Its use is representative of typical Title 14 Code of Federal Regulations (CFR) part 121 revenue service passenger aircraft currently in the domestic fleet.
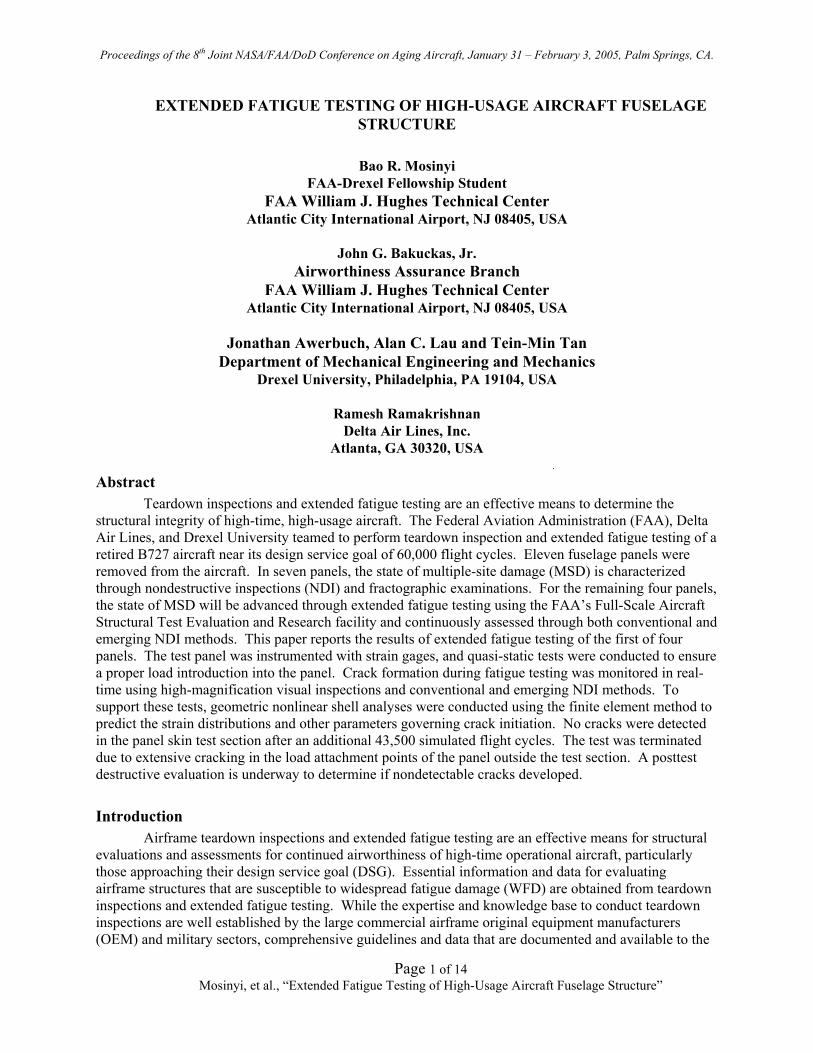
Eleven fuselage lap joint areas susceptible to WFD, each approximately 8 by 12 ft, were removed from the aircraft, seven will be destructively evaluated and four will be subjected to extended fatigue testing, Figure 1. Ten of the fuselage lap joint areas are located on the crown of the fuselage along the lap joint at stringers S-4R and -4L. One large area located in the bilge of the fuselage along stringer S-26L
Page 2 of 14 Mosinyi, et al., “Extended Fatigue Testing of High-Usage Aircraft Fuselage Structure”
S- 4R
S –4L
FS 360 FS 720FS 1130
S –26L
FS 760
Extended Fatigue Testing
Destructive Evaluation
FT1 FT2 FT3
FT4
Proceedings of the 8th Joint NASA/FAA/DoD Conference on Aging Aircraft, January 31 – February 3, 2005, Palm Springs, CA.
Page 3 of 14 Mosinyi, et al., “Extended Fatigue Testing of High-Usage Aircraft Fuselage Structure”
will also be examined. Based on in-service experience findings from fleetwide inspections subsequent to AD 99-04-22, it was anticipated that cracks would be found in these areas of the aircraft.
Figure 1. Fuselage structure for test and analysis
Prior to removing the panels, a field inspection was performed to catalog the condition of the aircraft and target structure. Detailed visual inspections and NDI evaluations were conducted using conventional internal mid-frequency eddy current (MFEC) and external low-frequency eddy current (LFEC) per standard industry practices, OEM specifications, mandated service bulletins, and ADs. These inspections were repeated after the panels were removed and shipped DAL’s facility in Atlanta, GA. In general, field inspection revealed an unsymmetrical damage condition in the aircraft. There were a large number of NDI crack indications along the lap joint along stringer S-4R, while there were few crack indications on the opposite side of the aircraft along stringer S-4L.
The panels along stringer S-4R and S-26L having NDI crack indications were used for damage characterization in subsequent destructive teardown evaluations. The four panels designated for extended fatigue testing, highlighted in the Figure 1, had few crack indications from the field inspections. Three panels, FT1-FT3, contain the lap joint of stringer S-4L between frame stations (FS) 480 to 740. The fourth panel, FT4, contains the lap joint of stringer S-4L between FS 990 to 1090.
Extended Fatigue Testing Four fuselage panels, designated FT1-FT4, are subjected to extended fatigue testing to (1)
propagate and extrapolate the state of damage beyond one DSG; (2) characterize and document the state of damage through real-time NDI, high-magnification visual measurements, and posttest destructive evaluation of fracture surfaces; and (3) correlate analysis methods to determine crack initiation and detection, first linkup, and residual strength.
Test Fixture and Modifications

Proceedings of the 8th Joint NASA/FAA/DoD Conference on Aging Aircraft, January 31 – February 3, 2005, Palm Springs, CA.
Extended fatigue testing is being performed at the FASTER facility located and operated at the FAA’s William J. Hughes Technical Center. The test fixture is capable of applying realistic flight load conditions including differential pressure, longitudinal, hoop and shear load in the skin, and hoop load in the frames. A detailed description of the FASTER facility can be found in [3]. Originally configured to test DC9/MD80 type narrow-body aircraft fuselage panels, modifications were done to accommodate B727 fuselage panels for this program. In addition, test fixture was enhanced to apply variable loading along the hoop and longitudinal edges of the test panel. An acceptance test program was undertaken to ensure that the modified FASTER fixture satisfied the design and operational requirements. A generic curved panel with the same configuration and dimensions as the B727 panels was fabricated and used for the acceptance test.
Inspection Capabilities Several inspection methods are used to detect and record crack formation and growth in the
fuselage panels tested:
Visual Inspection Methods Two methods of high-magnification visual inspections are used in this study, the Remote Control
Crack Monitoring (RCCM) system and the Underwater Crack Monitoring (UCM) system. The RCCM is used to externally monitor fasteners in the lap joint and butt joint for cracks throughout the test. The RCCM is a stand-alone, computer-based video data acquisition system capable of monitoring the entire fuselage panel test surface at several levels of magnification, with a field of view ranging from 0.05" up to 14" and a motion resolution of 1 micron.
The UCM system consists of a remotely controlled underwater camera mounted on remote-controlled robotic tracks. The camera, which is capable of a 340o pan and a 270o tilt, is water resistant and is rated at 44 psi. The camera resides inside the FASTER fixture pressure box and is used primarily to monitor cracking from fasteners in the inner skin of the lap joint.
Conventional NDI Methods Two conventional NDI techniques are used in this study, the external LFEC sliding probe
inspection and the internal MFEC inspection. The LFEC sliding probe is used to externally inspect for inner layer cracking according to B727 NDT Manual, Part 6, 53-30-27. The sliding probe operates in the reflection mode (transmit-receive), i.e., the eddy currents are induced by the driver coil (transmitter) and detected by a separate pick up coil (receiver). The sliding probe is a fast and efficient method to inspect a large number of fastener holes for cracks.
The MFEC probe is used for internal inspections of cracks from fasteners in the inner skin of the lap joint. The probe also uses eddy-current technology as the sliding probe. The inspections are performed according to B727 NDT Manual, Part 6, 53-30-27. Using this method, inspections are done by moving the spot probe around the periphery of a fastener and measuring the impedance changes.
Emerging NDI Methods Three emerging NDI inspection technologies are used in this study, the Meandering Winding
Magnetometer (MWM), Magneto Optic Imaging (MOI), and RivetCheck systems. All three system are designed for external inspections for third layer cracks in built-up structure.
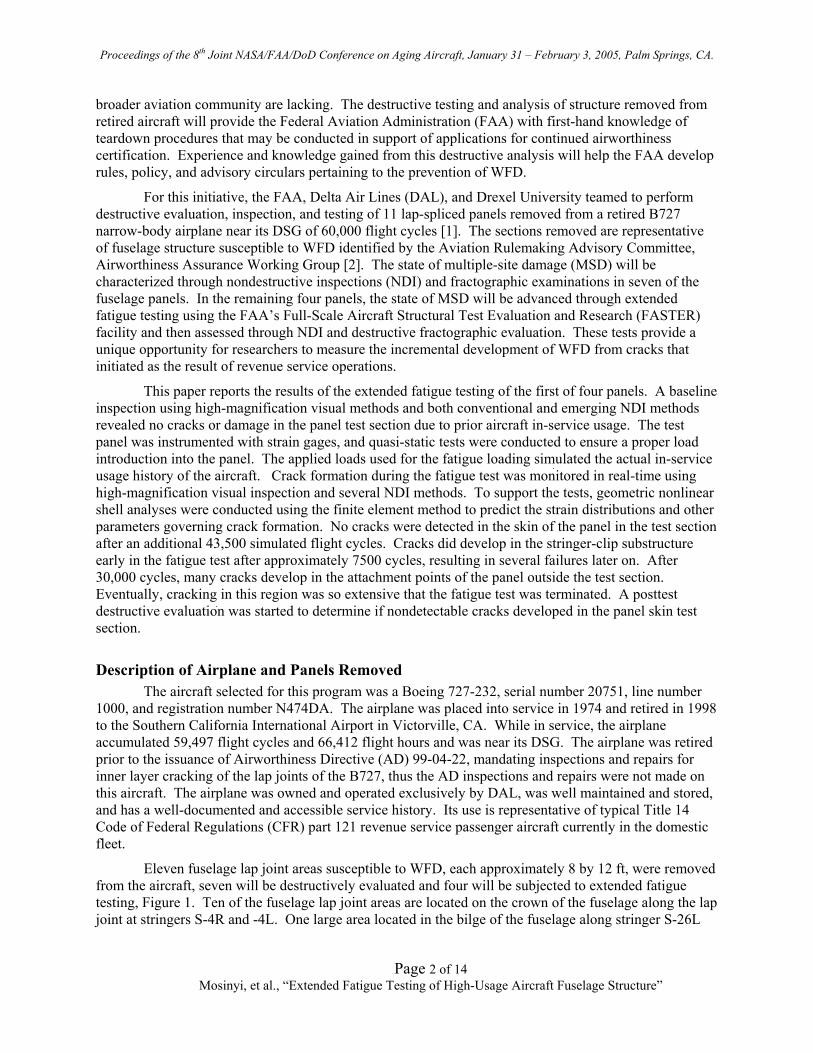
The MWM system, manufactured by Jentek Sensors, Waltham, MA, is capable of scanning an array of fasteners in a lap joint construction. Validation tests showed that MWM has a probability of detection (POD) of 90% with 95% confidence (90/95) for 0.124" third layer fatigue cracks with a false call rate of 0.3%. Figure 2 shows the major components of the system, which include a scanning probe, an interface box, and a laptop computer where the output is analyzed and displayed. In the MWM system, the scanning probe consists of a primary winding element that transmits a current and an array of
Page 4 of 14 Mosinyi, et al., “Extended Fatigue Testing of High-Usage Aircraft Fuselage Structure”
Computer
Scanner
Control unit
Computer
Scanner
Control unit
0.15" 0.05"0.10" No No
Proceedings of the 8th Joint NASA/FAA/DoD Conference on Aging Aircraft, January 31 – February 3, 2005, Palm Springs, CA.
Page 5 of 14 Mosinyi, et al., “Extended Fatigue Testing of High-Usage Aircraft Fuselage Structure”
secondary sensing elements that receive the signal. Figure 2 shows the results of MWM inspections performed on a sample lap joint specimen that consists of three layers of 2024-T3 aluminum sheets joined by two rows of countersunk fasteners. The fastener holes in the specimen contain either no damage or electric discharge machined (EDM) notches ranging from 0.05" to 0.15".
Figure 2. MWM components and signal output
The MOI system is used to conduct inspections on the lower rivet row of the lap splice to detect third layer cracks in lap joints via B727 NDT Manual, Part 6, 53-30-27. This method also is capable of scanning an array of fasteners in a lap joint construction. The MOI has a POD of 90/95 for 0.2" third layer fatigue cracks. The system consists of a control unit, hand-held imaging head, and a video monitor. The MOI technique provides a spatial map of the magnetic field from which cracks can be identified.
The Forester RivetCheck system or self-nulling rotating eddy-current probe is used to conduct inspections on the lap joint, butt splice, and stringer fasteners via B727 NDT Manual, Part 6, 51-00-00. This method is designed to inspect individual fasteners. Validation tests showed that RivetCheck has a POD of 90/95 for 0.032" first layer cracks and a POD of 90/95 for 0.0133" third layer cracks. The RivetCheck system consists of a laptop computer and the rotating probe. The system is user-friendly and automatically displays the waveform as a variation of voltage around the fasteners.
Test Plan Description
BS 620 BS 660BS 640 BS 680 BS 720BS 700
S-8L
S-5L
S-4L
S-3L
S-2L
S-1L
S-7L
S-6L
S-8L
S-5L
S-4L
S-3L
S-2L
S-1L
S-7L
S-6L
125"
73"
Row C
Row BRow A
Test Section
Proceedings of the 8th Joint NASA/FAA/DoD Conference on Aging Aircraft, January 31 – February 3, 2005, Palm Springs, CA.
Page 6 of 14 Mosinyi, et al., “Extended Fatigue Testing of High-Usage Aircraft Fuselage Structure”
Each panel is subjected to the following phases of testing:
Baseline: Prior to fatigue testing, all fasteners are cataloged and inspected using-high magnification visual inspections and NDI (conventional and emerging), discussed previously. In addition, strain surveys are conducted to ensure proper load introduction to the panel.
Phase 1. The panels are then subjected to fatigue load spectrum simulating the in-service flight load conditions. Both conventional and emerging NDI are used to document the number of cycles at which a crack is reliably detected.
Phase 2. Using the same fatigue load spectrum as in Phase 1, the crack growth is monitored and measured to a final damage state, possibly a 1.0" MSD crack or the first MSD linkup, whichever occurs first.
Phase 3. The applied fatigue load is then increased to the limit load conditions and applied at every cycle. The goal of this phase is to determine the size and state of damage at which the residual strength requirements of 14 CFR 25.571 can no longer be met.
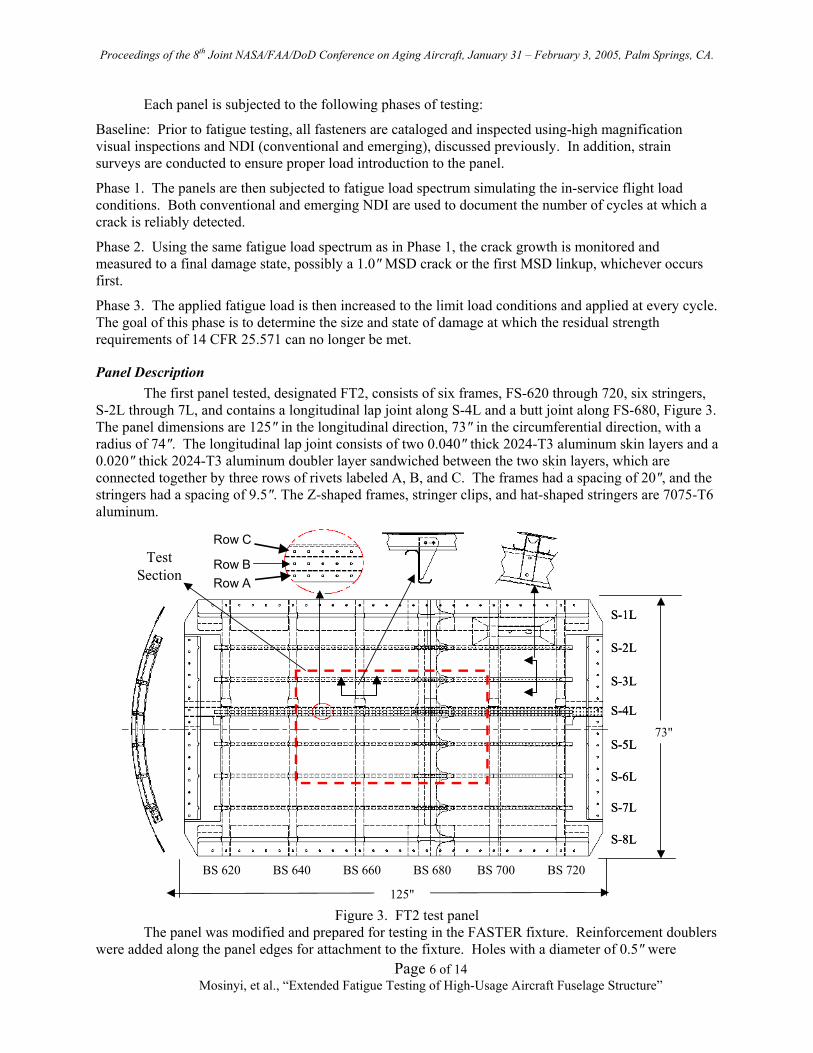
Panel Description The first panel tested, designated FT2, consists of six frames, FS-620 through 720, six stringers,
S-2L through 7L, and contains a longitudinal lap joint along S-4L and a butt joint along FS-680, Figure 3. The panel dimensions are 125" in the longitudinal direction, 73" in the circumferential direction, with a radius of 74". The longitudinal lap joint consists of two 0.040" thick 2024-T3 aluminum skin layers and a 0.020" thick 2024-T3 aluminum doubler layer sandwiched between the two skin layers, which are connected together by three rows of rivets labeled A, B, and C. The frames had a spacing of 20", and the stringers had a spacing of 9.5". The Z-shaped frames, stringer clips, and hat-shaped stringers are 7075-T6 aluminum.
Figure 3. FT2 test panel The panel was modified and prepared for testing in the FASTER fixture. Reinforcement doublers
were added along the panel edges for attachment to the fixture. Holes with a diameter of 0.5" were
Proceedings of the 8th Joint NASA/FAA/DoD Conference on Aging Aircraft, January 31 – February 3, 2005, Palm Springs, CA.
spaced approximately 4" apart on each side and 3.5" apart on the end in the reinforcement doublers to attach to the fixture load mechanisms. Altogether, there were 28 load application points on each side and 16 load application points on each end. The test section of the panel, the area in which the effects of the fixture attachment points are minimized, is approximately one frame bay and one stringer bay from the reinforcement area. The panel was instrumented with over 100 strain gages to monitor and record strain distribution during the test. Strain gages were installed on the skin, frames, and stringers. Several back-to-back strain gage sets were installed at various locations on the skin to measure secondary bending.
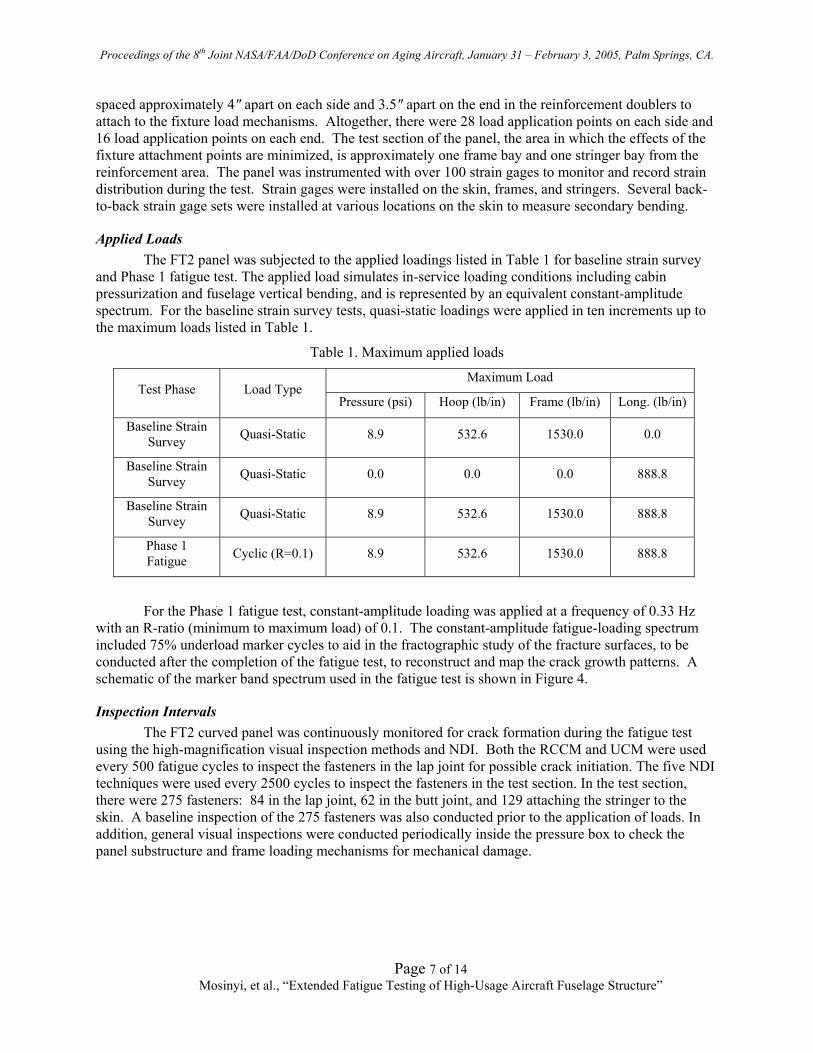
Applied Loads The FT2 panel was subjected to the applied loadings listed in Table 1 for baseline strain survey
and Phase 1 fatigue test. The applied load simulates in-service loading conditions including cabin pressurization and fuselage vertical bending, and is represented by an equivalent constant-amplitude spectrum. For the baseline strain survey tests, quasi-static loadings were applied in ten increments up to the maximum loads listed in Table 1.
Table 1. Maximum applied loads
Maximum Load Test Phase Load Type
Pressure (psi) Hoop (lb/in) Frame (lb/in) Long. (lb/in)
Baseline Strain Survey Quasi-Static 8.9 532.6 1530.0 0.0
Baseline Strain Survey Quasi-Static 0.0 0.0 0.0 888.8
Baseline Strain Survey Quasi-Static 8.9 532.6 1530.0 888.8
Phase 1 Fatigue Cyclic (R=0.1) 8.9 532.6 1530.0 888.8
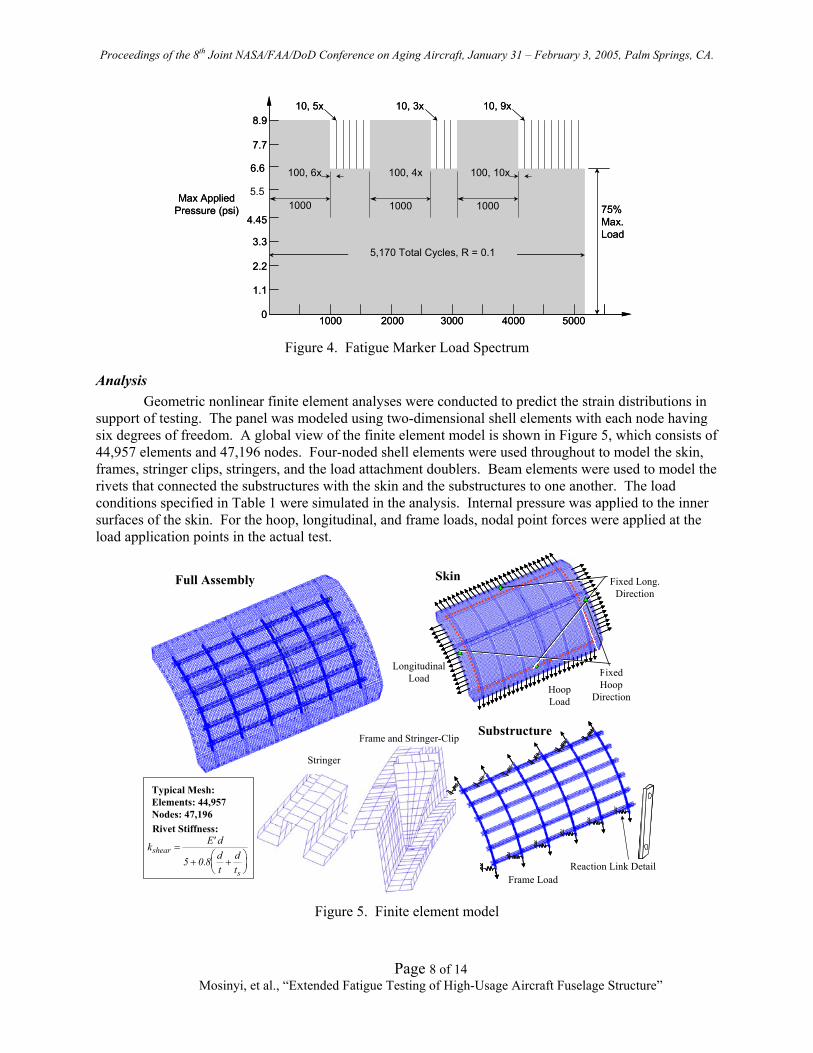
For the Phase 1 fatigue test, constant-amplitude loading was applied at a frequency of 0.33 Hz with an R-ratio (minimum to maximum load) of 0.1. The constant-amplitude fatigue-loading spectrum included 75% underload marker cycles to aid in the fractographic study of the fracture surfaces, to be conducted after the completion of the fatigue test, to reconstruct and map the crack growth patterns. A schematic of the marker band spectrum used in the fatigue test is shown in Figure 4.
Inspection Intervals The FT2 curved panel was continuously monitored for crack formation during the fatigue test
using the high-magnification visual inspection methods and NDI. Both the RCCM and UCM were used every 500 fatigue cycles to inspect the fasteners in the lap joint for possible crack initiation. The five NDI techniques were used every 2500 cycles to inspect the fasteners in the test section. In the test section, there were 275 fasteners: 84 in the lap joint, 62 in the butt joint, and 129 attaching the stringer to the skin. A baseline inspection of the 275 fasteners was also conducted prior to the application of loads. In addition, general visual inspections were conducted periodically inside the pressure box to check the panel substructure and frame loading mechanisms for mechanical damage.
Page 7 of 14 Mosinyi, et al., “Extended Fatigue Testing of High-Usage Aircraft Fuselage Structure”
Proceedings of the 8th Joint NASA/FAA/DoD Conference on Aging Aircraft, January 31 – February 3, 2005, Palm Springs, CA.
Page 8 of 14 Mosinyi, et al., “Extended Fatigue Testing of High-Usage Aircraft Fuselage Structure”
4.45
5.5
0
1.1
2.2
3.3
6.6
7.7
8.9
1000 2000 3000 4000 5000
5,170 Total Cycles, R = 0.1
1000
100, 6x 100, 4x 100, 10x
10, 5x 10, 3x 10, 9x
75% Max. Load
Max Applied Pressure (psi) 1000 1000
4.45
5.5
0
1.1
2.2
3.3
6.6
7.7
8.9
1000 2000 3000 4000 5000
5,170 Total Cycles, R = 0.1
1000
100, 6x 100, 4x 100, 10x
10, 5x 10, 3x 10, 9x
75% Max. Load
Max Applied Pressure (psi) 1000 1000
Figure 4. Fatigue Marker Load Spectrum
Analysis Geometric nonlinear finite element analyses were conducted to predict the strain distributions in
support of testing. The panel was modeled using two-dimensional shell elements with each node having six degrees of freedom. A global view of the finite element model is shown in Figure 5, which consists of 44,957 elements and 47,196 nodes. Four-noded shell elements were used throughout to model the skin, frames, stringer clips, stringers, and the load attachment doublers. Beam elements were used to model the rivets that connected the substructures with the skin and the substructures to one another. The load conditions specified in Table 1 were simulated in the analysis. Internal pressure was applied to the inner surfaces of the skin. For the hoop, longitudinal, and frame loads, nodal point forces were applied at the load application points in the actual test.
Full Assembly Skin
LongitudinalLoad
HoopLoad
Fixed Hoop
Direction
Fixed Long. Direction
Stringer
Rivet Stiffness:
k E ddt
dt
shear
s
=+ +
'
.5 0 8
Typical Mesh:Elements: 44,957Nodes: 47,196
Frame Load
Substructure
Reaction Link Detail
Frame and Stringer-Clip
Figure 5. Finite element model

Applied Pressure (psi)0 2 4 6 8 10
Strain(µε)
0
200
400
600
800
1000
1200
1400
1600
Applied Pressure (psi)0 2 4 6 8 10
Strain(µε)
0
200
400
600
800
1000
1200
1400
1600
(a) Skin hoop, 45o, and longitudinal strains (b) Frame hoop and stringer longitudinal strains
Skin Rosette 91
Stringer Gage 27
Test 1Test 2Test 3Analysis
Longitudinal
45o
Hoop
Stringer Gage 27, Long Strain
Frame Gage 77, Hoop Strain
Frame Gage 77
Skin Rosette 91
Max. Load Pressure 8.9 psi Hoop Load 594.4 lb/in Frame Load 1530 lb Long. Load 1158.6 lb/in
Proceedings of the 8th Joint NASA/FAA/DoD Conference on Aging Aircraft, January 31 – February 3, 2005, Palm Springs, CA.
Page 9 of 14 Mosinyi, et al., “Extended Fatigue Testing of High-Usage Aircraft Fuselage Structure”
Results Representative results from the baseline and Phase 1 fatigue testing of FT2 panel are outlined in
the subsequent sections.
Baseline Test: The test section of the panel was first baselined using high-magnification visual inspections and
conventional and emerging NDI. Altogether, 275 fasteners were inspected in the test section: 84 in the lap joint, 62 in butt splice, and 129 attaching the stringers to the skin. No pre-existing damage was evident due to the service history of the aircraft: 59,497 flight cycles and 66,412 flight hours.
Three tests were then conducted for each of the quasi-static loading conditions listed in Table 1. The load was applied in ten increments up to the maximum values listed in Table 1. The strain distributions measured from all three tests conducted were nearly identical, indicating that the FASTER fixture is reliable and the test data are repeatable. Figure 6 shows representative results of the strain in the hoop, 45°, and longitudinal direction, respectively, measured by a rosette strain gage located in a skin mid-bay for three quasi-static tests. As shown in the figure, the strains were repeatable for all three runs. Also shown in the figure is a plot of the result predicted using the finite element analysis. The predictions from the analysis shown by the solid curves in the figure are in good agreement with the experimental data. Additional results from strain gages measuring longitudinal strain in a stringer and hoop strain in a frame are shown in Figure 6.
Figure 6. FT2 panel strain measurements and predictions
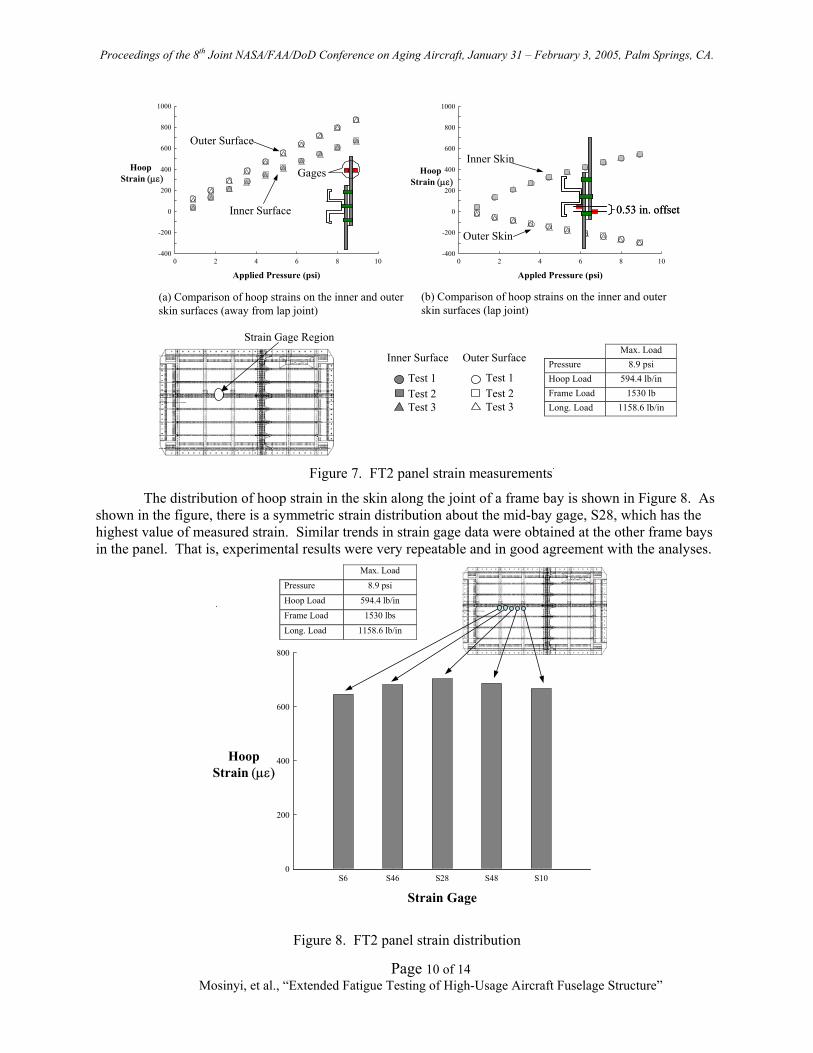
Figure 7 shows the skin hoop strains from a set of back-to-back gages, located 1" above the lap joint between FS 640 and 660, and near rivet row C. It can be seen that at the mid-bay area, the strain on the outer surface is slightly higher than that on the inner surface, indicating that the skin is primarily under in-plane loading with relatively minor bending. Also shown in Figure 7 are strain results in the lap joint area near rivet row A. In this area, the strain on the inner skin surface is under tension while the outer skin is under compression, indicating significant bending.
Proceedings of the 8th Joint NASA/FAA/DoD Conference on Aging Aircraft, January 31 – February 3, 2005, Palm Springs, CA.
Page 10 of 14 Mosinyi, et al., “Extended Fatigue Testing of High-Usage Aircraft Fuselage Structure”
Appled Pressure (psi)0 2 4 6 8 10
Hoop Strain (µε)
-400
-200
0
200
400
600
800
1000
Applied Pressure (psi)0 2 4 6 8 10
Hoop Strain (µε)
-400
-200
0
200
400
600
800
1000
(a) Comparison of hoop strains on the inner and outer skin surfaces (away from lap joint)
(b) Comparison of hoop strains on the inner and outer skin surfaces (lap joint)
Test 1Test 2Test 3
Inner Surface
Test 1Test 2Test 3
Outer Surface
Strain Gage Region Max. Load Pressure 8.9 psi Hoop Load 594.4 lb/in Frame Load 1530 lb Long. Load 1158.6 lb/in
Outer Surface
Inner Surface
Gages
Outer Skin
Inner Skin
0.53 in. offset0.53 in. offset
Figure 7. FT2 panel strain measurements
The distribution of hoop strain in the skin along the joint of a frame bay is shown in Figure 8. As shown in the figure, there is a symmetric strain distribution about the mid-bay gage, S28, which has the highest value of measured strain. Similar trends in strain gage data were obtained at the other frame bays in the panel. That is, experimental results were very repeatable and in good agreement with the analyses.
Strain GageS6 S46 S28 S48 S10
HoopStrain (µε)
0
200
400
600
800
Max. Load
Pressure 8.9 psi
Hoop Load 594.4 lb/in
Frame Load 1530 lbs
Long. Load 1158.6 lb/in
Figure 8. FT2 panel strain distribution
Proceedings of the 8th Joint NASA/FAA/DoD Conference on Aging Aircraft, January 31 – February 3, 2005, Palm Springs, CA.
Page 11 of 14 Mosinyi, et al., “Extended Fatigue Testing of High-Usage Aircraft Fuselage Structure”
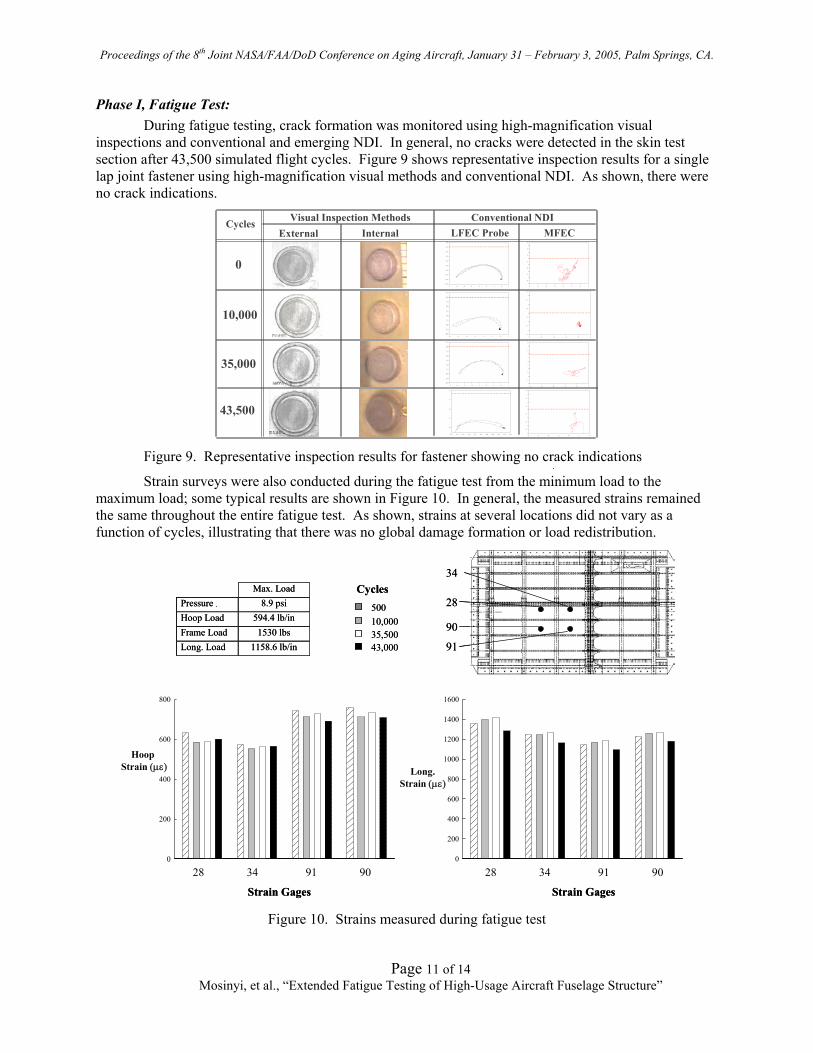
Phase I, Fatigue Test: During fatigue testing, crack formation was monitored using high-magnification visual
inspections and conventional and emerging NDI. In general, no cracks were detected in the skin test section after 43,500 simulated flight cycles. Figure 9 shows representative inspection results for a single lap joint fastener using high-magnification visual methods and conventional NDI. As shown, there were no crack indications.
-8 -6 -4 -2 0 2
-2
0
2
4
6
8
-8 -6 -4 -2 0 2 4 6
-4
-2
0
2
4
6
8
-8 -6 -4 -2 0 2 4 6
-4
-2
0
2
4
6
8
-8 -6 -4 -2 0 2-2
0
2
4
6
8
-8 -6 -4 -2 0 2-2
0
2
4
6
8
-7 -6 -5 -4 -3 -2 -1 0 1-0.5
0.0
0.5
1.0
1.5
2.0
2.5
3.0
3.5
4.0
-7 -6 -5 -4 -3 -2 -1 0 1-0.5
0.0
0.5
1.0
1.5
2.0
2.5
3.0
3.5
4.0
-6 -5 -4 -3 -2 -1 0 1-0.5
0.5
1.5
2.5
3.5
0.0
1.0
2.0
3.0
4.0
-7 -6 -5 -4 -3 -2 -1 0 1-0.5
0.5
1.5
2.5
3.5
0.0
1.0
2.0
3.0
4.0
-2.0 -1.8 -1.6 -1.4 -1.2 -1.0 -0.8 -0.6 -0.4 -0.2 0.0
0
1
2
3
4
-8 -6 -4 -2 0 2 4
-2
0
2
4
6
8
Cycles
0
10,000
Internal
35,000
External MFECLFEC Probe
43,500
Visual Inspection Methods Conventional NDI
Figure 9. Representative inspection results for fastener showing no crack indications
Strain surveys were also conducted during the fatigue test from the minimum load to the maximum load; some typical results are shown in Figure 10. In general, the measured strains remained the same throughout the entire fatigue test. As shown, strains at several locations did not vary as a function of cycles, illustrating that there was no global damage formation or load redistribution.
Max. Load Pressure 8.9 psi Hoop Load 594.4 lb/in Frame Load 1530 lbs Long. Load 1158.6 lb/in
28 34 91 90 28 34 91 90
Strain Gages Strain Gages
28
34
90
91
50010,000
43,00035,500
Cycles
Hoop Strain (µε)
0
200
400
600
800
Long.Strain (µε)
0
200
400
600
800
1000
1200
1400
1600
Max. Load Pressure 8.9 psi Hoop Load 594.4 lb/in Frame Load 1530 lbs Long. Load 1158.6 lb/in
28 34 91 9028 34 91 90 28 34 91 9028 34 91 90
Strain Gages Strain Gages
28
34
90
91
50010,000
43,00035,500
Cycles
Hoop Strain (µε)
0
200
400
600
800
Long.Strain (µε)
0
200
400
600
800
1000
1200
1400
1600
Figure 10. Strains measured during fatigue test
Proceedings of the 8th Joint NASA/FAA/DoD Conference on Aging Aircraft, January 31 – February 3, 2005, Palm Springs, CA.
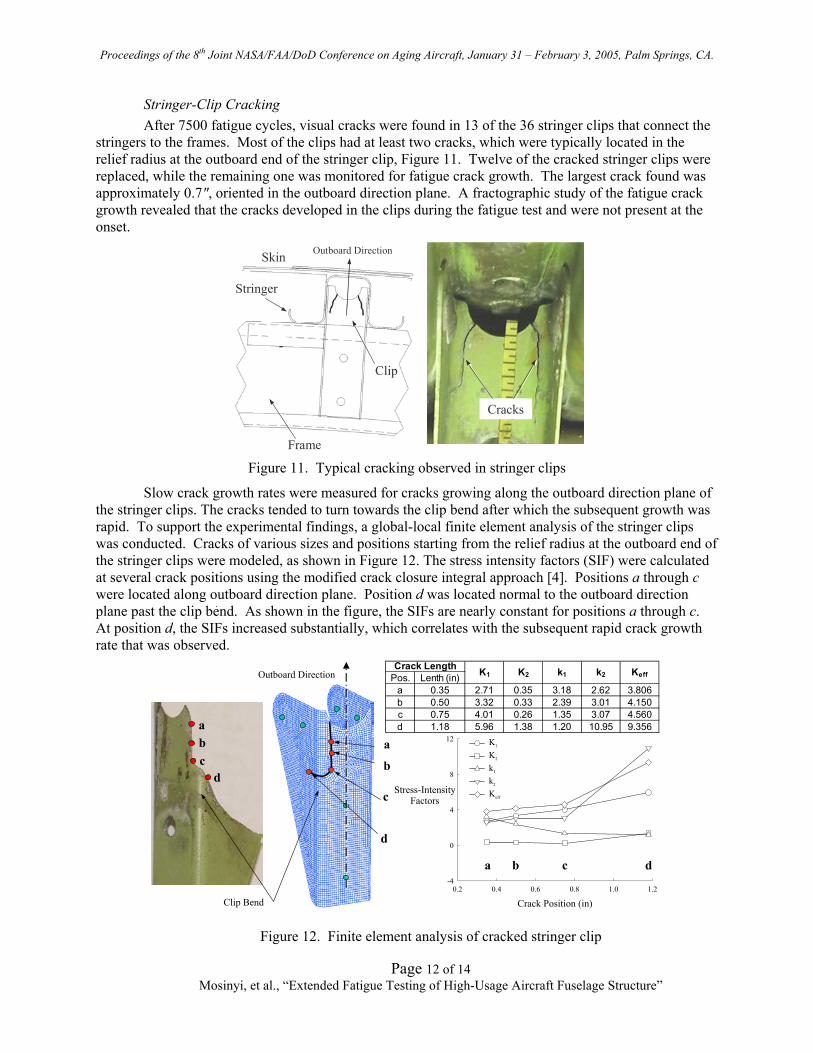
Stringer-Clip Cracking After 7500 fatigue cycles, visual cracks were found in 13 of the 36 stringer clips that connect the
stringers to the frames. Most of the clips had at least two cracks, which were typically located in the relief radius at the outboard end of the stringer clip, Figure 11. Twelve of the cracked stringer clips were replaced, while the remaining one was monitored for fatigue crack growth. The largest crack found was approximately 0.7", oriented in the outboard direction plane. A fractographic study of the fatigue crack growth revealed that the cracks developed in the clips during the fatigue test and were not present at the onset.
Cracks
Frame
Stringer
Clip
Skin Outboard Direction
Figure 11. Typical cracking observed in stringer clips
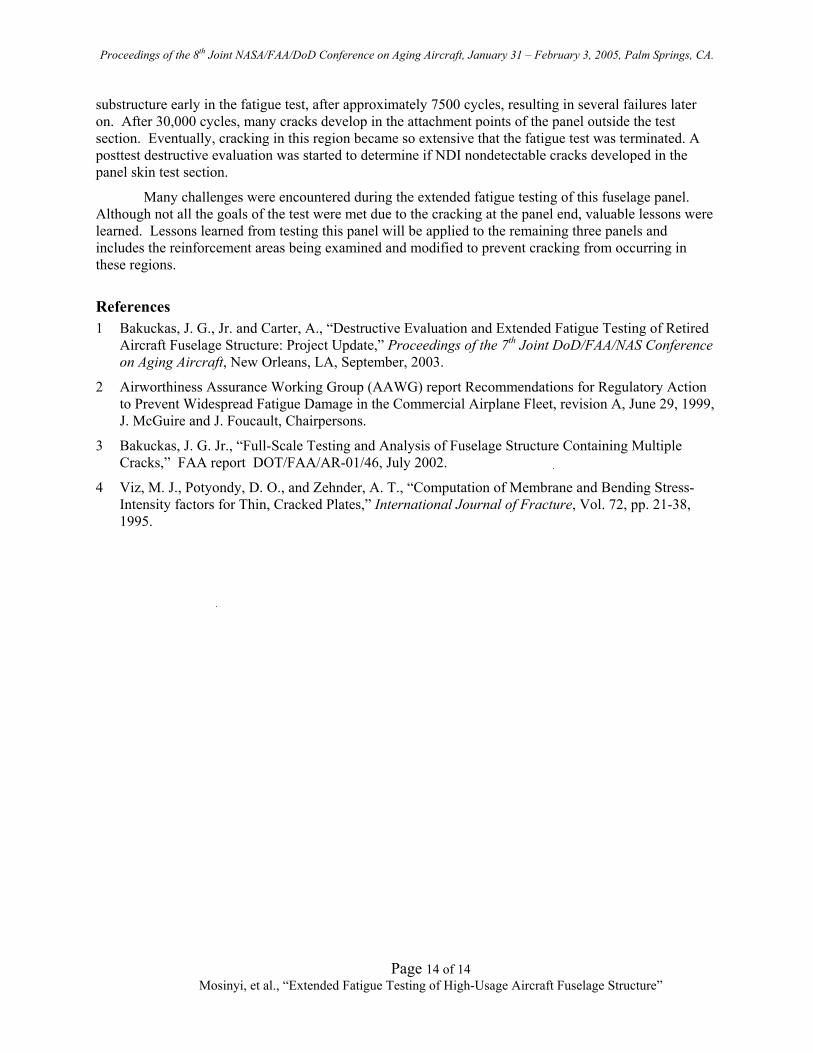
Slow crack growth rates were measured for cracks growing along the outboard direction plane of the stringer clips. The cracks tended to turn towards the clip bend after which the subsequent growth was rapid. To support the experimental findings, a global-local finite element analysis of the stringer clips was conducted. Cracks of various sizes and positions starting from the relief radius at the outboard end of the stringer clips were modeled, as shown in Figure 12. The stress intensity factors (SIF) were calculated at several crack positions using the modified crack closure integral approach [4]. Positions a through c were located along outboard direction plane. Position d was located normal to the outboard direction plane past the clip bend. As shown in the figure, the SIFs are nearly constant for positions a through c. At position d, the SIFs increased substantially, which correlates with the subsequent rapid crack growth rate that was observed.
Crack Position (in)0.2 0.4 0.6 0.8 1.0 1.2
Stress-IntensityFactors
-4
0
4
8
12 K1
K2
k1
k2
Keff
Pos. Lenth (in)a 0.35 2.71 0.35 3.18 2.62 3.806b 0.50 3.32 0.33 2.39 3.01 4.150c 0.75 4.01 0.26 1.35 3.07 4.560d 1.18 5.96 1.38 1.20 10.95 9.356
KeffCrack Length K1 K2 k1 k2
a
b
c
d
abc
d
dcba
Outboard Direction
Clip Bend
Figure 12. Finite element analysis of cracked stringer clip
Page 12 of 14 Mosinyi, et al., “Extended Fatigue Testing of High-Usage Aircraft Fuselage Structure”

Fatigue cracks
Reinforced Area
Repairs
Proceedings of the 8th Joint NASA/FAA/DoD Conference on Aging Aircraft, January 31 – February 3, 2005, Palm Springs, CA.
Page 13 of 14 Mosinyi, et al., “Extended Fatigue Testing of High-Usage Aircraft Fuselage Structure”
Longitudinal Load Attachment Cracking After 30,000 cycles, cracks were observed in the longitudinal reinforcement areas of FT2. The
cracks were mostly oriented in the hoop direction. The cracked areas that were accessible were repaired without removing the panel from the fixture. Eventually, cracking in this region was so extensive that the fatigue test was terminated after 43,500 fatigue cycles, as shown in Figure 13.
Figure 13. Cracking in longitudinal reinforcement area of FT2 after 43,500 cycles
Fractographic Examinations A post-test destructive evaluation was initiated to determine if NDI nondetectable cracks
developed in the panel skin test section using the teardown protocol outlined in reference [1]. Preliminary findings indicate no cracks on the surface of the skin around four fastener holes located in the lap joint mid-bay between FS 660 and 680 as viewed under an optical microscope. The joint is being disassembled for further assessments for cracks at the hole and faying surfaces.
Concluding Remarks
For this initiative, the Federal Aviation Administration (FAA), Delta Air Lines, and Drexel University have teamed to perform teardown inspection and extended fatigue testing of a retired B727 aircraft near its design service goal of 60,000 flight cycles. Eleven fuselage panels were removed from the aircraft. In seven panels, the state of multiple-site damage (MSD) will be characterized using nondestructive inspections (NDI) and fractographic examinations. For the remaining four panels, the state of MSD will be advanced through extended fatigue testing using the FAA’s Full-Scale Aircraft Structural Test Evaluation and Research facility.
This paper reports the results of the extended fatigue testing of the first of four panels to be tested. A baseline inspection using high-magnification visual methods and both conventional and emerging NDI methods revealed no cracks or damage in the skin of the panel test section due to prior aircraft in-service usage. The panel was instrumented with strain gages, and quasi-static tests were conducted to ensure a proper load introduction. The applied loads used for the fatigue loading simulated the actual in-service usage history of the aircraft. Crack formation during the fatigue test was monitored in real-time using high-magnification visual inspection and NDI. No cracks were detected in the skin of the panel test section after an additional 43,500 simulated flight cycles. Cracks did develop in the stringer-clip
Proceedings of the 8th Joint NASA/FAA/DoD Conference on Aging Aircraft, January 31 – February 3, 2005, Palm Springs, CA.
substructure early in the fatigue test, after approximately 7500 cycles, resulting in several failures later on. After 30,000 cycles, many cracks develop in the attachment points of the panel outside the test section. Eventually, cracking in this region became so extensive that the fatigue test was terminated. A posttest destructive evaluation was started to determine if NDI nondetectable cracks developed in the panel skin test section.
Many challenges were encountered during the extended fatigue testing of this fuselage panel. Although not all the goals of the test were met due to the cracking at the panel end, valuable lessons were learned. Lessons learned from testing this panel will be applied to the remaining three panels and includes the reinforcement areas being examined and modified to prevent cracking from occurring in these regions.
References 1 Bakuckas, J. G., Jr. and Carter, A., “Destructive Evaluation and Extended Fatigue Testing of Retired
Aircraft Fuselage Structure: Project Update,” Proceedings of the 7th Joint DoD/FAA/NAS Conference on Aging Aircraft, New Orleans, LA, September, 2003.
2 Airworthiness Assurance Working Group (AAWG) report Recommendations for Regulatory Action to Prevent Widespread Fatigue Damage in the Commercial Airplane Fleet, revision A, June 29, 1999, J. McGuire and J. Foucault, Chairpersons.
3 Bakuckas, J. G. Jr., “Full-Scale Testing and Analysis of Fuselage Structure Containing Multiple Cracks,” FAA report DOT/FAA/AR-01/46, July 2002.
4 Viz, M. J., Potyondy, D. O., and Zehnder, A. T., “Computation of Membrane and Bending Stress-Intensity factors for Thin, Cracked Plates,” International Journal of Fracture, Vol. 72, pp. 21-38, 1995.
Page 14 of 14 Mosinyi, et al., “Extended Fatigue Testing of High-Usage Aircraft Fuselage Structure”