extended professional development in project … abstract from 2008 to 2010, project-based learning...
TRANSCRIPT

Office of ResearchDivision of Curriculum and Instruction
Extended Professional Development in Project-Based LearningImpacts on 21st Century Skills Teaching and Student Achievement

West Virginia Board of education
2012-2013
L. Wade Linger Jr., PresidentGayle C. Manchin, Vice President
Robert W. Dunlevy, Secretary
Michael I. Green, MemberPriscilla M. Haden, MemberLloyd G. Jackson II, MemberLowell E. Johnson, MemberJenny N. Phillips, MemberWilliam M. White, Member
Paul L. Hill, Ex OfficioChancellor
West Virginia Higher Education Policy Commission
James L. Skidmore, Ex OfficioChancellor
West Virginia Council for Community and Technical College Education
Jorea M. Marple, Ex OfficioState Superintendent of Schools
West Virginia Department of Education

Extended Professional Development in Project-Based Learning
Impacts on 21st Century Teaching and Student Achievement
Nate K. Hixson
Jason Ravitz
Andy Whisman

West Virginia Department of Education Division of Teaching and Learning
Office of Research Building 6-Room 722 State Capitol Complex
1900 Kanawha Boulevard East Charleston, WV 25305
http://wvde.state.wv.us/
September 2012 Jorea M. Marple State Superintendent of Schools West Virginia Department of Education Robert Hull Associate Superintendent West Virginia Department of Education Larry J. White Executive Director Office of Research Acknowledgements This research was funded, in part, by a grant from the Buck Institute for Education,
and was further supported by the guidance and collaboration of BIE’s research director, Ja-son Ravitz, and executive director, John R. Mergendoller.
Keywords Project-Based Learning, Professional Development, Standardized Testing, Student
Performance Suggested Citation
Hixson, N.K., Ravitz, J., & Whisman, A. (2012). Extended professional development
in project-based learning: Impacts on 21st century teaching and student achievement.
Charleston, WV: West Virginia Department of Education, Division of Teaching and Learn-
ing, Office of Research.
Content Contact Nate Hixson Assistant Director Office of Research [email protected]

iii
Abstract
From 2008 to 2010, project-based learning (PBL) was a major focus of the Teacher
Leadership Institute (TLI), undertaken by the West Virginia Department of Education
(WVDE), as a method for teaching 21st century skills. Beginning in January 2011, a summa-
tive evaluation was conducted to investigate the effect of PBL implementation on teachers’
perceived ability to teach and assess 21st century skills and on student achievement.
Method of study. We conducted a survey of teachers who (a) were trained in PBL at
TLI by Buck Institute for Education (BIE), (b) had been identified as experienced users be-
cause they had successfully published a project in the state’s peer-reviewed project library,
and (c) used PBL during the spring semester of SY2011. The survey responses of the final
sample of 24 trained PBL-using teachers were compared to a matched group of teachers
with similar backgrounds and teaching assignments who did not use PBL or who had used it
but had limited or no professional development and had not participated in the BIE training.
WESTEST 2 achievement gains in English/language arts, mathematics, science, and social
studies were compared for students of the two groups of teachers.
Findings. Overall, there were substantial and statistically significant effect size dif-
ferences between teachers who used PBL with extended professional development and other
teachers in the sample. Compared with the matching group, the extensively trained PBL-
using teachers taught 21st century skills more often and more extensively. This finding ap-
plied across the four content areas, in classrooms serving students with a range of perfor-
mance levels, and whether or not their schools had block scheduling. The study also found
that teachers did not feel as successful at assessing the skills as they did teaching them.
Students of these teachers performed no differently on WESTEST 2 than a matched
set of students taught by non-PBL-using teachers or teachers who had not received extensive
training. Although these results did not show significantly different gains, they should serve
to mitigate the concern among some educators that engaging in PBL will impede standard-
ized test preparation. This study also provided evidence of the potential of PBL to become
part of the larger educational landscape by working in different types of schools.
Limitations of study. All studies of this nature that involve voluntary teacher partici-
pation in professional development and implementation have a risk of self-selection bias.
Survey responses were based on teacher perceptions regarding a “target class”; consequently
they do not necessarily represent the breadth of instruction provided by the sampled teach-
ers in all of their course offerings. Due to relatively low sample sizes and small effect sizes,
the achievement test analyses were afflicted by low statistical power. When we aggregated
our data (across content areas) the result approached significance, but the difference be-
tween groups was still quite small in practicality.

iv

v
Contents
Abstract .................................................................................................................................... iii
Introduction ............................................................................................................................... 1
Review of Relevant Scholarship .......................................................................................... 2
Research Questions and Hypotheses .................................................................................. 3
Methods and Results ................................................................................................................ 5
Research Question 1 Methods............................................................................................. 5
Participant characteristics ............................................................................................ 5
Sampling procedures .................................................................................................... 5
Sample power and precision ..........................................................................................7
Measures and covariates ................................................................................................7
Research design ............................................................................................................ 9
Research Question 1 Results ..............................................................................................10
Overall results .............................................................................................................. 11
Results for 21st century skills: Frequency of PBL use ................................................. 11
Results for 21st century skills: Extensiveness of PBL use ........................................... 12
Results within and across content areas ...................................................................... 13
Results by perceived student workload, outcomes, and achievement levels .............. 14
Results by block scheduling ......................................................................................... 15
Results by teacher background .................................................................................... 17
Research Question 2 Methods ........................................................................................... 18
Participant characteristics ........................................................................................... 18
Sampling procedures ................................................................................................... 19
Sample size, power, and precision .............................................................................. 20
Measures and covariates ............................................................................................. 20
Research design ........................................................................................................... 21
Research Question 2 Results ............................................................................................. 21
Mathematics main analysis ........................................................................................ 24
English/language arts main analysis .......................................................................... 24
Science main analysis ................................................................................................. 25
Social studies main analysis ....................................................................................... 26
Post-hoc analyses for RQ2 .......................................................................................... 26

Abstract
vi | Extended Professional Development in Project-Based Learning
Discussion ................................................................................................................................ 31
Limitations of the study .................................................................................................... 32
Recommendations .................................................................................................................. 35
References ............................................................................................................................... 37
Appendix A. Survey Instrument .............................................................................................. 41
Appendix B. 21st Century Skills Frameworks ......................................................................... 59
Appendix C. Recoding Methods .............................................................................................. 61
Appendix D. Index Construction Factor Analyses .................................................................. 63
Appendix E. Research Question 1 Data Analysis Tables ........................................................ 69
Appendix F. Research Question 2 Data Analysis Tables ........................................................ 79
Covariate 1: District .......................................................................................................... 79
Covariate 2: Race ............................................................................................................... 81
List of Figures
Figure 1. Definitions of 21st Century Skills .......................................................................... 8
Figure 2. Mean 21st Century Skills Index by PBL Use, Within Class Achievement and
Block Schedule ...................................................................................................... 17
Figure 3. Differences in Baseline Achievement Between the Groups by Content Area ..... 23
Figure 4. Mathematics Gain During SY2011 by Group ....................................................... 24
Figure 5. English/Language Arts Gain During SY2011 by Group ...................................... 25
Figure 6. Science Gain During SY2011 by Group ................................................................ 25
Figure 7. Social Studies Gain During SY2011 by Group ..................................................... 26
List of Tables
Table 1. Mean 21st Century Skills Index by PBL Use (Two and Three Categories) ........... 11
Table 2. Mean 21st Century Skills Practices for Each Skill by PBL Use ............................. 12
Table 3. Mean Perceptions of 21st Century Skills Taught by PBL Use .............................. 13
Table 4. Mean 21st Century Skills Index by Subject and PBL Use ..................................... 14
Table 5. Mean 21st Century Skills Index by Class Academic Performance and PBL Use .. 15
Table 6. Mean 21st Century Skills Index by Block Schedule and PBL Use ........................ 16
Table 7. Mean 21st Century Skills Index by Teacher as PD Leader and PBL Use ............. 17
Table 8. Number of Survey Respondents by PBL Implementation Status ........................ 18
Table 9. Number of WVEIS Validated PBL Teachers by Content Area ............................. 19
Table 10. Number of Students in PBL Courses by Content Area ......................................... 19

Abstract
Extended Professional Development in Project-Based Learning | vii
Table 11. Verification of Matching for Categorical Covariates ........................................... 22
Table 12. Verification of Matching for Interval Level Covariate ......................................... 23
Table 13. Distribution of Students by Mathematics Course Code and Group .................... 24
Table 14. Distribution of Students by English/Language Arts Course Code and Group .... 24
Table 15. Distribution of Students by Science Course Code and Group ............................. 25
Table 16. Distribution of Students by Social Studies Course Code and Group................... 26
Table 17. Power Analyses for Content Area t-Tests ............................................................ 27
Table 18. Tests of Between Subjects Effects for Factorial ANOVA Testing Interaction
Between Group and Starting Point (Mathematics) ............................................. 28
Table 19. Tests of Between Subjects Effects for Factorial ANOVA Testing Interaction
Between Group and Starting Point (English/Language Arts) ............................. 28
Table 20. Tests of Between Subjects Effects for Factorial ANOVA Testing Interaction
Between Group and Starting Point (Science) ...................................................... 28
Table 21. Tests of Between Subjects Effects for Factorial ANOVA Testing Interaction
Between Group and Starting Point (Social Studies)............................................ 29
List of Appendix Tables
Table A 1. Survey Respondent Recoding Based on Background Information From
Survey Responses ................................................................................................. 61
Table A 2. Factor Analysis of the Last Four 21st Century Skills ........................................... 63
Table A 3. Factor Analysis of the First Four 21st Century Skills .......................................... 65
Table A 4. Factor Analysis of Perceptions Items for First Four 21st Century skills ............ 67
Table A 5. Time on Professional Development, Extended Assignments, and Perceived
Outcomes, by PBL Use......................................................................................... 69
Table A 6. Mean 21st Century Skills Correlated to Professional Development and
Extended Assignments ........................................................................................ 70
Table A 7. Independent Samples T Test of Means, by PBL Use ............................................ 71
Table A 8. ANOVA Tests for Mean 21st Century Skills......................................................... 72
Table A 9. Independent Samples T Tests of Means for Each Skill, by PBL Use ................... 73
Table A 10. Means on Practices Items for Each Skill, by PBL Use ......................................... 74
Table A 11. Independent Sample T Tests for 21st Century Skills by PBL Use Within
Subjects ................................................................................................................. 77
Table A 12. Mean 21st Century Skills Z-Scores Across Subject Areas ..................................... 77
Table A 13. ANOVA Test of Differences in 21st Century Skills by Subject Area ..................... 77
Table A 14. Chi-Square Test For Distribution by PBL Category ............................................ 78

Abstract
viii | Extended Professional Development in Project-Based Learning
Table A 15. Factorial ANOVA Results for “District” and Dependent Variable: Math Gain ... 79
Table A 16. Factorial ANOVA Results for “District” and Dependent Variable: RLA Gain ..... 79
Table A 17. Factorial ANOVA Results for “District” and Dependent Variable: Science
Gain ................................................................................................................... 80
Table A 18. Factorial ANOVA Results for “District” and Dependent Variable: Social
Studies Gain ......................................................................................................... 80
Table A 19. Factorial ANOVA Results for “Race” and Dependent Variable:
Reading/Language Arts Gain ............................................................................... 81

1
Introduction
From 2008 to 2010, project-based learning (PBL) was the focus of a major professional
development effort, the Teacher Leadership Institute (TLI), undertaken by the West Virginia
Department of Education (WVDE).
TLI is an annual yearlong professional development experience, with an intensive week-
long residency, to support teams of teacher leaders from each county. The county teams trained
at TLI are charged with assisting the county leadership as they build capacity for 21st century
learning experiences for students and their teachers. According to WVDE Office of Instruction
staff, the collaborative school teams focus on creating engaging instructional designs and their
delivery “to improve student achievement while transforming the culture of the school to sup-
port collaboration, communication, problem solving, creativity, and critical thinking among stu-
dents and teachers” (WVDE, n.d.). Throughout the year, the office provides monthly webinars to
support the TLI teams.1
All PBL professional development provided during this period was conducted in partner-
ship with the Buck Institute for Education (BIE), a nonprofit group founded in 1987 that has fo-
cused since the late 1990s on the provision of high-quality PBL professional development.2
PBL is an approach to instruction that can vary depending on grade level and subject
area. Mergendoller, Markham, Ravitz, and Larmer (2006) have provided a general definition
that captures many important characteristics of PBL. They explain that PBL is “a systemic teach-
ing method that engages students in learning essential knowledge and life-enhancing skills
through an extended, student-influenced inquiry process that is structured around complex, au-
thentic questions and carefully designed products and tasks” (p. 587). In other words, while al-
lowing for some degree of student voice and choice, teachers carefully plan, manage, and assess
rigorous projects to help students learn key academic content and develop 21st century skills.
Twenty-first century skills as defined in West Virginia 21st Century Content Standards
and Objectives (West Virginia Board of Education, 2008) include the following:
Standard 1: Information and Communication Skills—The student will access, analyze, manage, integrate, evaluate, and create information in a variety of forms using appropriate technology skills and communicate that information in an ap-propriate oral, written, or multimedia format. (p. 1)
Standard 2: Thinking and Reasoning Skills—The student will demonstrate the ability to explore and develop new ideas, to intentionally apply sound reasoning processes and to frame, analyze and solve complex problems using appropriate technology tools. (p. 4)
1 More information about the Teacher Leadership Institute is available at
http://wvde.state.wv.us/instruction/.
2 More information about the BIE is available at http://www.bie.org/.
Introduction
2 | Extended Professional Development in Project-Based Learning
Standard 3: Personal and Workplace Skills—The student will exhibit leadership, ethical behavior, respect for others; accept responsibility for personal actions considering the impact on others; take the initiative to plan and execute tasks; and interact productively as a member of a group. (p. 5)
Significant resources have supported the professional development effort to prepare
teachers to use PBL as a method for teaching 21st century skills; consequently, the WVDE Office
of Research (OR) and BIE, in collaboration with the WVDE Office of Instruction (OI) undertook
a summative evaluation of the effect of PBL implementation on teachers’ perceived ability to
teach and assess 21st century skills, and on student achievement. A research proposal and re-
search-funding request submitted to BIE in December 2010 was approved, and subsequently
guided the research beginning in January 2011.
Review of Relevant Scholarship
Research suggests that PBL is not only aligned with 21st century skills, but also has a
number of academic and other benefits. Many studies have reported positive changes in student
motivation, attitude toward learning, critical thinking, and problem-solving skills resulting from
their participation in project-based learning (Bartscher, Gould, & Nutter, 1995; Peck, Peck,
Sentz, & Zasa, 1998; Tretten & Zachariou, 1995). Others have emphasized PBL as a form of rig-
orous content delivery, finding improved cognitive outcomes for students, but no similar gains
in motivation and affective outcomes (Kanter & Konstantopoulos, 2010). The impact varies
based on design and implementation approaches.
For most important outcomes (with the exception of short-term concept learning), PBL
appears to be as effective as traditional instructional approaches, and there are studies that
show PBL to be superior (Buck Institute for Education, 2009; Edutopia, 2001; Finkelstein, et al.,
2010; Walker & Leary, 2008). The impact of PBL is most noticeable when assessments are de-
signed to address performance on complex tasks, long-term retention, and deeper conceptual
learning (Strobel & van Barneveld, 2008). Student work that involves an active mode of acquir-
ing knowledge—authentic pedagogy—has been linked to heightened student achievement on
standardized tests (Newmann & Associates, 1996; Newmann, Bryk, & Nagaoka, 2001) while
studies from Detroit (Geier, et al., 2008) and in the United Kingdom (Boaler, 2002) indicate
that carefully conducted PBL can improve achievement for diverse students.
As one of the authors of this study reported previously (Ravitz, 2010, p. 294), PBL-type
instruction has been shown
to increase understanding of concepts and the ability to apply knowledge as meas-ured by standardized tests of subject matter (e.g., Finkelstein et al., 2010; Geier et al., 2008; Hickey, Kindfled, Horwitz, & Christie, 1999; Mergendoller, Maxwell, & Belli-simo, 2007; Walker & Leary, 2008);
to enable students to remember what they have learned longer and use that knowledge in new situations (e.g., Dochy, Segers, Van den Bossche, & Gijbels, 2003; Schwartz & Martin, 2004; Strobel & van Barneveld, 2008);
to enable students to learn how to work in groups, solve problems, and communicate what they have learned (e.g., Cognition and Technology Group at Vanderbilt, 1992; Gallagher, Stepien, & Rosenthal, 1992; Hmelo, 1998);

Introduction
Extended Professional Development in Project-Based Learning | 3
to improve attitudes and motivation (e.g., Boaler, 2002); and
to be especially effective with lower-achieving students (e.g., Finkelstein, et al., 2010; Geier et al., 2008; Hickey, Kindfled, Horwitz, & Christie, 1999; Lynch, Kuipers, Pyke, & Szesze, 2005; Newmann, Bryk, & Nagaoka, 2001).
Research Questions and Hypotheses
WVDE has emphasized PBL both for teaching of 21st century skills and for helping stu-
dents learn core content at a deeper level (WVDE, n.d.). Our study tests the idea, articulated in
Mergendoller, Markham, Ravitz, and Larmer (2006) that well-planned, managed, and assessed
projects can help students develop 21st century skills at the same time they help students learn
rigorous academic content.
We posed two central research questions in this study:
RQ1 Do teachers who received extended professional development and are experienced PBL users report that they teach 21st century skills more than other teachers?
RQ2 What do PBL-implementing teachers add to student achievement that is above and beyond the value added by traditional and incidental instruction received during a single school year?
To investigate these research questions, we proposed two study hypotheses:
H1 Teachers who received extended professional development and are experienced PBL users will report that they teach 21st century skills more than teachers who are not known to use PBL or who have received only limited professional develop-ment.
H2 Students of teachers who are considered to be experienced implementers of the BIE model of PBL will exhibit higher average test score gains when compared to students of teachers who did not use the BIE model of PBL.
With respect to H1, we reasoned that PBL and the practices it encompasses are designed,
in part, to help students learn 21st century skills. For example, Shear, Novais, Means, Gallagher,
and Langworthy (2010, p. 3) in their discussion of deeper learning and student-centered peda-
gogies discuss PBL-related practices that support learning of 21st century skills, including
. . . models of teaching and learning that are project-based, collaborative, foster
knowledge building, require self regulation and assessment, and are both personalized
(allowing for student choice and relevance to the individual student) and individualized
(allowing students to work at their own pace and according to their particular learning
needs). Each of these elements has a strong base of prior research linking it to positive
outcomes for students in terms of development of 21st-century skills (Bransford, Brown,
& Cocking, 1999; Darling-Hammond et al., 2008).
While comparison group teachers might find ways to teach these skills using their own
practices, teachers who went through TLI had an opportunity to learn about teaching these skills
using PBL. It was hoped that this would help teachers be more effective and likely to teach and
assess 21st century skills.
With respect to H2, we reasoned that proponents of PBL espouse using projects to moti-
vate and enhance student learning and to help students to develop self-directed learning skills

Introduction
4 | Extended Professional Development in Project-Based Learning
that enable them to apply what they learn procedurally and conceptually in ways that are con-
sistent with the requirements of the West Virginia 21st Century Content Standards and Objec-
tives (WV CSOs)3. The items used on West Virginia’s state summative assessment, the West
Virginia Educational Standards Test 2 (WESTEST 2), are designed to assess standards using
problems that involve multiple steps, requiring students to think critically and use information
to solve a complex problem—which we reasoned is a set of skills similar to those students devel-
op in PBL. Therefore, if PBL were to enhance learning and help students develop these essential
21st century skills, we posited that exposure to PBL may have the potential to impact perfor-
mance on WESTEST 2; likewise, all other factors being equal, the absence of PBL may have a
detrimental effect on student achievement.
3 The WV CSOs were developed in 2006 by teams of master teachers and reviewed by internal and
external stakeholders, including members of the Partnership for 21st Century Skills.

5
Methods and Results
West Virginia Department of Education (WVDE) Office of Research (OR) and Buck In-
stitute for Education (BIE) staff completed the data collection and analysis stages in February
2012. Our methods varied by research question. Therefore, in this report we present the meth-
odology and results separately for each question.
Research Question 1 Methods
The objective of RQ1 was to determine if teachers who learn about and implement the
BIE model of project-based learning (PBL) indicate that they teach 21st century skills more than
a comparable set of teachers who use their own set of instructional practices. Specifically, we
tested the following hypothesis:
Teachers who received extended professional development and are experienced PBL users will report that they teach 21st century skills more than teachers who are not known to use PBL or who have received only limited professional devel-opment.
Participant characteristics
For this research study, the treatment population was defined as the subset of West Vir-
ginia educators who had participated in weeklong PBL professional development sessions led by
BIE and WVDE Office of Instruction (OI) staff during SY2008, SY2009, and/or SY2010 and
who appeared to be using PBL to a significant extent4.
Sampling procedures
BIE worked with the WVDE Office of Instruction (OI, the state program office that plans
and provides the Teacher Leadership Institute PBL training) to identify experienced PBL-using
teachers based on surveys conducted at the end of weeklong summer institutes during two con-
secutive summers. After considering data from more than 600 teacher attendees, 60 were iden-
tified who taught mathematics, social studies, science, or English/language arts in Grades 4-11,
who had successfully published a project in the state’s peer-reviewed project library, and whose
surveys indicated at least a year of PBL experience and an intention to continue using PBL in
their academic teaching. These teachers were identified as experienced PBL users because they
had succeeded in publishing a project that met WVDE OI criteria and because based on their
own self-identification they had used PBL for at least a year prior to the study and seemed
committed to this way of teaching.
We focused on the instructional activities and perceptions of the TLI-trained teachers
who used PBL during the spring semester of SY2011. As such, it was an important initial step of
4 Throughout this document, the abbreviation “SY(20xx)” is used to denote the academic year un-
der examination. In all cases, the year provided in text is the ending year for the academic year (e.g.,
SY2008 refers to the 2007–2008 academic year).

Methods and Results
6 | Extended Professional Development in Project-Based Learning
data cleaning for us to locate the identified PBL-using teachers in the SY2011 active list of teach-
ers listed in the West Virginia Education Information System (WVEIS)5. In the process of locat-
ing these teachers in WVEIS, we encountered considerable attrition that had occurred between
the TLI sessions from SY2008 to SY2010 and the beginning of the research project. This attri-
tion may have resulted from a few teachers transitioning to nonteaching positions at the district
or state level, transferring to other districts or schools, or otherwise dropping off the active
teacher list or course schedule. An additional source of attrition resulted from a mismatch of
participant names on our list of PBL-using teachers with the official WVEIS list of teachers—that
is, our list included some nicknames that did not match full names (e.g., Pat vs. Patricia). As a
result of these issues, several iterations were required for us to validate an accurate linkage be-
tween the list of PBL-using teachers and the official WVEIS roster. Fifty-seven teachers were
validated to move forward in the study.
Once this subset of PBL-using teachers had been validated, a second step was to locate
their course offerings in the SY2011 master course schedule. This step resulted in the elimina-
tion of several more teachers who (a) were absent from the course schedule, (b) were listed as
being responsible for noninstructional or administrative course codes in the target semester, or
(c) were listed with non-primary content area course titles (e.g., early childhood/elementary ed-
ucation). As a result of this step, we were left with a final list of 42 treatment group teachers who
had been identified from the original list of PBL-using teachers.
Once we had identified our 42 treatment group teachers, we selected a comparison group
by extracting from the SY2011 master course schedule all courses within the primary content
areas and course codes matching those taught by treatment group teachers. From that list, we
identified comparison group candidates using three additional criteria relative to the treatment
group:
1. They taught in the same school districts as PBL-using teachers. This criterion was based on an assumption that students within the same districts would, to some extent, have similar school experiences based on local conditions, and that teachers within the same districts served under the same district-level priorities and policies.
2. They taught at the same programmatic levels as PBL-using teachers. Fourteen (33%) of the treatment group teachers taught at the elementary or middle school programmatic level and it was deemed important to match them with teachers at those levels. Note that since there were so few of these teachers, the elementary and middle school teachers were grouped together for purposes of this study.
3. They had position codes in the teacher roster indicating they were a classroom teacher. This criterion is somewhat self-explanatory as RQ1 was focused on classroom instruc-tional practices.
This comparison yielded a shortlist of 187 potential matching candidates, of whom 42 were se-
lected based on the nearest match relative to the PBL-using teachers’ level of education and
years of service.
5 The WVEIS is the transactional data system used by West Virginia’s county school systems for
daily school information maintenance and warehousing of student data.

Methods and Results
Extended Professional Development in Project-Based Learning | 7
As a final step in the matching process, we cross checked the 42 comparison group
teachers against another list provided by BIE of more than 200 individuals known to have par-
ticipated in some degree of professional development related to PBL. We verified that none of
the 42 comparison group teachers appeared on the list. This process resulted in a final sample of
84 teachers to complete surveys regarding their teaching of 21st century skills.
Sample power and precision
To enable us to show statistically significant differences between our treatment and
comparison group teachers at the 95% confidence level, we calculated that we needed to obtain
responses from 38 of the 42 teachers in each group.6
Measures and covariates
To measure and compare teacher practices and perceptions for RQ1, we developed the
21st Century Teaching and Learning Survey (see Appendix A, p. 41). This survey asked for
teacher perceptions about their PBL use and teaching practices related to 21st century skills. It
also asked for background information to help validate the list of PBL users and to identify their
teaching responsibilities for RQ2.
We chose to conduct a survey study because we believed this to be the least intrusive
method for collecting the needed data from a large group of geographically dispersed teachers.
Use of an electronic survey system (SurveyMonkey) allowed us to distribute the surveys, follow
up with nonrespondents, and collect data most efficiently.
Background variables
On the survey questionnaire, before they answered questions about their teaching prac-
tices, respondents were instructed to select a target course, and a target class in which they felt
their practices—including PBL use if applicable—were most effective, and to answer the survey
with this target class in mind. To address the question of differences in subject and grade taught,
we used the target class information based on a roster of classes from WVEIS that were included
with the survey instrument. We also asked background questions about teachers and their target
class to verify how teachers were coded for the study and to allow us to more closely examine the
findings.
As an indicator of teacher leadership and professional development involvement we
asked teachers whether their work had included a significant focus on technology integration,
formative and benchmark assessments, or project-based learning, the extent of their profession-
al development overall (in hours), and whether they had helped lead professional development
sessions in the past year. As an indicator of the overall level of academic performance in the
target class, we asked teachers whether most of the students in this class were behind, at, or
ahead of the expected achievement level for their grade. We also asked about teachers’ assess-
ment of student learning of academic content, the hours per week an average student might be
expected to continue working on their assignments outside of class, and how much time stu-
6 We used the MacCorr Research Solutions Online Sample Size Calculator to determine these
numbers, available at http://www.macorr.com/sample-size-calculator.htm.

Methods and Results
8 | Extended Professional Development in Project-Based Learning
dents spent preparing for standardized tests. Finally, we asked about block scheduling, because
this school structure variable is often considered favorable for PBL use.
Measuring 21st century skills
Our conceptualization of the skills came from the international Innovative Teaching and
Learning study (Shear, Novais, Means, Gallagher, & Langworthy, 2010). We also considered the
conceptualization of 21st century skills from The William and Flora Hewlett Foundation (2010).
Appendix B, p. 59 shows the frameworks for these two respective organizations.
We selected or modified many survey items used to indicate that the skills were taught
based on reliability data reported by Novais & Gallagher (2010) and personal communications
with Gabriel Novais (April 27, 2011). We also reviewed items used in surveys in Chicago Public
Schools (Consortium on Chicago School Research, 2005) and the draft documents from the The
William and Flora Hewlett Foundation (2010). The WVDE OI reviewed the resulting framework
(Figure 1) and instrument (Appendix A, p. 41) to make sure that items were compatible with the
ideas put forth in West Virginia 21st Century Content Standards 1–3, described earlier (p. 1).
For an indication of rigorous content learning—which is an important component in all
21st century teaching and learning frameworks—we used questions that were independent from
questions about the skills themselves. For our purposes content learning in the target class was
indicated by test scores (RQ2) and by teacher perceptions of various student outcomes.
Figure 1. Definitions of 21st Century Skills
Code Skill name and definition
CT CRITICAL THINKING SKILLS refers to students being able to analyze complex problems, investigate questions for which there are no clear-cut answers, evaluate different points of view or sources of information, and draw appropriate conclusions based on evidence and reasoning.
CO COLLABORATION SKILLS refers to students being able to work together to solve problems or answer questions, to work effectively and respectfully in teams to accomplish a common goal and to assume shared responsibility for completing a task.
CM COMMUNICATION SKILLS refers to students being able to organize their thoughts, data, and findings; and share these effectively through a variety of media, as well as orally and in writing.
CR CREATIVITY AND INNOVATION SKILLS refers to students being able to generate and refine solutions to complex problems or tasks based on synthesis, analysis, and then combining or presenting what they have learned in new and original ways.
S SELF-DIRECTION SKILLS refers to students being able to take responsibility for their learning by identifying topics to pursue and processes for their own learning, and being able to review their own work and respond to feedback.
G GLOBAL CONNECTIONS refers to students being able to understand global, geopolitical issues including awareness of geography, culture, language, history, and literature from other countries.
L LOCAL CONNECTIONS refers to students being able to apply what they have learned to local contexts and community issues.
U USING TECHNOLOGY AS A TOOL FOR LEARNING refers to students being able to manage their learning and produce products using appropriate information and communication technologies.
For each 21st century skill, the survey started by providing the definition (Figure 1), fol-
lowed by a list of related practices—that is, student tasks teachers may have assigned as part of
their repertoire for teaching each skill. The survey asked about the frequency of five to eight

Methods and Results
Extended Professional Development in Project-Based Learning | 9
such practices for each skill. For example, one of the practice items related to collaboration skills
included, “In your teaching of your TARGET CLASS, how often have you asked students to work
in pairs or small groups to complete a task together?” Response choices included 1, Almost nev-
er; 2, A few times a semester; 3, 1-3 times per month; 4, 1-3 times per week; 5, Almost daily.
After reading the definition of the skill and indicating the frequency of their practices,
teachers indicated whether they had tried to teach these skills, whether students had learned,
and if they had been able to assess these skills. Teachers responded to the following prompts
substituting the name of the skill (e.g., critical thinking):
a. I have tried to develop students' _______ skills.
b. Most students have learned _______ skills while in my class.
c. I have been able to effectively assess students' _______ skills.
Response choices included 1, Not really; 2, To a minor extent; 3, To a moderate extent;
4, To a great extent, or 5, To a very great extent.
To summarize, we used a combination of teachers’ practices in assigning different kinds
of PBL tasks to students, and more general perceptions about how extensively they taught and
assessed each of the 21st century skills. The resulting measures were used to construct indices,
which allowed us to test the hypothesis (H1) that teachers who received professional develop-
ment and are using PBL teach 21st century skills more than others.
Research design
Communications with study participants followed a process recommended by Dillman
(2000), including multiple contacts and a social incentive of a $15 gift certificate to be awarded
randomly to one out of every three respondents. We sent personal e-mail messages to teachers
in the sample, requesting their participation and directing them to the online survey question-
naire via a hyperlink in the messages. We followed up with personal e-mails and faxes to
schools.
Recoding participants
To validate that study participants had the expected participant characteristics the sur-
vey asked teachers whether PBL had been an emphasis for their teaching or professional devel-
opment, the amount of professional development they had received, and the extent of their use
of PBL during the prior year. We recoded PBL teachers who said they did not consider PBL to
have been an emphasis, who had not used PBL for at least a year, or who had not received ex-
tended professional development in PBL. Out of the original 42 PBL teachers, we were only able
to verify that 24 met our criteria during the study period (see Appendix C, p. 61 for recoding de-
tails).
Index construction
Prior to constructing our indices we analyzed both the reliability and factor structure for
each of the measures. Both practice and perception measures were highly correlated within each
skill, allowing them to be combined into an overall index for each skill with strong reliability
(standardized alpha = .90 or greater, with inter-item correlations all above .58). The overall in-

Methods and Results
10 | Extended Professional Development in Project-Based Learning
dex for all items combined had alpha = .986. The items with the lowest communalities (correct-
ed item total correlations) were items connected to global connections, collaboration skill, and
using technology as a tool for learning.
Factor analyses helped verify that the instrument seemed to be measuring different con-
structs. All factor analyses used principal axis factoring extraction, with Varimax rotation and
Kaiser normalization. In many cases, factor analysis seemed to confirm that separate constructs
were being measured. For example, the last four skills— self-direction, global connections, local
connections, and using technology as a tool for learning—emerged cleanly as four different fac-
tors (see Table A 2 in Appendix D, p. 63). However, critical thinking, creativity and innovation,
collaboration, and communication items were less empirically distinct, often loading on their
preconceived factors, but not always. For example, many of the items intended to measure crea-
tivity and innovation-related practices loaded with critical thinking items (see Table A 3, p. 65).
The perception items for the first four measures, however, revealed a clean clustering of items
(see Table A 4, p. 67). These factor analyses overall lend support to the presence of different
constructs. Combined with the reliability runs these analyses suggest ways to reduce the number
of measures and items needed in future studies.
Statistical tests and analyses
For each measure of 21st century skills we focused on the difference between teachers
who used PBL with extended professional development (n = 24) and others who did not use PBL
or had limited professional development (n = 38). We compared the mean scores and computed
effect sizes based on the overall standard deviation. The comparison group included teachers
from the original PBL and matching samples, who said they used PBL but did not have extended
professional development. In one of our analyses we used this group as a third category (n = 17),
with effect sizes based on a comparison to the remaining group who did not use PBL at all (n =
21). This was useful in illustrating that PBL-using teachers with limited professional develop-
ment on average fell between those who did not use PBL at all and those who used PBL with ex-
tended professional development.
Statistical significance was calculated using independent samples t tests for comparisons
of means between two different sets of teachers, and ANOVA tests for comparison of means
across three or more groups. Chi-square tests were used to analyze the distribution of back-
ground variables (e.g., block scheduling) across PBL and non-PBL teachers. For continuous
measures, with at least five or more clearly ordered choices, we used correlations to indicate
whether these measures (e.g., the number of projects used) are related to the teaching of 21st
century skills.
Research Question 1 Results
The survey opened on May 23, 2011 and closed on June 20, 2011. We received completed
responses from 62 of 84 teachers for an overall response rate of 74%. We received surveys from
38 of 42 PBL-using teachers (90%) and 24 of 42 matched teachers (57%). These response rates
were considered adequate for our purposes and we did not attempt to analyze nonrespondents.
We started by confirming that teachers in the PBL-using category more frequently re-
ported extended professional development and class time devoted to extended assignments or

Methods and Results
Extended Professional Development in Project-Based Learning | 11
projects (Table A 5, p. 69 in Appendix E). We also checked to see if our measures of 21st century
skills teaching were correlated to these indicators of PBL use (Table A 6, p. 70). The overall
measure of 21st century skills teaching was positively correlated with time spent in professional
development (r = .34, p < .01), the number of extended assignments (r = .47, p < .001), weeks
conducting extended projects (r = .29, p < .05) , and overall class time devoted to extended pro-
jects (r = .35, p < .01).
Overall results
Table 1 addresses the hypothesis (H1) that teachers who used PBL and received extended
professional development report significantly more teaching of 21st century skills. There were
substantial and statistically significant effect size differences between teachers who used PBL
with extended professional development and other teachers in the sample, whether we used a
two-category comparison (i.e., comparing to all other teachers in the sample), or a three-
category comparison (i.e., dividing the comparison groups into teachers who did not use PBL at
all and those who indicated limited PBL use with limited professional development).
Table 1. Mean 21st Century Skills Index by PBL Use (Two and Three Categories)
PBL-use category n Mean 21st Century
Skills Index (Z score) SD Effect size p <
Total 62 .00 1.00 Two categories
No PBL or limited PD 38 -.35 .93 .91 t test .001 PBL use with extended PD 24 .56 .86
Three categories No PBL emphasis or use 21 -.59 1.02 1.15
ANOVA .001
Used PBL with limited PD 17 -.05 .72
PBL use with extended PD 24 .56 .86
Statistical test data are available in Table A 7 (p. 71) for t tests and Table A 8 (p. 72) for
ANOVA tests. Effect sizes for the three categories are based on means for the first and third cat-
egories only (i.e., no PBL emphasis or use, versus PBL use with extended professional develop-
ment). Tukey post-hoc analyses (available from the author) suggested that this comparison was
statistically significant (p < .001), while the other comparisons did not reach statistical signifi-
cance.
These findings confirm H1 for the first research question by indicating that PBL use and
extended professional development were clearly associated with more teaching of 21st century
skills. In the following analyses we attempt to tease this relationship apart for the purpose of
improving our understanding and clarifying how robust this relationship is across different
skills, subjects taught, and teacher and classroom characteristics.
Results for 21st century skills: Frequency of PBL use
The results were remarkably consistent across the different 21st century skills (Table 2).
The only major exception to the overall pattern was teaching of global connection skills. Subse-
quent analysis suggested this skill seemed to be more a function of whether a teacher taught so-
cial studies than whether they used PBL.

Methods and Results
12 | Extended Professional Development in Project-Based Learning
Table A 9 (p. 73) provides independent samples t-tests of statistical significance for the
mean scores on the practice measures in Table 2. Table A 10 (p. 74) shows how teachers re-
sponded to the individual practice items by PBL group. Statistical significance tests for individu-
al items are available from the author.
Table 2. Mean 21st Century Skills Practices for Each Skill by PBL Use
Practice Index Measures (N) Total
(N = 62)
No PBL or extended
PD (n = 38)
PBL with extended
PD (n = 24)
SD. Effect size p <
Overall .00 -.35 .36 1.00 .71 .001
Critical thinking skills .00 -.22 .35 .76 .76 .005
Collaboration skills .00 -.32 .52 .84 1.00 .001
Communication skills .00 -.33 .53 .81 1.06 .001
Creativity & innovation skills .00 -.30 .48 .85 .93 .001
Self-direction skills .00 -.21 .34 .81 .68 .01
Global connections skills -.01 -.02 .01 .87 .03 .90 (ns)
Local connections skills .00 -.25 .40 .87 .75 .005
Technology as a tool for learning skills .00 -.27 .43 .81 .86 .001
Results for 21st century skills: Extensiveness of PBL use
In addition to reporting practices related to 21st century skills more frequently (Table 2),
teachers in the PBL group also perceived themselves as having taught the skills to a greater ex-
tent than the comparison group. According to these teacher perceptions (Table 3) the 21st cen-
tury skills that received the greatest amount of instruction were collaboration and critical
thinking, while global connections and local connections received the least amount of instruc-
tion. Across the eight 21st century skills, teachers were most likely to report they had tried to
develop the skill. They were second most likely to report that most students had learned the
skills and least likely to report that they had been able to effectively assess the skills.
The remaining survey response analyses explore whether the relationships between PBL
use and 21st century skills teaching varied according to the characteristics of the target class and
the teachers. Target class characteristics include subject taught, teacher-reported learning out-
comes, and achievement levels.

Methods and Results
Extended Professional Development in Project-Based Learning | 13
Table 3. Mean Perceptions of 21st Century Skills Taught by PBL Use
Perception Item Responses (Low N) Total mean
(n = 60) Total SD
No PBL or limited PD
(n = 37)
PBL with extended
PD (n = 23) Effect size
Independent samples
t test, p <
Critical thinking skills
I have tried to develop 4.19 .87 3.95 4.58 .73 .01
Most students have learned 3.58 .93 3.29 4.04 .81 .001
I have been able to effectively assess 3.35 .83 3.16 3.67 .61 .02
Collaboration skills
I have tried to develop 4.03 .97 3.68 4.58 .92 .001
Most students have learned 3.77 1.06 3.37 4.42 .99 .001
I have been able to effectively assess 3.57 1.12 3.13 4.30 1.05 .001
Communication skills
I have tried to develop 3.65 1.10 3.26 4.25 .89 .001
Most students have learned 3.29 1.11 2.89 3.92 .92 .001
I have been able to effectively assess 3.19 1.17 2.74 3.92 1.01 .001
Creativity and innovation skills
I have tried to develop 3.48 1.10 3.13 4.04 .83 .001
Most students have learned 3.05 1.29 2.55 3.83 1.00 .001
I have been able to effectively assess 3.00 1.18 2.62 3.61 .84 .001
Self direction skills
I have tried to develop 3.44 1.07 3.16 3.88 .67 .01
Most students have learned 2.89 1.04 2.55 3.42 .83 .001
I have been able to effectively assess 2.95 1.09 2.61 3.50 .82 .001
Making global connections skills
I have tried to develop 2.74 1.20 2.81 2.63 -.16 ns
Most students have learned 2.52 1.24 2.55 2.46 -.08 ns
I have been able to effectively assess 2.31 1.14 2.37 2.21 -.14 ns
Making local connections skills
I have tried to develop 2.65 1.13 2.32 3.17 .75 .01
Most students have learned 2.34 1.07 2.13 2.67 .50 .05
I have been able to effectively assess 2.26 1.03 2.08 2.57 .47 ns (.08)
Using technology as a tool
I have tried to develop 3.42 1.15 3.08 3.96 .76 .01
Most students have learned 3.15 1.27 2.84 3.63 .62 .02
I have been able to effectively assess 3.03 1.23 2.79 3.42 .51 .05
Results within and across content areas
Starting with content area taught in the target class, findings suggest large effects for
three of the four major content areas, and a moderate effect for social studies (Table 4). Because
of the relatively small number of cases in each content area, however, the differences between
PBL and other teachers was only statistically significant for mathematics teachers (ES = 1.21, p <

Methods and Results
14 | Extended Professional Development in Project-Based Learning
.002). Yet, the mean difference was substantial and approached statistical significance for sci-
ence teachers (ES = .95, p < .09) and English teachers (ES = 1.06, p < .06). This finding did not
hold for social studies teachers (ES = .47, ns).
Table 4. Mean 21st Century Skills Index by Subject and PBL Use
Subject of target class Total
No PBL or extended PD
PBL with extended PD Effect size p <
Mean
Overall 0.00 -.35 .56 0.91 .001
Mathematics -.32 -.86 .52 1.21 .002
Science -.06 -.34 .26 0.95 .09 (ns)
Social Studies .36 .21 .69 0.47 .45 (ns)
English .26 -.12 .87 1.06 .06 (ns)
N
Overall 62 38 24
Mathematics 23 14 9
Science 13 7 6
Social Studies 13 9 4
English 13 8 5
SD
Overall 1.00 .93 .86
Mathematics 1.14 .81 1.10
Science .64 .62 .54
Social Studies 1.00 1.13 .65
English .94 .74 .95
*** p < .001 , ** p < .01, * p < .05 See Table A 11 in Appendix E (p. 77) for statistical significance analyses.
There were variations across content areas in how much the different skills were taught.
Table A 12 (p. 77) shows the overall index score (for frequency and extensiveness combined) of
each skill by subject area. Mathematics teachers on average reported teaching the 21st century
skill practices least frequently, while science teachers reported above average use of practices
specifically related to collaboration and communication skills. English and social studies teach-
ers reported the most frequent use of the practices overall, with a large portion of the social
studies effect coming from global connections, the only skill for which there was a statistically
significant difference across the four content areas (Table A 13, p. 77).
Results by perceived student workload, outcomes, and achievement levels
Other characteristics of the target class we examined included teacher perceptions about
how much students learned or were motivated by the class, how much time they spent on class
work outside of class, and how much time they spent preparing for standardized tests.
Compared to other teachers, PBL-using teachers with extensive professional develop-
ment (hereafter, PBL-using teachers) more frequently indicated that students learned what they
needed to do well on standardized tests (ES = .55, p < .05), could apply or transfer what they
learned to new tasks and situations (ES = .66, p < .01), and were motivated to learn more about
the subjects they studied (ES = .55, p < .05). There were no statistically significant differences
in whether what students learned was personally relevant (ES = .28, p < .28, ns), the amount of
time teachers estimated students spent working on class work outside of class (ES = -.27, p <
.31, ns), or preparing to take standardized tests (ES = -.16, p < .55, ns). See Table A 5 (p. 69) for
means comparisons and Table A 7 (p. 71) for statistical tests. Taken together, these results sug-

Methods and Results
Extended Professional Development in Project-Based Learning | 15
gest PBL-using teachers believe as much if not more than comparison teachers that their stu-
dents were working just as hard, were prepared just as well, and learned as much as students of
other teachers in the sample.
Regarding the class academic performance level as a whole, it appears that teaching of
21st century skills was fairly evenly distributed regardless of teachers’ ratings of the overall stu-
dent academic performance level. If anything, responses suggest that classes with students at
the expected level had the least opportunity to learn these skills (Table 5).
Table 5. Mean 21st Century Skills Index by Class Academic Performance and PBL Use
Total
No PBL or extended
PD
PBL with extended
PD Effect size p <
Mean
Total 0.00 -.38 .56
Behind most students .23 -.38 .95 1.30 .01
At the expected level -.30 -.72 .43 1.10 .006
Ahead of most students .20 .04 .43 .42 .34 (ns)
N
Total 60 36 24
Behind most students 13 7 6
At the expected level 25 16 9
Ahead of most students 22 13 9
SD
Total 1.02 .95 .86
Behind most students 1.02 .71 .87
At the expected level 1.05 .96 .80
Ahead of most students .93 .93 .93
There was no statistically significant difference in distribution of perceived student
achievement levels between PBL groups, as indicated by the chi-square tests shown in Table A
14(p. 78; N = 60, Χ2 = 2.451, df = 4, p < .65) and teacher ratings of the class performance level
was not by itself a significant predictor of having taught 21st century skills (ANOVA p < .15, ns).
However, after splitting the file by teacher-reported achievement levels, PBL-using teachers re-
ported more teaching of 21st century skills overall, with statistically significant differences for
classes identified as being behind most students (ES = 1.30, p < .01) and at the expected
achievement level (ES = 1.10, p < .005). These results are shown in Table 5 (above) with a
graphic representation in Figure 2 (p. 17) and details of the statistical significance tests in Table
A 8 (p. 72).
In summary, the distribution of achievement levels reported by teachers in the PBL-
using and comparison groups were not significantly different. While the PBL-using and non-
PBL teachers did not report significantly different student populations, they did report signifi-
cantly different teaching practices and perceptions for classes that were behind and at the ex-
pected level of academic performance.
Results by block scheduling
We asked about whether the target class used a block schedule, which may make it easier
to carry out projects. Table 6 and chi-square tests (Table A 14, p. 78) show no significant differ-

Methods and Results
16 | Extended Professional Development in Project-Based Learning
ence in presence of block scheduling across PBL users and nonusers (N = 62, Χ2 = 3.352, df = 4,
p < .50). By itself, block scheduling was related to 21st century skills measures to an extent that
approached statistical significance (ANOVA p < .10).
Table 6. Mean 21st Century Skills Index by Block Schedule and PBL Use
Subject of target class Total Mean
No PBL or extended PD
PBL with extended PD Effect Size p <
Mean
Total .00 -.35 .56
Always block .27 -.04 .73 .69 .13 (ns)
Sometimes block .47 -.15 .78 1.58 .05
No block --.23 -.53 .37 .96 .005
N
Total 62 38 24
Always block 20 12 8
Sometimes block 6 2 4
No block 36 24 12
SD
Total 1.00 .93 .86
Always block 1.12 1.19 .87
Sometimes block .59 .24 .43
No block .94 .78 .97
After splitting the file by block schedule categories, PBL-using teachers reported more
teaching of 21st century skills, with statistically significant differences for teachers who reported
no block schedule (ES = .96, p < .005) and sometimes having a block schedule (ES = 1.58, p <
.05). For teachers reporting they always had a block schedule, there was not a statistically signif-
icant difference between PBL-using and non-PBL teachers (ES = .69, p < .13, ns), but there was
a modest difference. These results are shown in Table 6 with a graphic representation in Figure
2 and details of the statistical significance tests in Table A 8 (p. 72).
In Figure 2, the top line represents PBL-using teachers, while the bottom line represents
mean scores for non-PBL teachers. The horizontal axis shows the categories for class achieve-
ment and block scheduling, respectively. Taken together these findings suggest that the relation-
ship between 21st century skills teaching and PBL use is largely independent of class
achievement reported by the teacher, and block scheduling.

Methods and Results
Extended Professional Development in Project-Based Learning | 17
Results by teacher background
Finally, we examined differences in the proportion of teachers who indicated that they
had helped lead a professional development session for others since 2008. Our analysis indi-
cates that 100% of the PBL-using teachers in our study had helped provide professional devel-
opment to others, compared to 37% (14 out of 38) of the comparison group (Table 7). Unlike the
other background variables this difference in distribution was statistically significant (chi-
square p < .001, Table A 14, p. 78). Moreover, based on independent samples t tests (Table A 7,
p. 71) having led professional development by itself was a significant predictor of 21st century
skills teaching (ES = .77, p < .01).
Table 7. Mean 21st Century Skills Index by Teacher as PD Leader and PBL Use
Helped lead any PD sessions? Total
No PBL or limited PD
PBL with extended PD Effect Size p <
Mean Total .00 -.35 .56 No -.47 -.47 -- -- -- Yes .30 -.15 .56 .83 .01
N Total 62 38 24 No 24 24 0 Yes 38 14 24
SD Total 1.00 .93 .86 No 1.06 1.06 -- Yes .85 .63 .86
Of the various background and contextual measures, this indicator of teacher back-
ground is the most noteworthy because there were not only significant differences in mean re-
sponses, but there were significant differences in population distribution. This suggests that
professional development could have a significant impact on the overall results. However, when
we control for this teacher background variable—focusing only on the group that had led profes-
sional development by using split-file analyses (Table 7 above and Table A 7, p. 71)—we still see
Figure 2. Mean 21st Century Skills Index by PBL Use, Within Class Achievement and Block Schedule

Methods and Results
18 | Extended Professional Development in Project-Based Learning
evidence that PBL use was related to significantly higher mean 21st century skill scores (ES =
.83, p < .01).
Research Question 2 Methods
To address RQ2, we devised methods for investigating the following hypothesis:
Students of teachers who are considered to be strong implementers of the BIE model of PBL will exhibit higher average test score gains when compared to stu-dents of teachers who are not known to use BIE’s model for PBL.
The null hypothesis postulates that there will be no difference between these two groups of stu-
dents.
Participant characteristics
The treatment population for RQ2 consisted of all students who participated in courses
offered by a subset of WV public school teachers, all of whom indicated via a survey adminis-
tered in the spring of the 2010–2011 school year that their level of PBL use was extensive in core
content areas (SY2011; see RQ1). As described earlier, the survey asked all responding teachers
to select a target course in which they had implemented at least some components of PBL during
SY2011. Then they were asked to indicate their level of PBL use in that target course. We ulti-
mately coded teachers into one of three levels of PBL use based upon their survey responses (1 =
no PBL use, 2 = limited PBL use, and 3 = extensive PBL use). Respondents who indicated a valid
target course in one of four core content areas (i.e., mathematics, English/language arts, science,
or social studies) and who also reported extensive PBL use in this course were subsequently
identified as the teachers of treatment group students. Student-level data were collected for
these target courses and a comparison group was selected using propensity score matching
models (PSM) for subsequent analyses. Details of how these students were identified follow.
A total of 38 of the 42 PBL teachers identified as part of RQ1 responded to the spring
SY2011 survey (90%). Almost all (97%) indicated a valid core content area target course. The
breakdown of PBL implementation in those target courses is shown in Table 8.
Table 8. Number of Survey Respondents by PBL Implementation Status
Self-reported level of PBL use Number of respondents Percentage of sample
TOTAL 38 100 1 (no PBL use) 9 24 2 (limited PBL use) 5 13 3 (extensive PBL use) 24 63
Of the 24 teachers who reported extensive PBL use, we were able to verify via course
scheduling rosters retained by the WVDE that 17 survey respondents self-reported implement-
ing PBL in a target course that was offered during SY2011 (71%). These teachers are hereafter
referred to as PBL teachers and were identified as those teachers from whose courses students
were selected. The breakdown of PBL teachers by content area is shown in Table 9.

Methods and Results
Extended Professional Development in Project-Based Learning | 19
Table 9. Number of WVEIS Validated PBL Teachers by Content Area
Content area Number of teachers Percent of sample*
Total 17 100 Mathematics 5 29 English/language arts 5 29 Science 4 23 Social studies 3 18
*Percentages do not add up to 100 due to rounding.
We next collected unique student identifiers for all those students who were actively en-
rolled in the target courses offered by PBL teachers (hereafter referred to as the PBL group). We
excluded students in Grades 3 and 12 because we required two points of assessment data to an-
swer RQ2.7 A total of 821 unduplicated students were identified within all offered sections of the
target courses reported by PBL teachers. The breakdown of students by content area is shown in
Table 10.
Table 10. Number of Students in PBL Courses by Content Area
Content area Number of students Percentage of sample
Total 821 100 Mathematics 112 14 English/language arts 222 27 Science 298 36 Social studies 189 23
Sampling procedures
Having identified the 821 students in the PBL group, we next sought to identify a suita-
ble comparison group (hereafter referred to as the non-PBL group). We used propensity score
matching (PSM) to derive four samples of students (i.e., one per content area) that were inclu-
sive of PBL group students and an equal number of matched non-PBL group students.
For the PSM analyses, we first created a binary indicator for each student that indicated
whether or not the student was a member of the PBL group. We then operationalized our pro-
pensity score as the conditional probability of being assigned to the PBL group given a vector of
observed covariates upon which we sought to exercise control because of their possible influence
on student achievement. In this study, the covariates we used were (a) school district, (b) grade,
(c) race, (d) sex, (e) free and reduced-price lunch eligibility, (f) special education eligibility, and
(g) prior academic achievement (i.e., z score for SY2010 in the relevant content area). Thus, the
propensity score was the predicted probability of being assigned to the PBL group, obtained
from a binary logistic regression of an indicator of being enrolled in a course where PBL was im-
plemented on the listed covariates (Rosenbaum & Rubin, 1983). We used the nearest neighbor
method in SPSS and specified a delta or difference ranging from .02 to .04 in our models, based
on the standard error of each model, meaning the predicted probability of a non-PBL student
7 Grade 3 is the first year of state summative testing and grade 12 students are not currently tested
in West Virginia.

Methods and Results
20 | Extended Professional Development in Project-Based Learning
could only vary from .02 to .04 compared to that of the PBL student to whom they are matched.
We ran the procedure separately for each observed course code to ensure all potential matches
took the same course as their PBL counterparts during SY2011.
Notably, the PSM analyses did not function properly for Course Code 3044 (conceptual
mathematics). We excluded students in course 3044 because two variables (grade and special
education eligibility) in the logistic regression model had very large coefficients and resulted in
nonoverlapping propensity scores between the PBL and non-PBL groups. In general, variables
with large coefficient values in a logistic regression model indicate either that the variable is ex-
tremely effective (should probably be removed from the model and used as an external rule or
filter) or that the variable contains biased data and is highly correlated to the explained variable.
The latter (bias) was probably the case in our model; therefore, we removed these students.
Finally, we also conducted a series of analyses to verify the PSM process was successful.
First, we conducted a series of chi-square tests to determine if the PBL group and the matched
non-PBL group differed on the categorical covariates entered into the logistic regression (school
district, grade, race, sex, free and reduced-price lunch eligibility, and special education eligibil-
ity). We conducted these analyses by content area. We then utilized independent samples t tests
to determine if the two groups differed on the interval level covariate entered into the logistic
regression (i.e., SY2010 achievement). In both sets of analyses, we presumed that violation of
the null hypothesis would provide evidence that our groups may not be adequately matched.
These tests were conducted prior to the final analyses.
Sample size, power, and precision
Our intent for all analyses was to have sufficient statistical power to examine differences
in achievement between the two groups for each content area under examination (i.e., mathe-
matics, English/language arts, science, and social studies). Ultimately, the power for our anal-
yses, which is based on the observed effect size for the differences, ranged from very low in
social studies where we observed a very small effect size (.12 or 12%) to moderate in science (.77
or 77%). The power for our aggregated analyses was much higher (i.e., .90 or 90%), but did not
approach the criterion of 95% confidence. More details about sample size and power for these
analyses are in the results section.
Measures and covariates
The main outcome measure for RQ2 was the gain in standard deviation units between
students’ standardized WESTEST 2 scores as measured at the conclusion of SY2010 and SY2011.
We created the gain score variable via a multistep process. First, we computed z scores for each
student using the population of all students in the state as the referent group. We standardized
each student’s WESTEST 2 scale scores within each grade level band (i.e., Grades 3, 4, 5, etc.).
This was done to ensure that each z score accurately represented the student’s relative position
within the distribution of performance for her/his grade-level peers. We completed the process
using the SY2010 and SY2011 datasets independently. We then computed an SY2010 to SY2011
gain score for each student by subtracting the student’s SY2010 z score from her/his SY2011 z
score. The resulting gain scores represent the magnitude and direction of each student’s change
in position with her/his grade level peers, as measured in standard deviation units. Gain scores
were computed for each of the four core content areas assessed by WESTEST 2. We then exam-

Methods and Results
Extended Professional Development in Project-Based Learning | 21
ined the differences in the average gain scores for PBL and non-PBL groups in our main analy-
sis.
As indicated above, we used a variety of covariates in our main analysis to control for
their potential impact on the outcome measure. The covariates included in each PSM model
were (a) school district, (b) grade, (c) race, (d) sex, (e) free and reduced-price lunch eligibility,
(f) special education eligibility, and (g) prior academic achievement (i.e., z score for SY2010 in
the relevant content area). In addition, we held constant the variability in each student’s core
content area course enrollment by conducting each PSM model within a single course code. For
example, if a student in the PBL group experienced PBL in an Algebra 1 course, we ran the PSM
algorithm within the pool of all other non-PBL Algebra 1 students, and selected the nearest
neighbor based upon the vector of covariates noted above.
Research design
Following the PSM analysis, we conducted a set of independent samples t tests to deter-
mine if the PBL and non-PBL groups of students differed significantly in terms of the average
achievement gains experienced during SY2011. Each analysis used group membership (PBL or
non-PBL) as the independent variable and gain score in terms of standard deviation units be-
tween SY2010 and SY2011 as the dependent variable. These analyses were initially conducted
independently within each content area (i.e., mathematics, English/language arts, science, and
social studies), and then, to increase statistical power, conducted in aggregate (i.e., with the four
content areas treated as one).
Research Question 2 Results
As noted previously, we began our investigation of RQ2 by confirming that the PSM
model had resulted in adequately matched groups. We believed this was essential prior to con-
ducting the main analysis. We initially used chi-square test statistics to examine this assumption
for all six of the categorical covariates. We found that the chi-square values were not significant
for any covariate or content area except in the case of race for English/language arts and school
district, which differed significantly for all four content areas.
In the cases where our assumptions were violated, we conducted follow-up analyses in
the form of factorial analysis of variance (ANOVA). Each analysis used group membership and
the categorical covariate in question as predictors of the relevant gain score, which would serve
as the dependent variable in our main analyses. We presumed that the presence of an interac-
tion effect between group and the covariate of interest would represent a potential bias. If no
interaction effects were present, we accepted the matching as successful and proceeded to main
analyses.
Table 11 illustrates the chi-square statistics and associated p values for each covariate.
For those covariate*group combinations where the chi-square statistic was significant, we also
present the significance value (p) for the interaction effect between group and the covariate of
interest upon the relevant gain score8. Notably, none of the p values for such interaction effects
8 Complete statistics for the factorial ANOVAs can be found in Appendix F, p. 77.

Methods and Results
22 | Extended Professional Development in Project-Based Learning
were statistically significant, leading us to conclude that matching was successful on all covari-
ates.
Table 11. Verification of Matching for Categorical Covariates
Covariate X₂ df p Assumption
p (interaction effect) Conclusion
Mathematics School district 52.477 14 .000 Violated .548 OK Grade 1.026 4 .906 Met N/A OK Race 1.382 3 .710 Met N/A OK Free and reduced-price lunch eligibility .288 1 .591 Met N/A OK Special education eligibility .806 1 .369 Met N/A OK Sex 1.473 1 .225 Met N/A OK
English/language arts School district 306.487 18 .000 Violated .856 OK Grade .337 3 .953 Met N/A OK Race 10.081 3 .018 Violated .765 OK Free and reduced-price lunch eligibility .009 1 .923 Met N/A OK Special education eligibility .450 1 .502 Met N/A OK Sex 1.777 1 .182 Met N/A OK
Science School district 53.145 12 .000 Violated .502 OK Grade 2.014 3 .570 Met N/A OK Race 2.068 4 .723 Met N/A OK Free and reduced-price lunch eligibility .062 1 .803 Met N/A OK Special education eligibility 1.362 1 .243 Met N/A OK Sex .242 1 .622 Met N/A OK
Social studies School district 164.565 17 .000 Violated .551 OK Grade 2.016 3 .569 Met N/A OK Race 5.122 4 .275 Met N/A OK Free and reduced-price lunch eligibility 1.524 1 .217 Met N/A OK Special education eligibility 1.965 1 .161 Met N/A OK Sex .266 1 .606 Met N/A OK
Each PSM model included one interval level covariate as well for which chi-square anal-
yses were not appropriate (prior academic achievement). Again, for this covariate we presumed
a lack of statistically significant differences among the groups to represent evidence of a success-
ful matching process. We conducted a set of four independent samples t tests to test this as-
sumption. Significance values for each t test indicated that the groups did not differ significantly
on baseline academic achievement; thus, we concluded that for no content area did one group
have a significantly different starting point. Table 12 presents a summary of the results of the t
tests and Figure 3 provides a graphical representation of the differences in baseline achievement
between the groups by content area.

Methods and Results
Extended Professional Development in Project-Based Learning | 23
In conclusion, for all covariates in all content areas we believe the groups to have been
adequately matched. In fact, the data indicated to us that the PSM analyses were remarkably
successful in providing a matched group on the covariates of interest with the exception of
school district. Our additional analyses indicated that this difference is likely of little concern to
our examination because, while district is sometimes related to students’ gain scores when ex-
amined independently, there were no statistically significant interaction effects between district
and group—indicating that the potential influence of school district upon gain score is not dif-
ferentially present among our groups. Taken together, these results allow us to be confident that
our groups are reasonably equivalent on all measured covariates. As such, we proceeded to the
main analysis within each content area.
Table 12. Verification of Matching for Interval Level Covariate
Content Area
PBL Non-PBL
t df p Mean ∆ SE ∆ Z score SD Z score SD
Mathematics .325 1.05 .166 1.03 1.14 222 .254 .160 .139 English/Language Arts .500 .760 .430 .976 .850 417.07 .396 .071 .083 Science .143 .892 .180 .910 -.494 594 .621 -.036 .074 Social Studies -.004 .932 .126 .945 -1.35 376 .178 -.130 .096
Figure 3. Differences in Baseline Achievement Between the Groups by Content Area

Methods and Results
24 | Extended Professional Development in Project-Based Learning
Mathematics main analysis
There were 112 students in the PBL group whose teachers indicated they implemented
project-based learning in their mathematics courses during SY2011. This figure excludes those
students who were enrolled in
“conceptual math.” As we note
above, the PSM model did not
function properly for this group.
We used PSM to draw a
matched sample of 112 students
who took the same courses but
whose teachers, according to
BIE’s records, had not partici-
pated in PBL professional de-
velopment. Table 13 presents a
description of the courses rep-
resented in the data and the
number of students enrolled in
those courses by group.
We conducted an inde-
pendent samples t test to de-
termine if the average gain
score for PBL group students
differed significantly from non-
PBL students. The t test indicat-
ed no significant difference in
mathematics achievement gains
for PBL and non-PBL students during SY2011 (t[222] = -1.294; p = .20). The sample means are
displayed in Figure 4, which illustrates a slightly higher average gain score for the PBL group
(.083) when compared with the non-PBL group (-.043). However, as noted previously, this dif-
ference was not statistically significant.
English/Language Arts main analysis
There were 222 students in the PBL group whose teachers indicated they implemented
project-based learning in their English/language arts courses during SY2011. We used PSM to
draw a matched sample of 222 students who took the same courses but whose teachers, accord-
ing to BIE’s records, had not
participated in PBL profession-
al development. Table 14 pre-
sents a list of the courses
represented in the data and the
number of students enrolled in
those courses by group.
Table 13. Distribution of Students by Mathematics Course Code and Group
Course code Course description n PBL group n non-PBL group
3004 Mathematics 4 23 23 3005 Mathematics 5 23 23 3006 Mathematics 6 46 46 3007 Mathematics 7 20 20
Table 14. Distribution of Students by English/Language Arts Course Code and Group
Course code Course description n PBL group n non-PBL group
4005 English/language arts 5 25 25 4006 English/language arts 6 54 54 4010 English/language arts 10 143 143
Figure 4. Mathematics Gain During SY2011 by Group

Methods and Results
Extended Professional Development in Project-Based Learning | 25
We conducted an in-
dependent samples t test to
determine if the average gain
score for PBL group students
differed significantly from
non-PBL students. The t test
indicated no significant dif-
ference in English/language
arts achievement gains for
PBL and non-PBL students
during SY2011 (t[442] =
-.866; p = .39). The sample
means are displayed in
Figure 5, which illustrates a
slightly higher average gain
score for the PBL group
(-.039) when compared with the non-PBL group (-.092). However, as noted previously, this dif-
ference was not statistically significant.
Science main analysis
There were 298 students
in the PBL group whose teachers
indicated they implemented pro-
ject-based learning in their sci-
ence courses during SY2011. We
used PSM to draw a matched
sample of 298 students who
took the same courses but
whose teachers, according to
BIE’s records, had not partici-
pated in PBL professional de-
velopment. Table 15 presents a
description of the courses rep-
resented in the data and the
number of students enrolled in
those courses by group.
We conducted an inde-
pendent samples t test to de-
termine if the average gain
score for PBL group students
differed significantly from non-
PBL students. The t test indicated no significant difference in science achievement gains for PBL
and non-PBL students during SY2011 (t[594] = -.523; p = .60). The sample means are displayed
Table 15. Distribution of Students by Science Course Code and Group
Course code Course description n PBL group n non-PBL group
6005 Science 5th
grade 67 67 6008 Science 8
th grade 83 83
6021 Biology 148 148
Figure 6. Science Gain During SY2011 by Group
Figure 5. English/Language Arts Gain During SY2011 by Group
English/language arts Gain During SY2011 by Group

Methods and Results
26 | Extended Professional Development in Project-Based Learning
in Figure 6, which illustrates a slightly higher average gain score for the PBL group (.018) when
compared with the non-PBL group (-.016). However, as noted previously, this difference was not
statistically significant.
Social studies main analysis
There were 189 students in the PBL group whose teachers indicated they implemented
project-based learning in their social studies courses during SY2011. We used PSM to draw a
matched sample of 189
students who took the
same courses but whose
teachers, according to
BIE’s records, had not par-
ticipated in PBL profes-
sional development. Table
16 presents a description of
the courses represented in
the data and the number of
students enrolled in those
courses by group.
We conducted an
independent samples t test
to determine if the average
gain score for PBL group
students differed signifi-
cantly from non-PBL stu-
dents. The t test indicated
no significant difference in
social studies achievement gains for PBL and non-PBL students during SY2011 (t[376] = -1.077;
p = .28). The sample means are displayed in Figure 7, which illustrates a slightly higher average
gain score for the PBL group (.044) when compared with the non-PBL group (-.038). However,
as noted previously, this difference was not statistically significant.
Post-hoc analyses for RQ2
We conducted a series of additional post-hoc analyses for RQ2 to address three remain-
ing areas of concern following the final analysis:
1. estimating observed power for each content area test;
2. determining if the inequality in starting points between groups negatively impacted potential growth for one group more than the other; and
3. determining the presence/absence of an effect for PBL when all four content areas were aggregated together to increase statistical power.
Table 16. Distribution of Students by Social Studies Course Code and Group
Course code Course description n PBL group n non-PBL group
7008 Social studies 8 – WV studies 66 66 7010 World history to 1900 123 123
Figure 7. Social Studies Gain During SY2011 by Group

Methods and Results
Extended Professional Development in Project-Based Learning | 27
Power analyses
We calculated observed effect sizes (Cohen’s d) for each of the original content area anal-
yses. We then used a freely available power calculator (G*Power 3.1.2: Faul, Erdfelder, & Buch-
ner, 2007) to determine the observed statistical power given the effect size and the sample size
for each analysis. Our observed power ranged from very low in social studies where we observed
a very small effect with a sample of less than 400 students (i.e., 0.12 or 12%) to moderate in sci-
ence where we observed a small effect in a sample of nearly 600 students (i.e., 0.77 or 77%). For
all analyses, we next used the power calculator to determine the sample size necessary to have
95% confidence in an effect the size of those observed in our study. Finally, we determined the
number of additional cases necessary to achieve that level of confidence. The results appear in
Table 17.
Table 17. Power Analyses for Content Area T Tests
Content Area Observed effect
(Cohen’s d) Sample size Observed power
Necessary sample size for 95%
confidence in observed effect
Additional cases needed for 95%
confidence in observed effect
Mathematics -.17 (small) 224 .73 (73%) 439 215 English/Language Arts
-.08 (very small) 444 .39 (39%) 2,020 1,576
Science -.11 (small) 596 .77 (77%) 1,063 467 Social Studies -.04 (very small) 378 .12 (12%) 8,111 7,733
Impact of nonequivalent starting points
As noted previously, we included prior academic achievement in the PSM models used
for this study and we did not find statistically significant differences in baseline academic
achievement when conducting analyses to verify that the PSM models had functioned properly.
Nevertheless, we were still concerned that the small differences in baseline achievement be-
tween the PBL and non-PBL groups could have negatively influenced the ability of one group to
exhibit change over time. As such, we conducted post-hoc analyses to verify that, regardless of
starting point, on average, students in both groups had the same opportunities to achieve gains
over time.
For each content area, we created a binned variable which indicated each student’s start-
ing quartile of baseline achievement. Quartile 1 represented the 1st to 24th percentile of baseline
achievement, Quartile 2 represented the 25th to 49th percentile, Quartile 3 represented the 50th
to 74th percentile, and Quartile 4 represented the 75th to 99th percentile.
We then constructed a series of linear models to test whether gain scores differed signifi-
cantly based on starting points. First we entered starting point into a univariate model as the
only predictor of student gain scores. The model was significant, indicating the presence of a po-
tential bias based on starting point, whereby students who started in the bottom quartile had
significantly higher gain scores than those who started in quartiles 2, 3, or 4 regardless of group
membership (PBL versus non-PBL).
This main effect alone was not unexpected. However, to determine if this effect was pre-
sent when group membership was accounted for (PBL or non-PBL), we ran a set of factorial

Methods and Results
28 | Extended Professional Development in Project-Based Learning
ANOVAs, entering group and baseline quartile of achievement into the model to predict gain
scores. Our hypothesis was that the presence of a significant interaction effect in these models
would be a red flag, indicating that starting points might be impacting gain scores in one group
more than the other.
The factorial ANOVAs indicated that, for all content areas, there was a main effect for
starting point, but the interaction between group and starting point was not statistically signifi-
cant for any of the four content areas (see Table 18 through Table 21). As such, we concluded
that, while there is an effect for starting point on students’ academic gain score, the effect was
not differentially present in our two groups. Therefore, it was not of critical concern in our main
analyses. In other words, as we had anticipated, students’ baseline achievement has an influence
on their ability to demonstrate growth. Therefore, our efforts to include starting points in the
PSM model were justified. Further, the results of the factorial ANOVAs, which indicated no in-
teraction effects for group and starting point, provide satisfactory evidence that we effectively
accounted for the influence of baseline achievement in this study.
Table 18. Tests of Between Subjects Effects for Factorial ANOVA Testing Interaction Between Group and Starting Point (Mathematics)
Source Type III sum of
squares df Mean square F p
Group .767 1 .767 1.551 .214 Starting point 8.877 3 2.959 5.986 .001 Group*Starting point
1.025 3 .691 .691 .558
Error 106.773 216 .494 N/A N/A
Table 19. Tests of Between Subjects Effects for Factorial ANOVA Testing Interaction Between Group and Starting Point (English/Language Arts)
Source Type III sum of
squares df Mean square F p
Group .144 1 .144 .350 .554 Starting point 3.939 3 1.313 3.188 .024 Group*Starting point
.549 3 .183 .444 .722
Error 179.560 436 .412 N/A N/A
Table 20. Tests of Between Subjects Effects for Factorial ANOVA Testing Interaction Between Group and Starting Point (Science)
Source Type III sum of
squares df Mean square F p
Group .246 1 .246 .415 .520 Starting point 28.785 3 9.595 16.211 .000 Group*Starting point
.674 3 .225 .380 .768
Error 348.023 588 .592 N/A N/A

Methods and Results
Extended Professional Development in Project-Based Learning | 29
Table 21. Tests of Between Subjects Effects for Factorial ANOVA Testing Interaction Between Group and Starting Point (Social Studies)
Source Type III sum of
squares df Mean square F p
Group .950 1 .950 .528 .161 Starting point 27.348 3 9.116 1.968 .000 Group*Starting point
.909 3 .303 18.884 .597
Error 178.619 370 .483 .628 N/A
Aggregating content areas to increase statistical power
As indicated above, the observed statistical power for our individual content area anal-
yses was well below the criterion of 95% confidence. As such, we could not have confidence in
our ability to determine if the observed effects, though small, were statistically significant.
Therefore, we sought to increase our sample size to an adequate level by aggregating students
from all four content areas resulting in a total sample size of N = 1,624 (i.e., 821 in each group,
PBL and non-PBL).
We then ran another independent samples t test to examine differences in average gain
scores based on group membership (PBL versus non-PBL). The t test did not return a statistical-
ly significant result (t[1,640] = -1.729, p = .08). However, as we observed in the content area
analyses, the PBL group outgained the non-PBL group by a small margin (mean difference of
-.063). The observed difference translates to an estimated effect size of d = .08 or a very small
effect (i.e., a small effect is equal to at least .10 according to Cohen).
We calculated the observed power for a two-tailed independent samples t test, wherein a
small effect (d = .08) was observed with a sample size of 1,642. The result was .90 or 90% confi-
dence. We concluded that, even after aggregating across content areas, we did not have adequate
power to reach 95% confidence in a very small effect. However, our analysis indicated that, with
90% confidence, the very small effect we observed for PBL membership was not statistically sig-
nificant (p = .08). If we were to relax the criterion for significance to p = .10 in light of the ex-
ploratory nature of this study, we would have achieved statistical significance, but we would still
have to question the practical significance of such a small effect and rule out other explanatory
variables as the source of the impact.

30

31
Discussion
This study identified a list of 21st century skills based on other available research, pro-
vided data on which of these skills teachers taught most often and extensively, and to what ex-
tent these results were related to teachers’ use of project-based learning (PBL) instructional
approaches and their participation in PBL professional development. The overall results provide
evidence that PBL use in combination with PBL professional development can have an impact
on 21st century teaching. In nearly every case the comparison suggests there are substantial dif-
ferences in the hypothesized direction, with no statistically significant findings suggesting oth-
erwise.
The study provides evidence that speaks to the potential of 21st century skills and PBL to
become part of the larger educational landscape by working in different types of schools. The
West Virginia Department of Education effort sought to change teaching and learning not just
“in leading edge schools that have incorporated deeper learning” as highlighted by the Alliance
for Excellent Education (2011, p. 4), but also in “high-poverty schools…with persistent achieve-
ment gaps” as called for by The William and Flora Hewlett Foundation (2010, p. 7). As indicated
earlier, Geier, et al. (2008) and Boaler (2002) have conducted studies that indicate PBL can be
effective with at-risk and diverse students. However, others have questioned the extent to which
schools and teachers can foster equitable distribution of reform practices (Camburn & Won
Han, 2008). It is noteworthy that in our study, 21st century skills teaching and PBL use were not
limited to classes that were perceived as high achieving, but were also present in classrooms
serving a majority of students whose academic performance was “behind most students their
age.” Ultimately, instructional innovations are aimed at preparing all students for careers
and/or college. The largely rural state of West Virginia is a test case for what others are trying to
do.
Teachers most often reported that they tried to develop the skills, while they least often
reported that they were able to effectively assess these skills. This points to a need for advancing
not just PBL practices that develop students’ 21st century skills, but also assessments that are
more closely aligned with PBL and 21st century skills and can be used to help guide teachers’
work with students.
Another inference that can be drawn from this study is that PBL can be compatible with
standardized test preparation. This is important because in their discussion of barriers to in-
structional reform, Wasley and Lear (2001) write “teachers abandon project-based teaching to
ensure time to prepare for high-stakes tests” (p. 4). Our findings suggest that West Virginia
teachers who used PBL felt no disadvantage in preparing students for these tests. Yet, we failed
to reject the null hypothesis for all four content areas (English/language arts, mathematics, sci-
ence and social studies). In other words, contrary to our hypothesis, we did not find that stu-
dents in the PBL group achieved significantly greater gains than a matched sample of students
in the non-PBL group. Due to relatively low sample sizes and small effect sizes, the content area
analyses were afflicted by low statistical power. However, aggregating our data to build power
did not result in a statistically significant effect for PBL. The result approached significance with
approximately 90% confidence, but the difference between groups was still quite small in practi-

Discussion
32 | Extended Professional Development in Project-Based Learning
cality. However, it should be noted that we did observe in all four content areas and the aggre-
gated analysis that students in the PBL group exhibited marginally higher gains than a matched
set of non-PBL students. Although these results could be viewed as disappointing, they should
serve to mitigate the concern among some educators that engaging in PBL will impede standard-
ized test preparation.
The question of distribution of reform practices by teacher characteristics is also im-
portant, perhaps as important as analyzing across student and school characteristics. The find-
ing about teachers in the PBL group offering professional development to others echoes findings
from other studies suggesting that teacher engagement in leadership activities is a predictor of
their success in teaching reforms (Riel & Becker, 2008). This is a concern because it suggests
that the PBL teachers in our study may be teaching 21st century skills for reasons that are inde-
pendent of the professional development they received. One could argue that it is a characteris-
tic of the teacher (e.g., being a leader, innovator, or early adopter) not the PBL professional
development that explains our results. It is worth noting, however, that even within teacher
leaders we saw evidence that PBL may be increasing the teaching of 21st century skills. More-
over, the enthusiasm of early adopters and their ability to provide support to others is important
for any scaling up initiative.
Finally, this study may be helpful in survey instrument development for future research
on 21st century skills teaching. Studies could draw on the subsets of items that emerged as
unique factors or use a sampling of the highest loading items across the factors to create new,
more streamlined measures regarding the constructs of interest.
Limitations of the study
All studies of this nature that involve voluntary teacher participation in professional de-
velopment and implementation have a risk of self-selection bias. That is, often it is the most mo-
tivated and potentially most highly effective teachers that self-select to participate in
professional development and participate in voluntary research. As mentioned above, RQ1 is
particularly susceptible to this bias which represents a potential threat to the validity of our find-
ings. Finding a suitable comparison group for the PBL teachers was challenging because of un-
measured variability in this characteristic (i.e., motivation). We tried to address this by
matching teachers on background characteristics as much as possible and analyzing differences
in the obtained samples on a variety of measures. However, West Virginia only warehouses lim-
ited information about teachers. Therefore, we could only exercise control upon highest degree
obtained and years of experience. Certainly, these measures help to model equivalent selection
bias among the two groups, but we would never presume that these variables account for all dif-
ferences in motivation among PBL and non-PBL teachers.
Another limitation of RQ1 is that the survey analyses used broad indices. However, sub-
sequent analyses might focus on more specific practices and perceptions. We hope that an even-
tual outcome of this study will be a set of distinct and succinct indicators for teaching of 21st
century skills and identification of subdimensions (e.g., two types of critical thinking) if any are
evident.

Discussion
Extended Professional Development in Project-Based Learning | 33
Finally, the survey which addressed RQ1 asked participants in both groups to identify a
target class to serve as a referent for subsequent survey items including, for example, indicators
of academic press (e.g., hours of homework), the general level of student academic performance,
and whether teachers used block scheduling. Because we used this approach, the analysis of sur-
vey data only represents the experience of the target class. Survey results are not necessarily
representative of the breadth of instruction provided by teachers in all of their course offerings.
Several limitations of our investigation of RQ2 bear mentioning. First, in our analyses of
student achievement data we were not able to include all of the teachers who took part in the
BIE-sponsored professional development. Several teachers were excluded because they (a) used
PBL in a course that was designated as a none-core content area (e.g., art or psychology), and as
such no relevant state assessment data were available for their students; (b) implemented PBL
in grade levels where students are not assessed using the statewide accountability assessment
(e.g., grade 12); or because (c) we were unable to locate course records for them despite their
having self-reported implementing PBL in a core content area course during SY2011. The re-
maining teachers who were included in our study may not represent the full breadth of PBL im-
plementation among those teachers trained by the BIE. Exacerbating this issue, the inferential
statistical tests used for this study (and most inferential tests for that matter) focus upon aver-
age differences observed between groups, and as such, variability among the students of PBL
teachers and non-PBL teachers are somewhat washed out. If sample sizes were larger, and if we
knew more about the quality of PBL implementation in each group, we could potentially conduct
additional post hoc analyses to address this variability.
Another limitation arises from our inability to measure implementation fidelity ade-
quately. With respect to the PBL group, we only had self-reported survey data indicating how
extensively PBL was used. These data are likely subject to social desirability bias. Also, because
of limitations in the course scheduling data available to us at the state level, we decided to in-
clude all available sections of the target courses self-reported by PBL teachers in our analyses. It
is possible that PBL may have been implemented to varying degrees or not at all in some of
these sections. Furthermore, we had no way to measure the degree to which students in target
courses were actually exposed to PBL. It is certainly possible that measures such as attendance
in the PBL target course could moderate its effect on achievement. Likewise, in the comparison
group, we were unable to measure the presence or absence of PBL implementation. This is par-
ticularly problematic given that PBL is a common instructional modality in West Virginia, which
is a Partnership for 21st Century Skills state (Partnership for 21st Century Skills, n.d.). However,
we should note that our intent in conducting this study was to determine if the BIE-led PBL pro-
fessional development, because of its intensity and quality, was associated with significantly dif-
ferent teaching practices and higher achievement gains than “business as usual” teaching in WV.
We anticipated that “business as usual” teaching would include similar elements of PBL. Re-
gardless, having a measure of PBL implementation in the comparison group used in our anal-
yses of test scores would have been helpful.
We should also mention that our outcome measure, WESTEST 2, may be too broad to
serve as an effective dependent variable for this type of study. As noted previously, our hypothe-
sis associated with RQ2 was based upon the reasoning that PBL espouses self-directed learning
and requires students to apply learned content in a procedural fashion that is similar to the re-

Discussion
34 | Extended Professional Development in Project-Based Learning
quirements of the 21st Century Content Standards and Objectives. Likewise, the items used on
WESTEST 2, which are designed to assess these standards and which are multistep and require
students to think critically and use information to solve a complex problem, require a similar set
of skills. Therefore, if PBL were to enhance these essential 21st century skills, we posited that
exposure to PBL may have the potential to impact performance on WESTEST 2. However, we
must acknowledge that standardized tests include items that cover a wide range of standards
and objectives, while a given PBL unit may focus on relatively few. For example, it is easy for one
to imagine the case where a specific PBL unit is focused on teaching students a single topic such
as photosynthesis. However, the end-of-year WESTEST 2 assessment for science for the corre-
sponding grade level would include items aligned to this standard and a variety of others. In this
scenario, how can we expect the students’ overall test scores to be significantly impacted by
her/his participation in the specific PBL unit? Had we a better measure of the content covered
by the PBL unit, our results may be very different than what we have seen in this study.
Ways to avoid these limitations in future studies are addressed in the recommendations
that follow.

35
Recommendations
The following recommendations, which are based on our findings, may help guide future
research on PBL and 21st century skills.
1. Help teachers assess 21st century skills.
The study found that teachers did not feel as successful at assessing the skills as they did
teaching them overall. Teachers who have adopted PBL but are struggling with assess-
ment might value continued professional development focused on assessment of 21st
century skills.
2. Design studies that control for teacher leadership.
Future studies might use probability sampling to avoid the problem of having teachers
with extremely strong professional engagement over-represented as they were in this
study. This will help provide a better test for the effectiveness of PBL use.
3. Map outcomes to PBL more closely.
One of the lessons of this study is that effective research on PBL outcomes requires
achievement measures that are closely matched to the standards taught by each project.
When measures are closely aligned to project design, PBL has a better chance of showing
an impact (e.g., Strobel and van Barneveld, 2008; Finkelstein, et al., 2010; Boss, et al.,
2011). Although projects in West Virginia were mapped to standards that theoretically
are assessed on WESTEST 2, there was no opportunity to establish measures for as-
sessing each standard individually. One possible direction to explore is designing pro-
jects to meet standards in states or districts that use testing at more regular intervals on
more discrete topics, e.g., incorporating more fine-grained assessments that can measure
achievement on these specific standards rather than an overall score at the end of the
year.
4. Reuse and adapt the survey instrument.
We hope that this study can help in the development of distinct (and succinct) indicators
for use in future studies that focus on teaching 21st century skills, including identifica-
tion of subdimensions for closer analysis (e.g., types of critical thinking and creativity).
We recommend that researchers consider using the instrument we developed to replicate
findings and use our analyses to help establish measures that meet different needs, in-
cluding different subsets of these skills.

36

37
References
Alliance for Excellent Education (2011). A time for deeper learning: Preparing students for a
changing world. Washington, DC: Author. Retrieved from
http://www.all4ed.org/files/DeeperLearning.pdf
Bartscher, K., Gould, B., & Nutter, S. (1995). Increasing student motivation through project-
based learning. Master’s Research Project, Saint Xavier and IRI Skylight.
Boaler, J. (2002). Learning from teaching: Exploring the relationship between reform curricu-
lum and equity. Journal for Research in Mathematics Education, 33(4), 239-258. Re-
trieved from http://tnl.esd113.org/cms/lib3/WA01001093/Centricity/
ModuleInstance/276/BoalerReformCurriculumandequity.pdf
Boss, S., Johanson, C., Arnold, S., Parker, W., Nguyen, D, Mosborg, S., Nolen, S., Valencia, S.,
Vye, N. & Bransford, J. (2011). The quest for deeper learning and engagement in ad-
vanced high school courses The Foundation Review, 3(3), 12-23. Retrieved from
http://www.ingentaconnect.com/content/jcgvsu/fr/2011/00000003/00000003/art00
003
Bransford, J. D., Brown, A. L., & Cocking, R. R. (1999). How people learn: Brain, mind, and ex-
perience. Washington, D.C.: National Academy Press.
Buck Institute for Education (2009). Does PBL work? Novato, CA: Author. Retrieved
from http://www.bie.org/research/study/does_pbl_work
Camburn, E. & Won Han, S. (2008). What do we know about instruction from large-scale na-
tional surveys? WCER Working Paper No. 2008-1. Retrieved from
http://www.wcer.wisc.edu/publications/workingPapers/Working_Paper_No_2008_01.
php
Cognition and Technology Group at Vanderbilt. (1992). The Jasper series as an example of an-
chored instruction: Theory, program description and assessment data. Educational Psy-
chologist, 27, 291-315.
Cohen, J. (1988). Statistical power analysis for the behavioral sciences (2nd ed.). Hillsdale, NJ:
Lawrence Earlbaum Associates.
Consortium on Chicago School Research (2005). Survey of Chicago public school teachers.
High School Teacher Edition. Chicago: Author. Retrieved from
http://ccsr.uchicago.edu/downloads/73922005-hs-teacher-survey.pdf
Darling-Hammond, L., Barron, B., Pearson, P. D., Schoenfeld, A., Stage, E., Zimmerman, T.,
Cervetti, G., & Tilson, J. (2008). Powerful learning: What we know about teaching for
understanding. San Francisco, CA: Jossey-Bass.
Dillman, D. (2000). Mail and internet surveys: The tailored design method (2nd Edition). New
York: Wiley & Sons.

References
38 | Extended Professional Development in Project-Based Learning
Dochy, F., Segers, M., Van den Bossche, P., & Gijbels, D. (2003). Effects of problem-based learn-
ing: a meta-analysis. Learning and Instruction, 13, 533–568.
Edutopia (2001). PBL research summary: Studies validate project-based learning. Novato, CA:
Author. Retrieved from http://www.edutopia.org/project-based-learning-research
Faul, F., Erdfelder, E., & Buchner, A. (2007). G*Power 3. Institute for Experimental
Psychology. Dusseldorf, Germany: Heinrich-Heine-University. Retrieved from
http://www.psycho.uni-duesseldorf.de/abteilungen/aap/gpower3/
Finkelstein, N., Hanson, T., Huang, C. W., Hirschman, B., and Huang, M. (2010). Effects of
problem based economics on high school economics instruction. (NCEE 2010-4002).
Washington, DC: National Center for Education Evaluation and Regional Assistance, In-
stitute of Education Sciences, U.S. Department of Education. Retrieved from
http://www.bie.org/research/study/experimental_study_of_bie_project_based_econo
mics_units
Francisco, K. (2011). Lilly grant powers teacher transformation. The Journal Gazette, Fort
Wayne, IN. July 17, 2011. Retrieved from http://www.journalgazette.net/
article/20110717/EDIT10/307179979/1147/EDIT07
Gallagher, S.A., Stepien, W.J., Rosenthal, H. (1992) The effects of problem-based learning on
problem solving. Gifted Child Quarterly, 36, 195-200.
Geier, R., Blumenfeld, P.C., Marx, R.W., Krajcik, J.S., Fishman, B., Soloway, E., & Clay-
Chambers, J. (2008). Standardized test outcomes for students engaged in inquiry-based
science curricula in the context of urban reform. Journal of Research in Science Teach-
ing, 45(8), 922-939.
Hickey, D.T., Kindfeld, A.C.H., Horwitz, P., & Christie, M.A. (1999). Advancing educational the-
ory by enhancing practice in a technology-supported genetics learning environment.
Journal of Education, 181, 25-55.
Hmelo, C. (1998). Problem-based learning: Effects on the early acquisition of cognitive skill in
medicine. Journal of the Learning Sciences, 7, 173-208.
Kanter, D. & Konstantopoulos, S. (2010). The impact of a project-based science curriculum on
minority student achievement, attitudes, and careers: The effects of teacher content and
pedagogical content knowledge and inquiry-based practices. Science Education, 94(5),
855-887. Retrieved from http://onlinelibrary.wiley.com/doi/10.1002/sce.20391/full
Lynch, S., Kuipers, J. U., Pyke, C., & Szesze, M. (2005). Examining the effects of a highly rated
science curriculum unit on diverse students: Results from a planning grant. Journal of
Research in Science Teaching, 42, 921-946.
MaCorr Research (n.d.). Sample Size Calculator. Toronto, Ontario: Author. Retrieved from
http://www.macorr.com/sample-size-calculator.htm
Mergendoller, J. R., Markham, T., Ravitz, J., & Larmer, J. (2006). Pervasive management of
project based learning: Teachers as guides and facilitators. In C. M. Evertson & C. S.
Weinstein (Eds.), Handbook of classroom management: Research, practice, and con-
temporary issues, Mahwah, NJ: Lawrence Erlbaum, Inc.

References
Extended Professional Development in Project-Based Learning | 39
Newmann, F., & Associates. (1996). Authentic achievement: Restructuring schools for intellec-
tual quality. San Francisco: Jossey-Bass.
Newmann, F.M., Bryk, A.S., & Nagaoka, J. (2001). Authentic intellectual work and standard-
ized tests: Conflict or coexistence? Chicago: Consortium on Chicago School Re-
search. Available: http://ccsr.uchicago.edu/publications/authentic-intellectual-work-
and-standardized-tests-conflict-or-coexistence
Novalis, G. & Gallaher, L. (2010). ITL research technical memo. SRI International: Menlo Park,
CA.
Partnership for 21st Century Schools. (n.d.) FAQs. Washington DC: Author. Retrieved from
http://www.p21.org/overview/p21-faq
Peck, J.K., Peck, W., Sentz, J., & Zasa, R. (1998). Students’ perceptions of literacy learning in a
project-based curriculum. In E.G. Sturtevant, J.A. Dugan, P. Linder, & W.M. Linek
(Eds.), Literacy and community (pp. 94-100). Texas A&M University: College Reading
Association.
Ravitz, J. (2010). Beyond changing culture in small high schools: Reform models and changing
instruction with project-based learning. Peabody Journal of Education, 85(3), 290-313.
Retrieved from http://teacherscollegesj.edu/resources/publications/Beyond%20
Changing%20Culture%20in%20Small%20HS.pdf
Riel, M. & Becker, H. (2008). Characteristics of teacher leaders for information and communica-
tion technology. In J.Voogt & G. Knezek (Eds.). International handbook of information
technology in primary and secondary education, 20(4). New York: Springer, 397-417.
Retrieved from http://mindmaps.typepad.com/files/08-riel-becker-teacher-leadership-
tech.pdf
Rosenbaum, P.R. & Rubin, D.B. (1983). The central role of the propensity score in observational
studies for causal effects. Biometrika, 70(1), 41-55.
Schwartz, D. and Martin, T. 2004. Inventing to prepare for future learning: The hidden efficien-
cy of encouraging original student production in statistics instruction. Cognition and In-
struction, 22, 129–184.
Shear, L., Novais, G., Means, B., Gallagher, L., & Langworthy, M. (2010). ITL research design.
Menlo Park, CA: SRI International. Retrieved from http://itlresearch.com/images/
stories/reports/ITL%20Research%20design_15%20Nov%20201.pdf
Strobel, J. & van Barneveld, A. (2008). When is PBL more effective? A Meta-synthesis of meta-
analyses comparing PBL to conventional classrooms, Interdisciplinary Journal of Prob-
lem-based Learning, 3(1), Article 4. Retrieved from http://docs.lib.purdue.edu/
ijpbl/vol3/iss1/4
The William and Flora Hewlett Foundation (2010). Education program strategic plan. Menlo
Park, CA: Author. Retrieved from http://www.hewlett.org/uploads/documents/
Education_Strategic_Plan_201.pdf
Tretten, R. & Zachariou, P. (1995). Learning about project-based learning: Self-assessment
preliminary report of results. San Rafael: The Autodesk Foundation.

References
40 | Extended Professional Development in Project-Based Learning
Walker, A. & Leary, H. (2008). A problem based learning meta analysis: Differences across
problem types, implementation types, disciplines, and assessment levels, Interdiscipli-
nary Journal of Problem-based Learning, 3(1), 12-43. Retrieved
from http://docs.lib.purdue.edu/ijpbl/vol3/iss1/3
Wasley, P. & Lear, R. (2001). Small schools, real gains. Educational Leadership, 58(6). Re-
trieved from http://www.txechs.com/downloads/19_smallschoolsrealgains.pdf
West Virginia Board of Education (2008). 21st century learning skills and technology tools con-
tent standards and objectives for West Virginia schools. (Policy 2520.14). Charleston,
WV: Author. Retrieved from http://wvde.state.wv.us/policies/p2520.14.pdf
West Virginia Department of Education. (n.d.) Office of Instruction website. Charleston, WV:
author. Retrieved from http://wvde.state.wv.us/instruction/

41
Appendix A. Survey Instrument

Appendix A. Survey Instrument
42 | Extended Professional Development in Project-Based Learning

Appendix A. Survey Instrument
Extended Professional Development in Project-Based Learning | 43

Appendix A. Survey Instrument
44 | Extended Professional Development in Project-Based Learning

Appendix A. Survey Instrument
Extended Professional Development in Project-Based Learning | 45
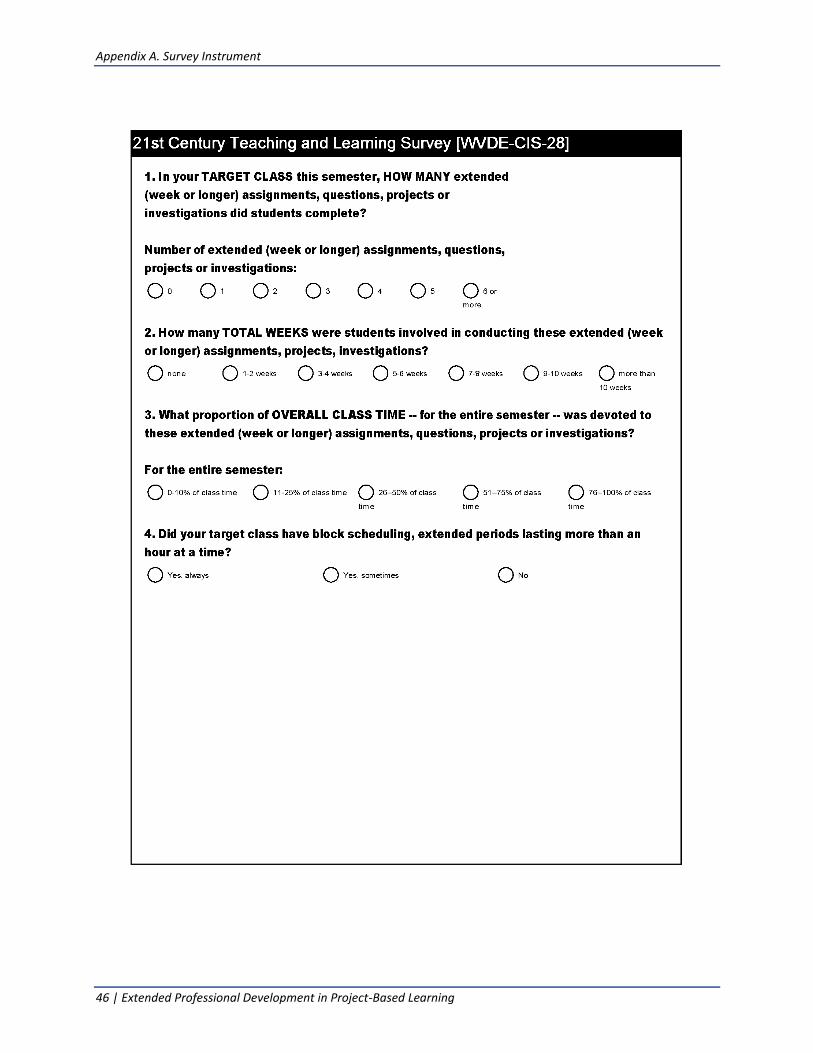
Appendix A. Survey Instrument
46 | Extended Professional Development in Project-Based Learning

Appendix A. Survey Instrument
Extended Professional Development in Project-Based Learning | 47

Appendix A. Survey Instrument
48 | Extended Professional Development in Project-Based Learning

Appendix A. Survey Instrument
Extended Professional Development in Project-Based Learning | 49
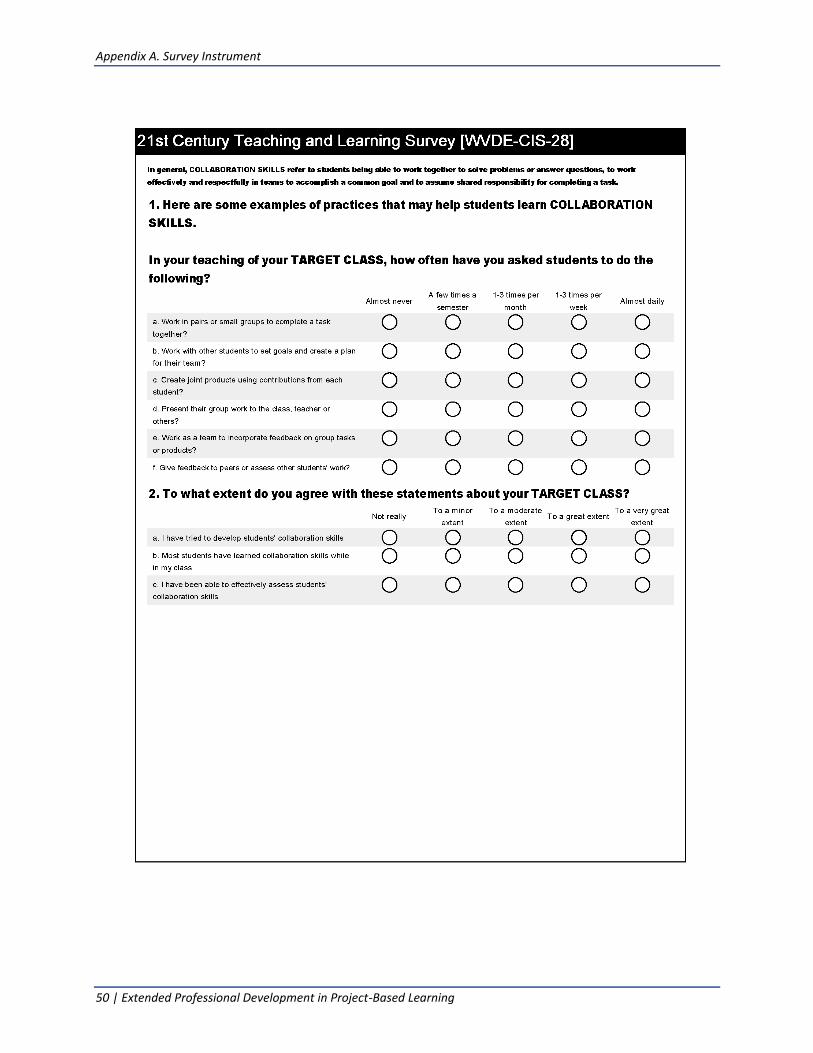
Appendix A. Survey Instrument
50 | Extended Professional Development in Project-Based Learning
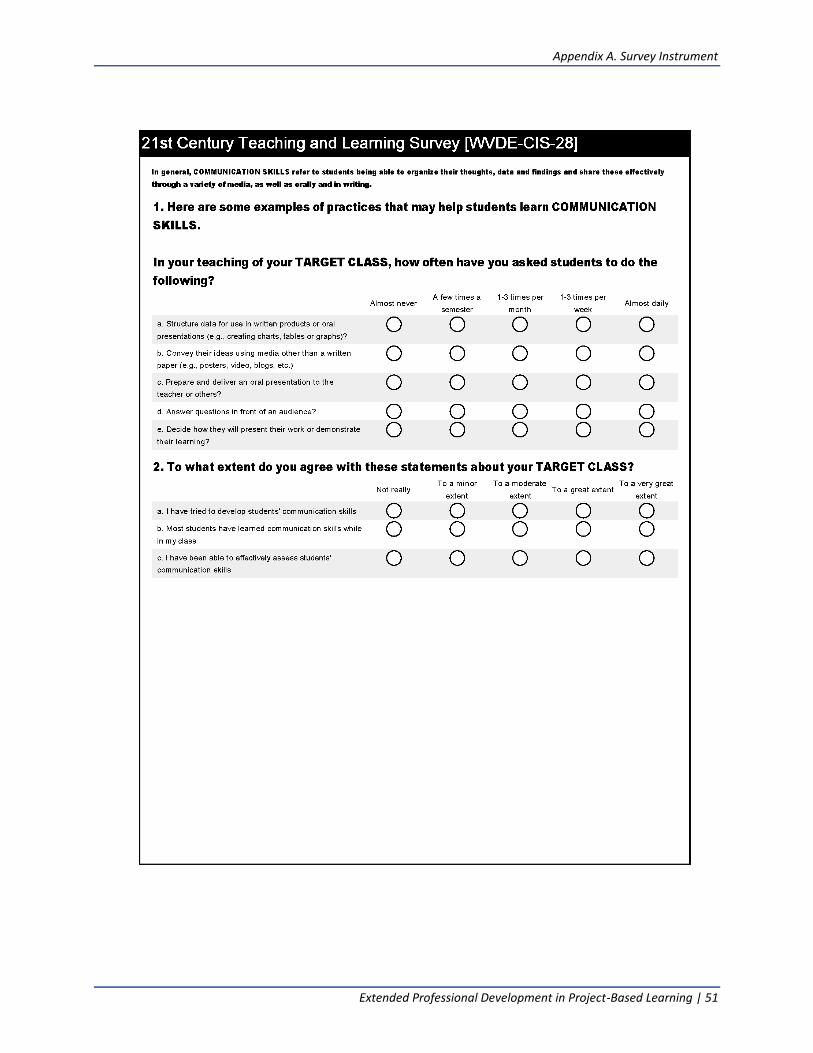
Appendix A. Survey Instrument
Extended Professional Development in Project-Based Learning | 51

Appendix A. Survey Instrument
52 | Extended Professional Development in Project-Based Learning

Appendix A. Survey Instrument
Extended Professional Development in Project-Based Learning | 53

Appendix A. Survey Instrument
54 | Extended Professional Development in Project-Based Learning

Appendix A. Survey Instrument
Extended Professional Development in Project-Based Learning | 55

Appendix A. Survey Instrument
56 | Extended Professional Development in Project-Based Learning

Appendix A. Survey Instrument
Extended Professional Development in Project-Based Learning | 57

58

59
Appendix B. 21st Century Skills Frameworks
Students’ 21st Century Skills (ITL/SRI version)
Knowledge Building - Students move beyond the reproduction of information to construct knowledge that is new to them.
Problem-Solving and Innovation - Students solve problems for which there is no previously learned solution, make choices in their approach, and implement their solutions in the real world.
Skilled Communication - Students present their ideas in ways that are clear and compelling, and present sufficient relevant evidence on a topic or theme.
Collaboration - Students work together in groups, take on roles, and produce a joint work product.
Self-Regulation - Students plan and monitor their work, and make revisions based on feedback or self-assessment.
Use of ICT for Learning - Students use ICT to construct knowledge; choose when, where, and how to use it; and evaluate the credibility and relevance of online re-sources.
The William and Flora Hewlett Foundation Deeper Learning Framework An early draft (12/24/2010) was focused on giving students opportunities to learn
Content knowledge o To acquire a deep understanding of the academic content o To apply their knowledge to novel tasks and situations o To create new knowledge
Cognitive Strategies o To think critically and solve complex problems o To communicate effectively orally and in writing
Learning Behaviors o To actively engage in their own learning o To work collaboratively with others
Their web site (as of July 15, 2012) states that deeper learning prepares students to
Master core academic content
Think critically and solve complex problems
Work collaboratively
Communicate effectively
Learn how to learn (e.g., self-directed learning)
http://www.hewlett.org/programs/education-program/deeper-learning

60

61
Appendix C. Recoding Methods
Table A 1. Survey Respondent Recoding Based on Background Information From Survey Responses
Recoded Category
Original Category
Match PBL Total
Total 24 38 62
No PBL Use (N = 21)
No emphasis on PBL 5 4 9
Emphasis on PBL, but no professional development or use 2 2
Emphasis on PBL, some professional development, but no use 5 3 8
Emphasis on PBL, extended professional development, but no use 2 2
Used PBL, limited professional development (N = 17)
Emphasis on PBL, no professional development, but used PBL 5 5
Emphasis on PBL, only some professional development, and used PBL 7 5 12
Used PBL, extended professional development (N = 24)
Emphasis on PBL, extended professional development, used PBL 24 24
NOTE: Of the originally identified 42 PBL teachers, 38 responded to the survey. By requiring all three criteria we lost an additional 14 PBL teachers. Keeping only the third category and combining the other two we get PBL with extended PD (N = 24) and No PBL or limited PD (N = 38)

62

63
Appendix D. Index Construction Factor Analyses
Table A 2. Factor Analysis of the Last Four 21st Century Skills
Skill Items – perceptions (highlighted with *) and frequency of practices (“I asked students to . . .”)
Component
1 2 3 4
Global connections
*I have tried to develop students' skills in making global connections .90 .10 .11 .16
Study information about other countries or cultures? .88 .03 -.09 .05
*Most of my students have learned to make global connections while in my class
.87 .18 .15 .22
Understand the life experiences of people in cultures besides their own? .86 -.05 .09 .22
Study the geography of distant countries? .79 .09 -.04 .16
*I have been able to effectively assess students' skills in making global connections
.78 .18 .19 .17
Use information or ideas that come from people in other countries or cultures? .77 .12 .08 .12
Reflect on how their own experiences and local issues are connected to global issues?
.76 .11 .23 .23
Discuss issues related to global interdependency (for example, global environment trends, global market economy)?
.71 .25 .16 .33
Using technology
Select appropriate technology tools or resources for completing a task? .12 .82 .26 .17
*Most students have learned to use technology as a tool for learning while in my class
.15 .80 .37 .19
Use technology to analyze information (e.g., databases, spreadsheets, graphic programs, etc.)?
.14 .79 .32 .07
*I have tried to develop students' skills in using technology as a tool for learning
.26 .77 .25 .31
*I have been able to effectively assess students' skills in using technology for learning
.20 .70 .44 .16
Use technology or the Internet for self-instruction (e.g., Kahn Academy or other videos, tutorials, self-instructional websites, etc.)?
-.04 .70 .20 .20
Use technology to help them share information (e.g., multi-media presentations using sound or video, presentation software, blogs, podcasts, etc.)?
.15 .65 .33 .34
Use technology to support team work or collaboration (e.g., shared work spaces, email exchanges, giving and receiving feedback, etc.)?
.12 .63 .41 .29
Evaluate the credibility and relevance of online resources? .33 .63 .36 .33
Use technology to interact directly with experts or members of local/global communities?
.23 .52 .28 .39
Use technology to keep track of their work on extended tasks or assignments? -.05 .48 .24 .33
Table A 2 continued next page
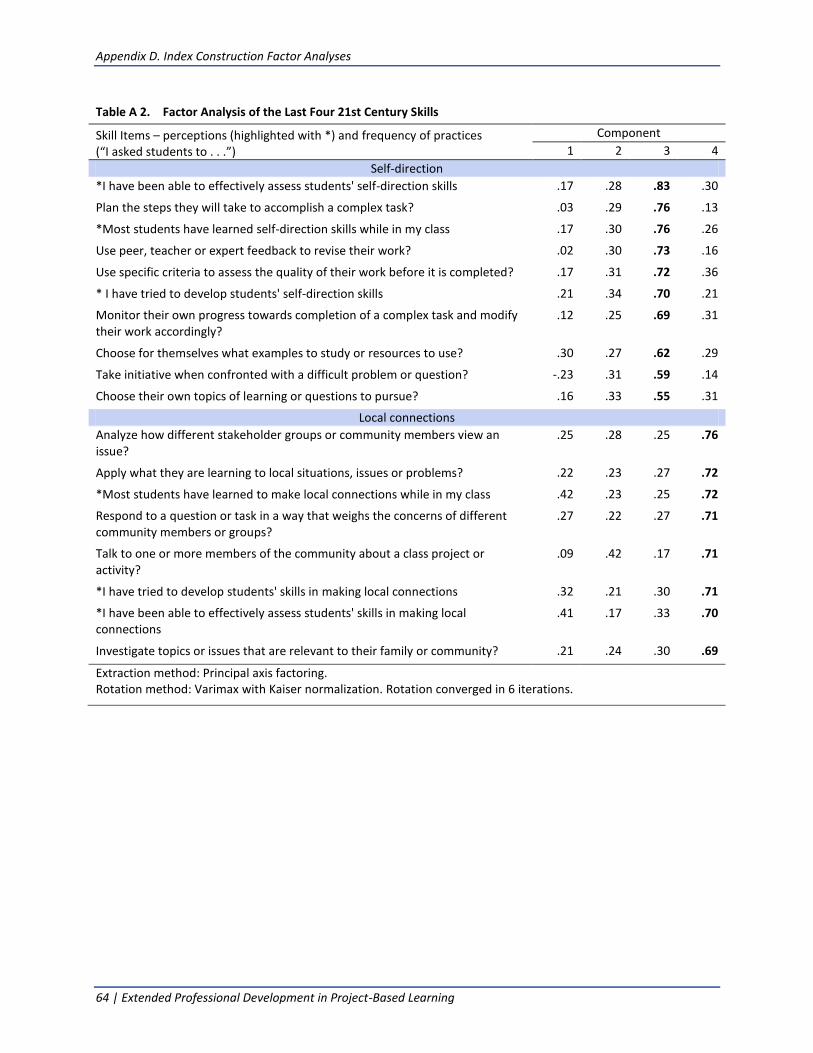
Appendix D. Index Construction Factor Analyses
64 | Extended Professional Development in Project-Based Learning
Table A 2. Factor Analysis of the Last Four 21st Century Skills
Skill Items – perceptions (highlighted with *) and frequency of practices (“I asked students to . . .”)
Component
1 2 3 4
Self-direction
*I have been able to effectively assess students' self-direction skills .17 .28 .83 .30
Plan the steps they will take to accomplish a complex task? .03 .29 .76 .13
*Most students have learned self-direction skills while in my class .17 .30 .76 .26
Use peer, teacher or expert feedback to revise their work? .02 .30 .73 .16
Use specific criteria to assess the quality of their work before it is completed? .17 .31 .72 .36
* I have tried to develop students' self-direction skills .21 .34 .70 .21
Monitor their own progress towards completion of a complex task and modify their work accordingly?
.12 .25 .69 .31
Choose for themselves what examples to study or resources to use? .30 .27 .62 .29
Take initiative when confronted with a difficult problem or question? -.23 .31 .59 .14
Choose their own topics of learning or questions to pursue? .16 .33 .55 .31
Local connections
Analyze how different stakeholder groups or community members view an issue?
.25 .28 .25 .76
Apply what they are learning to local situations, issues or problems? .22 .23 .27 .72
*Most students have learned to make local connections while in my class .42 .23 .25 .72
Respond to a question or task in a way that weighs the concerns of different community members or groups?
.27 .22 .27 .71
Talk to one or more members of the community about a class project or activity?
.09 .42 .17 .71
*I have tried to develop students' skills in making local connections .32 .21 .30 .71
*I have been able to effectively assess students' skills in making local connections
.41 .17 .33 .70
Investigate topics or issues that are relevant to their family or community? .21 .24 .30 .69
Extraction method: Principal axis factoring. Rotation method: Varimax with Kaiser normalization. Rotation converged in 6 iterations.

Appendix D. Index Construction Factor Analyses
Extended Professional Development in Project-Based Learning | 65
Table A 3. Factor Analysis of the First Four 21st Century Skills
Indicators of 21st Century Skills – First Four
Factor Number
1 2 3 4 5 6
Collaboration (CO) Work in pairs or small groups to complete a task together? .72 -.07 .26 .15 .22 .09
(CO) Work as a team to incorporate feedback on group tasks or products?
.70 .36 .19 .13 .33 .16
(CO) *I have tried to develop students' collaboration skills .69 .13 .07 .42 .08 .41
(CO) Work with other students to set goals and create a plan for their team?
.66 .38 .16 .20 .31 .11
(CO) *Most students have learned collaboration skills while in my class
.65 .20 .19 .45 .11 .34
(CO) Create joint products using contributions from each student? .59 .49 .14 .15 .20 .20
(CO) Present their group work to the class, teacher or others? .56 .42 .21 .02 .26 .10
(CT) Draw their own conclusions based on analysis of numbers, facts, or relevant information?
.50 .06 .39 .24 .14 .25
(CO) *I have been able to effectively assess students' collaboration skills
.48 .37 .31 .42 .13 .38
Communication (CM) Decide how they will present their work or demonstrate their learning?
.17 .65 .42 .26 .21 .06
(CM) *I have been able to effectively assess students' communication skills
.14 .65 .24 .53 .12 .30
(CM) Prepare and deliver an oral presentation to the teacher or others?
.32 .62 .05 .29 .38 .19
(CM) Answer questions in front of an audience? .08 .59 .41 .02 .25 .17
(CM) *I have tried to develop students' communication skills .36 .56 .11 .47 .13 .42
(CM) Convey their ideas using media other than a written paper (e.g., posters, video, blogs, etc.)
.25 .49 .27 .44 .36 .19
Creativity (with critical thinking) (CR) Test out different ideas and work to improve them? .14 .20 .76 .24 .28 .07
(CR) Generate their own ideas about how to confront a problem or question?
.23 .18 .71 .20 .37 .12
(CT) Analyze competing arguments, perspectives or solutions to a problem?
.14 .28 .66 .15 .01 .33
(CT) Develop a persuasive argument based on supporting evidence or reasoning?
.29 .14 .63 .04 .09 .41
(CR) Invent a solution to a complex, open-ended question or problem?
.35 .29 .49 .32 .48 .07
(CT) Summarize or create their own interpretation of what they have read or been taught?
.37 .13 .42 .31 .01 .15
(CT) Try to solve complex problems or answer questions that have no single correct solution or answer?
.37 .13 .39 .12 .39 .20
Table A 3 continued next page
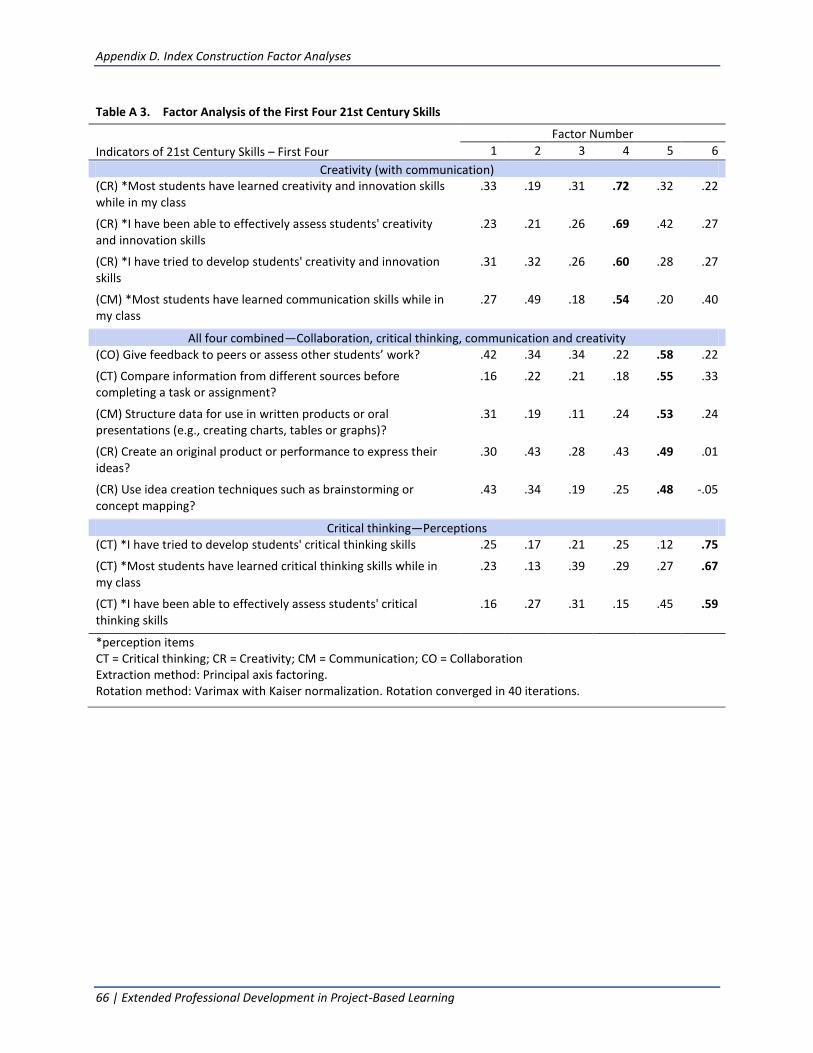
Appendix D. Index Construction Factor Analyses
66 | Extended Professional Development in Project-Based Learning
Table A 3. Factor Analysis of the First Four 21st Century Skills
Indicators of 21st Century Skills – First Four
Factor Number
1 2 3 4 5 6
Creativity (with communication) (CR) *Most students have learned creativity and innovation skills while in my class
.33 .19 .31 .72 .32 .22
(CR) *I have been able to effectively assess students' creativity and innovation skills
.23 .21 .26 .69 .42 .27
(CR) *I have tried to develop students' creativity and innovation skills
.31 .32 .26 .60 .28 .27
(CM) *Most students have learned communication skills while in my class
.27 .49 .18 .54 .20 .40
All four combined—Collaboration, critical thinking, communication and creativity (CO) Give feedback to peers or assess other students’ work? .42 .34 .34 .22 .58 .22
(CT) Compare information from different sources before completing a task or assignment?
.16 .22 .21 .18 .55 .33
(CM) Structure data for use in written products or oral presentations (e.g., creating charts, tables or graphs)?
.31 .19 .11 .24 .53 .24
(CR) Create an original product or performance to express their ideas?
.30 .43 .28 .43 .49 .01
(CR) Use idea creation techniques such as brainstorming or concept mapping?
.43 .34 .19 .25 .48 -.05
Critical thinking—Perceptions (CT) *I have tried to develop students' critical thinking skills .25 .17 .21 .25 .12 .75
(CT) *Most students have learned critical thinking skills while in my class
.23 .13 .39 .29 .27 .67
(CT) *I have been able to effectively assess students' critical thinking skills
.16 .27 .31 .15 .45 .59
*perception items CT = Critical thinking; CR = Creativity; CM = Communication; CO = Collaboration Extraction method: Principal axis factoring. Rotation method: Varimax with Kaiser normalization. Rotation converged in 40 iterations.

Appendix D. Index Construction Factor Analyses
Extended Professional Development in Project-Based Learning | 67
Table A 4. Factor Analysis of Perceptions Items for First Four 21st Century skills
Components
Items 1 2 3 4
Creativity I have been able to effectively assess students' creativity and innovation skills .81 .31 .35 .24 Most students have learned creativity and innovation skills while in my class .80 .27 .31 .36 I have tried to develop students' creativity and innovation skills .76 .29 .36 .31
Critical thinking I have been able to effectively assess students' critical thinking skills .21 .81 .39 .12 Most students have learned critical thinking skills while in my class .35 .79 .2 .32 I have tried to develop students' critical thinking skills .22 .79 .16 .37
Communication I have been able to effectively assess students' communication skills .34 .28 .82 .23 Most students have learned communication skills while in my class .42 .3 .73 .37 I have tried to develop students' communication skills .39 .3 .69 .41
Collaboration I have tried to develop students' collaboration skills .29 .28 .21 .84 Most students have learned collaboration skills while in my class .30 .28 .36 .78 I have been able to effectively assess students' collaboration skills .35 .37 .46 .62
Extraction method: Principal axis factoring. Rotation method: Varimax with Kaiser normalization. Rotation converged in 5 iterations.

68

69
Appendix E. Research Question 1 Data Analysis Tables
Table A 5. Time on Professional Development, Extended Assignments, and Perceived Outcomes, by PBL Use
'Item Total
Mean SD
Mean No PBL or
Limited PD (Low N =
37)
Mean PBL with
extended PD (N =
24) Effect
Size p <
Time spent in professional development (1 = 0 to 10 hours, 2 = 11–20, 3 = 21–30, 4 = 31–40, 5 = 40 or more)
3.19 1.60 2.87 3.71 .53 .05
Number of extended (week or longer) assignments (1 = 0, 2 = 1, 3 = 2, 4 = 3, 5 = 4, 7 = 6 or more)
3.50 1.45 3.37 3.71 .24 .37 (NS)
Total weeks of extended assignments (1 = none, 2 = 1–2 weeks, 3 = 3–4, 4 = 5–6, 5 = 7–8, 6 = 9–10, 7 = more than 10)
3.37 1.71 3.08 3.83 .44 .09 (NS)
Proportion of class time devoted to extended assignments (1 = 0–10%, 2 = 11–25%, 3 = 26–50%, 4 = 51–75%, 5 = 76–100%)
2.31 1.18 2.05 2.71 .56 .05
Time spent having students practice taking standardized tests (1 = none, 2 = less than 4, 3 = 4–12 hours, 4 = 13–20, 5 = more than 20)
2.60 1.00 2.66 2.50 -.16 .55 (NS)
Hours per week an average student is expected to work OUTSIDE OF CLASS (1 = less than 1, 2 = 1–2, 3 = 3–5, 4 = 6–9, 5 = 10 or more)
2.56 .90 2.66 2.42 -.27 .31 (NS)
To what extent students in the selected class (1 = very few, 2 = some, 3 = most, 4 = nearly all)
Learned what they will need to know to do well on standardized tests?
3.00 .75 2.84 3.25 .55 .05
Feel that what they learned was personally relevant?
3.00 .72 2.92 3.13 .28 .28 (NS)
Can apply and transfer what they have learned to new tasks and situations?
2.95 .73 2.76 3.25 .66 .01
Are motivated to learn more about the subject they studied?
2.84 .73 2.68 3.08 .55 .05

Appendix E. Research Question 1 Data Analysis Tables
70 | Extended Professional Development in Project-Based Learning
Table A 6. Mean 21st Century Skills Correlated to Professional Development and Extended Assignments
Correlations In the last year….
Mean z score 21st
century skills
Time PD
Number extended
Total weeks
Overall class time
Time spent involved in professional development workshops or self-paced courses
.34** 1.00
Number of extended (week or longer) assignments, questions, projects or investigations
.47*** 0.15 1.00
How many TOTAL WEEKS were students involved in conducting these extended (week or longer) assignments, projects, or investigations?
.29* .25* .44*** 1.00
What proportion of OVERALL CLASS TIME -- for the entire semester -- was devoted to these extended (week or longer) assignments, questions, projects or investigations?
.35** .26* .31* .47*** 1.00
*** p < .001 ** p < .01 * p < .05 Low n = 61

Appendix E. Research Question 1 Data Analysis Tables
Extended Professional Development in Project-Based Learning | 71
Table A 7. Independent Samples T Test of Means, by PBL Use
Mean comparison: PBL with extended PD vs. no PBL or limited PD
Equal vari-ances assum-ed?
Levene's test for equality of
variances
T test for equality of means
t df
Sig. (2-
tailed)
Mean dif-
ference
Std. Error
dif-ference
95% confidence interval of the
difference
F Sig. Lower Upper
Mean 21st Century Skills Index scores by PBL use
Yes .138 .712 -3.88 60.00 .000 -.91 .23 -1.38 -.44
No -3.94 51.68 .000 -.91 .23 -1.38 -.44
Mean on teacher-reported outcomes by PBL Use
Learned what they need for standardized tests?
Yes 5.03 .03 -2.16 60.00 .035 -.41 .19 -.79 -.03
No -2.37 59.95 .021 -.41 .17 -.75 -.06
Can apply and transfer what they have learned to new tasks and situations?
Yes .44 .51 -2.67 60.00 .010 -.49 .18 -.85 -.12
No -2.62 45.83 .012 -.49 .19 -.86 -.11
Feel that what they learned was personally relevant?
Yes .37 .55 -1.08 60.00 .284 -.20 .19 -.58 .17
No -1.11 52.59 .274 -.20 .18 -.57 .17
Are motivated to learn more about the subjects they studied?
Yes 3.52 .07 -2.16 60.00 .035 -.40 .18 -.77 -.03
No -2.23 53.46 .030 -.40 .18 -.76 -.04
Mean on teacher reported academic press, by PBL use
Hours of test preparation Yes 1.743 .192 1.03 60.00 .307 .24 .23 -.23 .71
No 1.08 56.47 .284 .24 .22 -.20 .69
Hours outside of class Yes .998 .322 .60 60.00 .549 .16 .26 -.37 .68
No .62 53.23 .539 .16 .26 -.35 .67
Extended (week or longer) assignments, questions, projects or investigations
Number of extended as-signments
Yes .09 .76 -.90 60.00 .372 -.34 .38 -1.10 .42
No -.92 52.36 .362 -.34 .37 -1.08 .40
TOTAL WEEKS were stu-dents involved
Yes .05 .82 -1.72 60.00 .091 -.75 .44 -1.63 .12
No -1.73 49.93 .090 -.75 .44 -1.63 .12
Proportion of OVERALL CLASS TIME–for semester
Yes .15 .70 -2.19 59.00 .033 -.65 .30 -1.25 -.06
No -2.25 54.07 0.028 -0.65 0.29 -1.24 -0.07
Mean 21st Century Skills by teacher involvement in professional development
Time spent involved in PD in the last year
Yes .002 .96 -2.07 6.00 .043 -.84 .41 -1.65 -.03
No -2.09 50.55 .042 -.84 .40 -1.65 -.03
Teachers who had led PD since 2008 (ignoring PBL use)
Yes 1.884 .175 -3.13 60.00 .003 -.76 .24 -1.25 -.28
No -2.99 41.40 .005 -.76 .25 -1.28 -.25
By PBL use, for teachers who had led PD
Yes 1.489 .230 -2.70 36.00 .011 -.71 .26 -1.25 -.18
No -2.92 33.93 .006 -.71 .24 -1.21 -.22

Appendix E. Research Question 1 Data Analysis Tables
72 | Extended Professional Development in Project-Based Learning
Table A 8. ANOVA Tests for Mean 21st Century Skills
Mean on 21st century skills index by…
Between groups Within groups Total
Sum of squares df
Mean square F Sig
Sum of squares df
Mean square
Sum of squares Df
PBL use (3-category)
14.97 2 7.48 9.59 .000 46.030 59 0.780 61.00 61
Mean on 21st Century Skills Index by academic performance level indicated by the teacher (ignoring PBL)
3.923 2 1.961 1.959 .150 57.059 57 1.001 60.981 59
Mean on 21st Century Skills Index by PBL use, within academic performance level
Ahead of most .815 1 .815 .938 .340 17.371 20 .869 18.186 21
Behind most 5.652 1 5.652 9.102 .010 6.830 11 .621 12.482 12
At the expected level 7.532 1 7.532 9.186 .006 18.859 23 .820 26.391 24
Mean on 21st Century Skills Index by block scheduling category (ignoring PBL)
4.591 2 2.296 2.401 .100 56.409 59 .956 61.000 61
Mean on 21st Century Skills Index by PBL use, within block scheduling category
No block schedule 6.434 1 6.434 8.976 .005 24.371 34 .717 30.806 35
Sometimes 1.144 1 1.144 7.575 .050 .604 4 .151 1.747 5
Always 2.863 1 2.863 2.454 .135 20.993 18 1.166 23.856 19
Red denotes nonsignificance.

Appendix E. Research Question 1 Data Analysis Tables
Extended Professional Development in Project-Based Learning | 73
Table A 9. Independent Samples T Tests of Means for Each Skill, by PBL Use
Practice score index
Equal variances assumed?
Levene's test for equality of variances
T test for equality of means
t df
Sig. (2-
tailed) Mean
difference Std. error
difference
95% confidence interval of the
difference
F Sig. Lower Upper
Critical thinking
Yes 1.81 .18 -3.11 60.00 .003 -.57 .18 -.94 -.21
No -3.31 57.80 .002 -.57 .17 -.92 -.23
Collaboration Yes .47 .50 -4.34 60.00 .000 -.84 .19 -1.22 -.45
No -4.46 53.26 .000 -.84 .19 -1.21 -.46
Communica-tion
Yes .00 .96 -4.71 60.00 .000 -.86 .18 -1.23 -.50
No -4.58 44.46 .000 -.86 .19 -1.24 -.48
Creativity and innovation
Yes .03 .86 -3.95 60.00 .000 -.78 .20 -1.18 -.39
No -4.03 52.01 .000 -.78 .19 -1.17 -.39
Self direction Yes .38 .54 -2.73 60.00 .008 -.55 .20 -.95 -.15
No -2.79 52.79 .007 -.55 .20 -.94 -.15
Global connections
Yes .26 .61 -.12 60.00 .905 -.03 .23 -.48 .43
No -.12 5.90 .904 -.03 .23 -.48 .42
Local connections
Yes 1.48 .23 -3.09 60.00 .003 -.66 .21 -1.08 -.23
No -2.99 43.99 .005 -.66 .22 -1.10 -.22
Technology as a tool
Yes .03 .86 -3.60 60.00 .001 -.70 .19 -1.09 -.31
No -3.65 51.39 .001 -.70 .19 -1.08 -.31
Red indicates results that were not significant.

Appendix E. Research Question 1 Data Analysis Tables
74 | Extended Professional Development in Project-Based Learning
Table A 10. Means on Practices Items for Each Skill, by PBL Use
In your teaching of your TARGET CLASS, how often have you asked students to do the following? Scale: 1 = Almost never; 2 = A few times a semester; 3 = 1–3 times per month; 4 = 1–3 times per week; 5 = Almost daily
Total mean SD
Mean no PBL or
limited PD
(n = 38)
Mean PBL with extend-
ed PD (n = 24) Effect Size
Critical thinking skills
Summarize or create their own interpretation of what they have read or been taught?
4.03 a
.89 3.84 4.33 .55 *
Draw their own conclusions based on analysis of numbers, facts, or relevant information?
3.97a .96 3.74 4.33 .62 *
Analyze competing arguments, perspectives or solutions to a problem?
3.39 1.00 3.16 3.75 .59 *
Try to solve complex problems or answer questions that have no single correct solution or answer?
3.34 1.09 3.05 3.79 .68 **
Develop a persuasive argument based on supporting evidence or reasoning?
2.97 1.12 2.61 3.50 .79 **
Compare information from different sources before completing a task or assignment?
2.92 1.18 2.82 3.08 .23 (ns)
Collaboration skills Work in pairs or small groups to complete a task together?
4.21 a
.83 3.95 4.63 .81 ***
Work with other students to set goals and create a plan for their team?
3.28 1.08 2.97 3.75 .72 **
Create joint products using contributions from each student?
3.24 1.15 2.76 4.00 1.07 ***
Present their group work to the class, teacher or others?
3.03 .96 2.76 3.46 .73 **
Work as a team to incorporate feedback on group tasks or products?
2.95 1.12 2.61 3.52 .82 ***
Give feedback to peers or assess other students’ work? 2.87 1.11 2.50 3.46 .86 ***
Communication skills Answer questions in front of an audience? 3.03 1.34 2.68 3.58 .67 **
Structure data for use in written products or oral presentations (e.g., creating charts, tables or graphs)?
2.82 1.11 2.50 3.33 .75 **
Decide how they will present their work or demonstrate their learning?
2.71 1.00 2.37 3.25 .88 ***
Convey their ideas using media other than a written paper (e.g., posters, video, blogs, etc.)
2.66 1.07 2.26 3.29 .96 ***
Prepare and deliver an oral presentation to the teacher or others?
2.44 .95 2.05 3.04 1.04 ***
Table A 10 continued next page

Appendix E. Research Question 1 Data Analysis Tables
Extended Professional Development in Project-Based Learning | 75
Table A 10. Means on Practices Items for Each Skill, by PBL Use
In your teaching of your TARGET CLASS, how often have you asked students to do the following? Scale: 1 = Almost never; 2 = A few times a semester; 3 = 1–3 times per month; 4 = 1–3 times per week; 5 = Almost daily
Total mean SD
Mean no PBL or
limited PD
(n = 38)
Mean PBL with extend-
ed PD (n = 24) Effect Size
Creativity & innovation skills Generate their own ideas about how to confront a problem or question?
3.35 1.09 3.03 3.87 .78 **
Use idea creation techniques such as brainstorming or concept mapping?
2.97 1.12 2.74 3.33 .53 *
Test out different ideas and work to improve them? 2.95 1.15 2.58 3.54 .84 ***
Invent a solution to a complex, open-ended question or problem?
2.61 1.01 2.32 3.08 .76 **
Create an original product or performance to express their ideas?
2.57 1.09 2.16 3.21 .96 ***
Self-direction skills Take initiative when confronted with a difficult problem or question?
3.42 1.17 3.21 3.75 .46 (ns, .08)
Use peer, teacher or expert feedback to revise their work?
3.11 1.33 2.89 3.46 .42 (ns, .10)
Plan the steps they will take to accomplish a complex task?
2.95 1.21 2.68 3.38 .57 *
Use specific criteria to assess the quality of their work before it is completed?
2.89 1.22 2.53 3.46 .77 **
Monitor their own progress towards completion of a complex task and modify their work accordingly?
2.81 1.23 2.55 3.21 .53 *
Choose for themselves what examples to study or resources to use?
2.65 1.17 2.45 2.96 .43 (ns, .10)
Choose their own topics of learning or questions to pursue?
2.32 1.07 2.05 2.75 .65 **
Global connection skills Reflect on how their own experiences and local issues are connected to global issues?
2.54 1.21 2.51 2.58 .06 (ns)
Understand the life experiences of people in cultures besides their own?
2.44 1.22 2.45 2.42 -.03 (ns)
Study information about other countries or cultures? 2.37 1.19 2.45 2.25 -.17 (ns)
Discuss issues related to global interdependency (for example, global environment trends, global market economy)?
2.35 1.24 2.29 2.46 .14 (ns)
Use information or ideas that come from people in other countries or cultures?
2.18 1.08 2.13 2.25 .11 (ns)
Study the geography of distant countries? 1.88 1.18 1.89 1.88 -.01 (ns)
Table A 10 continued next page

Appendix E. Research Question 1 Data Analysis Tables
76 | Extended Professional Development in Project-Based Learning
Table A 10. Means on Practices Items for Each Skill, by PBL Use
In your teaching of your TARGET CLASS, how often have you asked students to do the following? Scale: 1 = Almost never; 2 = A few times a semester; 3 = 1–3 times per month; 4 = 1–3 times per week; 5 = Almost daily
Total mean SD
Mean no PBL or
limited PD
(n = 38)
Mean PBL with extend-
ed PD (n = 24) Effect Size
Local connection skills Apply what they are learning to local situations, issues or problems?
2.74 1.19 2.50 3.13 .53 *
Investigate topics or issues that are relevant to their family or community?
2.63 1.16 2.37 3.04 .58 *
Respond to a question or task in a way that weighs the concerns of different community members or groups?
1.92 b 1.00 1.66 2.33 .68 **
Talk to one or more members of the community about a class project or activity?
1.90 .94 1.61 2.38 .82 ***
Analyze how different stakeholder groups or community members view an issue?
1.87 1.00 1.61 2.29 .69 **
Using technology as a tool for learning skills Select appropriate technology tools or resources for completing a task?
3.27 1.16 2.89 3.88 .84 ***
Use technology or the Internet for self-instruction (e.g., Kahn Academy or other videos, tutorials, self-instructional websites, etc.)?
2.94 1.32 2.61 3.46 .65 **
Use technology to analyze information (e.g., databases, spreadsheets, graphic programs, etc.)?
2.92 1.22 2.58 3.46 .72 **
Use technology to help them share information (e.g., multi-media presentations using sound or video, presentation software, blogs, podcasts, etc.)?
2.82 1.26 2.47 3.38 .71 **
Use technology to keep track of their work on extended tasks or assignments?
2.69 1.38 2.32 3.25 .67 **
Evaluate the credibility and relevance of online resources?
2.63 1.30 2.26 3.21 .73 **
Use technology to support team work or collaboration (e.g., shared work spaces, email exchanges, giving and receiving feedback, etc.)?
2.48 1.29 2.03 3.21 .92 ***
Use technology to interact directly with experts or members of local/global communities?
1.77 1.12 1.61 2.04 .39 (ns)
*** p < .001, ** p < .01, * p < .05 a
Min/Max = 2/5 b Min/Max = 1/4
NOTE: Statistical significance is based on Independent Samples t tests, available from the author.

Appendix E. Research Question 1 Data Analysis Tables
Extended Professional Development in Project-Based Learning | 77
Table A 12. Mean 21st Century Skills Z-Scores Across Subject Areas
Mathematics
(n = 23) Science
(n = 13) Social studies
(n = 13) English
(n = 13) P <
Overall -.32 -.06 .36 .26 .18 (ns)
Critical thinking skills -.10 .04 .12 .01 ns
Collaboration skills -.18 .18 -.02 .18 ns
Communication skills -.23 .13 .12 .16 ns
Creativity and innovation skills -.14 -.12 .17 .21 ns
Self-direction skills -.14 -.20 .02 .43 .17 (ns)
Making global connections -.57 -.28 1.10 .16 p < .001
Making local connections -.28 .00 .39 .12 .15 (ns)
Using technology as a tool -.12 -.03 .08 .16 ns
Table A 13. ANOVA Test of Differences in 21st Century Skills by Subject Area
Subject taught
Between groups Within groups Total
Sum of squares df
Mean square F Sig
Sum of squares df
Mean square
Sum of squares df
Overall – all skills combined 4.939 3 1.646 1.703 .176 56.061 58 .967 61 61
Critical thinking .441 3 .147 .248 .863 34.373 58 .593 34.813 61
Collaboration 1.609 3 .536 .769 .516 4.484 58 .698 42.093 61
Communication 2.004 3 .668 .986 .406 39.299 58 .678 41.303 61
Creativity & innovation 1.597 3 .532 .750 .527 41.176 58 .71 42.773 61
Self-direction 3.358 3 1.119 1.714 .174 37.881 58 .653 41.24 61
Global connections 24.67 3 8.223 22.503 .001 21.195 58 .365 45.865 61
Local connections 4.021 3 1.34 1.837 .15 42.317 58 .73 46.338 61
Using technology as a tool for learning .758 3 .253 .360 .782 4.666 58 .701 41.424 61
Red indicates results that were not significant.
Table A 11. Independent Sample T Tests for 21st Century Skills by PBL Use Within Subjects
Practice index
Equal variances assumed?
Levene's test for equality of
variances
t-test for equality of means
t df Sig.
(2-tailed) Mean
difference Std. Error difference
95% confidence interval of the
difference
F Sig. Lower Upper
Math Yes .65 .43 -3.47 21.00 .002 -1.38 .40 -2.21 -.55
No -3.25 13.59 .006 -1.38 .42 -2.29 -.47
Science Yes .30 .59 -1.87 11.00 .088 -.61 .32 -1.32 .11
No -1.89 1.99 .085 -.61 .32 -1.31 .10
Social Studies
Yes 2.54 .14 -.77 11.00 .455 -.47 .61 -1.82 .87
No -.95 9.78 .363 -.47 .50 -1.59 .64
English Yes .82 .38 -2.11 11.00 .058 -.99 .47 -2.03 .04
No -1.98 7.01 .088 -.99 .50 -2.17 .19
Red indicates results that were not significant.

Appendix E. Research Question 1 Data Analysis Tables
78 | Extended Professional Development in Project-Based Learning
Table A 14. Chi-Square Test For Distribution by PBL Category
Distribution by PBL use
Value df Asymp. Sig.
(2-sided)
Class academic performance indicator by PBL category
Pearson chi-square 2.451a 4 .653
Likelihood ratio 2.459 4 .652
Linear-by-linear association .779 1 .378
N of valid cases 60
Block scheduling by PBL category Pearson chi-square 3.352b 4 .501
Likelihood ratio 3.311 4 .507
Linear-by-linear association .016 1 .900
N of valid cases 62
Leading professional development since 2008 by PBL category
Pearson chi-square 24.731c 1 .000
Likelihood ratio 32.745 1 .000
Linear-by-linear association 24.332 1 .000
N of valid cases 62
a. 2 cells (22.2%) have expected count less than 5. The minimum expected count is 3.47. b. 3 cells (33.3%) have expected count less than 5. The minimum expected count is 1.65. c. 0 cells (.0%) have expected count less than 5. The minimum expected count is 9.29. b. Computed only for a 2x2 table.

79
Appendix F. Research Question 2 Data Analysis Tables
Covariate 1: District
Chi-Square statistics were significant when examining the variable “district” for all four
content areas. Therefore, we conducted additional Factorial ANOVAs to verify that the treat-
ment*district interaction was not significant. The following tables present the results and inter-
action effects appear in green text. None of the interaction effects were significant.
Table A 15. Factorial ANOVA Results for “District” and Dependent Variable: Math Gain
Source Type III Sum of
Squares df Mean Square F Sig.
Corrected Model 25.817a 18 1.434 3.197 .000
Intercept .012 1 .012 .027 .871 treatm 1.302 1 1.302 2.901 .090 CRQDIS 23.608 14 1.686 3.758 .000 treatm * CRQDIS .954 3 .318 .709 .548 Error 91.985 205 .449 Total 117.893 224 Corrected Total 117.802 223 a. R Squared = .219 (Adjusted R Squared = .151)
Table A 16. Factorial ANOVA Results for “District” and Dependent Variable: RLA Gain
Source Type III Sum of
Squares df Mean Square F Sig.
Corrected Model 8.966a 22 .408 .977 .493
Intercept 1.409 1 1.409 3.379 .067 treatm .019 1 .019 .046 .830 CRQDIS 6.874 18 .382 .916 .560 treatm * CRQDIS .322 3 .107 .258 .856 Error 175.600 421 .417 Total 186.503 444 Corrected Total 184.566 443 a. R Squared = .049 (Adjusted R Squared = -.001)

Appendix F. Research Question 2 Data Analysis Tables
80 | Extended Professional Development in Project-Based Learning
Table A 17. Factorial ANOVA Results for “District” and Dependent Variable: Science Gain
Source Type III Sum of
Squares df Mean Square F Sig.
Corrected Model 26.166a 15 1.744 2.882 .000
Intercept .196 1 .196 .324 .569 treatm .531 1 .531 .877 .349 CRQDIS 25.151 12 2.096 3.462 .000 treatm * CRQDIS .836 2 .418 .690 .502 Error 351.097 580 .605 Total 377.263 596 Corrected Total 377.263 595 a. R Squared = .069 (Adjusted R Squared = .045)
Table A 18. Factorial ANOVA Results for “District” and Dependent Variable: Social Studies Gain
Source Type III Sum of
Squares df Mean Square F Sig.
Corrected Model 25.693a 20 1.285 2.518 .000
Intercept 4.781 1 4.781 9.370 .002 treatm .006 1 .006 .012 .912 CRQDIS 24.160 17 1.421 2.786 .000 treatm * CRQDIS .610 2 .305 .597 .551 Error 182.145 357 .510 Total 207.841 378 Corrected Total 207.838 377 a. R Squared = .124 (Adjusted R Squared = .075)

Appendix F. Research Question 2 Data Analysis Tables
Extended Professional Development in Project-Based Learning | 81
Covariate 2: Race
Chi-Square statistics were significant when examining the variable “race” only for read-ing/language arts. Therefore, we conducted an additional Factorial ANOVA to verify that the treatment*race interaction was not significant. The following table presents the results and the interaction effect appears in green text. The interaction effect was not significant.
Table A 19. Factorial ANOVA Results for “Race” and Dependent Variable: Reading/Language Arts Gain
Source Type III Sum of
Squares df Mean Square F Sig.
Corrected Model 2.541a 5 .508 1.223 .297
Intercept .004 1 .004 .011 .917 treatm .009 1 .009 .022 .883 RACE 1.995 3 .665 1.600 .189 treatm * RACE .037 1 .037 .090 .765 Error 182.025 438 .416 Total 186.503 444 Corrected Total 184.566 443 a. R Squared = .014 (Adjusted R Squared = .003)

82


Jorea M. Marple, Ed.D.State Superintendent of Schools