extended reports high-throughput process development
TRANSCRIPT

Extended reports
Toledo, Spain — October 9-12, 2017
High-throughput process development

Contents
01 From the conference chairs 3
02 Modified batch isotherm 5 determination method for mechanistic model calibration
03 Scalability of mechanistic models 10 for ion exchange chromatography under high load conditions
04 Improving mechanistic model 14 calibration of microscale chromatography by accounting for intermittent flow
05 How cell culture automation benefits 20 upstream process development
06 Comparison of relative resin content 27 between prepacked mini- and laboratory-scale chromatography columns
07 Rapid process development of a cation 30 exchange step for a biosimilar
08 High-throughput process development 36 for aggregate removal in flow-through membrane chromatography
09 Adapting existing HTPD tools to suit 42 rapid development of affinity purification resins
10 Integrated process development: 48 case studies for high quality analysis of upstream screenings
11 Progress and challenges in 53 high-throughput stability screening at Genentech
12 Understanding RoboColumn scale 58 offsets and exploring the use of RoboColumn units as a scale-down model
13 Integration of downstream platform 63 development into a single 96-well filter plate for ultrarapid process definition
14 Towards understanding and managing 68 resin variability
15 Applications of directly scalable 73 protein A chromatography for high-throughput process development
16 Process development in the digital 79 biomanufacturing age
17 Author index 83
2

From the conference chairs
01
3

The conference series devoted to high-throughput process development (HTPD) has established itself as the leading forum within its field. After meetings in Krakow, Poland in 2010, in Avignon, France in 2012 and in Siena, Italy in 2014, the fourth HTPD meeting was held in yet another UNESCO World Heritage site — Toledo, Spain — in October 2017.
The goal of this scientific conference has not changed since the very first meeting in 2010, it is still to provide a leading forum for discussion and exchange of ideas surrounding the challenges and benefits of employing high-throughput techniques in the development of manufacturing processes for biological products. HTPD methods are now widely used in all areas of process development (PD), from upstream processing to stable formulations. To date, these methods have proven especially well-suited for the development of robust downstream processes and there are many examples of routine utilization also for upstream processes, and this area continues to rapidly evolve. However, challenges remain before the full value of HTPD methods becomes realized, and several of these challenges were discussed during the conference.
HTPD 2017 conference started with the plenary lecture ”Miniaturization in Process Development — HTPD at the Nano Scale” by Marcel Ottens, Associate Professor at Delft University of Technology in the Netherlands. The conference continued with four case study sessions that covered upstream and downstream processing as well as drug substance modifications and formulations: one session focused on smart PD and one concluding session presented frontiers in PD.
About 100 delegates from 17 different countries and 44 different companies/academic institutions could enjoy 27 oral presentations and 26 posters in total. Based on feedback, this fourth HTPD conference could be considered as the most successful HTPD event ever.
This extended abstract book captures some of the presentations and posters from this very exciting conference. We hope that this book will serve as a resource and summary of the first-rate talks and discussions, as well as encourage you to participate in future events in this HTPD conference series.
Our thanks go to the session chairs for their efforts in putting together excellent sessions, to the presenters for their contributions, and to the participants for making this a truly valuable and enjoyable event.
Philip Lester Roche
Mats Gruvegard Cytiva
Karol Łącki Avitide
4

Modified batch isotherm determination method for mechanistic model calibrationTobias Hahn1, Thiemo Huuk1, and Jürgen Hubbuch2 1 GoSilico GmbH, Karlsruhe, Germany, 2 KIT, Karlsruhe, Germany
02
5
IntroductionThe fundamental hypothesis of in silico scale-up and scale-down of chromatography methods is that only the fluid dynamics outside the pore system change. Once a sample component enters the pore system, pore diffusion, adsorption, and desorption are assumed to follow the same mechanism in a filter plate as in a production column. An adsorption isotherm determined at one scale is thus transferable to any other scale.
Isotherm determination by filter plate experiments is favorable because of its simplicity. In comparison to column experiments, fluid dynamic effects such as axial dispersion and film transfer as well as binding kinetics can be neglected due to the long incubation time.
The typical work flow for calibrating an adsorption isotherm model for further use in column experiments is to:
1. Apply the stock solutions with concentration (c0).
2. Incubate.
3. Centrifuge and measure supernatant concentration (c).
4. Assume a phase ratio and calculate adsorbed concentration (q).
5. Assume an “equivalent column volume” factor [1].
6. Estimate adsorption isotherm model parameters from q/c data.
The fifth step is necessary to account for the differences in adsorber slurry concentration, duration of the packing process, adsorber compressibility, and similar that lead to different packing densities [1].
Both, the fifth and sixth step are error-prone. In a per-well capacity study of filter plates prepared with a ResiQuot device, considerable well-to-well differences [2] and, most importantly, deviations from the expected equivalent column volume that result in wrong predictions of column experiments, could be found (Fig 1).
To solve this, we present a modified method for fitting batch isotherms to mechanistic model equations that relies only on the applied and measured supernatant concentrations. An assumption of the resin amount in the well is not needed anymore.
6

Fig 1. Fitted lysozyme isotherm model to measured data points using an equivalent column volume factor from literature (top) and resulting deviation of a predicted breakthrough curve of a column experiment (bottom).
Volume (mL)
Simulated
Experiment
Simulated
Experiment
Supernatant concentration, c (g/L)0
0 0
1
2
3
4
5
200
400
600
800
1000
1200
0 8765432115105
Ads
orbe
d co
ncen
trat
ion
per
adso
rber
ske
leto
n q
(g/L
)
A28
0 (×
104 ) a
t 10
mm
(mA
U)
Volume (mL)
Simulated
Experiment
Simulated
Experiment
Supernatant concentration, c (g/L)0
0 0
1
2
3
4
5
200
400
600
800
1000
1200
0 8765432115105A
dsor
bed
conc
entr
atio
n pe
rad
sorb
er s
kele
ton
q (g
/L)
A28
0 (×
104 ) a
t 10
mm
(mA
U)
Materials and methodsMaterials and softwareThis study was performed with lysozyme on the compressible agarose-based SP Sepharose™ FF adsorber (Cytiva, Uppsala, Sweden), a strong cat-ion exchange resin. Details on the used equipment, column and plate formats, as well as chemicals are given in Huuk et al. [2].
The fitting of model equations was accomplished with MATLAB® 2017b, column simulations were performed with the ChromX™ software [3].
7

TheoryFor the chosen ion-exchange mode, the typically chosen isotherm equation is the steric mass action (SMA) model [4]:
q = keq (Λ − (ν + σ)q)ν c,
csalt
minkeq,ν, σ ||qmeasured − qmodel (keq )||., ν, σ
1 − ε
1 − εminkeq,ν, σ, ε || ε (c0 − c) − qmodel (keq )||.
qmeasured = ε (c0 − c) and the objective function to
,ν,σ
qmodel = keq ( Λ − (ν + σ)q )ν
(c0 − 1 − ε
qmodel).εcsalt + 1 − ε νqε
Where Λ is the scale-independent ionic capacity per adsorber skeleton volume and keq, ν, and σ are protein specific parameters that are determined by curve fitting with the objective function
The measured q is calculated from the difference of applied protein concentration (c0) and measured supernatant concentration (c) after centrifugation using an assumption on the phase ratio. Introducing a porosity parameter (ε), defined as the ratio of fluid volume to whole well volume, we can write q as
With ε as new model parameter, we can substitute c in the SMA equation to allow an easier solution of the fix point equation q = f(q) and also account for the increase in the salt concentration due to protein binding:
ResultsAs shown in Figure 1, fitting an isotherm equation to uncorrected q/c data points using common assumptions lead to an offset between column simulation and measurement. In Huuk et al. [2], it could be shown that an individual correction of the data points, using per-well ionic capacity measurements, lead to an equivalent column volume factor of 1.3 and a much better agreement of simulation and measurement. In comparison, the equivalent column volume factor of 1.6 reported in Bergander and Łącki [1] lead to a too low concentration of q, inaccurate model parameters, and no transferability from one scale to the other.
0 5 10 15 20 25 30
Sample concentration, c0 (g/L)
0
200
400
600
800
1000
1200
Ads
orbe
d co
ncen
trat
ion
per
adso
rber
ske
leto
n q
(g/L
)
Estimation-based corrected measurementsUncorrected measurements
Estimated isothermHistidine-corrected measurements
Fig 2. Fitted lysozyme isotherm model (green line) to measured data points (green points) resulting after estimation of well porosity. Bound protein concentration values from Figure 1 are shown in orange and per-well corrected values in blue.
8

When re-estimating the isotherm parameters and the newly introduced porosity parameter (ε), the resulting q values were again higher than the originally obtained ones but in average lower than the per-well corrected values (Fig 2).
The resulting simulated breakthrough curve agreed very well with the observed. The saturation capacity (qmax) per adsorber skeleton determined from the measured breakthrough curve was 1020 g/L. In comparison, the new method based on porosity estimation resulted in 1008 g/L, which is closer than the value of 1040 g/L obtained from individual well correction in Huuk et al. [2]. The simulation in Figure 1, using an equivalent column volume factor of 1.6, was 900 g/L.
When evaluating the least squares curve fitting residual in an interval around the estimated well porosity, a unique minimum could be found (Fig 3) that indicates that the porosity value is uniquely determinable. This is intuitively clear as different adsorber amounts resulting from varying ε lead to different c0, c pairs that would deviate from the measured pairs.
Leas
t sq
uare
s re
sidu
al (×
10-3
)
Porosity, ε0.97
0
1
2
3
4
5
6
7
0.975 0.98 0.985 0.99 0.995 1
Fig 3. Least squares residual error plotted over porosity values from 0.97 to 1, showing a clearly defined optimum.
SummaryUsing the presented method, average well porosities in a 96-well plate filled with SP Sepharose FF could be determined from a single isotherm at constant buffer salt concentration. A manual calculation of the bound protein concentration using assumptions of the phase ratio is not needed anymore. The resulting binding capacity follows the same trend as correcting each well individually, using ionic capacity measurements. Finally, the obtained isotherm parameters could be used successfully to predict a breakthrough curve on a lab-scale column. This confirms the initial hypothesis that protein adsorption follows the same mechanisms in batch and column chromatography and that isotherm model parameters are transferable from one scale to another.
References1. Bergander, T. and Łącki, K.M. High-throughput process development:
chromatography media volume definition. Eng Life Sci 16, 185–189 (2015).
2. Huuk, T.C., Briskot, T., Hahn, T., and Hubbuch, J. A versatile noninvasive method for adsorber quantification in batch and column chromatography based on the ionic capacity. Biotechnol Prog 32, 666–677 (2016).
3. Hahn, T., Huuk, T.C., Heuveline, V., and Hubbuch, J. Simulating and optimizing preparative protein chromatography with ChromX. J Chem Educ 92, 1497–1502 (2015).
4. Brooks, C.A. and Cramer, S.M. Steric mass-action ion exchange: Displacement profiles and induced salt gradients. AIChE J 38, 1969–1978 (1992).
9

Scalability of mechanistic models for ion exchange chromatography under high load conditionsThiemo Huuk1, Tobias Hahn1, Jan Griesbach2, Stefan Hepbildikler3, and Jürgen Hubbuch4
1 GoSilico GmbH, Karlsruhe, Germany 2 F. Hoffmann-La Roche Ltd, Basel, Switzerland 3 Roche Diagnostics GmbH, Penzberg, Germany 4 KIT, Karlsruhe, Germany
03
10

IntroductionThe majority of downstream processes (DSP) for biopharmaceuticals are nowadays based on chromatographic separation techniques. Future DSP has to meet the evolving expectations of regulators, such as a mechanistic process understanding proposed within the quality by design (QbD) framework. The most sophisticated approach to develop a mechanistic process understanding is the implementation of fundamental models for chromatography. To implement these models under real industrial conditions, the models need to be able to predict the highly overloaded conditions in preparative purification tasks. A second challenge is the transferability of model parameters between different column scales, which is important for process scale-up and the incorporation of small-scale data.
This paper presents an industrial case study on an intermediate purification of a monoclonal antibody based on high-protein-load-density ion exchange chromatography. Under the prevailing circumstances of a high protein load density and a low salt concentration in the protein sample, an unusual elution peak shape can be observed. This phenomenon cannot be modeled with the commonly used equations for ion exchange chromatography.
Materials and methodsThe case study covers a range of experimental systems from commonly used 16 mL lab scale and 1 mL small-scale columns, down to the 0.6 mL RoboColumn™ format. The experiments in 1 and 16 mL scale were carried out using an ÄKTApurifier 10, the RoboColumn experiments with a Tecan Freedom EVO™ liquid handling station. The POROS™ 50HS adsorber was used for this cation exchange step. The running buffer for all experiments was a 10 mM sodium citrate buffer at pH 5.0 with additional sodium chloride.
The monoclonal antibody is of IgG class and derived from Chinese hamster ovary (CHO) cell cultivation. The mAb pool was purified by preparative affinity chromatography. The antibody concentration was 12.7 g/L, with a monomer content of 98.3%, as quantified by size exclusion chromatography (SEC). Chromatogram simulation and isotherm parameter estimation were carried out using GoSilico’s ChromX software [1]. ChromX provides the functionality to create models from raw chromatograms and allows in silico process scale-up/scale-down.
11

ResultsModel calibrationUnder low load conditions, a typical Gaussian peak shape can be observed that transforms into a trapezoidal shape with increasing load (Fig 1). Using Mollerup’s generalized ion exchange isotherm (GIEX) [2], the observed elution peak shapes could be recovered.
To this end, the GIEX isotherm introduced two additional parameters compared to the commonly applied SMA isotherm [3] to approximate the asymmetric activity coefficient:
It could be shown that the parameters can be determined by inverse peak fitting [4] (Fig 1). In consequence, the further process development can be performed fast and easy in silico. For a derivation of the isotherm models and detailed parameter interpretation, the reader is referred to the references by Mollerup [2], Brooks and Cramer [3], and Huuk et al. [4].
Parameter qualityWhile the model fits (Fig 1) and predictions (Fig 2) are very good, the median difference of the estimated parameters from 16 mL to 0.6 mL scale is 12%, and 20% from 16 mL to 1 mL scale. However, most parameters of the 0.6 and 1 mL scales lie within the 95% confidence intervals of the 16 mL scale. This means, the parameter estimates are at least transferable and probably even identical. Only kp is not well identified.
Table 1. 95% confidence intervals (CI) of 16 mL parameter estimates and deviations of the estimated parameter values from 0.6 mL and 1 mL experiments
Parameter95% confidence interval of 16 mL scale estimates
Parameter value deviation from 0.6 mL to 16 mL scale
Parameter value deviation from 1 mL to 16 mL scale
keff ± 7% - 13% - 20%
kkin ± 78% - 48% - 41%
keq ± 20% + 12% + 32%
ν ± 4% - 2% + 3%
σ ± 0% - 1% + 5%
kp ± 8% - 47% - 293%
ksalt ± 4% + 0% + 1%
(A) (C)(B)
Fig 1. Example chromatograms at equal residence time, salt concentrations, and column loading in 16 mL scale (A), 1 mL scale (B), and 0.6 mL scale (C). Simulations are plotted in color, measurements in dark blue.
γ = ekpc + ksaltcsalt .~Volume (mL)
Pro
tein
(mA
U)
Salt
(M)
0 4 12 200
600
1200
1800
2400
3000
0
0.1
0.2
0.3
0.4
0.5
168
Volume (mL)
Pro
tein
(mA
U)
Salt
(M)
0 120 240 360 480 6000
200
400
600
800
1000
0
0.1
0.2
0.3
0.4
0.5
Volume (mL)
Pro
tein
(mA
U)
Salt
(M)
0 6 12 18 24 300
200
400
600
800
1000
0
0.1
0.2
0.3
0.4
0.5
salt kkin ∂qi = keq
(Λ − ∑n
(νj + σj)qj)
ν γcp − c
ν q,j=1∂t~
12

Fig 2. 16 mL simulation (orange) repeated using model parameters from 1 mL scale (green) and RoboColumn scale (blue) under low load density (A) and high load density (B, C). UV measurements are shown in dark gray.
Volume (mL)
Pro
tein
(mA
U)
Salt
(M)
0 100 200 300 4000
250
500
750
1000
0
0.1
0.2
0.3
0.4
0.5
Volume (mL)
Pro
tein
(mA
U)
Salt
(M)
0 100 200 3000
300
600
900
1200
0
0.1
0.2
0.3
0.4
0.5
Volume (mL)
Prot
ein
(mA
U)
Salt
(M)
0 150 300 450 6000
400
800
1200
1600
0
0.1
0.2
0.3
0.4
0.5
(A) (C)(B)
In silico scale-upTo demonstrate that the adsorption model is indeed scale-invariant, the estimated model parameters from the 1 mL and 0.6 mL scale were applied for the prediction of the elution behavior on the 16 mL scale (Fig 2). Just the column dimensions, porosity, and ionic capacity remain scale-dependent and were determined separately [4]. From visual inspection of Figure 2, it is obvious that the differences in model parameters lead only to minor changes in the simulated chromatograms. Hence, the differences in peak shape when scaling up (Fig 1, right to left) can be accurately predicted under the assumption that the thermodynamic properties of the system stay constant.
Summary and outlookThis case study supports the fundamental assumption of in silico scale-up and scale-down of chromatography, that only the fluid dynamics outside the pore system change. Once inside the pores, the same mechanism applies to robotic and laboratory-scale columns. Even for the observed complex adsorption behavior, the models calibrated from three gradients at 0.6 and 1 mL scale were able to accurately predict the 16 mL scale. A further scale-up to pilot and production scale is expected to work successfully as well.
References1. Hahn, T., Huuk, T. C., Heuveline, V., and Hubbuch, J., Simulating and optimizing
preparative protein chromatography with ChromX. J Chem Educ 92, 1497–1502 (2015).
2. Mollerup, J. M. A review of the thermodynamics of protein association to ligands, protein adsorption, and adsorption isotherms. Chem Eng Technol 31, 864–874 (2008).
3. Brooks, C. A. and Cramer, S. M. Steric mass-action ion exchange: displacement profiles and induced salt gradients. AIChE J 38, 1969–1978 (1992).
4. Huuk, T. C., Hahn, T., Doninger, K., Griesbach, J., Hepbildikler S., and Hubbuch, J. Modeling of complex antibody elution behavior under high protein load densities in ion exchange chromatography using an asymmetric activity coefficient. Biotechnol J 12 10.1002/biot.201600336 (2017).
13

Improving mechanistic model calibration of microscale chromatography by accounting for intermittent flowNicholas Whitelock1, Milan Mijajlovic1, Vladimir Zivkovic1, Razwan Hanif 2, and Mari Spitali 2
1 BBTC, Newcastle University, Newcastle Upon Tyne, NE1 7RU, GB
2 UCB, 638 Ajax Avenue, Slough, SL1 4BG, GB
04
14

• Below working volume.
• No even meniscus.
• Drop is not accurately measured by single-point UV absorption.
• Above working volume.
• Meniscus is level.
• Drop can be accuratelymeasured by single-pointUV absorption.
Abs
orba
nce
(AU
/µL)
Volume (µL)
0 500 1000 1500
0
0.005
0.010
0.015
Fig 1. Demonstration of how prefilling collection plates and using PABA allowed dropwise resolution for pulse tests. (A) Visual representation of minimum working volume of well, demonstrating how working below minimum volume leads to inaccurate measurement. (B) A single pulse test performed on a 600 μL column using PABA at dropwise resolution achieved by prefilling the wells.
(A)
(B)
Microscale chromatography is a powerful tool in process development, providing the opportunity to perform a large number of experiments with reduced material, labor, and time consumption. However, there are numerous differences apparent in microscale chromatography that are not seen at laboratory-scale and above, such as poor resolution, low superficial flow velocities, and intermittent flow, which inhibits the quality, interpretation, and application of microscale data to larger systems.
Mechanistic models have simulated a wide variety of chromatographic systems for the purposes of understanding, improving, and scaling processes. We have employed a general rate model (GRM) and methods for improved resolution in order to mitigate the scale and operation artefacts often seen in microscale chromatography data.
Improving resolution The lowest resolution one can achieve with liquid handler-operated microscale columns is usually determined by the minimum working volume of the collection vessel, often 96-well plates. Fractions with volumes beneath this minimum will not exhibit an even meniscus, and therefore cannot be accurately measured by the single-point UV spectrometry used to measure volume and infer protein concentration (Fig 1A). There have been many creative approaches to improve upon this, including sampling the fractions into 384-well plates (Evans, Stewart et al. 2017) and staggering collection points for multiple equivalent columns (Osberghaus, Drechsel et al. 2012). We have prefilled the wells with buffer above their minimum working volume, allowing all subsequent drops to meet this minimum volume threshold. This approach, when paired with changing the UV analytes from a volatile, weakly UV absorbing compound (acetone) to a non-volatile, strongly UV absorbing compound (para-aminobenzoic acid [PABA]), has allowed us to reduce fraction volumes, and therefore resolution, to a single drop for individual columns on conventional 96-well plates (Fig 1B).
• Below working volume
• No even meniscus
• Drop is not accurately measured by single-point UV absorption
• Below working volume.
• No even meniscus.
• Drop is not accurately measured by single-point UV absorption.
• Above working volume.
• Meniscus is level.
• Drop can be accuratelymeasured by single-pointUV absorption.
Abs
orba
nce
(AU
/µL)
Volume (µL)
0 500 1000 1500
0
0.005
0.010
0.015
• Above working volume
• Meniscus is level
• Drop can be accurately measured by single-point UV absorption
15
0
10
20
30
40
50
60
70
80
90
100
0 10 20 30 40 50 60 70 80 90
Bre
akth
roug
h (%
)
Load challenge (mg/mL)
IgG A 160s
IgG A 160s paused
0
10
20
30
40
50
60
70
80
90
100
0 10 20 30 40 50 60 70 80 90
Bre
akth
roug
h (%
)
Load challenge (mg/mL)
IgG A 240s
IgG A 240s paused
0
10
20
30
40
50
60
70
80
90
100
0 10 20 30 40 50 60 70 80 90
Bre
akth
roug
h (%
)
Load challenge (mg/mL)
160s microscale
240s microscale
480s microscale
0
10
20
30
40
50
60
70
80
90
100
0 10 20 30 40 50 60 70 80 90
Bre
akth
roug
h (%
)
Load challenge (mg/mL)
IgG A 480s
IgG A 480s paused
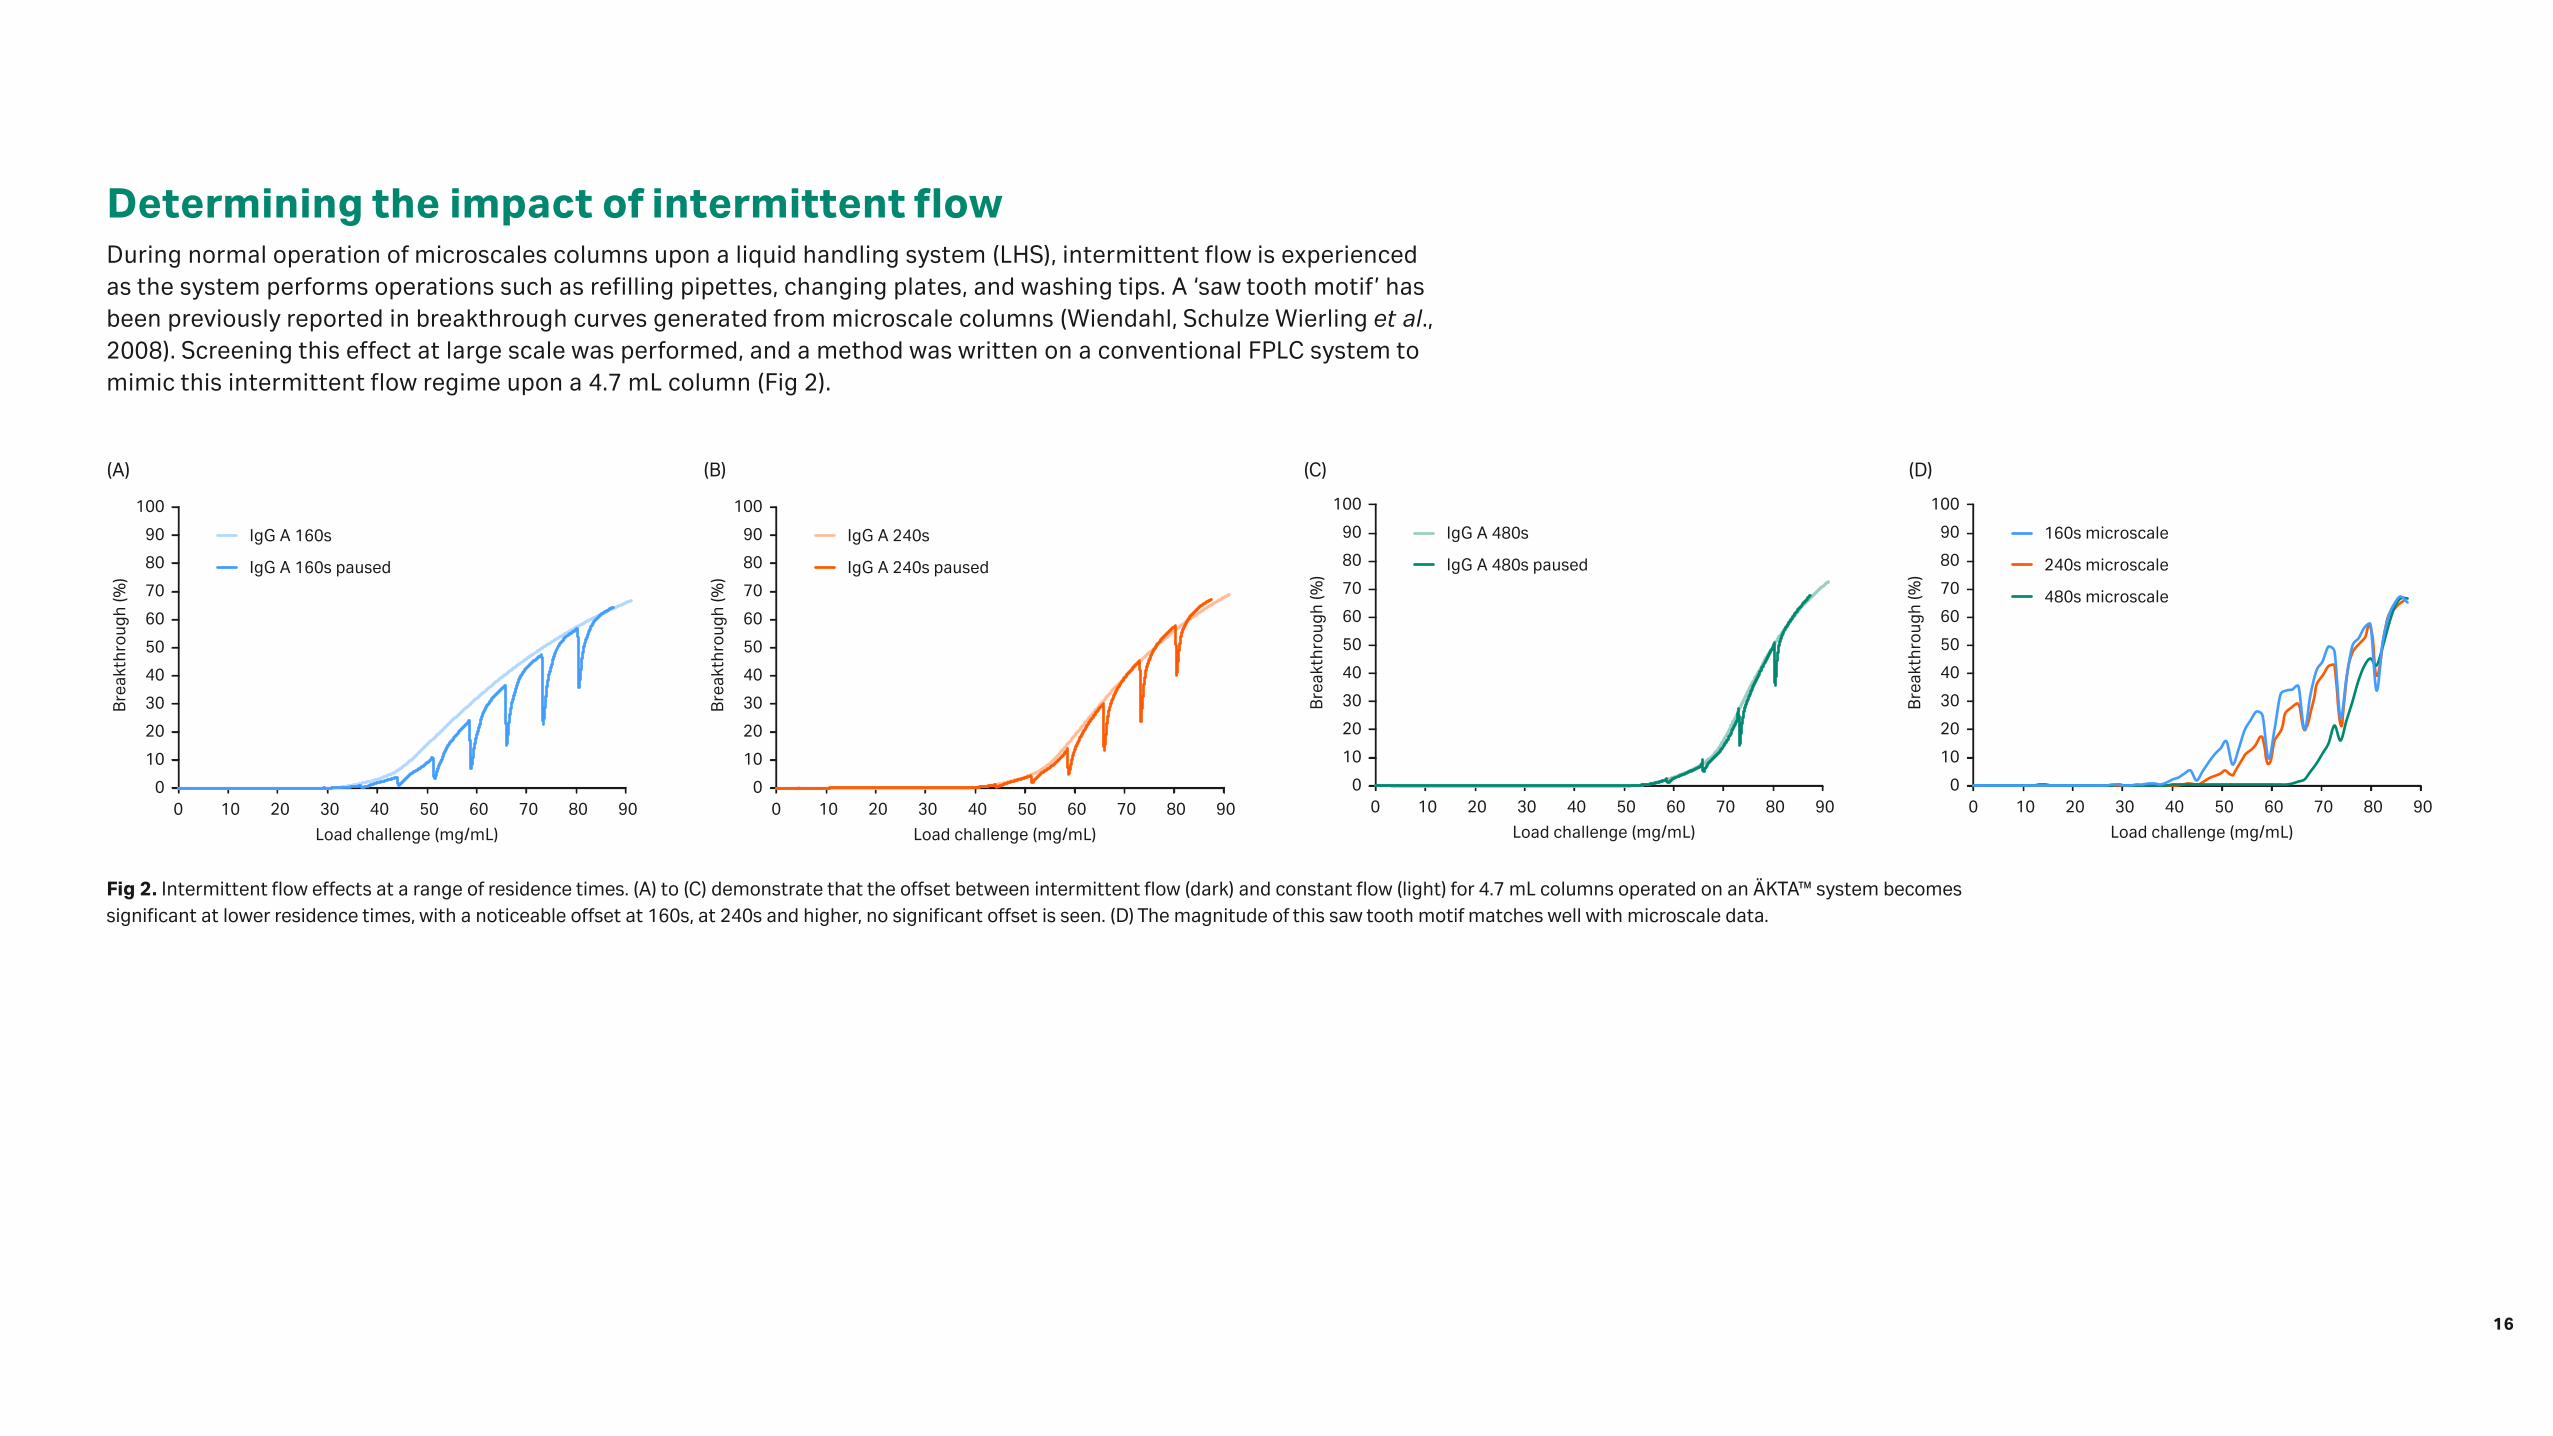
Fig 2. Intermittent flow effects at a range of residence times. (A) to (C) demonstrate that the offset between intermittent flow (dark) and constant flow (light) for 4.7 mL columns operated on an ÄKTA™ system becomes significant at lower residence times, with a noticeable offset at 160s, at 240s and higher, no significant offset is seen. (D) The magnitude of this saw tooth motif matches well with microscale data.
(C) (D)
Determining the impact of intermittent flowDuring normal operation of microscales columns upon a liquid handling system (LHS), intermittent flow is experienced as the system performs operations such as refilling pipettes, changing plates, and washing tips. A ‘saw tooth motif’ has been previously reported in breakthrough curves generated from microscale columns (Wiendahl, Schulze Wierling et al., 2008). Screening this effect at large scale was performed, and a method was written on a conventional FPLC system to mimic this intermittent flow regime upon a 4.7 mL column (Fig 2).
0
10
20
30
40
50
60
70
80
90
100
0 10 20 30 40 50 60 70 80 90
Bre
akth
roug
h (%
)
Load challenge (mg/mL)
IgG A 160s
IgG A 160s paused
0
10
20
30
40
50
60
70
80
90
100
0 10 20 30 40 50 60 70 80 90
Bre
akth
roug
h (%
)
Load challenge (mg/mL)
IgG A 240s
IgG A 240s paused
0
10
20
30
40
50
60
70
80
90
100
0 10 20 30 40 50 60 70 80 90
Bre
akth
roug
h (%
)
Load challenge (mg/mL)
160s microscale
240s microscale
480s microscale
0
10
20
30
40
50
60
70
80
90
100
0 10 20 30 40 50 60 70 80 90
Bre
akth
roug
h (%
)
Load challenge (mg/mL)
IgG A 480s
IgG A 480s paused
(A) (B)
16

Convection(u)
Film diffusion
Convection
∂c= − u + − (c − cp )|r = rp
Dax∂t
Transfer with resin particles
Axial dispersion
Sorption
Pore diffusion
(kf)
Adsorption (Keq, Qmax)
Axial dispersion(Dax)
Pore diffusion(Dp)∂cp = � �+ −− Dp∂t
1
βp
∂q
∂t
2 ∂cp
rp ∂r
∂2cp
∂r2
∂c
∂z
∂2c
∂z2
3 kf
βc rp
(A) (B)
Model calibrationThe GRM is one of the more comprehensive models of chromatography, with terms describing most significant mass transfer resistances, such as pore diffusion, film diffusion, axial dispersion and convection, the bed characteristics (column porosity and particle porosity), as well as the adsorption isotherm (binding capacity and equilibrium coefficient). For accurate models, all of these terms must be estimated, either by engineering correlations or by empirical results (Fig 3).
Fig 3. The general rate model (GRM). (A) The GRM mass balance equations. (B) Schematic describing the significant mass transfer resistances in preparative chromatography, and the parameters describing them in the GRM.
Convection(u)
Film diffusion
Convection
∂c= − u + − (c − cp )|r = rp
Dax∂t
Transfer with resin particles
Axial dispersion
Sorption
Pore diffusion
(kf)
Adsorption (Keq, Qmax)
Axial dispersion(Dax)
Pore diffusion(Dp)∂cp = � �+ −− Dp∂t
1
βp
∂q
∂t
2 ∂cp
rp ∂r
∂2cp
∂r2
∂c
∂z
∂2c
∂z2
3 kf
βc rp
17

0
10
20
30
40
50
60
70
80
90
0 20 40 60 80
Bre
akth
roug
h (%
)
Load challenge (mg/mL)
160s microscale 480s microscale
160s large scale 480s large scale
0
20
40
60
80
100
0 20 40 60 80
Bre
akth
roug
h (%
)
Load challenge (mg/mL)
Experimental 160s Simulated 160s
Experimental 480s Simulated 480s
0
10
20
30
40
50
60
70
80
90
0 20 40 60 80
Bre
akth
roug
h (%
)
Load challenge (mg/mL)
160s microscale 480s microscale
160s large scale 480s large scale
0
20
40
60
80
100
0 20 40 60 80
Bre
akth
roug
h (%
)
Load challenge (mg/mL)
Experimental 160s Simulated 160s
Experimental 480s Simulated 480s
0
10
20
30
40
50
60
70
80
0 20 40 60 80
Bre
akth
roug
h (%
)
Load challenge (mg/mL)
Simulated 160sExperimental 160s
Simulated 480sExperimental 480s
Using the high-resolution pulse tests, one can fit the bed characteristics by using a range of pulse agents: a small molecule (PABA) able to rapidly diffuse into the particle structure gives a measurement of total porosity; a large molecule (dextran 2 000 000) that is sterically hindered from entering the pore network provides a measure of bed porosity; and the target protein under non-binding conditions provides a measurement of how much of the total pore network the molecule can diffuse into. The adsorption isotherm was determined by batch studies, and two breakthrough experiments calibrated the pore diffusion coefficient, with the film diffusion coefficient estimated using established correlations. Simulation of the model was achieved using the chromatography analysis and design toolkit (CADET) (von Lieres and Andersson 2010), with an optimization scheme in MATLAB fitting the mass transfer parameters using the inverse method (Fig 4).
Using this microscale model, one could remove the intermittent flow and simulate for the bed parameters and flow-dependant mass transfer resistances at scale. This model, calibrated with microscale breakthrough experiments, microscale pulse experiments, adsorption isotherm, and large-scale pulse data (using small volumes of material), could predict breakthrough behavior at scale, at a range of flow rates, offering a significant improvement to directly comparing microscale to larger scale data (Fig 5).
This approach has enabled one to account for and mititgate the scale, system, and operational effects seen with microscale data, and build more accurate models, predicting large-scale behavior with microscale data.
Fig 4. Model of 600 μL protein A columns at two breakthroughs, demonstrating fitting of the ‘saw tooth’ motif. The model was formulated to simulate no flow for certain times, determined by measuring the length of time taken for the LHS to perform certain operations (plate changes, pipette filling, and tip washing).
Fig 5. Predictive large-scale model. When comparing (A) the raw microscale data to large scale data, (B) the predictive large-scale model when compared to experimental data demonstrates a significant improvement.
(A)
(B)
18

References1. Evans et al. Optimization of a micro-scale, high throughput process development tool and the demonstration of
comparable process performance and product quality with biopharmaceutical manufacturing processes. Journal of Chromatography A 1506, 73–81 (2017).
2. Osberghaus et al. Model-integrated process development demonstrated on the optimization of a robotic cation exchange step. Chemical Engineering Science 76, 129–139 (2012).
3. von Lieres, E. and Andersson, J. A fast and accurate solver for the general rate model of column liquid chromatography. Computers & Chemical Engineering 34, 1180–1191 (2010).
4. Wiendahl et al. High Throughput Screening for the Design and Optimization of Chromatographic Processes — Miniaturization, Automation and Parallelization of Breakthrough and Elution Studies. Chemical Engineering & Technology 31, 893–903 (2008).
19

How cell culture automation benefits upstream process developmentCarsten Musmann
Roche Diagnostics GmbH, Pharma Biotech Production and Development, Penzberg, Germany, 82377
05
20

BackgroundWe developed an automated, multi-well plate (MWP)-based screening system for suspension cell cultures (Fig 1), which is now routinely used in late-stage cell culture process development. The system is characterized by a fully automated workflow with integrated analytical instrumentation. It uses shaken 6–24-well plates as bioreactors, which can be run in batch and fed-batch mode with a capacity of up to 576 bioreactors in parallel [1–3]. With these features, the system enables:
• High degree of parallelization and automation
• Sophisticated experimental designs (i.e., design of experiments [DoE])
• Statistically sound data sets based on a large number of replicates
• Deeper process understanding for increased process control
A wide-ranging analytical portfolio to monitor cell culture performance is an integrated part of the system. Product quality is characterized in collaboration with internal high-throughput (HT) analytics groups. In addition, the use and the benefits of spectroscopic methods for cell culture automation was shown in the past [4, 5].
Incubation Cell seedingCell feeding
SamplingAssay preparation
Cell staining (i.e., growth,viability, apoptosis)
Nutrients, metabolitesProduct concentration
Automated plate handler
Automated microtiterplate incubator
Modular analyticalinstrumentation
Automatedpipetting platform
Fig 1. Schematic illustration of the automated cell culture system. Only the core system is shown with a robotic plate handler as key device, connecting cultivation, processing, and analytical parts.
21
Shake flask
Fractional factorial design
Potential of robotics
Increased throughput enables broader screening combined with statistically sound data sets
Full factorial design with enhanced parameter space and replicates
Increase probability to find the most promising parameter
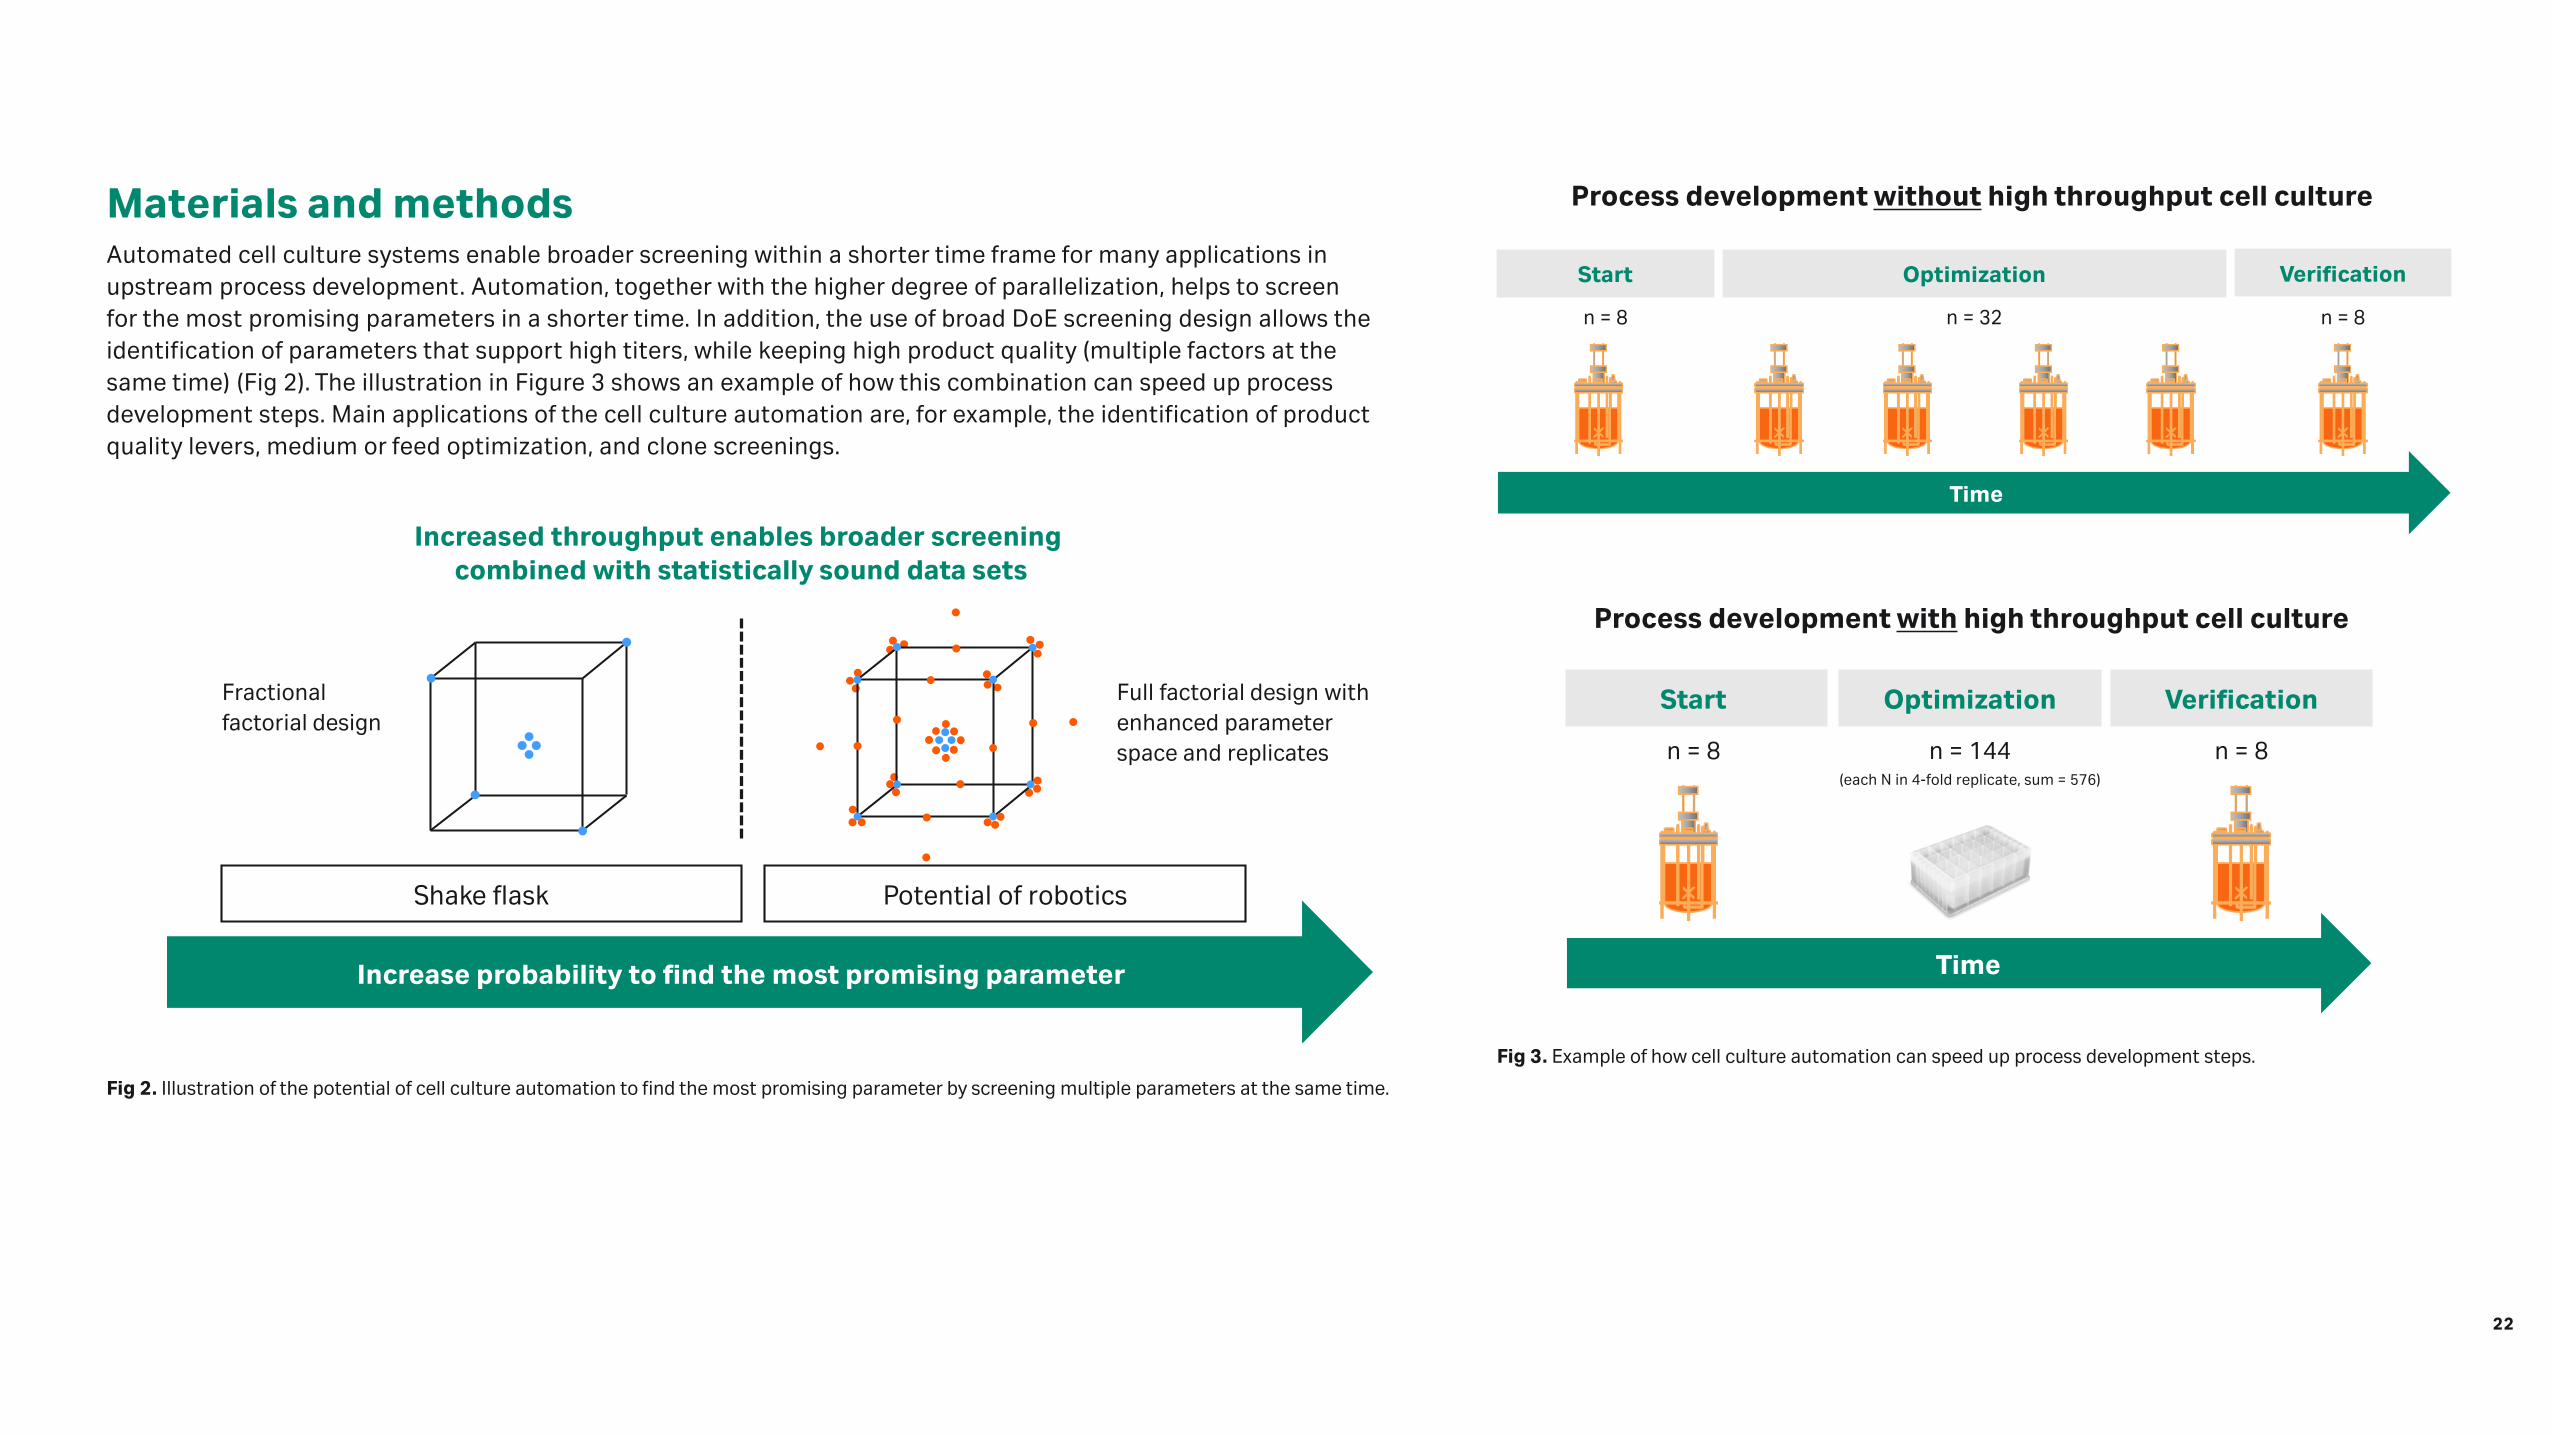
Fig 2. Illustration of the potential of cell culture automation to find the most promising parameter by screening multiple parameters at the same time.
Materials and methodsAutomated cell culture systems enable broader screening within a shorter time frame for many applications in upstream process development. Automation, together with the higher degree of parallelization, helps to screen for the most promising parameters in a shorter time. In addition, the use of broad DoE screening design allows the identification of parameters that support high titers, while keeping high product quality (multiple factors at the same time) (Fig 2). The illustration in Figure 3 shows an example of how this combination can speed up process development steps. Main applications of the cell culture automation are, for example, the identification of product quality levers, medium or feed optimization, and clone screenings.
Start Optimization
n = 8 n = 8
Verification
Time
n = 32
Start Optimization Verification
n = 8 n = 8n = 144(each N in 4-fold replicate, sum = 576)
Time
Process development with high throughput cell culture
Start Optimization
n = 8 n = 8
Verification
Time
n = 32
Start Optimization Verification
n = 8 n = 8n = 144(each N in 4-fold replicate, sum = 576)
Time
Process development with high throughput cell culture
Fig 3. Example of how cell culture automation can speed up process development steps.
Process development without high throughput cell culture
Process development with high throughput cell culture
22

SHARC createsworklists and
controls VWorks
VWorks controlsrobotic system
VWorks Automation Control
Import raw data and barcode files
Result exportfor experiment
evaluation
Database
SHARC (process control system)
Cel
l den
sity
(%)
Process time (h)
Automated microtiterplate incubator
Automated pipetting platform
Modular analyticalinstrumentation
Fig 4. Data workflow controlled by the in-house developed process control system called SHARC (software for high throughput applications using robotics).
The handling of big data is one of the most challenging points for every high-throughput system. To overcome these challenges, the SHARC (software for high throughput applications using robotics) process control system for high-throughput systems was developed. SHARC controls all data-related experiment steps from planning to execution and evaluation. Figure 4 shows the data workflows controlled by SHARC.
ResultsThe application of the cell culture automation is shown, using three examples of late-stage upstream process development.
In the first application, the goal was to identify levers to reduce trisulfides. By a screening of 39 conditions in parallel (in 4-fold replication, 158 wells in sum), a reduction of trisulfides by 97.5% (normalized to start level) was possible. In addition, the levers for trisulfide reduction were identified. The best and start conditions were verified in bioreactor scale (Fig 5).
The goal in the second application was to increase product concentration without impacting product quality. By a screening of 54 conditions in parallel (in 4-fold replication, 216 wells in sum), the increase in titer from 1.5 to 3.7 g/L (factor of > 2) was possible by medium platform change and medium optimization. Any impact on product quality could not be seen. The best conditions were also verified in bioreactor scale (Fig 6).
23

Optimization Verification
n = 4 n = 54 n = 2
Start
Pro
duct
con
cent
rati
on (g
/L)
0
1
2
3
4
3.7 g/L
1.5 g/L
(each N in 4-fold replicate, sum = 216)
146%increase
0
20
40
60
80
100 100% (Normalized)
Optimization Verification
n = 4 n = 39 n = 8
Start
Nor
mal
ized
tri
sulfi
des
(%)
2.5%(Normalized)
(each N in 4-fold replicate, sum = 156)
97.5%reduction
Fig 5. Application of the automated cell culture system in the identification of product quality levers. The orange bars show the starting point of the development step in bioreactor scale. The green bars show the results of the optimization step in the automated cell culture system. The blue bars show the results of the corresponding verification steps in the bioreactor scale. The trisulfide level is normalized to the highest trisulfide level of the bioreactors at the starting point.
Fig 6. Application of the automated cell culture system in the field of titer optimization. The orange bars show the starting point of the development step in bioreactor scale. The green bars show the results of the optimization step in the automated cell culture system. The blue bars show the results of the corresponding verification steps in the bioreactor scale.
24

0
1
2
3
4
5 (each N in 4-fold replicate, sum = 480) (each N in 4-fold replicate, sum = 216)
Screening
n = 120
Pro
duct
con
cent
rati
on (g
/L)
Optimization
n = 54
31%increase
106%increase
Clo
ne 0
1
Clo
ne 0
2
Clo
ne 0
3
Clo
ne 0
4
Clo
ne 0
5
Clo
ne 0
6
Clo
ne 0
7
Clo
ne 0
8
Clo
ne 0
9
Clo
ne 1
0
Clo
ne 1
2
Clo
ne 1
1
Clo
ne 1
3
Clo
ne 1
4
Clo
ne 1
6
Clo
ne 0
1
Clo
ne 0
2
Clo
ne 0
4
Clo
ne 0
5
Clo
ne 0
6
Clo
ne 0
9
Clo
ne 1
6
Clo
ne 1
5
Fig 7. Application of the automated cell culture system in advanced clone screening. The illustration shows a combination of clone screening and process optimization in one experiment followed by a second optimization step. The bar color characterizes the clone, and the different bars for the same color describes different process conditions.
The third application is the use of the automated cell culture system in advanced clone screening, a combination of clone evaluation and process optimization in one step. The goal was to identify the top clone under optimized fed-batch conditions. Altogether, 16 clones were evaluated with up to 9 different process conditions per clone. In sum, 120 different conditions were tested (in 4-fold replication, 480 wells in sum) in the first step. In that setup, for example, a titer increase of 106% could be seen between the best and the worse condition for the same clone. In a second step, another process optimization was performed for the top 7 clones and in sum 54 conditions (in 4-fold replication, 216 wells in sum). With that, an additionally titer increase of 31% was possible for the same clones as in the first step (Fig 7).
ConclusionThe benefits of using cell culture automation in late-stage process development were shown, using three examples of current applications. For this purpose, the experimental results of the development work of three projects, using the in-house developed automated cell culture system, were shown. The first example shows the capability of the automated cell culture system by significantly reducing trisulfides in just one experiment. For the second project, the final product concentration could be increased by a factor of 2.5 by a medium screening and changing to the in-house medium platform. The last project demonstrates the capability to perform a clone screening and a process optimization in one step. For all applications, the automated cell culture system was predictive for the standard bioreactor.
These three examples show the potential of cell culture automation as a routine tool in process development.
25

AcknowledgementsThe author would like to thank the cell culture automation team (J. Hoffmann, G. Pechmann, C. Schuster), all internship and diploma students (S. Spielmann, K. Müller, B. Frommeyer, J. Wisbauer, A. Gutknecht), former members of the cell culture automation team (K. Joeris, S. Markert), the Roche Penzberg pilot plant team, and all Roche Penzberg portfolio project teams.
References1. Markert, S., Joeris, K. Development of an automated, multiwell plate based screening system for suspension cell
culture. BMC Proc 5 (Suppl 8): O9 (2011).
2. Markert, S., Musmann, C., Joeris, K. Development and application of an automated, multiwell plate based screening system for suspension cell culture. BMC Proc 7 (Suppl 6) P113 (2013).
3. Markert, S., Joeris, K. Establishment of a fully automated microtiter plate-based system for suspension cell culture and its application for enhanced process optimization. Biotechnol Bioeng. 114, 113-121 (2017).
4. Musmann, C., Joeris, K., Markert, S. Spectroscopic tools for an automated suspension cell culture screening system. BMC Proc 9 (Suppl 9): P31 (2015).
5. Musmann, C., Joeris, K., Markert, S., Solle, D., Scheper, T. A review of spectroscopic methods for high-throughput characterization of mammalian cell cultures in automated cell culture systems. Engineering in Life Sciences 16 (2015).
26

06
Comparison of relative resin content between prepacked mini- and laboratory-scale chromatography columnsElin Monie, Anna Mattsson, Tryggve Bergander, Anna Grönberg, and Eva HeldinCytiva Sweden AB, Björkgatan 30, 751 84 Uppsala, Sweden
27

IntroductionUnderstanding the differences between column formats is key when validating conclusions made in small process development formats. Prepacked laboratory-scale columns and mini-columns have different geometry and production method, causing differences in the resin dry weight content (DWC) that might impact the results when changing format. In this study, aliquots of the same resin lot were packed into both mini- (PreDictor™ RoboColumn units) and laboratory-scale (HiScreen™ columns) column formats. Dynamic binding capacity (DBC) of two different resins, Capto™ Q and Capto Q ImpRes, for a model protein at different residence time (RT) was used as a functional response. Capacity data at different saturation situations was compared with the DWC in the different formats.
Bovine serum albumin (BSA) was loaded until 90% breakthrough. HiScreen columns were operated using an ÄKTA system. PreDictor RoboColumn units were operated both on the ÄKTA system, by using an inhouse made adapter, and on the Tecan™ robot. In the Tecan method, 200 μL fractions were collected in UV-readable plates and UV absorbance at 280 nm was measured off-line. On the ÄKTA system, UV at 280 nm was measured by the on-line detector. The delay volume was determined by injection of BSA in non-binding mode.
Results and discussionDBC determined on PreDictor RoboColumn units on the Tecan robot are in good agreement with data generated on HiScreen columns on the ÄKTA system (Fig 1).
0
50
100
150
200
0
50
100
150
200
QB10
2 min. RTQB90
2 min. RTQB10
8 min. RTQB90
8 min. RT
DB
C (g
/L)
Capto Q PreDictor RoboColumn TecanHiScreen ÄKTA
PreDictor RoboColumn TecanHiScreen ÄKTA
QB10
2 min. RTQB90
2 min. RTQB10
8 min. RTQB90
8 min. RT
DB
C (g
/L)
Capto Q ImpRes
Fig 1. Comparison of DBC determined at 10% (QB10) and 90% (QB90) breakthrough in PreDictor RoboColumn units operated on the Tecan robot and in HiScreen columns operated on the ÄKTA system (four replicates).
0
50
100
150
200
0
50
100
150
200
QB10
2 min. RTQB90
2 min. RTQB10
8 min. RTQB90
8 min. RT
DB
C (g
/L)
Capto Q PreDictor RoboColumn TecanHiScreen ÄKTA
PreDictor RoboColumn TecanHiScreen ÄKTA
QB10
2 min. RTQB90
2 min. RTQB10
8 min. RTQB90
8 min. RT
DB
C (g
/L)
Capto Q ImpRes
28

Unused mini- and laboratory-scale columns were disassembled and emptied, and the DWC of the resin was quantitatively measured. A small, but significant, difference in resin DWC per column volume between formats were observed. To see if the resin DWC affected the DBC, the two column formats were run on the ÄKTA system. The study was performed at 8 min RT to be close to saturation. The difference in measured DBC was similar to the difference in DWC (Fig 2).
For the Capto Q resin, the shape of the break-through curves differed between PreDictor RoboColumn units operated on the Tecan robot and HiScreen columns operated on the ÄKTA system. However, the difference in DBC for BSA is not larger than the variation between the columns (Fig 3).
ConclusionsDBC determined in mini-columns on the Tecan robot are in good agreement with DBC determined in laboratory-scale columns on the ÄKTA system.
PreDictor RoboColumn units on the Tecan robot can be used for parallel screening and optimization of DBC in a similar way as for laboratory-scale columns on the ÄKTA system used in a sequential mode.
The small, but significant, difference observed in resin dry weight content per column volume correlates with the difference in determined DBC between column formats.
Fig 2. Comparison of dry weight content per column volume (DWC/mL) and DBC determined at 5% (QB5), 10% (QB10), and 90% (QB90) breakthrough in PreDictor RoboColumn units and HiScreen columns (both operated on the ÄKTA system) at 8 min RT (four replicates). Values normalized to data from PreDictor RoboColumn units.
0%
20%
40%
60%
80%
100%
DWC/mL QB90 QB10 QB5
Nor
mal
ized
dry
wei
ght
cont
ent
(DW
C/m
L) a
nd D
BC
val
ues
Nor
mal
ized
dry
wei
ght
cont
ent
(DW
C/m
L) a
nd D
BC
val
ues
0%
20%
40%
60%
80%
100%
DWC/mL QB90 QB10 QB5
Capto Q PreDictor RoboColumn ÄKTA
HiScreen ÄKTA
PreDictor RoboColumn ÄKTA
HiScreen ÄKTA
Capto Q ImpRes
0
0.2
0.4
0.6
0.8
1.0
0 50 100 150 200 250
C/C
0
mg BSA loaded / mL resin
HiScreen Capto Q ImpRes PreDictor RoboColumn Capto Q ImpRes Tecan
HiScreen Capto Q PreDictor RoboColumn Capto Q Tecan
Fig 3. Breakthrough curves from frontal analysis at 2 min RT.
29

Rapid process development of a cation exchange step for a biosimilarSushma Nayak Teichert1, Anna Maria Gudmundsdottir2, Charlotte Brink1, Kristina Nilsson Välimaa1, Elizabeth Ellis2, and Andrew Falconbridge2
1 Cytiva Sweden AB, Björkgatan 30, 751 84 Uppsala, Sweden 2 Alvotech, Sæmundargötu 15-19, 101 Reykjavík, Iceland
07
30

Resin screening
Static binding capacity
(SBC)
Elutionconditionscreening
Chromatographic method
development
IntroductionWhen establishing purification processes for a biosimilar molecule, it is important to develop steps that are scalable, selective, and cost-effective.
A cation exchange (CIEX) chromatographic step was developed as part of a collaborative project, where expertise in the field of downstream purification and bioprocessing was combined with specific biosimilar requirements. A standardized workflow was adapted using a high-throughput process development (HTPD) approach: chromatography resin and running conditions were selected based on experience and adapted to meet requirements. By providing the process development support, aggressive timelines could be addressed, which resulted in an accelerated progression of bioprocess design to reduce timelines.
The aim was to select the optimal resin from three candidates and provide initial running conditions for the chosen resin. The goal was to reduce aggregate levels to approximately 0.6% after the polishing step in conjunction with obtaining the highest yield possible for the monomer. HTPD experiments were performed in both 96-well plates and small-scale columns.
Fig 1. The Fast Trak standardized workflow applied for evaluating and selecting resins for a polishing step of a biosimilar molecule. The first part consists of screening of a wide area of conditions in a format that allows increased throughput and provides process understanding. The final part involves development of a chromatographic method to identify running conditions in an “easy-to-scale-up” approach.
31
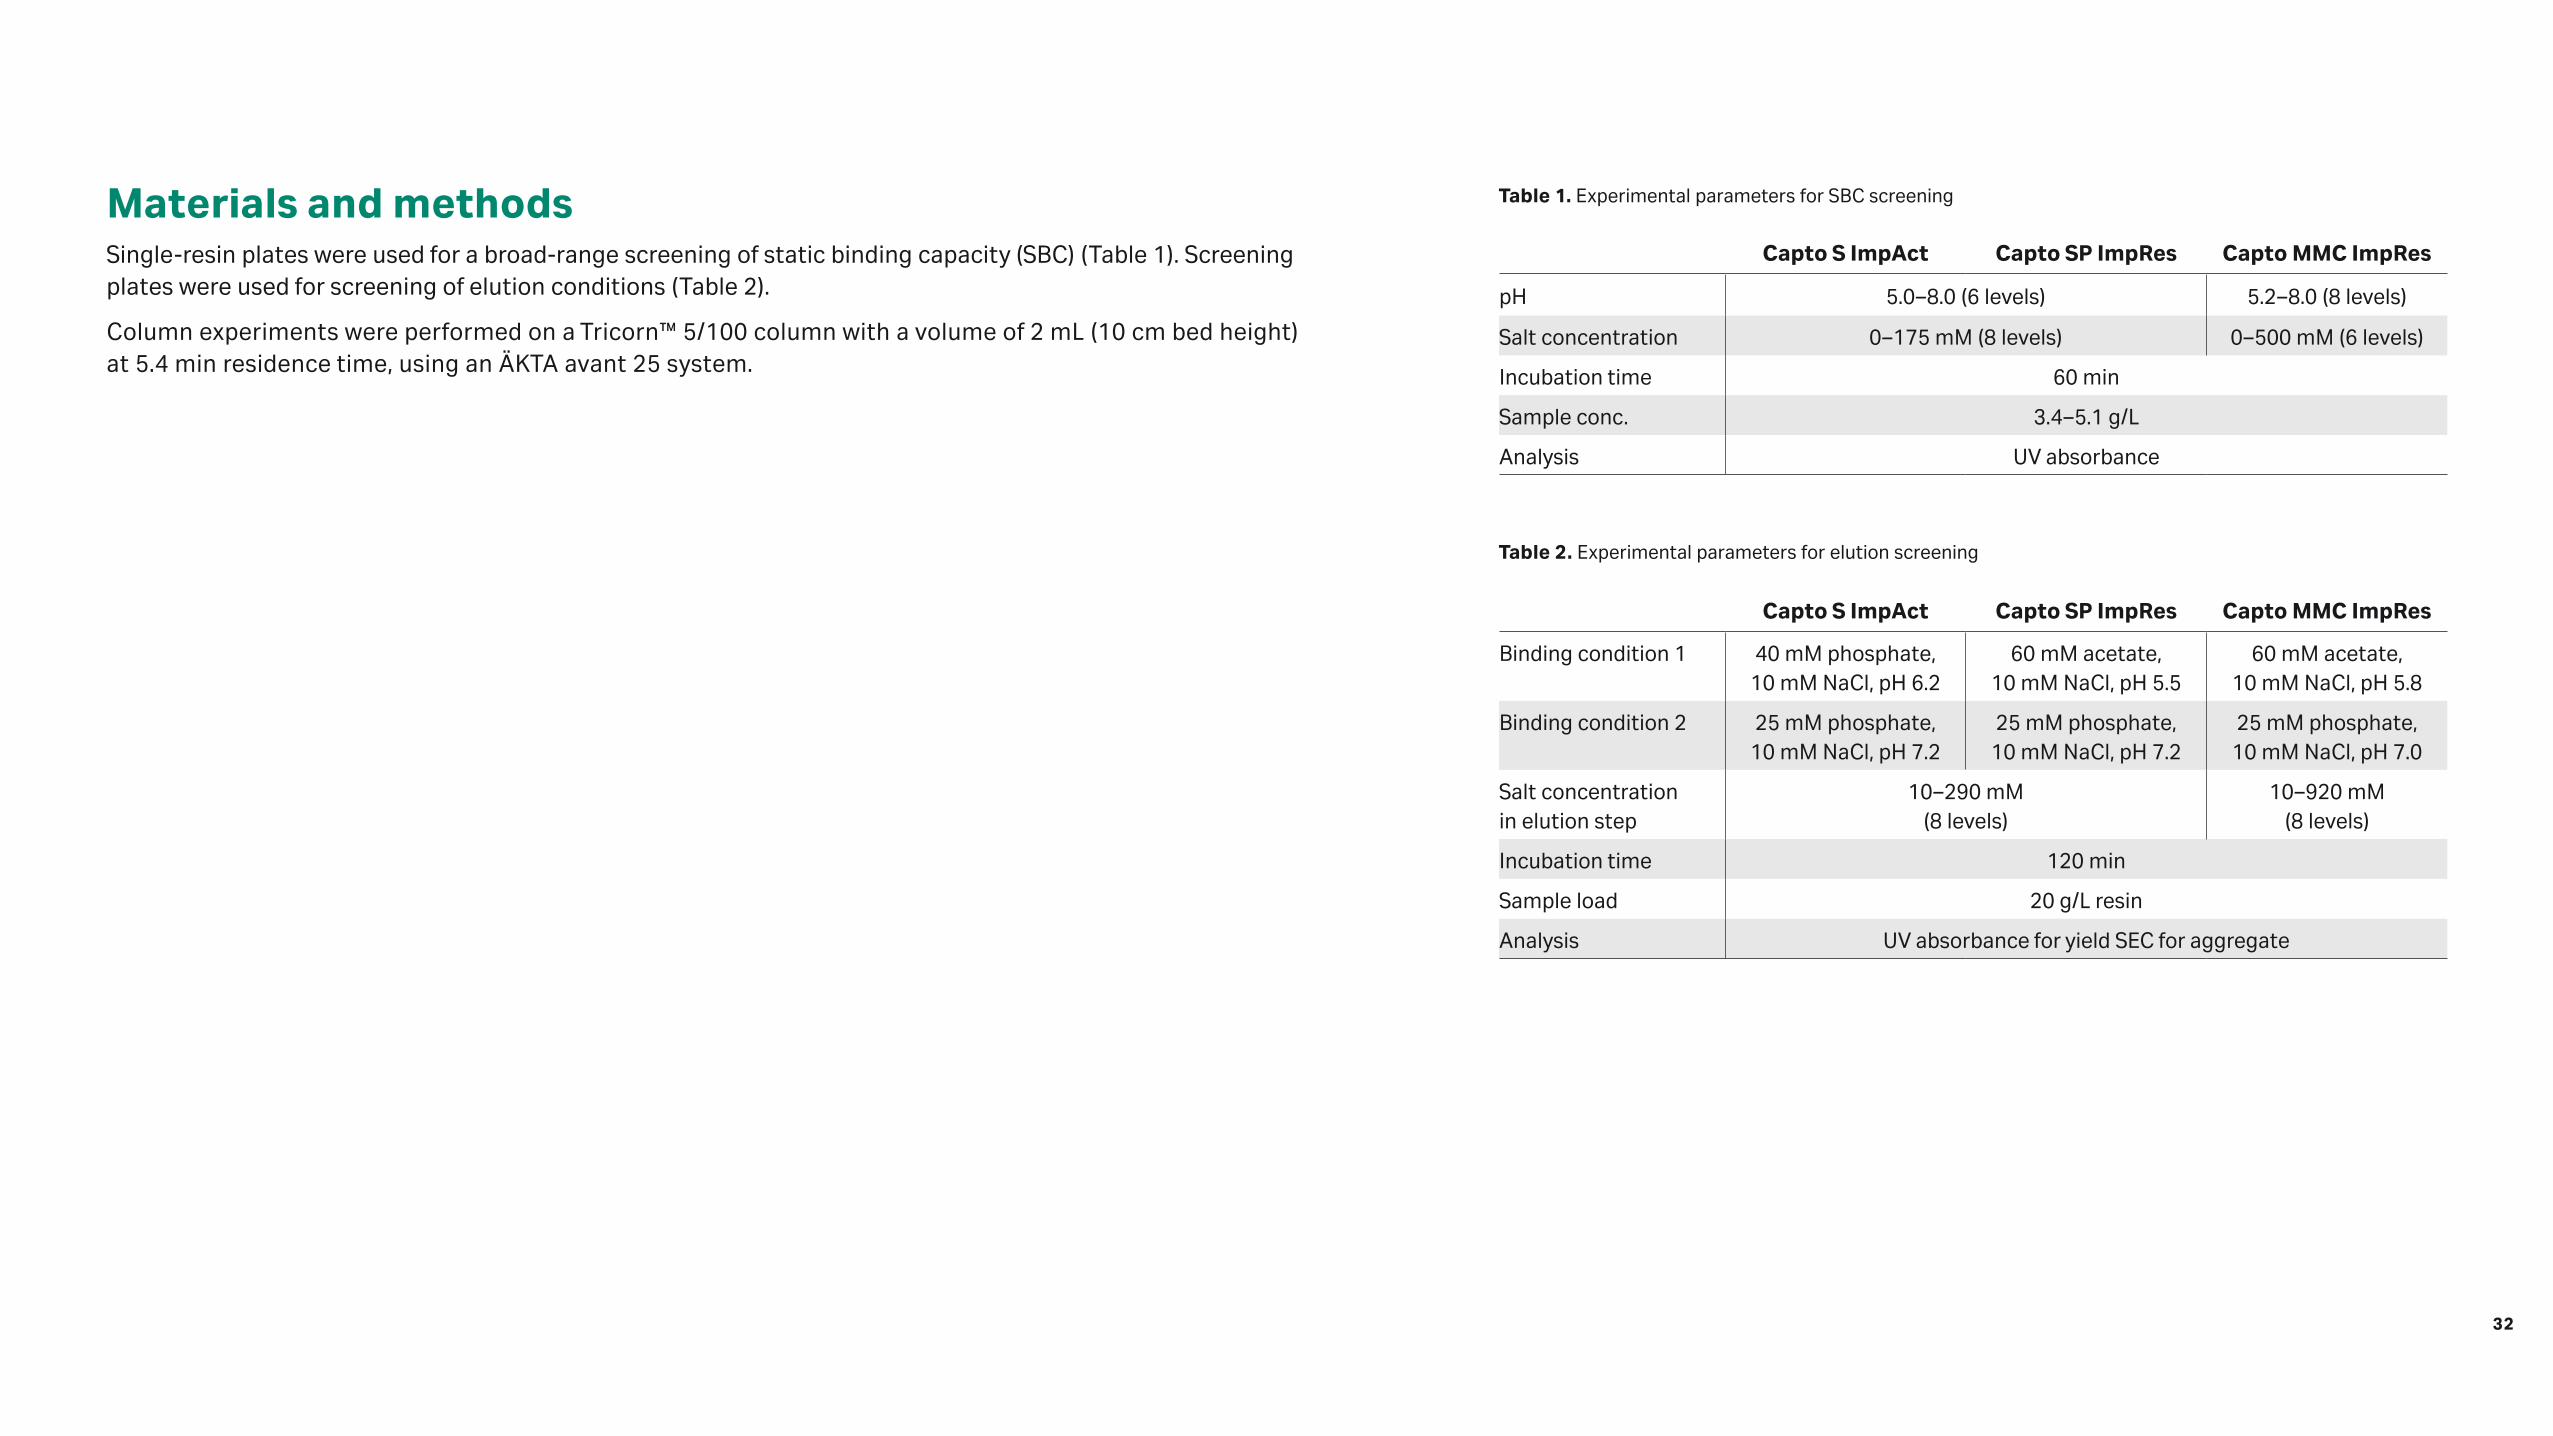
Table 1. Experimental parameters for SBC screening
Capto S ImpAct Capto SP ImpRes Capto MMC ImpRes
pH 5.0–8.0 (6 levels) 5.2–8.0 (8 levels)
Salt concentration 0–175 mM (8 levels) 0–500 mM (6 levels)
Incubation time 60 min
Sample conc. 3.4–5.1 g/L
Analysis UV absorbance
Table 2. Experimental parameters for elution screening
Capto S ImpAct Capto SP ImpRes Capto MMC ImpRes
Binding condition 1 40 mM phosphate, 10 mM NaCl, pH 6.2
60 mM acetate, 10 mM NaCl, pH 5.5
60 mM acetate, 10 mM NaCl, pH 5.8
Binding condition 2 25 mM phosphate, 10 mM NaCl, pH 7.2
25 mM phosphate, 10 mM NaCl, pH 7.2
25 mM phosphate, 10 mM NaCl, pH 7.0
Salt concentration in elution step
10–290 mM (8 levels)
10–920 mM (8 levels)
Incubation time 120 min
Sample load 20 g/L resin
Analysis UV absorbance for yield SEC for aggregate
Materials and methodsSingle-resin plates were used for a broad-range screening of static binding capacity (SBC) (Table 1). Screening plates were used for screening of elution conditions (Table 2).
Column experiments were performed on a Tricorn™ 5/100 column with a volume of 2 mL (10 cm bed height) at 5.4 min residence time, using an ÄKTA avant 25 system.
32

140
140–90
60–0
90–60
SBC (g/L)
140
140–90
60–0
90–60
SBC (g/L)
5.0 8.05.6 6.8 7.46.2
pH pH pH
Salt
con
cent
rati
on (m
M)
25
75
100
150
175
50
125
Salt
con
cent
rati
on (m
M)
25
75
100
150
175
50
125
Salt
con
cent
rati
on (m
M)
200
300
500
100
400
5.2 8.06.0 6.8 7.65.6 6.4 7.2
40
40–20
10–0
20–10
SBC (g/L)
5.0 8.05.6 6.8 7.46.2
140
140–90
60–0
90–60
SBC (g/L)
140
140–90
60–0
90–60
SBC (g/L)
5.0 8.05.6 6.8 7.46.2
pH pH pH
Salt
con
cent
rati
on (m
M)
25
75
100
150
175
50
125
Salt
con
cent
rati
on (m
M)
25
75
100
150
175
50
125
Salt
con
cent
rati
on (m
M)
200
300
500
100
400
5.2 8.06.0 6.8 7.65.6 6.4 7.2
40
40–20
10–0
20–10
SBC (g/L)
5.0 8.05.6 6.8 7.46.2
Fig 2. Evaluation of SBC of (A) Capto S ImpAct, (B) Capto SP ImpRes, and (C) Capto MMC ImpRes.
(A) (C)(B)
Results and discussionBinding studyContour plots were used for evaluating SBC and visualizing trends. The plots also provided information of which binding conditions to test for in the subsequent elution studies as well as possible conditions for column method screening. As seen in Figure 2, Capto S ImpAct resin had the highest SBC of the resins tested.
33

0
0.25
0.50
0.75
1.00
50 90 1300
10
20
30
40
50
60
70
80
Agg
rega
te (%
)
Salt concentration (mM)
Yiel
d (%
)
pH 6.2 yield pH 7.2 yield
pH 6.2 aggregate pH 7.2 aggregate
0
0.25
0.50
0.75
1.00
50 90 1300
10
20
30
40
50
60
70
80
Agg
rega
te (%
)
Salt concentration (mM)
Yiel
d (%
)
pH 5.5 yield pH 5.5 aggregate
0
0.25
0.50
0.75
1.00
140 270 400 5300
10
20
30
40
50
60
70
80
Agg
rega
te (%
)
Salt concentration (mM)
Yiel
d (%
)
pH 5.8 yield pH 7.0 yield
pH 5.8 aggregate pH 7.0 aggregate
Elution screeningThe first elution fraction was evaluated for yield and aggregate content (Fig 3). Capto S ImpAct and Capto SP ImpRes showed most promising aggregate removal of all tested candidates. In addition, it was seen that lower pH was beneficial for aggregate removal. As Capto S ImpAct exhibited the highest SBC, this resin candidate and the corresponding conditions was chosen for further optimization.
Fig 3. Yield (bars) and aggregate content (lines) for (A) Capto S ImpAct, (B) Capto SP ImpRes, and (C) Capto MMC ImpRes.
(A) (C)(B)
34

130
145
0
20
40
60
80
100
120
140
160
pH 5.5 pH 6.0
QB
10 (g
/L r
esin
)
Chromatographic method developmentTo aim for an increased productivity, the dynamic binding capacity (DBC) was investigated. DBC at 10% breakthrough (QB10) was determined by performing frontal analysis at two different pH values (pH 5.5 and 6.0) for Capto S ImpAct (Fig 4). The highest binding capacity (QB10 = 145 g/L resin) was obtained at pH 6.0.
The selectivity of Capto S ImpAct between monomers and aggregates was also verified at pH 5.5 and 6.0. The two conditions showed similar selectivity, but higher capacity, at pH 6.0. This pH was therefore finally selected. To improve the productivity, high sample loads (80 and 100 g/L resin) were evaluated at pH 6.0. Results showed that a sample load of 100 g/L resin (70% of QB10) gave excellent aggregate and host cell protein (HCP) removal (Fig 5 and Table 3). This fulfilled the biosimilarity requirements at a high sample load, resulting in a polishing step with high productivity.
ConclusionsThe close collaboration enabled rapid process development by quick identification of a suitable resin candidate, process conditions,
and critical parameters. Access to expertise helped develop an adaptable and optimized purification process with improved process
understanding. Using the Fast Trak standardized workflow, initial running conditions were identified in four weeks for further
process development.
Fig 4. Dynamic binding capacity of Capto S ImpAct at different pH values.
Table 3. Main peak yield, aggregate content, and HCP results for Capto S ImpAct
Yield (%) Aggregate (%) HCP (ppm)
Start sample N/A 2.2 55
Sample load: 80 g/L resin 95 0.5 13
Sample load: 100 g/L resin 97 0.5 14
0
30 40 50 60 70 80
500
1000
1500
2000
A28
0 (m
AU
)
2500
3000 A280
Main peak
Aggregatepeak
Volume (mL)
Conductivity
Concentration
Fig 5. Chromatogram from elution gradient experiment at a sample load of 100 g/L resin.
Start buffer: 40 mM phosphate, 10 mM NaCl, pH 6.0 (4.3 mS/cm)Elution buffer: 10–250 mM NaCl, linear gradient, 15 column volumes (CV)
35

High-throughput process development for aggregate removal in flow-through membrane chromatographyDominik Stein, Alexander Langsdorf, and Volkmar Thom
Sartorius Stedim Biotech GmbH, August-Spindler-Str. 11, D-37079 Goettingen
08
36

AbstractIn downstream processing of therapeutic proteins, membrane adsorbers (MA) have long been recognized to offer significant advantageous compared to resin-based chromatographic processes when used for contaminant and/or aggregate removal. The main benefits of MA compared to chromatographic resin are higher mass transfer rates and thus elevated productivity, as well as ease-of-use due to the prepacked and often also single-use nature of the membrane adsorber devices. Here we describe a high-throughput screening (HTS) robotic technique for solution parameter optimization for flow-through (FT) aggregate removal by MA. Protein dimer/aggregate removal and membrane binding capacity for monomers and dimers were determined by using eight parallel down-scale Sartobind® Q, anion-exchange (AEX) MA. Furthermore, a process map of a recombinant Chinese hamster ovary (CHO) cell-fermented and post-protein A clarified immunoglobulin G (IgG) feed could be established.
IntroductionHTS is typically executed on robotic platforms, allowing automated, fast, and reliable workflows with minimized scale-down devices and often employed to speed up parameter estimation (Wiendahl et al., 2008). For a HTS setup, the chromatographic process must display fluid dynamics, binding capacity, and mass transfer effects (Bellot and Condoret, 1991; Dorsey, 2012). While fluid dynamics in scale-down models are often misrepresented, binding constants can be determined by measuring batch isotherms or FT experiments. Considering process oriented mass transfer restrictions, actual FT experiments are necessary.
IEX chromatographic separation performance is mainly influenced by salt concentration, pH value, and stationary phase properties (Shan and Anderson, 2001). HTS can be efficiently used to determine performance as a function of the solution parameter space (Bensch et al., 2005).
For process oriented parameter determination in adaption of scale-down models, eight parallel down-scale membrane devices — similar to RoboColumn units — of an AEX membrane adsorber were investigated with recombinant CHO cell-fermented and post-protein A clarified IgG feed.
37

Material The determination of the protein concentration of IgG monomer and IgG dimer was carried out with the Yarra™ SEC-3000 LC-column (3 µm; 300 × 7.8 mm) delivered by Phenomenex. With Sartobind Q, an AEX membrane adsorber with a mean diameter of > 3 µm and a ligand density of 2-5
µeq
cm2 , was investigated. The recombinant CHO cell-fermented and post-protein A clarified IgG protein solution was adjusted at four different pH-values with a Sartoflow® Smart Hydrosart membrane.
The flow-through verification experiments were carried out with an ÄKTAprime plus chromatography system, Cytiva.
The HTS is based on an eight-channel liquid handling robot Lissy® 2002 GXXL/8P delivered by Zinsser Analytic. Down-scale MA devices of Sartobind Q membrane (AEX) were used, each having a bed volume of 0.4 mL.
MethodsThe MA devices in Figure 1 exhibit a septum port, through which robotic needles can penetrate and inject the different solutions with positive pressure through the device. Eluate fractions are collected in moveable well plates beneath.
The MA characterization was divided in screening and determination of binding capacity to examine possible operation points and influence as shown in Figure 2.
Tip
Membranedevice
Holder
Movablewell plate
Fig 1. HTS device.
Screening Component behavior Operation prediction
8.0 8.5 9.0 9.5 10
4
6
8
10
12
14
16
18
20
CD
(mS/
cm)
pH
8.0 8.5 9.0 9.5 10
4
6
8
10
12
14
16
18
20
CD
(mS/
cm)
pH
Fig 2. Parameter determination method.
38

3.5
2.5
3.0
1.5
2.0
0.5
0
0 10 20 30
Volume (mL)
Con
cent
rati
on m
onom
er (m
g/m
L)
Loading Elution Regeneration
Rat
io d
imer
/mon
omer
elu
ate
frac
tion
Con
duct
ivit
y (m
S/cm
)
40 50
1.0
80
60
70
40
50
10
20
0
30
30
22
24
26
28
16
20
18
4
8
2
6
0
12
14
10
Fig 3. Pipetting scheme.
The HTS system investigates the impact of pH and salt concentration on the separation selectivity of IgG monomer and dimer. The eight parallel membrane devices are step-wise loaded at a chosen pH value (6 < pH < 11) in 0.5 steps and sequentially eluted at different salt concentrations, respectively conductivity (CD) (2 < CD < 12), as shown in Figure 3. Remaining impurities are removed in the regeneration step. Finally, the MA is re-equilibrated. The MA screening for eight pH values and six elution steps takes in total 1.5 h. Afterwards, all eluates are analyzed for IgG monomer and dimer concentration by size exclusion chromatography (SEC).
Figure 3 displays an HTS result in FT mode and starts with the loading of feed onto the Sartobind Q membranes with different bed volumes. Hence, the breakthrough curve can be determined. Afterwards, the MA is washed with binding buffer to flush out unbound material. In the next step, elution at different salt concentrations is carried out. The respective eluates are analyzed for IgG monomer and dimer concentration. For determining the loading capacity, the sum of all sub-sequentially eluted fractions is formed. Thereafter, the MA is regenerated with high salt buffer and re-equilibrated with loading buffer. The screening procedure assumes that the determined IgG dimer selectivity calculated from binding capacity also holds true for FT mode, leading to a respective FT process map.
39
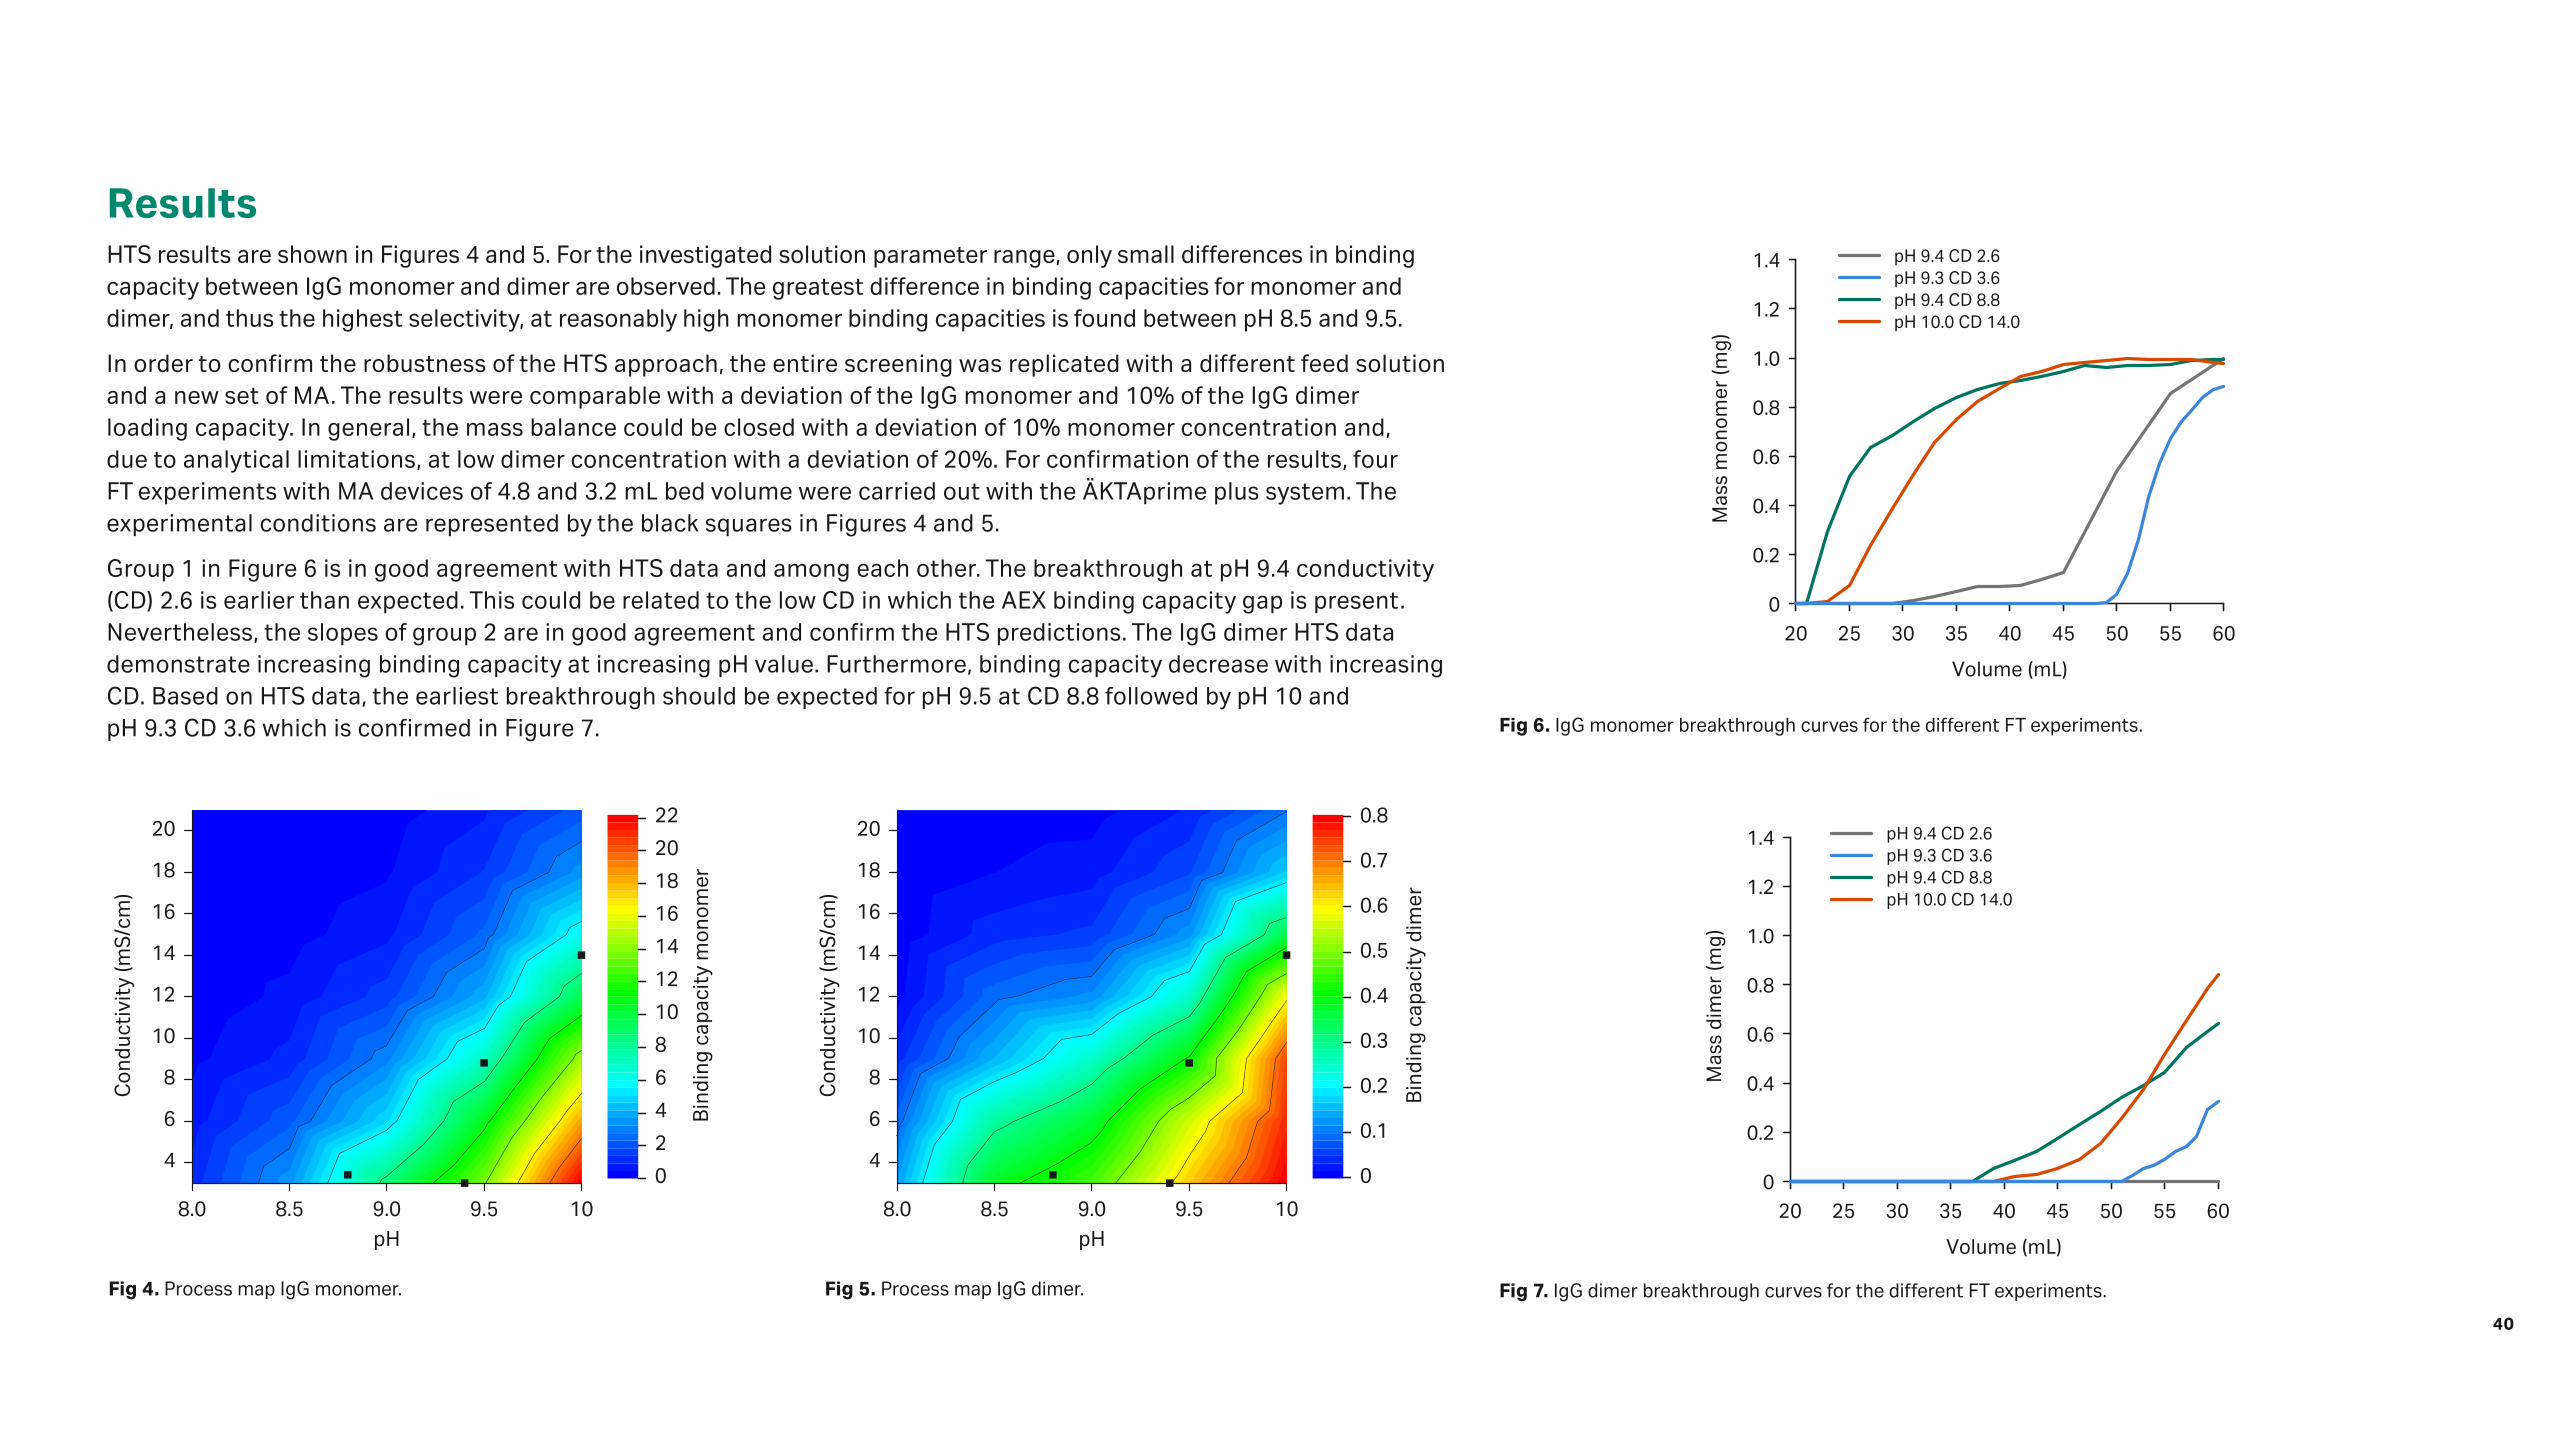
ResultsHTS results are shown in Figures 4 and 5. For the investigated solution parameter range, only small differences in binding capacity between IgG monomer and dimer are observed. The greatest difference in binding capacities for monomer and dimer, and thus the highest selectivity, at reasonably high monomer binding capacities is found between pH 8.5 and 9.5.
In order to confirm the robustness of the HTS approach, the entire screening was replicated with a different feed solution and a new set of MA. The results were comparable with a deviation of the IgG monomer and 10% of the IgG dimer loading capacity. In general, the mass balance could be closed with a deviation of 10% monomer concentration and, due to analytical limitations, at low dimer concentration with a deviation of 20%. For confirmation of the results, four FT experiments with MA devices of 4.8 and 3.2 mL bed volume were carried out with the ÄKTAprime plus system. The experimental conditions are represented by the black squares in Figures 4 and 5.
Group 1 in Figure 6 is in good agreement with HTS data and among each other. The breakthrough at pH 9.4 conductivity (CD) 2.6 is earlier than expected. This could be related to the low CD in which the AEX binding capacity gap is present. Nevertheless, the slopes of group 2 are in good agreement and confirm the HTS predictions. The IgG dimer HTS data demonstrate increasing binding capacity at increasing pH value. Furthermore, binding capacity decrease with increasing CD. Based on HTS data, the earliest breakthrough should be expected for pH 9.5 at CD 8.8 followed by pH 10 and pH 9.3 CD 3.6 which is confirmed in Figure 7.
Fig 4. Process map IgG monomer. Fig 5. Process map IgG dimer.
8.0 8.5 9.0 9.5 10
4
6
8
10
12
14
16
18
20
Con
duct
ivit
y (m
S/cm
)
pH
0
2
4
6
8
10
12
14
16
18
20
22
Bin
ding
cap
acit
y m
onom
er
8.0 8.5 9.0 9.5 10
4
6
8
10
12
14
16
18
20C
ondu
ctiv
ity
(mS/
cm)
pH
0
0.1
0.2
0.3
0.4
0.5
0.6
0.7
0.8
Bin
ding
cap
acit
y di
mer
20 25 30 35 40 45 50 55 600
0.2
0.4
0.6
0.8
1.0
1.2
1.4
Mas
s m
onom
er (m
g)
Volume (mL)
20 25 30 35 40 45 50 55 600
0.2
0.4
0.6
0.8
1.0
1.2
1.4
Mas
s di
mer
(mg)
Volume (mL)
pH 9.4 CD 2.6pH 9.3 CD 3.6pH 9.4 CD 8.8pH 10.0 CD 14.0
pH 9.4 CD 2.6pH 9.3 CD 3.6pH 9.4 CD 8.8pH 10.0 CD 14.0
Fig 6. IgG monomer breakthrough curves for the different FT experiments.
Fig 7. IgG dimer breakthrough curves for the different FT experiments.
20 25 30 35 40 45 50 55 600
0.2
0.4
0.6
0.8
1.0
1.2
1.4
Mas
s m
onom
er (m
g)
Volume (mL)
20 25 30 35 40 45 50 55 600
0.2
0.4
0.6
0.8
1.0
1.2
1.4
Mas
s di
mer
(mg)
Volume (mL)
pH 9.4 CD 2.6pH 9.3 CD 3.6pH 9.4 CD 8.8pH 10.0 CD 14.0
pH 9.4 CD 2.6pH 9.3 CD 3.6pH 9.4 CD 8.8pH 10.0 CD 14.0
40

8.0 8.5 9.0 9.5 10
4
6
8
10
12
14
16
18
20
Con
duct
ivit
y (m
S/cm
)
pH
0
0.1
0.3
0.4
0.5
0.6
0.8
0.9
1.0
Targ
et fu
nct
ion
(rec
over
y ×
puri
fied
volu
me)
Fig 8. Possible process target function.
Summary The presented HTS setup and solution parameter screening principle enable efficient and parallel investigation of a FT process range for aggregate removal. The resulting trends were confirmed by selected FT runs. In order to provide fast track process operation points and possible quality by design (QbD) approaches, the HTS setup can provide valuable data. With a mathematical description of binding capacity as a function of salt and pH value a target function for process design, for example, targeting maximal monomer recovery and purified feed volume, as shown in Figure 8, can be generated.
AcknowledgementsWe would like to acknowledge the support of Kathrin Schröder-Tittmann, Nicole Linne, Nelli Marks of the membrane chromatography team, Martin Leuthold in device development team and Peter Polossek for building the HTS setup.
References1. Bellot, J.C. and Condoret, J. S. Liquid chromatography modelling: a review.
Process Biochemistry 26, 363–376 (1991).
2. Bensch, M., Schulze Wierling, P., von Lieres, E., Hubbuch, J. High throughput screening of chromatographic phases for rapid process development. Chemical Engineering & Technology 28, 1274–1284 (2005).
3. Dorsey, J.G. Editorial on “Mass transfer kinetics, band broadening and column efficiency” by F. Gritti and G. Guiochon. Journal of chromatography A 1221 10.1016/j.chroma.2011.11.004 (2012).
4. Shan, L. and Anderson, D. J. Effect of buffer concentration on gradient chromatofocusing performance separating proteins on a high-performance DEAE column. Journal of Chromatography A 909, 191–205 (2001).
5. Wiendahl, M., Schulze Wierling, P., Nielsen, J., Fomsgaard Christensen, D., Krarup, J., Staby, A, Hubbuch, J. High throughput screening for the design and optimization of chromatographic processes — miniaturization, automation and parallelization of breakthrough and elution studies. Chemical Engineering & Technology 31, 893–903 (2008).
41
Adapting existing HTPD tools to suit rapid development of affinity purification resinsBrandon Coyle, Karol Łącki, and Warren Kett
Avitide Inc., 16 Cavendish Ct, Lebanon, NH, USA
09
42

IntroductionProtein A chromatography has set the bar for the standard performance of affinity purification. The technique led to an industry-wide adoption of a platform approach for mAb purification, which means products can be quickly taken to proof of concept (POC) studies and rapidly move to commercialization. However, Protein A chromatography is limited to antibodies and Fc-fusion drug products. For other biologic modalities (e.g., recombinant proteins, enzymes, vaccines, and virus-like particles) to take advantage of the same benefits, manufacturers need access to affinity resins for a wider range of molecules. Avitide’s mission is to develop affinity resins that extend the benefits of the Protein A capture step, such as fast development, step consistency, as well as high yield and purity for products other than mAb therapeutics.
The Avitide approachDevelopment stagesAffinity resin development consists of three stages that each require screening using high-throughput process development (HTPD) tools: the affinity ligand, the resin/ligand chemistry, and the capture method development.
The affinity ligand discovery stage focuses on identifying the interaction that secures the desired selectivity. Avitide implements HTPD methods to screen a library of > 1013 affinity ligands from over 40 ligand families. By using such a large and diverse library, many different shapes, sizes, conformations, and contact areas between the ligands and the target molecule can be screened. The goal is to achieve ligand affinities similar to the affinity of Protein A for IgG (10–20 nM), while maintaining stability, manufacturability, and selectivity.
In the next steps, focus is on developing the resin and the associated chromatography method. These areas are inherently intertwined, and as each ligand and base matrix combination is unique, a quality by design (QbD) approach to resin screening in combination with “fail-fast” screening techniques is used. This approach allows maximizing the time allotted for method development. Four case-studies are presented to highlight these techniques.
43
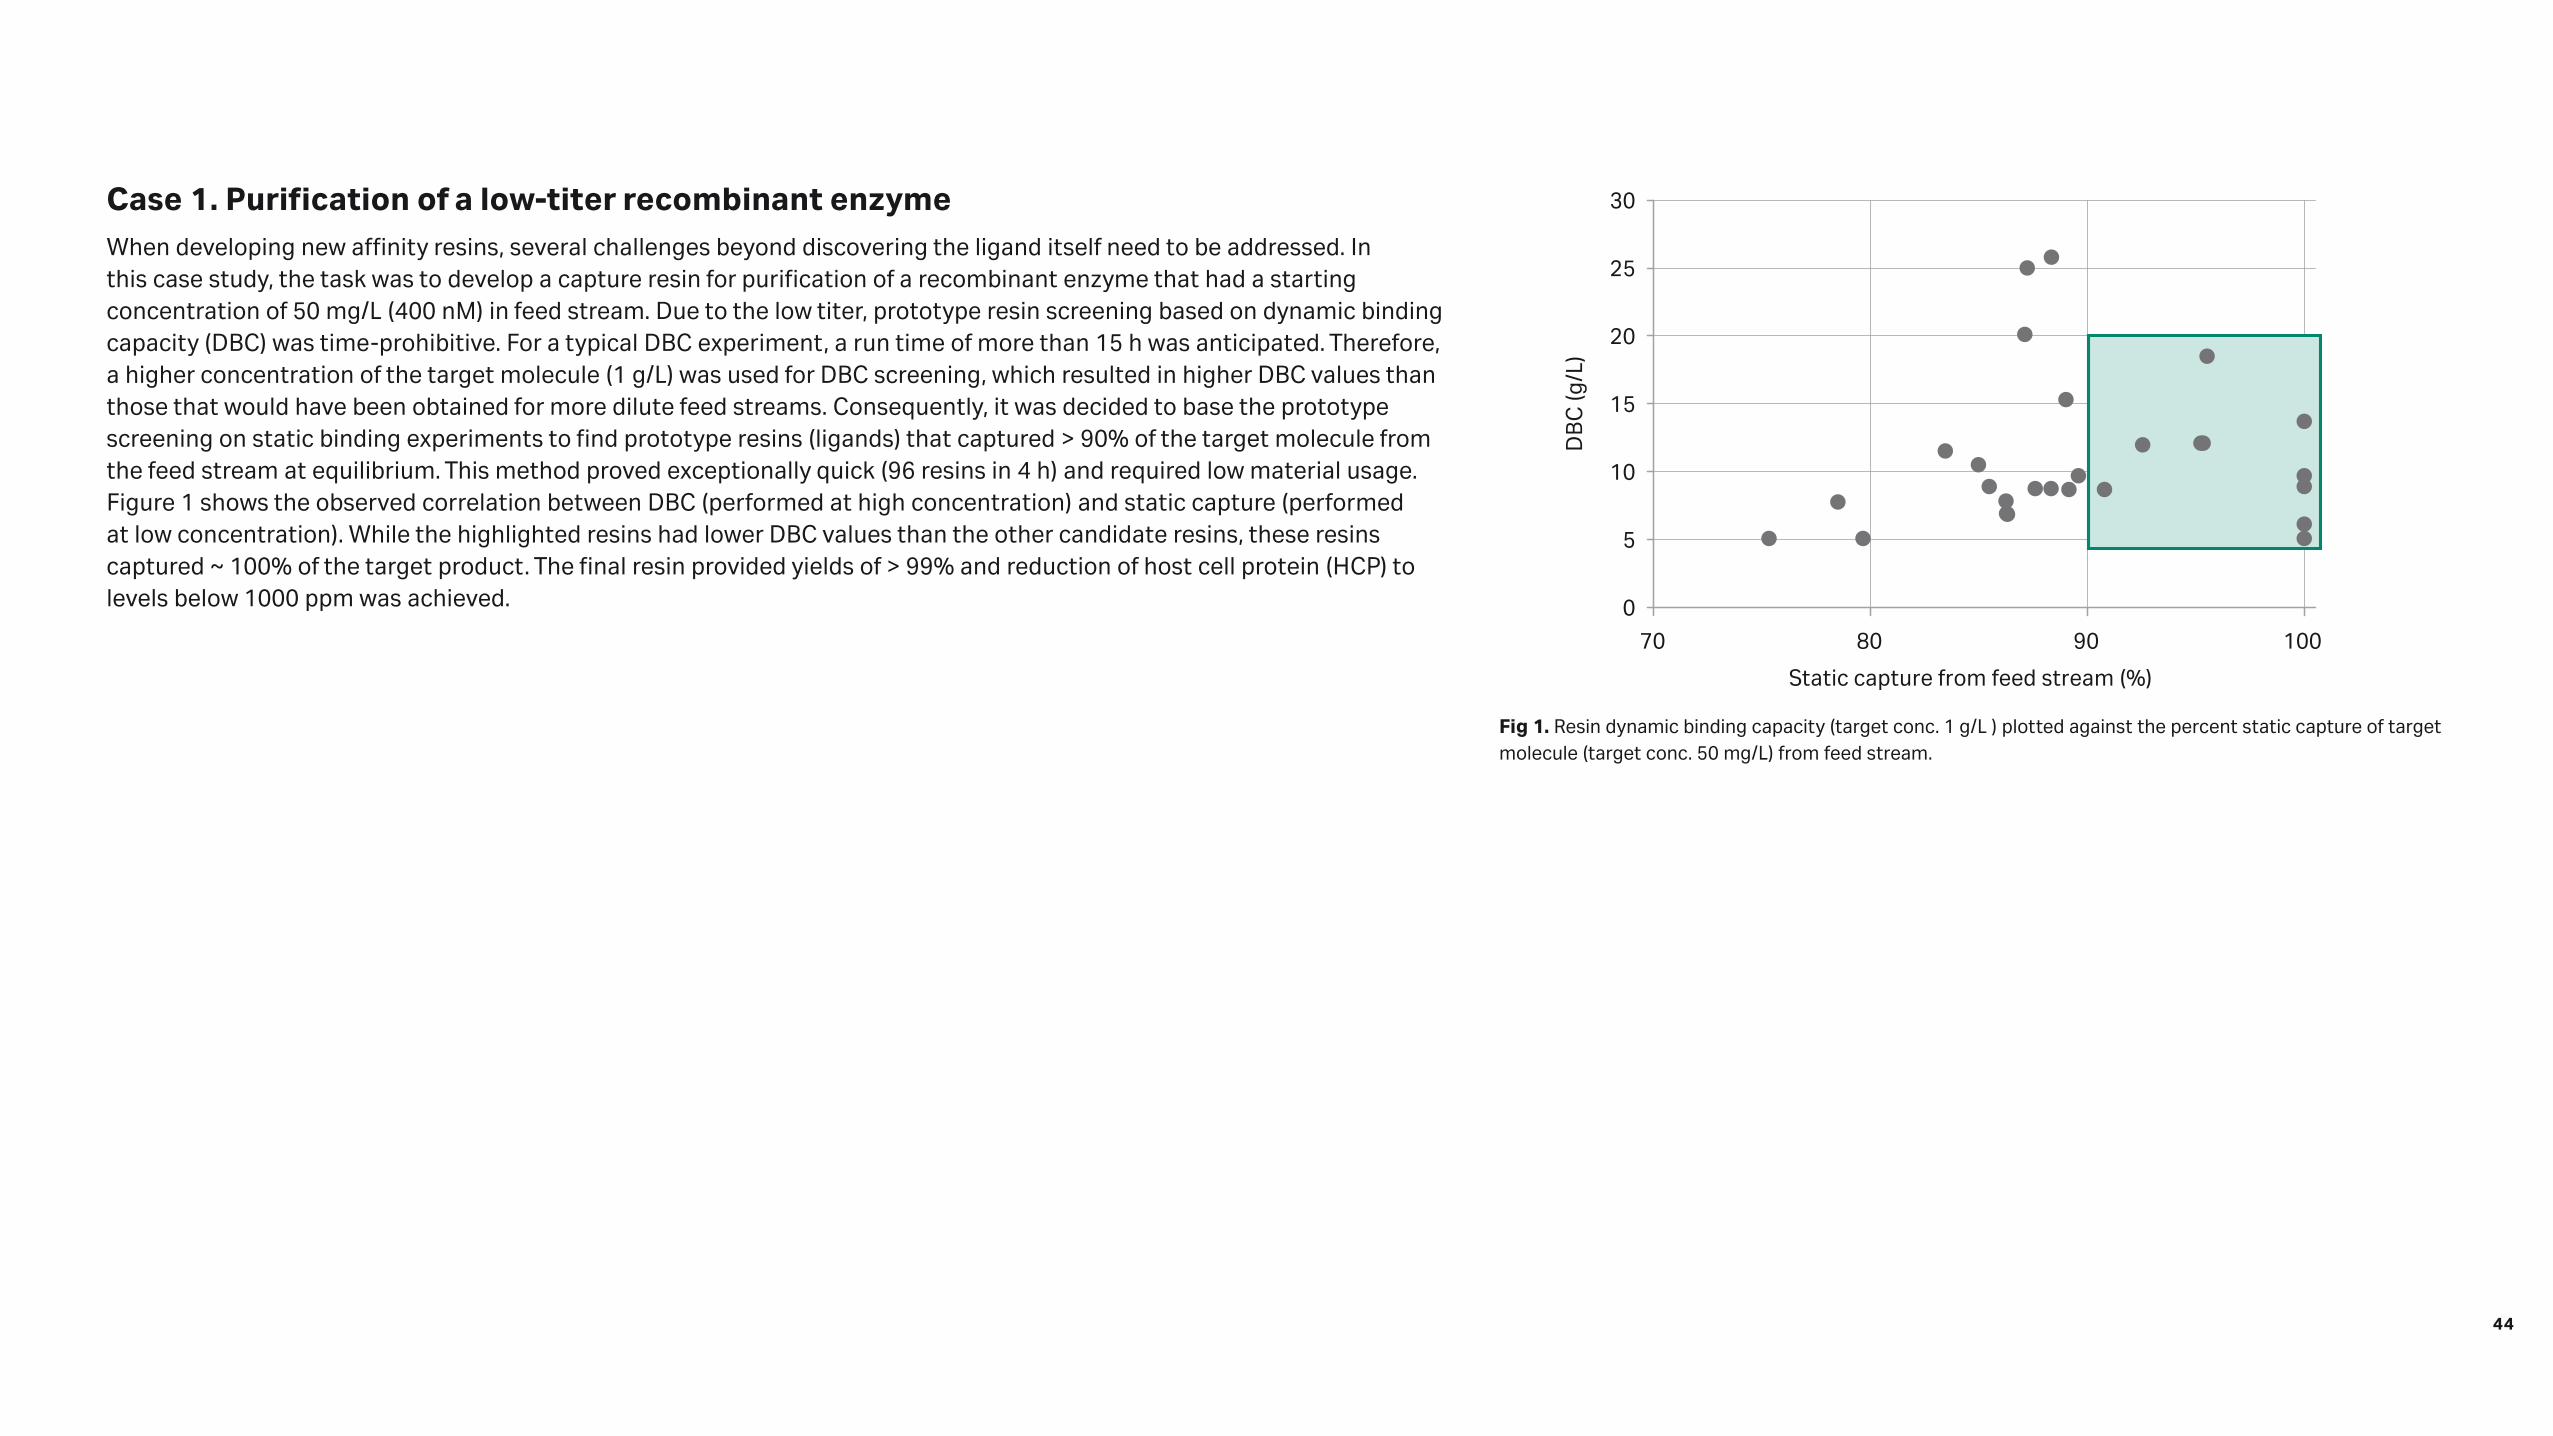
Case 1. Purification of a low-titer recombinant enzymeWhen developing new affinity resins, several challenges beyond discovering the ligand itself need to be addressed. In this case study, the task was to develop a capture resin for purification of a recombinant enzyme that had a starting concentration of 50 mg/L (400 nM) in feed stream. Due to the low titer, prototype resin screening based on dynamic binding capacity (DBC) was time-prohibitive. For a typical DBC experiment, a run time of more than 15 h was anticipated. Therefore, a higher concentration of the target molecule (1 g/L) was used for DBC screening, which resulted in higher DBC values than those that would have been obtained for more dilute feed streams. Consequently, it was decided to base the prototype screening on static binding experiments to find prototype resins (ligands) that captured > 90% of the target molecule from the feed stream at equilibrium. This method proved exceptionally quick (96 resins in 4 h) and required low material usage. Figure 1 shows the observed correlation between DBC (performed at high concentration) and static capture (performed at low concentration). While the highlighted resins had lower DBC values than the other candidate resins, these resins captured ~ 100% of the target product. The final resin provided yields of > 99% and reduction of host cell protein (HCP) to levels below 1000 ppm was achieved. 0
5
10
15
20
25
30
70 80 90 100
DB
C (g
/L)
Static capture from feed stream (%)
Fig 1. Resin dynamic binding capacity (target conc. 1 g/L ) plotted against the percent static capture of target molecule (target conc. 50 mg/L) from feed stream.
44
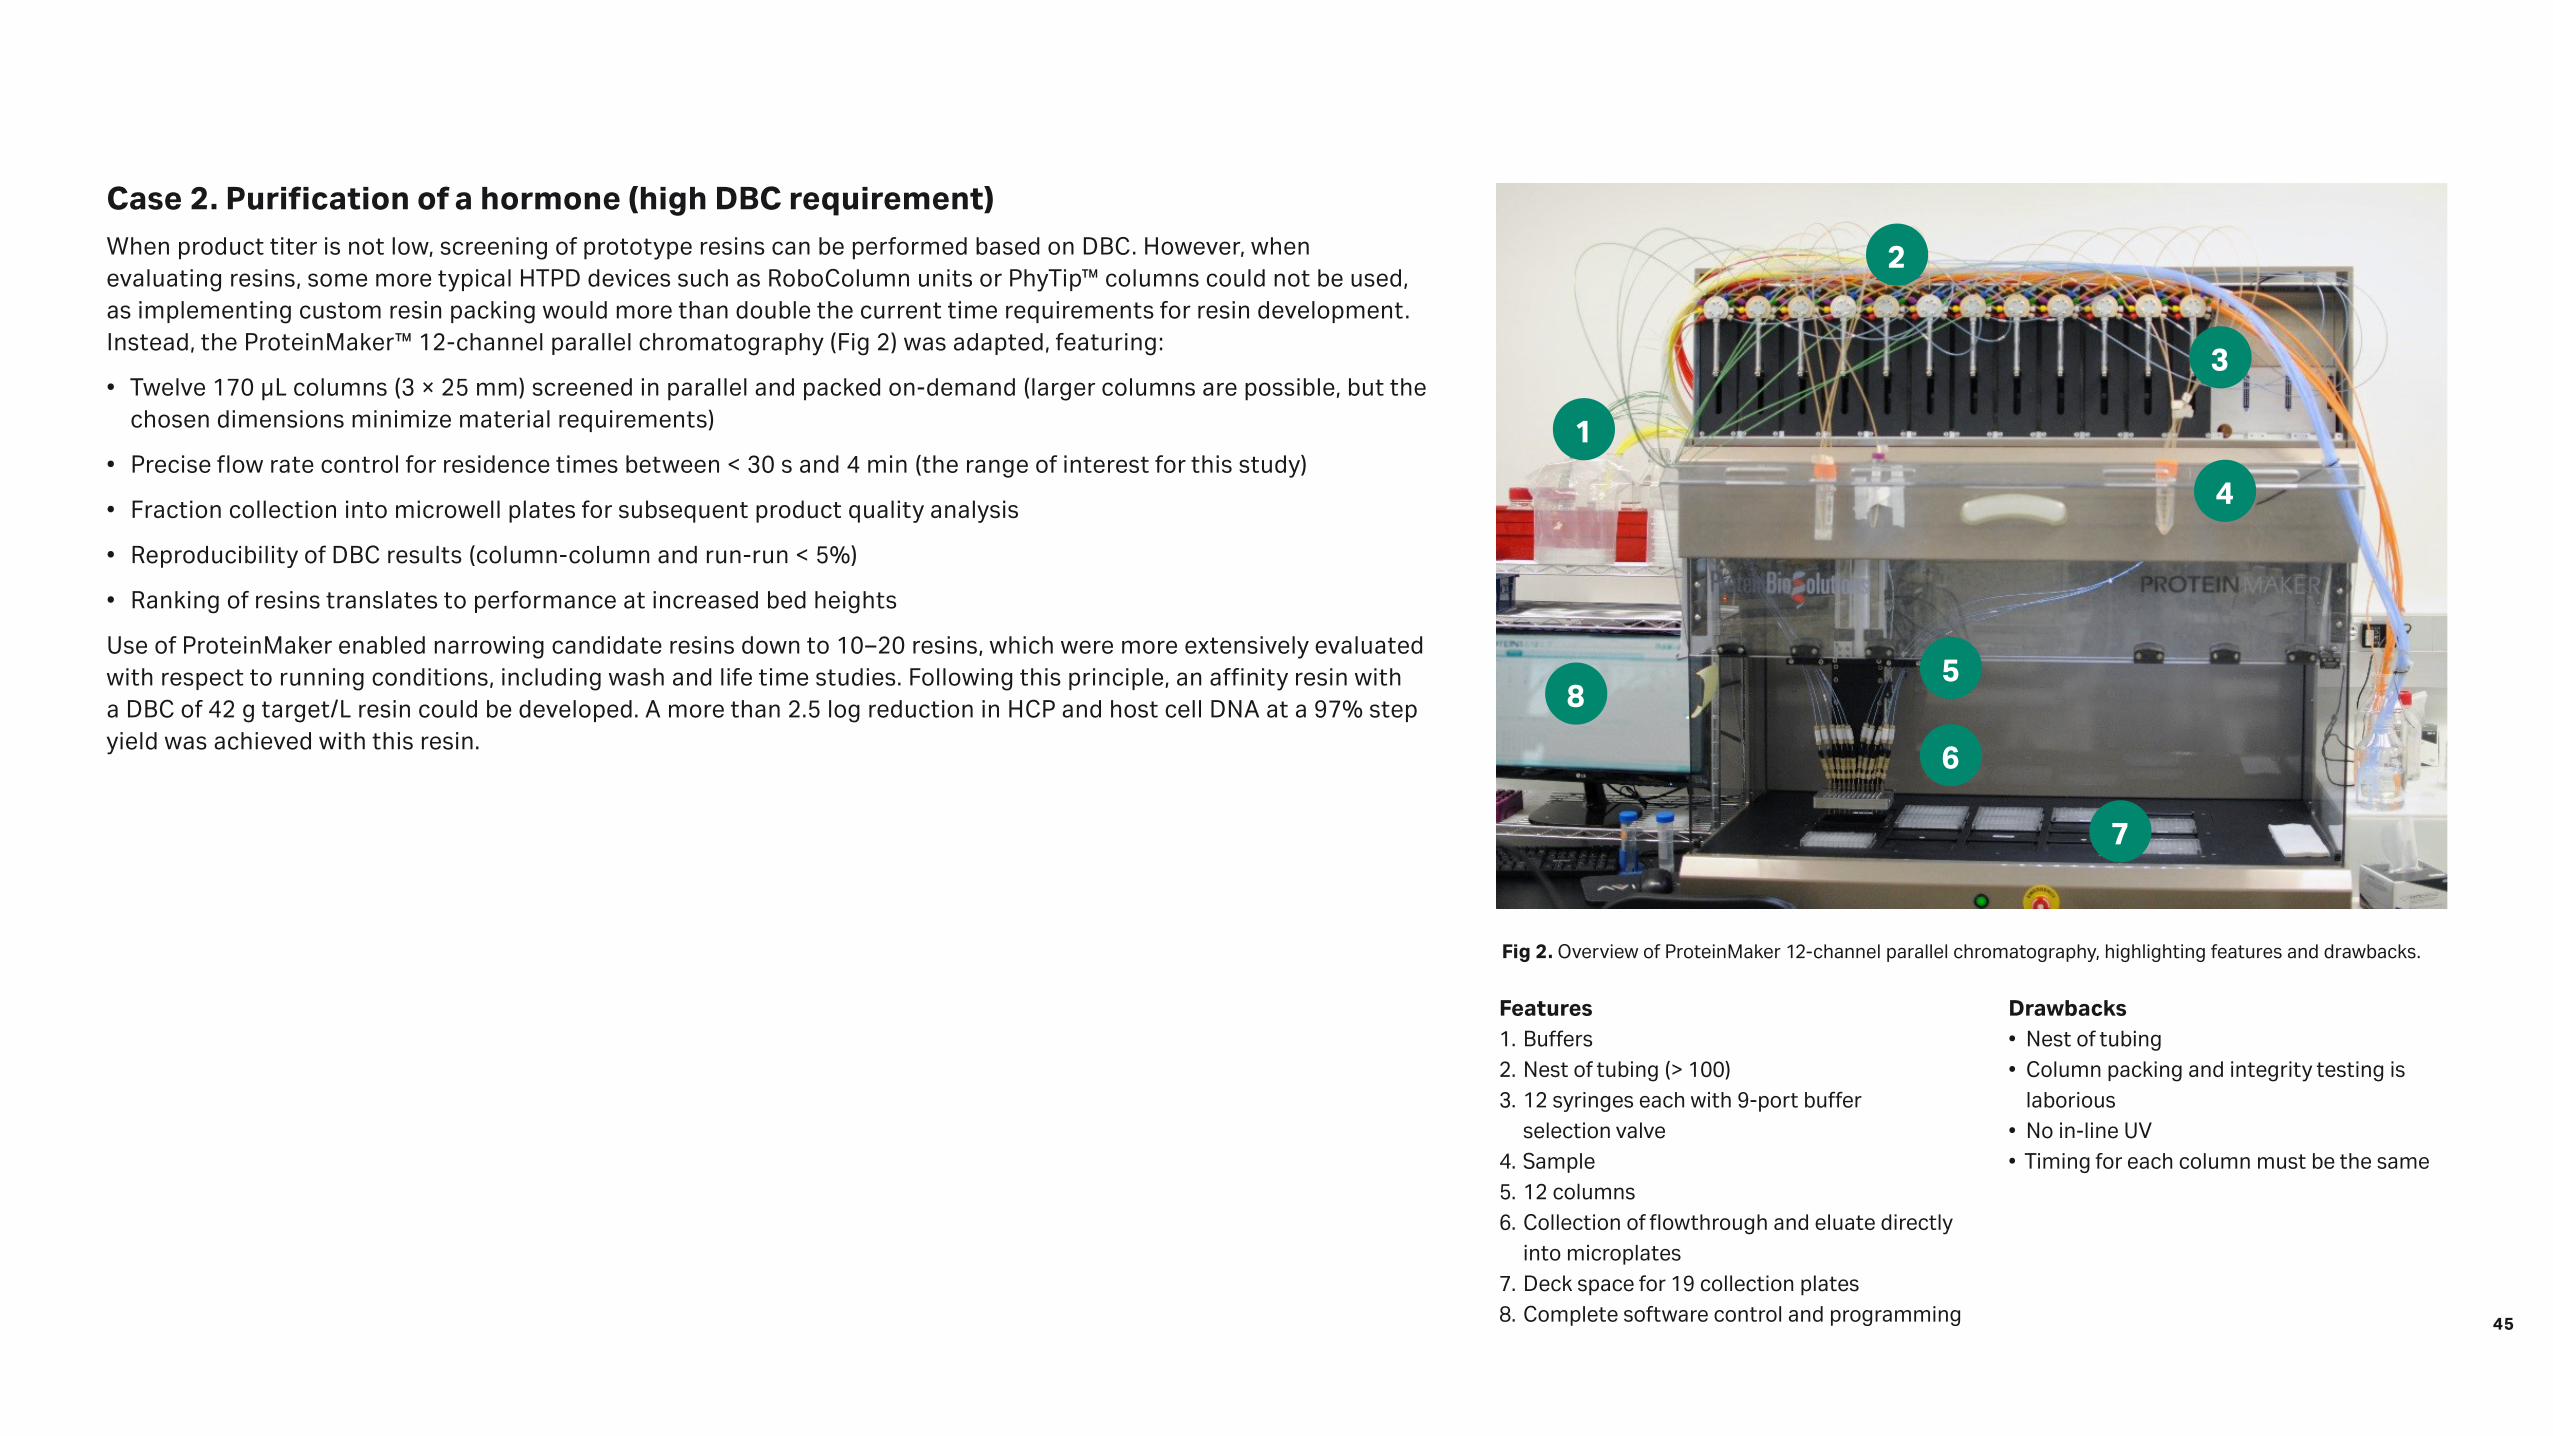
Case 2. Purification of a hormone (high DBC requirement)When product titer is not low, screening of prototype resins can be performed based on DBC. However, when evaluating resins, some more typical HTPD devices such as RoboColumn units or PhyTip™ columns could not be used, as implementing custom resin packing would more than double the current time requirements for resin development. Instead, the ProteinMaker™ 12-channel parallel chromatography (Fig 2) was adapted, featuring:
• Twelve 170 µL columns (3 × 25 mm) screened in parallel and packed on-demand (larger columns are possible, but the chosen dimensions minimize material requirements)
• Precise flow rate control for residence times between < 30 s and 4 min (the range of interest for this study)
• Fraction collection into microwell plates for subsequent product quality analysis
• Reproducibility of DBC results (column-column and run-run < 5%)
• Ranking of resins translates to performance at increased bed heights
Use of ProteinMaker enabled narrowing candidate resins down to 10–20 resins, which were more extensively evaluated with respect to running conditions, including wash and life time studies. Following this principle, an affinity resin with a DBC of 42 g target/L resin could be developed. A more than 2.5 log reduction in HCP and host cell DNA at a 97% step yield was achieved with this resin.
Fig 2. Overview of ProteinMaker 12-channel parallel chromatography, highlighting features and drawbacks.
3
4
1
2
6
58
7
Features1. Buffers2. Nest of tubing (> 100)3. 12 syringes each with 9-port buffer
selection valve4. Sample5. 12 columns6. Collection of flowthrough and eluate directly
into microplates7. Deck space for 19 collection plates8. Complete software control and programming
Drawbacks• Nest of tubing• Column packing and integrity testing is
laborious• No in-line UV• Timing for each column must be the same
45
Case 3. Development of affinity resin for removal of product-related impuritiesOne of the most powerful aspects of custom affinity resins is the possibility to discover a ligand that will separate a desired form of the product from product-related impurities. This type of separation is often the most challenging to perform with traditional separation techniques, as the impurities share many properties with the target molecule. However, a custom affinity resin that can target the subtle differences can provide ideal purification solution for such cases.
One of the major difficulties in developing resins with this type of selectivity is the analytical burden required to evaluate the resin performance. Many of the analyses are complex, but still need to be high-throughput. Avitide approaches the analytical challenge differently. Instead of separating teams in siloes, the Process Development and Analytics teams are integrated. This approach results in more cross-training between these traditionally separated teams. Avitide also leverages walk-up solutions, which allow for all the team members to generate and access data as soon as possible from each experiment. The diverse range of molecules that Avitide is asked to work with requires that some analyses are specific to each project. Robotic sample preparation and processing have greatly facilitated both quick method adoption and result generation, enabling the teams to evaluate resins quickly and be agile in iterating the experiments.
46

Case 4. Development of an affinity resin for a gene therapy vector Development of an affinity resin for capture of adeno-associated virus (AAV) gene therapy vectors creates one of the more difficult resin development challenges. In many ways, the work incorporates each of the same issues identified in case studies 1 to 3, but it also adds the complexity that arises by virtue of the size of the target. An AAV has a weight of approximately 6 MDa and a diameter of approximately 25 nm. Therefore, to make sure that the best resin will be developed, more base matrices (resins) and resin chemistries than in any other campaign were surveyed. This approach resulted in a multiple-fold increase in the number of affinity resin prototypes that were developed and tested. As affinity purification is a combination of, not only capture, but also elution and cleaning, it is perhaps testimony to the feature that the ideal resin for this application was based on an agarose base matrix. The resin delivered high binding capacity, gentle elution conditions, 93% yield, and a 3 log HCP reduction. Although only a 10 cycle life time was required for this (disposable) resin, the alkaline-stable ligand could have allowed many more cycles.
Final resin selection and scalabilityStep elution, inherently scalableUtilization of HTPD and miniaturized formats can be used as filters for selection of the best affinity resins. As a result, only a few prototypes will proceed to the largest R&D column dimensions for confirmation and demonstration of resin performance under conditions designed for scalability. Finally, the customer can further evaluate the resins with propriety buffers and facility fit considerations. Ultimately, the same metrics used by Avitide for resin evaluation during development become the basis of quality control and release assays when the resin transitions to the resin manufacturing facility for scale-up and supply in larger quantities.
47

Integrated process development: case studies for high quality analysis of upstream screeningsCornelia Walther1, Simon Haidinger1, Dario Boras1, Sophie Fröhlich1, Astrid Dürauer2, and Cecile Brocard1
1 Boehringer-Ingelheim RCV, Dr. Boehringer Gasse 5-11, 1121 Vienna, Austria
2 University of Natural Resources and Life Sciences Vienna, Muthgasse 18, 1190 Vienna, Austria
10
48

E. coli is a well-established host for low-cost and high-yield production of non-glycosylated proteins often difficult to produce in other hosts. Proteins overexpressed in this bacterial host tend to be deposited in inclusion bodies (IBs), which represent an easy-to-harvest source of highly pure product.
Development and trouble-solving activities for upstream processes, regularly carried out in form of design of experiments (DoE), are usually based on evaluation of product titers only. Yet, high titer does not necessarily guarantee success for the subsequent downstream process, a crucial step for the overall productivity of the production process. Therefore, process development and optimization work should consider the entire process chain, including each unit operation. Integration of DoE approaches results in numerous experiments, and such optimization can only be timely achieved using a parallelized high-throughput approach at micro scale.
We recently established a high-throughput platform, connecting extensive upstream DoE setups to recovery of active protein from IBs. Figure 1 presents our miniaturized and automated high-throughput purification process chain for proteins expressed in inclusion bodies. The combined unit operations comprise cell harvest, cell disruption and IB preparation, solubilization, refolding, and chromatographic purification. All unit operations are performed in 96-well plates on a liquid handling system (Tecan) except for cell disintegration, which is performed using a mechanical bead mill (1–3).
Our investigations on the resolution capabilities of the process chain confirmed that purity differences of at least 2% can be distinguished after processing (data not shown). Afterwards, we examined the predictive capability of the miniaturized process for bench-scale runs (Fig 2). The absolute values for recovery of protein and purity differed between scales. This can be explained by the better purification capabilities of a packed chromatography column in comparison to batch processes. However, the trends determined for product quality derived from different fermentations were comparable between scales. The fermentation with the highest recovery in micro scale also showed the highest recovery in bench scale and vice versa (Fig 2A). The same was shown for the purity. The highest purity in micro scale was obtained for the fermentation that also showed the highest purity in bench scale and vice versa (Fig 2B) (3). Therefore, we conclude that the developed miniaturized platform is predictive for bench scale regarding trends between fermentations.
Cell harvest• Centrifugation
Cell disintegration/IB preparation• Bead mill
• SDS-PAGE/PicoGreen™
IB solubilization• Follow via turbidity decrease in micro titer plate
• SDS-PAGE
IB refolding• Follow via turbidity and intrinsic fluorescence in micro titer plate
• SDS-PAGE
Chromatography• Follow via UV in batch
• SDS-PAGE/HPLC/MS
Fig 1. Miniaturized, automated high-throughput process development for non-platform molecules expressed as inclusion bodies in E. coli.
Fermentation
F1 F2 F3
g p
rod
uct
/L fe
rme
nta
tio
n
0
0.2
0.4
0.6
0.8
1.0
1.2
1.4 Micro scale Bench scale
Micro scale Bench scale
Fermentation
F1 F2 F3
SE
C p
uri
ty [%
]
50
60
70
80
90
100
Fig 2. Predictive capability of miniaturized purification platform. (A) Recovery of product after complete purification compared between micro and bench scales. (B) Purity of final purified material determined by size exclusion chromatography (SEC)-HPLC for bench and micro scales.
(A) (B)
49

Fig 3. Influence of certain upstream parameters on production/abundance of a mass variant. Orange: variant is present. Green: variant is not present. (A) Four different medium compositions were tested and analysis was performed at four time points during fermentation. (B) Six codon usage variants and three strains were analyzed for their influence on the mass variant.
Medium composition
Induction duration (h)
3 5 7 9
1
2
3
4
Codon usage variant
Strain
1 2 3
1
2
3
4
5
6
(A) (B)The platform can be used to support upstream development or for trouble-solving activities. Figure 3 shows an application for trouble-solving activities. Here, an additional mass variant of the product was present in the final drug substance. An assumption was that upstream-related events were involved in the occurrence of this variant. Thus, different upstream parameters were investigated for their influence on the production of the variant. The presence of the variant was analyzed by mass spectrometry which required the purification of each fermentation sample prior to the analysis. The production of the variant was not influenced by medium composition or length of the fermentation (Fig 3A). Irrespective of these parameters, the variant was always present. In contrast, the investigation of variants designed by different codon usage revealed one variant that did not produce the previously observed mass variant regardless of the E. coli strain tested (Fig 3B). Therefore, by changing the codon usage, it was possible to produce the product without the undesired mass variant.
50

Fig 4. 3D surface plots obtained after certain processing steps for a DoE carried out for fermentation optimization. (A) Titer as result at end of fermentation. (B) Recovery of IBs produced per L fermentation after IB preparation. (C) Recovery of purified protein per L fermentation after complete processing.
9.5
10.5
11.5
12.5
13.5
14.5
15.5
6.2
6.5
6.8
7.1
7.4
0
2
4
6
8
10
12
14
Tite
r (g
/L)
pHInductiontime point (h)
9.5 10.5
11.5 12.5
13.5 14.5
15.5
6.2
6.5
6.8
7.1
7.4
0
1
2
3
4
5
6
7
IB g
pro
duct
/L fe
rmen
tati
on
pHInductiontime point (h) 9.5
10.5
11.5
12.5
13.5
14.5
15.5
6.2
6.5
6.8
7.1
7.4
0
0.2
0.4
0.6
0.8
1
g pr
oduc
t/L
ferm
enta
tion
M
P IE
X (g
/L)
pHInductiontime point (h)
(A) (B) (C)
The platform can also be used for optimization of fermentation processes. A fermentation DoE was carried out where temperature, pH, and induction time point were varied. The fermentations were thereafter processed on the micro-scale platform. Besides the fermentation titer, also the IB yield and quality, refolding yield, as well as yield and purity after chromatography could be used for evaluation of the DoE (Fig 4). Fermentation temperature and induction time point were found to be significant parameters for the product titer. Late induction and lower temperature were beneficial for the process if only the product titer was taken into account (Fig 4A). Taking the IB preparation step into consideration, different results were obtained (Fig 4B). While late induction was still beneficial for the IB yield, lower fermentation temperature showed no beneficial influence on the IB yield anymore. This is due to the higher product loss during the IB preparation for fermentations conducted at lower temperature. Moreover, the quality of these IBs based on compactness and product content was not as good as for mid- and high temperatures. Taking into consideration the preparation of the IBs, it appears that only the induction time point was a significant DoE parameter. This was confirmed by the data obtained including the refolding and capture step (Fig 4C). Also here, late induction showed to be beneficial for the overall productivity. Based on these results, mid pH and temperature and the latest induction time point were selected as optimized conditions.
51

Compared to a traditional sequential bench-scale approach, utilization of our high-throughput platform resulted in reduced time and material consumption. Only 2 g of biomass were required for each upstream condition tested, instead of the 200 g required for bench-scale experiments. The processing of 24 different fermentation conditions was carried out in 7 days, instead of 120 days using the conventional approach. Furthermore, the very low material consumption allows for evaluation of multiple time points during fermentation, thereby supporting optimization of the fermentation duration.
In conclusion, we developed a micro-scale purification process chain that is predictive for bench scale and can resolve purity differences of at least 2%. The system can be used for trouble-solving as well as for optimization of upstream processes. Adoption of the miniaturized process generates broader data sets and improves early process understanding. As an additional benefit, each unit operation can be separately performed and used for development of downstream processes.
References1. Walther, C., Kellner, M., Berkemeyer, M., Brocard, C., Dürauer, A. A microscale bacterial cell disruption technique as
first step for automated and miniaturized process development. Process Biochemistry 59, 207–215 (2017).
2. Walther, C., Kellner, M., Berkemeyer, M., Brocard, C., Dürauer, A. Integrated process development — a robust, rapid method for inclusion body harvesting and processing at the microscale level. Preparative Biochemistry and Biotechnology 47, 874–880 (2017).
3. Walther, C., Boras, D., Demmel, L., Berkemeyer, M., et al. Integrated process development-quality by design compliant evaluation of upstream variations on a microscale. J Chem Technol Biotechnol DOI 10.1002/jctb.5407 (2017).
52

Progress and challenges in high-throughput stability screening at GenentechDavid Smithson, Jia Sun, Katherine Tschudi, Louis-Xavier Barrette, Yilma Adem, and Bill Galush
Genentech Inc., South San Francisco, CA USA
11
53

IntroductionAs protein therapeutics become more structurally diverse, the need to evaluate a wider range of formulation conditions and rapidly predict long term stability with minimal material demands increases. Technologies that can enable this assessment must demonstrate high levels of sensitivity, accuracy, and most importantly, show relevant degradation mechanisms known to occur in final drug product configurations. Our group has recently evaluated two approaches to increase our overall throughput, while minimizing material utilization.
Application of high-throughput methods to assess physical stabilityPhysical instability of therapeutic proteins, especially aggregate formation, can affect the potency of the drug or cause immunogenicity (1). Proteins can associate in the native state or the monomers can unfold, causing the hydrophobic regions to interact and aggregate (2). By choosing appropriate buffers, excipients, ionic strength, and pH conditions, the formation of aggregates in protein formulations at their storage temperature condition (5°C) can be minimized.
During formulation development, accelerated thermal stress studies are performed at higher temperatures (30°C or 40°C) to assess the risk of shelf-life-limiting aggregate formation and other physicochemical properties. Using the principles of the Arrhenius equation, the kinetics of aggregate formation at the storage temperature (5°C) can be predicted from the degradation that occurs at higher temperatures. However, as the risk of aggregation caused by unfolding is low at 5°C, the accelerated stress conditions need to be selected thoughtfully to avoid aggregation of thermally unfolded proteins and ensure relevant degradation mechanisms.
Traditionally, differential scanning calorimetry (DSC) is used to measure the temperature at which the protein starts to unfold (Tonset). Unfortunately, DSC results do not provide information on when the protein starts to aggregate due to this unfolding, making it challenging to determine an appropriate stress temperature for accelerated stability studies on DSC data alone. To obtain this information, static light scattering (SLS) can be used to assess the relationship between unfolding and aggregation. Scattering intensity in a protein formulation increases with the formation of dimers and multimers. The changes in scattering intensity can be monitored across a thermal ramp to identify the temperature at which a protein starts to form aggregates and multimers (Tagg).
In this study, we measured the SLS of two IgG4 mAbs (Proteins 1 and 2) that have the same Tonset, using the same thermal ramp. The mAbs were formulated at 1 mg/mL protein concentration; Protein 1 was formulated in high ionic strength buffer and Protein 2 in low ionic strength buffer at the same pH. The SLS results of the Protein 1 formulation showed large changes in scattering intensity and the scattering intensity increased sharply at the Tonset. There was a small differential between the Tonset and the Tagg, suggesting that Protein 1 in the high ionic strength formulation rapidly aggregated post unfolding. If this Protein 1 formulation was stressed at a temperature close to the Tonset, the unfolded protein could form aggregates unrepresentative of those formed at 5°C. In contrast, the Protein 2 formulation showed little 54

changes in scattering intensity even when heated up to 90°C, suggesting that Protein 2 does not rapidly aggregate upon unfolding in the low ionic strength buffer. Despite the similar Tonset between the Protein 1 formulation and the Protein 2 formulation, the Protein 1 formulation had a small differential between the onset of unfolding and the onset of aggregation, whereas the Protein 2 formulation had a large offset between Tonset and Tagg. In a follow-up study (not presented at the conference), two mAbs formulated in the same buffer and pH conditions showed different light scattering profiles. The mAb with similar Tonset and Tagg aggregated at lower temperatures, whereas the mAb with larger differential between Tonset and Tagg showed minimal change in light scattering intensity, suggesting a lower propensity for aggregates induced by protein unfolding.
In order to understand the effect of temperature on aggregate formation, both mAbs were stressed at 30°C and 40°C for six and four weeks, respectively. As a comparison, both mAbs were also stored at 5°C for nine months. At 30°C and 40°C stress conditions, Protein 1 formed a large amount of multimers. However, these multimers were not observed after nine month’s storage at 5°C, which indicated that the degradation mechanisms at 30°C and 40°C were not relevant to 5°C storage. Protein 2 exhibited a different behavior than Protein 1, which is expected because of the large differential between Tonset and Tagg. The dimers formed post 40°C stress corresponded to those formed after nine months at 5°C. Post 30°C stress, the degradation products formed were within assay variability. For Protein 2, a higher stress temperature was appropriate and allowed for measurable aggregation to occur on more accelerated timescales. The differences in degradation products post-accelerated stress and the offsets between Tonset and Tagg for Protein 1 and Protein 2 suggested that Protein 2 has stabilizing colloidal forces that limit aggregation of the protein even when unfolded.
We are investigating further how to leverage the dissociation constant (Kd), Tonset , and Tagg to design appropriate formulation spaces in terms of protein concentration, ionic strength, and pH. In the future, formulations could be characterized by these parameters to identify shelf-life-limiting risks early. The combination of SLS and DSC measurements can provide additional information on the impact of unfolding on physical stability and better inform stress temperature decisions. Combining this data with parameters from other techniques such as dynamic light scattering (DLS) can also be useful in creating better predictive models for understanding thermal stress and shelf-life stability of mAbs.
55

Evaluation of miniaturized containers for formulation developmentHigh-throughput screening has been successfully employed in many pharmaceutical development areas such as cell culture and protein purification. In spite of this, there has been limited implementation of this technology in the formulation development process. One of the major concerns voiced by many formulation groups is that changes in the materials of contact during stability testing will result in different degradation mechanisms than observed in final drug product configurations. However, the standard 2CC glass vials used in the current formulation development screens are difficult to handle by using typical laboratory liquid handling systems. The 2CC glass vials are also relatively large, require a high filling volume, and have low recovery volumes due to the internal geometry. Therefore, a miniaturized automation-friendly container that shows degradation patterns consistent with those observed in drug product containers (2CC glass vials) must be identified prior to applying high-throughput technology in the area of formulation development.
In this study, different types of automation-friendly glass and plastic vials were evaluated with the standard 2CC glass vials. Figure 1 displays all the vials that were used in this study. Two predefined formulations of a mAb (Protein 3) were prepared and filled at 50% of the capacity of each container. One formulation (worst case) was known to result in oxidative degradation of Protein 3 under accelerated thermal stress. This formulation had also previously shown differential stability patterns in glass vials and polypropylene (PP) microplates. The second formulation (negative control) does not cause oxidative degradation and had shown consistent degradation patterns of Protein 3 in both glass vials and PP microplates. All containers were incubated at 40°C for four weeks to compare protein degradation patterns between 2CC glass vials and all other types of containers.
After four weeks of thermal stress at 40°C, peptide mapping by liquid chromatography-mass spectrometry (LC/MS) was performed for all the samples to detect protein oxidation. The data are summarized in Table 1. As the data shows, the oxidation level is relatively low for all the containers filled with negative control samples. For the worst-case formulation, the plastic containers (Vials 4, 5, and 6) show relatively low oxidation levels, which are comparable with the negative controls. Concerningly, all glass vials showed different levels of oxidation, with none matching the standard 2CC glass vial configuration.
As the data shows from this study, there is a significant difference between the standard 2CC glass vial and other glass and plastic vials in terms of protein oxidation under thermal stressed condition. Further experimentation demonstrated that observed oxidation patterns were likely due to leachables from the glass and that expected oxidation could be triggered in some plastics by spiking in water or buffer exposed to glass at elevated temperatures. Further studies will be needed to characterize the active glass leachable and enable representative miniaturized stability testing.
1 2 3 4 5 6
Fig 1. Different types of glass and plastic vials. 1: Standard 2CC, 2: high recovery glass, 3: glass 2, 4: PP 600 μL cryo, 5: low-bind PP flip-top, 6: PP 2 mL cryo.
Table 1. Protein oxidation in all containers after 4 weeks at 40°C
Sample Oxidation (%)
Negative control T0 2
1 (standard 2CC glass vial) 2.6
2 (high recovery glass) 2.6
3 (glass 2) 2.7
4 (PP 600 μL cryo) 2.7
5 (low-bind PP flip-top) 2.6
6 (PP 2 mL cryo) 3.9
Worst case formulation T0 1.9
1 (standard 2CC glass vial) 35.5
2 (high recovery glass) 15.6
3 (glass 2) 17.1
4 (PP 600 μL cryo) 5.1
5 (low-bind PP flip-top) 5
6 (PP 2 mL cryo) 6.5
56
References1. Moussa, E.M., Panchal, J.P., Moorthy, B.S., Blum, J.S., Joubert, M.K., Narhi, L.O., & Topp, E.M. Immunogenicity of
therapeutic protein aggregates. Journal of pharmaceutical sciences 105, 417–430. (2016).
2. Roberts, C. J. Therapeutic protein aggregation: mechanisms, design, and control. Trends in biotechnology 32, 372–380 (2014).
57

Understanding RoboColumn scale offsets and exploring the use of RoboColumn units as a scale-down modelMichael Chinn, John Lazzareschi, Jerry Bill, and Benjamin Tran
Purification Development, Genentech, South San Francisco
12
58
IntroductionHigh-throughput screening (HTS) methods have become increasingly utilized in biopharmaceutical process development to meet the demands of accelerated timelines and novel molecule formats. In particular, purification process development groups have predominately used two HTS techniques for chromatography process development: 96-well batch binding screens [1, 2, 3] and parallelized mini-chromatography columns (RoboColumn units) [3, 4, 5]. These high-throughput techniques are frequently used in chromatography development workflows [2, 4], and preliminary studies have shown the potential of utilizing HTS techniques in process validation and characterization [5, 6]. Of these two techniques, RoboColumn units are most similar to bench-scale columns, due to their dynamic mode of operation and have been identified as most comparable and scalable to conventional chromatography [6].
While the scale comparability of RoboColumn units to bench-scale chromatography has previously been assessed [4, 5, 6], an understanding of how scale offsets vary with process parameters has yet to be systematically explored. In this work, we demonstrate how scale offsets for monoclonal antibody (mAb) yield, pool volume, and impurity clearance will vary with process parameters for two model bind-and-step-elute chromatography processes: cation exchange (CEX) chromatography and Protein A chromatography. Specifically, we investigated the effect of CEX load density and elution buffer strength on yield, pool volume, and aggregate clearance, and assessed the effect of Protein A wash buffer strength and wash phase duration on host cell protein (HCP) clearance. We propose that the observed scale offsets are primarily driven by an exacerbation of peak broadening at RoboColumn scale, which is a result of RoboColumn geometry [4]. By understanding how scale offsets vary with process parameters, we can enable better prediction of bench-scale column performance and utilization of the RoboColumn format as a scale-down model in process characterization studies.
Column chromatographyMiniaturized, packed-bed chromatography columns (OPUS™ RoboColumn, Repligen) with a 1 cm inner diameter and 3 cm bed height, run with Tecan Freedom EVO robotic liquid handlers, were used for all studies. Packed-bed, bench-scale chromatography was performed on 0.66 to 1 cm inner diameter columns with a bed height of 20 cm. Identical CEX and Protein A chromatography experiments were performed at RoboColumn and bench scale using 3 mAb feedstocks; and yield, pool volume, and impurity clearance were compared. Load and pool fractions were measured for protein concentration by UV absorption, aggregates by size exclusion chromatography (SEC)-HPLC, and phospholipase B-like 2 (PLBL2) using a multi-product ELISA.
59
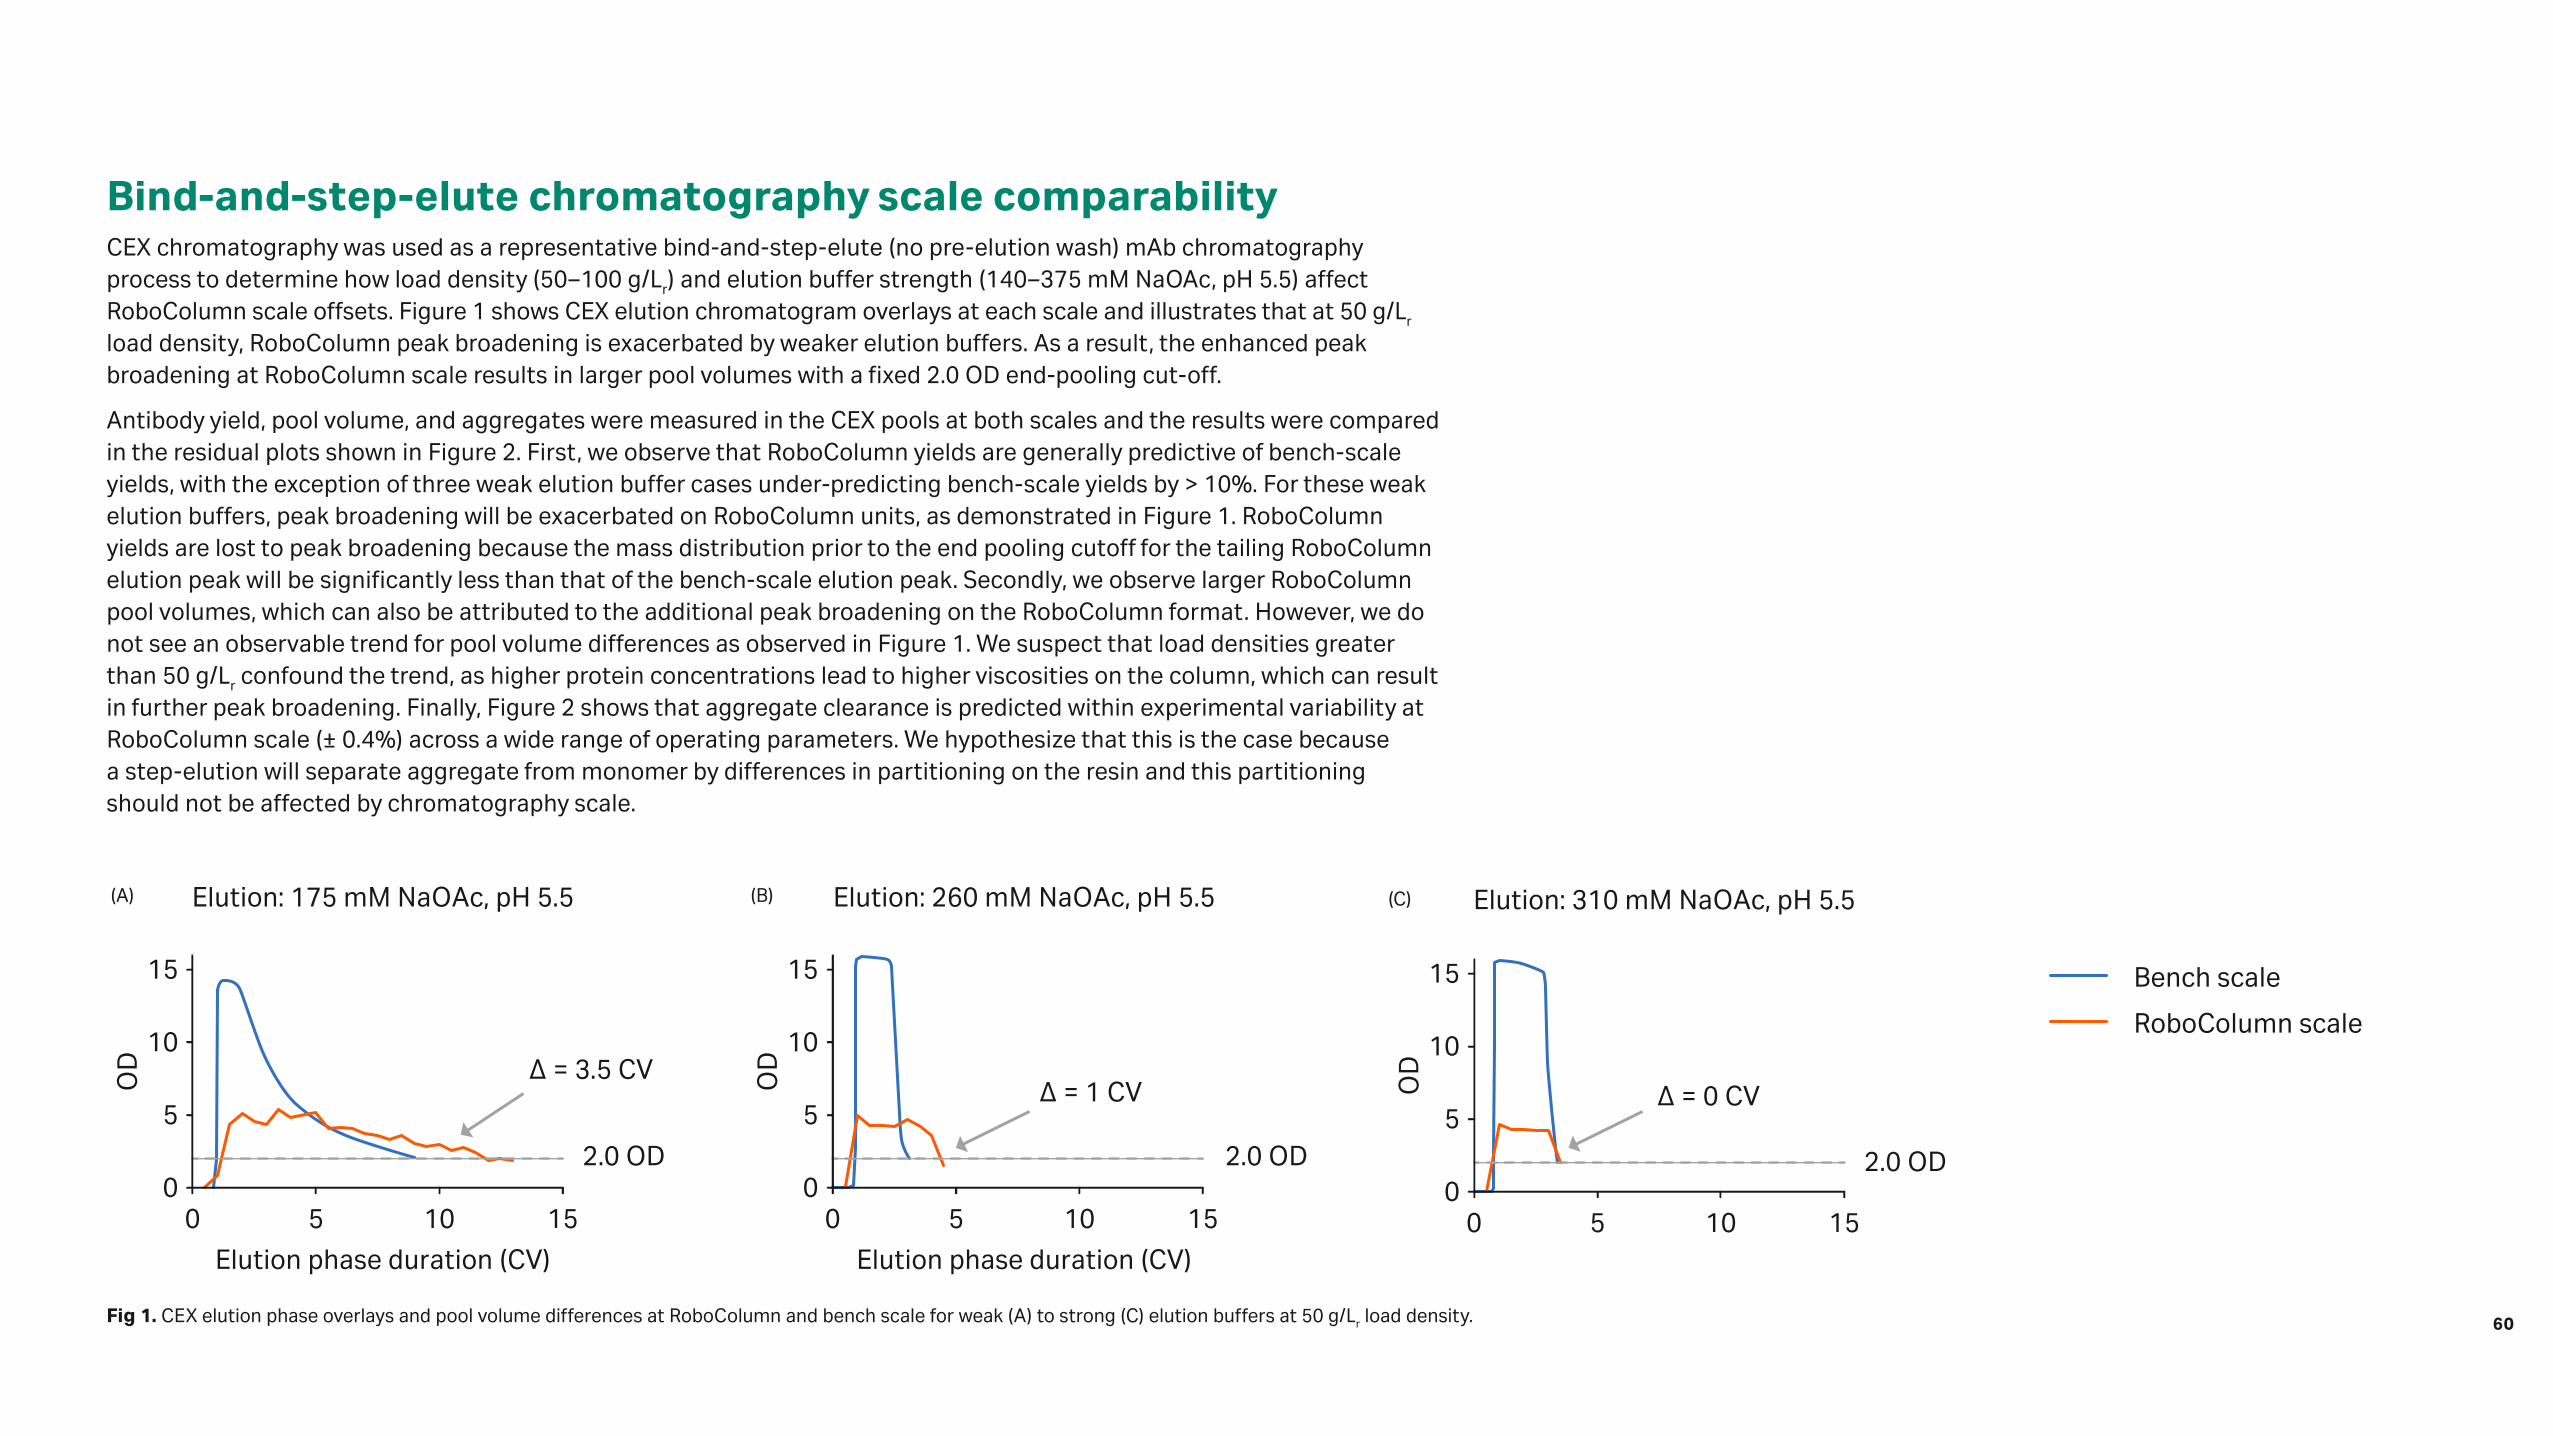
Bind-and-step-elute chromatography scale comparabilityCEX chromatography was used as a representative bind-and-step-elute (no pre-elution wash) mAb chromatography process to determine how load density (50–100 g/Lr) and elution buffer strength (140–375 mM NaOAc, pH 5.5) affect RoboColumn scale offsets. Figure 1 shows CEX elution chromatogram overlays at each scale and illustrates that at 50 g/Lr load density, RoboColumn peak broadening is exacerbated by weaker elution buffers. As a result, the enhanced peak broadening at RoboColumn scale results in larger pool volumes with a fixed 2.0 OD end-pooling cut-off.
Antibody yield, pool volume, and aggregates were measured in the CEX pools at both scales and the results were compared in the residual plots shown in Figure 2. First, we observe that RoboColumn yields are generally predictive of bench-scale yields, with the exception of three weak elution buffer cases under-predicting bench-scale yields by > 10%. For these weak elution buffers, peak broadening will be exacerbated on RoboColumn units, as demonstrated in Figure 1. RoboColumn yields are lost to peak broadening because the mass distribution prior to the end pooling cutoff for the tailing RoboColumn elution peak will be significantly less than that of the bench-scale elution peak. Secondly, we observe larger RoboColumn pool volumes, which can also be attributed to the additional peak broadening on the RoboColumn format. However, we do not see an observable trend for pool volume differences as observed in Figure 1. We suspect that load densities greater than 50 g/Lr confound the trend, as higher protein concentrations lead to higher viscosities on the column, which can result in further peak broadening. Finally, Figure 2 shows that aggregate clearance is predicted within experimental variability at RoboColumn scale (± 0.4%) across a wide range of operating parameters. We hypothesize that this is the case because a step-elution will separate aggregate from monomer by differences in partitioning on the resin and this partitioning should not be affected by chromatography scale.
Fig 1. CEX elution phase overlays and pool volume differences at RoboColumn and bench scale for weak (A) to strong (C) elution buffers at 50 g/Lr load density.
∆ = 1 CV
∆ = 0 CV
2.0 OD
2.0 OD
2.0 OD
∆ = 3.5 CV
Elution: 175 mM NaOAc, pH 5.5
Bench scale
RoboColumn scale
15
10
OD
Elution phase duration (CV)
5
00 5 10 15
15
10
OD
Elution phase duration (CV)
5
00 5 10 15
15
10
OD
Elution phase duration (CV)
5
00 5 10 15
Elution: 260 mM NaOAc, pH 5.5
Elution: 310 mM NaOAc, pH 5.5
(A) (B) (C)
60

% y
ield
diff
eren
ce(R
oboC
olum
n-be
nch)
-20
-10
0
10
20
50 60 70 80 90
Bench-scale yield (%)
Yield residuals
Poo
l vol
ume
diff
eren
ce(R
oboC
olum
n-be
nch)
-4
-2
0
2
4
2 4 6 8 10 12
Bench-scale pool volume (CV)
Pool volume residuals
% a
ggre
gate
diff
eren
ce(R
oboC
olum
n-be
nch)
-0.4
-0.2
0
0.2
0.4
0 1 2 3 4 5
Bench-scale HMWS (%)
Aggregate residuals
Bind-wash-step-elute chromatography scale comparabilityProtein A chromatography was used as a representative bind-and-step-elute process to assess how wash process parameters affect RoboColumn scale offsets. Specifically, we probed the effect of varying concentration of salt species A from 0 to 1000 mM and wash phase duration (0–8 column volumes) on PLBL2 clearance. The data is summarized in Figure 3 and show that PLBL2 in mAb Protein A pools is reduced as wash buffer strength (salt concentration) and phase duration increase. Additionally, Figure 3 illustrates that RoboColumn Protein A pools will have higher [PLBL2] than corresponding bench-scale Protein A pools. The difference in PLBL2 between scales decreases with wash buffer strength and decreases, then plateaus, with wash buffer phase duration. Thus, we can expect that impurity clearance by wash phases on RoboColumn units will be decreased relative to bench-scale clearance. This offset will decrease as wash buffer strength and phase duration increase.
We hypothesize that the wash phase impurity offset can also be attributed to exacerbated peak broadening on RoboColumn units. Similar to how mAb peak broadening increases with weaker elution buffer, as illustrated in Figure 1, HCP peak broadening will increase with weaker wash buffers. With an increase in HCP peak broadening and a fixed wash duration, RoboColumn units will clear less HCP in the wash phase. As HCP peak broadening is decreased with stronger wash buffers, the difference in HCP clearance will decrease, as illustrated in Figure 3.
% y
ield
diff
eren
ce(R
oboC
olum
n-be
nch)
-20
-10
0
10
20
50 60 70 80 90
Bench-scale yield (%)
Yield residuals
Poo
l vol
ume
diff
eren
ce(R
oboC
olum
n-be
nch)
-4
-2
0
2
4
2 4 6 8 10 12
Bench-scale pool volume (CV)
Pool volume residuals
% a
ggre
gate
diff
eren
ce(R
oboC
olum
n-be
nch)
-0.4
-0.2
0
0.2
0.4
0 1 2 3 4 5
Bench-scale HMWS (%)
Aggregate residuals
Fig 2. Absolute difference between RoboColumn CEX pools and bench-scale CEX pools for yield, pool volume, and aggregates (high molecular weight species [HMWS]) for two mAbs.
(A) (C)(B)
61
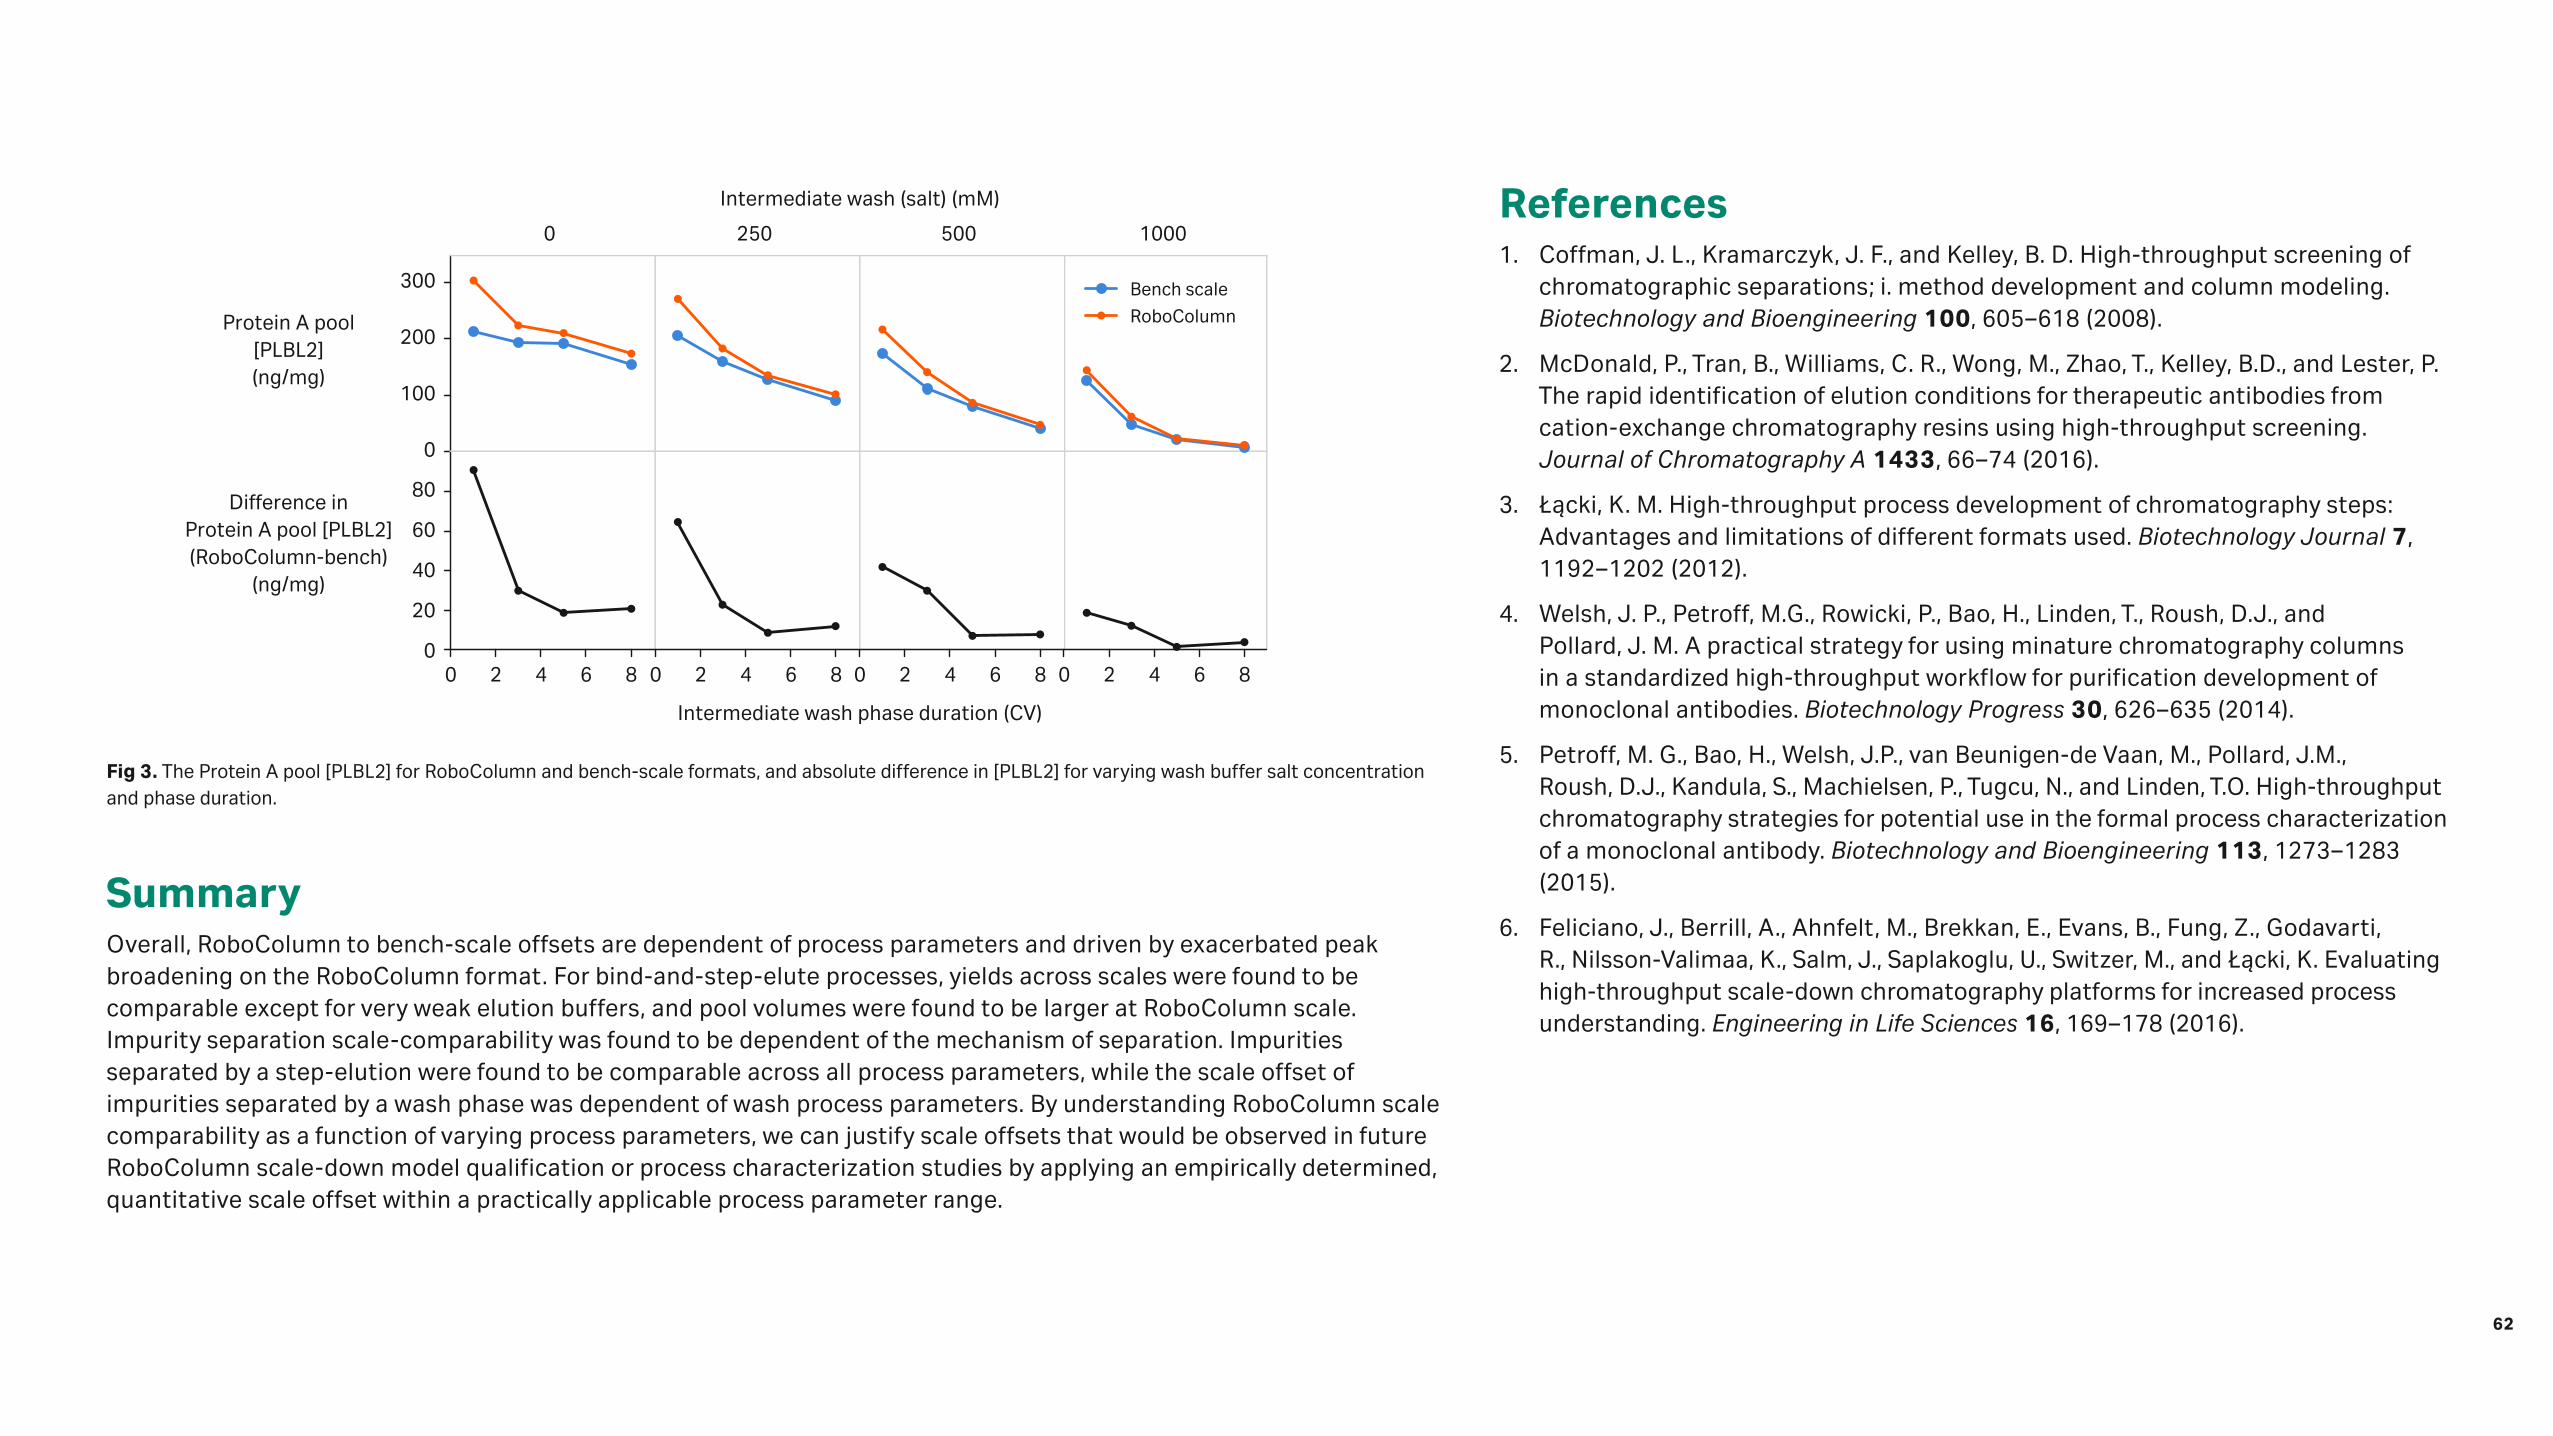
Bench scale
RoboColumn
300
200
100
00 2 4 6 8 0 2 4 6 8
Intermediate wash phase duration (CV)
Intermediate wash (salt) (mM)
Protein A pool[PLBL2](ng/mg)
Difference in Protein A pool [PLBL2](RoboColumn-bench)
(ng/mg)
0 2 4 6 8 0 2 4
0 250 500 1000
6 8
0
80
60
40
20
Fig 3. The Protein A pool [PLBL2] for RoboColumn and bench-scale formats, and absolute difference in [PLBL2] for varying wash buffer salt concentration and phase duration.
SummaryOverall, RoboColumn to bench-scale offsets are dependent of process parameters and driven by exacerbated peak broadening on the RoboColumn format. For bind-and-step-elute processes, yields across scales were found to be comparable except for very weak elution buffers, and pool volumes were found to be larger at RoboColumn scale. Impurity separation scale-comparability was found to be dependent of the mechanism of separation. Impurities separated by a step-elution were found to be comparable across all process parameters, while the scale offset of impurities separated by a wash phase was dependent of wash process parameters. By understanding RoboColumn scale comparability as a function of varying process parameters, we can justify scale offsets that would be observed in future RoboColumn scale-down model qualification or process characterization studies by applying an empirically determined, quantitative scale offset within a practically applicable process parameter range.
References1. Coffman, J. L., Kramarczyk, J. F., and Kelley, B. D. High-throughput screening of
chromatographic separations; i. method development and column modeling. Biotechnology and Bioengineering 100, 605–618 (2008).
2. McDonald, P., Tran, B., Williams, C. R., Wong, M., Zhao, T., Kelley, B.D., and Lester, P. The rapid identification of elution conditions for therapeutic antibodies from cation-exchange chromatography resins using high-throughput screening. Journal of Chromatography A 1433, 66–74 (2016).
3. Łącki, K. M. High-throughput process development of chromatography steps: Advantages and limitations of different formats used. Biotechnology Journal 7, 1192–1202 (2012).
4. Welsh, J. P., Petroff, M.G., Rowicki, P., Bao, H., Linden, T., Roush, D.J., and Pollard, J. M. A practical strategy for using minature chromatography columns in a standardized high-throughput workflow for purification development of monoclonal antibodies. Biotechnology Progress 30, 626–635 (2014).
5. Petroff, M. G., Bao, H., Welsh, J.P., van Beunigen-de Vaan, M., Pollard, J.M., Roush, D.J., Kandula, S., Machielsen, P., Tugcu, N., and Linden, T.O. High-throughput chromatography strategies for potential use in the formal process characterization of a monoclonal antibody. Biotechnology and Bioengineering 113, 1273–1283 (2015).
6. Feliciano, J., Berrill, A., Ahnfelt, M., Brekkan, E., Evans, B., Fung, Z., Godavarti, R., Nilsson-Valimaa, K., Salm, J., Saplakoglu, U., Switzer, M., and Łącki, K. Evaluating high-throughput scale-down chromatography platforms for increased process understanding. Engineering in Life Sciences 16, 169–178 (2016).
62
Integration of downstream platform development into a single 96-well filter plate for ultrarapid process definitionRon Gillespie, Jeremy Shaver, Megan McClure, Tileli Amimeur, Lisa Connell-Crowley, and Scott Freeman
Just Biotherapeutics, Inc., Seattle, WA, USA
13
63

IntroductionHigh-throughput screening (HTS) and miniaturization are well-established strategies for streamlining downstream process development. During routine development, utilization of HTS technologies across the entire downstream process can enhance overall process understanding and identification of process design gaps. During early phase development, HTS methods can facilitate development of multiple molecules in parallel and inform efficient, phase-appropriate workstreams. The present work describes a method for integrated downstream process development in a single 96-well filter plate experiment. The plate design allows for data collection on the colloidal, chemical, and thermal stability of a product over the full range of downstream solution conditions, including low-pH viral inactivation. Additionally, in the same plate, batch binding studies were performed to investigate protein-adsorbent interactions over five types of chromatographic resins.
Materials and methodsThe method was implemented using a 96-well filter plate with 50 µL resin in each well. The entire method, including load and buffer preparation, was automated on a robotic liquid handling system. After solution and load preparation, the plate was loaded and incubated for 60 min, followed by recovery of the unbound material. Next, the resins in the wells were incubated with either a strip solution or elution buffer, depending on the mode of chromatography, followed by collection of the stripped or eluted material. The load, unbound, elution, and strip samples were analyzed for protein concentration and target impurities such as high-molecular weight (HMW) entities, host cell protein (HCP), or fragments. Resins evaluated in the 96-well plate include protein A affinity and cation exchange (CEX) chromatography in bind-elute mode and anion exchange (AEX), hydrophobic interaction (HIC), and multimodal (MMC) chromatography in flow-through (FT) mode. Figure 1 presents the plate configuration and Table 1 shows the operational conditions tested.
1
A
H
G
F
E
D
C
B
2 3
Protein A elution
AEX FT
HIC FT MMC FT
CEX gradient: resin 2
CEX gradient: resin 1
CEX binding: resin 1 CEX binding: resin 2
4 5 6 7 8 9 10 11 12
Fig 1. The 96-well filter plate configuration. The colors indicate areas of the plate dedicated to specific resins (protein A affinity: orange, AEX: yellow, HIC: green, MMC: dark grey, CEX resin 1: purple and light grey, and CEX resin 2: dark blue and light grey).
Table 1. Operational conditions and outputs for single 96-well filter plate experiment
Resin pHSalt
(mM) ModeLoading
(g/Lr) Wells Output
Protein A 3.3–3.8 0 BE1 20 6Recovery, HMW, low pH stability
CEX 15 0–100 Binding ≥ 80 3 Static capacity
5 0–6503 BE 20 9 Recovery, purity
CEX 25 0–100 Binding ≥ 80 3 Static capacity
5 0–5003 BE 20 9 Recovery, purity
AEX 6–8 33–200 FT2 5 18 Recovery, purity, impurity removal, partition coefficient (Kp), solution stability (load)
HIC 5–8 25–400 FT 5 24
MMC 5–8 25–400 FT 5 24
1 BE = Bind-elute2 FT = Flow-through3 Binding at 0 mM salt followed by stepwise elution to 650 mM and 500 mM salt over nine wells for CEX resin 1
and CEX resin 2, respectively. 64

Solution stabilitySignificant insight into potential operating conditions can be gained by evaluating the solution stability of molecules. Colloidal, chemical, and thermal stability across the potential solution conditions in the downstream process was used to identify the operating space where the product is most stable and to identify conditions that minimize yield loss and aggregation. Figure 2 compares the colloidal stability by light scattering and the chemical stability by size exclusion chromatography (SEC) for two different monoclonal antibodies (mAbs). As shown in this example, mAb 1 is relatively stable with respect to precipitation and aggregation across the range of downstream operating conditions evaluated. Alternatively, mAb 2 precipitates at high pH and low ionic strength and displays significant aggregation at high pH and high salt strength, indicating that these solution conditions should be avoided during downstream process design. Figure 3 highlights the difference in thermal stability by differential scanning fluorimetry (DSF) for an IgG1 mAb (mAb 3) and a Fc-fusion protein. As shown in this example, mAb 3 exhibits typical thermal stability for an IgG1 along with greater thermal stability as the pH increases. The Fc-fusion protein, in addition to an overall lower melting temperature (Tm), exhibits a decrease in thermal stability with an increase in pH and salt strength.
0.03 AU
> 0.1 AU
< 10%
> 50%
< 0.04 AU
3.6%
4.0%
450
< 0.03 < 0.03
< 3.55 < 10
Predictedturbidity (A405)
< 0.04
< 0.06
< 0.07
< 0.09
< 0.10
≥ 0.10
400
350
300
250
Salt
(mM
)
200
150
100
50
04.5 5.0 5.5 6.0 6.5
pH7.0 7.5 8.0 8.5
450 Predictedturbidity (A405)
< 0.04
< 0.05
< 0.06
< 0.07
< 0.08
< 0.09
< 0.10
≥ 0.10
400
350
300
250
Salt
(mM
)
200
150
100
50
04.5 5.0 5.5 6.0 6.5
pH7.0 7.5 8.0 8.5
450 Predictedtotal HMW (%)
< 3.60
< 3.65
< 3.70
< 3.75
< 3.80
< 3.85
400
350
300
250
Salt
(mM
)
200
150
100
50
04.5 5.0 5.5 6.0 6.5
pH7.0 7.5 8.0 8.5
450 Predictedtotal HMW (%)
< 15
< 20
< 25
< 30
< 35
< 40
< 3.90
< 3.95
≥ 3.95
< 45
< 50
≥ 50
400
350
300
250
Salt
(mM
)
200
150
100
50
04.5 5.0 5.5 6.0 6.5
pH7.0 7.5 8.0 8.5
Increasingstability
Decreasingstability
< 50.0
450
Predicted Tm
< 52.2< 54.4< 56.7< 58.9< 61.1< 63.3< 65.6
400
350
300
250
Salt
(mM
)
200
150
100
50
04.5 5.0 5.5 6.0 6.5
pH7.0 7.5 8.0 8.5
350
Predicted Tm
< 67.8< 70.0≥ 70.0
< 50.0< 52.2< 54.4< 56.7< 58.9< 61.1< 63.3< 65.6< 67.8< 70.0≥ 70.0
300
250
Salt
(mM
)
200
150
100
50
04.5 5.0 5.5 6.0 6.5
pH7.0 7.5 8.0 8.5
Fig 3. Thermal stability determined by DSF for the range of downstream process conditions evaluated for (A) mAb 3 and (B) Fc-fusion protein 1.
Fig 2. Comparison of solution stability for two mAbs for the range of downstream process conditions evaluated. (A) Turbidity and (B) HMW for mAb 1. (C) Turbidity and (D) HMW for mAb 2.
(A)
(A)
(B)
(B)
(C)
(D)
65

Batch bindingThe 96-well plate was used to perform batch binding studies to investigate protein-adsorbent interactions over five types of chromatographic resins across a wide range of pH and salt conditions. This format was used to screen protein A elution conditions; evaluate static resin capacity, gradient elution strength, and selectivity for two cation exchange resins; and evaluate selectivity between product and impurities for three different resins operated in flow-through mode for a single molecule. Figure 4 presents an example of the data obtained in the single plate experiment. These data can be used to estimate protein A recovery and molecule sensitivity to low-pH viral inactivation; select a CEX resin based on elution strength, recovery and selectivity for impurities; and, finally, identify the optimal flow-through resin and conditions for operation. The integrated plate-based method presented herein provides insight into setpoints for individual unit operations as well as sensitivity to operating ranges. In addition, mode pairing may be employed to select resins and operating conditions across the entire process (Fig 5).
HCP HMW
Yield
HMW
Yield
AEX HIC MMC
Tota
l HM
W (%
)Yi
eld
(%)
100
50
3.3
6.0 5.0 5.5 6.0 6.5
pH
7.0 7.5 8.06.5 7.0
pH
7.5 8.0
3.4 3.5 3.6pH
3.7 3.8
3.3 3.4 3.5 3.6pH
3.7 3.8
Bat
ch c
onc.
(g/L
)
1.0
0
Salt
(mM
)
Salt
(mM
)
50
100
200
300
400
5.0 5.5 6.0 6.5
pH
7.0 7.5 8.0
Salt
(mM
)
100
200
300
400
100
150
200
0.6
0.4
0.2
0.8
0NaCl (mM)
800600400
Strong CEX
Weak CEX
200
Pur
ity
(%)
100
90
96
94
92
98
0Yield (%)
10050
Strong CEX
Weak CEX
CEX purity threshold
HM
W M
B (%
)
100
0
50
Cap
acit
y (g
/L) 100
0
50
0 50 100NaCl (mM)
0 50 100NaCl (mM)
Strong CEX Weak CEX
2
4
6
8
Fig 4. Example of data generated during a single batch binding experiment. (A) Protein A recovery versus elution pH and pool HMW, following a 60 min low-pH hold. (B) Pseudo-chromatograms for two CEX resins. (C) Static capacity and HMW mass balance for two CEX resins. (D) Purity (HMW) plot for two CEX resins. (E) Recovery and impurity contour plots for AEX, HIC, and MMC resins operated in flow-through mode.
(A)
(B)
(E)
(C)
(D)
66
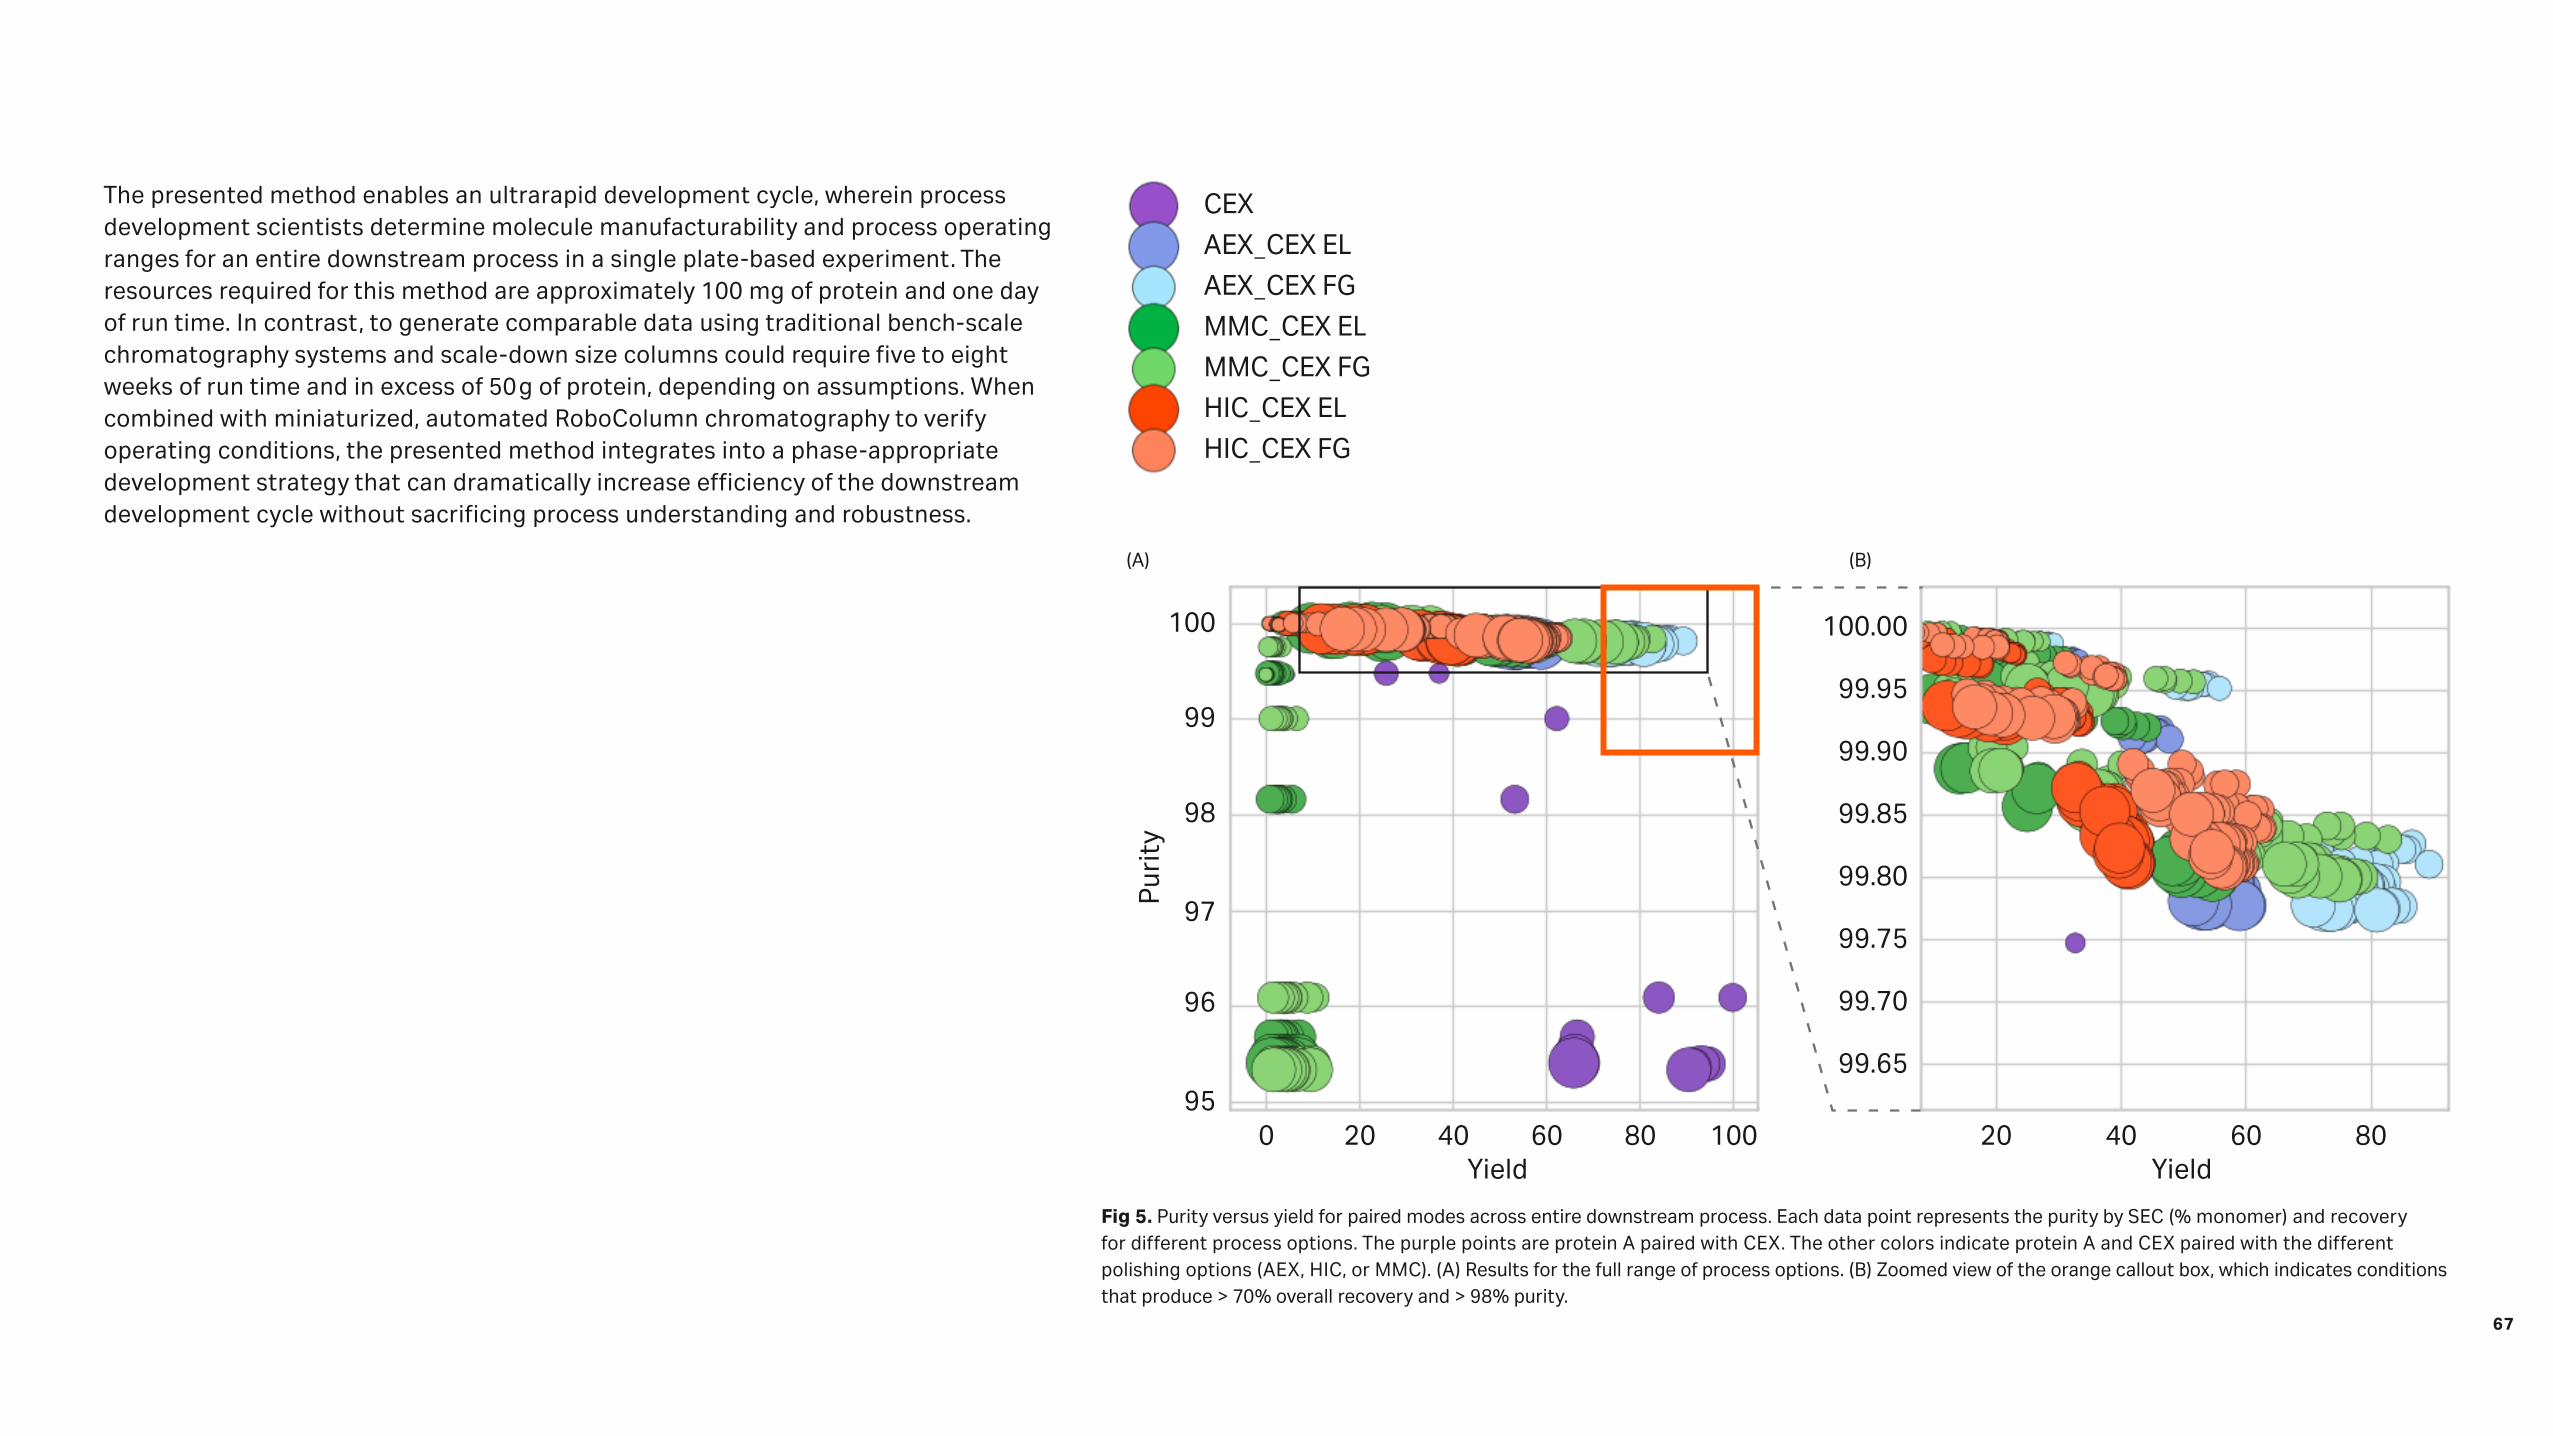
The presented method enables an ultrarapid development cycle, wherein process development scientists determine molecule manufacturability and process operating ranges for an entire downstream process in a single plate-based experiment. The resources required for this method are approximately 100 mg of protein and one day of run time. In contrast, to generate comparable data using traditional bench-scale chromatography systems and scale-down size columns could require five to eight weeks of run time and in excess of 50 g of protein, depending on assumptions. When combined with miniaturized, automated RoboColumn chromatography to verify operating conditions, the presented method integrates into a phase-appropriate development strategy that can dramatically increase efficiency of the downstream development cycle without sacrificing process understanding and robustness.
Yield Yield
CEX
AEX_CEX EL
AEX_CEX FG
MMC_CEX EL
MMC_CEX FG
HIC_CEX EL
HIC_CEX FG
Pur
ity
100 100.00
99.95
99.90
99.85
99.80
99.75
99.70
99.65
99
98
97
96
950 20 40 60 80 100 4020 8060
(A) (B)
Fig 5. Purity versus yield for paired modes across entire downstream process. Each data point represents the purity by SEC (% monomer) and recovery for different process options. The purple points are protein A paired with CEX. The other colors indicate protein A and CEX paired with the different polishing options (AEX, HIC, or MMC). (A) Results for the full range of process options. (B) Zoomed view of the orange callout box, which indicates conditions that produce > 70% overall recovery and > 98% purity.
Yield Yield
CEX
AEX_CEX EL
AEX_CEX FG
MMC_CEX EL
MMC_CEX FG
HIC_CEX EL
HIC_CEX FG
Pur
ity
100 100.00
99.95
99.90
99.85
99.80
99.75
99.70
99.65
99
98
97
96
950 20 40 60 80 100 4020 8060
67

Towards understanding and managing resin variabilityPeter Hagwall1, Eva Rosenberg2, Per Lidén1, and Gunnar Malmquist1
1 Cytiva Sweden AB, Björkgatan 30, 751 84 Uppsala, Sweden;
2 Bioprocess Development Roche Diagnostics GmbH, Nonnenwald 2, 82377 Penzberg, Germany
14
68

IntroductionThe robustness and consistency of a chromatography step can be described by the impact of variability in the feed material, critical process parameters, and critical raw materials together with the ability of the process control strategy to mitigate such variability without compromising quality.
According to the ICH guideline Q8, the manufacturer of biologics needs to understand all critical attributes of raw materials and how to control the variability to ensure consistent supplies. The focus of quality by design (QbD) efforts during the last decade has often been centered to variability in the manufacturing process itself, with limited insight into raw material variability. It is often not until commercial manufacturing where the full impact of raw material variability is experienced, often without major issues, although sometimes resulting in lengthy manufacturing investigations and possibly batch rejection. Here, we present a roadmap and working approach for how supply chain transparency and collaboration between manufacturer and supplier can enable process development regarding raw material variability and support continued process verification.
Need for information and toolsWhen resins are developed, a methodology based on an established intended use, design for six sigma (DfSS), and structure-function relationships is used to design for consistent performance. This methodology aligns well with the principles and processes of QbD (Fig 1 and 2). For a purification process, with intended use, molecule, or process conditions that differs significantly from the model used in the resin development, the structure-function relationships might no longer apply. Hence, the impact of raw material variability can be unknown. Raw material variability can be assessed in early stage, but is often first addressed during late stage development, in preparation for clinical phase III trials, and performed after optimization and confirmation runs in scale-down models. Typically, a risk assessment is performed and, depending on the outcome, certain attributes may be characterized. Prior experience and reference materials may be used, but there is a clear need for tools and information as well as collaboration in order to enable a proper risk assessment of robustness as well as characterization if needed.
Fig 1. The product development methodology at Cytiva mirrors principles of QbD, relating productivity or process economy to functional and structural properties as well as process parameters. DBC = dynamic binding capacity.
Processparameters
Structualproperties
Functionalproperties
Userneeds
• Stirrer speed
• Temperature
• Amount of ligand
• Particle size
• Pore size
• Ligand density
• Pressure/flow
• DBC
• Selectivity
• Productivity
• Process economy
Critical processparameters and
material attributes
Critical quality
attributes
Quality targetproduct
profile
Clinical datasafety
efficacy
Design for six sigma
Quality by design
Resin CQA’s becomepotential CMA’s
in customer process
69
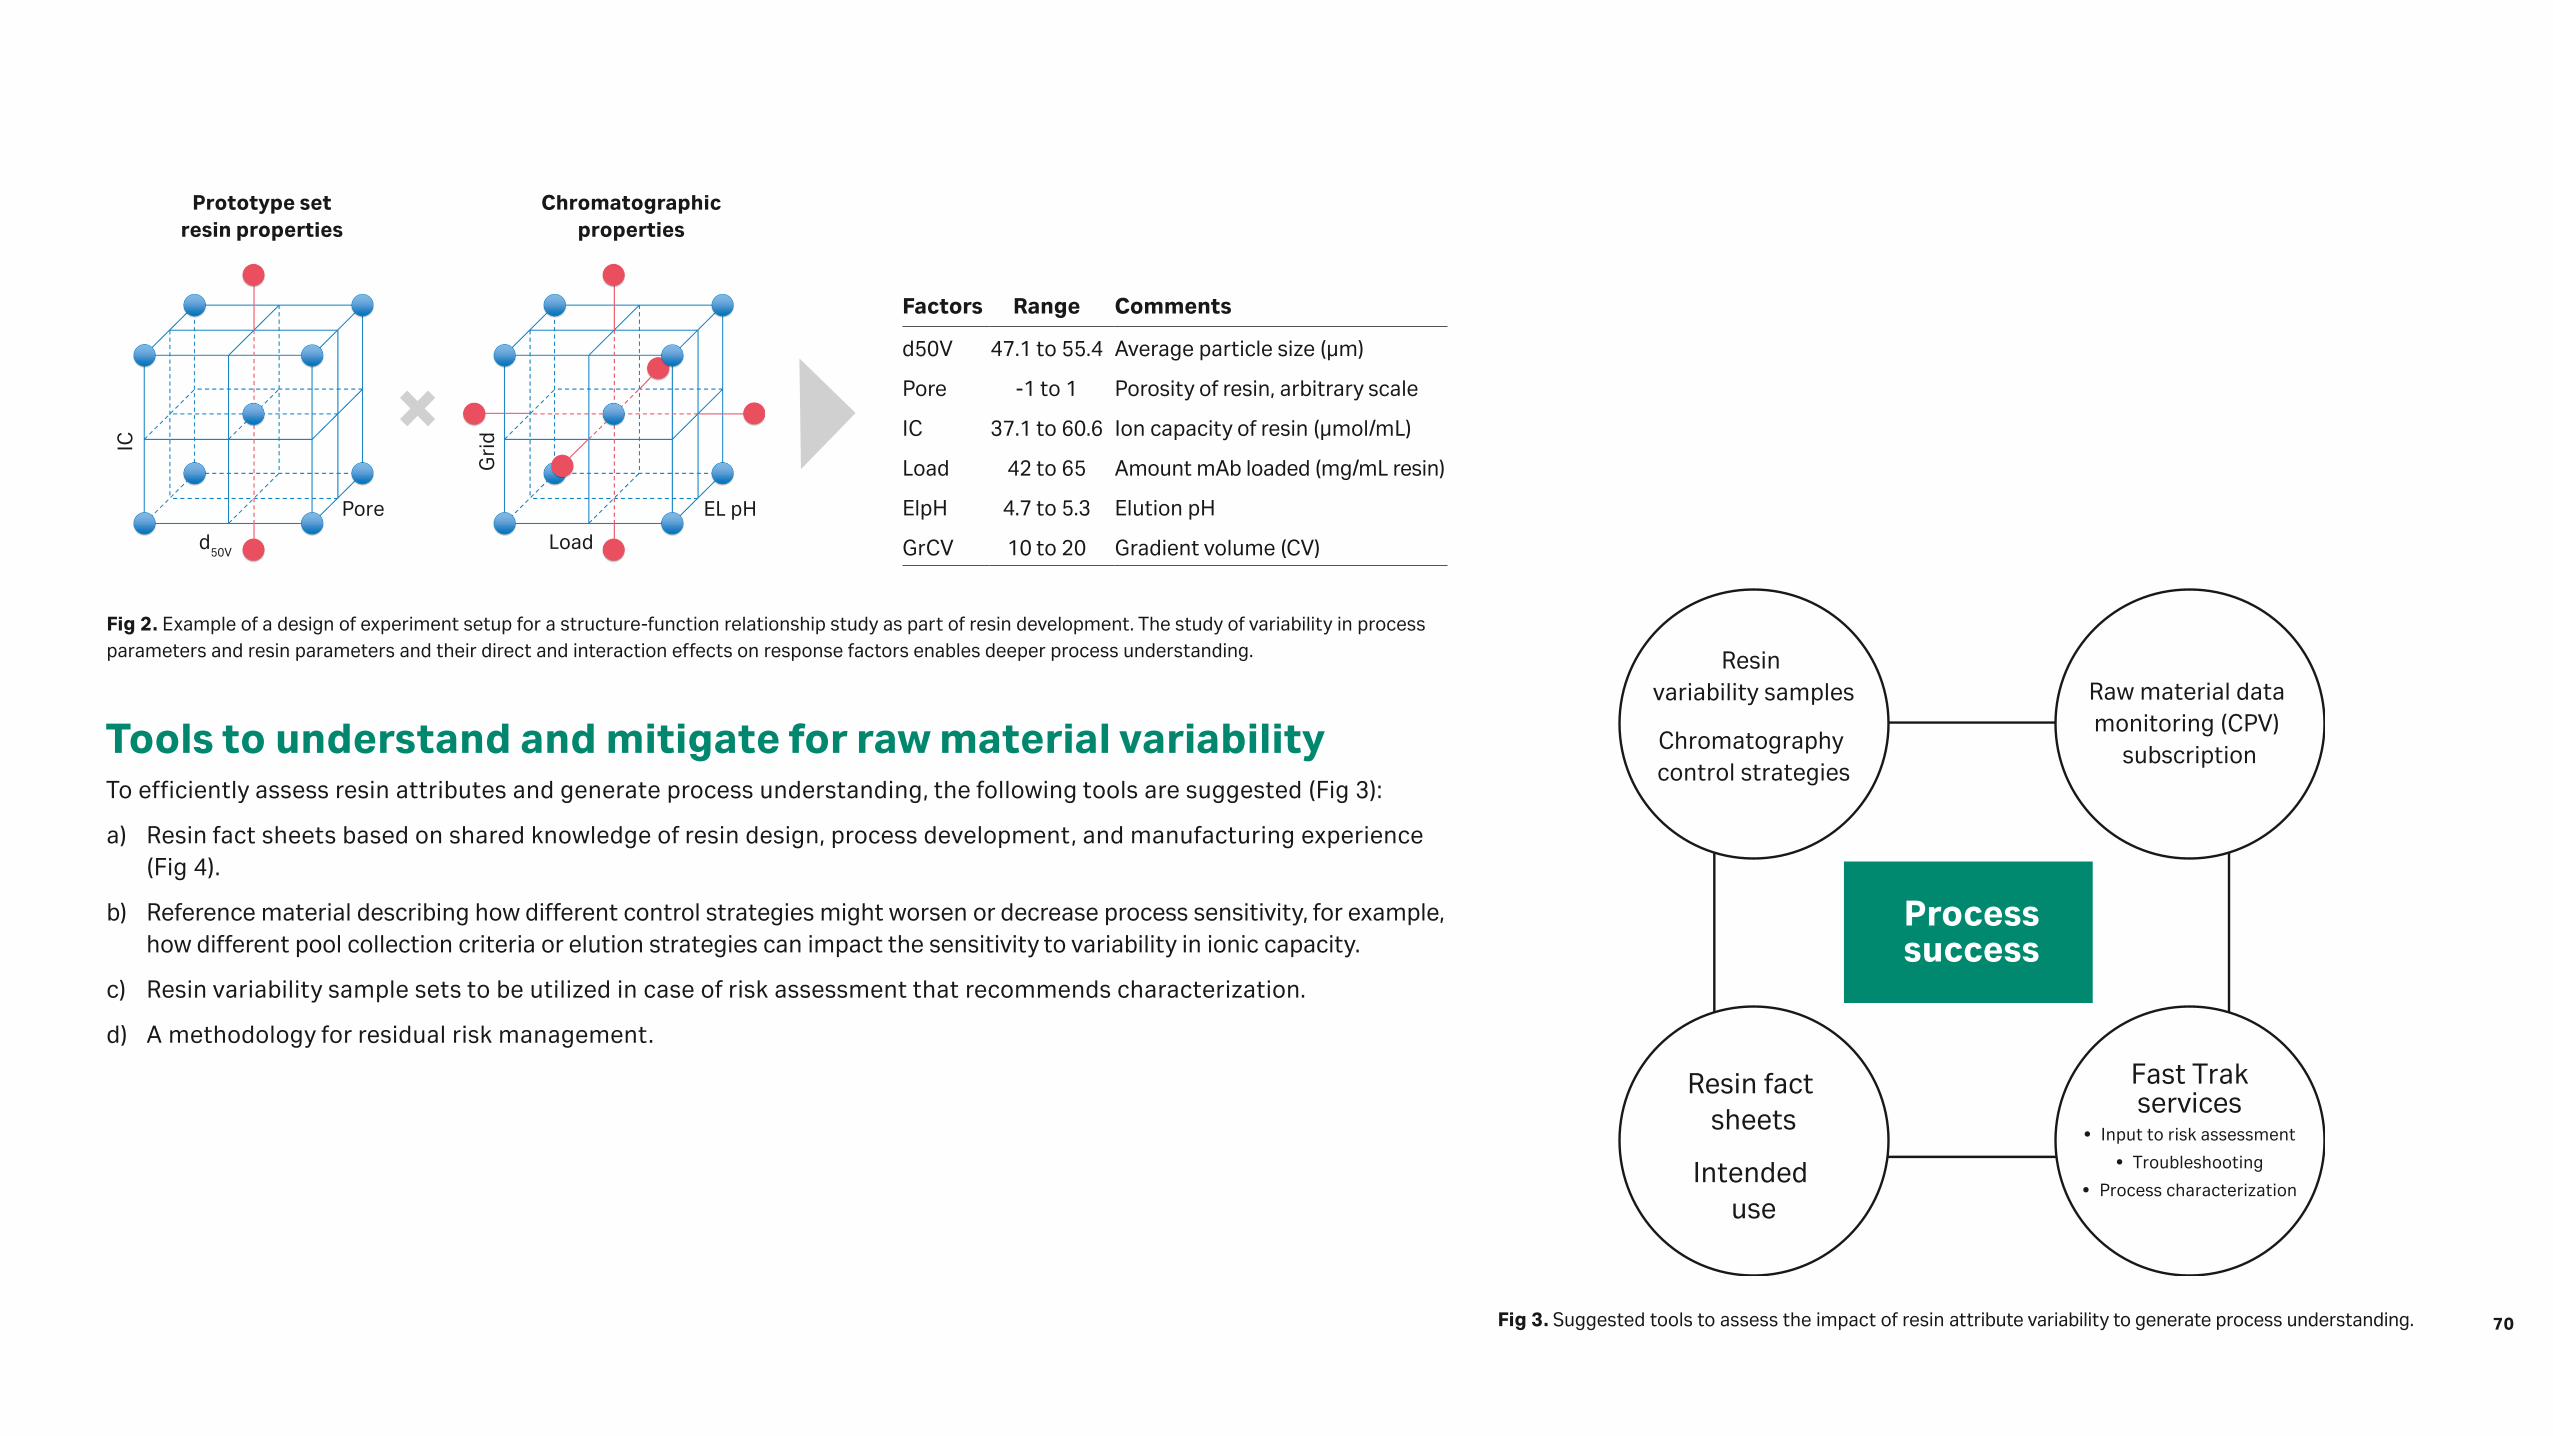
Tools to understand and mitigate for raw material variabilityTo efficiently assess resin attributes and generate process understanding, the following tools are suggested (Fig 3):
a) Resin fact sheets based on shared knowledge of resin design, process development, and manufacturing experience (Fig 4).
b) Reference material describing how different control strategies might worsen or decrease process sensitivity, for example, how different pool collection criteria or elution strategies can impact the sensitivity to variability in ionic capacity.
c) Resin variability sample sets to be utilized in case of risk assessment that recommends characterization.
d) A methodology for residual risk management.
Fig 2. Example of a design of experiment setup for a structure-function relationship study as part of resin development. The study of variability in process parameters and resin parameters and their direct and interaction effects on response factors enables deeper process understanding.
d50V
Prototype setresin properties
Chromatographicproperties
Pore
IC
Load
EL pH
×G
rid
Factors Range Comments
d50V 47.1 to 55.4 Average particle size (µm)
Pore -1 to 1 Porosity of resin, arbitrary scale
IC 37.1 to 60.6 Ion capacity of resin (µmol/mL)
Load 42 to 65 Amount mAb loaded (mg/mL resin)
ElpH 4.7 to 5.3 Elution pH
GrCV 10 to 20 Gradient volume (CV)
Processsuccess
Resin variability samples
Chromatography control strategies
Raw material data monitoring (CPV)
subscription
Resin fact sheets
Intended use
Fast Trakservices
• Input to risk assessment
• Troubleshooting
• Process characterization
Fig 3. Suggested tools to assess the impact of resin attribute variability to generate process understanding. 70
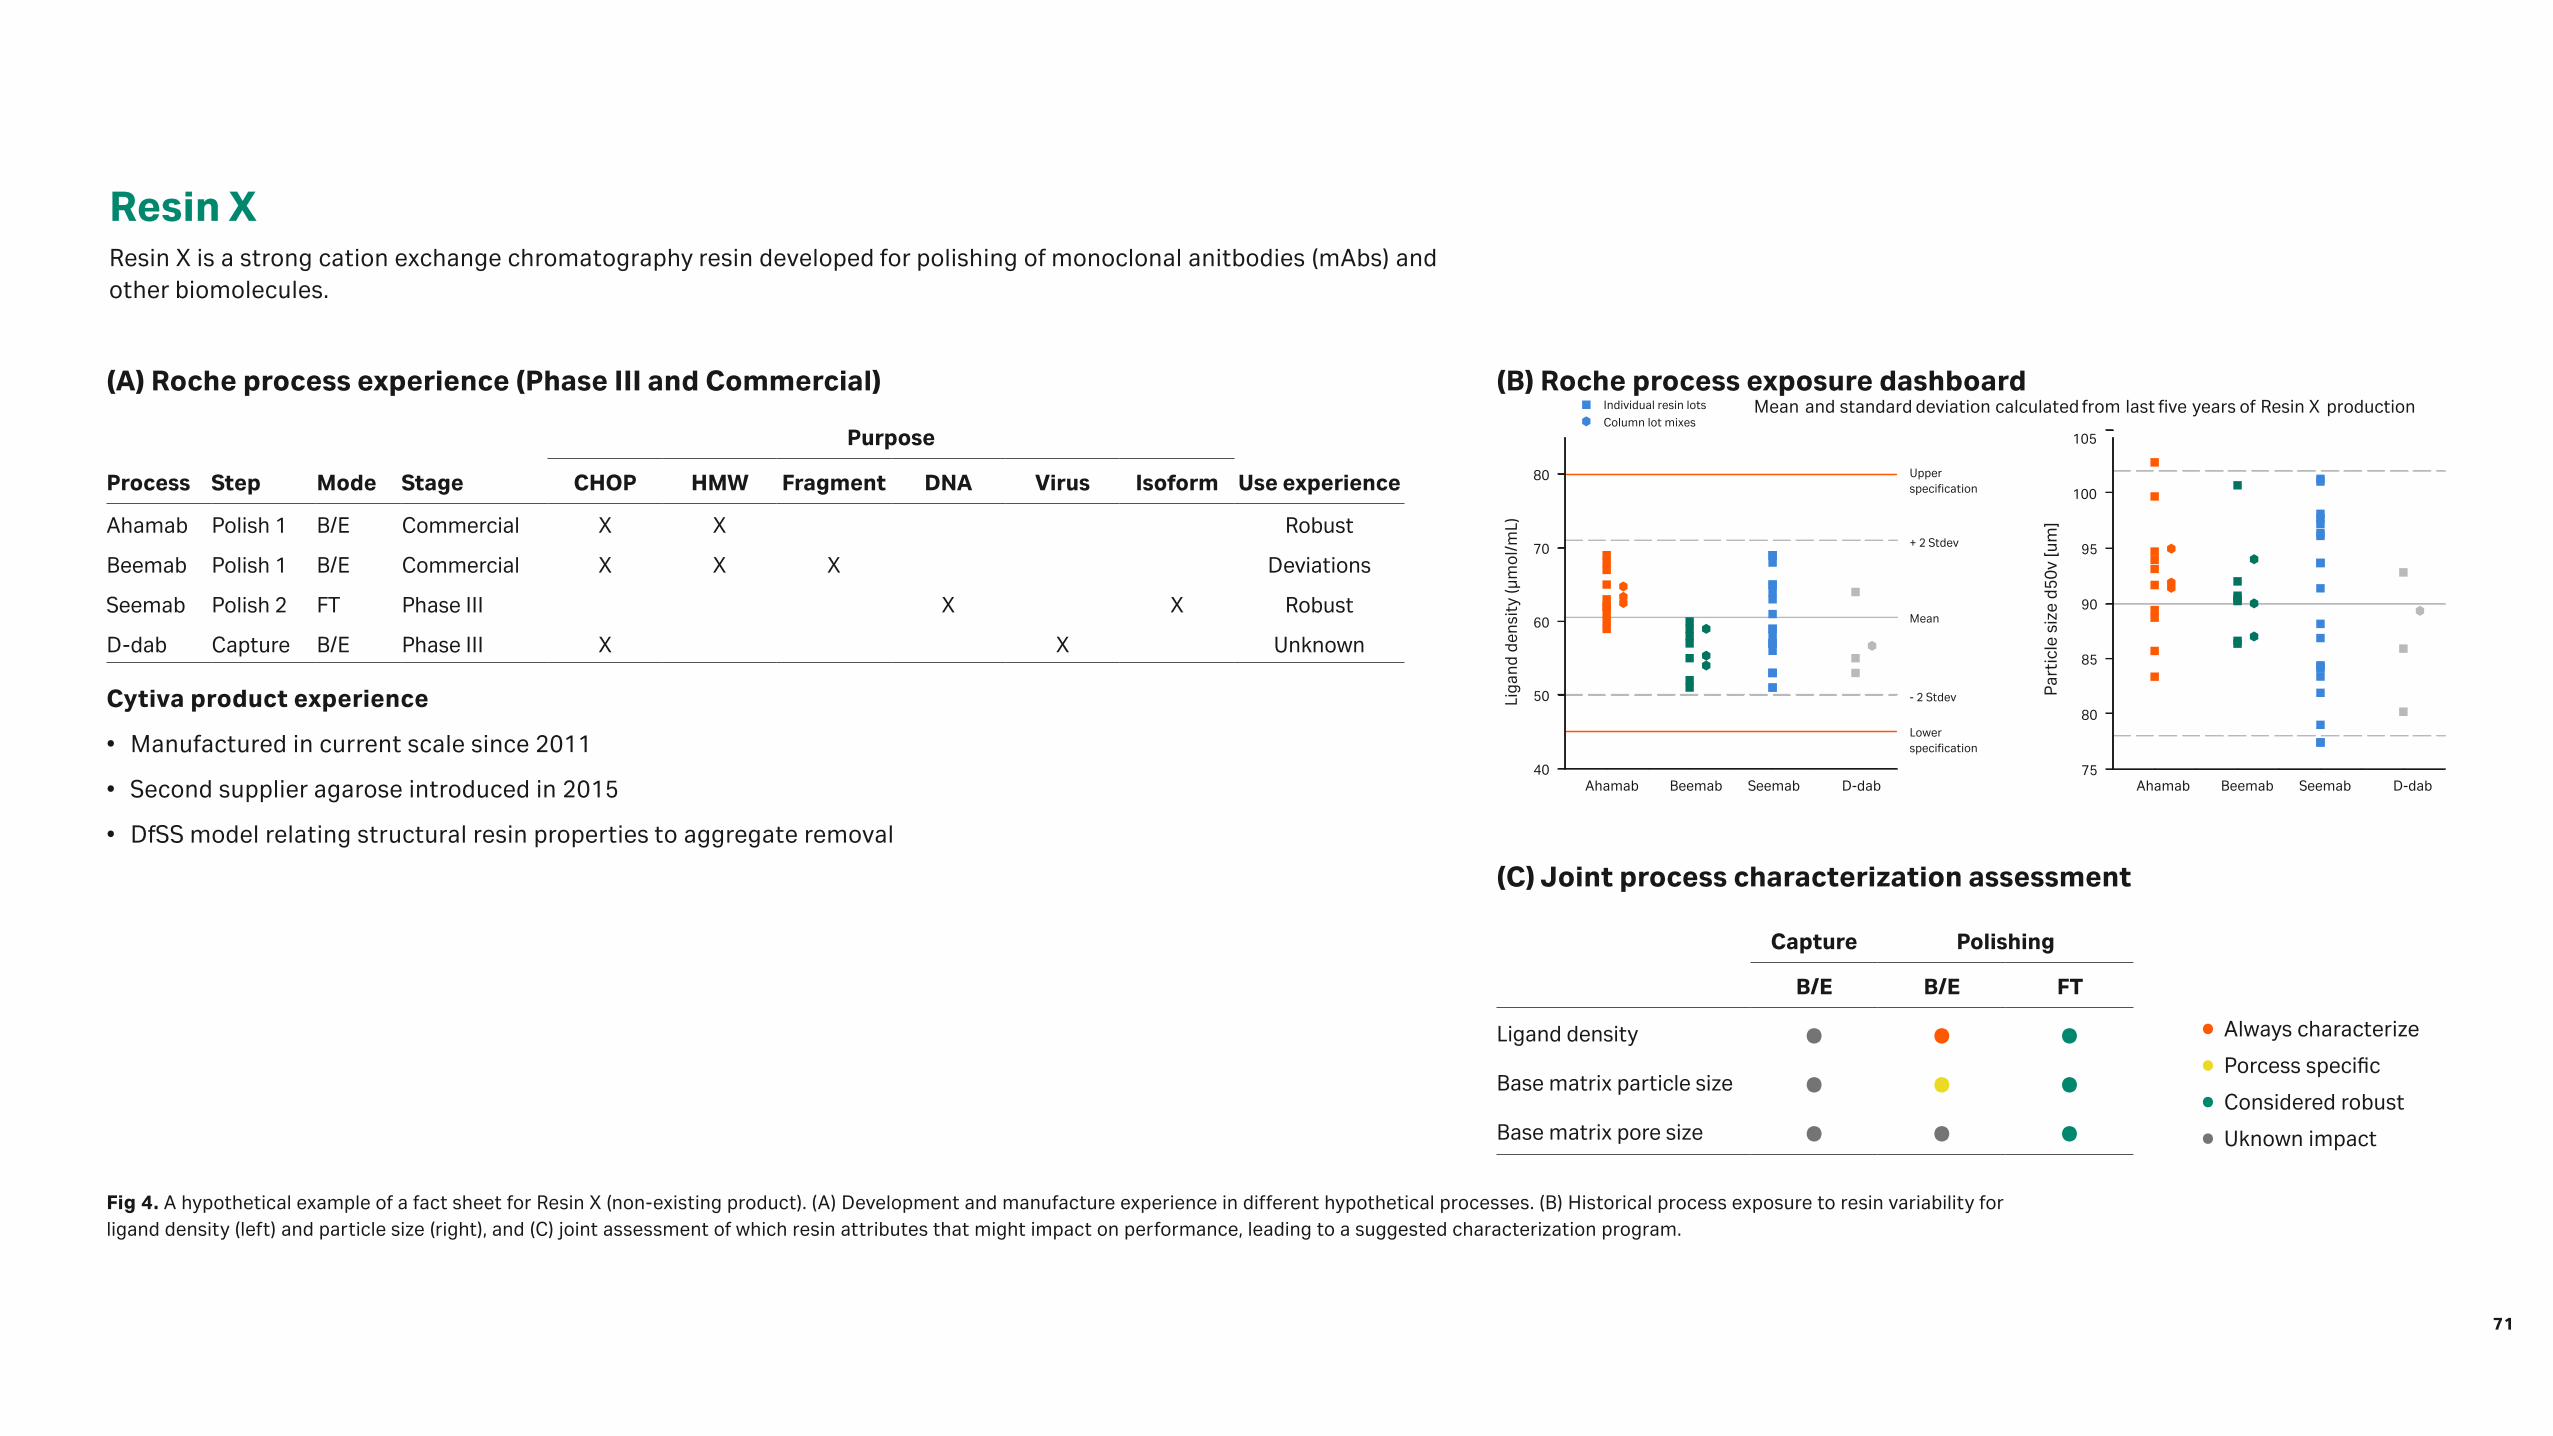
Resin XResin X is a strong cation exchange chromatography resin developed for polishing of monoclonal anitbodies (mAbs) and other biomolecules.
Fig 4. A hypothetical example of a fact sheet for Resin X (non-existing product). (A) Development and manufacture experience in different hypothetical processes. (B) Historical process exposure to resin variability for ligand density (left) and particle size (right), and (C) joint assessment of which resin attributes that might impact on performance, leading to a suggested characterization program.
(A) Roche process experience (Phase III and Commercial)
Purpose
Process Step Mode Stage CHOP HMW Fragment DNA Virus Isoform Use experience
Ahamab Polish 1 B/E Commercial X X Robust
Beemab Polish 1 B/E Commercial X X X Deviations
Seemab Polish 2 FT Phase III X X Robust
D-dab Capture B/E Phase III X X Unknown
Cytiva product experience
• Manufactured in current scale since 2011
• Second supplier agarose introduced in 2015
• DfSS model relating structural resin properties to aggregate removal
(B) Roche process exposure dashboardMeanIndividual resin lots
Column lot mixesand standard deviation calculated from last five years of Resin X production
Liga
nd d
ensi
ty (µ
mol
/mL)
40Ahamab Beemab Seemab D-dab Ahamab Beemab Seemab D-dab
50
60
70
80 Upperspecification
+ 2 Stdev
Mean
- 2 Stdev
Lowerspecification
Par
ticl
e si
ze d
50v
[um
]
75
80
85
90
95
100
105
(C) Joint process characterization assessment
Capture Polishing
B/E B/E FT
Ligand density • • •Base matrix particle size • • •Base matrix pore size • • •
• Always characterize
• Porcess specific
• Considered robust
• Uknown impact
71

Residual risk managementRaw material monitoring is a tool to utilize for residual risks, for example, when attributes cannot be fully studied during process development. If particle size was not included in the process characterization design, principal component analysis of particle size distribution can be used as a tool to manage residual risk, for example, to compare lots used in the purification process compared with the manufacturing envelope for Resin X (Fig 5).
Discussion and conclusionsVariability in resin attributes can impact process performance and product quality. The presented approach, with tools and information based on shared knowledge, enables increased process understanding and robust, scientifically understood processes. The result can be higher process consistency and productivity. Some of the tools are applicable for both early and late stage process development.
Fig 5. Resin lots (green) in relation to resin manufacturing envelope for Resin X. (A) Risk assessment of a new resin lot (orange) concludes that the risk of process impact is low. (B) Indication that a new resin lot (orange) could be used to expand the process envelope through scale-down testing to reduce the residual risk.
(A) (B)
72
15
Applications of directly scalable protein A chromatography for high-throughput process developmentIan Scanlon, Chris Morris, Matthew Townsend, Nicholas Daniell, and Oliver Hardick
Cytiva, Puridify, Stevenage Bioscience Catalyst, Gunnels Wood Rd, Stevenage, UK
73

IntroductionThe most efficient chromatography platforms currently available for scaled-down high-throughput process development (HTPD) exist in a 96-well plate format (e.g., PreDictor plates from Cytiva). These can be invaluable for automated early screening work, enabling a large array of conditions to be scouted with reduced material and time costs [1], However, the requirement for specialised liquid handling equipment and robust bridging experiments to translate to process scale can be considered a disadvantage.
Here, two high-throughput research-scale devices are presented. These devices are based on established protein A and ion exchange ligands, immobilised onto high-flow rate cellulose fiber membrane absorbent units [2], We explored laboratory-scale protein A functionalized membrane chromatography devices capable of purifying ~ 10 mg of antibody in a primary capture mode in a 2 min chromatography cycle, with capacity being independent of flow rate (Fig 1).
Figure 2 displays how operating at high flow rates and in smaller scales allows full process development to be carried out quickly, with sufficient material generated to perform material characterization studies.
The membrane adsorbent material is designed to operate in a rapid cycling mode, with each unit capable of being cycled > 100 times in a single working shift. The units currently scale up to 100 mL of membrane. Larger units are being developed to handle mAb quantities for large industrial processes.
Two case studies are presented here to demonstrate the complementary attributes of the two formats: 0.4 mL laboratory-scale and 60 µL 96-well plate. The first covers the process development of a primary capture step on an industrially relevant mAb, varying process conditions such as the pH and concentration of elution and post-load wash buffers as well as flow rate. The second illustrates the integration of the capture step into upstream development by using the robust cellulose fiber matrix to handle centrifuged material from Ambr™ 15 bioreactors to obtain samples for analysis during a cell line selection screen.
0
0.2
0.4
0.6
0.8
1.0
0
10
20
30
40
50
0 0.1 0.2 0.3 0.4
Col
umn
dP m
ax (M
Pa)
DB
C10
% (m
g/m
L)
Residence time (s)
ProA (DBC)
dPC (Mpa)
Fig 1. The effect of residence time on mAb dynamic binding capacity of protein A membranes (1.8 mg/mL purified mAb loading, 0.4 mL membrane volume).
Conventionalcolumns
0 20 40 60 80 100 120 140 160
Experimental time (h)
RoboColumnunits
8 × matrix protein ACellulosefiber devices
8 × matrix flowthrough
8 × matrix polish
Scale-up validation
Fig 2. Overview of experimental time taken to run eight different scouting conditions for three chromatography steps for conventional bead chromatography, eight parallel RoboColumn units, and membrane absorbent units [3].
74

Case study 1. High-throughput buffer screening for a Protein A stepAn initial set of design of experiments (DoE) studies, examining which factors have the most influence upon the elution profile including buffer strength, pH, and flow rate during elution, determined that concentration of elution buffer had the most significant effect. A full investigation of effect of buffer strength on elution profile, including interaction with post-load wash buffers, was carried out with a monoclonal antibody (mAb 1) supplied by GlaxoSmithKline (GSK), Gunnels Wood Road, Stevenage, Herts, SG1 2NY UK.
Materials• ÄKTA avant 150, using UNICORN™ 7.0
• Cellulose fiber membrane functionalized with protein A, 0.4 mL membrane volume
• Binding buffer: 20 mM Tris, pH 7.5 + 150 mM NaCl
• Post-load wash buffer (Table 1)
• Elution buffer (Table 1)
• mAb 1, post-protein A purified mAb, made up to 1 g/L in binding buffer
MethodChromatography runs were performed on Cytiva’s ÄKTA avant 150 at a flow rate of 15 mL/min, 37.5 MV/min, 1.6 s residence time (for equilibration, loading, post-load washing, and elution on a 0.4 mL membrane), with each full cycle taking 2 min. Buffers for post-load wash and elution were varied as shown in Table 1, using two membrane volumes of each buffer.
The load for each run was 4 mL of mAb 1 at 1 g/L, with each combination of wash and elution buffers run in duplicate. Results were reported from the integration of the chromatograms using the automated integration feature of the UNICORN 7.0 software, with peak area (mAU/mL) values comparing recovery.
Table 1. Post-load wash (PLW) and elution buffers used in the study
PLW Buffer Elution Buffer
1 20 mM Tris 150 mM, NaCl pH 7.5 A 30 mM NaOAc, pH 3.5
2 10 mM Tris, pH 7.5 B 50 mM NaOAc, pH 3.5
3 20 mM Tris, pH 7.5 C 100 mM NaOAc, pH 3.5
4 50 mM Tris, pH 7.5 D 150 mM NaOAc, pH 3.5
5 50 mM citrate, pH 5.5 E 30 mM acetic acid, pH 3.2
6 100 mM citrate, pH 5.5 F 50 mM acetic acid, pH 3.1
7 50 mM NaOAc, pH 5.0 G 100 mM acetic acid, pH 2.8
8 100 mM NaOAc, pH 5.0 H 150 mM acetic acid, pH 2.7 75
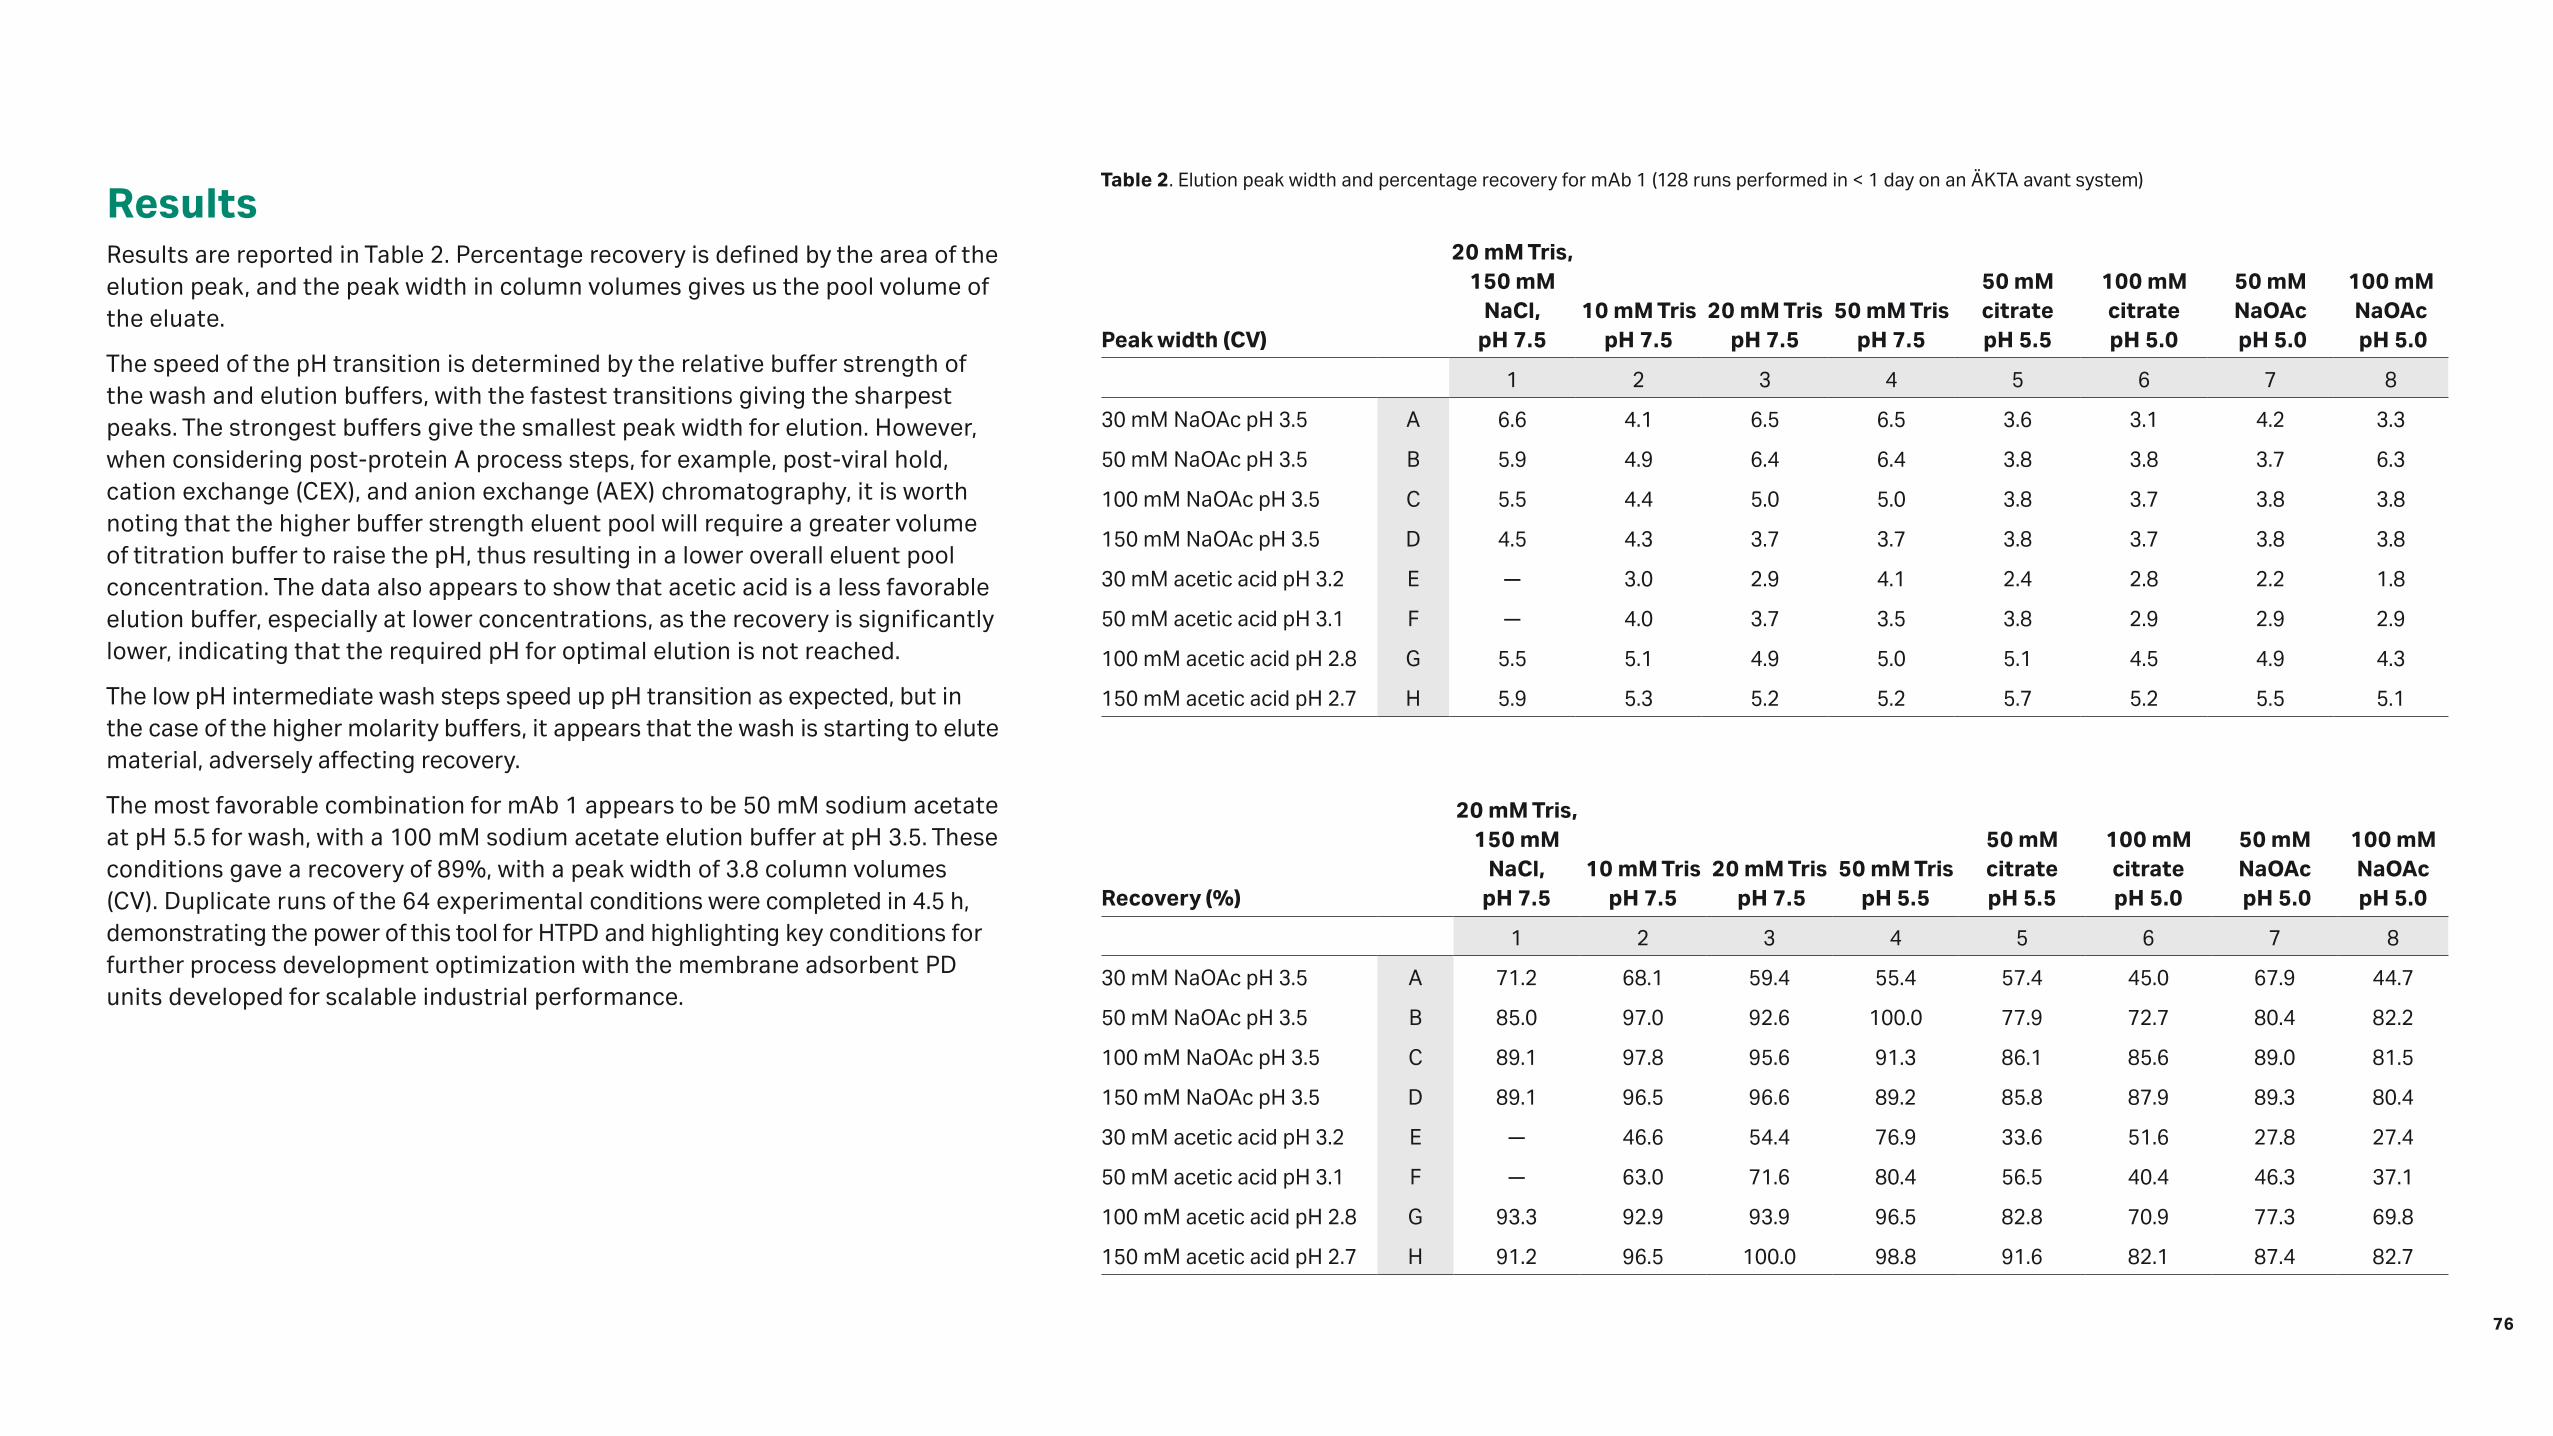
ResultsResults are reported in Table 2. Percentage recovery is defined by the area of the elution peak, and the peak width in column volumes gives us the pool volume of the eluate.
The speed of the pH transition is determined by the relative buffer strength of the wash and elution buffers, with the fastest transitions giving the sharpest peaks. The strongest buffers give the smallest peak width for elution. However, when considering post-protein A process steps, for example, post-viral hold, cation exchange (CEX), and anion exchange (AEX) chromatography, it is worth noting that the higher buffer strength eluent pool will require a greater volume of titration buffer to raise the pH, thus resulting in a lower overall eluent pool concentration. The data also appears to show that acetic acid is a less favorable elution buffer, especially at lower concentrations, as the recovery is significantly lower, indicating that the required pH for optimal elution is not reached.
The low pH intermediate wash steps speed up pH transition as expected, but in the case of the higher molarity buffers, it appears that the wash is starting to elute material, adversely affecting recovery.
The most favorable combination for mAb 1 appears to be 50 mM sodium acetate at pH 5.5 for wash, with a 100 mM sodium acetate elution buffer at pH 3.5. These conditions gave a recovery of 89%, with a peak width of 3.8 column volumes (CV). Duplicate runs of the 64 experimental conditions were completed in 4.5 h, demonstrating the power of this tool for HTPD and highlighting key conditions for further process development optimization with the membrane adsorbent PD units developed for scalable industrial performance.
Table 2. Elution peak width and percentage recovery for mAb 1 (128 runs performed in < 1 day on an ÄKTA avant system)
Peak width (CV)
20 mM Tris, 150 mM
NaCl, pH 7.5
10 mM Tris pH 7.5
20 mM Tris pH 7.5
50 mM Tris pH 7.5
50 mM citrate pH 5.5
100 mM citrate pH 5.0
50 mM NaOAc pH 5.0
100 mM NaOAc pH 5.0
1 2 3 4 5 6 7 8
30 mM NaOAc pH 3.5 A 6.6 4.1 6.5 6.5 3.6 3.1 4.2 3.3
50 mM NaOAc pH 3.5 B 5.9 4.9 6.4 6.4 3.8 3.8 3.7 6.3
100 mM NaOAc pH 3.5 C 5.5 4.4 5.0 5.0 3.8 3.7 3.8 3.8
150 mM NaOAc pH 3.5 D 4.5 4.3 3.7 3.7 3.8 3.7 3.8 3.8
30 mM acetic acid pH 3.2 E — 3.0 2.9 4.1 2.4 2.8 2.2 1.8
50 mM acetic acid pH 3.1 F — 4.0 3.7 3.5 3.8 2.9 2.9 2.9
100 mM acetic acid pH 2.8 G 5.5 5.1 4.9 5.0 5.1 4.5 4.9 4.3
150 mM acetic acid pH 2.7 H 5.9 5.3 5.2 5.2 5.7 5.2 5.5 5.1
Recovery (%)
20 mM Tris, 150 mM
NaCl, pH 7.5
10 mM Tris pH 7.5
20 mM Tris pH 7.5
50 mM Tris pH 5.5
50 mM citrate pH 5.5
100 mM citrate pH 5.0
50 mM NaOAc pH 5.0
100 mM NaOAc pH 5.0
1 2 3 4 5 6 7 8
30 mM NaOAc pH 3.5 A 71.2 68.1 59.4 55.4 57.4 45.0 67.9 44.7
50 mM NaOAc pH 3.5 B 85.0 97.0 92.6 100.0 77.9 72.7 80.4 82.2
100 mM NaOAc pH 3.5 C 89.1 97.8 95.6 91.3 86.1 85.6 89.0 81.5
150 mM NaOAc pH 3.5 D 89.1 96.5 96.6 89.2 85.8 87.9 89.3 80.4
30 mM acetic acid pH 3.2 E — 46.6 54.4 76.9 33.6 51.6 27.8 27.4
50 mM acetic acid pH 3.1 F — 63.0 71.6 80.4 56.5 40.4 46.3 37.1
100 mM acetic acid pH 2.8 G 93.3 92.9 93.9 96.5 82.8 70.9 77.3 69.8
150 mM acetic acid pH 2.7 H 91.2 96.5 100.0 98.8 91.6 82.1 87.4 82.7
76

Case study 2. Accelerating cell line development through liquid handling roboticsIn some alternative applications, the rapid recycling of HPTD units might be inappropriate due to the possibility of cross-contamination. In this case study, we demonstrate the rapid purification of unfiltered centrifuged supernatant from 48× Ambr 15 bioreactors via a high-throughput protein A 96-well screening plate on a liquid handling platform (Tecan).
The objective was to generate purified IgG suitable for evaluating the performance of each bioreactor, to facilitate cell line selection.
Materials• Freedom EVO 150 liquid handling platform with integrated Te-Chrom™ capability (Tecan)
• Cellulose fiber membrane functionalized with protein A, 60 µL membrane volume, 96-well plate
• Platform buffers for standard GSK protein A chromatography process
• 48× Ambr 15 bioreactors (Sartorius)
• Sorvall™ Legend RT Bench-top centrifuge (Thermo Scientific)
MethodAs depicted in Figure 3, the bioreactors were benchtop-centrifuged in a bespoke 3D printed carrier, and then transferred to the liquid handling deck where supernatant from each individual bioreactor was aspirated via liquid handling and directly loaded in parallel sets of 8 individual chambers of the 96-well plate cellulose fiber device. Each well was washed, and then eluted into a single fraction with protein concentration measured and titrated to neutral pH for subsequent assays.
Results Samples from the 48× Ambr 15 bioreactor supernatants were purified, with concentrations determined and pH adjusted in under 2 h, with 500–600 μg IgG per sample collected in a 200 μL pool. With the single-use modality of the high throughput plate format, no filtration was required prior to the loading of sample onto the membranes; increased purified IgG could be generated by cycling the units several times. The work demonstrates a fully integrated automated platform operating in under 2 h, enabled by the performance of the cellulose fiber device.
CentrifugeAmbr 15
bioreactorsEquilibration
Install on liquid handling platform
Removesupernatant
Load
Post-loadwash
pHadjustment +spectroscopic
analysis
Elutionphase
CIP/Storage Regeneration
Fig 3. Process flow diagram for purification of mAb from Ambr 15 bioreactors using a liquid handler from Tecan.77

ConclusionWe have demonstrated the utility of cellulose fiber devices in different HTPD applications. Very small quantities of adsorbent can yield a great deal of data and process development understanding. This is due to the immediate mass transfer observed with the membrane adsorbent, meaning less complexity when scaling up. The scalability criterion of the device format means that methods can be easily scaled.
Small, scalable units enable a range of process parameters to be explored with minimal feed requirements. Units can be cycled up to 200 times to add confidence to repeats and adsorbent lifetime understanding, as well as produce meaningful amounts of material for further study. All units can be run on standard ÄKTA systems. The alternative 96-well format can be used where carryover could be an issue, for example, in cell line selection, foulant material, static studies (long buffer holds, base stability, etc.). The 96-well format fits seamlessly into Te-Chrom-enabled Tecan liquid handling platforms.
References1. Feliciano, J., Berrill, A., Ahnfelt, M., Brekkan, E., Evans, B., Fung, Z., Godavarti, R., Nilsson-Välimaa, K., Salm,
J., Saplakoglu, U., Switzer, M., Łącki, K. Evaluating high-throughput scale-down chromatography platforms for increased process understanding. Engineering in Life Sciences 16, 169–178 (2016).
2. Hardick, O., Dods, S., Stevens B. and Bracewell, D.G. Nanofiber adsorbents for high productivity downstream processing. Biotechnology and Bioengineering 110, 1119–1128 (2013).
3. Adams et al. Optimization of a micro-scale, high throughput process development tool and the demonstration of comparable process performance and product quality with biopharmaceutical manufacturing processes. Journal of Chromatography A 1506, 73–81 (2017).
78

16
Process development in the digital biomanufacturing ageWilliam Whitford1 and Daniel Horbelt2
1 Cytiva, Marlborough, MA, USA, 2Insilico Biotechnology AG, Stuttgart, DE
79

Maturing digital manufacturing concepts are beginning to change the way we see biopharmaceutical manufacturing. Keys to this initiative include de-siloing data, predictive simulations, model reference adaptive control, dynamic enterprise control algorithms, and process automation. Digital biomanufacturing (DB) is part of an evolution and one further step in the application of technologies such as multiplexed reactor monitoring, internet of things (IoT), and cloud computing.
Powerful algorithms, along with fully automated, modular workflows built up by micro-services, employ disparate data from such sources as new sensors and at-line analytics, along with such other high-value information as process history records and genome based metabolic networks. The emerging technologies are now providing both a quantitative understanding of cell physiology and advanced model-based control toward process development, operational efficiency, and business goals. Those familiar with the digital plant maturity model (DPMM) or Industry 4.0 might know of some of the advances now being addressed.
InsilicoDiscovery™
InsilicoDesigner™
InsilicoController™
Bioprocessmodeling
and simulation
Processanalysis
Metabolicanalysis
Feedcontrol
Mediumdesign
Dataintegration
InsilicoInspector™
UNICORNsoftware
At-line and onlinedata collection
Integrated network and cloud platforms
Fig 1. Intelligent software applications in digitalized process development. A prerequisite for making use of bioprocess data are data management systems that integrate online bioprocess data and at-line data (such as cell number and viability, metabolites, and product titer and quality). Intelligent software solutions check and analyze these data sets on the basis of metabolic cell and process models to either optimize the conditions for a specific clone and product, or to continuously improve the production platform as a whole. In the future, predictive metabolic modeling will allow for online preemptive process optimization and control based on reduced data sets.
Examples of this include process understanding, monitoring, and analytics; plant design and automation; process design and flow; embedded, distributed, or modular control units; as well as advances in enterprise resource planning (ERP)/manufacturing execution systems (MES). Predictive modeling is an integral part of this and a key technology to unleash the full potential of digital biomanufacturing. Supporting this initiative are databases built from bioprocesses operating worldwide. The potential consequences include world-wide connectivity, supporting past, off-line, and current data feeding self-learning, closed-loop enterprise control.
Bioprocess development is witnessing a maturing of intelligent software applications. They now employ process data in combination with metabolomics, transcriptomics, or proteomics data to generate individualized metabolic network models, representing specific host cell lines and bioprocesses (Fig 1). Such models enable predictive simulations as part of accelerated process development workflows (Fig 2). Moreover, these in silico replicas of the process are used to generate quantitative insights into cellular metabolism, which are taking statistical process analysis to another level, creating improved process understanding and correlation between process performance and cellular metabolism. Advanced metabolic modeling workflows, employing artificial intelligence can generate highly accurate predictions, while the time to generate those models is rapidly decreasing, finally allowing for online predictive computing (Fig 3). Another way to conceptualize this is as a biomanufacturing application of the learning digital model of an apparatus called a digital twin (Fig 4).
80

0
5
10
15
20
25
30
35
40
45
1 2 3 4 5 6 7 8 9 10Development time (-)
Pro
duct
tit
er (-
)
Evolutionary
60%predictionaccuracy
90%predictionaccuracy
Speed-up 350%
Speed-up 250%
Higher titer
Hostengineering
Vectorengineering
Mediumdesign
Feedingregime
optimization
Processadaptation
Improved glycosylation
Reduced truncation
Minimized mAb reduction
(A) (B)
Fig 2. Applications and benefits of predictive simulations for bioprocess development. (A) Paramount goals of process development are maximum product titer and improvements in product quality such as glycoform distribution, reduced protein truncation, and minimized antibody reduction. Predictive simulations of cells in a bioprocess reduce the experimental efforts in cell line development (engineering of host cells and expression vectors) and process development (medium design, optimization of feeding regimes, and adaptation of the most suitable process format) to achieve these goals. (B) Replacement of wet lab experiments by predictive simulations allows for compressed timelines as compared to conventional, evolutionary process design. Time savings increase with increased prediction accuracy.
Fig 3. Accuracy and efficiency of predictive modeling. (A) A metabolic network model for Chinese hamster ovary (CHO) cells was used for simulation of an antibody bioproduction process. Comparison of predicted and measured parameters for a training data set (blue dots) and validation data set (orange dots) revealed prediction accuracies of 73% and 78% for cell density and product titer, respectively. (B) Improved automated workflows and machine learning algorithms lead to a dramatic decrease in the times required for metabolic model calibration and validation, allowing for at-line predictive computing.
0.1
1
10
100
2013 2014 2015
Time (y)
Tim
e fo
r m
odel
cal
ibra
tion
and
valid
atio
n (d
)
2016 2017 2018e0
0 0.2 0.4 0.6 0.8 1.0
0.2
0.4
0.6
0.8
1.0
Measurement
Viable cells
Prediction accuracy: 73%
Pre
dict
ion
00 0.2 0.4 0.6 0.8 1.0
0.2
0.4
0.6
0.8
1.0
Measurement
Product titer
Prediction accuracy: 78%
Pre
dict
ion
(A) (B)
00 0.2 0.4 0.6 0.8 1.0
0.2
0.4
0.6
0.8
1.0
Measurement
Viable cells
Prediction accuracy: 73%
Pre
dict
ion
00 0.2 0.4 0.6 0.8 1.0
0.2
0.4
0.6
0.8
1.0
Measurement
Product titer
Prediction accuracy: 78%P
redi
ctio
n
81

+Fig 4. The digital twin concept. Digital twins are persistent digital models of the structure and behavior of each instrument, enabling performance understanding, prediction, and optimization.
Physical asset Digital twinA learning digital model
1. Per platform model
3. Continuously learns
4. Scalable/adaptable
2. Process and business
f(x)Transfer function
Machinelearning
Physicsmodels +
Physical asset Digital twinA learning digital model
1. Per platform model
2. Process and business
3. Continuously learns
4. Scalable/adaptable
References1. Anttonen, E., Harmik, B., Dubs, M., Helliwell, I., Selva, J. Digital plant maturity
model. InTech (n.d.). [Online] http://intechdigitalxp.isa.org/i/833037-may-jun-2017/31?m4=. Accessed 18 December 2017.
2. Jonischkeit, B. Industry 4.0: Pfizer opens continuous manufacturing plant in Freiburg. BIOPRO Baden-Württemberg GmbH. [Online] https://www.gesundheitsindustrie-bw.de/en/article/news/industry-40-pfizer-opens-continuous-manufacturing-plant-in-freiburg/. Accessed 18 December 2017.
3. Whitford, W. The era of digital biomanufacturing. BioProcess International 2017 15,12–18 (2017).
4. Popp, O., Müller, D., Didzus, K., Paul, W., Lipsmeier, F., Kirchner, F., Niklas, J., Mauch, K., Beaucamp, N. A hybrid approach identifies metabolic signatures of high-producers for Chinese hamster ovary clone selection and process optimization. Biotechnology and Bioengineering 113, 2005–2019 (2016).
Machine learning
Physics models
82

17
Author Index
83

Adem, Y. 53 Amimeur, T. 63
Barrette, L-X. 53 Bergander, T. 27 Bill, J. 58 Boras, D. 48 Brink, C. 30 Brocard, C. 48
Chinn, M. 58 Connell-Crowley, L. 63 Coyle, B. 42
Daniell, N. 73 Dürauer, A. 48
Ellis, E. 30
Falconbridge, A 30 Freeman, S. 63 Fröhlich, S. 48
Galush, B. 53 Gillespie, R. 63 Griesbach, J. 10 Grönberg, A. 27 Gudmundsdottir, A. M. 30
Hagwall, P. 68 Hahn, T. 5, 10 Haidinger, S. 53 Hanif, R. 14 Hardick, O. 73 Heldin, E. 27 Hepbildikler, S. 10 Horbelt, D. 79 Hubbuch, J. 5, 10 Huuk, T. 5, 10
Kett, W. 42
Łacki, K. 42 Langsdorf, A. 36 Lazzareschi, J. 58 Lidén, P. 68
Malmquist, G. 68 Mattsson, A. 27 McClure, M. 63 Mijajlovic, M. 14 Monie, E. 27 Morris, C. 73 Musmann, C. 20
Nayak Teichert, S. 30 Nilsson Välimaa, K. 30
Rosenberg, E. 68
Scanlon, I. 73 Shaver, J. 63 Smithson, D. 53 Spitali, M. 14 Stein, D. 36 Sun, J. 53
Thom, V. 36 Townsend, M. 73 Tran, B. 58 Tschudi, K. 53
Walther, C. 48 Whitelock, N. 14 Whitford, W. 79
Zivkovic, V. 14
84

cytiva.com
Cytiva and the Drop logo are trademarks of Global Life Sciences IP Holdco LLC or an affiliate. ÄKTA, Capto, HiScreen, PreDictor, Sepharose, Tricorn and UNICORN are trademarks of Global Life Sciences Solutions USA LLC or an affiliate doing business as Cytiva.
Ambr, Hydrosart, Sartobind, and Sartoflow are registered trademarks of Sartorius Stedim Biotech GmbH. Lissy is a registered trademark of Zinsser NA, Inc. Freedom EVO, Tecan, and Te-Chrom are trademarks of Tecan Group Ltd. ChromX is a trademark and brand of GoSilico GmbH. Insilico Controller, Insilico Designer, Insilico Discovery, and Insilico Inspector are trademarks of Insilico Biotechnology AG. MATLAB is a registered trademark of The MathWorks, Inc. OPUS is a trademark of Repligen Corp. PhyTip is a trademark of PhyNexus, Inc. PicoGreen, Poros, and Sorvall are trademarks of Thermo Fisher Scientific. ProteinMaker is a trademark of Emerald BioSystems, Inc. RoboColumn is a trademark of Atoll GmbH Limited. Yarra is a trademark of Phenomenex. All other third-party trademarks are the property of their respective owners.
© 2020 Cytiva
All goods and services are sold subject to the terms and conditions of sale of the supplying company operating within the Cytiva business. A copy of those terms and conditions is available on request. Contact your local Cytiva representative for the most current information.
For local office contact information, visit cytiva.com/contact
CY13184-11Dec20-BR