external imbalances and fiscal fragility in the euro area this draft: july 29, 2012 external...
TRANSCRIPT

1
This draft: July 29, 2012
External imbalances and fiscal fragility in the euro area
Pietro Alessandrini*, Michele Fratianni**,
Andrew Hughes Hallett*** and Andrea F. Presbitero*
Abstract
This paper presents two views of the European sovereign debt crisis. The first is that the South in the euro zone has been fiscally irresponsible and failed to implement pro-competitive supply side policies. The second view holds that the crisis reflects a deep divide between the external surpluses of the North and external deficits of the South. Basic stylized facts cast considerable doubt on the explanation based only on the first thesis. A relatively simple model shows how poor fundamentals can create a debt problem independently of fiscal responsibility. The empirical analysis of the determinants of government bond yield spreads relative to Germany suggests that both views in fact provide useful insights into the roots of the current sovereign crisis. However, differences in labor productivity growth and competitiveness between North and South have assumed a much more dominant role since the Greek crisis erupted in 2010.
JEL Classification: F32, F42, G12, H63.
Keywords: Sovereign yield spreads; external imbalances; adjustment burden; monetary union.
* Università Politecnica delle Marche, Italy, and MoFiR, emails: [email protected] and [email protected]. ** Corresponding author, Indiana University, Università Politecnica delle Marche (Italy) and MoFiR, email: [email protected]. ***Kennedy School (Harvard University), George Mason University, University of St Andrews, email: [email protected] We thank Jeff Frieden, Paul De Grauwe, Barry Eichengreen, John Pattison, Fabrizio Saccomanni, Juan Carlos Martinez Oliva, Tom Willett, Ramkishen Rajan, Levan Efrenidze and participants at the “CEMP Forum on Global Imbalances and Economic Stability” (George Mason University) and the INFER workshop “The euro: manage it or leave it!” for their comments; and Gian Maria Milesi-Ferretti and Goetz Von Peter for data on financial flows.

2
1. Introduction
This paper tries to answer three inter-related questions: Why is the speculative attack
(sell off) against sovereign debt taking place in the euro area (EA) in the aftermath of
the financial crisis of 2008-2009? Why is that attack primarily focused on the South,
and not on the North of the EA? Why is such a crisis not occurring outside the EA?
The current policy debate in the EA is predominantly centered on whether the
ongoing fiscal austerity should be continued during depressed economic times. We
can identify three different views in this debate: fiscal austerity in the South of the EA
(simply the South) is necessary to resolve the debt crisis; fiscal austerity can make the
debt crisis worse rather than better; and, an intermediate position, that the austerity
measures need to be timed rather carefully.
The first view is the “German” view: fiscal austerity is essential to reduce the
yield spreads of government debt in the South relative to that on “safe” German
government debt, to restore credibility in the South’s ability to honor its debt, and to
lessen the risk of the South exiting the euro. The alternative of inflating away the
problem by transforming the European Central Bank (ECB) into a lender of last resort
to governments is not only unacceptable to the North, but violates the Treaty of the
European Union (Neumann 2012). The second, Keynesian view is that fiscal austerity
is counter-productive, given the size of the fiscal multipliers, marginal tax rates and
expected long-term growth rates. Fiscal austerity may actually exacerbate market
doubts about government solvency by lowering expected tax revenues (DeLong and
Summers 2012). The third accepts the necessity of fiscal austerity but not under bad
economic times; in other words the implementation of fiscal correction must take
place when conditions warrant it (Corsetti 2012; IMF 2012a).
Until recently, relatively little has been said about the euro-area crisis being
as much the result of external imbalances as of fiscal profligacy.1 In a sovereign
country, inter-regional imbalances would pose no problem to the stability of the
monetary union. But in the euro area they do. There are two reasons for this.
The first is that a monetary union needs the support of a significant centralized
budget to absorb transitory, idiosyncratic shocks to individual member economies; in
other words a fiscal union (Kenen 1969). In a monetary union, monetary policy can
1An exception is Wihlborg et al (2010). An implication of this view is the endogenous optimal currency area hypothesis may have misled policymakers into thinking there was no need to adjust.

3
only stabilize aggregate shocks if they affect all members of the union equally. The
alternative, real exchange-rate adjustments to idiosyncratic shocks must operate
through changes to regional prices and wages. The fact that prices and wages are
sluggish makes this adjustment process slow and leads to excessively long
disequilibria in the output and labor markets. Therefore, it falls to fiscal policy to fill
in the gap; to play the role of equilibrating regional differences in the fluctuations of
output and employment (Fratianni and von Hagen 1992, ch. 8). Inadequate centralized
fiscal instruments expose a monetary union to prolonged spells of regional economic
disparities and, as a result, undermine the proper functioning of the union. Empirical
work done in the 1980s and the 1990s has confirmed the importance of this view.2
The call for a sizable centralized fiscal budget to stabilize transitory regional
shocks in an Economic and Monetary Union (EMU) is an old one. It was pointed out
in 1989 by the Delors Report.3 Earlier, the MacDougall Report (Commission of the
EC 1977) had estimated that a budget of about five percent of the Community's GNP
would be required for a viable EMU. The same report also indicated that central
governments tend to redistribute resources among regions permanently. For example,
between 1971 and 1973, poorer regions in the South of Italy received net public
finance inflows averaging between 7.8 and 28 percent of their gross regional product.
At the same time, their regional current-account deficits varied between 14.8 and 42.3
percent. In contrast, the relatively rich regions in the North had net public finance
outflows between 4.4 and 11.1 percent, compared with current account surpluses of
10.9 to 15.3 percent (Commission of the EC 1977: 33).4
2 For example, Sachs and Sala-i-Martin (1989) contend that the U.S. federal fiscal system responds to regional shocks by offsetting about one-third of impact effects through compensating tax and transfer payments. They, like Eichengreen (1990) and Bayoumi and Masson (1995), conclude that an EMU without a sufficiently large fiscal apparatus would not work well. 3 On page 89, this report states that: “[I]n all federations the different combinations of federal budgetary mechanisms have powerful "shock-absorber" effects, dampening the amplitude either of economic difficulties or of surges in prosperity of individual states. This is both the product of, and the source of the sense of national solidarity which all relevant economic and monetary unions share.” 4 The Italian redistribution of public resources from the North supplemented inadequate capital flows to South. Between 1970-72, private net inflows, intermediated by banks and subsidized by government, accounted for 14.2 percent of the South’s GDP against a current-account deficit equal to 23.4 percent of the area’s GDP. Such a situation has persisted to the present day. Long-run sustainability of the inter-regional current-account imbalances in the Italian monetary union was guaranteed not only by inter-regional flows of capital (both private and public) but also of labor. From 1951 to 1981, 25 per cent of the population has emigrated from the less developed Italian regions. On these issues see Tamagna and Qualeatti (1978), Alessandrini (1989), Galli (1990), and De Bonis et al. 2010.

4
The second reason why national imbalances may undermine the EA is that
speculative attacks against individual members of the monetary union cannot be ruled
out (Garber 1999). By contrast, speculative attacks against regions of a sovereign
country can be ruled out. The argument goes as follows. The euro area has a
centralized monetary authority, the ECB, and national central banks (NCB). The fixity
of the exchange rate among member countries is guaranteed by unlimited credit
granted to each NCB through Target2, the online real-time payment system through
which intra-euro area transactions are settled. These transactions arise from cross-
border flows of goods and services, financial transactions or transfer of money (bank
deposits) from one country to another. If member countries had fixed exchange rates
but different currencies, these cross-border transactions would have to be settled with
international reserves. A common currency and the Target2 mechanism have
eliminated the need for such reserves. But an essential condition for the smooth
operation of the euro area is that each NCB must have free access to credit through
Target2 to play the role of reserves. If there is “skepticism that a strong currency NCB
will provide through Target2 unlimited credit in euros to the weak NCBs,” sparked by
“[a] large cross-border capital movement [that] may occur because of misplaced
doubt about the continuation of a country in the monetary union, fear of a default on
its bonds, or problems in its financial system that cause a bank run”, then a
precondition exists for a speculative attack (Garber 1999:211-12).
Before the liquidity crisis that erupted in the European interbank market in
August of 2007, the Target2 balances of individual NCBs were small. Since 2007,
these balances have grown steadily.5 Sinn and Wollmershaeuser (2011) and
European Economic Advisory Group (2012, ch. 2) claim that these imbalances
represent a quasi-fiscal action by creditor NCBs (the North) in favor of debtor NCBs
(the South) and are qualitatively not different from the assistance that the South
already receives through the European Financial Stability Facility. In Germany, this
issue is becoming politicized and gives additional credence to the point raised by
Garber: the very fact that a discussion is taking place about ways to curtail or make
Target2 debit balances more costly raises doubts about the availability of unlimited
5 At the end of 2010, Germany had a credit balance of €326 billion; and Greece, Ireland, Portugal and Spain owed an aggregate €340 billion (Sinn and Wollmershäuser 2011). At the end of 2011, the German credit balance had increased by more than €100 billion to a reported total of nearly €1tn, while Italy had accumulated a deficit position of close to €200 billion (Bornhorst and Mody 2012).
5
of debtor economies.
credit in the future and the possibility, remote as it may be, of a speculative currency
attack on the euro – or, more likely, on the debt
In sum, the EA is structurally fragile, a fragility that was exposed by the financial
crisis and government actions to rescue their banking systems. Investors’ fears about
this weak structure have manifested themselves by attacking the euro through the
government debt market. While these attacks may reflect genuine concerns about the
unsustainability of debt in the South, the deep divide between the external surplus of
the North and the deficits of the South cannot be dismissed as a potential trigger
mechanism for the debt crisis and its resistance to fiscal therapy. This resistance may
well reflect an inadequate transfer mechanism that is normally present in sovereign
states, destabilizing real exchange rate movements, and low economic growth. These
are old problems (Sargent 2012); but they have not been recognized by the recent
literature or policy practice. As a result, the present regime of fiscal austerity appears
to be a cure of a symptom rather than of the cause of the euro crisis.
The rest of the paper is organized as follows. In the second section we present
some stylized facts of the sovereign debt crisis, facts that cast some doubt on the view
that the sovereign debt crisis has been driven by the lack of fiscal discipline in the
South. The third lays out the two interpretations of the crisis. Section four provides a
general framework for analyzing an excess debt problem. Section five develops and
tests an empirical model of the determinants of sovereign yield spreads in the euro
area. The critical result is that fiscal fragility and external imbalances explain a
significant share of the widening spreads in the euro area since the onset of the global
financial crisis. That share now dominates, having risen significantly with differences
in labor productivity and growth rates between the North and the South since the
Greek crisis erupted in 2010. Conclusions are drawn in the last section.
2. Stylized Facts
In this section we present some stylized facts of the sovereign debt crisis. We start by
examining the yields on 10-year government bonds of Greece, Ireland, Portugal,
Spain, and Italy (known collectively as GIPSIs) and Germany from 2007 to the end of
March 2012. At the time that the European inter-bank liquidity crisis exploded (7

6
August, 2007), the GIPSI sovereign yields were very close to Germany’s.6 After the
Lehman’s bankruptcy and, more clearly after the revelation of the Greek crisis, these
spreads marched relentlessly upward, apparently immune to the announcements and
actions taken by European Union leaders to contain the crisis.7
The extraordinary rise in GIPSI’s bond yields stands in sharp contrast to the
decline of US, UK, and Japanese bond yields, as well as German bonds.8 These are
dramatic contrasts which this paper needs to explain.
Differences in inflation expectations, or an expected exchange rate depreciation
of the euro relative to the dollar, are not likely explanations of the phenomenon in
question. If they were, one would have observed significant differences between the
German yields and US, UK and Japanese yields. In fact, the differences between
German yields and UK and US yields are negligible, while the difference with respect
to the Japanese yields is less than one percentage point.
High and rising levels of government debt in relation to GDP, and large
government budget deficits are another possible explanation. Table 1 shows govern-
ment gross-debt-to-GDP ratios for 11 EA countries and the three outside countries,
the United Kingdom, the Unites States, and Japan. Reported data are for 1999 (start of
the euro), 2007 (pre-crisis period), 2011, and the first differences between 2007 and
1999, and 2011 and 2007. By 2007, Austria, Belgium, Finland, Ireland, Italy, the
Netherlands, and Spain had reduced their debt ratios relative to 1999 values. By
contrast, Japan had increased its debt ratio by 54 percentage points and the United
States by one percentage point. Government financed rescue plans of the banking
system and the recession following the financial crisis then raised debt ratios
significantly. Particularly hard were hit Ireland (whose debt ratio went up by 89
percentage points), Greece (60 percentage points), Portugal (38), and Spain (31).
Japanese, US and UK debt ratios also went up sharply, by 45, 38 and 37 percentage
points respectively. In contrast, Italian debt ratio was not influenced by the financial
6 At that point, Ireland and Spain had yield differentials relative to Germany of 9 basis points (bp); Portugal 23 bp; Italy 28 and Greece 30. 7 When Lehman filed for bankruptcy protection on September 18, 2008, those spreads had risen to 47 bp for Spain (the smallest), and 81 bp for Greece (the largest). When irregularities in Greek government budget accounts were revealed in January of 2010, the Greek spreads moved to 271 bp; Ireland followed with 156 bp; and Spain’s were lowest at 71 bp. 8 The German yield declined steadily from 4.7 percent in the middle of 2008 to 1.2 percent at the end of July, 2012. US and UK yields dropped from around 5 percent in 2007, to around 1.5 percent by July 2012; and Japanese yields from the 2 to 0.85 percent over the same period.

7
crisis. And as late as the first quarter of 2012, Spain had a debt ratio lower than that of
France or Germany.
Next, consider fiscal discipline as measured by the ratio of government primary
surpluses to GDP. Table 1 reports the cumulative flow over the period 1999 to 2011
for the 11 EA countries plus the UK, US, and Japan. Three of the Southern economies
accumulated smaller primary deficits than in France or Ireland. Italy, on the other
hand, accumulated primary surpluses larger than those of Germany, the Netherlands
or Austria. And the three outside countries are the least fiscally disciplined. Initial
debt conditions also matter. A large debt requires larger primary surpluses to offset
interest payments on that debt; this is the case in Belgium and Italy. On the other
hand, countries with a more virtuous fiscal past are in a position to run larger primary
deficits or the same primary surpluses at lesser cost than countries with a profligate
past. This is the case in France, Ireland, Spain, the United Kingdom and the United
States. The United States, in particular, benefits from the additional advantage that the
US dollar is a dominant world currency which makes borrowing cheaper. The puzzle
is Japan, a country with an extremely high initial debt-to-GDP ratio (in 1999), and
high budget deficits, but no speculative attacks. The fact that Japan has large net
foreign assets, continues to run current account surpluses, and has a central bank that,
unlike the ECB, is willing and able to act as lender of last resort to government may
explain the puzzle.
The final set of stylized facts refers to external imbalances. Table 2 shows
cumulative current-account balances for 11 EA countries as a percent of GDP over
the period 1999-2012 (2012 values are IMF forecasts). Note the big divide between
the surpluses of the North – Netherlands, Finland, Germany, Belgium, Austria — and
the deficits of the South (Italy, Spain, Portugal and Greece) with France acting as
median. The table has two additional columns: the cumulative percentage change in
unit labor costs for the period 1999-2010 and the cumulative percentage change in the
CPI for 1999-2010. With the exception of Ireland, badly affected by the financial
crisis, the North has benefited from low unit labor cost growth and below median
inflation rates (real exchange rate depreciations relative to the South), whereas the
South has suffered from high unit labor cost growth and above median inflation rates9
9 In other words, (cost) inflation in the South cannot be laid at the door of a Balassa-Samuelson effect.

8
(real exchange rate appreciation relative to the North). These data are consistent with
the hypothesis that the asymmetries in the external imbalances of euro area countries
were driven by wage and labor productivity differentials which were not compensated
by real exchange rate adjustments.
In sum, the stylized facts raise significant doubts about the view that the
sovereign debt crisis has been driven primarily by a lack of fiscal discipline in the
South. In fact, to select the problem economies by size of deficit or debt ratios is to
pick out the wrong set of countries.
3. Two Interpretations
There are at least two interpretations of the sovereign debt crisis in the South of the
euro area. The first is a lack of fiscal discipline; the second is external imbalances and
inadequate adjustment mechanisms operating in the EA. The two interpretations are
not mutually exclusive however.
The first hypothesis takes its cue from the financial crisis of 2008-2009, which
instigated a big increase in general risk aversion. It is based on a large literature
stressing the adverse role of fiscal deficits and government debt on sovereign bond
yields; see Baldacci and Kumar (2010), Maltritz (2012) and references cited therein.
Fiscal variables have been found to be statistically significant in explaining the rise in
government bond yields in the first phase of the financial crisis (Attinasi et al 2009;
von Hagen et al 2011). However, their economic relevance is quite limited (Attinasi et
al 2009; Aizenman et al 2011; De Grauwe and Ji 2012). An additional, but smaller
role is played by liquidity effects and repricing of risk (announcements of bank rescue
packages), while international risk aversion has played the biggest role in explaining
the increase in spreads. Significantly, international risk aversion matters most for
countries with weaker fiscal positions (Favero and Missale 2012). This parallels the
finding that Argentina had, by the time of the collapse of her currency board regime in
2001, swapped default risk for currency risk (Hughes Hallett 2007), which explains a
good part of why default risks have acted on the South and not on high-deficit, high-
debt countries like Japan, the United States or the United Kingdom.
This argument provides an alternative interpretation of the crisis. The shock of
the world financial crisis exposed the fragility of the EA construction which does not
permit the South, burdened with external imbalances and rigid economies, to benefit

9
from the fiscal equalization and bail-out commitments normally available to sub-
national governments in a fiscal union. It is quite likely that the South may be too big
to bail-out; an issue that does not apply to a country like Japan, for example, whose
government is supported by a central bank willing to act as a lender of last resort.
Under flexible or adjustable exchange rates, adjustments to a current account deficit
occur via a combination of income and exchange rate changes. Under fixed exchange
rates, the adjustment occurs by a flow of money from deficit to surplus countries and
subsequent price and income adjustments. Should the central bank counteract this
money flow with sterilization policies, a speculative attack will induce deficit
countries to devalue and surplus countries to revalue their nominal exchange rates. In
a monetary union like the EA, NCBs can neither adopt sterilization policies nor adjust
their nominal exchange rates. This does not imply, as we have seen, that the monetary
union is immune from the risk of a speculative attack induced by persistent external
imbalances in some of its member countries. To avoid such a risk, the adjustment to
external imbalances must occur through internal revaluation in the surplus countries
and internal devaluation in deficit countries. In the EA, this means that the North must
have higher incomes, prices and wages; or the South has to have lower incomes,
prices and wages; or a combination of the two. This adjustment burden needs to be
shared between surplus and deficit countries, with the predominant share of the
burden falling on surplus countries when economic activity is slack and on deficit
countries in an inflationary environment (Keynes 1943: 20; Mundell 1968, ch. 13).
But the North is not willing to reflate. Instead, it has imposed an internal devaluation
on the South through a policy of fiscal austerity. Given that internal devaluation is
difficult and takes a long time to implement, the market expresses its “fears” on the
feasibility and sustainability of this strategy by raising risk premia on Southern
government debt. These fears are further reinforced by concerns about the sustain-
ability of the Target2 balances.
Somewhat belatedly, the literature is beginning to recognize the importance of
external imbalances in explaining the euro crisis. The fall in interest rates, following
monetary union membership, fueled foreign borrowing by both public and private
sectors in the peripheral countries (Waysand et al 2010). However, contrary to the
prediction of the Blanchard and Giavazzi (2002) model, “foreign capital was used to
support domestic consumption or housing booms rather than productivity enhancing

10
investments” (Higgins and Klitgaard 2010:1), spreading the seeds of a future
sovereign debt crisis (IMF 2012b). This is a point originally made by Ingram (1973),
and discussed by Giavazzi and Spaventa (2010) who develop a model to show that the
intertemporal budget constraint influences capital allocations even within a monetary
union. A boom of foreign financing directed to the non-tradable residential sector, or
to consumption, makes growth unsustainable since the solvency conditions cannot be
met. According to Merler and Pisani-Ferry (2012:12), “conventional wisdom in
research and policy was that among euro-area countries, balance-of-payments would
become as irrelevant as among regions within a country”. In a CESifo Institute report
(Sinn 2012), we read that: “The European Monetary Union is currently experiencing a
serious internal balance of payments crisis that is similar, in many important ways, to
the crisis of the Bretton Woods System in the years prior to its demise.”10
In what follows we present a small model showing that these two alternative
hypotheses are not mutually exclusive, and then provide some econometric results to
show the relative importance of external imbalances and fiscal fragility in explaining
the broadening sovereign bond yields in the EA.
4. A General Framework
The objective of this section is to present a simple model that demonstrates how poor
fundamentals can create a debt problem with or without fiscal irresponsibility.
The point of departure for this model is the fundamental identity in any open
economy: S – I = (G-T) + CA, where S = private saving, I = fixed investments, G-T =
budget deficit (public spending less revenues) and CA = current account balance. This
identity links external imbalances and private financing imbalances to the govern-
ment’s fiscal imbalance. It shows how imbalances on the right hand side can lead to a
banking crisis in the private sector; or how an external imbalance, even in the absence
of fiscal irresponsibility, can lead to an accumulation of public debt, capital outflows
and a financial sector liquidity crisis, in which private debt is replaced by public debt.
For example, if a current-account deficit appears for any reason (CA < 0), then
either the government has to run a budget deficit (G-T > 0), or private savings must
fall relative to investment (S – I < 0) to restore equilibrium. But private savings tend
to rise, and investment to fall in a recession: S – I > 0. So the more likely outcome is
10 A point taken up by Martin Wolf in the Financial Times (April 10, 2012).

11
that the government budget deficit rises. Indeed, if the private sector is carrying too
much debt, it will be the first to deleverage in a downturn – creating a banking crisis
because savings rise to pay down that debt. This causes a loss of liquidity in the
banking system and a potential banking crisis, which leads to even larger fiscal
deficits to rebalance economic activity, or to smooth consumption or tax revenues,
and to replace the savings in banks. At that point, excess private debt becomes excess
public debt. Demand for assets/bonds in problem countries will collapse, especially in
a currency union like the EA where asset sales can be sent to low-risk countries
(Germany, Finland, the Netherlands) without cost or exchange rate risk. Government
bonds in the problem countries are then no longer capital risk free, especially if a
bailout looks unlikely or too small. In such cases, the expected value of a euro held in
one place is not necessarily the same as its value in another – leading to a run on the
deposit base in the problem economy and increased borrowing costs.
One can extend this example by asking, how did the private sector get indebted in
the first place? If an economy enters an era of historically low interest rates (a global
savings glut, or on joining a more disciplined currency zone), then savings will fall
with the start of an asset bubble or domestic credit boom (US, UK, Ireland) which
turns S-I negative. This is no problem if, and as long as, the credit bubble produces a
matching trade deficit (CA<0) as in Portugal or Spain. But if it fails to produce that
deficit, or the credit/asset bubble bursts, or if trade financing dries up (so I falls too),
or there is a deposit run as above, then there will be a financing stop and fiscal deficits
have to increase (G-T>0) to provide liquidity to the banks. Hence the distribution of
debt matters (Wolf, 2012) and this needs to be recognized in our model.
This sequence of events provides the links by which poor macroeconomic funda-
mentals and current account deficits can easily translate into fiscal deficits and a crisis
in the banking sector, even if there has been no fiscal irresponsibility (Ireland, Spain).
Fiscal irresponsibility (Greece) simply adds to the fiscal deficits already implied. It is
therefore sufficient to model these links for a given fiscal program, responsible or not.
The key point is to show how they can cause unsustainable build-ups in sovereign or
private debt, irrespective of the degree of fiscal responsibility.
4.1 Modeling Private Sector Imbalances Since both current accounts and portfolio balances affect exchange rates and rates
of return, and are affected by them, they need to be modeled jointly. This is usually

12
accomplished by assuming perfectly substitutable assets between countries and
instantaneous and complete market adjustments. Uncovered interest rate parity can
then be applied. However, given that we are dealing with a case where a country’s net
debt may become excessive and needs to be curtailed, this approach is not suitable in
a world of global imbalances or market distortions caused by sticky prices, fixed
exchange rates, sudden stops, and a revealed preference for holding foreign reserves
or foreign assets (i.e., where there are safe haven or flight-to-quality effects). A more
general approach is provided by Blanchard, Giavazzi and Sa (2005), who build upon
earlier models by Masson (1981), Henderson and Rogoff (1983), and Kouri (1983).
Blanchard et al. model current account and portfolio balances directly, and the adjust-
ments between them. Their framework therefore permits us to consider imperfect
asset substitutability and different asset preferences. It also allows us to examine the
stability of the adjustment process in assets/debt under a common currency, sticky
relative prices, and sudden stops in capital flows or inter-economy financing. Those
extensions are studied by Hughes Hallett and Martinez Oliva (2012) to show the net
asset positions of different countries and valuation effects caused by financial flows.
The formal model is presented and analyzed in the Appendix. Here we limit
ourselves to a description of its main features and its implications. Our simple model
considers two countries, home and foreign, linked to each other by an uncovered
interest parity condition, current and expected real exchange rates (defined as the
price of home goods relative to foreign goods). In the EA, nominal exchange rates are
fixed and changes in real exchange rates occur only through relative prices. A country
accumulates net foreign debt through interest payments on the beginning-of-the
period debt and a new external imbalance flow, the latter a function of the real
exchange rate and trade shocks. Investors’ wealth is the difference between domestic
assets and net foreign debt; the distribution of wealth between domestic and foreign
assets is determined by interest rates and real exchange rates.
In equilibrium, there is a negative relationship between the real exchange rate
and net debt in both the portfolio balance and the current account balance relation-
ships. A higher net foreign debt requires a lower exchange rate because the demand
for domestic assets has fallen and a larger external surplus is needed to meet interest
payments. But to ensure stability in both trade and capital markets, the sensitivity of
the real exchange rate (E) to changes in net foreign debt (F) must be higher in the

portfolio balance (PB=0) relation than in the current account balance relationship
(CA=0); see Figure 1.
The same figure could be used to distinguish differences in adjustments
between the EA countries and outsiders like the United Kingdom or the United States,
which can use their nominal exchange rates and lender-of-last-resort facility to make
the current account more sensitive to the real exchange rate. Two specific problems
have therefore made the debt crisis in Europe difficult to resolve: fixed nominal
exchange rates (a consequence of currency union membership) and sudden stops in
financing (especially given excess inflows before the sudden stops). Figure 1 imposes
these restrictions with either a fixed real exchange rate ,E or a fixed level of net
foreign debt at the left hand vertical line. A fixed real exchange rate shows what
will happen with inflexible prices/wages when nominal exchange rates are fixed; and
what happens if there is a sudden financing stop.
We start with a fixed exchange rate regime. At a point A, home’s current
account is in deficit and her net foreign debt is increasing. So the PB=0 line shifts to
the right, and will continue to do so as long as the fixed exchange rate remains in
place and relative prices remain sticky. The process of adjustment goes through an
early stage of net foreign debt changes before valuation and exchange rate effects lead
to a slide down the PB=0 line. But we never gets as far as A’’ in the absence of real
exchange rate depreciations. This process is not sustainable because home’s debt
increases without limit; default will eventually break the real exchange rate when the
debt ratio can no longer be serviced, the economy goes into recession and prices fall.
When that happens, the economy adjusts down the PB=0 line until it reaches C. But
the longer E is maintained, the further the PB=0 line will have shifted, the greater the
debt burden, the bigger the bust. To avoid these outcomes, home or foreign will have
to bring a sudden capital stop and provide liquidity support; or they will have to adjust
their real exchange rates; or foreign must accept an ever increasing accumulation of
claims on home, such as unused foreign assets or Target2 promissory notes. In sum,
debt is the main equilibrating force until countries are forced to adjust the real
exchange rate and competitiveness.
Next we move to flexible exchange rates. At B, home’s current account is in
deficit and her net foreign debt is increasing. A saddle path to a new equilibrium is
determined by the interplay of a faster adjusting debt, and hence upward pressure on 13
the current account deficit; and a slower adjusting trade balance, hence downward
pressure on the current-account deficit. If the former dominates, we do not get back to
the line; instead we move down a parallel line above it until we get close to
the PB = 0 line (if the slower moving trade adjustments allow us to catch up with
movements in portfolio balances). Eventually, at PB=0, F will move slower than the
trade balance and it becomes possible to slide down the portfolio balance line to the
new equilibrium at C. If the trade balance is sensitive to the exchange rate (i.e., the
Marshall-Lerner conditions are satisfied), the pressure to move down to the current
account line will be large relative to the changes in debt and we will catch up with the
shifts in C. However, the Marshall-Lerner conditions are often not satisfied, especially
in the short run when J-curve effects are operative. In the long term, the trade deficit
may become sufficiently sensitive to real exchange rate depreciations the economy to
approach the CA=0 line. If so, E will jump to the saddle path and settle at C where
0CA
F 0 and PB=0 stops moving. In sum, the danger is that corrections to trade
imbalances may never be large enough, rapid enough, or strong enough to balance the
current account and stop the debt escalation.
4.2. Implications for a testable empirical model
The model sketched above has several implications for empirical work. First, the two
interpretations of the debt crisis – fiscal irresponsibility and external imbalances – are
not mutually exclusive and yield compatible implications, especially in the short run.
In the long run, however, the external imbalance interpretation has more
explanatory power: factors such as losses of competitiveness, sticky real exchange
rates, persistent trade deficits, sudden stops in capital flows, and vanishing liquidity
can account for a debt crisis independently of fiscal irresponsibility, whereas poor
fiscal policies can be overcome when the fundamentals are strong (e.g., the pre-2005
period). Second, debt sustainability requires higher debt levels to be matched by
depreciating real exchange rates; and that the indicators of debt sustainability, such as
yields on government securities relative to a safe asset, are more sensitive to portfolio
factors and financing flows than to the trade balance.
The relative sensitivity of asset portfolios and trade deficits therefore play a
crucial role in a debt crisis: debt reductions need to react to existing debt levels which
means current-account deficits and their underlying determinants have to respond too
14

to prevent those reductions being offset. So whether we reach an equilibrium position
with sticky real exchange rates and financing stops is ultimately an empirical matter.
It is important that we include the drivers of that interplay in our equation explaining
spreads: debt, primary deficits, financing vs. growth, productivity, competitiveness, or
trade deficits. Lastly, the loss of market liquidity (a sudden stop in F, which manifests
itself in larger bid-ask spreads in the securities market) and inflexible real exchange
rates render adjustment to a new equilibrium much more difficult, if not impossible.
In the next section, we test the implications of the two interpretations of the
debt crisis for their importance.
5. The determinants of EMU sovereign yield spreads
5.1 The empirical model
To assess the relative importance of external imbalances and fiscal variables on the
evolution of the 10-year government bond spreads relative to German bunds (Spread)
to represent fiscal fragility, we follow the recent literature on European sovereign debt
crisis (Codogno et al. 2003; Pagano and von Thadden 2004; Barrios et al. 2009; von
Hagen et al. 2011; Maltritz 2012; Favero and Missale 2012) and estimate a simple
model based on quarterly data for 10 EA countries.11 To do that, Spread is modeled
as a function of variables capturing global, regional and country-specific conditions:
where i refers to the i-th EA country and t refers to the quarter. In line with the
majority of the recent literature on EA spreads, all country-specific explanatory
variables are measured as differences from the benchmark German values (von Hagen
et al. 2011; Maltritz 2012; Favero and Missale 2012). In view of the empirical
importance of aggregate risk in explaining yield differentials (Codogno et al. 2003;
Geyer et al. 2004; Favero et al. 2010), we use a synthetic measure of general risk
aversion (Global Risk Aversion). We construct this variable from the first principal
component of four alternative indicators of global riskiness: the volatility index of the
OEX market, the effective long-term yields on AAA- and BBB-corporate bonds and
the yields and volatility index on US-euro and euro-yen 3-month exchange rate (as in
15
11 As standard in this literature, we drop the other EMU countries from the sample as being too small.

16
Barrios et al. 2009). The Principal Component Analysis shows that the four indicators
are highly correlated. The first component (our Global Risk Aversion) explains 62 per
cent of the variance in the data and is constructed to give the same weights to each of
the four underlying variables. It is interesting to compare the evolution of Global Risk
Aversion and a synthetic index of our 10 EA Spreads (a Sovereign Risk Factor), the
first principle component of the individual spreads. These two variables turn out to be
highly and positively correlated until the first phase of the financial crisis; but they
start to diverge in 2010 after Greece’s credit rating downgrade in December 2009,
which in turn triggered massive capital outflows and sudden-stop episodes in the EA
South (Merler and Pisani-Ferry 2012). This steep increase in EA sovereign bond
yields in a period of otherwise stable (or moderately declining) global risk aversion is
consistent with the hypothesis that the sovereign debt crisis is EA-specific and stems
from causes that go far beyond fiscal profligacy (Figure 2).
Our empirical model also includes Liquidity, a measure of liquidity risk in the
bond markets, and real GDP growth (Growth). The effect of liquidity has been
recognized by the literature in general (e.g., Amihud and Mendelson 2006; De Nicolò
and Ivaschenko 2009) and specifically with respect to EA sovereign spreads (e.g.,
Attinasi et al. 2009; Barrios et al. 2009).12 We measure liquidity conditions using bid-
ask spreads on the secondary markets for 10-year government bonds. This measure of
liquidity reveals a severe liquidity contraction in the Greek market, where the bid-ask
spread rose above 700 bp; and, to a lesser extent, in the Irish and Portuguese markets
in 2011. Italy and Spain, by contrast, experienced very moderate increases in bid-ask
spreads (16 bp and 11 bp, respectively), almost the same as those observed in Austria
and Belgium. By contrast, the German market remained deep and liquid throughout
the sovereign debt crisis.
The role of fiscal variables in driving Spreads is documented, among others,
by Attinasi et al. (2009), von Hagen et al. (2011), and De Grauwe and Ji (2012). Our
vector Fiscal consists of two variables: primary-budget-balance-to-GDP ratio and
gross-government-debt-to-GDP ratio, both measured as differences from the German
counterparts. These ratios are widely recognized as indicators of fiscal fragility and
12 Liquidity in EMU bond markets emerged as an issue during the crisis, having been small and inter-twined with fundamental risk during earlier more tranquil periods (Geyer et al. 2004; Pagano and von Thadden 2004; Favero et al. 2010).

17
have received maximum attention from policy makers.13 Larger budget deficits are
perceived as indicators of a lax fiscal policy, and hence default risk, to the extent that
they undermine public debt sustainability. Debt sustainability is also weakened by
high values of existing public debt: small changes in interest rates exert large changes
in interest payments on debt. Therefore, financial markets start demanding higher risk
premia when public debts are perceived to be “too high.” The emergence of higher
risk premia, in turn, may trigger a vicious cycle of rising interest expenditures and
growth-reducing fiscal austerity undertaken during periods of slow or negative
economic growth (Perotti 2012).
Table 1 shows that some countries in the South – e.g., Spain – had better fiscal
positions than Germany before the onset of the crisis, and we have argued that the
roots of the crisis are deeper than fiscal profligacy. Our focus has been on external
imbalances instead, and the fragility of the EA in the absence of a smooth adjustment
mechanism for resolving those imbalances (Section 3). Vector Imbalances in our
empirical equation includes explanatory variables that capture the external imbalance
issue: changes in the general level of prices (Inflation), growth of labor productivity
(Labor productivity), and a measure of foreign bank lending (Liabilities to German
banks). Inflation and Labor productivity are different indicators of competitiveness
underlying trade and current account imbalances. Liabilities to German banks is
computed as the ratio of a country’s financial liabilities vis-à-vis German banks to
German GDP, as reported in the consolidated banking statistics of the Bank of
International Settlements (2012). This variable is a good proxy for the Target2
mechanism, a key instrument that countries in the South have used to finance their
external imbalances at the peak of the crisis. Finally, ηi are country fixed effects and
εit the error term. Table 3 reports variable definitions, data sources and sample means.
5.2 Empirical results
To compare our results with the existing literature, we estimate equation (1) on
quarterly data from 2000:q1 to 2011:q2 using a range of possible estimators. Table 4
summarizes the results.
We start by using a panel-corrected standard error (PCSE) estimator and Feasible
General Least Squares (FGLS) corrected for heteroskedasticity across panels. The
13 See the VoxEU debate managed by Corsetti (2012). The two fiscal measures are highly correlated with spreads (Maltritz 2012; Favero and Missale 2012).

18
PCSE estimator assumes that disturbances are heteroskedastic and contemporaneously
correlated across panels and that follow, within panels, an AR(1) process specific to
each panel. The PSCE estimates (column 1) suggest that the degree of global risk
aversion does not affect EA yield spreads, and that large primary deficits relative to
Germany raise the spread. Spreads are, however, more strongly influenced by market
liquidity, public debt and growth. These variables are highly significant and have the
expected signs. The same is true for the FGLS estimates (column 2).14
PCSE and FGLS estimators, while representing the conventional approach in
this context (see Attinasi et al 2009; Baldacci et al 2011; Schmitz and von Hagen
2011), assume that observations can be pooled across panels. The validity of this
assumption is challenged by the Roy-Zellner test for poolability, which shows that the
null hypothesis of equality of the country coefficients is rejected (the value of the Chi-
squared test is 534). Therefore, we re-estimate model (1) using a within-group (fixed
effect) estimator, assuming an autocorrelation process in the error terms up to order 4
(Newey and West 1987).15 Adding country fixed effects (column 3) changes the
magnitude of the coefficients, but confirms the previous findings, except for the
coefficient of the primary balance that becomes positive and statistically significant.
At first sight this result seems counterintuitive. It would be correct if enough countries
had stronger fiscal positions than Germany. But even if some did, on average, across
countries and time, they did not: see Table 3. The explanation is in fact different, and
follows because the trade balances term in Table 7 below has a matching sign. This is
evidence that external imbalances (when financed by capital flows) offset the need
for, and impact of, internal imbalances just as the fundamental identity in Section 4
says it should. A current account imbalance matched by a private financing inflow has
little impact on the budget balance. But if those inflows fail, as in the crisis period
(2010 on), the impact of the primary deficit on spreads will matter and may switch
sign – as we see in Table 6 when we allow the estimated coefficients to vary over
time. As proof of this proposition, the flow of finance (here liabilities to German
14 In this context, the PCSE estimator is preferable to Feasible General Least Squares (FGLS) because the latter generates over-optimistic variance-covariance estimates in panels with a limited time dimension (Beck and Katz 1995). 15 Results are similar using different autocorrelation lags in the error term. We performed Hausman’s (1978) specification test to compare the random and fixed effect models. The results strongly reject the random effect model. In addition, the small number of observations and the limited number of countries prevents us from using a more complete dynamic specification and GMM estimates (Arellano and Bond 1991), which are in any case unsuited to samples like ours (Bond 2002).

19
banks, a proxy for Target2) should become more important with a more negative
impact after 2010; and it does, see Table 6. Thus, to the extent private financing falls
short, primary deficits will proxy for external deficits. Otherwise they are
expansionary. A second complication is that the positive coefficient on primary
balances also depends on the individual country effects. Remove the fixed effect
dummies and the coefficient turns negative as we might have expected from first
principles. In other words, the primary deficit’s impact on a country’s spread depends
on its initial position. The absolute effect of an increased primary deficit is to increase
borrowing costs, and hence spread vs. the benchmark (Germany). But if that country
starts from a weak position (a large primary deficit relative to Germany), and if
private financing is easily available, then spreads (the relative, if not absolute
borrowing costs) fall as long as private finance is available and the relative deficits do
not become so large as to cause a financing stop or capital reversal. Such financing
makes it safer to live with divergence.
For the rest, deteriorations in public debt, contractions in market liquidity, or a
growth slowdown relative to Germany, spill over into higher spreads. These findings
are all consistent with the hypothesis that fiscal fundamentals contribute to explaining
the crisis, but in a far more complicated way than we usually suppose.
In column 4 we add time dummies; the fit of the model significantly increases,
but only in pre-crisis years if competitiveness and financing variables are included. A
lack of competitiveness and financing difficulties therefore contribute to explaining
the increase in spreads since 2008. Put differently, risks will be mispriced if the wider
macroeconomic fundamentals beyond fiscal indiscipline are ignored. Hence there may
have been risk mispricing independent of the fundamentals, but in this case the effects
are limited (contrast De Grauwe and Ji 2012) if risk aversion is modeled explicitly.
So far we have ignored the role of external imbalances and capital flows
within the EA. We noted that an interpretation of the European debt crisis in terms of
foreign borrowing and lending imbalances has gained currency recently (Higgins and
Klitgaard 2010; Sinn 2010; Giavazzi and Spaventa 2010; Merler and Pisani-Ferry
2012; EEAG 2012). The specific arguments are that large foreign bank lending from
the North to the South before the crisis, sudden capital reversals in the wake of the
crisis, and mounting NCB Target2 balances offer a more accurate picture of diverging
external imbalances than current-account imbalances (Buiter et al 2011). For instance,

20
foreign lending by German banks to EA countries shows steep increases in lending to
Spain, Ireland and Portugal up to the first months of 2008. In Ireland, Portugal, and
Spain, foreign capital was mainly channeled to non-tradable sectors like housing,
making the intertemporal budget constraint unsustainable (Giavazzi and Spaventa
2010, Lane and Pels 2012). But once the Greek crisis started, solvency fears and
uncertainty about liquidity provisions by the ECB triggered a crisis of confidence and
sudden capital reversals in the Southern countries (Merler and Pisani-Ferry 2012).
For these reasons, in column 5 we augment the model by including country-
specific measures of external imbalances: inflation, relative unit labor costs and credit
extended by the German banks. The explanatory power of the model rises (the R-
squared is 0.87) and this represents our preferred specification. While results on
macroeconomic fundamentals are confirmed, we find that spreads also rise when there
is a capital reversal (i.e. a reduction in lending by German banks), and when labor
productivity declines and inflation rises relative to Germany. Also the time dummies
are no longer significant; the unexplained time factor is no longer associated with the
increase in spreads. These findings support the hypothesis that external imbalances,
misaligned real exchange rates and capital reversals contributed to the crisis.
5.3 Fiscal fragility, external imbalances, or both?
The results reported in Table 4 justify the attention given to fiscal adjustment to heal
the Eurozone debt problems. But the same results also point to a decisive role played
by differences in competitiveness and economic growth between North and South. To
assess which of the two competing (but not necessarily alternative) explanations of
the Eurozone crisis matters more, we calculate the contribution of each determinant in
explaining the change in Spread using the regression coefficients of columns 5 of
Table 4 and actual changes in the determinants between 2011:q2 and 2008:q3, or
between 2011:q2 and 2010:q1; see Table 5.
The statistically significant macroeconomic variables in Table 4 explain 77
(76) percent of the movements in the Spread between the third quarter of 2008 (first
quarter of 2010) and second quarter of 2011. Taking the periods of global financial
crisis and sovereign debt crisis together, the bid-ask spread and public debt are the
two main drivers of Spread, accounting for 41% and 26%, respectively, of an average
290 bp increase in spreads across EA countries. If, instead, we focus only on the
sovereign debt crisis period (2010 onward), the role of public debt becomes negligible

21
(accounting for only 4.7% of the increase in Spread in that period), while labor
productivity becomes the relevant factor (29% of that increase), together with market
liquidity (48.5%), in explaining the widening spreads between the Southern countries
and Germany. The other factors remain fairly small, with global risk aversion and
inflation losing what relevance they had before the crisis.
In sum, the results point to a) the greater importance of market liquidity in
times of uncertainty (as in Beber et al. 2009); and b) a shift from a fiscal crisis to a
balance-of-payment crisis which is grounded in labor productivity differences and
growth differentials between North and South.
Thus, the fiscal imbalances and excess debt we observe are not only a matter of
fiscal irresponsibility. Indeed, they are not even predominantly a fiscal indiscipline
matter in the debt crisis period itself. Other macro-imbalances, in particular external
and financing imbalances, matter even in a currency union. Relative to Germany, to
run the euro system safely and smoothly requires symmetric adjustment.
5.4 Testing for structural breaks
The empirical results so far assume that the coefficient estimates remain the same
over time. It is reasonable to assume, however, that the marginal effects of the macro
variables would change as the EA crisis intensifies. Hence, as a next step, we test for
the presence of a structural break in December 2010.16 Table 5 shows the results for
our baseline model. The Chow test confirms that there is a very significant structural
break in the wake of the EA crisis. Moreover, the effect on the explanatory variables
is significantly different across the pre-2010 and post-2010 samples, as shown by the
t-tests for the equality of coefficients.
First, it is worth stressing that the role of external imbalances is magnified
during the crisis. Differences in growth, growth of labor productivity and foreign
borrowing turn out to be significant in the crisis period only, providing supporting
evidence in favor of an external imbalance interpretation of the sovereign debt crisis.
Inflation, by contrast, switches sign and becomes insignificant, implying that the
austerity program, in causing falling prices (deflation) relative to Germany, may now
be creating currency risk for the euro as a whole or an exit risk (devaluation risk) for
the problem countries.
16 We choose 2010 as breakpoint because the bunching of the national spreads broke down in 2010 as the Greek data problems become public. Additional tests confirm that date: see figure 2.

22
As regards the other variables, Global Risk Aversion has the standard positive
coefficient in the pre-crisis period, but turns negative in the midst of the EA crisis,
further confirming the regional dimension of the crisis (Figure 2). Finally, the effect
of budget balance is not significant in either sub-period. But public debt has a much
larger coefficient in post-2010 than before, while the coefficients on market liquidity
are not statistically different across the two sub-samples.
5.5 Robustness
We tested the robustness of the main results, first for potential endogeneity of the bid-
ask spread, second to more controls; see Table 7.
We address the potential endogeneity of liquidity effects using a two stage
least squares (2SLS) estimator. In this case the bid-ask spread of country i at time t is
instrumented using its own lagged value and the average of the other 10 EA countries
at time t. The results for the baseline specification, reported in column 1 of Table 7,
confirm our previous findings. The diagnostics of the 2SLS estimates show that the
model is not misspecified. The exclusion restriction is satisfied since the Sargan-
Hansen test of overidentifying restrictions (OIR) does not reject the null hypothesis
that the instruments are uncorrelated with the error term. The Kleibergen-Paap rk LM
statistic rejects the null hypothesis that the excluded instruments are not correlated
with the endogenous regressors (i.e., the equation is underidentified). We are thus
confident that our instruments satisfy the rank condition. Finally, the Kleibergen-Paap
F-statistic for weak identification is well above the Staiger-Stock (1997) rule of thumb
value of 10, and above the Stock-Yogo (2005) 5 percent critical values for 10 percent
maximum bias. This is strong evidence for the validity of the instruments. Moreover
the coefficient on the bid-ask spread is similar in size and significance to our preferred
specification (col. 5, Table 4), and to the estimates in this table once political risk and
trade imbalances are accounted for. This suggests simultaneity biases are minimal in a
properly specified model. That said, none of our inferences are affected; there are no
sign or size changes, or losses in significance, in the other coefficients. However, the
2SLS estimates do not allow for the serial or cross equation error correlations found in
the FE-NW estimates. We therefore opt to remain with our preferred estimates from
Tables 4 and 7: choosing efficiency which might affect the interpretation of our
results, over consistency/endogeneity which evidently does not.

23
In columns 2-5 of Table 7 we expand the preferred specification by including
the stock of private debt (as a share of GDP), trade balances (as a share of GDP), and
an indicator of political risk proxied by the International Country Risk Guide (ICRG).
We find that private debt does not add explanatory power to our model. By contrast,
trade imbalances not privately financed (Table 3, with a positive coefficient in Table
7, shows they were mostly privately financed in this period) and greater political risk
raise bond yields.17 Factors such as government stability, corruption, bureaucratic
quality and vetoes by special interests do have an influence on Spreads, once macro-
economic fundamentals have been controlled for (Baldacci et al 2011).
6. Conclusions
This paper has presented two views of Europe’s sovereign debt crisis. The first is
that the South of the euro zone has been fiscally irresponsible, and has failed to
implement necessary supply-side policies such as liberalizing labor markets and the
market for services. This interpretation has won official recognition and represents
the prevailing wisdom in the EA. It has led to an austerity program aimed at
reducing government budget deficits and debt-to-GDP ratios in the South, haircuts
on holders of government debt should member countries receive financial assistance
from the European Union, measures to restructure public debt, and the new Fiscal
Compact to reinforce budgetary discipline.
The second view is that Germany and the northern economies have failed to
understand the nature of a sovereign debt crisis and that trade finance plays a central
role. Within the EA, the North has enjoyed large current-account surpluses while the
South accumulated current-account deficits, suggesting that the real exchange rate of
the euro is too weak for the North and too strong for the South. Since nominal
exchange rates are fixed in the Euro, and given that economic activity is historically
low in the South, the burden of adjusting external imbalances should fall primarily
on the North through an expansion of aggregate demand rather than forcing the
South to curtail demand. An austerity program in the South implies the opposite: a
reduction of income that is bound to undermine the effects of austerity on budget
17 This coefficient on trade balances is subject to exactly the same interpretation as that for the positive coefficient on primary balances in Section 5.2; it switches to an insignificant negative coefficient in the crisis period as public finance replaces private, and turns negative if country fixed effects are taken out.
24
deficits and debt ratios. In addition, the South cannot benefit from the insurance
mechanism that operates in other fiscal unions, by redirecting public funds from
above-average income regions to below-average income regions.
These two views are not inconsistent. The first stresses the need for fiscal
correction, although not necessarily in the short term. The second recognizes the
importance of long-run fiscal adjustment, but identifies the source of the sovereign
debt crisis as inadequate adjustments in competitiveness between surplus and deficit
countries. As presently constituted, the euro area lacks two important safety valves:
a transfer union and a guarantee that national central banks have unlimited access to
credit in the settlement of intra-EA payments.
The stylized facts in Section 2, and model in Section 4, raise doubts about an
interpretation that says debt crises are driven only, or even primarily, by fiscal
irresponsibility in the South. The comparison of the correlation between debt levels,
primary balances and yield spreads in southern Europe and in the United Kingdom,
United States and Japan imply that fiscal fundamentals are not enough to explain
sovereign risk. Even within the EA, some Southern countries had sounder fiscal
positions than Germany before the onset of the crisis. By contrast, there is a clear
divide between external surpluses of the North and deficits in the South. The North
has benefited from low unit labor cost growth and real exchange rate depreciations
relative to the South. This trend is mirrored by capital outflows from the North–
especially from German banks–to the South. These flows were used to finance
domestic consumption and a boom in the residential sector rather than productive
investments, spreading the seeds of a sovereign debt crisis. The empirical results in
this paper confirm that hypothesis: the Euro-zone sovereign debt crisis has been as
much a matter of external imbalances and consequent financing stops, as of fiscal
irresponsibility. In fact in the crisis period, it has been pre-dominantly a question of
misaligned fundamentals, external imbalances and financing. No-one would argue
that austerity is not necessary in the long term; but mismatches in the timing of its
effects can mean that a misdirected cure kills some patients before they recover.
References
Aizenman, Joshua, Hutchinson, Michael, Jinjarak, Yothin, 2011, What is the Risk Of European Sovereign Debt Defaults? Fiscal Space, CDS Spreads and Market Pricing of Risk, NBER Working Paper, No. 17407.

25
Alessandrini, Pietro, 1989, I flussi finanziari interregionali: interdipendenze funzionali ed indizi empirici sulla realtà italiana, in Niccoli, Alberto (ed.), Credito e sviluppo, Milano: Giuffré editore.
Amihud, Yakov, Mendelson, Haim, 2006, Stock and bond liquidity and its effect on prices and financial policies, Financial Markets and Portfolio Management, 20: 19-32.
Arellano, Manuel, Bond, Stephen R., 1991, Some tests of specification for panel data: Monte Carlo evidence and an application to employment equations, Review of Economic Studies, 58: 277-97.
Attinasi, Maria-Grazia, Checherita, Cristina, Nickel, Christiane, 2009. What explaines the surge in Euro area sovereign spreads during the financial crisis of 2007-2009?, ECB, WP NO 1131.
Baldacci, Emanuele, Kumar, Manmohan S., 2010, Fiscal Deficits, Public Debt, and Sovereign Bond Yields, IMF WP/10/184, August
Baldacci, Emanuele, Gupta, Sanjeev, Mati, Amine, 2011, Political and Fiscal Risk Determinants of Sovereign Spreads in Emerging Markets, Review of Development Economics, 15(2): 251-63.
Bank for International Settelements (BIS), 2012, Guidelines to the international consolidated banking statistics, updated version February.
Barrios, Salvador, Iversen, Per, Lewandowska, Magdalena, Setzer, Ralph, 2009, Determinants of intra-euro area government bond spreads during the financial crisis, European Economy, Economic Papers N. 388.
Bayoumi, Tamim and Masson, Paul R, 1995.Fiscal flows in the United States and Canada: Lessons for monetary union in Europe, European Economic Re-view, 39: 253-74.
Beber, Alessandro, Brandt, Michael W., Kavajecz, Kenneth A., 2009, Flight-to-Quality or Flight-to-Liquidity? Evidence from the Euro Area Bond Market, Review of Financial Studies, 20: 527-52.
Beck, Nathaniel, Katz, Jonathan N., 1995, What to do (and not to do) with time-series-cross-section data, American Political Journal Review, 89: 634-47.
Blanchard, Olivier, Giavazzi, Francesco, 2002, Current account deficits in the euro area: The end of the Feldstein-Horioka puzzle?, Brookings Papers on Economic Activity, 2.
Blanchard, O., F. Giavazzi and F. Sa, 2005 “The US Current Account and the Dollar”. Brookings Papers on Economic Activity, 1, 2005, 1-49.
Bond, Stephen R., 2002, Dynamic panel data models: a guide to micro data methods and practice, Portuguese Economic Journal, 1: 141-62.
Bornhorst, Fabian, Mody, Ashoka, 2012, TARGET imbalances: Financing the capital-account reversal in Europe, VoxEU, 7 March.
Buiter, Willem H., Rahbari, Ebrahim, Michels, Juergen, 2011, The implications of intra-euro area imbalances in credit flows, CEPR Policy Insight, No. 57.
Codogno, Lorenzo, Favero, Carlo, Missale, Alessandro, 2003, Yield spreads on EMU government bonds, Economic Policy, October: 503–532.
Corsetti, Giancarlo, 2012, Austerity: Too Much of a Good Thing?, VoxEu.org eCollection, London: CEPR.
De Bonis, Riccardo, Rotondi, Zeno, Savona, Paolo (eds.), 2010, Sviluppo, rischio e conti con l’esterno delle regioni italiane, Edizioni Laterza.
De Grauwe, Paul and Ji, Yuemei, 2012, Mispricing of DSvereign Risk and Multiple Equilibria in the Eurozone, CEPS Working Document, No. 361.
DeLong, Bradford, Summers, Lawrence, 2012, Fiscal policy in a depressed economy, paper presented at the Spring 2012 Brookings Panel.
Delors Report [Committee for the Study of Economic and Monetary Union], 1989, Report on Economic and Monetary Union in the European Community, Luxembourg: Office for Official Publications of the EC.
De Nicolò, Gianni, Ivaschenko, Iryna, 2009, Global liquidity, risk premiums and growth opportunities, IMF working paper, No. 09/52.

26
Eichengreen, Barry, 1990, One money for Europe? Lessons from the U.S. currency union, Economic Policy 10: 119-186.
European Economic Advisory Group (EEAG), 2012, Report on the European Economy, CESifo 27 February.
Favero, Carlo, Pagano, Marco, von Thadden, Ernst-Ludwig, 2010, How does liquidity affect government bond yields?, Journal of Financial and Quantitative Analysis, 45: 107-34.
Favero, Carlo, Missale, Alessandro, 2012, Sovereign Spreads, Economic Policy, 70: 231-273 Fratianni, Michele, von Hagen, Jürgen, 1992, The European Monetary System and European
Monetary Union, Westview. Galli, Giampaolo (ed.), 1990, Il sistema finanziario nel Mezzogiorno, Roma: Banca d’Italia. Garber, Peter, 1999, The TARGET mechanism: will it propagate or stifle a stage III crisis?,
Carnegie-Rochester Conference Series on Public Policy, 51:195-220. Geyer, Alois, Kossmeier, Stephan, Pichler, Stefen, 2004, Measuring systemic risk in EMU
government yield spreads, Review of Finance, 8: 171-97. Giavazzi, Francesco, Spaventa, Luigi, 2010, Way the Current Account May Matter in a
Monetary Union – Lessons from the Financial Crisis in the Euro Area, CEPR Discussion paper, No. 8008.
Hausman, J.A., 1978, Specification tests in econometrics, Econometrica 46: 1251-1271. Henderson, D. and K. Rogoff, 1982, “Negative Net Foreign Asset Poitions and Stability in a
World Portfolio Balance Model”, Journal of International Economics, 13, 85-104. Higgins, Matthew, Klitgaard, Thomas, 2010, Savings Imbalances and the Euro Area
Sovereign Debt Crisis, Current Issues in Economics and Finance, 17(5) Hughes Hallett, A., 2007, “Was Argentina’s Financial Collapse in 2001 Inevitable? What Did
we Know and When Did we Know It?” Journal of Financial Transformation, 19, 129-140.
Hughes Hallett, A and J.C. Marinez Oliva, 2012, Reducing Global Imbalances: Can Fixed Exchange Rates and Current Account Limits Help?, Open Economies Review, 23, 163-92.
International Monetary Fund (IMF), 2012a, Fiscal Monitor - Balancing Fiscal Policy Risks, Washington, DC, April.
International Monetary Fund (IMF), 2012b, Fostering Growth in Europe Now, IMF Staff Discussion Note, No. 12/07, Washington, DC, June.
Ingram, J. C., 1973, The case for European monetary integration, Essays in International Finance N. 98, Princeton University.
Kenen, Peter B., 1969, The theory of optimal currency areas: An eclectic view. In Robert A. Mundell and Alexander K. Swoboda (eds.), Monetary problems of the international economy. Chicago: University of Chicago Press.
Keynes, John Maynard, 1943, Proposals for an international clearing union, British government publication, Cmd. 6437, London (April).
Kouri, P. 1983, “Balance of Payments and the Foreign Exchange Market: a Dynamic Partial Equilibrium Model” in J. Bhandari and B. Putnam (eds) “Economic Inter-dependence and Flexible Exchange Rates”, MIT Press, Cambridge, MA.
Lane, Philip and Pels, Barbara, 2012, Current Account Imbalances in Europe, IIIS Discussion Paper, No. 397.
MacDougall Report [Commission of the European Communities], 1977, Report of the Study Group on the Role of Public Finance in European Integration, Vol. I and Vol. II, Brussels.
Maltritz, Dominik, 2012, Determinants of sovereign yield spreads in the Eurozone: A Bayesian approach, Journal of International Money and Finance, 31:657-672.
Masson, P. 1981, “Dynamic Stability of Portfolio Balance Models of the Exchange Rate”, Journal of International Economics, 11, 467-477.
Merler, Silvia, Pisani-Ferry, Jen, 2012, Sudden stops in the Euro area, Brueghel Policy Contribution Issue 2012/06.
Mundell, Robert, 1968, International economics, London, MacMillan Neumann, Manfred J.M., 2012, Too early to sound the alarm, VoxEu, 17 April. Newey, Whitney and West, Kenneth D., 1997, A Simple, Positive Semi-definite,
Heteroskedasticity and Autocorrelation Consistent Covariance Matrix, Econometrica, 55(3): 703-708.
Pagano, Marco, von Thadden, Ernst-Ludwig, 2004, The European bond markets under EMU, Oxford Review of Economic Policy, 20: 531-54.
Perotti, Roberto, 2012, The “Austerity Myth” Gain Without Pain?, in Fiscal Policy After the Financial Crisis, NBER Chapters.
Sachs, Jeffrey, Sala-i-Martin, Xavier, 1989, Optimum fiscal policy and optimum currency areas, working paper, Harvard University.
Sargent, Thomas, 2012, United States then, Europe now, Nobel Prize Lecture. Schmitz, Birgid, von Hagen, Jurgen, 2010, Current account imbalances and financial inte-
gration in the euro area, Journal of International Money and Finance, 30: 1676-95. Sinn, Hans-Werner, 2010, Rescuing Europe, CESifo Forum, August. Sinn, Hans-Werner, Wollmershäuser, T., 2011, Target loans, current account balances and
capital flows: The ECB's rescue facility, CESifo WP N. 3500, 21 June. Sinn, Hans-Werner (ed.), 2012, The European balance of payments crisis, CESifo Forum,
January. Staiger D. and J. Stock, 1997, Instrumental Variables Regression with Weak Instruments,
Econometrica, 65, 557-86. Stock, J. and Yogo, M., 2005, Testing for Weak Instruments in Linear IV Regression, in D.W.K.
Andrews and J.H. Stock (eds.) Identification and Inference for Econometric Models, Cambridge: Cambridge University Press.
Tamagna, Frank M., Qualeatti, Daniele, 1978, Sviluppo economico e intermediazione finanziaria, Milano: Franco Angeli.
von Hagen, Jurgen, Schuknecht, Ludger, Wolswijk, Guido, 2011, Government bond risk premiums in the EU revised: The impact of the financial crisis, European Journal of Political Economy, 27: 36-43.
Waysand, Claire, Ross, Kevin, de Guzman, John, 2010, European financial linkages: a new look at imbalances, IMF WP/10/295, December.
Wihlborg, C., T. Willett and N. Zhang (2010), The Euro debt crisis: It isn’t just fiscal, World Economics, 11, 51-77.
Wolf, M. (2012), Getting out of debt by adding debt, Financial Times, 25 July.
APPENDIX: A Model of Current Account and Portfolio Balances
Consider a home country, say Spain, and foreign country, say Germany (denoted with a “*”), which are linked by the uncovered interest parity condition,
1(1 ) (1 *) / er r E E (1)
where r and r* are the home and foreign rates of interest respectively, E is the real exchange rate (defined as the price of home goods relative to foreign goods), and
1eE is the real exchange rate expected next period. Thus
(2) /( *)E P eP
where e is the nominal exchange rate defined as the domestic currency price of foreign currency (e.g., dollars per euro if the US is the home country). In the specific case of Spain and Germany, e = 1. The home country accumulates net foreign debt according to:
27

28
1 1
e
, (3) 1 (1 ) ( , )F r F D E z
where F is the net debt denominated in the home currency (the amount of domestic currency needed to pay them off)18. D(E,z) is the trade deficit, which is a positive function of the real exchange rate. z is a shift variable describing the impact of a trade shock, a change in preference for home goods, or other changes in spending or the pattern of spending on those goods.
To allow for imperfect substitutability between national assets, let W be the total wealth of home investors, X the total stock of home’s assets, and F net debt position of the home economy (all in real terms). Thus:
W X , where F ≥ 0 implies net debt/liabilities (4) F
Wealth of foreign investors, in home’s currency, is
(5) * / * / .W E X E F
The expected real rate of return from holding home’s assets relative to foreign’s is
1[(1 ) /(1 *)]. /eR r r E E . (6)
Home investors place a share α in home securities and 1-α in foreign assets; and α* and 1-α* are the corresponding shares of foreign investors. We assume that α is increasing in the relative rates of return on home assets, , and in s, defined as the preference for holding domestic assets including any home bias, and safe haven effects. Symmetrically, α* is decreasing in those two factors. If home biases dominate the asset market, then
eR
* 1. Equilibrium in the market for home’s assets, and hence foreign’s assets, is given by the following portfolio balance (PB) equation:
(1 *) * / ( ) (1 *)( * / )X W W E X F X E F . (7)
Unlike in perfect substitutability, the distribution of wealth between home and foreign is independent of shifts in the trade or current account balances (i.e. z). Instead the real exchange rate E, relative rates of return , and asset preferences s, all of which affect α, determine and are determined by the distribution of wealth holdings. Nevertheless, trade and current account balances do lead to changes in F, and hence to changes in the real exchange rate:
eR
2
* 10
(1 *) * /
dE
dF X E
iff * 1. (8)19
The portfolio balance relation is nonlinear in E-F space and is downward sloping as long as home biases persist * 1 . Under these conditions, higher debt at home requires a lower exchange rate (because the demand for home assets has fallen, a larger trade surplus is needed to meet interest payments); and real exchange rates respond less to current-account imbalances than to changes in portfolio preferences and the distribution of wealth.
18 We do not distinguish home’s foreign and domestic held debt since no Eurozone country can use monetary policy to inflate its debt away. In that sense, all debt is “foreign”. 19 Both (8) and (11) are derived assuming that variations in α and α* are small and may be ignored. This is correct up to a first-order approximation. Moreover α+α*>1 is a natural condition given transactions costs and foreign risks, and that α,α*=½ implies indifference between X and X* as assets.
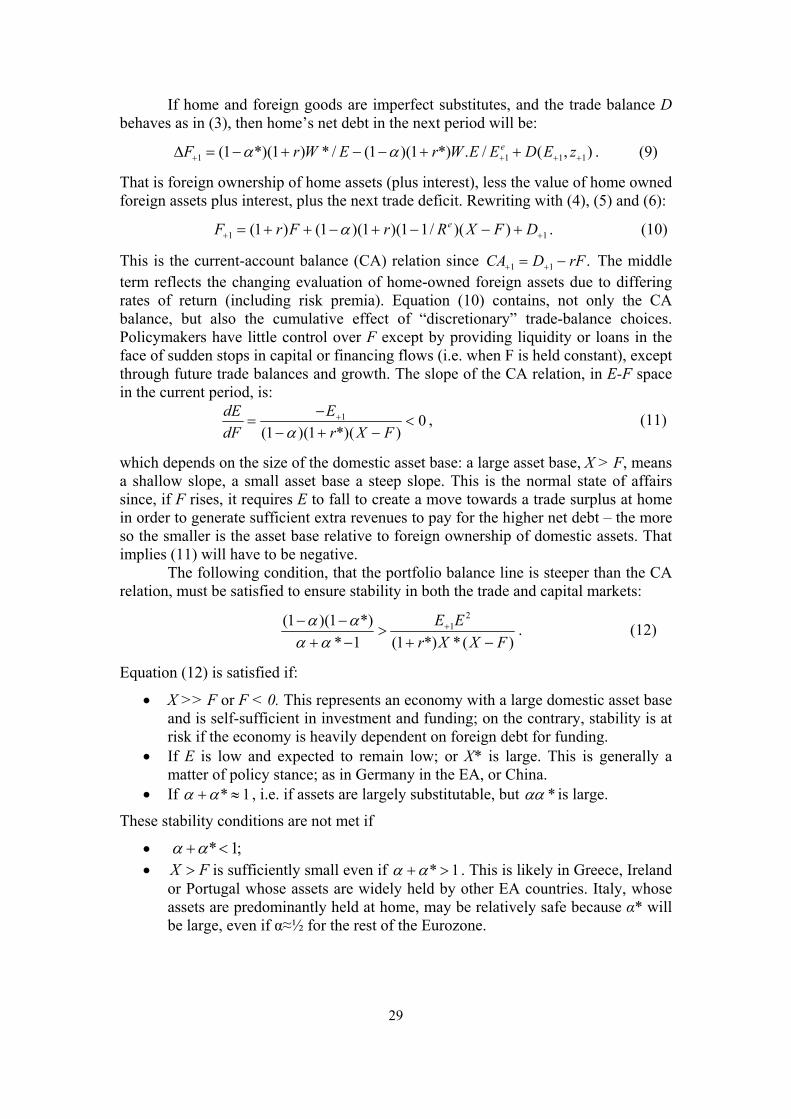
If home and foreign goods are imperfect substitutes, and the trade balance D behaves as in (3), then home’s net debt in the next period will be:
29
1 1 1 1(1 *)(1 ) * / (1 )(1 *) . / ( , )eF r W E r W E E D E z . (9)
That is foreign ownership of home assets (plus interest), less the value of home owned foreign assets plus interest, plus the next trade deficit. Rewriting with (4), (5) and (6):
1 1(1 ) (1 )(1 )(1 1/ )( )eF r F r R X F D . (10)
This is the current-account balance (CA) relation since 1 1 .CA D rF The middle term reflects the changing evaluation of home-owned foreign assets due to differing rates of return (including risk premia). Equation (10) contains, not only the CA balance, but also the cumulative effect of “discretionary” trade-balance choices. Policymakers have little control over F except by providing liquidity or loans in the face of sudden stops in capital or financing flows (i.e. when F is held constant), except through future trade balances and growth. The slope of the CA relation, in E-F space in the current period, is:
1 0(1 )(1 *)( )
dE E
dF r X F
, (11)
which depends on the size of the domestic asset base: a large asset base, X > F, means a shallow slope, a small asset base a steep slope. This is the normal state of affairs since, if F rises, it requires E to fall to create a move towards a trade surplus at home in order to generate sufficient extra revenues to pay for the higher net debt – the more so the smaller is the asset base relative to foreign ownership of domestic assets. That implies (11) will have to be negative.
The following condition, that the portfolio balance line is steeper than the CA relation, must be satisfied to ensure stability in both the trade and capital markets:
2
1(1 )(1 *)
* 1 (1 *) *( )
E E
r X X F
. (12)
Equation (12) is satisfied if:
X >> F or F < 0. This represents an economy with a large domestic asset base and is self-sufficient in investment and funding; on the contrary, stability is at risk if the economy is heavily dependent on foreign debt for funding.
If E is low and expected to remain low; or X* is large. This is generally a matter of policy stance; as in Germany in the EA, or China.
If * 1 , i.e. if assets are largely substitutable, but * is large.
These stability conditions are not met if
* 1; X F is sufficiently small even if * 1 . This is likely in Greece, Ireland
or Portugal whose assets are widely held by other EA countries. Italy, whose assets are predominantly held at home, may be relatively safe because α* will be large, even if α≈½ for the rest of the Eurozone.

Figure 1: A Model of Current Account and Portfolio Balances
Figure 2. Global risk aversion and sovereign risk in the euro area
Notes: The Sovereign Risk Factor is the first principal component of the sovereign yield spreads to 10-years German bunds of EMU countries. The Global Risk aversion is calculated as the first principal components of the volatility index of the OEX market, the effective long-term yields on AAA- and BBB-corporate bonds and on US, and the volatility of the euro-yen 3-months exchange rate. Daily data. See Table 4 for sources.
30

31
Table 1: Government gross debt and cumulative primary surplus in the EA, UK, US, and Japan, 1999-2011 (percent of GDP)
Debt to GDP Change Cumulative primary surpluses to GDP
Country 1999 2007 2011
1999-2007
2011-2007
1999-2011
Austria 67 61 72 -7 12 1.3
Belgium 114 84 95 -30 10 40.0 Finland 46 35 50 -11 15 29.8 France 59 64 87 5 23 -14.9 Germany 61 65 83 4 18 4.5 Greece 103 105 166 3 60 -17.7 Ireland 48 25 109 -23 84 -28.6 Italy 114 104 121 -10 17 23.6 Netherlands 61 45 66 -16 20 7.8 Portugal 50 68 106 19 38 -5.7 Spain 62 36 67 -26 31 -5.0 United Kingdom 44 44 81 0 37 -25.2 United States 61 62 100 1 38 -38.9 Japan 134 188 233 54 45 -75.4 Source: International Monetary Fund, World Economic Outlook Database, September 2011 (forecast values for 2011). Table 2. Current-account balances, unit labor costs and inflation rates, 11 EA countries, 1999-2012 Cumulative (CAB/Y)*100 ULC % change CPI inflation Country 1999-2012 1999-2010 1999-2012 Netherlands 79.6 4.2 30.3Finland 66 -19.9 26.4Germany 52 1.4 21.8Belgium 32.5 8 29.9Austria 28.1 -1.5 26.4France -3.4 2.4 24.5Ireland -19.1 -22.5 32.1Italy -24.4 28.5 30.9Spain -75.5 24.8 38.4Greece -123.2 54.9 43.1Portugal -132.2 11.1 35.1Notes: CAB = current-account balance, Y = GDP, ULC = unit labor cost, CPI = Consumer Price Index, 2012 values are forecast. Source: International Monetary Fund, World Economic Outlook Database, September 2011 for CAB, Y and CPI inflation; OECD, Main Economic Indicators for ULC.

32
Table 3: Variables: description, sources and descriptive statistics
Mean Variable Definition Source 2005q1 - 2011q2
(248 obs.)
Spread Difference in yields to maturity of 10-year government bonds: euro member countries less the German value.
Global Insight
70.142
Global risk aversion
General risk aversion, as the 1st component of the PCA of 4 measures of risk: OEX market volatility index, US corporate AAA and BBB yields and Euro-Yen 3-months exchange rate volatility. Quarterly averages from daily data.
Global Insight and
FRED -0.391
Bid-Ask Bid-ask spread in 10-year government bond market less the German values, per cent. Quarterly averages from daily data.
Bloomberg 1.045
Primary balance
Primary balance over GDP less the German values, per cent. Quarterly data. Since data are not seasonally adjusted, the variable is a (2 1 2) moving average.
Eurostat -1.934
Public debt Gross government debt over GDP less the German values, per cent. Quarterly.
Eurostat 2.806
Growth Quarterly GDP growth less the German values, percentage change with respect to corresponding quarter of previous year.
Eurostat -0.319
Inflation Quarterly inflation less the German values of the monthly HICP index number (2005 = 100)
Eurostat 0.733
Labor productivity
Quarterly real labor productivity per employee less the German values, percentage change on previous period (seasonally adjusted and adjusted by working days).
Eurostat 0.052
Liabilities to German banks
Financial liabilities vis-a-vis German banks over GDP, per cent.
BIS and Eurostat
18.188
Private debt Private debt over GDP less the German value, per cent. Quarterly. No data on the Netherlands.
Eurostat 54.418
Debt service
Quarterly interest payments on government debt over GDP less the German values, per cent.
Eurostat 0.152
Political risk Trade Balance
Political Risk Rating (0-100): one of the ICRG indices, based on several political risk components. Data are taken as the home value less the German value. Low figures mean high risk.
Trade balance over GDP relative to German values, per cent. Quarterly. Since data are not seasonally adjusted, the variable is a (2 1 2) moving average.
PRS Group Eurostat
-2.439
-5.366

33
Table 4: Determinants of 10-year government bond spreads relative to German Bunds in the EA, 2005q1 to 2011q2.
(1) (2) (3) (4) (5) Dep. Var.: Spread PCSE FGLS FE - NW FE - NW FE - NW Global risk aversion 4.087 4.238** 13.357*** 12.930*** 9.692*** [4.380] [2.066] [3.397] [3.702] [2.851] Primary balance -8.261*** -5.537*** 6.583* 7.418** 5.284** [1.320] [1.027] [3.577] [3.275] [2.043] Public debt 1.167** 0.415*** 7.574*** 6.823*** 7.419*** [0.482] [0.156] [1.660] [1.446] [1.245] Growth -7.440** -9.732*** -22.524*** -21.083*** -19.218*** [3.654] [1.928] [6.392] [7.209] [5.111] Bid-Ask 8.345*** 13.942*** 10.402*** 9.974*** 9.395*** [1.600] [1.182] [1.393] [1.247] [1.290] Inflation 15.716*** [4.140] Labor productivity -19.193*** [4.845] Liabilities to German banks -2.973** [1.285] Year 2006 -26.435* -38.277*** [14.594] [12.939] Year 2007 -11.196 -44.477*** [14.311] [16.414] Year 2008 -15.407 -30.918 [19.164] [19.885] Year 2009 30.517** -3.118 [13.945] [15.033] Year 2010 37.123* 2.833 [19.120] [21.137] Year 2011 47.492** -12.920 [24.100] [28.774] Observations 248 248 248 248 248 R-squared 0.701 0.802 0.826 0.868 Number of Countries 10 10 10 10 10 Country dummies NO NO YES YES YES Time dummies NO NO NO YES YES
Time dummies (p-value) 0.060 0.892 Notes: The table reports the regression coefficients of the estimation of model (1) using the following estimator: Panel-Corrected Standard Error (PCSE), Feasible General Least Square (FGLS) corrected for heteroskedasticity across panels, and Fixed Effects with Newey and West (1987) standard errors with autocorrelation up to order 4 (FE - NW). The associated standard errors are reported in brackets. * significant at 10%; ** significant at 5%; *** significant at 1%. A constant is included but not showed. The bottom row of the table reports the: 1) p-value of the F-test for the joint significance of the time dummies.

Table 5: Contributions of explanatory variables to EA sovereign yield spreads
Values Delta Contribution to the spread 2011q2-2010q1 2011q2-2008q3 Variable Beta
2008q3 2010q1 2011q2 2011q2-2010q1
2011q2-2008q3 Face values % Face values %
Spread 39.97 86.82 329.66 242.83 289.68 Global risk aversion 9.69 0.63 -0.63 -1.46 -0.83 -2.09 -8.01 -3.3 -20.22 -7.0 Primary balance 5.28 -3.57 -3.42 -6.47 -3.05 -2.89 -16.08 -6.6 -15.27 -5.3 Public debt 7.42 -0.62 8.01 9.55 1.54 10.17 11.42 4.7 75.49 26.1 Growth -19.22 -0.30 -2.13 -1.37 0.76 -1.07 -14.67 -6.0 20.50 7.1 Bid-Ask 9.40 0.76 0.83 13.36 12.53 12.59 117.75 48.5 118.39 40.9 Inflation 15.72 0.48 1.45 2.35 0.90 1.87 14.09 5.8 29.38 10.1 Labor productivity -19.19 -0.77 2.81 -0.82 -3.63 -0.05 69.66 28.7 0.96 0.3 Liabilities to German banks -2.97 20.89 19.64 16.00 -3.64 -4.89 10.81 4.5 14.52 5.0 Total 184.96 76.17 223.76 77.24 Notes: The table reports the estimated contribution of each explanatory variable to the 10-years government bond spreads to German bunds, based on actual changes of explanatory variables over different sample periods. Calculations are based on the coefficients reported in Table 4 (column 5).
34

35
Table 6: Testing for structural breaks
Baseline model (Table 1, col. 5) pre-2010 post-2010 t-test Global risk aversion 12.340*** -140.763*** 35.01 (2.069) (25.200) 0.00 Primary balance 1.053 -2.299 1.77 (1.785) (2.009) 0.19 Public debt 3.164*** 7.871*** 8.44 (0.674) (1.685) 0.00 Growth -4.821* -25.825*** 23.07 (2.655) (4.173) 0.00 Bid-Ask 6.017** 2.644** 1.23 (2.640) (1.195) 0.27 Inflation 7.285** -10.429 5.84 (2.982) (7.019) 0.02 Labor productivity -3.465 -27.957*** 9.98 (2.695) (6.997) 0.00 Liabilities to German banks 0.186 -11.694*** 60.52 (0.471) (1.534) 0.00 Chow test 27.02 (p-value) 0.00 Observations 248
R-squared 0.978 Notes: The table reports the regression coefficients of Fixed Effects estimation of model (1). Each regressor is interacted with a pre-2010 and a post-2010 dummies, in order to have separate coefficients for the pre- and the post-2010 periods, reported in columns 1 and 2. The associated Newey and West standard errors with autocorrelation up to order 4 are reported in brackets. * significant at 10%; ** significant at 5%; *** significant at 1%. The base model refers to the specification reported in column 5 of Table 4. The t-tests and the associated p-values for equality of coefficients across the two sub-periods are reported in columns 3. The Chow tests for the presence of a structural break between pre- and post-2010 are reported at the bottom of the Table. A constant, the Post 2010 dummy, yearly dummies, and nine country dummies (each one interacted with the pre-2010 and with the post-2010 dummies) are included in both specifications but not showed.

36
Table 7: Testing for robustness
(1) (2) (3) (4) (5) Dep. Var.: Spread 2SLS FE - NW FE - NW FE - NW FE - NW Global risk aversion 10.257*** 10.555*** 8.917*** 9.480*** 8.911*** [2.506] [3.415] [3.322] [3.020] [2.589] Primary balance 5.118*** 6.703* 6.419* 6.830*** 5.875*** [1.738] [3.414] [3.635] [2.151] [2.041] Public debt 7.246*** 8.020*** 7.803*** 6.403*** 6.344*** [0.946] [1.566] [1.534] [1.197] [1.163] Growth -19.445*** -20.877*** -20.544*** -16.476*** -18.298*** [3.921] [6.079] [6.215] [5.119] [4.995] Bid-Ask 10.044*** 26.687*** 26.468*** 9.378*** 9.329*** [1.288] [9.069] [9.047] [1.270] [1.270] Inflation 15.933*** 15.228** 15.056*** 11.288*** 15.971*** [3.693] [6.823] [5.622] [4.180] [4.005] Labor productivity -19.998*** -22.060*** -20.834*** -20.422*** -19.976*** [4.398] [5.605] [5.403] [4.604] [5.012] Liabilities to German banks -2.613** -2.570* -2.781** -2.826** -2.696* [1.019] [1.346] [1.324] [1.343] [1.420] Private debt -0.186 [0.554] Debt service 1.226 [1.550] Political risk -9.762*** [1.896] Trade Balance 8.158*** [3.062] Observations 244 203 229 248 248 R-squared 0.880 0.803 0.798 0.857 0.874 Year dummies YES YES YES YES YES Number of Countries 10 9 10 10 10 OIR (Hansen J-statistic) 0.374 Under-identification test 0.009 Weak-identification (F-test) 35.181 Notes: The table reports the regression coefficients of the estimation of model (1) using the following estimator: Two Stage Least Squares (2SLS) with robust standard errors and Fixed Effects with Newey and West (1987) standard errors with autocorrelation up to order 4 (FE - NW). The associated standard errors are reported in brackets. * significant at 10%; ** significant at 5%; *** significant at 1%. A constant and yearly dummies are included but not showed. In the 2SLS estimates, the bid-ask spread of country i at time t is instrumented using its own lagged value and the average of the other 10 countries at time t. The bottom rows of the table reports the: 1) the p-value of the Sargan-Hansen test of over-identifying restrictions (OIR) testing the null hypothesis that the instruments are uncorrelated with the error term; 2) the p-value of the Kleibergen–Paap rk LM-statistic testing the null hypothesis that the excluded instruments are not correlated with the endogenous regressor; and 3) the Kleibergen–Paap rk Wald F-statistic testing for weak identification.