extra class license class antennas and …long/ece145a/extraclasslicense110111.pdfextra class...
TRANSCRIPT

Extra Class License Class Antennas and Transmission lines
November 1, 2011Steve Long AC6T
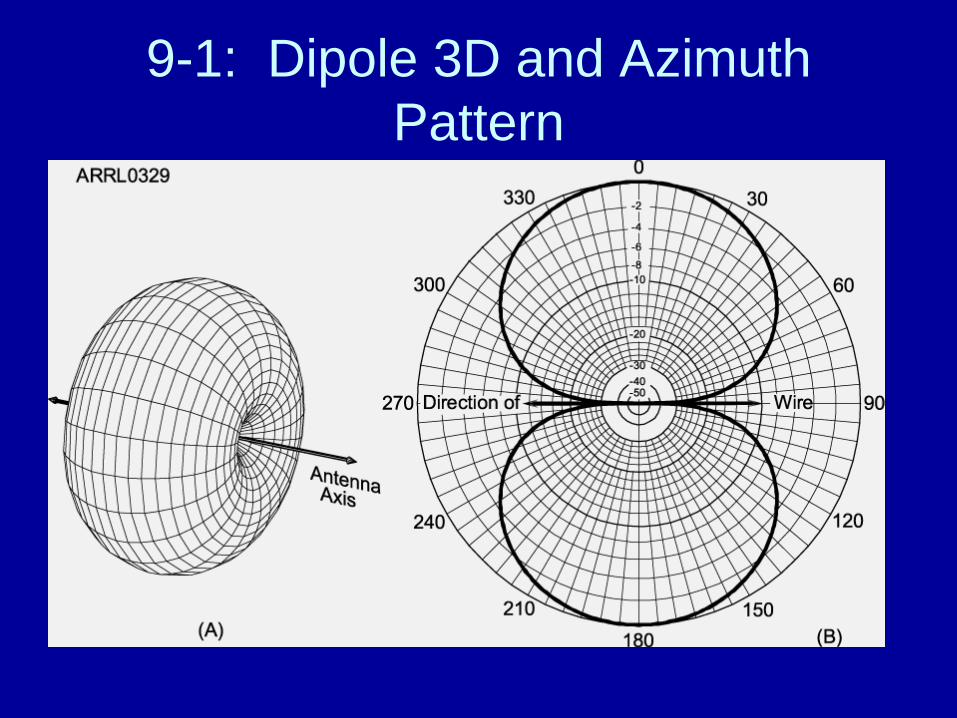
9-1: Dipole 3D and Azimuth Pattern
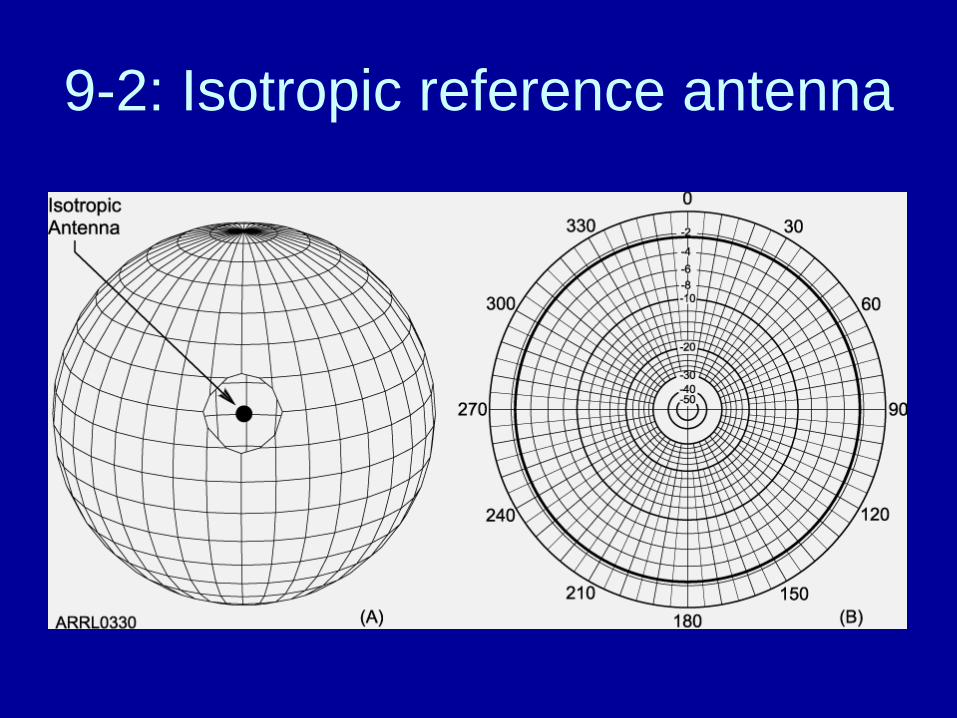
9-2: Isotropic reference antenna
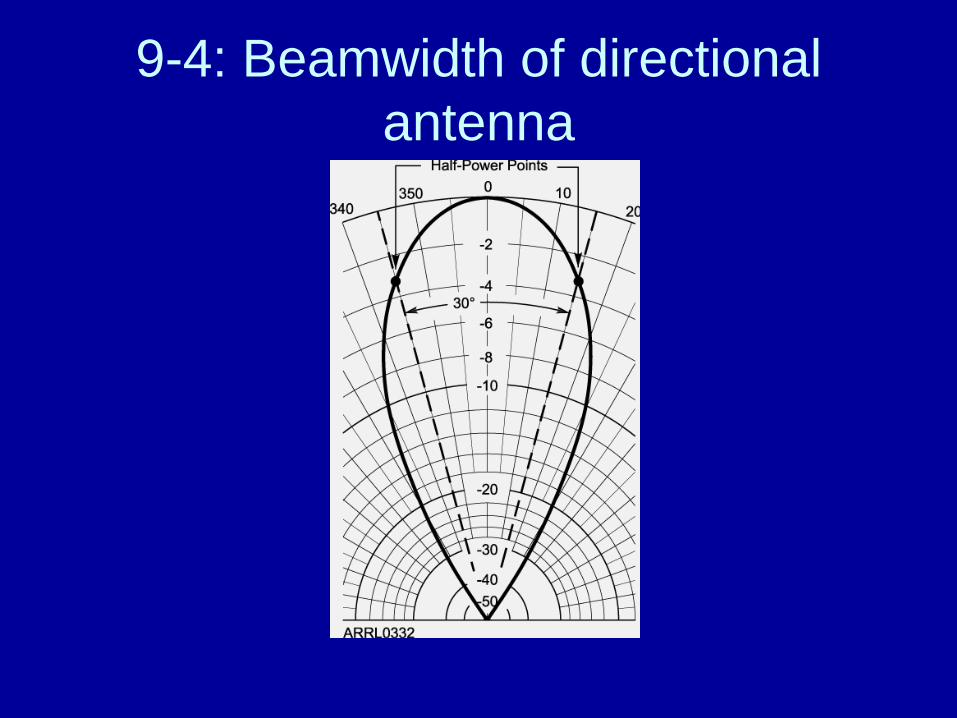
9-4: Beamwidth of directional antenna
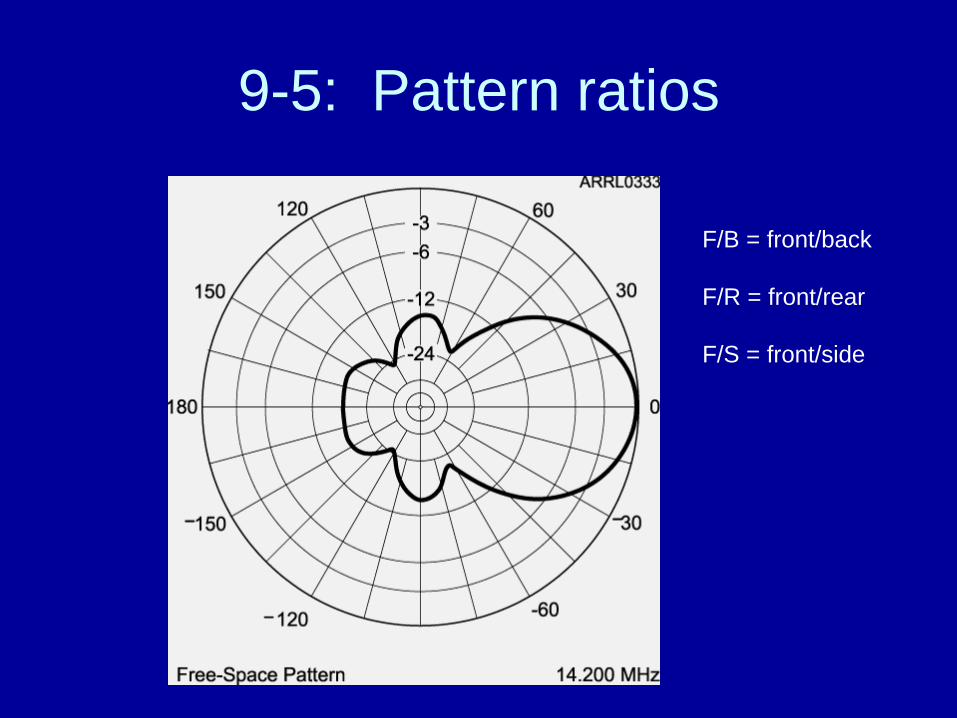
9-5: Pattern ratios
F/B = front/back
F/R = front/rear
F/S = front/side

9-6: Elevation pattern of typical Yagi antenna

Shortened antennas: low RR ; series XC

9-10: Traps for multiband operation


9-16: Phased vertical array
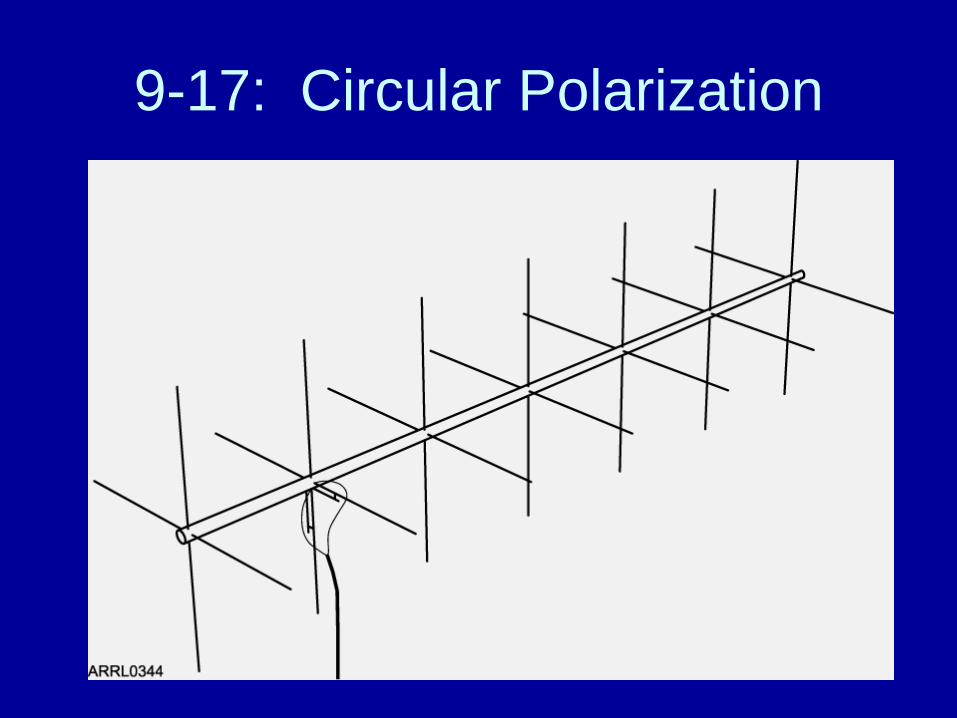
9-17: Circular Polarization
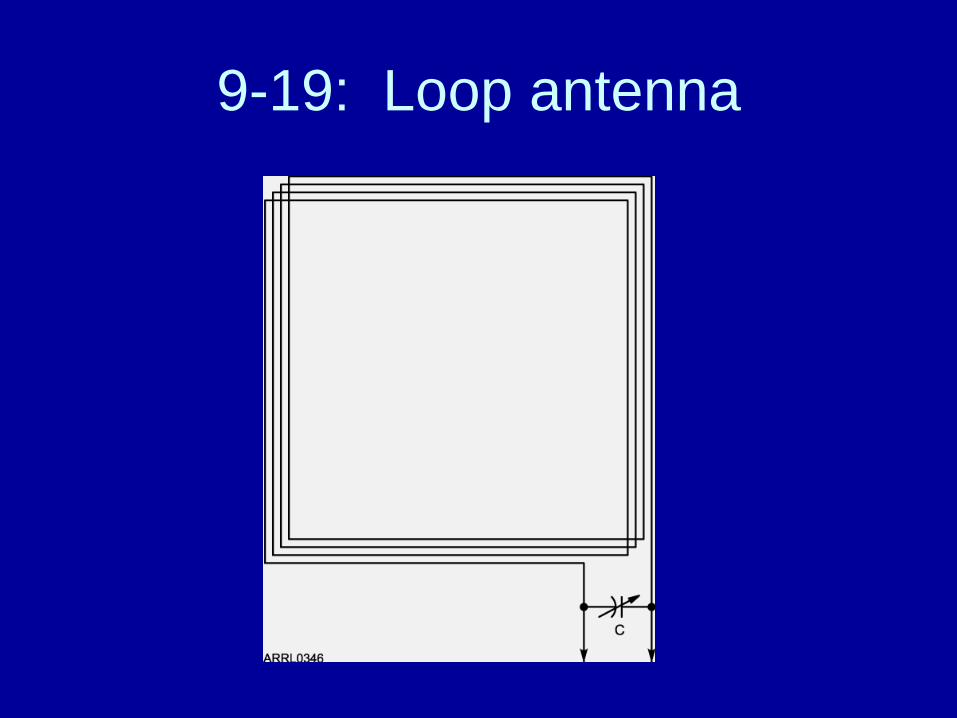
9-19: Loop antenna
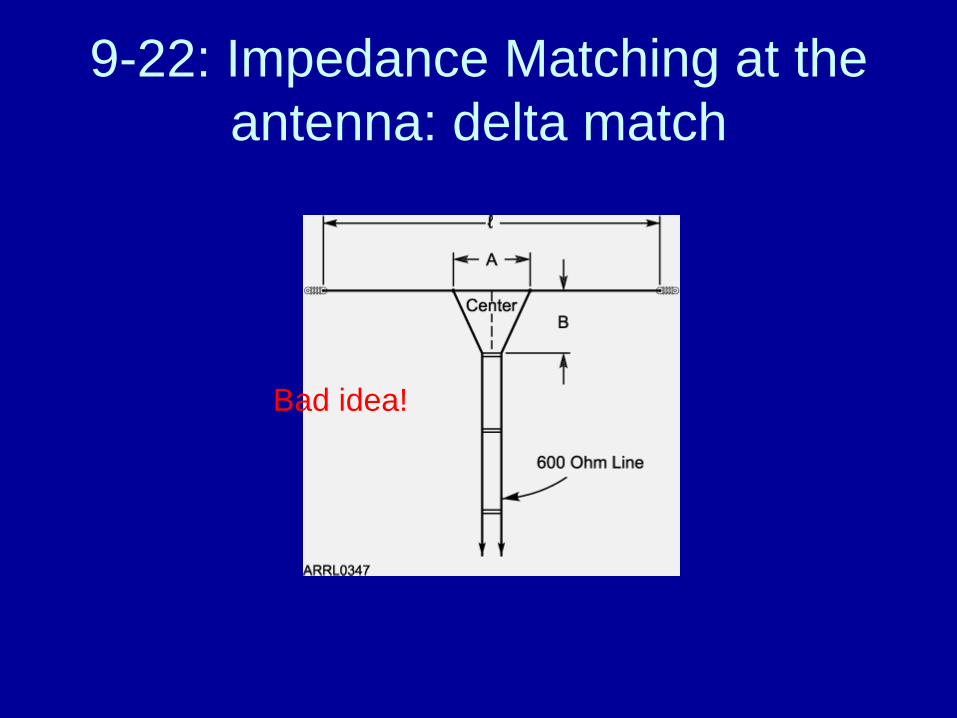
9-22: Impedance Matching at the antenna: delta match
Bad idea!

9-23: Impedance Matching at the antenna: Gamma Match
Widely used. Works well. Can be adjusted from the tower.

9-24: Impedance Matching at the antenna: Hairpin Match
Better solutionFully balanced
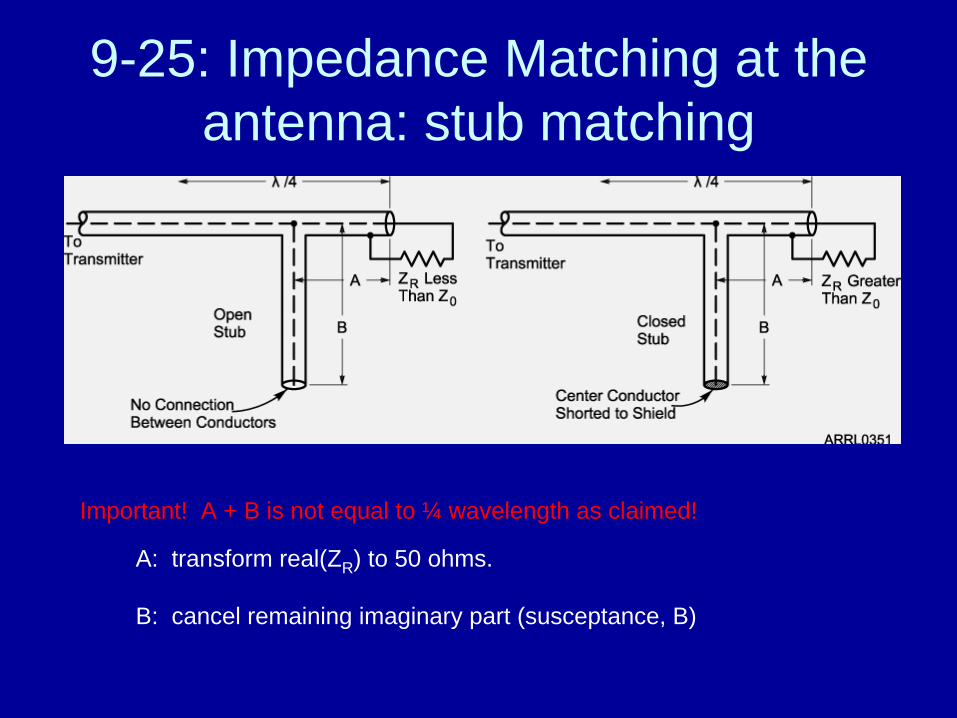
9-25: Impedance Matching at the antenna: stub matching
Important! A + B is not equal to ¼ wavelength as claimed!
A: transform real(ZR ) to 50 ohms.
B: cancel remaining imaginary part (susceptance, B)

Quarter-wave transformer
Z1 Zo
Z2λ/4
210 ZZZ =
TYPICALLY 50Ω
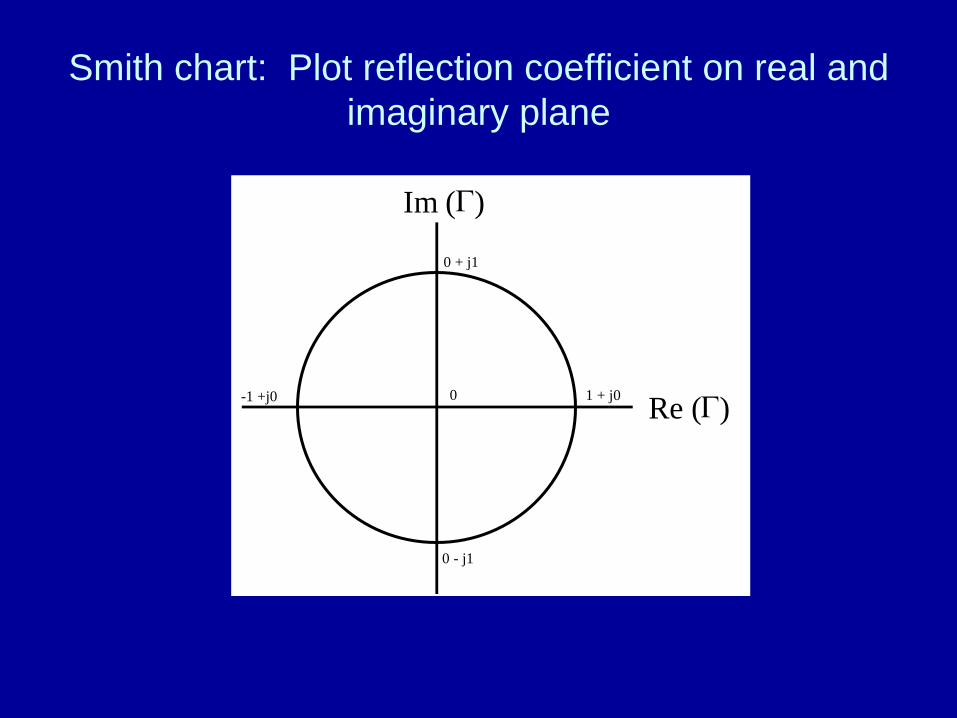
Smith chart: Plot reflection coefficient on real and imaginary plane
1 + j0
0 + j1
-1 +j0
0 - j1
Im (Γ)
0 Re (Γ)

Smith Chart: map impedance onto reflection coefficient
Constant reactance circlecenters on vertical axis
Constant resistancecircles on horiz. axis
z = r + jx
Plot is normalized toZo = 1
INDUCTIVEREACTANCE
CAPACITIVEREACTANCE
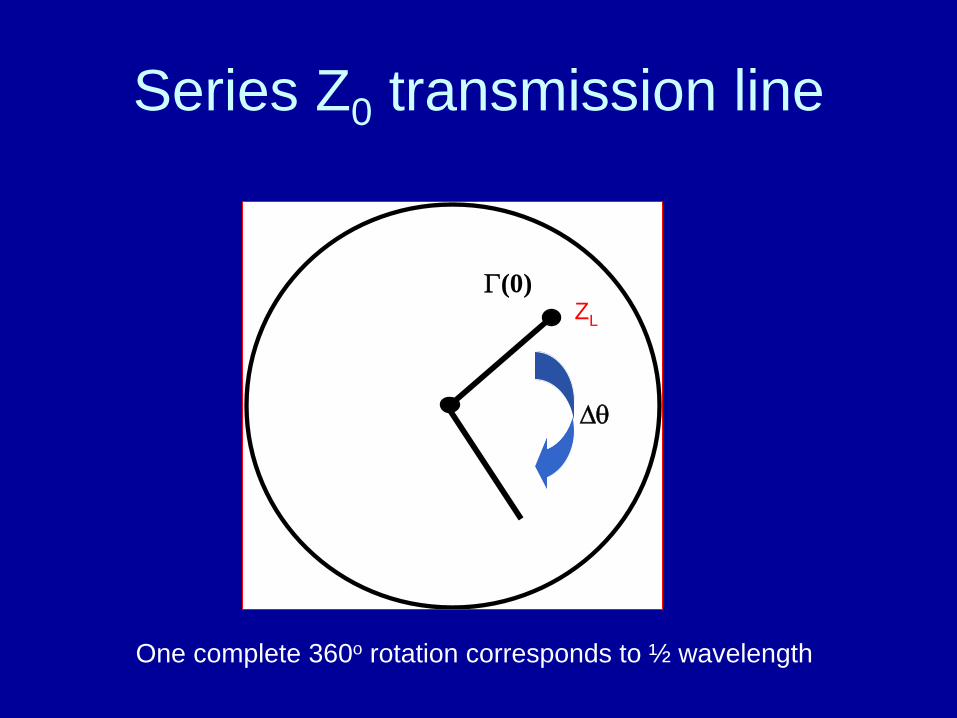
Series Z0 transmission line
Γ(0)
Δθ
ZL
One complete 360o rotation corresponds to ½ wavelength
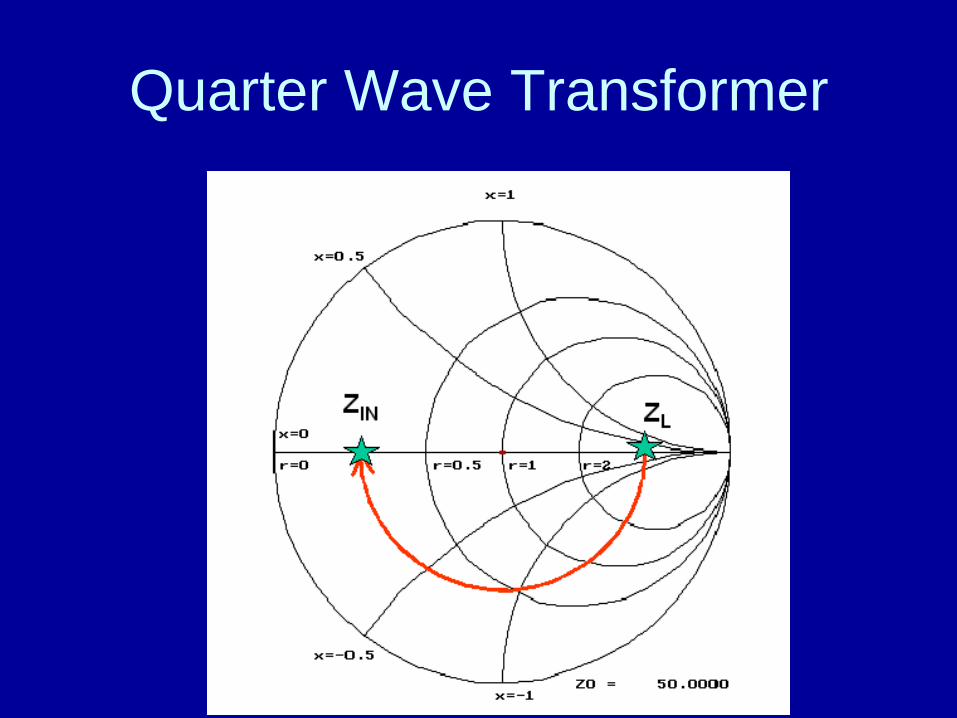
Quarter Wave Transformer

Open circuited t-line
ZoZIN
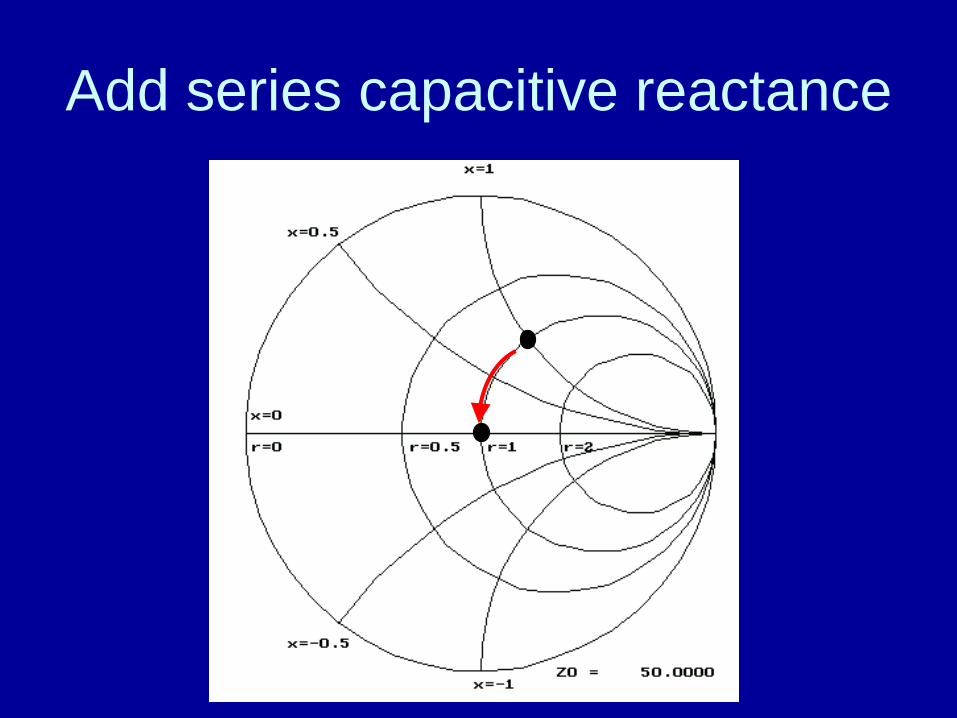
Add series capacitive reactance

Add series inductive reactance
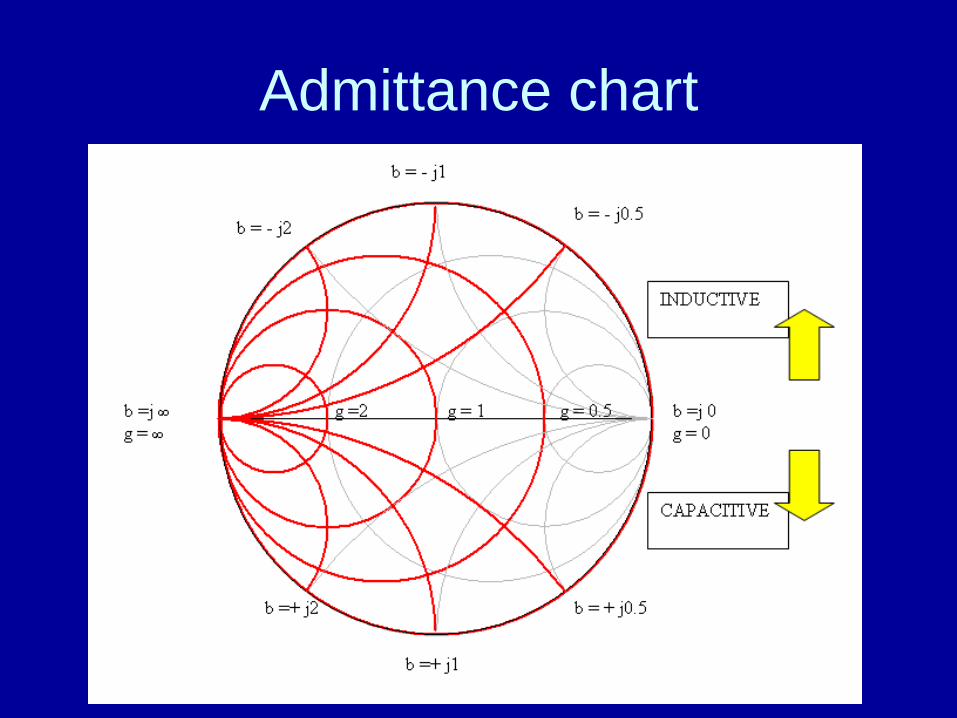
Admittance chart

Example: series – shunt stub match
ZL
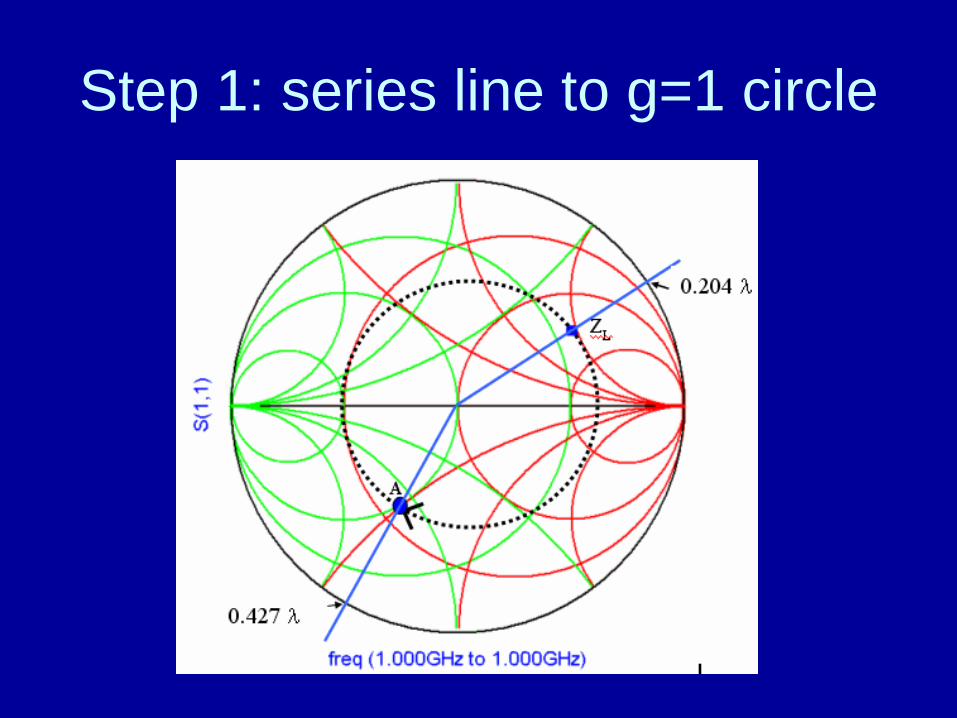
Step 1: series line to g=1 circle

Shorted and open stubs λ/8
Z = jZo
Z = -jZo

Step 2: shunt L with shorted stub of length 0.092λ

References
• Transmission lines and Smith Chart– www.ece.ucsb.edu/~long/ece145a/index.htm
• Class notes set #2 and 3
• Impedance matching networks• Class notes set #5
• Smith Charts – pdf files are on this website– Color printer needed for ZY chart

RADIALLY SCALED PARAMETERS
TOWARD LOAD —> <— TOWARD GENERATOR1.11.21.41.61.822.5345102040100
SWR 1∞
12345681015203040dBS
1∞
1234571015 ATTEN. [dB]
1.1 1.2 1.3 1.4 1.6 1.8 2 3 4 5 10 20 S.W. L
OSS C
OEFF
1 ∞0 1 2 3 4 5 6 7 8 9 10 12 14 20 30
RTN. LOSS [dB] ∞
0.010.050.10.20.30.40.50.60.70.80.91
RFL. COEFF, P0
0.1 0.2 0.4 0.6 0.8 1 1.5 2 3 4 5 6 10 15 RFL. LOSS
[dB]
∞0
1.1 1.2 1.3 1.4 1.5 1.6 1.7 1.8 1.9 2 2.5 3 4 5 10 S.W. P
EAK (CONST
. P)
0 ∞0.10.20.30.40.50.60.70.80.91
RFL. COEFF, E or I 0 0.99 0.95 0.9 0.8 0.7 0.6 0.5 0.4 0.3 0.2 0.1 0 TRANSM. C
OEFF, P
1
CENTER1 1.1 1.2 1.3 1.4 1.5 1.6 1.7 1.8 1.9 2 TRANSM
. COEFF, E
or I
0 0.1 0.2 0.3 0.4 0.5 0.6 0.7 0.8 0.9
ORIGIN
0.1
0.1
0.2
0.2
0.2
0.3
0.3
0.4
0.4
0.4
0.50.5
0.5
0.60.6
0.6
0.70.7
0.7
0.80.8
0.80.9
0.9
0.9
1.01.0
1.0
1.21.2
1.2
1.41.4
1.4
1.61.6
1.6
1.81.8
1.8
2.02.0
2.0
3.0
3.0
3.0
4.0
4.0
4.0
5.0
5.0
5.0
10
10
10
20
20
20
50
50
50
0.2
0.2
0.2
0.2
0.4
0.4
0.4
0.4
0.6
0.6
0.6
0.6
0.8
0.8
0.8
0.8
1.0
1.0
1.01.0
0.1
0.1
0.1
0.2
0.2
0.2
0.3
0.3
0.3
0.4
0.4
0.4
0.50.5
0.5
0.6
0.6
0.6
0.7
0.7
0.7
0.8
0.8
0.8
0.9
0.9
0.9
1.0
1.0
1.0
1.2
1.2
1.2
1.4
1.4
1.4
1.6
1.6
1.6
1.8
1.8
1.8
2.02.0
2.0
3.0
3.0
3.0
4.0
4.0
4.0
5.0
5.0
5.0
10
10
20
20
20
50
50
50
0.2
0.2
0.2
0.2
0.4
0.4
0.4
0.4
0.6
0.6
0.6
0.6
0.8
0.8
0.8
0.8
1.0
1.0
1.01.0
20-20
30-30
40-40
50
-50
60
-60
70
-70
80
-80
90
-90
100
-100
110
-110
120
-120
130
-130
140
-140
150
-150
160
-160
170
-170
180
±
90-9
085
-85
80-8
0
75-7
5
70-7
0
65-6
5
60-6
0
55-5
5
50-5
0
45
-45
40
-40
35
-35
30
-30
25
-25
20
-20
15
-15
10
-10
0.04
0.04
0.05
0.05
0.06
0.06
0.07
0.07
0.08
0.08
0.09
0.09
0.1
0.1
0.11
0.11
0.12
0.12
0.13
0.13
0.14
0.14
0.15
0.15
0.16
0.16
0.17
0.17
0.18
0.18
0.190.19
0.20.2
0.21
0.210.22
0.220.23
0.230.24
0.24
0.25
0.25
0.26
0.26
0.27
0.27
0.28
0.28
0.29
0.29
0.3
0.3
0.31
0.31
0.32
0.32
0.33
0.33
0.34
0.34
0.35
0.35
0.36
0.36
0.37
0.37
0.38
0.38
0.39
0.39
0.4
0.4
0.41
0.41
0.42
0.42
0.43
0.43
0.44
0.44
0.45
0.45
0.46
0.46
0.47
0.47
0.48
0.48
0.49
0.49
00
AN
GLE
OF
TRA
NSM
ISSO
N C
OE
FFICIEN
T IN D
EGR
EES
AN
GLE
OF R
EFLE
CT
ION
CO
EFF
CIE
NT
IN D
EGR
EES
—>
WA
VEL
ENG
THS
TOW
AR
D G
ENER
ATO
R—
><—
WA
VEL
ENG
THS
TOW
AR
DLO
AD
<—
IND
UC
TIV
E R
EAC
TAN
CE
COM
PON
ENT (+
jX/Zo), O
RIN
DUCTIVE SUSCEPTANCE (- jB/Yo)
EACTANCE COMPONENT (-jX
/Zo),O
RCAP
ACIT
IVE
SUSC
EPTA
NC
E(+
jB/Y
o)
RESISTANCE COMPONENT (R/Zo), OR CONDUCTANCE COMPONENT (G/Yo)
SMITH CHART FORM ZY-01-N
NAME TITLE
COLOR BY J. COLVIN, UNIVERSITY OF FLORIDA, 1997
DWG. NO.
DATE
NORMALIZED IMPEDANCE AND ADMITTANCE COORDINATES
RVE I TI CAPAC