extracted haralick’s texture features and … · 2011-10-22 · extracted haralick’s texture...
TRANSCRIPT

Extracted Haralick’s Texture Features and Morphological Parameters from Segmented Multispectrale Texture Bio-Images for Classification
of Colon Cancer Cells
AHMAD.CHADDAD*, CAMEL.TANOUGAST*, ABBAS.DANDACHE* and AHMED.BOURIDANE**
*Laboratory of Interface Sensors and Microelectronics Paul Verlaine University of Metz
7 Rue Marconi, Technopôle 57070 Metz FRANCE
**School of Computing, Engineering and Information Sciences, Northumbria University
UK
[email protected], [email protected]
Abstract: The automatic recognition and classification of biomedical objects can enhance work efficiency while identifying new inter-relationships among biological features. In this paper two features types, Haralick’s features based GLCM are applied for classification of cancer cell of textured images and morphological parameters based of cells detection. The objective in our work is the selection of the most discriminating parameters for cancer cells classification. In this work, a new approach aiming to detect and classify colon cancer cells is presented. Our detection approach was derived from the "Snake" method but using a progressive division of the dimensions of the image to achieve faster segmentation. Classification of three cell types was based on nine morphological parameters and five Haralick’s features on probabilistic neural network. Three morphological parameters and three Haralick’s features were used to assess the efficiency classifications models, including Benign Hyperplasia (BH), Intraepithelial Neoplasia (IN) that is a precursor state for cancer, and Carcinoma (Ca) that corresponds to abnormal tissue proliferation (cancer). Results showed that segmentation of microscopic images using this technique was of higher efficiency than the conventional Snake method. The time consumed during segmentation was decreased to more than 50%. The efficiency of this method resides in its ability to segment Ca type cells that was difficult through other segmentation procedures. Among the nine parameters morphology and five Haralick’s features used to classify cells, only three morphologic parameters (Area, Xor convex and Solidity) and three Haralick’s features (Correlation, Entropy and Contrast) were found to be effective to discriminate between the three types of cells. In addition, classification of unknown cells was possible using the morphology method. However, some IN cells were wrongly classified as BH cells due to their shapes that were similar to those of BH cells. On the other side, the classification based on three parameters (Correlation, Entropy and Contrast) were found to be effective to discriminate between the three types of cells without wrong. The results obtained using several images show the efficacy of our proposed method. Key-Words: - GLCM, Haralick’s features, Morphologic parameters, Segmentation, Snake, Classification.
1 Introduction Colon cancer as any cancer is characterized by an abnormal uncontrolled cell. Damaged cells divide and proliferate to form a tumor that may be benign (not cancerous) or malignant tumor (cancer). The majority methods used to make the cancerous classification of the cells based on the morphological image processing, i.e. the shapes as of these cells inside images. Research in medical images is accelerated when the manual search of
abnormalities in medical images is replaced by an automatic search. Many macroscopic and microscopic techniques may be used to detect colon cancer. Medical imaging techniques such as MRI (Magnetic Resonance Imaging), CT (Computed Tomography) scan, PET (Positron Emission Tomography) and SPECT (Single Photon Emission Computed Tomography) are considered as precious tools to detect, localize and estimate the volume of certain cancers. Nevertheless, these tools are not
WSEAS TRANSACTIONS on BIOLOGY and BIOMEDICINE Ahmad Chaddad, Camel Tanougast, Abbas Dandache, Ahmed Bouridane
ISSN: 1109-9518 39 Issue 2, Volume 8, April 2011

able to detect early cancer at the cellular level. On the other hand, microscopic observations of biopsies of the colon allow detecting irregular cells or non-natural contrasts. Therefore, many recent works have been concerned by developing automatic reading procedures of such biopsies [1, 2]. Automatic reading allows a faster and precise reading of microscopic biopsies and segmenting cells to classify them as cancerous or non cancerous cells. Effectiveness of automatic search is analyzed and interpreted a large number of medical images in short time. Our work is the segmentation of colon cancer cells within multispectral image [3, 4]. The multispectral image is an image repeated in many wavelengths. Different segmentation methods are available, including intensity leveling, texture based segmentation, region based segmentation, gradient contour based segmentation and active contour. The last method is the most powerful when irregular shapes such as cancerous cells are present within a microscopic multispectral image [5]. Indeed, Active Contour or "Snake" is a dynamic contour that reforms itself in an iterative adaptive way to localize and cover the real cell contour. It is based on color intensity and can be applied on sequences of objects in the image. Active contours or snakes have been widely used in image processing and computer vision, like a smart technique for image segmentation, efficiency active contour in the sequences of objects in images based on color or color intensity. Although this method is flexible and can be used as a non gradient method that is important in the case of high resolution and heterogeneous images, its main disadvantages are time consumption and detection of wrong contours during the first iterations [5, 6]. Classification of cancer cell images based on two applications, the Haralick’s texture features and morphology features, are extracted from multispectral images. These texture features based on Grey Level Co-occurrence Matrix (GLCM) is one of the most widely used techniques for texture analysis. It is an estimate of image properties related to second order statistics introduced by Haralick [7]. These Haralick's coefficients are usually used in various fields as telediction [8], quality control [9] or biomedical analysis [10, 11]. Morphology features methods used to make the cancerous classification of the cells based on the morphological image processing, i.e. the shapes as of these cells inside images. Cellular classification approaches include supervised and non-supervised methods [7, 12]. Supervised classification can be
distribution free, that does not require knowledge of any priori probability distribution functions, or statistical techniques based on probability distribution models, that may be parametric (such as Gaussian distributions) or non parametric. Nevertheless, probability distribution models cannot be considered as real models and may lead to wrong classifications. Non-supervised classification techniques attempt to identify clusters or natural grouping in the feature space. The main disadvantage here is that two close distributions may be identified as one class [13]. The proposed classification is based on the values of the Haralick’s coefficients used as a primary component to distinguish between different grades of malignancy of the cancerous cells in microscopic bio-images. We demonstrate that the Haralick’s features over the different wavelength of the microscopic images allows and their variations can lead to discrimination between the cells of cancer types. In this paper was to develop a new approach in segmentation was derived from the Snake method but using a progressive division of the dimensions of the image to achieve faster segmentation. The aim of this work is both to increase the efficiency and reduce the runtime of classification from Haralick multi-spectral texture features and morphological parameters. Three types of cells were used to assess the efficiency of our segmentation and classification models, including Benign Hyperplasia (BH - benign condition), Intraepithelial Neoplasia (IN) that is a precursor state for cancer and Carcinoma (Ca) that corresponds to abnormal tissue proliferation (cancer). This paper is organized as follows. Section 2 presents an overview of the multi-spectral images analysis and the Co-occurrence Matrix for textural classification applied in the biomedical field. Section 3 presents an overview of the basic Active Contour model and detection of contour with the new approach. This section also summarizes briefly the main steps of this approach. Section 4 summarizes briefly the five main Haralick’s texture features computed and based on the Grey level Co-occurrence Matrix for the image texture classification. This section also summarizes briefly the nine main features computed and based on the cells morphology. Section 5 details the application of the proposed method and shows the results allowing the images classification of grades of malignancy of the cancer cells. Finally, a conclusion and future work are given in section 6.
WSEAS TRANSACTIONS on BIOLOGY and BIOMEDICINE Ahmad Chaddad, Camel Tanougast, Abbas Dandache, Ahmed Bouridane
ISSN: 1109-9518 40 Issue 2, Volume 8, April 2011

2 Texture Analysis of MultiImages & Grey Level Co-Occurrence Matrix An analysis of the textures and structures present in the multi-spectral bio-images representing of samples, allows making a diagnosis of different grades of cancers malignancy correspond to different structural patterns as well as apparent textures. Multispectral image is an image repeated in many wavelengths. Fig. 1 gives an example of an obtained multi-spectral image decomposed of different wavelength sub-bands. We propose to apply the Haralick’s texture features on multispectral biopsy images with the wavelengthused between 500 and 650 nm and divided into 16 equal intervals. Thus, from each original image one can obtain another sixteen images propsixteen frequencies or wavelength multithe image used. The multi-spectral images are then analyzed at low, medium or high wavelength.
a) Different sub-bands of multispectral image of type
b) Different sub-bands of multispectral image of type
c) Different sub-bands of multispectral image of type
500 nm
Fig. 1: Images showing different wavelength submultispectral image, a) BH, b) IN, c)
The classification of different malignancy grades of cancer depends of the Haralick’sextracted from each sub-band frequency of the considered bio-image. For example, in the case of the bio-image of the colon, usually three major groups should be discriminated against based on variations of textures present in the multiimages. Fig. 2 gives samples of three image classes of cancer cells which are the Benign Hyperplasia
Texture Analysis of Multi-Spectral Occurrence
An analysis of the textures and structures present in images representing of
samples, allows making a diagnosis of different grades of cancers malignancy correspond to different structural patterns as well as apparent textures. Multispectral image is an image repeated
gives an example of an spectral image decomposed of
We propose to texture features on
multispectral biopsy images with the wavelength used between 500 and 650 nm and divided into 16
Thus, from each original image one can obtain another sixteen images proportional to sixteen frequencies or wavelength multi-spectral of
spectral images are then analyzed at low, medium or high wavelength.
bands of multispectral image of type BH.
bands of multispectral image of type IN.
bands of multispectral image of type Ca.
650nm
wavelength sub-bands of a , c) Ca.
The classification of different malignancy grades of Haralick’s coefficient
band frequency of the image. For example, in the case of
image of the colon, usually three major groups should be discriminated against based on variations of textures present in the multi-spectral
2 gives samples of three image classes Benign Hyperplasia -
BH, the Intraepithelial Neoplasia Carcinoma - Ca.
(A) (B)
Fig. 2: Images showing representative of the three classes of malignancy grades of the colon. (
2.1. Grey Level Co-Occurrence MatrixGray-level Co-occurrencematrix of Ng size where Ngof the image. GLCM represents the probabilities ��,� ��, � of transition from a pixel of an i grey intensity to a pixel of a j grey intensity separated by a translation vector defined by the d distance. The current values used are: 4} and r = {0; 45°; 90°; 135°}. is popular in texture description and is based on the repeated occurrence of some grey level configuration in the texture which varies rapidly with distance in fine texturetextures.
3 Active Contour Model 3.1 Segmentation Snake method uses an Active dynamic curve that tries, in an iterative process, to move toward and detect the contour of an object observed in a certain image. The model developed is able to detect the contour of an image witcalculating its gradient [5]. Let us consider Fig. presenting an object having different intensity than that of the background [14]. The curve in this image consists of a set of points connected to each other. An energy function is generally associacurve such a way:
Fig. 3: Image representing a single object with uniform intensity U
internal, bounded by the contour C0 from its background with uniform intensity U
Intraepithelial Neoplasia - IN and the
(B) (C)
2: Images showing representative of the three classes of cancer malignancy grades of the colon. (A) BH, (B) IN, (C) Ca.
Occurrence Matrix occurrence Matrix [4] is a square
Ng represents the grey level represents the probabilities
of transition from a pixel of an i grey grey intensity separated by
a translation vector defined by the r direction and a distance. The current values used are: d = {1, 2, 3,
= {0; 45°; 90°; 135°}. GLCM computation is popular in texture description and is based on the repeated occurrence of some grey level configuration in the texture which varies rapidly with distance in fine textures and slowly in large
Model
ctive Contour which is a dynamic curve that tries, in an iterative process, to move toward and detect the contour of an object observed in a certain image. The model developed is able to detect the contour of an image without
gradient [5]. Let us consider Fig. 3 presenting an object having different intensity than
]. The curve in this image consists of a set of points connected to each other. An energy function is generally associated to this
3: Image representing a single object with uniform intensity U internal, bounded by the contour C0 from its background with uniform
intensity U external.
WSEAS TRANSACTIONS on BIOLOGY and BIOMEDICINE Ahmad Chaddad, Camel Tanougast, Abbas Dandache, Ahmed Bouridane
ISSN: 1109-9518 41 Issue 2, Volume 8, April 2011

F�� �� � F������ � � F������ �
where F internal is an energy that depends on the physical properties of the contour and another energy that depends on the properties of the image [15]. The corresponding algorithm tries to find a combination between different image points to minimize the energy function F snake and detect the contour. Let C1 and C2 intensities in the regions respectively inside and outside the real contour C0. The energy as follow:
F � F��C�F��C � ∑ |U����������
c�|� � ∑ |U �x, y # c�|�����������
According to F, four different cases of contour detection may arise as shown in Figcases consider all possible outcomes of the dashed contour with the real one as follows:
(a)
(c)
Fig. 4: Four different cases of contour detection
�a F��C % 0 et F��C ) 0 �b F��C ) 0 et F��C % 0 �c F��C % 0 et F��C % 0 �d F��C ) 0 et F��C ) 0
We can also add to F a regularization term that leads to the final expression of F:
F � μ. length�C � ∑ |U ����������
c�|� � ∑ |U �x, y # c�|�����������
where µ ≥ 0 is a fixed parameter. Consequently, the detection of contours is reduced to be solution of
inf 4
56,57,�
�c�, c�, C
������ � (1)
internal is an energy that depends on the physical properties of the contour and F external is another energy that depends on the properties of the
]. The corresponding algorithm tries to find a combination between different image points
snake and then to be the average
intensities in the regions respectively inside and . The energy F is defined
U �x, y #
(2)
, four different cases of contour ig. 4. These four
cases consider all possible outcomes of the dashed
(b)
(d)
4: Four different cases of contour detection.
(3) (4) (5) (6)
a regularization term that leads
�x, y # (7)
0 is a fixed parameter. Consequently, the detection of contours is reduced to be solution of:
(8)
We derived from the Snakefaster segmentation approach of microscopic images, particularly gray scale images possessing both high dimension and high resolution. Since the active contour depends deeply on the initial contour, the proposed technique ensures a fast convergence onto real contour. It consists of a set of eight consecutive segmentation steps. In the first step, the dimension of the initial image is reduced to 12.5 % of its original size. This means that for an initial image of 512 × 512 pixelsimage I1 of the first step is reduced to 64 × 64 pixels (see Fig. 8 (a)). Segmentation of our images begins with an initial active square contour of dimension 42 × 42 pixels. Let C1 be the contour resulting from the first segmentation step (see segmentation step, the dimension of the reduced to 25 % of its original size. Thus, the dimension of the image becomes 128 ×128 pixels and the contour resulting from the first segmentation step, is resized to the dimension 128 × 128 pixels and it is used as an initial contour to segment the image contour C2 obtained after this segmentation is resized and used to segment the image step. Similarly, we continue with the remaining steps to finally segment the initial 512 × 512 image(Fig. 8 (c)). At each step, the initial image is reduced to the corresponding dimension (image and the contour obtained by the previous segmentation step (Ci-1) is resized to as initial contour for segmentation. Table 1 the segmentation procedure scheme.
Table 1: Process of eight stages in segmentationInitial image
I0 512*512
Step 1: Image 11
64*64
Step 2: Image 12
128*128
Step 3: Image 13
192*192
Step 4: Image 14
256*256
Step 5: Image 15
320*320
Step 6: Image 16
384*384
Step 7: Image 17
448*448
Step 8: Image 18
512*512
Snake method an effective and faster segmentation approach of microscopic
gray scale images possessing both high dimension and high resolution. Since the active contour depends deeply on the initial contour, the proposed technique ensures a fast convergence onto real contour. It consists of a set of eight
on steps. In the first step, the dimension of the initial image is reduced to 12.5 % of its original size. This means that for an initial
age of 512 × 512 pixels, the dimension of the image I1 of the first step is reduced to 64 × 64 pixels
)). Segmentation of our images begins with an initial active square contour of dimension 42
be the contour resulting from the see Fig. 8 (b)). In the second
segmentation step, the dimension of the initial image is reduced to 25 % of its original size. Thus, the dimension of the image I2 of the second step becomes 128 ×128 pixels and the contour C1, resulting from the first segmentation step, is resized to the dimension 128 × 128 pixels and it is used as
l contour to segment the image I2. The obtained after this segmentation is
resized and used to segment the image I3 of the third step. Similarly, we continue with the remaining steps to finally segment the initial 512 × 512 image
. At each step, the initial image is reduced to the corresponding dimension (image I i) and the contour obtained by the previous
) is resized to I i size and used itial contour for segmentation. Table 1 shows
edure scheme.
Table 1: Process of eight stages in segmentation Initialization Segmentatio
n
Square Contour
Contour C1
C1 Resized to 128*128
Contour C2
C2 Resized to 192*192
Contour C3
C3 Resized to 256*256
Contour C4
C4 Resized to 320*320
Contour C5
C5 Resized to 384*384
Contour C6
C6 Resized to 448*448
Contour C7
C7 Resized to 512*512
Final contour
WSEAS TRANSACTIONS on BIOLOGY and BIOMEDICINE Ahmad Chaddad, Camel Tanougast, Abbas Dandache, Ahmed Bouridane
ISSN: 1109-9518 42 Issue 2, Volume 8, April 2011

3.2 Automation Of each step of the segmentation After the number of iterations, the active contour fluctuates around a constant geometry. From this threshold, the active contour varies slightly in a repeated manner around the real contour. This is interpreted as non-necessary and beneficial iterations consuming precious time. The global minimum is eventually reached. In this second part we introduce conditions on the main technique to lead and automate each stage of the first part. The automation of the segmentation is done by two ways. First, the user does not give any condition on the initial contour as previously explained. Secondly, the required number of iterations in each stage is self-determined by this technique. The segmentation within each stage happens with successive steps. Each step is a set of 20 consecutive iterations. For each step, we measure the vector D0, which is the spatial difference between each two consecutive contours of the 20 iterations. At the end of each step, we measure the element Dsi, difference between maximum and minimum of vector D0. The first step (first twenty iterations) of each of the eight stages is characterized to have Ds1 the maximum value of Dsi. This technique continues to perform new 20 iterations step until the following condition:
D�� < α. D�� (9)
where α is a parameter that depend on the sensitivity of the required segmentation and is introduced by the user before starting the algorithm. An analysis of the curve obtained for each of the eight stages can give an idea about the order of the parameter α (see Fig. 5). The parameter α can be defined as the minimum value of Dsi on that of its maximum Ds1 such as follow:
α = min (D��) D��⁄ (10)
We can interpret from the results shown in Table 2 that α varies between 0.2 % and 1.7 %. Our choice of α for the segmentation of the 8 stages must be single. Therefore, we must choose a value that ensures the convergence within each of the eight steps of any image.
(a)
(b)
Fig. 5: Analysis of the α parameter from the curve variation of the
function ‘Difference’ for the stages 1 (a) and 2 (b) of the segmentation.
4 Parameters Extracted 4.1 Haralick’s Features In our case study, we only use and compute the following five main Haralick’s coefficients on GLCM for texture analysis and the classification: Contrast (Cont), Entropy (Ent), Energy (Eng) , Correlation (Corr) and Homogeneity (Hgt) parameters. The correlation feature based on the variance (σ ) and Mean parameter (µ ). The coefficient σ is specified by the following equations:
σ = >∑ ∑ (1 − μ)�. PA,�(i, j)CDEF�
CD�F� (11)
0 50 100 150 200 250 300 350 4000
50
100
150
200
250
300
350
400
450
X: 20Y: 410
Image 64 x 64
Saturation within 200 iterations. Computation time : 2.4577 secondes.
X: 200Y: 7.031
0 50 100 150 200 250 300 350 4000
500
1000
1500
2000
2500
3000
X: 20Y: 2508
Image 128 x 128
Saturation within 100 iterations. Computation time : 4.891 secondes.
X: 100Y: 15.4
Table 2: Results of the α parameter obtained for eight stages stage Image Min Max α
1 64x64 7.031 410 1.7% 2 128x128 15.4 2508 0.6% 3 192x192 14.83 2803 0.5% 4 256x256 7.596 2944 0.2% 5 320x320 49.56 2956 1.6% 6 384x384 24.19 3149 0.7% 7 448x448 38.55 3201 1.2% 8 512x512 43.32 3289 1.3%
WSEAS TRANSACTIONS on BIOLOGY and BIOMEDICINE Ahmad Chaddad, Camel Tanougast, Abbas Dandache, Ahmed Bouridane
ISSN: 1109-9518 43 Issue 2, Volume 8, April 2011

where
μ = ∑ ∑ i . PA,�(i, j)CDEF�
CD�F� (12)
We calculated these five Haralick’s parameters after making the segmentation of microscopic images of three types of abnormal cells (BH, IN and Ca). Each of these parameters [16, 17] are measured directly on three segmented types of abnormal cells after extracting the data from each cell segmented by active contour. Next, was calculated GLCM and therefore extracted the Haralick’s parameters from GLCM matrix of each cell segmented. These coefficients are specified as following. The Contrast (Cont) feature is a measure of image intensity contrast or the local variations present in an image to show the texture fineness. This parameter is specified by the following equation:
cont = ∑ ∑ (1 − j)�. PA,�(i, j)CDEF�
CD�F� (13)
The Entropy coefficient (Ent) is a descriptor of randomness produces a low value for an irregular GLCM. It achieves its highest value when all elements of the GLCM are equal for an irregular image. Furthermore, an irregular GLCM is produced by a regular image, such as one with a repetitive pattern. This coefficient is defined by the following expression:
Ent = ∑ ∑ PA,�(i, j). log [PA,�(i, j)]CDEF�
CD�F� (14)
The Energy feature (Eng) returns the sum of squared elements in the GLCM as expressed by the following equation :
Eng = ∑ ∑ PA,�(i, j)�CDEF�
CD�F� (15)
The descriptor Correlation (Corr) measures the linear dependence of gray level values in the co-occurrence matrix or describes the correlations between the rows and columns of the co-occurrence matrix. This parameter is specified by the following equation:
Corr = ∑ ∑ (i − μx)(j − μy). LM,N(�,E)O�.OP
CDEF�
CD�F� (16)
Homogeneity (Hgt) feature returns a value that measures the closeness of the distribution of elements in the GLCM to the GLCM diagonal. This coefficient is specified by the following equations:
Hgt = ∑ ∑ PA,�(i, j)/(1 + |i − j|)CDEF�
CD�F� (17)
The analysis results show that only three parameters (Correlation, Entropy and Contrast) of the Haralick’s coefficients give good classification between the three types of cancer cells (more details in the section 5). 4.2 Morphology Parameters Nine morphologic parameters were used to classify segmented cells. These parameters include Area and perimeter of the cell, Xor cell-circle, Xor cell-convex, Xor cell-rectangle, Standard Deviation of the positions of the contour points, Deviation Sum, Eccentricity and Solidity of the detected cell. Xor cell-circle operator is applied between the cell and a circle having the same area and center of mass as of the cell. Fig. 6 shows the three steps required to determine this parameter. The area of the white region in Fig. 6 (c) illustrates the numerical value of the Xor cell-circle parameter.
a) b) c)
Fig. 6: (a) segmented cell, (b) circle with the same area and center of mass as of the cell, (c) Xor cell-circle.
The same methodology in Xor cell-circle is used to estimate the Xor cell-convex (see Fig. 7). The Xor operator here is between the cell and a convex which covers the cell. Similarly, the Xor cell-rectangle is an operator between the segmented cell and a rectangle covering it.
(A) (B) (C)
Fig. 7: Parameter obtaining Xor cell-convex, three segmented cells, (A)
BH, (B) IN, (C) Ca.
The Standard Deviation of the position for the contour points is:
WSEAS TRANSACTIONS on BIOLOGY and BIOMEDICINE Ahmad Chaddad, Camel Tanougast, Abbas Dandache, Ahmed Bouridane
ISSN: 1109-9518 44 Issue 2, Volume 8, April 2011
Standard Deviation = >�C ∑ (X� − XV)�C�F� (18)
where N is the number of the contour points, Xi is the distance between a contour point i and the center of the cell, and WX is the mean value of Xi. The distance from each point of the contour to the mean contour is summed to determine the Deviation Sum as follows:
Deviation Sum = ∑ |X� − XV|C�F� (19)
To measure the Eccentricity, we interpose onto the cell an ellipse to cover it. The Eccentricity parameter is given then by the following equation:
Eccentricity = distance(f�, f�) L⁄ (20)
where f1 and f2 are the two foci of the ellipse and L is its major axis length. Finally, the Solidity is a scalar specifying the proportion of the pixels in the convex hull that are also in the region of the cell. It is computed by the following expression:
Solidity = Area (cell) Area (convex)⁄ (21)
5 Classification and Results 5.1 Experimental platform The computation and analysis for our experimental results of the main Haralick’s features are applied on multispectral images of colon cells in the healthy and cancerous cases. Indeed, the recent introduction of the multispectral imaging to pathology, allowing a complete high resolution optical spectrum to be generated for every pixel of a microscope image, represents a completely novel way of analyzing pathological tissues. These multispectral bio-images are obtain from an high-throughput Liquid Crystal Tunable Filter (LCTF) allows the capturing of 16 spectral bands between 500 nm and 650 nm with a 9.375 nm stepwise between each successive band. Therefore, there are 16 sequential bands images for each type of malignant cancer grades (BH, IN and Ca) for different frequencies or wavelength between 500 and 650 nm. All following experimental steps are carry out and obtained by using a 32 bits PC platform running at 2.4 GHz (Core 2 processor) based on the Matlab environment tool [20]. This platform validates the correct operations of the analysis textures and structures approaches starting from the capture of the multispectral bio-images.
5.2 Segmentation developed We developed two consecutive parts. It receives first the microscopic image of the biopsy which is a sequential band image. Specification of the desired band of the image as well as the segmentation sensitivity allows the algorithm to perform the eight successive stages of segmentation in order to provide a final segmented image (Fig. 8 (c)). Incomplete cells in the image are discarded by the algorithm. Images were segmented and observed at the 8th sequential band corresponding on a midrange of 575 to 584.375 nm of the multispectral bands. The value of the parameter α was set at 5%. In the second part, the algorithm extracts the Haralick features and the morphological parameters of the segmented cell that are used as input for the probabilistic neural network to detect the type of cell. Fig. 8 (a) shows images of three cell types BH, IN and Ca used during this study while Fig. 9 illustrates the results of segmentation of these cells using the classical Snake method. This segmentation required more than 6 minutes for each image beginning from a 492 × 492 square initial contour. It is evident that the contour converges toward local minima which are far from the real contour of each cell. The results of our new segmentation technique for the three images are shown in Fig. 10. Successful segmentations were obtained within less than 3 minutes for each image. These images show the efficiency of our model in detecting active contours of irregular objects such as cancerous IN and Ca cell types. After the cells segmented, we extracted these cells (see Fig. 11) for preparing it to computation these Haralick’s features and morphology parameters. 5.3 Neural network classification methods Several methods and algorithms allow classification using neural network. We used here probabilistic neural network in which the distance separating a test variable from known class variables is measured and classified as to be from the nearest class. The activation function is used to introduce non-linearity in the functioning of the neuron. The activation function of the probabilistic neural network [18, 19] is a function that measures the distance of unknown variable to all known class variables. This activation function plays the role of a low pass filter. We have used a probabilistic neural network [20] as an effective method for classification using segmented cells in the image and the extracted three Haralick’s coefficients (Contrast, Entropy, Correlation) and
WSEAS TRANSACTIONS on BIOLOGY and BIOMEDICINE Ahmad Chaddad, Camel Tanougast, Abbas Dandache, Ahmed Bouridane
ISSN: 1109-9518 45 Issue 2, Volume 8, April 2011

three shape parameters (Area, cell Convex Xor, Solidity).
(A) (B) a) Three types of colon cells are reduced to 64 x 64 pixels.
(A) (B) b) Segmentation of three images of size 64 x 64 pixels
(A) (B) c) Final segmentation results for three types of colon cells
Fig. 8: Segmentation of three images using the new segmentation
strategy: (A) BH, (B) IN, (C) Ca
Fig. 9: Segmentation results of three cell types images using the conventional Snake method.
Area, cell Convex Xor,
(C)
64 x 64 pixels.
(C)
b) Segmentation of three images of size 64 x 64 pixels.
(C)
Final segmentation results for three types of colon cells.
: Segmentation of three images using the new segmentation Ca.
: Segmentation results of three cell types images using the
a)
Fig. 10: Segmentation of three images using the new segmentation strategy: a) BH cell within 2.74 minutes, b
c) Ca cell within 2.33 minutes.
a) Extracted cells
b) Extracted cells
c) Extracted cells
Fig. 11: Extracted cells results for the three types of colon cells,
b) IN and
We used 18 images of known types shown in 12. The network is then used to classify any new segmented image of cells.parameters computed from the cell bioinputs to the probabilistic neural network which is able to classify and specify the type of cell detected(BH, IN or Ca).
b)
c)
Segmentation of three images using the new segmentation
cell within 2.74 minutes, b) IN cell within 2.28 minutes, cell within 2.33 minutes.
Extracted cells of type BH.
Extracted cells of type IN.
Extracted cells of type Ca.
he three types of colon cells, a) BH,
and c) Ca.
images of known types shown in Fig. . The network is then used to classify any new
segmented image of cells. The three Haralick’s parameters computed from the cell bio-image are inputs to the probabilistic neural network which is able to classify and specify the type of cell detected
WSEAS TRANSACTIONS on BIOLOGY and BIOMEDICINE Ahmad Chaddad, Camel Tanougast, Abbas Dandache, Ahmed Bouridane
ISSN: 1109-9518 46 Issue 2, Volume 8, April 2011

00.20.40.60.8 0200400
0.955
0.96
0.965
0.97
0.975
0.98
0.985
0.99
0.995
1
contrastEntropy
corr
elat
ion
c1-Bh
c2-in
c3-ca
Fig. 12: Clusters of abnormal colon cells, BH, IN and Ca. These clusters are according to three parameters (Corr, Ent, and Cont) of segmented
cells.
Our classification method was applied to several different cell types. Fig. 13 shows the position of three cells of unknown types and the results were very attractive. Indeed, the probabilistic neural network using the three Haralick’s parameters are able to correctly classify these new cells as depict in the Fig.12.
00.10.20.30.40.50.60.70.80.9
0
200
4000.955
0.96
0.965
0.97
0.975
0.98
0.985
0.99
0.995
1
contrast
Entropy
corr
elat
ion
c1-Bh
c2-in
c3-caTest Bh
Test IN
Test Ca
Fig. 13: Classify of three types of abnormal cell (BH, IN and Ca).
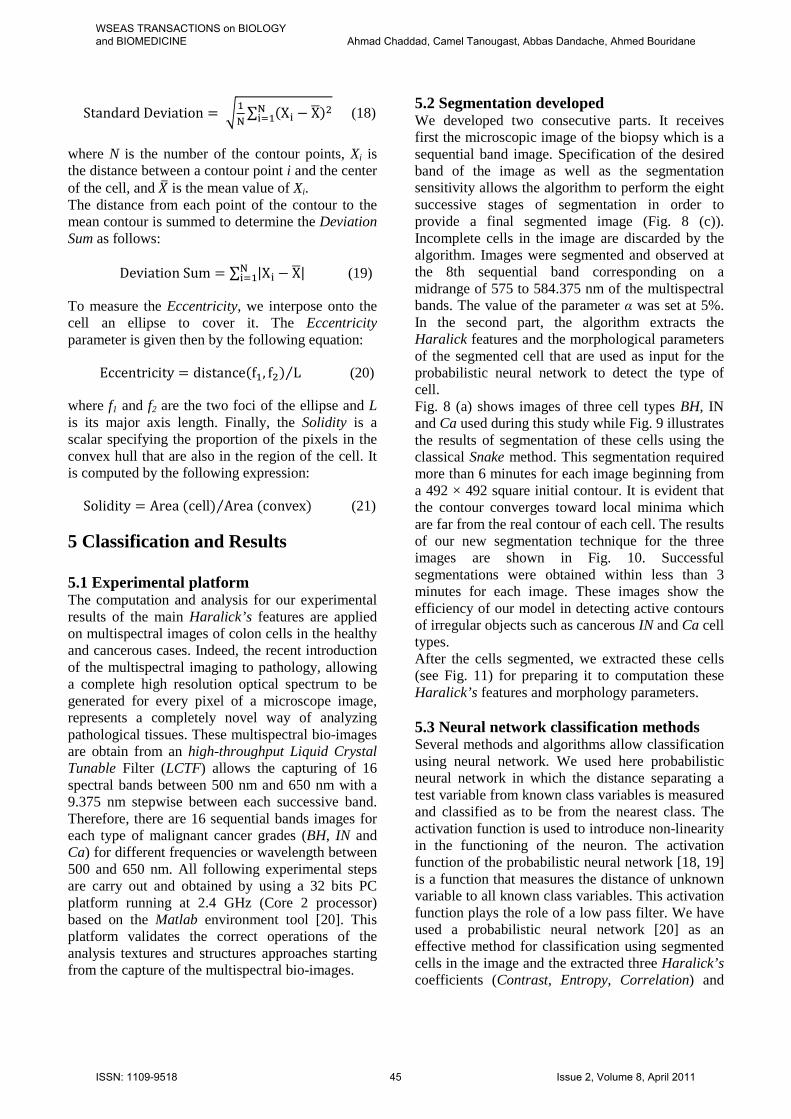
We trained with 45 images of known types as shown in Fig. 14 for use later to classify any new cell of a segmented image. The three shape parameters of the cell (Area, Xor convex Cell, Solidity) are therefore the input to the probabilistic neural network. Same classification method is applied to several different cell types using the three shape parameters (Area, Xor convex Cell and Solidity) could correctly classify new cells as shown in the Figures 15 (a), 15 (b) and 15 (c). Although the
three types are well separated in three regions, some IN cells are close to BH cells because of shape similarity between the BH and IN.
Fig.14: Clusters of abnormal colon cells, BH, IN and Ca. This clusters
are according to three parameters, Area, XOR convex cell and Solidity of segmented cells.
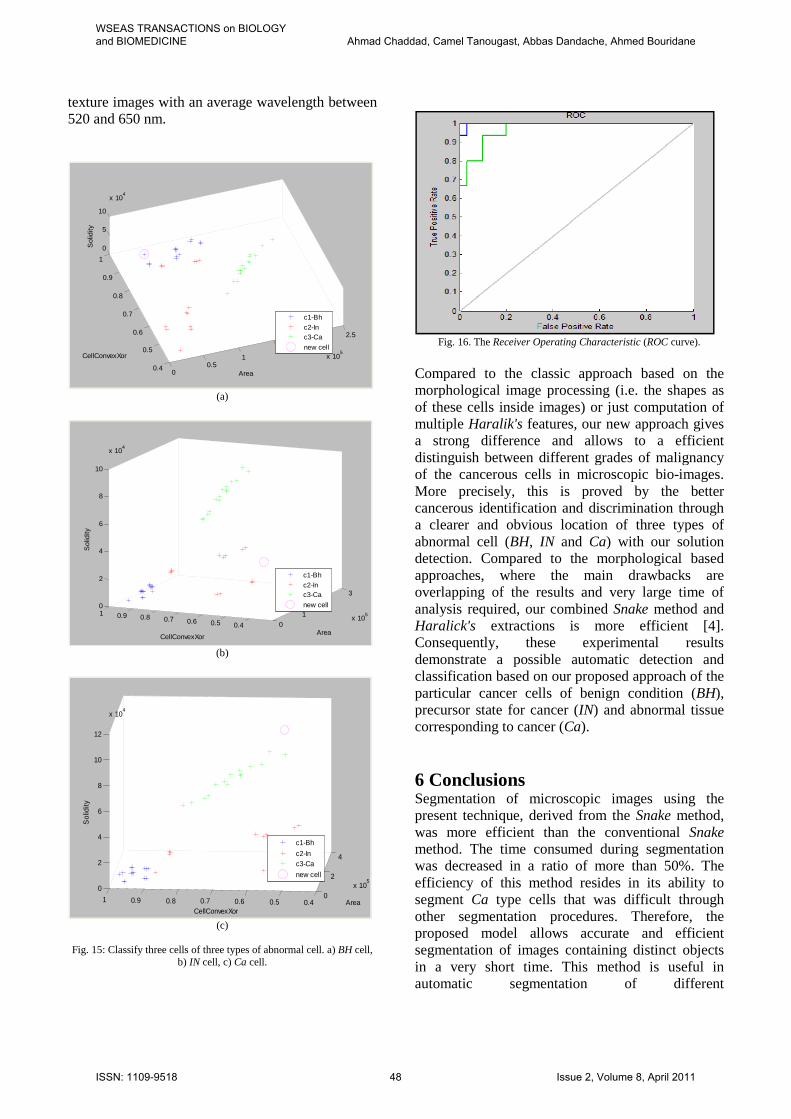
In a Receiver Operating Characteristic (ROC curve), the true positive rate (Sensitivity) is plotted in function of the false positive rate (100-Specificity) for different cut-off points as shown in Fig. 16. Each point on the ROC curve represents a sensitivity/specificity pair corresponding to a particular decision threshold. A test with perfect discrimination has a ROC curve that passes through the upper left corner (100% sensitivity, 100% specificity). Therefore the closer the ROC curve is to the upper left corner, the higher the overall accuracy of the classification between the three types of cancer cells. 5.4 Discussion Although the Haralick's texture features based on GLCM is one of the most widely used techniques for texture analysis, this approach requires the computation of a large combined parameters in order to deduce a efficient classification of cancer cell depending of the difference and distinguish parameters values [3]. Thanks to our approach based on the combination of the extracted texture parameters and the active contour or segmentation, considered as one pre-treatment of the lower, intermediate and higher frequency images, our experimental results demonstrate that only the Contrast, Entropy and Correlation of the Haralick’s texture parameters allow to classify the type or degree of cancer cells from their multispectral
00.5
11.5
22.5
x 105
0.4
0.6
0.8
10
2
4
6
8
10
x 104
CellConvexXorArea
Sol
idity
c1-Bh
c2-In
c3-Ca
WSEAS TRANSACTIONS on BIOLOGY and BIOMEDICINE Ahmad Chaddad, Camel Tanougast, Abbas Dandache, Ahmed Bouridane
ISSN: 1109-9518 47 Issue 2, Volume 8, April 2011
texture images with an average wavelength between 520 and 650 nm.
(a)
(b)
(c)
Fig. 15: Classify three cells of three types of abnormal cell. a) BH cell, b) IN cell, c) Ca cell.
Fig. 16. The Receiver Operating Characteristic (ROC curve).
Compared to the classic approach based on the morphological image processing (i.e. the shapes as of these cells inside images) or just computation of multiple Haralik's features, our new approach gives a strong difference and allows to a efficient distinguish between different grades of malignancy of the cancerous cells in microscopic bio-images. More precisely, this is proved by the better cancerous identification and discrimination through a clearer and obvious location of three types of abnormal cell (BH, IN and Ca) with our solution detection. Compared to the morphological based approaches, where the main drawbacks are overlapping of the results and very large time of analysis required, our combined Snake method and Haralick's extractions is more efficient [4]. Consequently, these experimental results demonstrate a possible automatic detection and classification based on our proposed approach of the particular cancer cells of benign condition (BH), precursor state for cancer (IN) and abnormal tissue corresponding to cancer (Ca).
6 Conclusions Segmentation of microscopic images using the present technique, derived from the Snake method, was more efficient than the conventional Snake method. The time consumed during segmentation was decreased in a ratio of more than 50%. The efficiency of this method resides in its ability to segment Ca type cells that was difficult through other segmentation procedures. Therefore, the proposed model allows accurate and efficient segmentation of images containing distinct objects in a very short time. This method is useful in automatic segmentation of different
00.5
11.5
22.5
x 105
0.4
0.5
0.6
0.7
0.8
0.9
1
0
5
10
x 104
Area
CellConvexXor
Sol
idity
c1-Bhc2-Inc3-Ca
new cell
0
1
2
3
x 105
0.40.50.60.70.80.910
2
4
6
8
10
x 104
AreaCellConvexXor
Sol
idity
c1-Bh
c2-Inc3-Ca
new cell
0
2
4
x 105
0.40.50.60.70.80.91
0
2
4
6
8
10
12
x 104
Area
CellConvexXor
Sol
idity
c1-Bh
c2-Inc3-Ca
new cell
WSEAS TRANSACTIONS on BIOLOGY and BIOMEDICINE Ahmad Chaddad, Camel Tanougast, Abbas Dandache, Ahmed Bouridane
ISSN: 1109-9518 48 Issue 2, Volume 8, April 2011

histopathological images and thus allowing a faster segmentation of microscopic bio-images. Among the five Haralick’s features used to classify cells, only three features (Correlation, Entropy and Contrast) were found to be effective to discriminate between the three types of cells (BH, IN and Ca). In addition, classification of unknown cell was possible using this classification method. The same for nine morphologic parameters used to classify cells, only three parameters (area, Xor cell-convex and solidity) were found to be effective to discriminate between the three types of cells. By comparison, we found that these classify more efficient on these Haralick features than these three morphologic parameters. Indeed, some IN cells were wrongly classified as BH cells due to their shapes that were similar to those of BH cells. Finally, our approach is very simple, exhibits attractive results and useful in the textures analysis between different histopathological images allowing a fast cancer cells classification of microscopic bio-images. As future work, we propose to research for new features about pixel value measurements. We also propose to deal with a hardware implementation to accelerate the computation features by deploying FPGA technology and for decrease the time of computation technology to achieve both high performance and flexibility in fast computation in real time processing. References: [1] C. A. B. Castano, J. S. Fraga, S. Fernandez, A.
Gruber and L. Costa, Biological shape characterization for automatic image recognition and diagnosis of protozoan parasites of the genus Eimeria, Pattern Recognition, Vol.40, No.7, 2007, pp. 1899-1910.
[2] A. Kumar, Y. L. Yip, B. Smith and P. Grenon, Bridging the gap between medical and bioinformatics: An ontological case study in colon carcinoma, Computers in Biology and Medicine, Vol.36, No.7, 2006, pp. 694-711.
[3] A. Chaddad, C. Tanougast, A. Dandache, A. Bouridane, J. Charara and A. Al Houseini, Classification of cancer cells based on Haralick’s Coefficients using Multi-spectral images, In: Proceedings of the 12th Mediterranean Conference on Medical and Biological Engineering and Computing. MEDICON 2010, May 27-30, 2010, Greece.
[4] M. A. Roula, Machine Vision and Texture Analysis for the Automated Identification of Tissue Patterns in Prostatic Tumours, PhD thesis in The Queen's University of Belfast, May 2004.
[5] G. D. Giannoglou, Y. S. Chatzizisis, V. Koutkias, I. Kompatsiaris and al, A novel active contour model for fully automated segmentation of intravascular ultrasound images: In vivo validation in human coronary arteries, Computers in Biology and Medicine, Vol.37, No.9, 2007, pp. 1292-302.
[6] R. Verdu, J. Morales, R. Gonzalez and L. Weruaga, Convergence analysis of active contours, Image and Vision Computing, Vol.26, No.8, 2008, pp. 1118-1128.
[7] R. M. Haralick, K. Shanmugam and I. Dinstein, Textural features for image classification, IEEE Trans. Syst. Man Cybern, Vol. 3, No.6, 1973, pp. 610-621.
[8] C. Corbane, F. Marre and M. Petit, Using SPOT-5 HRG Data in Panchromatic Mode for Operational Detection of Small Ships in Tropical Area, Sensors, Vol. 8, No.5, 2008, pp. 2959-2973.
[9] L. Sieler, C. Tanougast and A. Bouridane, A scalable and embedded FPGA architecture for efficient computation of grey level co-occurrence matrices and Haralick textures features, Microprocessors & Microsystems, Vol.34, No.1, 2010, pp. 14-24.
[10] D. Mayumi, U. Sabino, L. F. Costa, E. G. Rizatti and M. A. Zago, A texture approach to leukocyte recognition, Real-Time Imaging, Vol.10, No.4, 2008, pp. 205-216.
[11] M. A. Roula, A. Bouridane and P. Miller, A quadratic classifier based on multi-spectral texture features for prostate cancer diagnosis, In Proceedings of the Seventh International Symposium on Signal Processing and its Applications, Vol.2, 2003, pp. 37-40.
[12] M. A. Garcia and D. Puig, Supervised texture classification by integration of multiple texture methods and evaluation windows, Image and Vision Computing, Vol.25, No.7, 2007, pp. 1091-1106.
[13] A. K. Jain, Fundamentals of digital image processing, Information and System Sciences Series, Prentice-Hall, 1989.
[14] T. Chan and L. Vese, Active contours without edges, IEEE Trans Imag Proc, Vol.10, No.2, 2001, pp. 266-277.
WSEAS TRANSACTIONS on BIOLOGY and BIOMEDICINE Ahmad Chaddad, Camel Tanougast, Abbas Dandache, Ahmed Bouridane
ISSN: 1109-9518 49 Issue 2, Volume 8, April 2011

[15] X. Chen, X. Zhou and S. T. C. Won, Automated segmentation, classification, and tracking of cancer cell nuclei in time-lapse microscopy, IEEE Trans BiomedEng, Vol.53, No.4, 2006, pp. 762-766.
[16] T. Randen and J. H. Husoy, Filtering for texture classification: a comparative study, IEEE Trans. on Pattern Analysis and Machine Intelligence, Vol.21, No.4, 1999, pp. 291-310.
[17] S. H. .Peng, D. H. Kim, S. L. Lee and M. K. Lim, Texture feature extraction based on a uniformity estimation method for local brightness and structure in chest CT images, Computers in Biology and Medicine, Vol.40, Issues 11-12, 2010, pp. 931-942.
[18] A. B. Tosun, M. Kandemir, C. Sokmensuer and C. Gunduz-Demir, Object oriented texture analysis for the unsupervised segmentation of biopsy images for cancer detection, Pattern Recognition, Vol.42, No.6, 2009, pp. 1104-1112.
[19] S. L. Wang, X. Li, S. Zhang, J. Gui and D. S. Huang, Tumor classification by combining PNN classifier ensemble with neighborhood rough set based gene reduction, Computers in Biology and Medicine, Vol.40, No.2, 2010, pp. 179-189.
[20] Mathworks, Matlab Software, Version 7.8.0(R2009a), Mathworks, 2009.
WSEAS TRANSACTIONS on BIOLOGY and BIOMEDICINE Ahmad Chaddad, Camel Tanougast, Abbas Dandache, Ahmed Bouridane
ISSN: 1109-9518 50 Issue 2, Volume 8, April 2011