extratropical transition of southwest pacific tropical
TRANSCRIPT
Applied Aviation Sciences - Prescott College of Aviation
9-2004
Extratropical Transition of Southwest Pacific Tropical Cyclones. Extratropical Transition of Southwest Pacific Tropical Cyclones.
Part II: Midlatitude Circulation Characteristics Part II: Midlatitude Circulation Characteristics
Mark R. Sinclair Embry-Riddle Aeronautical University, [email protected]
Follow this and additional works at: https://commons.erau.edu/pr-meteorology
Part of the Atmospheric Sciences Commons, and the Meteorology Commons
Scholarly Commons Citation Scholarly Commons Citation Sinclair, M. R. (2004). Extratropical Transition of Southwest Pacific Tropical Cyclones. Part II: Midlatitude Circulation Characteristics. Monthly Weather Review, 132(9). https://doi.org/10.1175/1520-0493(2004)132%3C2145:ETOSPT%3E2.0.CO;2
© Copyright 2004 American Meteorological Society (AMS). Permission to use figures, tables, and brief excerpts from this work in scientific and educational works is hereby granted provided that the source is acknowledged. Any use of material in this work that is determined to be “fair use” under Section 107 of the U.S. Copyright Act September 2010 Page 2 or that satisfies the conditions specified in Section 108 of the U.S. Copyright Act (17 USC §108, as revised by P.L. 94-553) does not require the AMS’s permission. Republication, systematic reproduction, posting in electronic form, such as on a web site or in a searchable database, or other uses of this material, except as exempted by the above statement, requires written permission or a license from the AMS. Additional details are provided in the AMS Copyright Policy, available on the AMS Web site located at (http://www.ametsoc.org/) or from the AMS at 617-227-2425 or [email protected]. This Article is brought to you for free and open access by the College of Aviation at Scholarly Commons. It has been accepted for inclusion in Applied Aviation Sciences - Prescott by an authorized administrator of Scholarly Commons. For more information, please contact [email protected].

VOLUME 132 SEPTEMBER 2004M O N T H L Y W E A T H E R R E V I E W
q 2004 American Meteorological Society 2145
Extratropical Transition of Southwest Pacific Tropical Cyclones. Part II: MidlatitudeCirculation Characteristics
MARK R. SINCLAIR
Embry–Riddle Aeronautical University, Prescott, Arizona
(Manuscript received 23 April 2003, in final form 15 March 2004)
ABSTRACT
This second of two papers on extratropical transition (ET) over the southwest Pacific Ocean focuses on thevariability of ET. A climatology of ET onset based on a previously described objective technique shows thatET commences 158 of latitude nearer the equator on average than similar cases from the Northern Hemisphere.Characteristic midlatitude circulation patterns accompanying ET near 308S are identified by means of empiricalorthogonal function (EOF) analysis of 50 storms. The first eigenvector pattern, explaining nearly half thecirculation variability, expresses relaxed and enhanced pressure gradients south of the storm that define com-posites similar to ‘‘cradled’’ and ‘‘captured’’ classifications previously described for the southeast Indian Ocean.The second EOF distinguishes redeveloping from weakening storms. Reintensifying storms were located beneathstrong cyclonic vorticity advection (CVA) near the equatorward entrance region of an upper jet whereas theupper jet was well to the west of weakening storms.
A survey of factors responsible for modulating central sea level pressure change during ET was conductedfor the 50 storms. The quantity most strongly correlated with surface development was found to be CVA at thejet level. Extratropical reintensification occurred when the surface cyclone was located beneath the equatorwardentrance region of an upper jet for storms between 288 and 348S, and beneath the poleward exit jet region forstorms farther south. Strongest examples of redevelopment each occurred beneath a potent double jet signaturealoft, with maximum storm-relative upper-level CVA located directly above the surface low and net vorticityfluxes reflecting amplification of the upper wave. Weakening storms featured a weakening upper trough directlyabove the storm, with CVA to the east.
1. Introduction
This is the second of two papers on extratropical tran-sition (ET) in the southwest Pacific Ocean basin. In thefirst (Sinclair 2002), a 28-yr climatology was construct-ed for TCs moving into middle latitudes. That studyidentified the average structure changes during ET inthe southwest Pacific Ocean basin by compositingstorms at various stages of ET. It showed that, on av-erage, southwest Pacific tropical cyclones (TCs) start toencounter the baroclinic westerlies at around 208S, re-sulting in increasing eastward and poleward motion andan early onset of extratropical transformation comparedwith their Northern Hemisphere (NH) counterparts. By258–308S, virtually all southwest Pacific TCs under-going ET have acquired characteristics of midlatitudestorms, including asymmetric thermal and vertical mo-tion fields, upper jet streaks, cold and warm frontogen-esis regions, and a westward tilt with height.
This second companion paper addresses the issue of
Corresponding author address: Dr. Mark R. Sinclair, Embry–Rid-dle Aeronautical University, 3700 Willow Creek Road, Prescott, AZ86301.E-mail: [email protected]
ET variability. Using data from 50 TCs that progresssouth of 358S, the study will first identify the locationof ET onset using an objective measure of thicknessasymmetry similar to that proposed by Evans and Hart(2003, hereafter EH). This analysis will determine forthe first time, the range of latitudes at which southwestPacific TCs commence the process of ET. Second, thisstudy will identify characteristic synoptic-scale signa-tures that accompany ET near 308S. Storms that crossthis latitude are entering New Zealand waters and fore-casters there need to be alert to changes in track, in-tensity, and structure. Identifying characteristic patternsand how storms in each class evolve as they pass thislatitude will help New Zealand forecasters anticipate theresult as a storm enters New Zealand waters and rec-ognize signatures that lead to severe events. At thislatitude, the contribution from the environmental west-erlies is increasing, resulting in acceleration and recur-vature to the southeast. While most TCs are weakeningat this latitude, a few reintensify as vigorous extratrop-ical systems as a result of interaction with an activetrough in the westerlies (Sinclair 1993b; Hill 1970). Thepotential for rapid track and intensity changes near thislatitude compounds the difficulty associated with pre-
2146 VOLUME 132M O N T H L Y W E A T H E R R E V I E W
dicting the severity and duration of heavy precipitation,damaging winds, and wave events.
Simple composites such as those in Sinclair (2002)mask case-to-case variability and do not address therange of synoptic configurations between a TC and amidlatitude trough. There is much observational andtheoretical evidence that there are distinct synoptic-scaleflow patterns that lead to fundamentally different modesof midlatitude cyclone evolution (Davies et al. 1991;Thorncroft et al. 1993; Schultz et al. 1998; Sinclair andRevell 2000). Likewise, there is growing evidence thatthe changes in TC structure, motion, and intensity thatoccur during ET are highly dependent on the nature ofthe midlatitude circulation into which the TC moves.Harr and Elsberry (2000) attributed differences in theextratropical evolution of two North Pacific TC rem-nants to the different midlatitude circulation character-istics into which each TC moved. They proposed thatthe structure of the midlatitude environment was theprimary factor that determined the rate of any reinten-sification of the TC remnant. Thorncroft and Jones(2000) and Browning et al. (1998) found that NorthAtlantic ET characteristics differ for storms interactingwith cyclonic versus anticyclonic sheared waves. Ac-cording to Thorncroft et al. (1993), cyclonically shearedwaves are characterized by cyclonic wrap-up of the up-per-level potential vorticity (PV) and a broad, deep sur-face cyclone while anticyclonically sheared waves leadto meridionally elongated upper-level PV anomalies andthe development of cutoff lows. McTaggart-Cowan etal. (2001) found that the reintensification of HurricaneEarl was largely dependent on the midlatitude environ-ment, with the nature of the hurricane remnants havingcomparatively little impact. Simulations by Ritchie andElsberry (2003) confirmed the hypothesis that the in-tensity of extratropical redevelopment of an ex-TC de-pends strongly on the characteristics of the midlatitudecirculation into which the TC is moving, but noted thatfavorable phasing of the TC with the approaching mid-latitude trough can result in substantial enhancement ofupper-level divergence, even for weaker midlatitudetroughs.
Extratropical transition is sensitive to the geometryof the interaction between the decaying TC and the mid-latitude environment into which the TC is moving. Harret al. (2000) used empirical orthogonal function (EOF)analysis to identify two characteristic circulation pat-terns over the western North Pacific during ET. Onepattern, in which ET occurred downstream from a large-amplitude midlatitude upper trough located northwestof the TC was called the northwest pattern, while theother pattern featured the TC embedded in a more zonalconfluent flow about a large circulation center northeastof the TC (northeast pattern). Klein et al. (2000) com-pared storm evolution for these two environments.Storms moving into the northwest pattern tended to in-tensify more rapidly and take a meridional track whilestorms in the northeast pattern intensified only slowly
and moved in a more zonal direction. Furthermore, theposition of the primary midlatitude circulation relativeto the poleward-moving TC was found to influencefrontogenesis and energy transformations during ET.Sometimes, a trough interaction can invigorate the TCwithout ET occurring. Hanley (1999) and Hanley et al.(2001) found that the midlatitude PV anomalies that leadto ET in the North Atlantic are much deeper and widerthan cases (Hanley et al. 2001) where a trough inter-action results in strengthening of the hurricane withoutET. However, when a broader midlatitude PV maximumassociated with an approaching midlatitude trough in-teracted with the TC, a favorable upper-divergence en-vironment for surface development was created near theequatorward entrance region of a downstream jet as theupper-level PV approached to within 1000 km of theTC.
These NH studies show that the nature and geometryof the midlatitude circulation plays a crucial (and prob-ably the dominant) role in determining how the track,structure, and intensity of TCs change during ET. Thisstudy follows Harr et al. (2000) and Klein et al. (2000)in using EOF analysis to identify the more persistentmidlatitude synoptic-scale signatures associated withET in the southwest Pacific basin. While the basic ideaof identifying different classes of storm evolution issimilar to that of Sinclair and Revell (2000), we hereuse the objective tool of EOF analysis. The goal is toidentify the range of different midlatitude circulationpatterns that accompany ET and determine the impactof each on intensity, structure, and motion changes. Datalimitations and resolution here preclude individual caseanalysis as detailed as previous NH studies. In particular,vertical resolution is insufficient to realistically depictpotential vorticity anomalies or tropopause undulations,as in previous NH case studies (Browning et al. 2000;Thorncroft and Jones 2000). Instead, we identify thevariety of distinct recurring larger-scale synoptic pat-terns that accompany ET from a large number of ana-lyzed storms. One practical motivation for identifyingsynoptic patterns is the potential to improve forecastsof gross features of future storm evolution from thenature of the midlatitude flow into which the TC ismoving.
The third part of this study will identify characteristicmidlatitude synoptic patterns that accompany extratrop-ical reintensification. Klein et al. (2000) described theET process as having two stages. In the first stage (trans-formation), the TC undergoes structure changes as itinteracts with the baroclinic westerlies, resulting in theappearance of asymmetric thermal and ascent fieldscharacteristic of baroclinic midlatitude cyclones. How-ever, Klein et al. (2000) describe a possible second stage(reintensification) that occurs when the transformed TCundergoes reintensification, usually in response to in-creasing upper-level cyclonic vorticity advection aheadof an approaching midlatitude trough. Memorable NHexamples include the regeneration of Hurricane Hazel
SEPTEMBER 2004 2147S I N C L A I R
as a powerful extratropical storm (Palmen 1958) andHurricane Agnes, which produced one of the worst nat-ural flooding disasters in United States history (Carrand Bosart 1978; DiMego and Bosart 1982a,b). Ex-amples of reintensifying storms in the southwest Pacificbasin include the Wahine storm that produced windsgusting to 75 m s21 in New Zealand’s capital city ofWellington (Hill 1970) and Cyclone Bola, whichdropped more than 900 mm of rain over northern NewZealand (NZ) in March 1988 (Sinclair 1993b). Whilemaximum winds in these storms are typically weakerthan in the parent hurricane, the areas of damaging windand heavy rain are typically much larger (Hart andEvans 2001), increasing the potential for loss of life andproperty.
It is hypothesized here that a period of coupling withthe divergence quadrant of an upper jet is a necessarycondition for extratropical redevelopment of the tropicalcyclone. Sinclair (1993b) identified the arrival of anupper jet from the west as a trigger for extratropicalreintensification of Cyclone Bola (March 1988), whichoccurred beneath a highly divergent double upper-jetconfiguration. The regeneration of Cyclone Patsy (De-cember 1986) coincided with a period of coupling withthe equatorward entrance region of an upper jet thatremained ‘‘phase locked’’ with the poleward-movingstorm (Sinclair 1993a). Foley and Hanstrum (1994)showed that the reintensification of Cyclone Herbie nearwestern Australia coincided with a strengthening thick-ness gradient caused by the approach of a cold frontand favorable coupling with the equatorward entranceregion of an upper jet. Bosart and Lackmann (1995)showed that Tropical Storm David reintensified over theeastern United States in response to warming and upperridging downstream of a rather weak midlatitude dis-turbance. This warming, caused by strong latent heatrelease and warm advection, strengthened the vorticitygradient above the storm. At this time, David was lo-cated beneath the equatorward entrance region of anupper-wind maximum. The remnant of David was ex-tremely responsive to the weak forcing ahead of theweak upper trough because of near-neutral moist sta-bility that favored vigorous ascent and preexisting low-level ‘‘seed’’ vorticity that had a large development re-sponse to the increased ascent. Harr and Elsberry (2000)emphasize the importance of rotational frontogenesis inreinforcing the dynamical support for coupling with theapproaching midlatitude trough. Although not directlyimplicated in that study, a downstream jet and strength-ening downstream ridge again were accessory factors.
Following a brief description of available data (sec-tion 2), the location of ET onset is identified from anobjective method. This is used to construct a climatol-ogy of ET onset and identify the typical synoptic settingaccompanying ET onset (section 3). Section 4 identifiesseveral characteristic synoptic signatures as the TC pass-es 308S and describes the evolution within each class.In section 5, we identify the synoptic configurations that
favor TC reintensification and diagnose the processesresponsible. Section 6 comprises a summary and con-cluding remarks.
2. Data and methodology
a. Data sources
As outlined in Sinclair (2002), tropical cyclone besttrack and intensity data for the southwest Pacific basinare based on an archive developed by the New ZealandMeteorological Service (NZMS), henceforth referred toas the NZMS archive. The database compiles time, lo-cation, and estimated intensity, plus text comments, forall detected storms since 1939. Storms are tracked untiltheir demise, including any extratropical phase. In thisocean basin, observational data prior to the advent ofsatellites are sparse, resulting in many TCs going un-detected. Accordingly, only storms from 1970 onwardare incorporated in this study. Unfortunately, the NZMSarchive does not usually record the time of ET. An ex-amination of Joint Typhoon Warning Center (JTWC)archives finds that they also did not record the time ofET. In this study, the objective method of EH is adaptedto identify the time of ET onset (section 3).
Sinclair (2002) showed that southwest Pacific TCsthat made it as far south as 358S had completed ET andtransformed to baroclinic extratropical cyclones. Here,we again identify a set of cyclones completing ET asthose TCs that are tracked poleward of 358S in theNZMS archive. In the period 1970–97, 81 TCs weretracked poleward of 358S. Twenty-nine of these thatspent their life east of 1708W were not included becauseof the lack of observational data over that region. Theremaining 50 storms between Australia and 1708W dur-ing 1970–97 formed the TC population for this study.Table 1 is a summary of these storms.
Gridded reanalysis datasets from the National Centersfor Environmental Prediction (NCEP) are utilized herefor synoptic and diagnostic analysis. These comprisetwice-daily analyses of geopotential height, wind, tem-perature, relative humidity, and vertical P velocity fromthe NCEP–NCAR reanalysis dataset (Kalnay et al.1996) on a 2.58 3 2.58 latitude–longitude grid. As dis-cussed in Sinclair (2002), the study region lies down-wind from several rawinsonde and surface synoptic ob-servation (SYNOP) stations near Australia and NZ, withadditional island stations north of 308S. In more recentyears, a wide variety of satellite-derived products havealso been assimilated into the analysis. Data coverageand analysis resolution are clearly not adequate to depictthe hurricane’s tight inner core, nor are they able todiagnose mesoscale details of ET to the extent that theNH studies referenced earlier have. Despite these lim-itations, Sinclair (2002, 1993a,b) showed that the 2.58-resolution analyses are able to at least portray synoptic-scale influences on the structure, motion, and intensityof TCs in this region.

2148 VOLUME 132M O N T H L Y W E A T H E R R E V I E W
TABLE 1. List of southwest Pacific tropical cyclones during 1970–97 progressing poleward of 358S.
Name Start date Start location End date End location
RosieLenaAltheaYolandeKirsty
30 Dec 197014 Mar 197121 Dec 197117 Mar 197225 Feb 1973
14.78S, 164.08E15.18S, 157.58E14.08S, 157.38E15.28S, 177.58E13.68S, 157.48E
4 Jan 197123 Mar 197130 Dec 197123 Mar 19721 Mar 1973
40.68S, 169.18E39.18S, 159.38W38.68S, 166.08E36.38S, 161.08E39.08S, 160.08E
NessiePamZoeAliceVal
19 Jan 197430 Jan 19745 Mar 1974
20 Mar 197429 Jan 1975
20.08S, 162.28E15.08S, 177.88W18.98S, 151.78E17.28S, 149.18E13.88S, 176.58W
22 Jan 19747 Feb 1974
18 Mar 197430 Mar 19745 Feb 1975
37.38S, 177.28E37.58S, 161.08E38.28S, 178.98W40.78S, 160.08E37.58S, 171.08W
AlisonElsaColinJanWatorea
4 Mar 197521 Jan 197626 Feb 197616 Apr 197625 Apr 1976
16.28S, 172.58E14.28S, 167.58E10.08S, 154.08E14.88S, 162.08E
9.08S, 153.88E
11 Mar 197526 Jan 19767 Mar 1976
21 Apr 197630 Apr 1976
36.08S, 171.28E35.08S, 170.08E46.08S, 157.08E40.08S, 176.58W38.08S, 177.78W
NormanHalFayHenryPaul
9 Mar 19777 Apr 1978
27 Dec 197829 Jan 19797 Jan 1980
12.08S, 168.08E13.08S, 145.08E10.08S, 175.08E13.68S, 167.68E21.58S, 149.08E
24 Mar 197722 Apr 197831 Dec 19785 Feb 1979
12 Jan 1980
40.08S, 177.08W41.38S, 179.08W36.08S, 174.08W46.08S, 175.08E47.08S, 161.08E
SinaFredaGyanHettieBernieMonica
10 Mar 198026 Feb 198118 Dec 198124 Jan 19821 Apr 1982
25 Dec 1984
15.58S, 159.08E15.58S, 144.68E
9.08S, 172.08E18.28S, 166.18E
5.08S, 158.38E12.88S, 147.08E
16 Mar 19809 Mar 1981
29 Dec 19816 Feb 1982
14 Apr 19822 Jan 1985
50.08S, 173.08W35.08S, 169.88E41.08S, 166.38E40.08S, 156.08W40.08S, 167.58W50.08S, 167.08E
HinaPatsyBolaDoviEseta
11 Mar 198513 Dec 198624 Feb 19888 Apr 1988
17 Dec 1988
16.58S, 174.78E10.48S, 172.78E12.08S, 180.08E15.08S, 170.98E14.38S, 166.38E
20 Mar 198522 Dec 198611 Mar 198818 Apr 198828 Dec 1988
38.08S, 155.08W44.58S, 177.78E41.88S, 170.88E44.38S, 162.68W36.38S, 170.58E
DelilahHarryNancyDamanEsau
30 Dec 19888 Feb 1989
28 Jan 199015 Feb 199225 Feb 1992
17.38S, 150.18E17.28S, 160.98E18.08S, 156.08E12.68S, 170.08E15.48S, 168.58E
7 Jan 198923 Feb 19898 Feb 1990
23 Feb 19929 Mar 1992
37.18S, 168.38E49.08S, 175.98E40.08S, 170.98E51.08S, 158.08W37.58S, 179.08W
FranMickOliPollyRewa
5 Mar 19925 Feb 1993
15 Feb 199325 Feb 199328 Dec 1993
13.08S, 174.78W16.58S, 173.08W15.28S, 172.88E16.08S, 158.08E
9.58S, 166.58E
21 Mar 199211 Feb 199320 Feb 19939 Mar 1993
23 Jan 1994
35.58S, 166.08W36.08S, 179.08E35.08S, 175.18W42.58S, 169.08W40.68S, 168.38E
SarahUshaAtuBetiFergus
19 Jan 199424 Mar 199411 Mar 199621 Mar 199624 Dec 1996
17.08S, 170.58E11.58S, 157.58E21.08S, 168.08E12.58S, 170.98E13.18S, 159.68E
4 Feb 19944 Apr 1994
18 Mar 19962 Apr 19961 Jan 1997
52.08S, 157.58W47.08S, 172.08W49.08S, 171.58W48.58S, 175.28W52.08S, 151.08W
DrenaFredaNamelessGavin
3 Jan 199724 Jan 199723 Feb 19973 Mar 1997
13.68S, 167.78E20.08S, 170.08E18.08S, 159.28W
8.88S, 171.58E
13 Jan 19975 Feb 19972 Mar 1997
14 Mar 1997
53.08S, 174.08W53.58S, 169.58W48.58S, 164.58W48.08S, 168.08W
b. Empirical orthogonal function analysis
Following Harr et al. (2000) and Klein et al. (2000),EOF analysis (Joliffe 1986) of 500-hPa heights is usedto identify characteristic midlatitude circulation patternsaccompanying ET near 308S (section 4) and extratropicalregeneration (section 5). EOF analysis is commonly usedto classify the variety of synoptic types in a particularregion (e.g., Christenson and Bryson 1966; Kutzbach1967; Richman 1981; Kidson 1994). The EOFs are com-puted from the temporal covariance matrices constructedfrom the 50 cases of ET during 1970–97. To facilitatecomparison with Harr et al. (2000), we used a similar
procedure to that study. Following Harr et al. (2000),normalization of the time series of 500-hPa heights withrespect to the temporal standard deviation was not per-formed. This highlights the higher-latitude synoptic var-iability that we wish to characterize. The annual cyclewas also retained as in Harr et al. (2000). Experimentationrevealed that removing the annual cycle resulted in onlysmall changes to the spatial eigenvector patterns. Evi-dently, intraseasonal circulation variability in the South-ern Hemisphere (SH) dominates the smaller, more spa-tially coherent changes in the average circulation duringthe SH hurricane season (December to April).

SEPTEMBER 2004 2149S I N C L A I R
Varimax rotation (Richman 1986) of the leading 10principal components (PCs) is employed to isolate, asfar as possible, single or dipole anomaly centers whosesynoptic interpretation would be simplified. Rotationwas accomplished by leaving the time series (the rotatedPCs) mutually orthogonal, but relaxing the orthogonal-ity of the spatial patterns (the EOFs). The number ofcomponents to rotate is somewhat arbitrary. A rotationof fewer components often results in overly complexpatterns with inadequate regionalization while overro-tation produces excessive regionalization (O’Lenic andLivezey 1988). Richman (1986) also found that spatialpatterns of rotated eigenvectors are more robust withrespect to sampling variations than their unrotated coun-terparts.
Geopotential height at 500 hPa was first interpolatedonto a movable 31 3 31 Lambert conformal domain ofsize 3330 km 3 3330 km centered on each storm. Thisdomain was exactly centered on the minimum 850-hPavorticity using bicubic splines. Vorticity at 850 hPa wasused because of reduced flow distortion at this levelnear the rugged islands of New Caledonia and NewZealand. The EOF analysis was performed on the setof 50 fields extracted at the time when each storm wasclosest to 308S. The temporal coefficients, or principalcomponents for each spatial eigenvector pattern werethen used to produce positive and negative compositesof various fields by averaging cases having PC ampli-tude more than one standard deviation above and belowthe temporal mean. These composites would be ex-pected to be more meaningful and representative of ac-tual synoptic cases than composites obtained from sim-ple averages across a variety of diverse synoptic types.
3. Extratropical transition onset
The composites of Sinclair (2002) suggested thatsouthwest Pacific TCs commence ET earlier than theirNH counterparts. As noted earlier, the time of ET onsetis seldom recorded in the NZMS database. Here, for thefirst time, the location of southwest Pacific ET onset isidentified for a large number of TCs using an objectivediagnostic technique.
a. Definition of transition onset
Following EH, the time of transition onset is iden-tified from the asymmetry in the thermal field. This wasdiagnosed by first identifying the average 600–925-hPathermal wind vector averaged over a 500-km radius cir-cle. The warm minus cold asymmetry was then deter-mined from the 600–925-hPa thickness field as
B 5 (Z 2 Z ) 2 (Z 2 Z ) , (1)600 925 warm 600 925 cold
where Z600 and Z925 are the 600- and 925-hPa heightsand the overbars indicate the areal means over the semi-circles on the warm and cold side of the average thermalwind vector. This is identical to the method of EH except
here asymmetry is computed left minus right relativeto the thermal wind vector rather than to the storm trans-lation vector, as in EH. Calculations based on the meth-od of EH yielded widely fluctuating B values, especiallywhere the direction of motion was varying. Further-more, it is common for SH TCs to move nearly at rightangles to the thermal wind (e.g., Fig. 10 of Sinclair2002), resulting in smaller values of B. North Atlantictransitioning TCs seldom approach the baroclinic zonehead-on (J. Evans 2003, personal communication), asthey are typically recurving ahead of an approachingtrough, resulting in a track toward the east-northeast thatoften parallels the Gulf Stream (Hart and Evans 2001).The method used here based on the thermal wind vectoryielded smoothly varying values of B for most tracks.Following EH, the onset of ET was judged to havebegun at the start of the period when B exceeded 10 min three or more successive 12-hourly analyses.
For most storms, the transition to an asymmetricstructure as defined by B was well defined and rapid,with near-zero values of B typically increasing to anaverage of around 30 m following ET onset, with abouta third of storms attaining B values in excess of 50 m.These results for the evolution of B are quite similar tothose of EH for the North Atlantic.
Occasionally, the increase in B was transient or ir-regular. For example, TC Patsy interacted with two mid-latitude systems (Sinclair 1993a). The first systempassed to the poleward side of Patsy, shearing off thesymmetric upper-level anticyclonic circulation andstranding Patsy as a shallow, weakening, warm-coredvortex. Vertical shear was present above 500 hPa butlow-level moisture and thermal fields retained much ofthe original TC symmetry. Interaction with a secondmidlatitude trough and associated upper jet resulted inmodest extratropical regeneration and the progressiveappearance of cold and warm front–like features, withthese changes occurring over a period of several days.Corresponding values of B computed for Patsy revealedone short-lived (,24 h) pulse of B . 10 m for the firsttrough interaction and a second more-prolonged periodof B ranging between 10 and 15 m (i.e., only just ful-filling the threshold for ET onset). A few other ET casesin the sample exhibited similar complexity in their evo-lution.
b. Climatology of ET onset
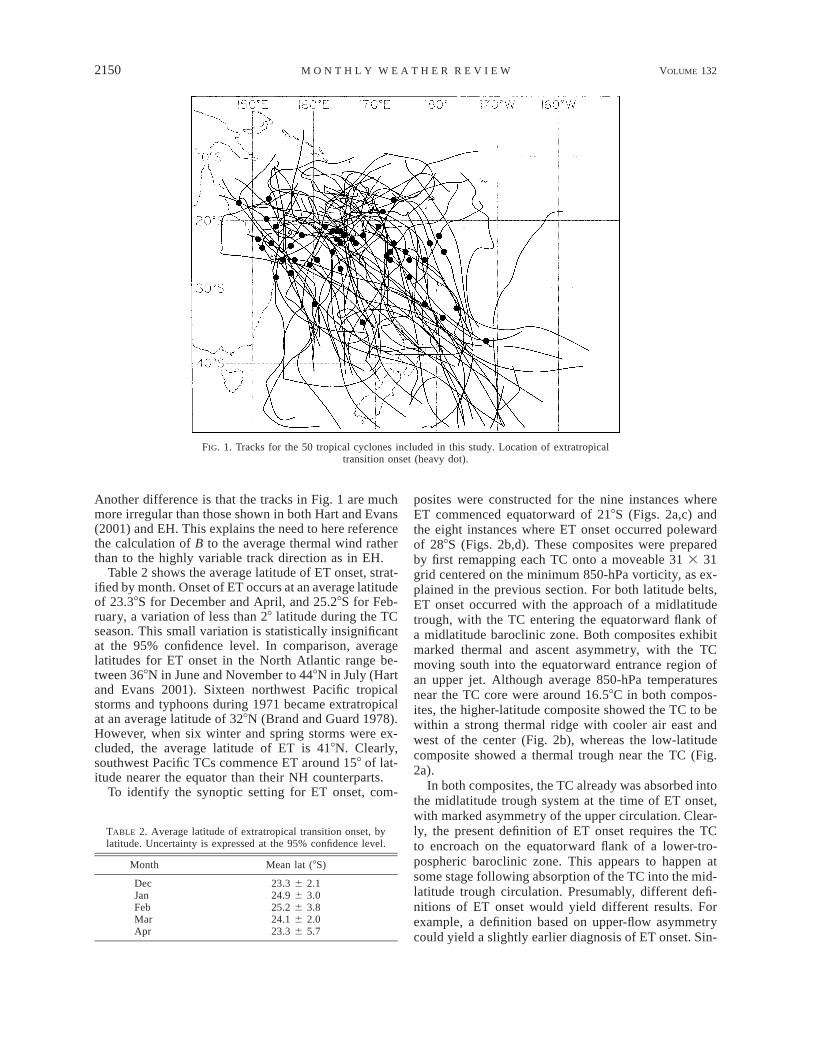
The tracks of all 50 TCs, with the diagnosed locationsof ET superimposed, are shown in Fig. 1. This showsthat ET onset most commonly occurs between 208 and308S, with an average latitude of ET onset of 24.38S.Comparison with the similar figure from EH (their Fig.1) reveals that ET onset in the southwest Pacific occursat markedly lower latitudes than in the North Atlantic,where ET occurs most frequently between 358 and 458N,as also shown by Hart and Evans (2001) using U.S.National Hurricane Center (NHC) estimates of ET onset.
2150 VOLUME 132M O N T H L Y W E A T H E R R E V I E W
FIG. 1. Tracks for the 50 tropical cyclones included in this study. Location of extratropicaltransition onset (heavy dot).
TABLE 2. Average latitude of extratropical transition onset, bylatitude. Uncertainty is expressed at the 95% confidence level.
Month Mean lat (8S)
DecJanFebMarApr
23.3 6 2.124.9 6 3.025.2 6 3.824.1 6 2.023.3 6 5.7
Another difference is that the tracks in Fig. 1 are muchmore irregular than those shown in both Hart and Evans(2001) and EH. This explains the need to here referencethe calculation of B to the average thermal wind ratherthan to the highly variable track direction as in EH.
Table 2 shows the average latitude of ET onset, strat-ified by month. Onset of ET occurs at an average latitudeof 23.38S for December and April, and 25.28S for Feb-ruary, a variation of less than 28 latitude during the TCseason. This small variation is statistically insignificantat the 95% confidence level. In comparison, averagelatitudes for ET onset in the North Atlantic range be-tween 368N in June and November to 448N in July (Hartand Evans 2001). Sixteen northwest Pacific tropicalstorms and typhoons during 1971 became extratropicalat an average latitude of 328N (Brand and Guard 1978).However, when six winter and spring storms were ex-cluded, the average latitude of ET is 418N. Clearly,southwest Pacific TCs commence ET around 158 of lat-itude nearer the equator than their NH counterparts.
To identify the synoptic setting for ET onset, com-
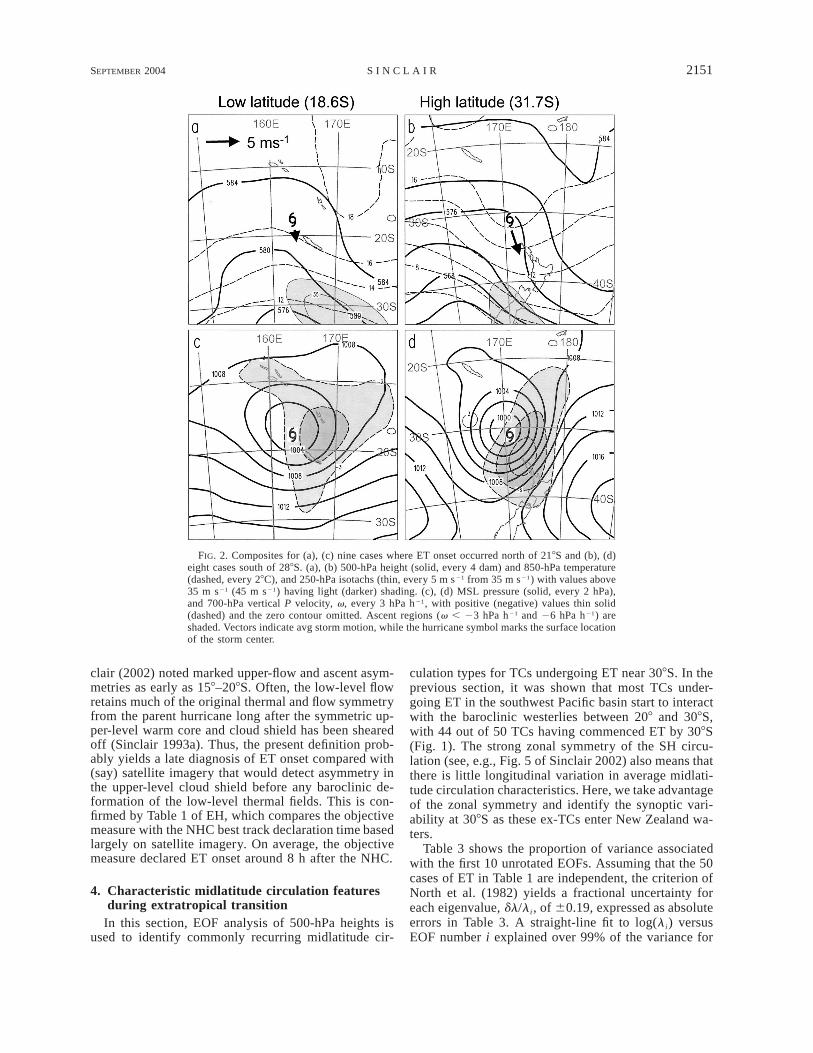
posites were constructed for the nine instances whereET commenced equatorward of 218S (Figs. 2a,c) andthe eight instances where ET onset occurred polewardof 288S (Figs. 2b,d). These composites were preparedby first remapping each TC onto a moveable 31 3 31grid centered on the minimum 850-hPa vorticity, as ex-plained in the previous section. For both latitude belts,ET onset occurred with the approach of a midlatitudetrough, with the TC entering the equatorward flank ofa midlatitude baroclinic zone. Both composites exhibitmarked thermal and ascent asymmetry, with the TCmoving south into the equatorward entrance region ofan upper jet. Although average 850-hPa temperaturesnear the TC core were around 16.58C in both compos-ites, the higher-latitude composite showed the TC to bewithin a strong thermal ridge with cooler air east andwest of the center (Fig. 2b), whereas the low-latitudecomposite showed a thermal trough near the TC (Fig.2a).
In both composites, the TC already was absorbed intothe midlatitude trough system at the time of ET onset,with marked asymmetry of the upper circulation. Clear-ly, the present definition of ET onset requires the TCto encroach on the equatorward flank of a lower-tro-pospheric baroclinic zone. This appears to happen atsome stage following absorption of the TC into the mid-latitude trough circulation. Presumably, different defi-nitions of ET onset would yield different results. Forexample, a definition based on upper-flow asymmetrycould yield a slightly earlier diagnosis of ET onset. Sin-
SEPTEMBER 2004 2151S I N C L A I R
FIG. 2. Composites for (a), (c) nine cases where ET onset occurred north of 218S and (b), (d)eight cases south of 288S. (a), (b) 500-hPa height (solid, every 4 dam) and 850-hPa temperature(dashed, every 28C), and 250-hPa isotachs (thin, every 5 m s21 from 35 m s21) with values above35 m s21 (45 m s21) having light (darker) shading. (c), (d) MSL pressure (solid, every 2 hPa),and 700-hPa vertical P velocity, v, every 3 hPa h21, with positive (negative) values thin solid(dashed) and the zero contour omitted. Ascent regions (v , 23 hPa h21 and 26 hPa h21) areshaded. Vectors indicate avg storm motion, while the hurricane symbol marks the surface locationof the storm center.
clair (2002) noted marked upper-flow and ascent asym-metries as early as 158–208S. Often, the low-level flowretains much of the original thermal and flow symmetryfrom the parent hurricane long after the symmetric up-per-level warm core and cloud shield has been shearedoff (Sinclair 1993a). Thus, the present definition prob-ably yields a late diagnosis of ET onset compared with(say) satellite imagery that would detect asymmetry inthe upper-level cloud shield before any baroclinic de-formation of the low-level thermal fields. This is con-firmed by Table 1 of EH, which compares the objectivemeasure with the NHC best track declaration time basedlargely on satellite imagery. On average, the objectivemeasure declared ET onset around 8 h after the NHC.
4. Characteristic midlatitude circulation featuresduring extratropical transition
In this section, EOF analysis of 500-hPa heights isused to identify commonly recurring midlatitude cir-
culation types for TCs undergoing ET near 308S. In theprevious section, it was shown that most TCs under-going ET in the southwest Pacific basin start to interactwith the baroclinic westerlies between 208 and 308S,with 44 out of 50 TCs having commenced ET by 308S(Fig. 1). The strong zonal symmetry of the SH circu-lation (see, e.g., Fig. 5 of Sinclair 2002) also means thatthere is little longitudinal variation in average midlati-tude circulation characteristics. Here, we take advantageof the zonal symmetry and identify the synoptic vari-ability at 308S as these ex-TCs enter New Zealand wa-ters.
Table 3 shows the proportion of variance associatedwith the first 10 unrotated EOFs. Assuming that the 50cases of ET in Table 1 are independent, the criterion ofNorth et al. (1982) yields a fractional uncertainty foreach eigenvalue, dl/li, of 60.19, expressed as absoluteerrors in Table 3. A straight-line fit to log(li) versusEOF number i explained over 99% of the variance for

2152 VOLUME 132M O N T H L Y W E A T H E R R E V I E W
TABLE 3. EOF number and % of variance associated with the first10 EOFs, with the absolute uncertainty from the test of North et al.(1982) included.
REOF H 500
12345
45.7 6 12.912.1 6 3.412.1 6 3.4
9.9 6 2.86.1 6 1.7
6789
101–10
5.2 6 1.52.0 6 0.61.8 6 0.51.7 6 0.51.5 6 0.4
98.6
EOFs 11–20, indicating these to be noise (Craddock andFlood 1969). When this logarithmic fit was extrapolatedback to the lower-numbered EOFs, just EOFs 1–8 aredistinguishable from the uncertainty in Table 3. Theseleading nonnoise EOFs explained a total of around 97%of the variance.
Each rotated PC was correlated with a small set ofselected storm properties mostly related to track andintensity change. These were 850-hPa vorticity at thestorm center (center vorticity), center vorticity change(computed as a 24-h centered difference of 850-hPacenter vorticity), U- and V-components of storm trans-lation, longitude, and the Southern Oscillation index(SOI). To identify if any of the rotated EOFs representedcirculation variations due to the annual cycle, the PCswere also correlated with a variable X 5 | M 2 2 |representing months from February (the warmestmonth), where M is month. For December, M was 0.No statistically significant correlations with X (or M)were found for any PC. Statistically significant corre-lations ( | r | . ;0.3) from this set are listed in thebottom left of the eigenvector plots. No statistically sig-nificant correlations were found for longitude, season,or SOI, for any of the PCs. Experimentation revealedthat rotated PCs were better correlated with TC motionand intensity than unrotated PCs, further justifying theuse of rotation.
a. REOF-1
The spatial eigenvector pattern for the first rotatedEOF, REOF-1, (Fig. 3a) is monopolar, with the centerof action located about 600 km south of the TC. ThisEOF, explaining 46% of the variance amongst the 50cases of ET, represents variations in the strength of thewesterlies in which the TC is embedded. Positive (neg-ative) excursions of PC-1 represent high (low) 500-hPaheights to the south. PC-1 positive patterns where PC-1 is more than 1 standard deviation above the mean arecalled high south patterns while PC-1 negative patterns(PC-1 at least 1 standard deviation below the mean) arecalled low south. There were nine cases in the high south
and seven in the low south composites. As would beexpected, this PC is highly correlated with the u com-ponent of storm translation (r 5 20.76) and with overalltranslation speed (r 5 20.60). However there was nosignificant correlation of the PC with storm intensity asmeasured by central 850-hPa vorticity.
As noted earlier, no statistically significant correla-tions were found with season (X or M), suggesting thatthe patterns in Fig. 3 can occur at any month during theTC season. In similar studies for the NH by Harr et al.(2000) and Klein (1997), the two leading eigenmodeswere found to represent seasonal variations in the cir-culation patterns and so were not considered further.Here, case-to-case variability in the strength of the west-erlies masks the much smaller SH annual cycle. Theaverage 500-hPa wind speed in the region bounded by158 and 408S and 1508E and 1508W varies only slightlyduring the SH hurricane season, from a minimum of 10m s21 in February to a maximum of 13 m s21 in April(www.cdc.noaa.gov). The variation in background 500-hPa winds between the high south and low south com-posites in Figs. 3b and 3c is clearly much larger thanthis. Experiments with the annual cycle removed causedonly slight changes to the spatial eigenvector pattern inFig. 3a and fraction of explained variance for PCs 2 and3 (Table 3). We conclude that, unlike the NH, the con-tribution to synoptic variability from the seasonal cycleis small for the southwest Pacific Ocean basin.
In the SH, the dominant mode of circulation vari-ability on time scales from intraseasonal to interannualrepresents zonally symmetric fluctuations in the strengthand location of the midlatitude westerlies (e.g., Kidson1988; Karoly 1990). Thus, it is not surprising that theleading mode of synoptic variability accompanying ETnear 308S also features variations in the backgroundheight gradient (Fig. 3). Clearly some TCs enter middlelatitudes during periods of enhanced height gradientswhile others do so during episodes of relaxed back-ground height gradients. Hartmann (1995) suggestedthat these variations in the zonal background flow resultin different evolution of baroclinic waves.
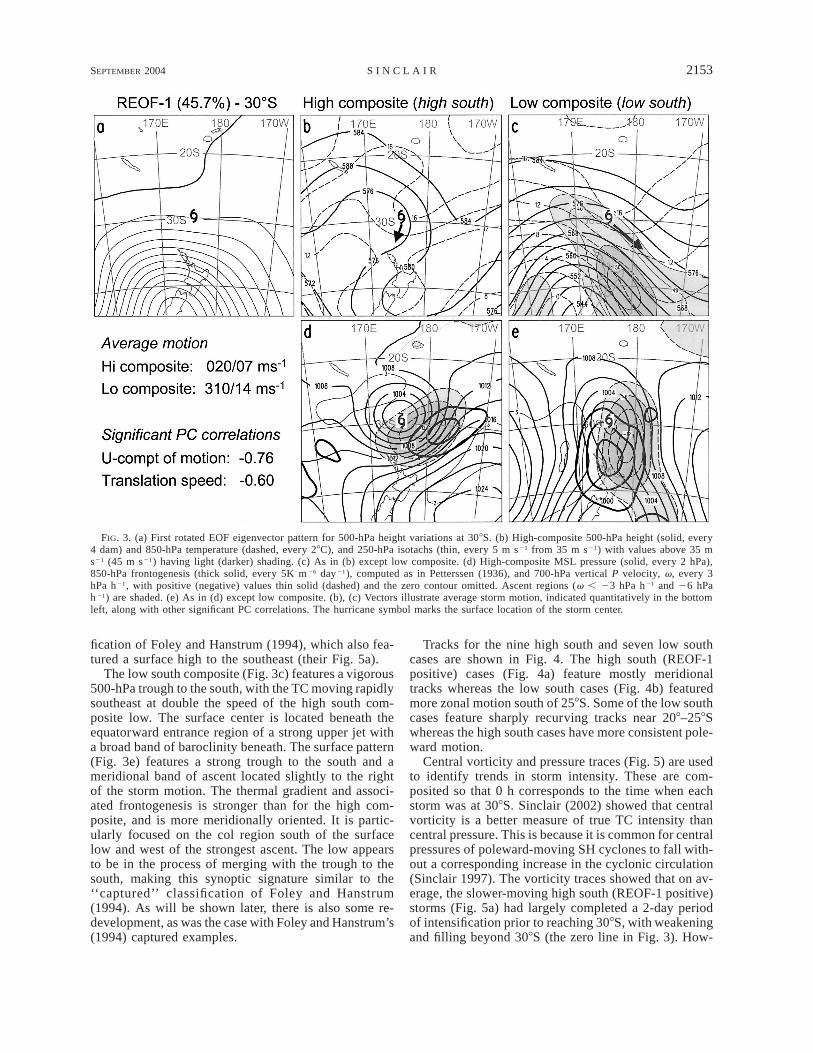
The high south composites (Figs. 3b,d) show the sur-face center moving almost due south in the region justeast of a 500-hPa cutoff low. There is a 500-hPa ridgeto the south, and the low has a warm core structure,with warmest air located just northeast of the low andcooler air wrapping about the western sector of the low,suggesting that extratropical transformation is well un-der way. Baroclinity is marked near and east of thecenter, with the suggestion of a warm front–like featurein this region. The high south surface chart (Fig. 3d)shows a strong high located southeast of the low. Stron-gest ascent is east of the low with frontogenesis east ofthe ascent within a zone of confluence within the bar-oclinic zone. The ascent maximum is located slightlyto the left of the storm motion. The high south synopticsignature in Fig. 3d is similar to the ‘‘cradled’’ classi-
SEPTEMBER 2004 2153S I N C L A I R
FIG. 3. (a) First rotated EOF eigenvector pattern for 500-hPa height variations at 308S. (b) High-composite 500-hPa height (solid, every4 dam) and 850-hPa temperature (dashed, every 28C), and 250-hPa isotachs (thin, every 5 m s21 from 35 m s21) with values above 35 ms21 (45 m s21) having light (darker) shading. (c) As in (b) except low composite. (d) High-composite MSL pressure (solid, every 2 hPa),850-hPa frontogenesis (thick solid, every 5K m26 day21), computed as in Petterssen (1936), and 700-hPa vertical P velocity, v, every 3hPa h21, with positive (negative) values thin solid (dashed) and the zero contour omitted. Ascent regions (v , 23 hPa h21 and 26 hPah21) are shaded. (e) As in (d) except low composite. (b), (c) Vectors illustrate average storm motion, indicated quantitatively in the bottomleft, along with other significant PC correlations. The hurricane symbol marks the surface location of the storm center.
fication of Foley and Hanstrum (1994), which also fea-tured a surface high to the southeast (their Fig. 5a).
The low south composite (Fig. 3c) features a vigorous500-hPa trough to the south, with the TC moving rapidlysoutheast at double the speed of the high south com-posite low. The surface center is located beneath theequatorward entrance region of a strong upper jet witha broad band of baroclinity beneath. The surface pattern(Fig. 3e) features a strong trough to the south and ameridional band of ascent located slightly to the rightof the storm motion. The thermal gradient and associ-ated frontogenesis is stronger than for the high com-posite, and is more meridionally oriented. It is partic-ularly focused on the col region south of the surfacelow and west of the strongest ascent. The low appearsto be in the process of merging with the trough to thesouth, making this synoptic signature similar to the‘‘captured’’ classification of Foley and Hanstrum(1994). As will be shown later, there is also some re-development, as was the case with Foley and Hanstrum’s(1994) captured examples.
Tracks for the nine high south and seven low southcases are shown in Fig. 4. The high south (REOF-1positive) cases (Fig. 4a) feature mostly meridionaltracks whereas the low south cases (Fig. 4b) featuredmore zonal motion south of 258S. Some of the low southcases feature sharply recurving tracks near 208–258Swhereas the high south cases have more consistent pole-ward motion.
Central vorticity and pressure traces (Fig. 5) are usedto identify trends in storm intensity. These are com-posited so that 0 h corresponds to the time when eachstorm was at 308S. Sinclair (2002) showed that centralvorticity is a better measure of true TC intensity thancentral pressure. This is because it is common for centralpressures of poleward-moving SH cyclones to fall with-out a corresponding increase in the cyclonic circulation(Sinclair 1997). The vorticity traces showed that on av-erage, the slower-moving high south (REOF-1 positive)storms (Fig. 5a) had largely completed a 2-day periodof intensification prior to reaching 308S, with weakeningand filling beyond 308S (the zero line in Fig. 3). How-

2154 VOLUME 132M O N T H L Y W E A T H E R R E V I E W
FIG. 4. Tracks of tropical cyclones having rotated PC-1 (a) more than 1 std dev above themean and (b) less than 1 std dev below the mean. Dots indicate 12-hourly positions.
ever, the low composites (Fig. 5b) exhibited progressiveintensification at 308S and in the 24 h following.
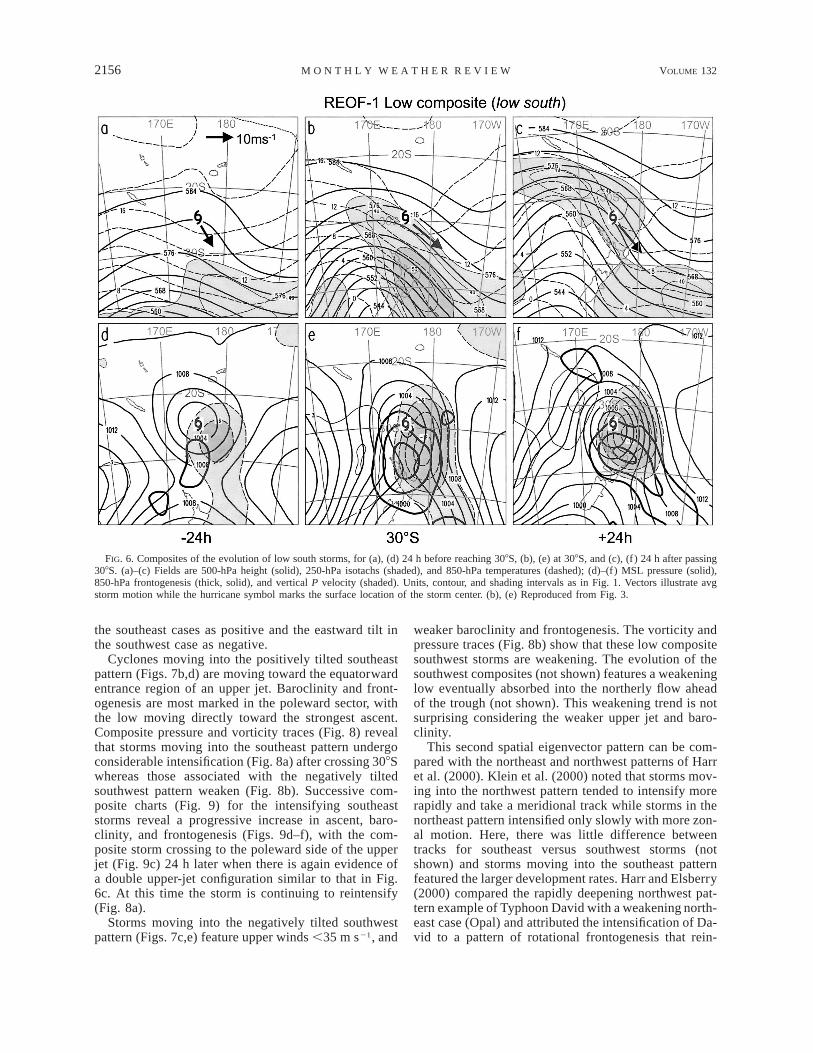
The 48-h composite evolution of the storms includedin the low composites for REOF-1 as they pass 308S isshown in Fig. 6. Twenty-four hours prior to reaching308S (Figs. 6a,d) the composite low is moving polewardtoward a 250-hPa jet stream, with a meridional band ofascent to the southeast, with strongest baroclinity southof the storm. Already, at this stage, the TC has lost itsoutflow pattern at 200 hPa (not shown), consistent withthe finding of Sinclair (2002) that southwest Pacific TCslose their symmetric outflow pattern by 258S. On reach-ing 308S, there is cooling west of the low (Fig. 6b) thatis located beneath the equatorward entrance of the upper
jet, with strengthening of the surface circulation, theascent field (Fig. 6e), and the baroclinity south of thestorm. Twenty-four hours later, the composite surfacelow crosses to poleward of the upper jet (Fig. 6c), withmarked cooling west of the low, strengthening the ther-mal gradient just west of the low and producing a secondzone of cold frontogenesis north of the center. Thestrengthening low-level circulation appears to contributeto this cold frontogenesis (Fig. 6f). It is likely that theappearance of a jet streak northwest of the center (Fig.6c) was an in situ response to this frontogenesis. Theappearance of this second jet results in a double upper-jet signature. Another factor possibly contributing to thesplit jet signature is erosion of the primary jet by com-

SEPTEMBER 2004 2155S I N C L A I R
FIG. 5. (a) High- and (b) low-composite central vorticity (solid) and central MSL pressure (dashed) time series, for rotated EOF-1. Centervorticity (1025 s21) is indicated at left and central pressure (hPa) at right, and time is hours since each storm was at 308S.
bined warm advection and diabatic heating within theascent region southeast of the low as the storm centercrosses to the poleward side of the upper jet. The ob-served ridging and weakening of the flow above thisregion is evidence of this process.
Thermal gradients in Figs. 6a–c rotate, tighten, andbecome more meridional in orientation during this 48-h period in a manner similar to that described by Harrand Elsberry (2000) for decaying western North PacificTCs that undergo reintensification as extratropical cy-clones. This evolution of surface and upper-air featuresdescribed here also mimics that of the capture eventsdescribed by Foley and Hanstrum (1994). In contrast,the evolution of the high composites (not shown), fea-tures a slow weakening (see Fig. 5a) as the compositelow progresses slowly south-southwest along the west-ern periphery of an intense high.
In summary, this first eigenvector pattern, explainingnearly half the midlatitude variability, is similar to thesubjectively derived cradled and captured classificationsdescribed by Foley and Hanstrum (1994). The presenthigh south category matches their cradled category andexhibits steady poleward movement into a region ofenvironmental easterly flow. High south cyclones usu-ally commence weakening south 308S (Fig. 5a). Thelow south, corresponding to Foley and Hanstrum’s(1994) captured classification, features a strong merid-ional cold front and low pressure to the south, withstrongest baroclinity southwest of the storm. Thesestorms typically intensify (Fig. 5b) after crossing 308Sand accelerate to the southeast, with average translationspeeds double those of the high south storms. Foley andHanstrum (1994) observed that captured storms com-
menced to accelerate to the southeast when the surfacecold front approached from the southwest to within anaverage distance of 1700 km from the surface low cen-ter. Based on previous studies (e.g., Brand and Guard1978; Hanley et al. 2001), significant interactions be-tween systems with more than 1700-km separation areunlikely.
b. REOF-2
The second rotated eigenvector pattern is bipolar (Fig.7a), with out of phase centers of action southwest andsoutheast of the surface low center. This EOF explains12% of the variance. No statistically significant corre-lations were found with track or intensity parameters.High composites exhibit a 500-hPa ridge southwest ofthe center and a trough to the south or southeast (Fig.7b) while low composites have a trough to the southwestand ridging to the southeast (Fig. 7c). By analogy withHarr et al. (2000), we refer to these cases as southeastfor the high composite and southwest for the low com-posite, the title referring to the direction of the dominantmidlatitude trough. These are the SH analogues respec-tively of Harr et al.’s northeast and northwest patternsso far as the broadscale location of the primary mid-latitude trough is concerned. Taken together, the maindifference between the high and low composites is thatthe trough in the southeast cases (high composite) tiltswestward and equatorward (analogous to positive tilt inthe NH) and eastward in the northwest cases (like neg-ative tilt in the NH). For the purpose of comparisonwith NH studies, we will refer to the westward tilt in
2156 VOLUME 132M O N T H L Y W E A T H E R R E V I E W
FIG. 6. Composites of the evolution of low south storms, for (a), (d) 24 h before reaching 308S, (b), (e) at 308S, and (c), (f) 24 h after passing308S. (a)–(c) Fields are 500-hPa height (solid), 250-hPa isotachs (shaded), and 850-hPa temperatures (dashed); (d)–(f) MSL pressure (solid),850-hPa frontogenesis (thick, solid), and vertical P velocity (shaded). Units, contour, and shading intervals as in Fig. 1. Vectors illustrate avgstorm motion while the hurricane symbol marks the surface location of the storm center. (b), (e) Reproduced from Fig. 3.
the southeast cases as positive and the eastward tilt inthe southwest case as negative.
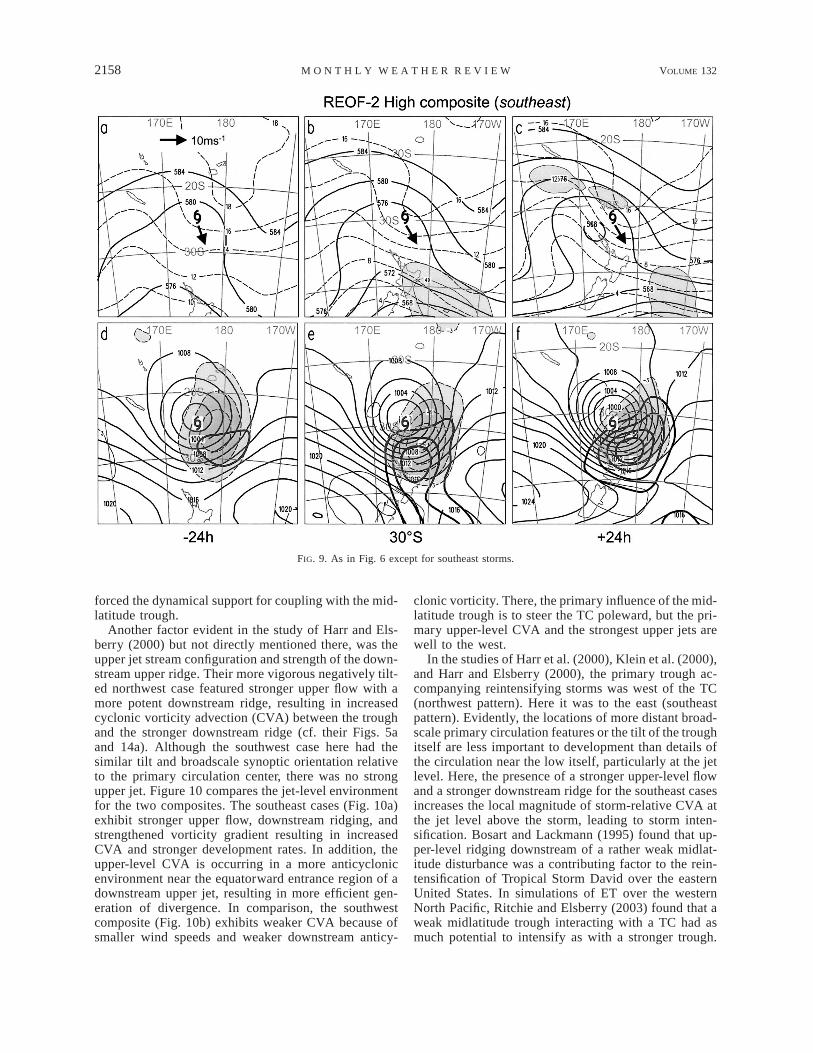
Cyclones moving into the positively tilted southeastpattern (Figs. 7b,d) are moving toward the equatorwardentrance region of an upper jet. Baroclinity and front-ogenesis are most marked in the poleward sector, withthe low moving directly toward the strongest ascent.Composite pressure and vorticity traces (Fig. 8) revealthat storms moving into the southeast pattern undergoconsiderable intensification (Fig. 8a) after crossing 308Swhereas those associated with the negatively tiltedsouthwest pattern weaken (Fig. 8b). Successive com-posite charts (Fig. 9) for the intensifying southeaststorms reveal a progressive increase in ascent, baro-clinity, and frontogenesis (Figs. 9d–f), with the com-posite storm crossing to the poleward side of the upperjet (Fig. 9c) 24 h later when there is again evidence ofa double upper-jet configuration similar to that in Fig.6c. At this time the storm is continuing to reintensify(Fig. 8a).
Storms moving into the negatively tilted southwestpattern (Figs. 7c,e) feature upper winds ,35 m s21, and
weaker baroclinity and frontogenesis. The vorticity andpressure traces (Fig. 8b) show that these low compositesouthwest storms are weakening. The evolution of thesouthwest composites (not shown) features a weakeninglow eventually absorbed into the northerly flow aheadof the trough (not shown). This weakening trend is notsurprising considering the weaker upper jet and baro-clinity.
This second spatial eigenvector pattern can be com-pared with the northeast and northwest patterns of Harret al. (2000). Klein et al. (2000) noted that storms mov-ing into the northwest pattern tended to intensify morerapidly and take a meridional track while storms in thenortheast pattern intensified only slowly with more zon-al motion. Here, there was little difference betweentracks for southeast versus southwest storms (notshown) and storms moving into the southeast patternfeatured the larger development rates. Harr and Elsberry(2000) compared the rapidly deepening northwest pat-tern example of Typhoon David with a weakening north-east case (Opal) and attributed the intensification of Da-vid to a pattern of rotational frontogenesis that rein-

SEPTEMBER 2004 2157S I N C L A I R
FIG. 7. As in Fig. 3 except for second rotated EOF eigenvector pattern.
FIG. 8. As in Fig. 5 except for rotated EOF-2.
2158 VOLUME 132M O N T H L Y W E A T H E R R E V I E W
FIG. 9. As in Fig. 6 except for southeast storms.
forced the dynamical support for coupling with the mid-latitude trough.
Another factor evident in the study of Harr and Els-berry (2000) but not directly mentioned there, was theupper jet stream configuration and strength of the down-stream upper ridge. Their more vigorous negatively tilt-ed northwest case featured stronger upper flow with amore potent downstream ridge, resulting in increasedcyclonic vorticity advection (CVA) between the troughand the stronger downstream ridge (cf. their Figs. 5aand 14a). Although the southwest case here had thesimilar tilt and broadscale synoptic orientation relativeto the primary circulation center, there was no strongupper jet. Figure 10 compares the jet-level environmentfor the two composites. The southeast cases (Fig. 10a)exhibit stronger upper flow, downstream ridging, andstrengthened vorticity gradient resulting in increasedCVA and stronger development rates. In addition, theupper-level CVA is occurring in a more anticyclonicenvironment near the equatorward entrance region of adownstream upper jet, resulting in more efficient gen-eration of divergence. In comparison, the southwestcomposite (Fig. 10b) exhibits weaker CVA because ofsmaller wind speeds and weaker downstream anticy-
clonic vorticity. There, the primary influence of the mid-latitude trough is to steer the TC poleward, but the pri-mary upper-level CVA and the strongest upper jets arewell to the west.
In the studies of Harr et al. (2000), Klein et al. (2000),and Harr and Elsberry (2000), the primary trough ac-companying reintensifying storms was west of the TC(northwest pattern). Here it was to the east (southeastpattern). Evidently, the locations of more distant broad-scale primary circulation features or the tilt of the troughitself are less important to development than details ofthe circulation near the low itself, particularly at the jetlevel. Here, the presence of a stronger upper-level flowand a stronger downstream ridge for the southeast casesincreases the local magnitude of storm-relative CVA atthe jet level above the storm, leading to storm inten-sification. Bosart and Lackmann (1995) found that up-per-level ridging downstream of a rather weak midlat-itude disturbance was a contributing factor to the rein-tensification of Tropical Storm David over the easternUnited States. In simulations of ET over the westernNorth Pacific, Ritchie and Elsberry (2003) found that aweak midlatitude trough interacting with a TC had asmuch potential to intensify as with a stronger trough.

SEPTEMBER 2004 2159S I N C L A I R
FIG. 10. Fields at 250 hPa, for (a) southeast cases and (b) southwest cases. Heights (solid, every 10 dam), storm-relative winds, V 2 C(arrows), isotachs (values 30 and 35 m s21 shaded), relative vorticity [every 2 3 1025 s21, values . 0 (thin solid), , 0 (dashed), and thezero contour (solid)], and cyclonic (negative) values of storm-relative vorticity advection by the storm-relative wind (thick solid, every 43 1025 s21 day21). The hurricane symbol marks the surface location of the storm center while the heavy vector indicates avg storm motion.
Addition of the TC to the simulations resulted in a stron-ger jet outflow and enhanced upper-level divergence. InFig. 10a, the more rapid development of the southeastcases also appears to be related to a more favorableenvironment for upper-level divergence near the equa-torward entrance region of the upper jet (Fig. 7b). Thisis also similar to the favorable distant interaction de-scribed by Hanley et al. (2001), where an upper PVmaximum approaches to within 1000 km from the westand development occurs under the equatorward entranceregion of the upper jet in such a way that the TC andthe upper jet mutually reinforce each other.
c. REOF-3
Since REOFs-2 and 3 each explain a similar amountof variance (Table 3), the third rotated eigenvector pat-tern and associated high and low composites are shown(Fig. 11) for completeness. This third eigenvector pat-tern represents fluctuations in the strength of the 500-hPa vortex, with high composites corresponding to astronger 500-hPa vortex (Fig. 11a) and a stronger sur-face low (Fig. 11d). Not unexpectedly, the associatedPC is correlated with central vorticity. The stronger highcomposites feature a higher degree of cool air circula-tion into the northwest sector of the storm (Fig. 11b),but with weaker overall baroclinity. Ascent and front-ogenesis magnitude appear to be similar for the twocomposites (Figs. 11d,e).
Some experimentation was performed to determinethe robustness of the patterns shown in this section.Randomly removing one or two cases from the set ofstorms had very little impact on the synoptic signaturessuggested in Figs. 3, 6, 7, 10, and 11. Removal of theannual cycle also had minimal impact, as noted earlier.For these experiments, the only impact was that theorder of patterns 2 and 3 (in terms of explained variance)was swapped in some cases. Such degeneracy betweenpatterns can imply a possible relationship between pat-terns, often a progression from one to the other. This isprecluded here, since the PCs are uncorrelated, makingthe storms represented by different EOFs mutually ex-clusive.
5. Extratropical reintensification
During the first stage (transformation) of ET, the TCundergoes structure changes as it interacts with the bar-oclinic westerlies. These changes include loss of theupper-level symmetric TC warm core, development ofa thermal advection dipole, and asymmetric ascent fieldsand eventual appearance of two regions of lower-tro-pospheric frontogenesis. These changes are describedin the mean by Sinclair (2002) for the southwest Pacificbasin and are the expected result of a vortex movinginto and interacting with a baroclinic flow field (e.g.,Doswell 1984). While some TCs progressively weakenas they advance into middle latitudes, others undergo a

2160 VOLUME 132M O N T H L Y W E A T H E R R E V I E W
FIG. 11. As in Fig. 3 except for third rotated EOF eigenvector pattern.
period of extratropical regeneration, which typically oc-curs after a period of weakening as the decaying TCmoves into middle latitudes.
Around 80% of the storms included in this study un-derwent one or more transient periods of restrength-ening of central cyclonic vorticity by at least 2 3 1025
s21 following peak intensity in the Tropics. In section5b, we examine characteristic synoptic signatures thataccompany these redevelopment episodes. Almost allthese cases of reintensification occurred near or pole-ward of 308S, after the TC had acquired a baroclinicstructure. Stronger reintensification, where there was astrengthening of central vorticity of more than 4 3 1025
s21 that lasted at least 24 h, occurred in 35% of cases.Analysis quality and data coverage clearly limit the ac-curacy of these statistics for storm reintensification. Fur-thermore, the assessment of whether or not a TC rem-nant has undergone regeneration is often subjective andvaries depending on how reintensification is defined.Hart and Evans (2001) defined reintensification as whena cyclone deepens beyond to its pretransition intensity.Such a pressure-based definition is inappropriate for theSH because large central pressure falls typically occurwhen a SH cyclone moves toward a lower backgroundpressure, regardless of whether or not surface windsaround the cyclone have increased (Sinclair 1997).
Klein et al. (2000) noted that the potential for rein-tensification was dependent on the details of the mid-latitude circulation and the geometry of the interaction.Sinclair (1993a) showed that the impetus for intensitychange comes from interaction with migratory midlat-itude disturbances in the westerlies. These interactionscan weaken or strengthen the TC remnants, dependingon the geometry of the interaction, the nature of themidlatitude trough, and the properties of the TC rem-nant.
In this section, we first identify the important dynam-ical and thermodynamic factors that modulate intensitychange for southwest Pacific TCs entering middle lat-itudes. Then, episodes of midlatitude regeneration aresingled out from the time series of central vorticity fromeach storm. Characteristic synoptic signatures that ac-company regeneration are first identified, again bymeans of EOF analysis. Finally, a smaller set of morevigorous regeneration episodes is used to identify theupper-air signatures leading to more significant regen-eration.
a. Dynamic and thermodynamic factors that modulatestorm intensity
In this section, we identify factors that are moststrongly correlated with variations in storm intensity as
SEPTEMBER 2004 2161S I N C L A I R
TCs move into middle latitudes. The goal is to diagnosewhich factors most strongly modulate surface intensitychanges. A set of thermodynamic and dynamic quan-tities is obtained for each track point and each quantityregressed against the set of central vorticity and pressuretendencies at each track point. The quantities used areobtained from Petterssen–Sutcliffe development theory(Petterssen 1956) as extended by Zwack and Okossi(1986). Similar diagnostics have been applied by Lupoet al. (1992), Rausch and Smith (1996), and Parsonsand Smith (2004) to relate surface development to dy-namic and thermodynamic forcings at various levels forcases of cyclone development near North America. Ourapproach follows Rausch and Smith (1996) except herewe reformulate in storm-following coordinates in orderto separate the advective effects associated with thetranslation of the storm system from the processes thatforce storm intensification. This is also required for con-sistency with the method used to compute central pres-sure and vorticity tendency following the moving TCas tracked.
As proposed by Johnson and Downey (1975) andapplied by Sinclair and Elsberry (1986) and Sinclairand Cong (1992), the governing equation for the prop-erty of interest is expressed in the quasi-Lagrangian(QL) framework moving with velocity C, by replacingthe Eulerian local rate of change, ]/]t by d/dt 2 C · =,where d/dt is the change following the storm. Here,translation velocities, C were obtained as centered dif-ferences from the TC track coordinates. Storm-relativewinds, V 2 C, are used in thermal and vorticity ad-vection terms. Sinclair and Revell (2000) found that thestorm-relative form of upper-level CVA, 2(V 2 C) ·=z, was markedly better correlated with central pressuretendency than the usual Eulerian form, for 40 cases ofSH cyclogenesis.
From the hydrostatic equation and the thermodynamicequation in QL coordinates, a relation for the thicknesstendency following the storm can be obtained as
pbd(F 2 F ) 5 R [2(V 2 C) · =T ] d lnpp b Edt p
TADV
p pb b Q1 R Sv d lnp 1 R d lnp,E E cpp p
ADIA LATH
(2)
where Fb is the geopotential at pressure pb near thebottom of the atmosphere (here 1000 hPa), Fp is thatat pressure p, S 5 2T] lnu/]p is a static stability pa-rameter, and Q/cp is the diabatic heating rate. Diabaticheating (LATH) is assumed to arise from release oflatent heat of condensation during resolvable saturatedascent and is computed following Sinclair (1993b). Pre-cipitation is parameterized to commence for relative hu-midity above 60% to compensate for the averaging and
nonrepresentativeness inherent in coarse-resolutiongridpoint data.
To obtain an approximate expression for the geo-potential tendency at pressure p, dFp/dt, we replacedzp/dt in the vorticity equation by its geostrophic equiv-alent, d/dt(¹2Fp/ f ) and take the inverse Laplacian, ¹22,of both sides and multiply by f to obtain
dFp 22¹ [2 f (V 2 C) · =(z 1 f )]ødt
VADV
221 ¹ [2 f (z 1 f )= · V], (3)
VDIV
where the smaller vertical advection and twisting termshave been neglected. In a similar formulation, Parsonsand Smith (2004) found these to be an order of mag-nitude smaller than other vorticity equation terms. The‘‘inverse Laplacian,’’ ¹22, is obtained as follows. Thevalue, c, of ¹22x for some term x, is obtained by solv-ing ¹2c 5 x using the method of sequential overrelax-ation (Haltiner and Williams 1980, p. 159) with zeroboundary conditions. Although this is strictly a double-space integral, we here use the ¹22 symbology, since,mathematically, this is the inverse of the Laplacian op-erator. Substituting (3) into (2) and rearranging, we ob-tain
1000dF1000 ø 2R [2(V 2 C) · =T ] d lnpEdt p
DH 2TADV
1000 1000 Q2 R Sv d lnp 2 d lnpE R E cp pp
2LATH2ADIA
221 1 f )]¹ [2 f (V 2 C) · =(z p
VADV
221 . (4)¹ [2 f (z 1 f )= · V]p
VDIV
This shows that 1000-hPa height falls (rises) occurin conjunction with net column-averaged warm (cold)advection, sinking (rising) motion, diabatic heating(cooling), plus cyclonic (anticyclonic) vorticity advec-tion and divergence (convergence) at the top of the col-umn. Friction and surface fluxes of heat and moistureare not included. Lupo et al. (1992) and Rausch andSmith (1996) found the direct contribution from surfaceexchanges to be small compared with other terms in (3),even for cyclones over the Gulf Stream or over land.Formulating (3) in terms of height rather than vorticitytendency avoids the necessity of applying a Laplacianto the thermodynamics terms in (2), reducing noise. Ver-tical integrals were obtained using cubic splines while

2162 VOLUME 132M O N T H L Y W E A T H E R R E V I E W
TABLE 4. Correlation of various terms with dF1000/dt. Here, VSUM is the sum of VADV 1 VDIV and NPTS is the number of track pointsin each latitude band used to compute the correlation coefficients. Only correlation coefficients significantly different from zero at the 95%level are shown.
Lat ¹THK TADV ADIA LATH VADV VDIV VSUM NPTS
158S208S258S308S358S408S458S
——
20.3020.2320.24
—20.47
—20.22
—————
0.280.33—
0.340.200.530.56
20.3020.31
—20.27
—20.4720.54
0.260.290.280.380.280.490.71
—20.2420.1920.18
——
20.48
0.290.150.240.410.410.630.74
193247138106100
6230
tendency terms were obtained as centered time differ-ences, accurate to O(Dt2) [as compared with O(Dt) forforward or backward differencing]. Forcing terms onthe rhs of (4) were averaged in time using a 1–2–1 filter.These calculations were performed for all track points(except the first and last) for all 50 TCs. Correlationsbetween the 1000-hPa height tendency, DH, and theother variables on the rhs of (4) were determined in sixlatitude bands and displayed in Table 4.
Results show that falling 1000-hPa heights (and sur-face pressures) are correlated with adiabatic cooling(ascent), latent heating, and upper-level cyclonic vor-ticity advection and divergence, as expected, with cor-relations increasing as the storms acquire extratropicalcharacteristics south of 308S. The term most stronglycorrelated with fluctuations in storm 1000-hPa heights,is upper-level QL vorticity advection. A more detailedanalysis of the relation between surface pressure changeand upper-level vorticity advection for various levels ofthe atmosphere revealed that the strongest correlationsare always found at the jet level. North of 208S, cor-relations are strongest at 200 hPa, at 250 hPa for 258and 308S, and at 300 hPa poleward of 358S. Table 4shows these terms for just 300 hPa. However, the sumof the two vorticity terms (VSUM) modulates surfacepressure changes even more than CVA alone. This sum(of the advection of vorticity by the storm-relative flowand the divergence term) represents the net accumula-tion of absolute vorticity above the moving storm. Fromthis simple correlation analysis, it is concluded that netimport of cyclonic vorticity at the jet level above thestorm is the synoptic-scale process having the most im-pact on surface development. This import of cyclonicvorticity occurs with the approach of an upper trough.
b. Synoptic signature of reintensifying cyclones
In the second part of this section, we use EOF analysisto identify characteristic synoptic signatures that ac-company reintensification. A TC remnant is deemed tobe reintensifying if the central 850-hPa vorticity falls(i.e., became more cyclonic) by more than 2 3 1025
s21 over a 24-h period following a period of weakening.Only intensification in the region poleward of 258S wasconsidered. The central vorticity change criterion wasa trade-off between identifying events that were strongly
reintensifying on the one hand and achieving a largeenough count for statistical analysis on the other. Somestorms decayed monotonically upon entering middle lat-itudes so were not candidates for regeneration. However,others had one or more transient or sustained periodsof redevelopment south of 258S, so were counted aspreviously. Forty-three episodes of modest extratropicalredevelopment were found in this way. Rotated EOFanalysis was performed on the 500-hPa fields accom-panying these reintensification events in order to iden-tify preferred synoptic signatures.
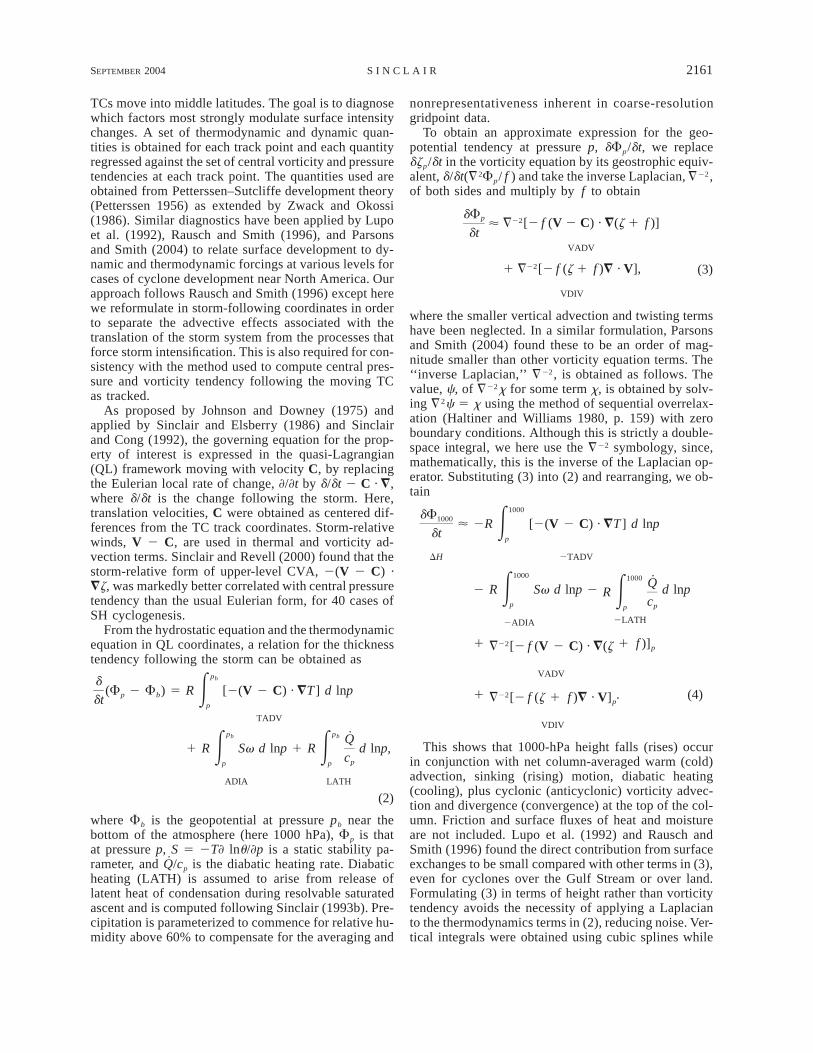
Figure 12 shows the spatial eigenvector pattern andthe associated high and low composites for the firstrotated EOF, which explains 61% of the case-to-casevariability. In order to obtain enough cases for mean-ingful averaging, the high- and low-composite fieldswere obtained by averaging cases having PC amplitudemore than 0.7 standard deviations above and below thetemporal mean (rather than 1 standard deviation as be-fore), resulting in nine included in the high compositesand seven in the low composites. The principal modeof case-to-case variation involves fluctuations in 500-hPa height southwest of the center (Fig. 12a). High com-posites (Figs. 12b,d) feature a closed 500-hPa circula-tion and marked low-tropospheric baroclinity, particu-larly southeast of the storm, where considerable front-ogenesis is occurring. The composite thermal gradientnorth and west of the low is weak. The surface low ismoving due south beneath the equatorward entrance re-gion of an upper jet and there is a surface high to thesouth.
The low composite (Figs. 12c,e) features the surfacelow moving more rapidly southeast beneath the pole-ward exit region of a stronger upper jet. Thermal andfrontogenesis fields show two regions of frontogenesis(Fig. 12e)—one east of the center within strong warmadvection and the other west and northwest of the centerwithin cold advection (Fig. 12c). These suggest a struc-ture similar to that of the Norwegian cyclone model,with distinct cold and warm fronts separated by a narrowwarm sector.
Because the PC associated with the eigenvector pat-tern in Fig. 12 is highly correlated with latitude (r 50.72), this variability is related to how far into the mid-dle latitudes the TC has advanced. The nine intensifi-
SEPTEMBER 2004 2163S I N C L A I R
FIG. 12. As in Fig. 3 except for first rotated EOF eigenvector pattern for reintensifying storms. See text for more information.
cation episodes included in the high composites wereall found between 258 and 338S while the seven low-composite contributors were between 328 and 488S. ThePC was also correlated with motion (r 5 20.62), withstorms comprising the high composites having an av-erage motion of 5 m s21 toward the south while the lowcomposites that had advanced deeper into the baroclinicwesterlies moved southeast at 13 m s21. The higher-latitude low composites also featured larger intensifi-cation rates as measured by central vorticity tendency.
Both high and low composites in Fig. 12 exhibit fa-vorable coupling with the upper jet, suggesting this tobe a key factor for reintensification. This is consistentwith the previous correlation analysis, which showedthat TC intensity changes were closely related to netimport and export of vorticity at the jet stream level.The lower-latitude low composites (Figs. 12b,d) are cou-pled with the equatorward entrance region of the upperjet and feature strong warm fronts and weak cold fronts.Reintensifying TCs further south move more rapidlysoutheast beneath the poleward exit region of a strongupper jet and exhibit both cold and warm fronts (Figs.12c,e). Sometimes, the upstream jet in Fig. 12c origi-nates as a separate migratory feature. For example, re-
generation of Cyclone Patsy was triggered by a jet thatpropagated in from the west (Sinclair 1993a). Sinclair(2002) showed that of the cases that featured an up-stream jet, about half involved a separate jet migratingfrom the west while the other half involved an in situdevelopment in response to frontogenesis northwest ofthe center.
c. Rapid regeneration cases
Here, the set of the five most vigorous extratropicalregeneration episodes is examined to identify the varietyof synoptic signatures that accompany rapid reintensi-fication and to determine the associated physical pro-cesses. These rapidly intensifying cases each have in-creases in cyclonic vorticity larger than 5 3 1025 s21
in 24 h.Composites of terms in (4) for these five cases were
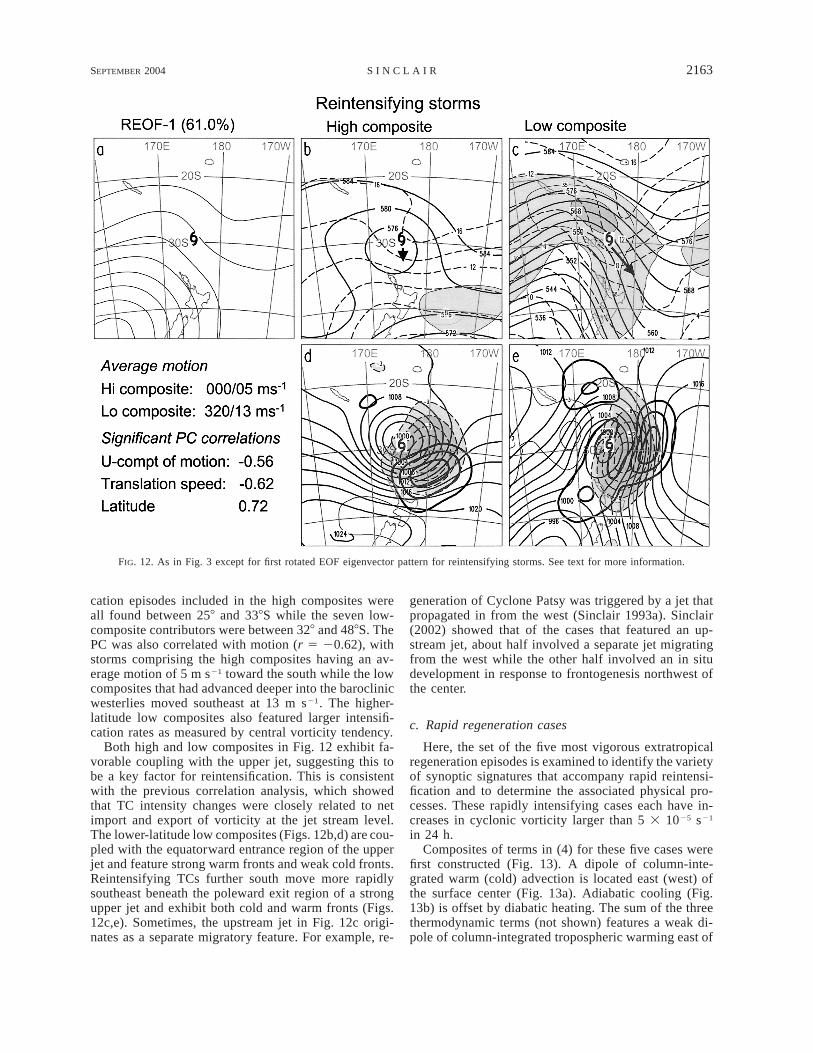
first constructed (Fig. 13). A dipole of column-inte-grated warm (cold) advection is located east (west) ofthe surface center (Fig. 13a). Adiabatic cooling (Fig.13b) is offset by diabatic heating. The sum of the threethermodynamic terms (not shown) features a weak di-pole of column-integrated tropospheric warming east of
2164 VOLUME 132M O N T H L Y W E A T H E R R E V I E W
FIG. 13. Composite plots of terms from Eq. (4) (units [ dam day21) over a circular domain of radius 158 lat for strongly reintensifyingstorms, with positive values (thin solid), negative (dashed), and the zero contour (thicker solid). (a) TADV, (b) ADIA, (c) LATH, (d) VADV,(e) VDIV, and (f ) the sum of VADV1VDIV. (a)–(c) For thermodynamic equation terms positive values contribute to thickness increases(warming), but to 1000-hPa height falls. For vorticity terms positive (negative) values contribute to 1000-hPa height rises (falls). (d)–(f )The 300-hPa height (solid, every 10 dam). The surface center is marked with a !. See text for more details.
the composite low and cooling west of it. The 300-hPavorticity terms (Figs. 13d–f) show CVA east of thetrough almost offset by the divergence term. However,the sum of the vorticity terms, ¹22{2=[(V 2 C) · (z1 f )]}, representing 1000-hPa height changes from netaccumulation of 300-hPa vorticity above the movingstorm, shows a dipole of height falls in the trough andrises a little upstream from the ridge, consistent withthe thermal terms. These height changes have the effectof amplifying the upper wave and decreasing its wave-length, which increases the CVA and divergence aloft.Composites constructed from the larger sample of 43redevelopment episodes used for the EOF analysis inFig. 12 yielded qualitatively similar results to Fig. 13except the magnitude of terms was around half that inFig. 13.
Individual charts at 250 hPa for these five cases forthe period leading up to and including each redevel-opment episode are shown in Fig. 14. These rapid cy-clogenesis events occurred between 278 and 398S, at an
average latitude of 338S. At the time of maximum cy-clogenesis (bottom row), each storm lay beneath thesuperposition of the poleward exit region of an upstreamjet and the equatorward entrance region of a downstreamjet. Uccellini and Kocin (1987) find this to be a regionof enhanced upper-level divergence and favored sig-nature for rapid cyclogenesis. This double upper-jet sig-nature is most strongly evident for Cyclone Bernie,which also featured the strongest redevelopment rate inthe entire sample of 50 storms. Bernie’s central vorticitybecame more cyclonic, changing from 28.8 to 214.73 1025 s21 over the 24-h period shown in Fig. 14.Details of the upper-jet evolution differ for each case.For Cyclones Sina and Bernie, the storm crosses fromthe warm side to the cold side of the strengthening up-stream jet. For Cyclones Paul and Monica, the surfacecyclone is more or less located beneath the equatorwardentrance region of the downstream jet, with the upstreamjet only evident at the time of maximum redevelopment.Cyclone Bola is located beneath the double signature

SEPTEMBER 2004 2165S I N C L A I R
FIG. 14. Plots of 250-hPa height (solid, every 15 dam) and isotachs (every 10 m s21 from 30 m s21, values .40 and 50 m s21 shaded)over a circular domain of radius 208 lat for (top row) 24 h and (middle row) 12 h before max intensification, and (bottom row) at the timeof max intensification for the five most rapidly redeveloping storms. The surface center is marked with a !. See text for more detail.
throughout the period, with both jets slowly strength-ening. Cyclogenesis occurs as the storm and the up-stream jet migrate closer to the downstream jet. Eachcase also features an increase in upper-wave amplitude,consistent with the composite height changes in Fig.13f.
d. Weakening cases
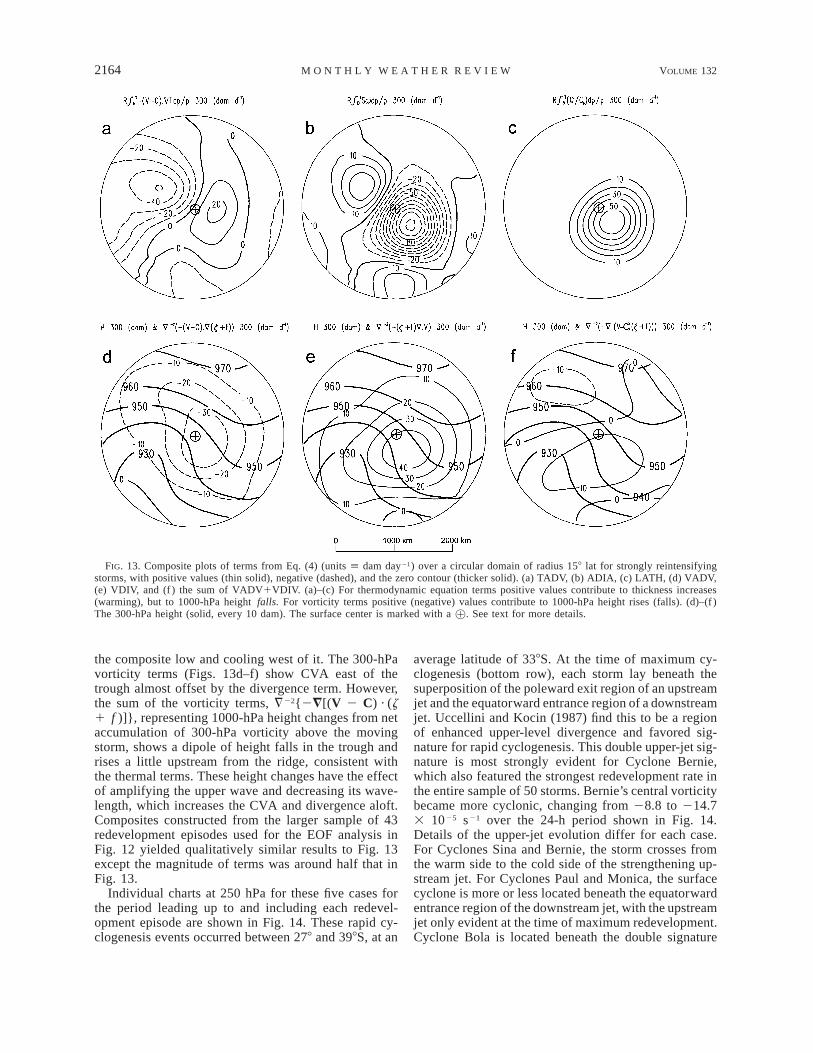
As a counterpoint, cases featuring a weakening sur-face circulation were also selected for composite anal-ysis. A total of 30 times where central vorticity becameless cyclonic at a rate exceeding 3 3 1025 s21 per daywere found. As in Fig. 13, terms in (4) are composited(Fig. 15). At first sight, results are similar to those forthe developing cases in Fig. 13 except terms are con-siderably smaller in magnitude. Thermodynamic termsagain feature a thermal advection dipole, adiabatic as-cent offset by diabatic heating, while vorticity terms areCVA offset by the divergence term. Here, however, theupper trough is more directly over the decaying storms.This results in CVA east of the surface center ratherthan directly above it as in Fig. 13. However, the fun-damental difference lies in the sum of the two 300-hPa
vorticity terms, which yield a net height increase in thetrough. This results in flattening of the upper wave,reducing CVA and divergence.
6. Summary and conclusions
This second of two papers on extratropical transitionin the southwest Pacific Ocean basin has identified char-acteristic midlatitude circulation types for 50 cases ofextratropical transition near 308S by means of EOF anal-ysis. The first EOF, explaining nearly half of the storm-to-storm variance, represents variations in the strengthof the westerlies in which the TC is embedded. As wouldbe expected, this PC is highly correlated with the ucomponent of storm translation. Tracks for the nine TCswhere the PC was .1 standard deviation above themean are mostly meridional whereas the seven low-composite cases featured more rapid zonal motion. Thehigh composite is similar to the ‘‘cradled’’ classificationof Foley and Hanstrum (1994), where the TC is cradledin a surface high to the southeast while the low com-posite features a vigorous 500-hPa trough to the south,with the TC moving rapidly southeast, like their ‘‘cap-ture’’ cases. The low composites had just completed a
2166 VOLUME 132M O N T H L Y W E A T H E R R E V I E W
FIG. 15. As in Fig. 13 except for rapidly weakening storms.
period of intensification prior to reaching 308S, and fea-tured stronger upper jets and vertical wind shear.
The second rotated EOF reflects out-of-phase 500-hPa height variations southwest and southeast of thestorm. Cyclones embedded in a circulation featuring adominant trough to the southeast are located beneaththe equatorward entrance region of an upper jet andundergo considerable reintensification because of stron-ger upper-level CVA and a stronger downstream ridge.Where the dominant trough was to the southwest, themain impact was to steer the TC poleward without in-tensification. The third rotated EOF, explaining a similaramount of variant to REOF-2, expressed variations instorm intensity.
It is interesting that both REOF-1 and REOF-3 weresignificantly correlated with the environment (REOF-1through steering and REOF-3 through intensity) whileREOF-2 is uncorrelated. It is possible that REOF-2 isrelated to the strength of the interaction between thestorm and its environment. Evidence for this is foundin the fact that the positively tilted high composites ofREOF-2 developed after crossing 308S while the neg-ative composites weakened. Development for the high
composites appeared to be related to a more favorableenvironment for upper-level divergence near the equa-torward entrance region of an upper jet. The configu-ration was similar to the favorable distant interactiondescribed by Hanley et al. (2001), where an upper troughapproaches to within 1000 km of the TC remnant. De-velopment occurs under the equatorward entrance re-gion of the upper jet in such a way that the TC and theupper jet mutually reinforce each other.
A climatology of ET onset was also performed, usingthe objective diagnostic of Evans and Hart (2003). Thisshowed that ET onset occurred at an average latitude238–258S, with minimal seasonal variation. In compar-ison, NH TCs commence ET at an average latitude of358–458N, with a marked seasonal variation. At the timeof ET onset, the TCs were already absorbed into anupper-level midlatitude trough and were approachingthe equatorward flank of a midlatitude low-level baro-clinic zone.
Finally, factors responsible for extratropical regen-eration were explored. Several studies (e.g., Palmen1958; DiMego and Bosart 1982a,b; Bosart and Dean1991; Sinclair 1993a) have shown that the approach of

SEPTEMBER 2004 2167S I N C L A I R
an upper-level midlatitude trough from the west is nec-essary for reintensification as an extratropical cyclone.Regeneration of TC remnants has been likened to aPetterssen Type B cyclogenesis, where development oc-curs when CVA ahead of a strong upper-level troughmoves over a region of low-level warm advection (Pet-terssen and Smebye 1971). Factors that modulate sur-face intensity poleward of 258S were identified for the50 storms. Of several diagnostic quantities, CVA at thejet level was the quantity most strongly correlated withsurface development, confirming a role for jet-levelCVA. Characteristic synoptic signatures for 43 episodesof extratropical reintensification revealed that reinten-sification occurred when the surface cyclone was locatedbeneath the equatorward entrance region of an upper jetfor storms between 288 and 348S, and beneath the pole-ward exit region for storms farther south. The stormsexhibiting particularly strong redevelopment each fea-tured a strong double upper-jet signature formed by thecombination of the upstream jet exit region and thedownstream jet entrance region directly above the stormat the time of strongest intensification. Uccellini andKocin (1987) found this to be a favorable region forrapid extratropical cyclogenesis. Sinclair (1993b) andHanley (1999) found a similar double-jet signature aloftabove the storm at the time of reintensification of a TCas an extratropical cyclone. Here, the composites forredeveloping storms revealed that strongest storm-rel-ative upper-level CVA was directly above the surfacelow, with net vorticity fluxes resulting in rising heightsin the upper ridge and falling heights in the trough. Forweakening storms, CVA was east of the storm, with thenet vorticity changes weakening the upper trough.
This study has shown that net import of cyclonicvorticity at the jet level is the primary factor controllingintensity variation of SH TCs undergoing ET. Presum-ably, this is because low inertial stability in the hurricaneoutflow layer renders the upper troposphere susceptibleto changes in divergence above the surface low in re-sponse to the approach of an upper disturbance. How-ever, as Hanley et al. (2001) point out, differences be-tween approaching disturbances that lead to TC inten-sification and those that do not are often rather subtle,accounting for the difficulty experienced forecasting TCintensity change as a midlatitude trough approaches.This difficulty is compounded in the SH by a lack ofobservations. As Hanley et al. (2001) observe, there aresome situations where the upper jet appears to be forcingdevelopment and others where the upper jets appear tobe the result of the TC–trough interaction. Clearly, moreobservations and improved analyses near the jet streamlevel might improve forecasts of ET. However, numer-ical models probably offer the best means of determin-ing cause and effect during ET.
Acknowledgments. The southwest Pacific tropical cy-clone database was kindly provided to NIWA byMetService (formerly New Zealand Meteorological Ser-
vice) while gridded atmospheric analyses were providedby NCEP. The author is grateful to three anonymousreviewers who provided comments that improved themanuscript. This research was funded by the New Zea-land Foundation for Research, Science and Technologyunder Contract CO1831.
REFERENCES
Bosart, L. F., and D. B. Dean, 1991: The Agnes rainstorm of June1972: Surface feature evolution culminating in inland storm re-development. Wea. Forecasting, 6, 515–537.
——, and G. M. Lackmann, 1995: Postlandfall tropical cyclone rein-tensification in a weakly baroclinic environment: A case studyof Hurricane David (September 1979). Mon. Wea. Rev., 123,3268–3291.
Brand, S., and C. P. Guard, 1978: Extratropical storm evolution fromtropical cyclones in the western North Pacific Ocean. Naval En-vironmental Prediction Tech. Rep. TR 78-02, 20 pp.
Browning, K. A., G. Vaughan, and P. Panagi, 1998: Analysis of anextratropical cyclone after its reintensification as a warm coreextratropical cyclone. Quart. J. Roy. Meteor. Soc., 124, 2329–2356.
——, A. J. Thorpe, A. Mantani, D. Parsons, M. Griffiths, P. Panagi,and E. M. Dicks, 2000: Interactions of tropopause depressionswith an ex–tropical cyclone and sensitivity of forecasts to anal-ysis errors. Mon. Wea. Rev., 128, 2734–2755.
Carr, F. H., and L. F. Bosart, 1978: A diagnostic evaluation of rainfallpredictability for Tropical Storm Agnes, June 1972. Mon. Wea.Rev., 106, 363–374.
Christenson, W. F., and R. A. Bryson, 1966: An investigation of thepotential of component analysis for weather classification. Mon.Wea. Rev., 94, 697–709.
Craddock, J. M., and C. R. Flood, 1969: Eigenvectors for representingthe 500-mb geopotential surface over the Northern Hemisphere.Quart. J. Roy. Meteor. Soc., 95, 576–593.
Davies, H. C., C. Schar, and H. Wernli, 1991: The palette of frontsand cyclones within a baroclinic wave development. J. Atmos.Sci., 48, 1666–1688.
DiMego, G. J., and L. F. Bosart, 1982a: The transformation of TropicalStorm Agnes into an extratropical cyclone. Part I: The observedfields and vertical motion computations. Mon. Wea. Rev., 110,385–411.
——, and ——, 1982b: The transformation of Tropical Storm Agnesinto an extratropical cyclone. Part II: Moisture, vorticity andkinetic energy budgets. Mon. Wea. Rev., 110, 412–433.
Doswell, C. A., III, 1984: A kinematic analysis of frontogenesis as-sociated with a nondivergent vortex. J. Atmos. Sci., 41, 1242–1248.
Evans, J. L., and R. E. Hart, 2003: Objective indicators of the lifecycle evolution of extratropical transition for Atlantic tropicalcyclones. Mon. Wea. Rev., 131, 909–925.
Foley, G. R., and B. N. Hanstrum, 1994: The capture of tropicalcyclones by cold fronts off the west coast of Australia. Wea.Forecasting, 9, 577–592.
Haltiner, G. J., and R. T. Williams, 1980: Numerical Prediction andDynamic Meteorology. John Wiley and Sons, 477 pp.
Hanley, D. E., 1999: The effect of trough interactions on tropicalcyclone intensity change. Ph.D. thesis, The University at Albany,State University of New York, 164 pp.
——, J. Molinari, and D. Keyser, 2001: A composite study of theinteractions between tropical cyclones and upper-tropospherictroughs. Mon. Wea. Rev., 129, 2570–2584.
Harr, P. A., and R. L. Elsberry, 2000: Extratropical transition of trop-ical cyclones over the western North Pacific. Part I: Evolutionof structural characteristics during the transition process. Mon.Wea. Rev., 128, 2613–2633.
——, ——, and T. F. Hogan, 2000: Extratropical transition of tropical
2168 VOLUME 132M O N T H L Y W E A T H E R R E V I E W
cyclones over the western North Pacific. Part II: The impact ofmidlatitude circulation characteristics. Mon. Wea. Rev., 128,2634–2653.
Hart, R. E., and J. L. Evans, 2001: A climatology of the extratropicaltransition of Atlantic tropical cyclones. J. Climate, 14, 546–564.
Hartmann, D. L., 1995: A PV view of zonal flow vacillation. J. Atmos.Sci., 52, 2561–2576.
Hill, H. W., 1970: The precipitation in New Zealand associated withthe cyclone of early April 1968. N. Z. J. Sci., 13, 641–662.
Johnson, D. R., and W. K. Downey, 1975: Azimuthally averagedtransport and budget equations for storms: Quasi-Lagrangian di-agnostics. Mon. Wea. Rev., 103, 967–979.
Joliffe, I. T., 1986: Principal Component Analysis. Springer-Verlag,271 pp.
Kalnay, E., and Coauthors, 1996: The NCEP/NCAR 40-Year Re-analysis Project. Bull. Amer. Meteor. Soc., 77, 437–471.
Karoly, D. J., 1990: The role of transient eddies in low-frequencyzonal variations in the Southern Hemisphere circulation. Tellus,42A, 41–50.
Kidson, J. W., 1988: Indices of the Southern Hemisphere zonal wind.J. Climate, 1, 183–194.
——, 1994: An automated procedure for the identification of synoptictypes applied to the New Zealand region. Int. J. Climatol., 14,711–721.
Klein, P. M., 1997: Extratropical transition of western North Pacifictropical cyclones. M.S. thesis, Department of Meteorology, Na-val Postgraduate School, Monterey, CA, 101 pp. [NTIS ADA-341-420.]
——, P. A. Harr, and R. L. Elsberry, 2000: Extratropical transitionof western North Pacific tropical cyclones: An overview andconceptual model of the transformation stage. Wea. Forecasting,15, 373–395.
Kutzbach, J. E., 1967: Empirical eigenvectors of sea-level pressure,surface temperature and precipitation complexes over NorthAmerica. J. Appl. Meteor., 6, 791–802.
Lupo, A. R., P. J. Smith, and P. Zwack, 1992: A diagnosis of theexplosive development of two extratropical cyclones. Mon. Wea.Rev., 120, 1490–1523.
McTaggart-Cowan, R., J. R. Gyakum, and M. K. Yau, 2001: Sensi-tivity testing of extratropical transitions using potential vorticityinversions to modify initial conditions: Hurricane Earl casestudy. Mon. Wea. Rev., 129, 1617–1636.
North, G. R., T. L. Bell, R. F. Cahalan, and F. J. Moeng, 1982: Sam-pling errors in the estimation of empirical orthogonal functions.Mon. Wea. Rev., 110, 699–706.
O’Lenic, E. A., and R. E. Livezey, 1988: Practical considerations inthe use of rotated principle component analysis (RPCA) in di-agnostic studies of upper air heights. Mon. Wea. Rev., 116, 1682–1689.
Palmen, E., 1958: Vertical circulation and release of kinetic energyduring the development of Hurricane Hazel into an extratropicalstorm. Tellus, 10, 1–21.
Parsons, K. E., and P. J. Smith, 2004: An investigation of extratropical
cyclone development using a scale-separation technique. Mon.Wea. Rev., 132, 956–974.
Petterssen, S., 1936: Contribution to the theory of frontogenesis. Geo-fys. Publ., 11 (6), 1–27.
——, 1956: Weather Analysis and Forecasting. 2d ed. Vol. 1. Mc-Graw-Hill, 428 pp.
——, and S. J. Smebye, 1971: On the development of extratropicalstorms. Quart. J. Roy. Meteor. Soc., 97, 457–482.
Rausch, R. L. M., and P. J. Smith, 1996: A diagnosis of a model-simulated explosively developing extratropical cyclone. Mon.Wea. Rev., 124, 875–904.
Richman, M. B., 1981: Obliquely rotated principal components: Animproved meteorological map typing technique. J. Appl. Mete-or., 20, 1145–1159.
——, 1986: Rotation of principal components. Int. J. Climatol., 6,293–335.
Ritchie, E. A., and R. L. Elsberry, 2003: Simulations of the extra-tropical transition of tropical cyclones: Contributions by the mid-latitude upper-level trough to reintensification. Mon. Wea. Rev.,131, 2112–2128.
Schultz, D. M., D. Keyser, and L. F. Bosart, 1998: The effect of large-scale flow on low-level frontal structure and evolution in mid-latitude cyclones. Mon. Wea. Rev., 126, 1767–1791.
Sinclair, M. R., 1993a: Synoptic-scale diagnosis of the extratropicaltransition of a southwest Pacific tropical cyclone. Mon. Wea.Rev., 121, 941–960.
——, 1993b: A diagnostic study of the extratropical precipitationresulting from Tropical Cyclone Bola. Mon. Wea. Rev., 121,2690–2707.
——, 1997: Objective identification of cyclones and their circulationintensity, and climatology. Wea. Forecasting, 12, 595–612.
——, 2002: Extratropical transition of southwest Pacific tropical cy-clones. Part 1: Climatology and mean structure changes. Mon.Wea. Rev., 130, 590–609.
——, and R. L. Elsberry, 1986: A diagnostic study of baroclinicdisturbances in polar air streams. Mon. Wea. Rev., 114, 1957–1983.
——, and X. Cong, 1992: Polar airstream cyclogenesis in the Aus-tralasian region: A composite study using ECMWF analyses.Mon. Wea. Rev., 120, 1950–1972.
——, and M. Revell, 2000: Classification and composite diagnosisof extratropical cyclogenesis events in the southwest Pacific.Mon. Wea. Rev., 128, 1089–1105.
Thorncroft, C. D., and S. C. Jones, 2000: The extratropical transitionsof Hurricanes Felix and Iris in 1995. Mon. Wea. Rev., 128, 947–972.
——, B. J. Hoskins, and M. E. McIntyre, 1993: Two paradigms ofbaroclinic wave life-cycle behavior. Quart. J. Roy. Meteor. Soc.,119, 17–55.
Uccellini, L. W., and P. C. Kocin, 1987: The interaction of jet streakcirculations during heavy snow events along the east coast ofthe United States. Wea. Forecasting, 2, 289–308.
Zwack, P., and B. Okossi, 1986: A new method for solving the quasi-geostrophic omega equation by incorporating surface pressuretendency data. Mon. Wea. Rev., 114, 655–666.