extreme heat and workers’ health in south australia€¦ · table 5.1 summary statistics for...
TRANSCRIPT

Extreme Heat and Workers’ Health in South Australia:
Association, perceptions, and adaptations in the workplace
Jianjun Xiang, MBBS, MMedSci
Discipline of Public Health
School of Population Health
Faculty of Health Sciences
The University of Adelaide
Thesis submitted for the degree of Doctor of Philosophy
October 2014

I
Table of Contents
LIST OF TABLES ........................................................................................................................................ VIII
LIST OF FIGURES ........................................................................................................................................ XI
PUBLICATIONS DURING CANDIDATURE ............................................................................................. XIII
AWARDS RECEIVED DURING CANDIDATURE ...................................................................................... XV
LIST OF ABBREVIATIONS ........................................................................................................................ XVI
THESIS ABSTRACT................................................................................................................................... XVII
DECLARATION ........................................................................................................................................... XX
ACKNOWLEDGEMENT ................................................................................................................................ I
INTRODUCTION .......................................................................................................................................... 1
SECTION I: LITERATURE REVIEW AND STUDY DESIGN ........................................................................ 6
Chapter 1 Literature review ................................................................................................................... 8
1.1 Effects of heat exposure on OH&S ................................................................................................ 8
1.2 Health impacts of workplace heat exposure on selected susceptible occupations: an
epidemiological review ............................................................................................................... 10
1.2.1 Overview of published epidemiological studies on workplace heat exposure ......................... 11
1.2.2 Characteristics of heat exposure in selected relatively high risk occupations .......................... 12
1.2.2.1 Agricultural workers ............................................................................................................ 16
1.2.2.2 Construction workers .......................................................................................................... 16
1.2.2.3 Miners ................................................................................................................................. 18
1.2.2.4 Armed forces personnel ...................................................................................................... 20
1.2.2.5 Fire-fighters and other emergency workers ....................................................................... 21
1.2.2.6 Manufacturing workers ....................................................................................................... 22
1.3 Personal vulnerability factors of workplace heat exposure ....................................................... 23
1.3.1 Age ............................................................................................................................................. 23
1.3.2 Gender ....................................................................................................................................... 24
1.3.3 The use of certain medications, drugs, and alcohol during extremely hot periods .................. 25
1.3.4 Acclimatization level .................................................................................................................. 26

II
1.3.5 Pre-existing diseases .................................................................................................................. 27
1.3.6 Hydration state .......................................................................................................................... 27
1.4 Awareness and knowledge of workplace heat exposure ........................................................... 28
1.4.1 Perceptions of heat among physical workers ............................................................................ 29
1.4.2 Awareness of workplace management personnel and relevant stakeholders ......................... 31
1.5 Workplace heat exposure prevention ........................................................................................ 33
1.5.1 Administrative management ..................................................................................................... 33
1.5.2 Heat training and education ...................................................................................................... 34
1.5.3 Heat indices, policies and regulations for working in hot environments .................................. 35
1.5.3.1 Heat indices ......................................................................................................................... 35
1.5.3.2 Heat-related regulations in Australia .................................................................................. 37
1.6 Discussion .................................................................................................................................... 45
1.7 Summary and research gaps ....................................................................................................... 49
Chapter 2 Study design and methodology ......................................................................................... 51
2.1 Introduction ................................................................................................................................ 51
2.2 The study region ......................................................................................................................... 51
2.3 Aims and objectives of the study ................................................................................................ 53
2.4 Research questions ..................................................................................................................... 53
2.5 Framework of the study .............................................................................................................. 54
2.6 Methodology used in the study .................................................................................................. 57
2.6.1 Analysis of occupational surveillance data ................................................................................ 57
2.6.1.1 Data collection .................................................................................................................... 57
2.6.1.2 Data analysis ....................................................................................................................... 58
2.6.2 Questionnaire survey ................................................................................................................. 62
SECTION II HEAT EXPOSURE AND WORK-RELATED INJURY............................................................. 63
Chapter 3 Epidemiological characteristics of work-related injury claims in South Australia,
2001-2010 ................................................................................................................................................ 65
3.1 Introduction ................................................................................................................................ 65
3.2 Materials and methods ............................................................................................................... 65
3.3 Results ......................................................................................................................................... 66
3.3.1 Age and gender .......................................................................................................................... 67

III
3.3.2 Season, month, and injury time ................................................................................................. 69
3.3.3 Industry ...................................................................................................................................... 71
3.3.4 Occupation ................................................................................................................................. 72
3.3.5 Nature of injury .......................................................................................................................... 73
3.3.6 Mechanism of injury .................................................................................................................. 73
3.3.7 Other distribution characteristics .............................................................................................. 78
3.4 Discussion .................................................................................................................................... 78
3.4.1 Gender ....................................................................................................................................... 78
3.4.2 Age ............................................................................................................................................. 79
3.4.3 Season, industry, and occupation .............................................................................................. 80
3.4.4 Heat-related claims .................................................................................................................... 80
3.5 Conclusion ................................................................................................................................... 81
Chapter 4 Occupational heat illness in South Australia, 2001-2010 ........................................... 83
4.1 Introduction ................................................................................................................................ 83
4.2 Materials and methods ............................................................................................................... 83
4.2.1 Workers’ compensation claim data ........................................................................................... 83
4.2.2 Identification of compensation claims due to heat illnesses in workplaces.............................. 84
4.2.3 Meteorological data ................................................................................................................... 85
4.2.4 Statistical analyses ..................................................................................................................... 86
4.3 Results ......................................................................................................................................... 87
4.3.1 Characteristics of heat illness claims in South Australia ............................................................ 87
4.3.1.1 Age and gender ................................................................................................................... 89
4.3.1.2 Season, month, and injury time .......................................................................................... 90
4.3.1.3 Medical expenditure and time lost ..................................................................................... 91
4.3.1.4 Industry ............................................................................................................................... 91
4.3.1.5 Occupation .......................................................................................................................... 92
4.3.2 Analyses focusing on Adelaide metropolitan area .................................................................... 93
4.3.2.1 Association between temperature and heat illness claims in Adelaide ............................. 93
4.3.2.2 Impact of heatwaves on heat illness claims in Adelaide ..................................................... 94
4.4 Discussion .................................................................................................................................... 95
4.4.1 Incidence of occupational heat illness ....................................................................................... 96
IV
4.4.2 Risk factors of occupational heat illness .................................................................................... 97
4.4.3 Heat illness prevention .............................................................................................................. 99
4.4.4 Limitations................................................................................................................................ 100
4.5 Conclusion ................................................................................................................................. 100
Chapter 5 The association between high temperature and work-related injuries ................ 102
5.1 Introduction .............................................................................................................................. 102
5.2 Materials and methods ............................................................................................................. 103
5.2.1 Workers’ compensation claim data ......................................................................................... 103
5.2.2 Meteorological data ................................................................................................................. 103
5.2.3 Statistical analyses ................................................................................................................... 104
5.3 Results ....................................................................................................................................... 106
5.3.1 Threshold temperature ............................................................................................................ 108
5.3.2 Total effects ............................................................................................................................. 108
5.3.3 Age and gender ........................................................................................................................ 109
5.3.4 Business size ............................................................................................................................. 109
5.3.5 Industry and occupation .......................................................................................................... 109
5.4 Discussion .................................................................................................................................. 112
5.4.1 Association between temperatures and work-related injuries ............................................... 113
5.4.2 Vulnerable sub-groups ............................................................................................................. 114
5.4.3 Limitations................................................................................................................................ 116
5.5 Conclusion ................................................................................................................................. 117
Chapter 6 The effects of heatwaves on work-related injuries .................................................... 119
6.1 Introduction .............................................................................................................................. 119
6.2 Materials and methods ............................................................................................................. 120
6.2.1 Workers’ compensation claim data ......................................................................................... 120
6.2.2 Meteorological data ................................................................................................................. 120
6.2.3 Heatwave definition ................................................................................................................. 120
6.2.4 Statistical analyses ................................................................................................................... 121
6.3 Results ....................................................................................................................................... 122
6.3.1 Effect estimates by gender, age, occupation and industry...................................................... 122
6.3.2 Types of work-related illnesses and injuries ............................................................................ 125

V
6.3.3 Injury mechanisms ................................................................................................................... 127
6.3.4 Comparison of the two heatwave definitions ......................................................................... 127
6.4 Discussion .................................................................................................................................. 128
6.4.1 Vulnerable sub-groups during heatwaves ............................................................................... 129
6.4.2 Diseases and injuries associated with heatwaves ................................................................... 131
6.4.3 Limitations................................................................................................................................ 132
6.5 Conclusion ................................................................................................................................. 133
SECTION III PERCEPTIONS OF WORKPLACE HEAT EXPOSURE ....................................................... 134
Chapter 7 Workplace heat exposure and OH&S: Perceptions from workers ........................... 137
7.1 Introduction .............................................................................................................................. 137
7.2 Materials and methods ............................................................................................................. 138
7.2.1 Questionnaire design ............................................................................................................... 138
7.2.2 Participant recruitment............................................................................................................ 139
7.2.3 Data analyses ........................................................................................................................... 141
7.3 Results ....................................................................................................................................... 142
7.3.1 Demographic characteristics.................................................................................................... 142
7.3.2 Heat illnesses and injuries occurring during hot weather ....................................................... 145
7.3.3 Risk perceptions of workplace heat exposure ......................................................................... 146
7.3.3.1 Concerns about heat exposure ......................................................................................... 146
7.3.3.2 Attitudes towards more heat-related training ................................................................. 147
7.3.3.3 Attitudes towards more heat-related policies .................................................................. 147
7.3.3.4 Attitudes towards the adjustment of work habits ............................................................ 148
7.3.3.5 Satisfaction degree of current heat-related prevention measures .................................. 149
7.3.4 Personal behaviours during hot days....................................................................................... 150
7.3.5 Current heat prevention measures .......................................................................................... 154
7.4 Discussion .................................................................................................................................. 155
7.4.1 Heat exposure concern in Australia ......................................................................................... 156
7.4.2 Heat-related training ............................................................................................................... 158
7.4.3 Individual behavioural response .............................................................................................. 160
7.4.4 Heat prevention measures....................................................................................................... 161
7.4.5 Limitations................................................................................................................................ 163

VI
7.5 Conclusion ................................................................................................................................. 163
Chapter 8 Workplace heat exposure and OH&S: Perceptions from occupational hygienists
................................................................................................................................................................... 165
8.1 Introduction .............................................................................................................................. 165
8.2 Materials and methods ............................................................................................................. 166
8.2.1 Questionnaire design ............................................................................................................... 166
8.2.2 Participant recruitment............................................................................................................ 167
8.2.3 Data analyses ........................................................................................................................... 167
8.3 Results ....................................................................................................................................... 168
8.3.1 Concern and awareness ........................................................................................................... 169
8.3.2 Preparedness and management .............................................................................................. 171
8.3.3 Preventive measures and adaptation barriers ........................................................................ 173
8.3.4 Relationship between heat concern, satisfaction and heat prevention efforts ...................... 175
8.4 Discussion .................................................................................................................................. 175
8.4.1 Heat exposure concern ............................................................................................................ 176
8.4.2 Heat exposure preparedness ................................................................................................... 177
8.4.3 Current heat prevention measures .......................................................................................... 178
8.4.4 Heat prevention barriers .......................................................................................................... 179
8.4.5 Limitations................................................................................................................................ 180
8.5 Conclusion ................................................................................................................................. 180
SECTION IV DISCUSSION AND CONCLUSION .................................................................................... 181
Chapter 9 Discussions and conclusions ........................................................................................... 182
9.1 Introduction .............................................................................................................................. 182
9.2 Key findings of this thesis .......................................................................................................... 182
9.2.1 Analyses of workers’ compensation claim data....................................................................... 182
9.2.2 Workers’ perceptions on workplace heat exposure ................................................................ 186
9.2.3 Occupational hygienists’ perceptions on heat exposure ......................................................... 187
9.3 Significance of this Thesis ......................................................................................................... 187
9.4 Strengths and limitations .......................................................................................................... 189
9.5 Implications and recommendations for workplace heat prevention ....................................... 191
9.5.1 Heat policy implications ........................................................................................................... 191

VII
9.5.2 Establishment of workplace heat alert system ........................................................................ 193
9.5.3 Real time health surveillance ................................................................................................... 198
9.5.4 The combination of self-regulated and mandatory heat management .................................. 199
9.5.5 Heat education, training, and individual capacity building ..................................................... 200
9.5.6 Establishment of collaborative mechanisms ........................................................................... 202
9.6 Further research directions ....................................................................................................... 203
9.6.1 Heat exposure and occupational disease/injury burden ......................................................... 203
9.6.2 Heat exposure and productivity loss ....................................................................................... 203
9.6.3 Heat risk perceptions among employers, policy-makers and relevant stakeholders .............. 204
9.6.4 Heat exposure and workers’ reproductive health ................................................................... 205
9.6.5 The development of heat standards for different climatic conditions and local use .............. 205
9.7 Conclusion ................................................................................................................................. 206
APPENDICES ............................................................................................................................................ 208
Appendix A: Overseas heat-related regulations and standards ............................................................... 209
Appendix B1: Ethical approval letter for the analysis of workers’ compensation claim data .................. 222
Appendix B2: Renewal of the ethical approval for the workers’ compensation claim data .................... 223
Appendix C: SafeWork SA Research Dataset Confidentiality Agreement ................................................. 224
Appendix D: Research invitation letter for employers ............................................................................. 234
Appendix E: Information sheet for workers .............................................................................................. 235
Appendix F: Survey questionnaires for workers ....................................................................................... 237
Appendix G: Survey questionnaires for TAFE students............................................................................. 242
Appendix H: Ethical approval for questionnaire surveys .......................................................................... 247
Appendix I: Survey questionnaires for hygienists ..................................................................................... 248
Appendix J: Information sheets for hygienists .......................................................................................... 252
Appendix K: Abstracts of published manuscripts ..................................................................................... 253
Appendix L: Journal commentary on a published manuscript based on Chapter 5 ................................. 256
REFERENCES .......................................................................................................................................... ..256

VIII
LIST OF TABLES
Table 1.1 Summary of findings from surveillance data analysis articles on workplace heat exposure published during January 1997-January 2014 ............................................................... 13
Table 1.2 Summary of epidemiological studies of workplace heat exposure published during January 1997-January 2014 ........................................................................................................... 14
Table 1.3 Review of studies on perceptions and behavioural responses of workplace heat exposure in January 1997- January 2014 ...................................................................................... 32
Table 1.4 Australian legal regulations and codes for occupational heat stress ........................... 39
Table 3.1 The number of claims, percentages and claim rates by gender, South Australia, 2001-2010 ............................................................................................................................................... 68
Table 3.2 Claims, percentages, and claim rates by age group and gender, South Australia, 2001-2010 ............................................................................................................................................... 69
Table 3.3 Claims by season, South Australia, 2001-2010 ............................................................. 70
Table 3.4 Claims by month, South Australia, 2001-2010 .............................................................. 70
Table 3.5 The number of claims, percentage, time-loss days, medical costs, and deaths by industry, South Australia, 2001-2010 ............................................................................................ 74
Table 3.6 The number of claims, percentage, time-loss days, medical costs, and deaths by occupation, South Australia, 2001-2010 ....................................................................................... 75
Table 3.7 The number of claims, percentage, time-loss days, medical costs, and deaths by nature of injury or illness, South Australia, 2001-2010 ................................................................ 76
Table 3.8 The number of claims, percentage, time-loss days, medical costs, and deaths by mechanism of injury or illness, South Australia, 2001-2010 ......................................................... 77
Table 4.1 Characteristics of heat illness compensation claims and all compensation claims reported in South Australia, 2001-2010 ........................................................................................ 88
Table 4.2 The number, percentage and claim rate of all and heat illness compensation claims by South Australia WorkCover Industrial Classification System (SAWICS) in South Australia, 2001-2010 ............................................................................................................................................... 92
Table 4.3 The number, percentage and claim rate of heat illness compensation claims and all claims by occupation in South Australia, 2001-2010 .................................................................... 93

IX
Table 4.4 The odds ratios (OR) of occupational heat illness claims during heatwave periods compared with non-heatwave periods in different control groups, Adelaide, South Australia, 2001-2010 ...................................................................................................................................... 95
Table 5.1 Summary statistics for meteorological indicators in Adelaide, South Australia, 2001-2010 ............................................................................................................................................. 107
Table 5.2 Number and percentage of workers' injury claims in Adelaide, South Australia, 2001-2010 ............................................................................................................................................. 107
Table 5.3 Daily injury claims, thresholds, and IRR estimates of Tmax (lag 0) on daily injury claims by gender, age group, industry and occupation in warm seasons (October-March), Adelaide, South Australia, 2001-2010 ......................................................................................................... 110
Table 6.1 The incidence rate ratio (IRR) of workers' compensation claims by gender, age group, industry and occupation during heatwave periods compared with non-heatwave periods in the warm season, Adelaide, South Australia, 2001-2010 ................................................................. 124
Table 6.2 Specific injury risk estimates (IRR) stratified by gender and age groups for industrial sectors significantly related to heatwaves in the warm season, Adelaide, South Australia, 2001-2010 ............................................................................................................................................. 125
Table 6.3 The incidence rate ratio (IRR) of workers' compensation claims by the type of injuries and illnesses during heatwave periods compared with non-heatwave periods in the warm season, Adelaide, South Australia, 2001-2010 ............................................................................ 126
Table 6.4 The IRR of workers' compensation claims by the mechanism of injury during heatwave periods compared with non-heatwave periods in the warm season, Adelaide, South Australia, 2001-2010 ................................................................................................................... 128
Table 7.1 Sampling framework: the number of employers invited to provide assistance in the distribution of questionnaires to workers .................................................................................. 140
Table 7.2 Perceptions of workplace heat exposure: prevalence estimates and 95% CI by different subgroups ..................................................................................................................... 143
Table 7.3 Factors associated with attitude and perception for workplace heat exposure, more heat-related training and regulations, the change of work habits, and satisfaction for prevention measures: bivariate analysis and multiple stepwise logistic regression an ................................ 151
Table 8.1 Demographic information of the participants ............................................................ 168
Table 8.2 Number and percentage of respondents' concern and awareness on workplace extreme heat exposure ............................................................................................................... 170

X
Table 8.3 Comparison of heat concern, attitudes toward future heat challenge, and satisfaction level of heat prevention measures by occupation and area ....................................................... 170
Table 8.4 Number and percentage of extreme heat preparedness and management .............. 172
Table 8.5 Relationship of heat concern and satisfaction level on the attitudes towards more training and regulations, and the adjustment of heat prevention recommendations…. ........... 175
Table A1 Outdoor temperature action levels …. ........................................................................ 210
Table A2 Two-hour time-weighted average permissible heat exposure limits …. ..................... 210
Table A3 Legal requirements relating to workplace heat exposure in some European Union countries …. ................................................................................................................................. 215
Table A4 High temperature allowance standards in major municipalities/provinces, China …. 220

XI
LIST OF FIGURES
Figure 1.1 Conceptual framework of the relationship between workplace heat exposure and its
impact .............................................................................................................................................. 9
Figure 1.2 Process of selection of articles for reviewing health impacts of workplace heat
exposure ........................................................................................................................................ 11
Figure 2.1 Location of metropolitan Adelaide, Adelaide, South Australia ................................... 52
Figure 2.2 Flowchart outlining the framework of the study ......................................................... 56
Figure 3.1 Spatial distribution of workers’ compensation claims in South Australia, 2001-2010
by postcode ................................................................................................................................... 67
Figure 3.2 Claim rates by gender, South Australia, 2001-2010 .................................................... 68
Figure 3.3 Distribution of claims by injury time and gender, South Australia, 2001-2010 .......... 71
Figure 4.1 Flowchart: identification of heat-related compensation claims, South Australia, 2001-
2010 ............................................................................................................................................... 85
Figure 4.2 Spatial distribution of heat-related injury claims in South Australia, 2001-2010 ....... 89
Figure 4.3 Distribution of heat illness compensation claims by month in South Australia, 2001-
2010 ............................................................................................................................................... 90
Figure 4.4 Distribution of heat illness compensation claims by injury time in South Australia,
2001-2010 ...................................................................................................................................... 90
Figure 4.5 Association between daily maximum temperature and daily occupational heat illness
claims in Adelaide, South Australia, 2001-2010 ............................................................................ 94
Figure 5.1 Characteristics of daily injury claims in 2001–2010, Adelaide, South Australia ........ 106
Figure 5.2 (A-E) Exposure–response relationships between daily maximum temperature and
daily injury claims for (A) total effects, (B) outdoor industries,(C) agriculture, forestry and fishing,
(D) construction and (E) electricity, gas and water. Data were smoothed using a LOWESS (locally
weighted scatter plot smoothing) smoother, bandwidth=0.8. ................................................... 111
Figure 7.1 Heat-related illnesses experienced by participants: number and percentage .......... 145

XII
Figure 7.2 Type of injuries experienced by participants during hot weather: number and
percentage ................................................................................................................................... 145
Figure 7.3 Type of injuries witnessed by participants during hot weather: number and
percentage ................................................................................................................................... 146
Figure 7.4 Reasons why there is no need for more heat-related regulations and guidelines ... 148
Figure 7.5 Reasons why workers did not consider adjusting work habits during hot weather . 149
Figure 7.6 Participants’ drinking habits during hot weather ...................................................... 150
Figure 7.7 Main sources of information about heat prevention ................................................ 153
Figure 7.8 Reasons that some workers did not work in their own pace during very hot weather
..................................................................................................................................................... 154
Figure 7.9 Heat prevention measures currently adopted in the workplace .............................. 155
Figure 8.1 Number and percentage of different hygienist categories ....................................... 169
Figure 8.2 Heat-related preventive measures currently adopted in the workplace .................. 173
Figure 8.3 Heat prevention and adaptation barriers existing in the workplace ......................... 174
Figure 9.1 The Construction, Forestry, Mining and Energy Union (CFMEU) hot weather guideline
..................................................................................................................................................... 197
Figure A1 Evaluating heat stress and strain………………………………………………………………………..….213

XIII
PUBLICATIONS DURING CANDIDATURE
Peer-reviewed Journals
Published
1. Xiang J, Bi P, Pisaniello D, Hansen A. Health Impacts of Workplace Heat Exposure: An
Epidemiological Review. Ind Health (impact factor: 1.045). 2014, 52: 91-101.
2. Xiang J, Bi P, Pisaniello D, Hansen A, et al. Association between high temperature and
work-related injuries in Adelaide, South Australia, 2001–2010. Occup Environ Med
(impact factor: 3.234). 2013, doi:10.1136/oemed-2013-101584.
3. Xiang J, Bi P, Pisaniello D, Hansen A.The impact of heatwaves on workers’ health and
safety in Adelaide, South Australia, 2001-2010.Environ Res (impact factor: 3.951). 2014,
133: 90-95. doi: 10.1016/j.envres.2014.04.042.
Manuscript in draft
4. Xiang J, Bi P, Pisaniello D, Hansen A. Extreme heat and occupational heat heat illness in
South Australia, 2001-2010. (Submitted)
5. Xiang J, Bi P, Pisaniello D, Hansen A. Workers’ perceptions on workplace heat exposure
in South Australia.
6. Xiang J, Bi P, Pisaniello D, Hansen A. Workplace heat exposrue and OH&S: Perceptions
from Australian occupational hygienists.
Conference presentations
1. Xiang J, Bi P, Pisaniello D, Hansen A, et al. Association between high temperature and
work-related injuries in Adelaide, South Australia, 2001–2010 (Oral presetation).The
23rd
International Conference on Epidemiology in Occupational Health (EPICOH),
Utrecht, Netherlands, 2013.
2. Xiang J, Bi P, Pisaniello D, Hansen A. Association between high temperature and work-
related injuries in Adelaide, South Australia, 2001–2010 (Poster presentation). The

XIV
Faculty of Health Science Postgraduate Research Conference, The University of
Adelaide, SA, 2013.
3. Xiang J, Bi P, Pisaniello D, Hansen A. Association between high temperature and work-
related injuries in Adelaide, South Australia, 2001–2010 (Poster presentation). The
Australian National Climate Change Adaptation Research Facility (NCCARF)
Conference, Sydney, Australia, 2013.
4. Xiang J, Bi P, Pisaniello D, Hansen A. The impact of heatwaves on workers’ health and
safety in Adelaide, South Australia (Poster presentation). The 24th
International
Conference on Epidemiology in Occupational Health (EPICOH), Chicago, USA, 2014.
5. Xiang J, Bi P, Pisaniello D, Hansen A. Climate change and workplace heat exposure:
Perceptions from occupational hygienists. The Australian National Climate Change
Adaptation Research Facility (NCCARF) Conference (A synthesis talk and poster
presentation), Gold Coast, Australia, 2014.
6. Xiang J, Bi P, Pisaniello D, Hansen A. Climate change and occupational heat stress:
Perceptions from workers. The Australian National Climate Change Adaptation Research
Facility (NCCARF) Conference (Poster presentation), Gold Coast, Australia, 2014.
7. Xiang J, Bi P, Pisaniello D, Hansen A. Extreme heat and occupational heat illness in
South Australia, 2001-2010. The Australian National Climate Change Adaptation
Research Facility (NCCARF) Conference (Poster presentation), Gold Coast, Australia,
2014.
8. Xiang J, Bi P, Pisaniello D, Hansen A. The impact of heatwaves on workers’ health and
safety in Adelaide, South Australia (Poster presentation). The Faculty of Health Science
Postgraduate Research Conference, The University of Adelaide, SA, 2014.

XV
AWARDS RECEIVED DURING PhD CANDIDATURE
The University of Adelaide – China Scholarship Council Joint Postgraduate Scholarships
Program, 2010-2014.
Postgraduate Travelling Fellowship, funded by the Freemasons Foundation. Faculty of
Health Sciences Research Committee, the University of Adelaide, 2013.
Travel grant. The 23rd
Scientific Committee on Epidemiology in Occupational Health
(EPICOH) Conference Committee. Utrecht, Netherlands, 2013.
Travel grant. The Australian National Climate Change Adaptation Research Facility
(NCCARF) Annual Conference Committee. Sydney, Australia, 2013.
Outstanding Service to the Adelaide Chinese Students & Scholars Association (ACSSA)
Award. Education Office, Embassy of China in Australia, 2013.
Travel grant. The 24th
Scientific Committee on Epidemiology in Occupational Health
(EPICOH) Conference Committee. Chicago, United States, 2014.

XVI
LIST OF ABBREVIATIONS
ABS Australian Bureau of Statistics
ACGIH American Conference of Governmental Industrial Hygienists
AIOH Australian Institute of Occupational Hygienists
ASCO Australian Standard Classification of Occupation
AT Apparent Temperature
BOM Bureau of Meteorology
CEN European Committee for Standardization
CFMEU Construction, Forestry, Mining and Energy Union
CI Confidence Interval
FIFO Fly-in/fly-out
GEE Generalized Estimating Equation
H/W Heatwave
ICD International Classification of Diseases
IRR Incidence Rate Ratio
ISO International Organization for Standardization
NIOSH National Institute for Occupational Safety and Health
OH&S Occupational Health & Safety
OLS Ordinary Least Square
OR Odd Ratio
PPE Personal Protective Equipment
SA South Australia
SAWIC South Australia WorkCover Industrial Classification
SWSA SafeWork South Australia
TAFE Technical and Further Education
TLV Threshold Limit Value
Tmax Maximum Temperature
TOOCS Type of Occurrence Classification System
UK United Kingdom
USA United States of America
USG Urine Specific Gravity
UTCI Universal Thermal Climate Index
WBGT Wet Bulb Globe Temperature
WHS Workers’ health and safety

XVII
THESIS ABSTRACT
Background
Occupational heat exposure may lead to adverse health effects and contribute to work-related
injury, illness or even death. With the predicted increase in the frequency and intensity of
extremely hot weather in South Australia, workplace heat exposure is presenting a growing
challenge to workers’ health and safety. This thesis aims to examine the effects of workplace
heat exposure on workers’ health and safety in Adelaide, South Australia, to investigate
perceptions of risks associated with workplace heat exposure, and to provide scientific evidence
for the development of heat necessary heat prevention and adaptation strategies particularly in a
warming climate.
Methods
This study can be broadly divided into two parts. The first part is the analyses of workers’
compensation claim data and weather data, obtained from the SafeWork South Australia and the
Bureau of Meteorology, respectively for 2001-2010. Time-series analysis approach was used to
quantify the effects of heat exposure on workers’ health and safety. Heat-related claims were
identified according to the Type of Occurrence Classification System coding information and
text-based diagnosis-related descriptions. Case-crossover analytic approach was undertaken to
estimate the risk of occupational heat illnesses during heatwaves. The second part of this study
comprises two cross-sectional questionnaire surveys to investigate how workers and
occupational hygienists perceive the risk of workplace heat exposure and health impact.

XVIII
Results
Analyses of workers’ compensation claim data
Generally, there was a reversed U-shaped relationship between daily maximum temperature
(Tmax) and daily injury claims in Adelaide. With increasing Tmax below certain threshold
temperatures ranging from 31.8℃ to 38.9℃, significant temperature-injury claims associations
were found in the following sub-groups: young workers aged ≤24 years; those working in some
outdoor industries such as ‘agriculture, forestry and fishing’, ‘construction’, and ‘electricity, gas
and water’; or employed as labourers, production and transport workers, and tradespersons in
small and medium sized businesses. When the temperature was extremely hot, almost all
industries had a decrease in injury claims, except the ‘electricity, gas and water’ industry.
During heatwave (≥3 consecutive days with Tmax ≥35℃) periods, outdoor male labourers and
tradespersons aged ≥55 years in ‘agriculture, forestry and fishing’ and ‘electricity, gas and water’
industries were found to be at higher risk of work-related injuries. Occupational burns,
lacerations, amputations, and heat illnesses were found to be significantly associated with
extreme heat, together with injuries resulting from moving objects, chemical exposures, and
environmental factors.
There were 306 heat-related injury claims reported during the 9-financial year period in South
Australia, with an incidence rate of 4.5 per 100,000 workers. Relatively high heat illness
incidence rates were observed in ‘mining’ and ‘electricity, gas and water’ industries, and those
employed as labourers and tradespersons across the state during the study period. When Tmax was
above 35.5℃, a 1 ℃ increase of Tmax was associated with a 12.7% increase in occupational heat
illness claims. During heatwave periods the risk of occupational heat illness was about 4-7 times
higher than that of non-heatwave periods.

XIX
Workers and occupational hygienists’ perceptions on heat exposure
Surveyed workers were moderately concerned about heat exposure. Young workers (≤24 years)
were less concerned than older workers. Workers undertaking very physically demanding work,
wearing personal protective equipment, or having had a previous heat illness/injury were found
to be more concerned about heat exposure.
The majority (90%) of occupational hygienists and specialists surveyed showed great concerns
over heat stress, but they did not show strong willingness to amend heat prevention
recommendations to management or companies. From the occupational hygienists’ point of view,
Australian workplaces may not be well-prepared for the likelihood of increasing heat stress due
to climate change.
Conclusions
Findings from this study will provide essential epidemiological evidence for policy makers and
relevant stakeholders to develop regulations and guidelines locally and /or internationally to
reduce the impacts of extreme heat on workers’ health and safety, particularly in the susceptible
subgroups identified. Industrial specific workplace hot weather alerts and response mechanisms
need to be developed via multi-sectoral cooperation between stakeholders to improve vulnerable
groups’ risk perceptions and knowledge about harm minimisation strategies during extremely hot
weather. In a warming climate, there is a need to develop specific and clear enforceable heat
regulations to ensure the implementation and compliance of heat policies.

XX
DECLARATION
I certify that this work is original and contains no material which has been accepted for the
award of any other degree or diploma in any university or other tertiary institution and, to the
best of my knowledge and brief, contains no material previously published or written by another
person, except where due acknowledgement is made in the text. No part of the work will be used
in a submission for any other degree or diploma in any university or other tertiary institution
without the prior approval of the University of Adelaide and where applicable, any partner
institution responsible for the join-award of the degree except where due reference has been
made in the text.
I give my consent to this copy of my thesis when deposited in the University Library, being
made available for loan and photocopying, subject to the provisions of the Copyright Act 1968.
I also give permission for the digital version of my thesis to be made available on the web, via
the University’s digital research repository, the Library catalogue, and the Australian Digital
Theses Program (ADTP) and also through web search engines, unless permission has been
granted by the University to restrict access for a period of time.
The author acknowledges that copyright of published works contained within this thesis (as
listed below) resides with the copyright holders of those works.
Signature: _____________________ Date: ________________________

I
ACKNOWLEDGEMENT
First and foremost I would like to express my heartfelt gratitude to my supervisors Professor
Peng Bi, Professor Dino L. Pisaniello, and Dr Alana Hansen, all of whom provided much
appreciated continuous help, encouragement and guidance. I consider myself very lucky to have
such a wonderful and supportive supervisory panel, and very fortunate to be part of our warm
research team. I would also like to thank all members of the Thesis Writing Group, the other
academic and professional staff, and fellow PhD students of the Discipline of Public Health for
their support throughout the candidature.
Appreciation is extended to SafeWork SA for providing workers’ compensation claims data,
especially Mr. John Horrocks and Ms. Shelley Rowett’s assistance in data delivery, collation and
variable interpretation. Beyond that, I am also thankful to SafeWork SA for helping me to invite
potential employers to participate in the heat stress questionnaire survey. I would also like to
thank TAFE SA and the Australian Institute of Occupational Hygienists Inc. (AIOH) for their
generous assistance in the distribution of questionnaires. All survey participants and employers
getting involved in this research are greatly appreciated for their contributions.
My sincere thanks also go to Mr. Thomas Sullivan (DMAC, University of Adelaide), Mr.
Graeme Tucker and Dr Monika Nitschke from SA Health, Dr. Sue Williams, Dr. Ying Zhang,
and Dr. Murthy Mittinty for their helpful assistance in solving the many methodological
problems encountered.
My PhD candidature was funded by the China Scholarship Council and the University of
Adelaide through a joint postgraduate scholarship program.
Thanks are extended to my friends for providing support and friendship that I needed, and
particularly to Mr. Andrew Bain, Ms Jennifer Cooper, Xue Qin, Sisi, Maoyi Xu, Ting Xia,
Yanyan Kong, Shurong Han, Hui Li, Jimin Xiong, Tongzhe Bi, Yun Li, and Tao Zhang. Last but
certainly not least, I wish to thank my hardworking parents and my two lovely younger sisters.
Their love provided my inspiration and was my internal driving force throughout the journey.
Jianjun Xiang

Introduction
1
INTRODUCTION
The relationship between high temperatures and population health has been well documented
after a series of severe extreme heat events occurred in the past decades, particularly in Europe,1
North America,2-7 and Australia.
8-12 Epidemiological evidence suggests that extremely hot
weather may contribute to excess morbidity and mortality,5-9, 11-18
particularly among the elderly,
patients with chronic diseases and those taking certain medications. Physically active workers
are also vulnerable during extreme heat.19-21
Short-term acute extreme heat exposure may disrupt
core body temperature balance and result in heat-related illnesses.22
Adverse long-term health
effects of chronic workplace heat exposure have also been reported.23-26
Moreover, working in
hot environments can increase the risk of occupational injuries and accidents.21, 27-29
Heat exposure is a common physical hazard in the workplace. Heat gain can be a combination of
heat from the external thermal environment and internal heat generation by metabolism
associated with physical activity. In the workplace, there are two types of external heat exposure
sources: weather-related and process-generated heat. With the predicted increase in the
frequency and intensity of extremely hot weather,30-32
weather-related heat exposure is
presenting an increasing challenge for occupational health and safety.19-21, 33
In recent years,
there has been a growing concern in the literature about the impact of heat-related events on
workers’ health and safety,19-21
and its importance has been addressed in the 2007
Intergovernmental Panel on Climate Change assessment report30
and reiterated in the recently
released 2014 report.34
Evidence shows that Australia would be one of the countries at high risk of increased heat stress
in the population if temperatures increase by 3℃.35
In particular, for workers undertaking manual

Introduction
2
work outdoors or around heat sources, “dangerous days” (days when there is a 2.5℃ increase of
body temperature in less than 2 hours) are predicted to increase to 15-27 days per year by 2070
compared to 1 day per year at present according to one Australian study.36
The potential impact
of climate change on workplaces may be even worse in South Australia (SA) than the Australian
national average level, as the average maximum temperature has increased at a faster rate than
the national average since 1950: 0.17℃ in SA compared to 0.13℃ per decade nationally.32
According to the weather projections for Adelaide, the capital of SA, the average number of days
with temperatures over 35℃ and the frequency of heatwaves will triple by 2070.32
Although South Australians are likely acclimatized to extreme heat, several studies in Adelaide
have found that heatwaves were associated with excess mortality and significant increases in
hospital admissions and ambulance call-outs.8, 11, 12, 17, 18
It is not known if findings from
community-based studies extend directly to occupational health risks and outcomes. Indeed, heat
vulnerability in the general population and heat vulnerability in the workforce are not mutually
exclusive, as sensitive sub-groups in the community are also part of the working sector.37
However, occupational heat exposure may be more hazardous than community exposure as the
individual has less control over the work environment and activities, due to workplace
disciplines, work nature and demands, and personal motivation. And few studies have
specifically examined the potential differences in the impact of extreme heat on workers’ health
as compared to that in general population.37
Workers are a relatively research-neglected and possible heat vulnerable sub-population
according to the published literature.19-21, 37
Exposure to environmental heat may be a significant
but overlooked occupational hazard.37 However, in Australia heat stress has not been listed to
date as a national occupational health priority.38
39
As the direct outcomes of heat exposure, the

Introduction
3
incidence and characteristics of occupational heat illnesses in Australia still remains unknown.
Moreover, it should be noted that the potential impact of accidents and injuries due to heat
exposure may represent a greater risk than heat-related illnesses itself.20, 33, 40
In addition,
cognitive and physical performance decrements can occur at heat exposure levels lower than
those causing heat illnesses and injuries,41
which may result in reduced hourly work capacity and
economic productivity.20, 42-46
Therefore, working in a hot environment is not only a matter of
occupational health and safety, but also an area involving all levels of society economically:
individual, family, community, regional, and national levels.40, 47
In the past decades, studies
about occupational health impacts of heat exposure mainly focused on workplace-generated heat
exposure such as in foundries, mining and metal plants. Research related to estimating the effects
of weather-related extreme heat exposure on workers’ health and safety is relatively limited.
So far Australia has not released clear regulations specifying standards for maximum
temperatures in the workplace,19
leaving some employment sectors at high risk of heat-related
illnesses and injuries.46, 48
By contrast, two States (California49
and Washington DC50
) in the
USA and some other countries such as China51
have implemented specific strict heat regulations
in recent years. Moreover, International Organization for Standardization (ISO) is also
considering updating some heat standards in the context of climate change.52 Therefore,
intensified research on the potential impact of high ambient temperatures on workers’ health and
safety is increasingly essential for local heat prevention policy development, heat stress control,
and evidence-based effective interventions. In addition, research on the characterization of work-
related injuries occurring during high temperatures may fill a significant gap in injury research. It
may also be helpful for the fulfilment of the Australian Work Health & Safety Strategy 2012-

Introduction
4
2022 national targets and performance indicators: i.e. at least 20% reduction of worker fatalities
due to injury and 30% reduction of serious injury claims.38
Heat-related illnesses and injuries are preventable. Current heat prevention strategies include
engineering control, administrative control, personal protection, education and training, and
regulations.53, 54
Effective heat stress control and management needs comprehensive efforts,
cooperation, and support from a wide variety of stakeholders such as employees, employers,
decision makers, managers, and occupational hygienists, physicians, and nurses.55, 56
An
investigation of how people perceive the risk of workplace heat exposure may be helpful to
identify potential heat prevention and adaptation barriers existing in the workplace, and to
develop current heat policies to make them more practicable and operational. However, currently
few studies have investigated the perceptions of workplace heat exposure in Australia.
The aim of this thesis was to fill the research gaps in knowledge about the health effects of
occupational heat exposure, and provide valuable scientific evidence for policy-makers and
occupational health and safety practitioners and officers to inform the development of heat-
related regulations and guidelines for heat prevention and adaptation in a warming climate.
This thesis is formulated in four sections. Section I comprises two chapters, the first of which is
a comprehensive literature review on the following four aspects: characteristics of health impacts
of workplace heat exposure on selected susceptible occupations, heat vulnerability factors,
perceptions of workplace heat exposure among different stakeholders, and current heat-related
regulations in Australia and overseas. The first Chapter concludes with a discussion of published
literature in occupational heat exposure and research gaps identified. The second Chapter of

Introduction
5
Section I outlines the aims and objectives of this study, research questions, framework of this
study and methodologies used.
Section II comprises four chapters, with the major aim of assessing the underlying impact of
extreme heat exposure on the health and wellbeing of the Australian workers at the population
level using workers’ compensation claim data. Chapter 3 describes the epidemiological
distribution characteristics of workers’ compensation claims reported in South Australia during
2001-2010, and paves the way for the analysis of heat exposure and work-related illnesses and
injuries. Chapter 4 investigates the characteristics of occupational heat illnesses, the incidence
rates of occupational heat illnesses by industry and occupation, and the impacts of extreme heat
on occupational heat illnesses. Chapter 5 mainly focuses on the quantitative association between
ambient temperature and work-related injuries, while Chapter 6 seeks to estimate the effects of
consecutive high temperature days (heatwave) on workers’ health and safety, to identify who are
most vulnerable to extreme heat, and to examine which types of work-related illnesses and
injuries are associated with extreme heat exposure.
The theme of Section III is the perceptions of workplace heat exposure. Chapter 7 aims to
investigate how workers perceive the risk of heat exposure and what prevention measures have
been adopted in the workplace, and to identify potential heat prevention barriers existing in the
workplace. Chapter 8 provides occupational hygienists’ views on heat stress management and
current preparedness for the likelihood of increasing hot weather.
Section IV comprises Chapter 9, concluding the thesis with a summary of the previous chapters
highlighting the key findings, research strengths and limitations, the public health significance of
this work, policy implications and suggestions for future research.

6
SECTION I
LITERATURE REVIEW
AND STUDY DESIGN

7
Introduction
This first section of the thesis, comprising two chapters, provides a general background and
outline to the relevant issues whist providing a basis for the main study.
Chapter 1 is a comprehensive literature review of recently published international and Australian
studies and relevant regulations concerning workplace heat exposure and workers’ health and
safety. This chapter has been organized into six parts. Part 1.1 is a brief summary of the impact
of heat exposure on workers’ health and safety. Part 1.2 mainly presents a review of the
characteristics of workplace heat exposure in selected relatively high risk occupations. Part 1.3
includes a review of the major heat vulnerability factors. Part 1.4 is a second literature review
summarising published studies regarding workers’ knowledge, attitudes, and behavioural
changes towards heat exposure and relevant stakeholders’ perceptions on the impact of a
warming climate on workers’ health and safety. Part 1.5 provides an overview of heat prevention
methods and strategies, and includes a literature review (Part 1.5.3) of the heat-related
regulations, policies and guidelines currently in place in Australia and overseas. Finally, research
gaps in the international and Australian literature are identified, confirming there is a need to
estimate the impact of extreme heat on workers’ health and safety at a population level,
understand heat perceptions of stakeholders, and develop heat prevention strategies that are
relevant currently and in the future.
Chapter 2 gives a general outline of the study design complete with aims and objectives, research
questions, the general framework of the study, the climatic and demographic characteristics of
the study region, and a justification of the chosen study method such as time-series analysis with
generalized estimating equations models and case-crossover analysis.

Chapter one: Literature review
8
Chapter 1
Literature review
1.1 Effects of heat exposure on OH&S
Working in hot environment is a common physical hazard. Physiological impacts of heat
exposures on human health have been well documented for decades.22
The human body can
maintain the internal heat balance through heat adjustment mechanisms including evaporation of
sweat, conduction, convection and radiation. There are six fundamental factors influencing
thermal comfort both environmentally and personally, including air temperature, radiant
temperature, wind speed, relative humidity, work demands, and clothing insulation.53, 54
The
combined effect of external heat exposure and internal metabolic heat production can produce
thermal stress on the body. The body’s physiological response to that stress, such as sweating,
increased heart rate and elevated temperature, can produce heat strain.53, 54
Without adequate heat dissipation, short-term acute extreme heat exposure can cause a rise in
core body temperature and may result in direct heat illnesses, ranging from mild heat rash, heat
cramps, heat exhaustion, to life-threating heat stroke. Adverse long-term health effects of chronic
workplace heat exposure have also been reported such as cardiovascular diseases,24
mental
health problems,57, 58
and chronic kidney diseases.25, 26
In addition to work-related illnesses,
working in hot environments can also increase the risk of occupational injuries and accidents.20,
21, 27-29 Core temperature elevation and dehydration have had negative behavioural effects such as
physical fatigue, irritability, lethargy, impaired judgment, vigilance decrement, loss of dexterity,
coordination and concentration,20, 59 and reduced visual acuity,
60 which may lead to a

Chapter one: Literature review
9
compromise of work efficiency, occupational safety, and productivity loss.20, 42, 44, 61-63
Therefore,
the adverse impact of extreme heat on occupational health and safety is an area which may have
consequences for all levels of society: individual, family, community, regional, and national
levels,20, 40
as summarized in Figure 1.1.
Figure 1.1 Conceptual framework of the relationship between workplace heat exposure and its impact
(adapted from Schutle et al21)

Chapter one: Literature review
10
1.2 Health impacts of workplace heat exposure on selected susceptible
occupations: an epidemiological review
A literature review was conducted to summarize the body of literature concerning the health
impacts of workplace heat exposure. As concerns over the environmental heat-related impacts of
climate change on population health have been raised since the late 1990s,64
relevant literature in
English for the period of January 1997 to January 2014 was retrieved utilizing the searching
strategy of random combinations of the first keywords [tiab] AND the second keywords [tiab].
The term ‘tiab’ is the abbreviation of ‘title or abstract’. All academic articles containing search
keywords in the title or abstract would be retrieved. The keywords used for the searching
strategy of random combinations of the first keywords [tiab] AND the second keywords [tiab]
included “climate change, heat stress, heatwaves, heat exposure, extreme heat” and “workplace,
work-related injury, workers, occupational health and safety”. Literature databases used for this
review ranged from PubMed (biomedical sciences), Scopus, ScienceDirect, and Google Scholar.
Only original research articles published in English in peer reviewed journals were included,
whereas review articles, editorials, letters, conference abstracts, and government reports were
excluded.
Figure 1.2 shows the process of selection of articles for inclusion in this subheading. Out of 289
identified articles, 64 were finally included in the review, with 13 articles (20%) being
surveillance data analyses (ecological studies), 41 articles (64%) being cross-sectional studies, 6
articles (9%) being epidemiological experiments, and 4 articles (6%) being cohort studies, as
presented in Table 1.1 and 1.2 respectively.

Chapter one: Literature review
11
Figure 1.2 Process of selection of articles for reviewing health impacts of workplace heat exposure
1.2.1 Overview of published epidemiological studies on workplace heat exposure
As shown in Table 1.1, all 13 surveillance data analysis articles (ecological studies) were studies
from high income countries with over half from the USA, 3 from Australia, and 1 each from
Germany and Italy. In terms of data sources, about 50% of studies were based on government
surveillance data, and the remaining 50% were based on hospital or workplace daily records.
Only 3 studies explored the relationship between temperatures and work-related illnesses and/or
injuries, using Poisson regression analysis. Others simply described the distribution of heat-
related illnesses over time periods.

Chapter one: Literature review
12
As shown in Table 1.2, of the 51 studies (cross-sectional, experimental, and cohort studies), there
were 24 (47%) articles for outdoor workplaces, 21 (41%) for indoor workplaces, and 6 (12%) for
mixed workplaces. Approximately 25(49%) studies involved process generated heat. In terms of
region, most studies were carried out in the tropical zones, with 21 (41%) studies from South and
Southeast Asia, 12 (24%) from America, 8 (16%) from the Middle East, 7 (14%) from Australia,
and 3 (6%) from Europe. A range of heat indices were used with 25 (49%) studies using Wet
Bulb Globe Temperature (WBGT), 8 (16%) using subjective heat stress and 7 (14%) using air
temperature. Thirty four (79%) of the studies indicated that participants were suffering from heat
strain, with outdoor workplaces (90%) being much higher than indoor workplaces (65%). In
terms of gender, 45% of studies focused on male workers only. In contrast, one study from India
targeted only female workers. In addition, only 3 studies utilized qualitative research methods.
Overall, in terms of occupation classification, 20% of the 64 identified articles focused on
manufacturing workers in steel and foundry industries, followed by miners (18%), mixed manual
workers (16%), construction workers (13%), farmers (13%), and armed forces personnel (5%).
In a majority of those studies, survey data were collected using self-administered57, 65-67
or
interviewer-administered questionnaires.62, 68
1.2.2 Characteristics of heat exposure in selected relatively high risk occupations
The characteristics of workplace heat exposure may vary in different occupations. The impacts
of heat exposure can be particularly harsh on outdoor workers such as those in the agriculture,
construction, mining and manufacturing industries as well as the armed forced personnel and
fire-fighters as discussed in detail below.

Chapter one: Literature review
13
Table 1.1 Summary of findings from surveillance data analysis articles on workplace heat exposure published during January 1997-January 2014
1WBGT denotes wet bulb globe temperature.
Data sources Country Data period Target workers
Heat indices Statistical analysis Relationship between temp and occupational injuries/illnesses
The Australian Institute of Health and Welfare 57 Australia 2003-2004 Athletes Not used Descriptive analysis Not analysed
Hospital discharge data, New South Wales, Australia 69
Australia 2001-2004 Athletes Not used Descriptive analysis Not analysed
The medical centre of deep underground metal mine in Australia 70
Australia 1997-1998 Miners Dry bulb temp and WBGT1
Descriptive analysis, U test
Not analysed
Hard coal mines in the Ruhr district, Germany 71 Germany 1995-1999 Miners Basic effective temp
Multivariate linear regression
U-shaped curve
Admission records of 5 hospitals, Central Italy 27 Italy 1998-2003 All workers Apparent temp
Poisson regression Reversed U-shaped curve
The Washington State Department of Labour and Industries' State Fund, USA 72
USA 1995-2005 All workers Not used Descriptive analysis Not analysed
The Agricultural Safety and Health Bureau of the North Carolina Department of Labour, USA 73
USA 1992-2006 Farmers Not used Descriptive analysis Not analysed
The US Bureau of Labour Statistics (BLS) Census of Fatal Occupational Injuries (CFOI) 74
USA 2003-2008 Farmers Not used Descriptive analysis Not analysed
An aluminium smelting plant, USA 28 USA 1997-1999 Foundry workers
Dry bulb temp Poisson regression U-shaped curve
The US National Institute for Occupational Safety and Health Website 75
USA 1983-2001 Miners Not used Descriptive analysis, U-test, z-test
Not analysed
Total Army Injury and Health Outcomes Database, the US Army Research Institute76
USA 1980-2002 Soldiers Not used Poisson regression Not analysed
The Centre for Accession Research, US Army Accession Command 77
USA 2005-2006 Soldiers Not used Multiple logistic regression
Not analysed
The Maricopa County Department of Public Health, Arizona, USA 78
USA 2002-2009 All workers Not used Multiple logistic regression
Positive

Chapter one: Literature review
14
Table 1.2 Summary of epidemiological studies of workplace heat exposure published during January 1997-January 2014
Target workers Country Sample size Gender Study design Indoors or outdoors Heat stress indices
All workers 57 Thailand 40,913 Both Cohort Both Subjective symptoms
All workers 25 Thailand 37,816 Both Cohort Both Subjective symptoms
All workers 79 Thailand 58,495 Both Cohort Both -
All workers 80 Nepal 120 Both Cross-sectional Both WBGT, HI3, Humidex
Airport ground servicers 81 Saudi Arabia - - Cross-sectional Outdoor WBGT
Construction workers 66 Japan 319 Male Cross-sectional Outdoor WBGT
Construction workers 82 UAE1 150 Male Cross-sectional Outdoor TWL2
Construction workers 83 India 11 Female Cross-sectional Outdoor WBGT
Construction workers 84 Thailand 108 Both Cross-sectional Outdoor WBGT
Construction workers 85 UAE1 22 Male Cross-sectional Outdoor TWL2, dry bulb temp
Construction workers 86 Japan 12 Male Cross-sectional Outdoor WBGT
Construction workers 87 UAE1 44 Male Cross-sectional Outdoor -
Construction workers 88 Iran 60 Not indicated Cross-sectional Outdoor TWL, USG4
Cooks 89 Japan 12 Male Cross-sectional Indoor WBGT
Cooks 90 Japan 809 Both Cross-sectional Indoor WBGT
Cooks 91 Japan 16 Male Cross-sectional Indoor WBGT
Farmers 92 USA 300 Both Cross-sectional Outdoor Subjective symptoms
Farmers 93 USA 405 Both Cross-sectional Outdoor Subjective symptoms
Farmers 94 Costa Rica 42 Male Cross-sectional Outdoor Dry bulb temp
Farmers 95 Costa Rica 105 Male Cross-sectional Outdoor WBGT
Farmers 96 India 26 Male Cross-sectional Outdoor WBGT
Farmers 97 Costa Rica 17 Not indicated Cross-sectional Outdoor Subjective symptoms
Fire fighters 98 Canada 37 Both Experimental Outdoor Dry bulb temp
Fire fighters 99 Canada 40 Both Experimental Outdoor Dry bulb temp
Fire fighters 58 USA 16 Male Experimental Outdoor Dry bulb temp
Fire fighters 100 Australia 15 Male Experimental Outdoor Core and skin temp

Chapter one: Literature review
15
Forestry workers 101 Japan 125 Both Cross-sectional Outdoor Subjective symptoms
Manufacturing workers 102 UAE1 275 Not indicated Cross-sectional Indoor WBGT
Foundry workers 103 USA 31 Not indicated Cross-sectional Indoor WBGT
Aluminium smelter 104 USA 61 Both Cross-sectional Indoor Core temp, heat rate, USG4
Manufacturing workers 105 India - - Cross-sectional Indoor WBGT
Manufacturing workers 106 India - - Cross-sectional Indoor WBGT
Manufacturing workers 24 Bulgaria 102 Male Cohort Indoor WBGT
Manufacturing workers 107 India - - Cross-sectional Indoor WBGT
Manufacturing workers 108 India 242 Not indicated Cross-sectional Indoor Subjective symptoms
Mine rescue workers 109 USA - - Cross-sectional Indoor WBGT
Mine rescue workers 110 Germany 52 Male Cross-sectional Indoor Basic effective temp
Miners 111 Germany 38 Male Cross-sectional Indoor Basic effective temp
Miners 112 Australia 362 Not indicated Cross-sectional Indoor WBGT, TWL2
Miners 113 Australia 39 Male Cross-sectional Indoor WBGT, TWL2
Miners 114 Australia 36 Male Cross-sectional Indoor WBGT, TWL2
Miners 115 Australia 45 Male Cross-sectional Indoor WBGT, TWL2
Mixed manual workers 116 South Africa 151 Both Cross-sectional Outdoor Subjective symptoms
Mixed manual workers 62 Thailand 21 Both Cross-sectional Both WBGT
Mixed manual workers 117 UAE1 186 Male Cross-sectional Both USG4
Mixed manual workers 118 Australia 29 Male Cross-sectional Outdoor Dry bulb temp
Garbage collectors 119 Japan 10 Male Cross-sectional Outdoor Dry bulb temp, heart rate
Soldiers 120 Australia 64 Male Experimental Outdoor WBGT
Steel workers 121 Israel 3507 Both Cross-sectional Indoor Dry bulb temp
Steel workers 122 Taiwan, ROC 55 Male Cross-sectional Indoor WBGT
Steel workers 123 Brazil 8 Male Experimental Indoor WBGT
1UAE: United Arab Emirates; 2TWL: thermal work limit; 3HI: heat index; 4USG: urine specific gravity.

Chapter one: Literature review
16
1.2.2.1 Agricultural workers
Agriculture is one of the industries at highest risk of heat-related illness and injury.21, 63, 124
Farmers are often exposed to outdoor heat extremes for long periods, and often there is a lack of
occupational health and safety programs to protect them. In the USA, agricultural industries have
the third highest rate of heat-related deaths among all industries, with the mortality rate
approximately 20 times greater than for all civilian workers.74
In terms of heat-related morbidity,
farmers have been shown to be four times more likely than non-agricultural workers to suffer
from heat-related illnesses in the USA.125
Currently, published literature assessing farmers’ heat stress status is limited. Mirabelli identified
that 161 heat-related fatalities occurred from 1977 to 2001 in North Carolina by reviewing
medical records, and found that 45% occurred among farmers.126
In another study by the same
author, it was found that approximately 94% of farmers reported working in extreme heat,
among which 40% experienced heat stress related symptoms.92 At the time no regulations and
prevention measures were available for preventing heat exposure. A study of 124 Japanese
forestry workers showed that 32.3% had reported symptoms of heat illness.101
Additionally,
agricultural workers in some low-middle income countries may be at relatively higher risk of
heat exposure, due to the low levels of mechanized farming and motivation by payment based on
work output.94
1.2.2.2 Construction workers
In the building industry, several contributing factors increase the risk of heat-related illness and
injury. These include the constant use of machinery and powered tools, working on elevated
surfaces, heavy workload, simple accommodation conditions near work sites, being temporarily

Chapter one: Literature review
17
employed by a sub-contractor on a daily payment basis, and constant and direct exposure to
sunlight.63, 127
From 2003 to 2008, the US Census of Fatal Occupational Injuries recorded 196
heat-related mortalities, and construction workers occupied the greatest proportion (36%).74
A
self-administered questionnaire among 115 Japanese male construction workers in summer
demonstrated that in terms of heat-related subjective symptoms, up to 63.7% of workers reported
‘feeling thirst’ at work, followed by 42.2% reporting it was ‘easy to get fatigued’, 41.2%
reported ‘waking up early due to hot conditions’, 31.9% reported ‘impatience’, 13.2%
‘headache’, and 11.8% ‘dizziness’.66
Those symptoms are consistent with the hypothesis that
heat exposure may increase the risk of occupational accidents and injuries. In Taiwan63
and
Thailand,84
temporarily self-employed construction workers reported suffering from severe heat
strain because of physically demanding work and hot living conditions in dormitories near
construction sites.
However, if preventive measures are sufficient on building sites, workers could reduce heat-
related symptoms. A cross-sectional study has been conducted among 12 male workers in a
Japanese hydroelectric power plant building site with WBGT often exceeding the recommended
exposure limit values on a typical hot day in summer.86
However, there was no significant
change in subjective symptoms, serum electrolytes, blood pressures and heart rates before and
after work, because preventive measures had been taken. These included temporary tents for rest,
electric fans for ventilation, and automatic machines for cool drinks. However, there should be
caution in the interpretation of the results because of the small sample size and the fine weather
conditions during the two day investigation period. Apart from common preventive measures,
self-pacing (self-adjustment of work rate) can also be an effective way of reducing the risk of

Chapter one: Literature review
18
heat-related illness and injury as reported in a study of construction workers in the United Arab
Emirates.85
1.2.2.3 Miners
Hot working conditions in mines are very common and vary according to the type of mining. For
open-cut mines, heat exposure is similar to other outdoor workplaces. However, by far the most
problems of heat stress have been reported from underground mines as additional heat from
virgin rock and mines increase with depth. Furthermore, air auto-compression for ventilation
adds about 6℃ dry bulb temperature per 1000m of vertical depth.113 High humidity from water
required for dust control also contributes markedly to the thermal load. The incidence of heat
illness in underground mines has been reported to be higher for metal mining than for coal
mining as underground metal mines are usually much deeper than coal mines in the USA.75
One
study of miners in Australia showed that the incidence rate ratio of heat exhaustion for deep
mines below 1200 m compared with above 1200 m was 3.17.70
According to the 1983-2001 data from the US National Institute for Occupational Safety and
Health, most heat illness cases in mines occurred during dayshift hours rather than night shift
hours.75
This is to be expected for surface mining given the higher air temperatures during the
day. But for underground mining, there is lack of convincing reasons for more heat illnesses
during dayshift hours even after considering the greater proportion of dayshift workers than
nightshift workers, because there is no significant change in temperatures in underground mines
between day and night due to thermal damping effects.70
Brake and Bates114
suggested that the
normal diurnal variation of body internal temperature, which is relatively lower at night, may
contribute to the lower risk of heat illness on night shift. The effects of seasonal change on

Chapter one: Literature review
19
underground temperatures decrease with the increase of mining depth. Hence, heat illnesses may
occur throughout the year and with less incidence rate in non-warm seasons. As expected, most
heat illnesses have been reported in summer seasons.70, 75
Therefore, surface temperature
forecasts can also be useful for warning miners and management about the risk of heat illnesses.
In some low-middle income countries miners with heat illness symptoms may still keep working
in extremely hot environments due to relatively low perceptions of prevention strategies, lack of
protective measures, and income incentives, which may result in the occurrence of life-
threatening heat strokes. In South African deep underground gold mines, for instance, heat stroke
has been a serious occupational hazard since before the 1970s. In recent years due to
acclimatization and prevention measures, the incidence rate of heat stroke has been declining
significantly.68
The occurrence of heat stroke is reportedly relatively rare currently but still
remains unresolved.
In high income countries heat stroke cases are seldom reported in mining industries. In an
Australian deep underground mine with about 2 000 miners, no heat stroke cases had been
reported to the 24-hour on-site medical clinic during over 10 million work shifts in the period
1966-1997.114
Similarly, there were no cases of heat strokes reported in 1983-2001 in the USA
mining industry.75
Several reasons may contribute to the few occurrences of heat stroke cases in
high income countries. Firstly, this may be attributed to a flexible management approach and the
resistance of miners to continue strenuous labour in severe thermal conditions. Secondly, most
miners are presumably well-trained about the effects of working in heat. Thirdly, in high income
countries miners suffering heat-related illnesses generally report their conditions actively and
cease mining.70
Finally, adverse health effects may be averted because of self-pacing.111
Miller
et al even suggest that self-pacing should be encouraged as a protective behaviour without

Chapter one: Literature review
20
productivity compromise in the mining industry,82
as nowadays many tasks in mining are highly
mechanized and a reduction of work load may not necessarily result in productivity loss.
1.2.2.4 Armed forces personnel
Most epidemiological studies on military personnel have focused on specific military bases for
relatively short periods and with relatively small populations.77
At present, heat-related
morbidity and mortality analyses of military personnel data are based on consulting military
hospital records.76, 128, 129
Over time there has been a downward trend of heat illness
hospitalization rates due to preventive measures in the USA Army.76
The total number of
hospitalizations for heat illness reduced by 60% in the 22-year period of 1980-2002.76
However,
heat stroke rates have markedly increased eightfold.76
The possibility is that preventive measures
might allow compromised soldiers to avoid minor heat illnesses and continue to exercise until
more severe heat stroke occurs.
Overall, almost 60%-70% of heat illness cases in the USA military during the period of 1980-
2002 were reportedly due to heat exhaustion and 13%-18% for heat stroke.76
The percentage of
mild heat illnesses is small as individuals may recover rapidly in the field without being
hospitalized. Infantry soldiers had the greatest risk of heat illness in the USA in the period 1980-
2002,76
whereas soldiers in administrative and support jobs had the lowest risk. In addition,
ethnicity, gender, fitness level, and geographical origin are related to heat illness occurrence in
military populations. Caucasians are more vulnerable to heat illness than African Americans and
Hispanic Americans.76
Soldiers from northern USA are more susceptible to heat illness that those
from southern USA, and female soldiers are at greater risk of heat illness than male soldiers.76 In
Australia, there has been no such report due to data availability.

Chapter one: Literature review
21
1.2.2.5 Fire-fighters and other emergency workers
Fire-fighters are required to wear fire-fighting protective clothing and self-contained breathing
apparatus regardless of environmental temperatures. This personal protective equipment can
reduce the effect of heat dissipation and increase the risk of heat stress. Recently, based on
simulated trials among 70 volunteers recruited from the Toronto Fire Service, the replacement of
the duty uniform long pants and shirt, with shorts and T-shirt has been recommended by
McLellan and Selkirk98, 99
who claim it could significantly reduce heat strain and extend at least
10-15% heat exposure time. However, it raises concerns about whether the replacement of long
pants with shorts may put fire-fighters at greater risk of injury. Evidence from the New York
City Fire Department proved that not only were the burn incidence and severity not affected
when wearing shorts instead of long pants, but also the days lost due to heat illnesses were
significantly reduced.130
In a simulated fire-fighting drill among 16 male fire-fighters from a Fire Service Institute in the
USA, higher blood lactate levels, longer recovery time, and significantly increased heart rate and
core temperature were observed after performing tasks in a live fire environment than after
performing the same tasks in a non-fire environment.58
In the same study it was shown that
psychological impacts of emergency conditions are also a problem for fire-fighters. A dramatic
increase of anxiety level immediately following firefighting activities was found.58
Elevated
anxiety status may impact on cognitive performance, resulting in inappropriate decisions that
might increase of risk of injury. Interestingly, the relationship between perceptions of heat illness
and heat strain varies by thermal conditions. In non-hot conditions, the correlation coefficient
between perceptions of heat illness and heat strain was moderately positive, however, there was
little relationship in hot conditions. If perceived risk of heat illness is underestimated, fire-

Chapter one: Literature review
22
fighters may put themselves at greater risk. But there is a probability that the results may be
prone to information bias if participants were unwilling to report their real feelings because of
peer pressure.58
In addition, evidence has shown that outdoor workers in “electricity, gas and water” are at high
risk of heat strain131, 132
and occupational burns.133
Due to the nature of work, sometimes workers
in this industry have to work even during extremely hot weather to ensure the continuous supply
of electricity, gas, and water. Moreover, pipe failure rates in Australia and electric power outage
rates in the USA in summer were reportedly about 200% and 85% respectively higher than that
in other seasons,134, 135
indicating a potential increased work load in summer for outdoor utility
maintenance workers in this industry. However, there is no research to examine the impact of
extreme heat on heat-related illnesses and injuries recorded in this industry at a population level,
using occupational health and safety surveillance data.
1.2.2.6 Manufacturing workers
Manufacturing workers in non-air conditioned indoor workplaces are also at risk of heat-related
illness despite little or no direct sunlight radiation. The levels of heat stress can be very high in
workplaces surrounding hot machines, furnaces, ovens, and molten metal. Even in winter, the
temperatures near furnaces in a steel plant have ranged from 35.5 to 46.5℃ when the outdoor
temperature was only 14-18℃.122
Summer hot days may worsen the extent of heat stress for
individuals working around heat generating sources. Hence, many epidemiological studies have
focused on the impacts of workplace-generated heat on factory workers in steel plants,28, 123
foundries,24
automobile industries,107
and glass manufacturing units.106

Chapter one: Literature review
23
Excessive industrial heat exposure is associated with dyslipidemia,24
cardiovascular and
digestive diseases.136
However, a cohort study in a French stainless steel producing plant showed
that cardiovascular disease mortality was 10% lower for the workers exposed to heat than for a
control group that was not exposed.137
The negative relationship between heat exposure and
mortality may result from the ‘healthy worker effect’ due to the stringent selection criteria when
recruiting workers.
1.3 Personal vulnerability factors of workplace heat exposure
The likelihood and severity of heat strain experienced by an individual worker for a given level
of heat stress depends on the physiological capacity to respond to heat exposure. Personal risk
factors of heat strain are those elements that may reduce an individual’s heat tolerance. A
previous history of heat illnesses is a critical factor for heat tolerance.54
Other risk factors include
age, gender, lifestyle, acclimatization, medical conditions, and ethnicity, as summarized below.
1.3.1 Age
Previous literature has shown that physiologically, middle-aged men and women are more heat
intolerant than younger individuals in general according to a heat tolerance test.138 However, in
the workplace, epidemiological studies have found that younger workers seem to be more likely
to suffer from heat-related injuries and accidents.28, 72
The greater risk of experiencing heat-
related illnesses for younger workers is likely due to undertaking more strenuous tasks, lack of
safety training and working skills, relatively lower awareness of the risk of heat exposure, and
presumably compromised self-pacing or /and work breaks because of peer or supervisor
pressure.139-141

Chapter one: Literature review
24
By contrast, many community-based studies have shown that elderly people are more vulnerable
to extreme heat,142-145 which may be attributable to the ageing-related thermoregulatory
dysfunctions, and a higher prevalence of pre-existing heat aggravated chronic diseases.14
Currently, few studies have particularly investigated which age groups of workers are more
vulnerable to extreme heat at a population level. In 2004, Fogleman et al. found that older
workers had a slightly higher injury rate than younger workers in an US aluminium smelting
plant when the temperature exceeded 38℃, whereas younger workers showed consistently higher
injury rates than older workers in all other thermal categories below 38℃.28
Older male workers
were also found to be at higher risk of heat-related deaths in the US agricultural workers.78
Further research is needed regarding age-related variations in the vulnerability to heat-related
injury/accident during extreme heat when developing new heat prevention policies or guidelines.
1.3.2 Gender
Women have a lower sweat rate than men, which is disadvantageous in hot-dry environments,
but advantageous in hot-wet environments.146, 147
Menstrual cycle effects on heat tolerance are
minimal.146, 147
One qualitative study conducted in South Africa has shown that women felt they
could not cope with hot weather as well as men, especially when they had to undertake labour
intensive work,116
although the distinctions tended to disappear if cardiovascular fitness level,
aerobic capacity, surface area-to-mass ratio, and the extent of acclimation were standardized.53
When undertaking work of an emergency nature, women were found to be at greater risk of
suffering from heat-related illnesses and injuries than their male counterparts.148
More evidence
is required to develop consensus views regarding gender differences for heat exposure.149

Chapter one: Literature review
25
In terms of heat-related mortality in the general population, several studies have shown that
women were found to be at higher risk in the general population during heatwaves.143, 149-151
On
the contrary, in the workplace male workers have found to be at higher risk of heat-related deaths
than female workers,73
as male workers are more likely to undertake outdoor physically
demanding work with an inherently high risk of heat-related illnesses and injuries. In the period
between 1992–2006, 68 crop workers died from heat stroke in the USA, and nearly all of the
deaths were males.73
Further industry/occupation specific research may be needed to clarify
which gender is more vulnerable to extreme heat in the workplace, to identify whether it is
necessary to develop special adaptation guidelines and practice.
1.3.3 The use of certain medications, drugs, and alcohol during extremely hot periods
Certain medications have been reported to be one of the possible causes of extra morbidity and
mortality in the general population during heatwave periods.152
The use of many prescription
drugs and some over-the-counter medications require cautions when working in hot
environments. Certain drugs can affect human body thermoregulation in different mechanisms:
altered thermoregulatory mechanisms, drug administration-related fever, fever from the
pharmacologic action of the drug, idiosyncratic reactions, and hypersensitivity reactions.153
There are not only possible adverse effects of a single drug but also the interactions between
multiple medications. Limited research has been conducted to investigate the prevalence of
medications usage among workers particularly those working in hot environments. According to
the statistics from Washington State, at least 22% of the 480 heat-related workers’ compensation
claims reported during the period of 1995-2005 involved medication use.72

Chapter one: Literature review
26
As a central nervous system depressant, alcohol not only affects perception and judgment in high
doses, but also reduces thermoregulatory responses in low doses including vasomotor and
sweating reflexes, leaving working people more susceptible to heat-related illnesses and
injuries.154
The proportion of workers drinking alcohol may vary by regions and culture. Among
Japanese construction workers, the prevalence of every day drinkers and heavy drinkers was 28.7%
and 20%, respectively.66
By contrast, the percentage of regular drinkers was about 5.0% in a
Thai workplace according to a national cohort survey.79
In Australia, according to the 2001
National Drug Strategy Household Survey, approximately 8% of the workforce drank at least
weekly at short-term risky or high risk levels.155
Nevertheless, it is necessary to incorporate the
knowledge about the combined risks of alcohol consumption and heat exposure into heat stress
education or training programs. The NIOSH and the US Department of Labour156
also
recommend that the information about individual use of alcohol and certain drugs should be
included in pre-placement and periodic health assessments for workers exposed to heat in the
workplace.
1.3.4 Acclimatization level
Heat acclimatization is a series of physiological changes allowing workers to withstand heat
stress with a reduction in heat strain by the increased effectiveness and efficiency of heat
dissipation.157, 158
The time it takes for employees to adjust to the heat varies. It is estimated that
most individuals adjust gradually to higher occupational heat levels in 4 to 14 days.159
One study
demonstrated that the majority of heat stress complaints were from new workers who were not
acclimatized or limited to those who engaged in heavy work outdoor.108

Chapter one: Literature review
27
Worker acclimatization is a requirement for heat prevention and is not compromised by rest
breaks in air-conditioned settings.54 However, it is very important to note that employees coming
back from extended leave, new employees, or temporary contract labour from a cooler climatic
region will not be acclimatized and also at high risk of heat-related illnesses and injuries53
such
as seasonal workers in Australia.160
The effects of heat acclimatization can be decreased or
nullified by sleep loss, infection, dehydration, and salt depletion.55
1.3.5 Pre-existing diseases
In the general population, pre-existing chronic diseases such as cardiovascular diseases have
been found to be an important contributing risk factor resulting in excess mortality and
significant increases in hospital admissions and ambulance call-outs during heatwaves.143, 161
According to the Thai national cohort study investigating the association between heat stress and
occupational injury,79
3.6% of the 58,495 workers had existing illnesses, which may be to some
extent underestimated as about 70% of participants were less than 35 years of age. However,
whether the presence of pre-existing diseases was a risk factor for heat-related illnesses and
injuries in the workplace was not been analysed in the study. Currently, relevant epidemiological
evidence is limited on this topic and more work is needed in this area.
1.3.6 Hydration state
Remaining well-hydrated is one of the most effective interventions to protect workers’ health
and safety when working in hot environments. The breakdown of human body water balance has
been shown to elevate core temperature, adversely affect physical performance and coordination,
and impair cognitive function.162
As a result, dehydration may potentially result in an increased
risk of injuries and accidents. Bates et al. have observed a consistent pattern of poor hydration

Chapter one: Literature review
28
status in workers employed in a range of industries in Australia and in the Middle East in the past
decade.85, 112, 113, 117
A study conducted among outdoor workers at aboveground mines in the
Pilbara region of Western Australia in 2007, has shown that over 70% of the 710 workers’ urine
samples indicated that the workers were poorly hydrated, with 16% of the samples reaching a
state of clinical dehydration.112
Although results from other Australian studies varied,113, 163
in
almost all groups the mean hydration status assessed by urine specific gravity was inadequate,
leaving a large proportion of workers being compromised in their ability to work safely in the
heat.164
A similar situation was found among construction workers in the United Arab Emirates85,
117 and Iran.
88 The hydration status in some low-middle income countries may be worse,
especially in the agriculture industry. In some Central American countries such as Nicaragua, up
to 80% of sugarcane workers had signs of dehydration, with about 33% having severe
dehydration.165
A similar situation had been found in Costa Rican workers.94, 97
Education is a vital component to help workers maintain their hydration state. Some
organizations such as the NIOSH have made recommendations regarding fluid intake and
hydration, e.g. drink small amounts of water frequently, approximately 1 cup (250ml) every 15-
20 minutes.166
However, the recommended amounts may be either too much or too little,164
as
water deficits or dehydration levels vary greatly for individuals and between groups, depending
on the environment, protective clothing, and work intensity.
1.4 Awareness and knowledge of workplace heat exposure
Literature review was also conducted with the aim of summarizing the current views and
perceptions on heat exposure from different stakeholders. As mentioned previously, there is a
growing concern on the effects of heat exposure on workers’ health and safety in recent years,19-

Chapter one: Literature review
29
21, 33, 37, 40, 167, 168 which is mainly driven by a changing climate. A better understanding of how
people perceive the risk of heat exposure may provide implications for heat stress management.
However, so far limited studies have investigated the perceptions of workplace heat exposure.
For the literature review, the keywords used for the searching strategy of the first keywords [tiab]
AND the second keywords [tiab] included “heat stress, workplace heat exposure, occupational
heat exposure, heat illness” and “perceptions, attitudes, knowledge”. Only original research
articles published in English in peer reviewed journals were included, whereas review articles,
editorials, letters, conference abstracts, and government reports were excluded.
In total 8 papers investigating perceptions of workplace heat exposure were identified (Table 1.3).
All applied cross-sectional study design, with half of them targeting farmers. The majority (6/8)
of studies were qualitative studies involving interviews or focus group discussions. The data of
two quantitative questionnaire survey studies were analysed using descriptive analysis and
multivariate logistic regression.169, 170
1.4.1 Perceptions of heat among physical workers
Compared with the growing concerns on the impact of extreme heat on workers’ health and
safety in academia, current awareness about the occupational health and safety in hot
environment remains low in the workplace, according to interviews conducted among Indian
industrial workers,108
South African outdoor manual workers,116
and Costa Rican sugarcane
workers.97
In the Mexican Immigration to California: Safety and Acculturation (MICASA) Study,
more than 92% of 474 hired farmworkers were not at all or a little concerned about the risk of
heat illness at work in 2008-2010.169
This may be partly the reason why the US OSHA launched

Chapter one: Literature review
30
the Heat Illness Prevention Campaign in 2011 to raise awareness of heat exposure in the
workplace.171
An Australian study showed that for outdoor workers, exposure to high temperatures during the
hot summer months was regarded as ‘routine’.43
Similarly in southern India, heat exposure was
considered as a ‘common and general’ occupational hazard.108
This may indirectly reflect that
workers in Australia and India were either well acclimatized to heat or had low heat risk
awareness. To date few studies have investigated the factors affecting individuals’ heat
perceptions. In the MICASA Study, is has been found that females and individuals undertaking
certain specific types of jobs or with longer duration of outdoor work experience in agriculture
were more concerned about heat illnesses.172
In terms of knowledge about heat exposure, the majority of surveyed workers in the USA and
South Africa knew the symptoms and severe outcomes of excessive heat exposure.116, 169, 172
Inaccurate or incorrect answers were mainly in response to questions about heat acclimatization
and medication use,172
and the potential impact of climate change on occupational health and
safety.116 A minority of outdoor physical workers in South Africa thought that hot weather did
not affect their health and safety.116
Similarly in India, a study found most of the workers in the
sectors of heavy truck and vehicle manufacturing were not aware of the consequences of heat
stress.108
Evidence has shown that more concerns about heat stress do not necessarily result in more heat
knowledge. In the MICASA Study, female farm workers were more concerned about the risk of
heat exposure than male farmers; however, the latter had a significantly higher heat knowledge
score.169
In addition, workers’ actual behaviours against heat in the workplace were not

Chapter one: Literature review
31
necessarily consistent with the level of heat knowledge. For example, the female Latino farm
workers in the USA deliberately wore dark and tight clothes to induce sweating to lose weight;173
Some male farm workers drank cool beers at work to help quench thirst, and some workers
selected highly caffeinated energy drinks to increase alertness and productivity, although they
realized that it may increase this risk of heat illness.173
Therefore, it is important to understand
the mutual interactions between heat awareness, knowledge, and behaviours to assure the
effectiveness of heat prevention programs.
1.4.2 Awareness of workplace management personnel and relevant stakeholders
In South Africa, a study showed the majority of workplace supervisors agreed that physical work
in the sun was strenuous and that hot environments made it difficult for workers to perform
optimally.116
Moreover, many supervisors agreed that there was a need to take measures to
protect workers against heat exposure. By contrast, a study in India found that workplace
management, who were normally exempt from direct sun exposure, had limited awareness of the
need for preventive measures against heat stress, despite widespread reported thermal discomfort
by workers.108
Therefore, it is necessary to investigate the views of heat exposure among all
levels of people in the workplace including employees, employers and managers, as well as
related stakeholders.

Chapter one: Literature review
32
Table 1.3 Review of studies on perceptions and behavioural responses of workplace heat exposure in January 1997- January 2014
Reference Participant Country Study design Sample size Study period Data collection Statistical method
Mathee et al 116
Grave diggers, street sweepers, construction workers, and horticultural workers
South Africa
Cross-sectional study
151 focus group
discussions, 17 interviews
March 2009
Focus group discussions and interviews using semi-structured interview schedule
Grounded theory approach, and thematic analysis
Balakrishnan et al 108 Workers in 10 different industrial units
India Cross-sectional study
242 - Interviewer-administered questionnaire
Thematic analysis
Crowe et al 97 Sugarcane workers Costa Rica
Cross-sectional study
22 Nov 2008 –Mar 2009
Direct observations and exploratory interviews
Thematic analysis
Singh et al 43
Union and industry representatives, governmental officials
Australia Cross-sectional study
20 Summer of
2010 Semi-structured telephone interview
Thematic analysis
Shendell et al 170 Athletes USA Cross-sectional study
1,138 Feb-Mar
2008 Online questionnaire survey
Descriptive analysis
Flocks et al 174 Female farmworkers in pregnancy
USA Cross-sectional study
35 Spring of
2012 Focus group, semi-structured interview
Thematic analysis
Lam et al 173 Farmworkers USA Cross-sectional study
35 - Focus group Thematic analysis
Stoecklin et al 169 Farmworkers USA Cross-sectional study
474 Nov 2008-Feb 2010
Questionnaire survey Descriptive analysis, multivariate logistic regression

Chapter one: Literature review
33
1.5 Workplace heat exposure prevention
Heat-related illnesses and deaths are largely preventable. Heat stress management and control
may have multiple benefits in terms of better health, improved productivity, and improved sense
of comfort and social well-being, as well as reducing health costs.107
Work-related injuries are
often the result of a concurrence of many workplace hazards, and no injuries are likely to be due
solely to heat exposure alone.46
However, the control of heat stress may reduce the probability of
workplace injuries. Heat stress management strategies mainly include administrative control,
engineering control, training and education, and heat-related regulations.54
1.5.1 Administrative management
Administrative controls are a useful way to minimize heat-related illnesses and deaths in
workplaces. First, work times may able to be rearranged to reduce heat exposure. Strenuous
outdoor activities may able to be rescheduled to cooler times of the day,175
and routine
maintenance and repair work in hot areas should be scheduled for the cooler seasons of the
year.55
Second, cooling systems and facilities could be provided in the workplace where possible.
Workers should have free access to cool water and shaded or air-conditioned rest areas and
should be advised to drink small amounts frequently before they get thirsty. For instance, in
Japan86
and United Arab Emirates,85
tents, electric fans, cool drinking water and ice making
machines are available in some workplaces plus appropriate shift-work schedules. Thus, the
effects of hot working environments on the health of the workers have not been remarkable.
Further administrative controls include acclimatizing workers to hot work environments. This is
could be a low-cost and highly effective way of improving safety and delaying the development
of heat strain.53
Other administrative controls may include reducing the physical demands of

Chapter one: Literature review
34
work, and providing recovery areas. Emergency procedures should be in place to facilitate
immediate first aid and transport to medical care.55
Additionally, heat tolerance screening can
identify potential risk factors such as individuals taking particular medication; sufferers of
underlying medical conditions that may compromise thermoregulatory functions; excessive
alcohol intake; unsatisfactory levels of basic fitness; body mass index; and high blood pressure.33
This can be an effective way to prevent heat stress and strain.
1.5.2 Heat training and education
Health education for employers, on-site managers and employees is an important approach to
reduce workers’ thermal stress.113
Prevention of heat illnesses among workers requires educating
employers, managers and workers on the adverse effects of working in hot environments and
showing them the most effect adaptive approaches.73 Such occupational health and safety
education and training programs may include: the hazards of heat stress; recognition of
predisposing factors, danger signs and symptoms; creating awareness of first-aid procedures for,
and the potential health effects of, heat stroke; understanding the prevention strategies that the
employer must have in place and implementing appropriate heat stress management measures.55
In seasonal farmers in the USA, the high proportion of heat-related mortality among foreign-born
workers suggests that an effective health education approach should be considered for the
culturally and linguistically diverse (CALD) groups among workers such as using images and
their own languages.73
The occupational health and safety for seasonal workers during extreme
hot days is also a challenge in Australia, and so far there has been very little work conducted in
this area. Obviously more research needs to be done in this area, together with government
organisations and employers.

Chapter one: Literature review
35
1.5.3 Heat indices, policies and regulations for working in hot environments
A review of current literature of heat prevention regulations and policies was conducted to gain a
broad understanding of current heat stress policies and provide necessary evidence for the
development of heat prevention guidelines and regulations applicable to the workplaces. A
comprehensive search of the local and international heat stress, standards, heat indices,
guidelines, and regulations was therefore conducted.
The search strategy was the random combination of the first keywords “heat stress, extreme heat,
high temperature, and hot weather” and the second keywords “standard, regulation, exposure
limit, policy, and guidelines”. The following databases were searched: PubMed, Scopus,
ScienceDirect, Google Scholar, and ‘grey literature’ including national and international
organizations’ official websites in relation to occupational health and safety. A manual search for
relevant references in articles was also conducted. Contents involving heat prevention in the
complex occupational health and safety regulations/laws were identified by searching the
keywords “heat, temperature, weather, and work environment”. All superseded heat regulations,
codes, and standards were excluded. Documents not in English were translated by using Google
Translator.
1.5.3.1 Heat indices
Findings from the literature review revealed that since 1905 many attempts have been made to
measure the integrated heat stress level in the workplace and/or to estimate the corresponding
heat strain.176
A heat stress index is a composite measure used for the assessment of heat stress,
taking environmental and/or personal factors into account. Due to the complexity of interaction
of heat stress determining variables which exist in the real working environment, it may not be

Chapter one: Literature review
36
feasible to create a universal heat stress index accounting for each variable. Differences in
physical demanding level of tasks, health status, tolerance to heat, heat sources, interference of
thermolytic mechanisms, level of intermittent work, and the ambient environment may all
influence levels of risk. As a result, to date more than 40 heat indices have been created,176
which
provide a scientific basis for the establishment of safety criteria and limits for those working in
hot environments.
Heat indices can be divided into three categories: rational indices, based on calculations
involving the heat balance equation; empirical indices, based on measurements of objective and
subjective heat strain; and direct indices, based on measurements of environmental variables.176
Among all heat indices, the WBGT index is now the most widely used heat stress index for
workplace applications and adopted by many international organizations, although it still has
several limitations.177
It is regarded as an exploratory method to determine heat stress through
the calculation of radiative, dry bulb, and wet bulb values. The simplicity of WBGT makes it an
easy field assessment tool as it requires minimal equipment and training. This index has two
variations: including radiative or solar heat loads. Typically these have been used indoors or
outdoors:
Indoors: WBGT=0.7tnw+0.3tg
Outdoors: WBGT=0.7tnw +0.2tg+0.1ta
Where tnw= natural web bulb temperature; tg = globe temperature; ta = air temperature (dry bulb
temperature)

Chapter one: Literature review
37
Most recently in 2012, Lemke and Kjellstorm suggested a new heat stress index UTCI
(Universal Thermal Climate Index) with the aim to assess the trends of occupational heat
exposure at population level, using ordinary meteorological surveillance data.178
Some of the authoritative governing bodies that have developed heat stress guidelines and/or
indices include the International Organization for Standardization (ISO),52
the European
Committee for Standardization (CEN), the US National Institute for Occupational Safety and
Health (NIOSH),179
and the American Conference of Governmental Industrial Hygienists
(ACGIH).180
In addition to the internationally accepted technical standards, many countries have
formulated their own standards, according to local climatic characteristics, level of economic
development, and industrial structure.
1.5.3.2 Heat-related regulations in Australia
The management of heat exposure in the Australian workplaces has long been a perplexing
dilemma due to the lack of clear regulations.53 As summarized in Table 1.4, legal requirements
relating to heat stress in Australia are fairly ambiguous. To date, the federal government has not
released its national regulations specifying explicit standards for maximum temperatures in the
workplace.19
Moreover, no State or Territory has specific legal requirements for heat stress
control and prevention, whereas guidelines and educational materials relating to heat stress are
available on each state’s Safe Work or/and Department of Health websites. Recently, the
Construction, Forestry, Mining and Energy Union (CFMEU) South Australia Branch launched a
campaign about working in extremely hot weather.181
It suggests that “If temperature is less than
35°C work continues normally but take actions to minimize heat stress as temperature rises in

Chapter one: Literature review
38
exposed areas”; “If temperature is over 35°C work in exposed areas ceases”; and “If temperature
is over 37°C all work ceases unless working in air conditioned area.”
Australia is one of the observing countries involved in the production of ISO heat standards.52
Heat stress standards and guidelines developed by the Australian Institute of Occupational
Hygienists (AIOH) were basically adopted from the US TLVs,180
which have been updated in
2013 for use in the Australian environment.54
Table 1.4 summarizes regulations and codes for
Australia.
Overseas heat-related regulations and guidelines are summarized in Appendix A.

Chapter one: Literature review
39
Table 1.4 Australian legal regulations and codes for occupational heat stress
Jurisdiction Legislation Scope Requirements relating to management of heat stress
National 182 Model Work Health and Safety Regulations 2014
All workplaces
Part 3.2 General workplace management, Division 2 General working environment (page 101): "A person conducting a business or undertaking at a workplace must ensure, so far as is reasonably practicable, the following: …(f) workers carrying out work in extremes of heat or cold are able to carry out work without risk to health and safety"
National 183 Model Work Health and Safety Act 2011
All workplaces None required
National 184 Model Code of Practice - Construction Work
Construction
Part 7 General workplace management arrangements (page 61): "Consider rescheduling work in the open in very hot weather conditions, or ensure subcontractors are adequately managing risk of heat stress; Providing access to adequate, cool, clean water; Providing access to appropriate PPE"; Page 65, "A readily accessible and plentiful supply of drinking water must be available to all workers on the site."
National 185 Model Code of Practice - Managing the Work Environment and Facilities
All workplaces
Part 2.8 Heat and cold (page 14): "Work should be carried out in an environment where a temperature range is comfortable for workers and suits the work they carry out…"; "If it is not possible to eliminate exposure to extreme heat, the risk of heat strain and heat exhaustion must be minimised so far as is reasonably practicable. For example: „increase air movement using fans, install air-conditioners..."; "An adequate supply of clean drinking water must be provided free of charge for workers at all times."
South Australia 186 Work Health and Safety Act 2012 All workplaces None required
South Australia 187 Mines and Works Inspection Regulations 2013
Mining None required

Chapter one: Literature review
40
South Australia 188 Work Health and Safety Regulations 2012
All workplaces and mining
Chapter 3, Part 2 General workplace management, Division 2 General working environment: "A person conducting a business or undertaking at a workplace must ensure, so far as is reasonably practicable, the following: …(f) workers carrying out work in extremes of heat or cold are able to carry out work without risk to health and safety"; Chapter 10 Mines, part 2, division 3 (page 116): "the mine operator of a mine must ... (b) if risks associated with extreme heat exist in an underground mine—implement control measures (including monitoring) to manage heat stress in places in the mine where—(i) persons work or travel; and (ii) the wet bulb temperature exceeds 27°C."
Australian Capital Territory 189
Work Health and Safety Act 2011 All workplaces None required
Australian Capital Territory 190
Work Health and Safety Regulation 2011
All workplaces
Part 3.2 General workplace management, Division 3.2.2 General working environment (page 29): "A person conducting a business or undertaking at a workplace must ensure, so far as is reasonably practicable, the following: …(f) workers carrying out work in extremes of heat or cold are able to carry out work without risk to health and safety"
Australian Capital Territory 191
Work Health and Safety (Construction Work Code of Practice)
Construction
Part 7.1 The work environment (page 33): "workers exposed to extremes of heat or cold are able to carry out work without risk to their health and safety…"; Page 35: "Outdoor workers should be provided with protection in adverse weather conditions, for example sunshades, sheds, caravans, tents and windbreaks."
Australian Capital Territory 192
Work Health and Safety (Managing the Work Environment and Facilities) Code of Practice 2011
All workplaces
Part 2.8 Heat and cold (page 15): "Work should be carried out in an environment where a temperature range is comfortable for workers and suits the work they carry out…"; "If it is not possible to eliminate exposure to extreme heat, the risk of heat strain and heat exhaustion must be minimised so far as is reasonably practicable. For example: „increase air movement using fans, install air-conditioners..."; "An adequate supply of clean drinking water must be provided free of charge for workers at all times."
New South Wales 193 Work Health and Safety Act 2011 All workplaces None required

Chapter one: Literature review
41
New South Wales 194 Work Health and Safety Regulation 2011
All workplaces
Part 3.2 General workplace management, Division 2 General working environment: "A person conducting a business or undertaking at a workplace must ensure, so far as is reasonably practicable, the following: …(f) workers carrying out work in extremes of heat or cold are able to carry out work without risk to health and safety"
New South Wales 195 Managing the work environment and facilities: Code of practice
All workplaces
Part 2.8 Heat and cold (page 14): "Work should be carried out in an environment where a temperature range is comfortable for workers and suits the work they carry out…"; "If it is not possible to eliminate exposure to extreme heat, the risk of heat strain and heat exhaustion must be minimised so far as is reasonably practicable. For example: „increase air movement using fans, install air-conditioners..."; "An adequate supply of clean drinking water must be provided free of charge for workers at all times."
Northern Territory 196 Model Work Health and Safety (WHS) Act
All workplaces None required
Northern Territory 197 Model Work Health and Safety (WHS) Regulations
All workplaces
Part 3.2 General workplace management, Division 2 General working environment: "A person conducting a business or undertaking at a workplace must ensure, so far as is reasonably practicable, the following: …(f) workers carrying out work in extremes of heat or cold are able to carry out work without risk to health and safety"
Northern Territory 198 Transitional Arrangements for Construction Work
Construction None required
Queensland 199 Work Health and Safety Act 2011 All workplaces None required
Queensland 200 Managing the Work Environment and Facilities Code of Practice 2011
All workplaces
Part 2.8 Heat and cold (page 14): "Work should be carried out in an environment where a temperature range is comfortable for workers and suits the work they carry out…"; "If it is not possible to eliminate exposure to extreme heat, the risk of heat strain and heat exhaustion must be minimised so far as is reasonably practicable. For example: „increase air movement using fans, install air-conditioners..."; "An adequate supply of clean drinking water must be provided free of charge for workers at all times."

Chapter one: Literature review
42
Queensland 201 Foundry Code of Practice 2004 Foundry Part 3.1 "Working in heat: altering the work environment, administrative controls …"
Queensland 202 Hazardous Manual Tasks Code of Practice 2011
All workplaces
Part 4.8 Changing the work environment (page 30): "For workers in hot and humid conditions, reduce temperature and humidity during manual tasks where possible by relocating work away from sources of heat, providing fans or air-conditioning, using screens, awnings and clothing to shield workers from radiant heat sources such as ovens, furnaces and the sun..."
Queensland 203 Forest Harvesting Code of Practice 2007
Forestry Part B workplace health and safety, 14 heat stress (page 37): "To avoid heat stress: the golden rule for workers in hot conditions who may be feeling weak or faint is to stop work immediately and cool down..."
Queensland 204 Children and Young Workers Code of Practice 2006
All workplaces None required
Queensland 205 Managing the risk of falls at workplaces
All workplaces Part 2.3 How to control the risk: "When assessing the risks arising from each fall hazard, the following matters should be considered, such as …extreme heat…"
Queensland 206 Traffic Management for Construction or Maintenance Work Code of Practice 2008
Construction
Part 8.3 Sun and heat (page 17): "Every workplace should carry out its own assessment of sun exposure, identify tasks that place workers at risk, and control workers’ sun exposure."; "Some examples of controlling exposure to sun and heat are: wearing personal protection, taking precautions and setting time limits spent working in the sun during summer’s highest risk time – between 9 am and 3 pm, reorganising work schedules so that outdoor tasks are done early in the morning or late in the day..."
Victoria 207 Occupational Health and Safety Act 2004
All workplaces None required
Victoria 208 Occupational Health and Safety Regulations 2007
All workplaces None required

Chapter one: Literature review
43
Victoria 209 Mines Act 1958 Mining None required
Victoria 210 Working Safely With Trees 2001 (recommended practices for the amenity tree industry)
Tree industry
Part 3.1 Heat and cold (page 36): “Inform and train workers to recognise symptoms of heat-related illness and to understand the need to drink coo, non-alcoholic fluids; allow workers time to acclimatise to working in heat. This takes several days; make sure workers take frequent rest breaks in hot or humid conditions; provide shade where possible, at least for break periods; Cease work if conditions become unsafe to continue…”
Victoria 211 Health and Safety in Shearing Shearing Part 10 Work in heat and cold (page 34): “ changing working hours to avoid working during the hottest part of the day; allowing for acclimatisation to heat by workers; decreasing the workload in very hot conditions…”
Victoria 212
Guidance Note: Working in heat (Advice about how to prevent heat illness from working outdoors in hot weather or where heat is generated as part of work)
All workplaces
“increasing air movement using fans; installing shade cloth to reduce radiant heat from the sun; removing heated air or steam from hot processes using local exhaust ventilation; locating hot processes away from people; insulating hot processes or plant; isolating employees from the hot process by locating them in air conditioned control rooms…”
Victoria 213 Foundries-Compliance Code 2008 (guidance)
Foundry
pp7-8, “an acclimatisation process; pacing of work to suit the conditions; scheduling of hot work in cooler parts of the day or isolating it by distance from other workers; rotation of hot tasks between employees to minimise exposure time; employees are trained, educated and continuously monitored for sighs of excessive heat exposure and heat stroke…”
West Australia 214 Occupational Safety and Health Act 1984
All workplaces None required
West Australia 215 Occupational Safety and Health Regulations 1996
All workplaces Part 3.15: "Employer must ensure — that work practices are arranged so that employees are protected from extremes of heat and cold."

Chapter one: Literature review
44
Tasmania 216 Construction Industry (Long Service) Act 1997
Construction None required
Tasmania 217 Work Health and Safety Act 2012 All workplaces None required
Tasmania 218 Mines Work Health and Safety (Supplementary Requirements) Act 2012
Mining None required
Tasmania 219 Construction Work: Code of Practice
Construction
Part 7.1 The work environment (page 35): "If it is not reasonably practicable to eliminate exposure to heat and cold, risks can be minimised with a range of control measures. Examples of control measures in a hot work environment may include installing shade structures, task rotation, rest breaks, or isolating workers from heat. Workers must have access to adequate, cool, clean water."
Tasmania 220 Managing the Work Environment and Facilities
All workplaces
Part 2.8 Heat and cold (page 14): "Work should be carried out in an environment where a temperature range is comfortable for workers and suits the work they carry out…"; "If it is not possible to eliminate exposure to extreme heat, the risk of heat strain and heat exhaustion must be minimised so far as is reasonably practicable. For example: „increase air movement using fans, install air-conditioners..."; "An adequate supply of clean drinking water must be provided free of charge for workers at all times."
Tasmania 221 Work Health and Safety Regulations 2012
All workplaces
Division 2-general work environment: "A person conducting a business or undertaking at a workplace must ensure, so far as is reasonably practicable, the following: …(f) workers carrying out work in extremes of heat or cold are able to carry out work without risk to health and safety"

Chapter one: Literature review
45
1.6 Discussion
If the predictions about future temperature increases prove reliable, weather-related extreme heat
exposure will be placing many types of indoor and outdoor workers at increasingly high risk of
heat-related illnesses and injuries.19-21, 30
For acclimatised manual workers, a few degrees rise in
temperature can make dangerous days increase to 15-26 days per year in 2070 compared to 1 day
per year at present in Australia.36
Outdoor workers, in particular those undertaking highly
intensive and physical activity such as construction and road maintenance under the sun are
susceptible to heat stress during heatwaves when preventive measures are not adequately
adopted.66, 83, 86, 87, 92, 94, 96, 97
Physical and strenuous activity generating internal body heat load
associated with increasing metabolic rate, together with significant radiant heat load from direct
sunlight, may further worsen heat stress. Indoor workers, especially those working around
furnaces, ovens, smelters and boilers, are at a higher heat stress risk on hot days.58, 98, 99, 121, 122
Despite indoor workers not being exposed to direct solar radiation, they can be exposed to heat
and humidity generated from work processes or equipment. Their working environment can also
become very hot when a cooling system is not available or ventilation is insufficient during hot
days.122
The review of the health impacts of workplace heat exposure has examined 64 epidemiological
studies published between January 1997 and January 2014. Due to the availability of
occupational health and safety data, all published papers based on surveillance data have been
from high income countries. Although the underreporting of work-related injuries may challenge
the data quality and affect the reliability of results, these findings provide a good overview of the
characteristics of occupational health and safety in hot condition. However, roughly three
quarters of the articles simply described the distribution of heat-related illness or injuries by

Chapter one: Literature review
46
industrial sectors, occupations, seasons, and months, suggesting most of heat-related illnesses
and injuries occurred in summer months and hottest parts of the day.72
There is lack of further
data analyses exploring the quantitative association between temperatures and heat/work-related
injuries.
In general, the association between temperature and morbidity & mortality has been
characterized as U, V, or J-shaped relationship.11, 13, 15, 16, 18, 222
Some attempts have been made to
identify threshold temperatures,18, 223, 224
above which health outcomes increase significantly. It
provides useful evidence-based implications for the establishment of extreme heat early warning
systems.225
However, in the workplace preventive measures may be adopted and workers may be
able to stop work or self-pace if the workplace temperature is extremely high.226
This can result
in a decline in the number of work-related injuries at the certain temperature point, which is
described as reversed U-shaped curve.27, 139, 226
However, if denominator information is available
for calculating work-related injury rates, the relationship still appears to be U-shaped curve.64, 111
The relationship patterns between temperatures and work-related injuries may vary by industries,
gender, and age group. For example, young workers aged less than 30-years-old showed
consistently higher injury rates than other age groups in all thermal categories,111
which may be
related to the practice of assigning young workers with more physically demanding work, in
addition to their lack of experience for self-pacing.
More epidemiological analyses based on occupational injury surveillance data are needed to
quantify the extent to which high-risk manual workers are affected by workplace heat exposure
and to identify risk factors for workplace heat prevention and adaptation,37
especially for low-
middle income countries in tropical regions.20
This is achievable if there is a routine occupational
injury surveillance system, which may provide epidemiology-based evidence for the decision of

Chapter one: Literature review
47
heat alert temperatures in the workplace. There are several points worth noting when analysing
the temperature-occupational injury relationship, including the selection of appropriate
regression models, the adjustment of confounding factors, and the handling of non-linear
relationship.222, 227, 228
Among these reviewed articles, only three papers used Poisson regression
suitable for count data.27, 28, 76
However, none reported checking whether the distribution of
work-related injuries was over-dispersed or not, in which case negative binominal regression is
more appropriate.229
Consideration should also be given to the selection of functions when using
GEE (generalized estimating equation) models. In terms of confounding factors, amongst the
reviewed articles only Morabito27
took public holidays, weekends, and time-lag effects into
account, whereas the long-term variation trend and day of week were not adjusted. As to the
problem of non-linearity, piecewise linear regression or linear spline functions have been
adopted in some studies by dividing temperature ranges into several pieces.27, 28
Usually, the number of reported direct heat illness is very small. In Australia, statistics show
there were only 485 work-related illnesses and injuries due to exposure to environmental heat in
the 11-year period of 1997-2007.230
Similarly, 480 heat-related illnesses were identified during
the 11-year period of 1995-2005 in Washington State, USA.72
If just based on the reported
statistical figures, it is not surprising that heat stress is not listed as occupational health priority.
However, it should be noted that heat-related illnesses may be underreported largely due to
following reasons. Firstly, many high income countries utilize workers’ compensation claims to
measure occupational health and safety performance. However, the compensation based data do
not provide any information for groups not covered by workers’ compensation schemes, such as
some self-employed workers. Secondly, some workers with minor injuries may not apply for
compensation claims. Most heat illnesses are mild and individuals recover rapidly through

Chapter one: Literature review
48
simple treatment or rest on site without hospitalization. Thirdly, because heat exposure can
exacerbate existing medical conditions, illness or death due to heat exposure may be preceded by
other diseases and reported as other diseases other than heat illness. Additionally, the criteria
used to determine heat illness and death vary largely, resulting in misclassification. Overall, it
should be realized that a huge potential risk of heat-related injury and accident may be disguised
by the underestimated number of heat-related illness and death.
In contrast to surveillance data analyses, most cross-sectional field surveys aiming to investigate
heat stress status and workers’ physiological responses to heat are from low-middle income
countries, especially in tropical regions.62, 83, 94, 97, 106-108, 116
It is consistent with the regional maps
proposed by Hyatt,35
predicting regions at high risk of occupational heat exposure. With global
climate change trends, extreme workplace heat exposure situations may extend to large areas of
the world apart from Australia, South Asia, Southern Africa, Central America, and southern
USA. A majority of the studies show that workplace heat stress exceeds the heat stress criteria of
the American Conference of Governmental Industrial Hygienists and is presenting a threat to
manual workers’ health and safety. Usually, physiological responses and subjective symptoms of
industrial workers exposed to heat include elevated blood pressure and urine gravity, increased
recovery heart rates and body temperature, and increased fatigue symptoms.58, 71, 86, 98, 112, 115, 117,
122 However, if effective prevention measures are taken in the workplace, risk of heat-related
illness and injury can be significantly reduced.66, 85, 121, 123
Workers’ self-pacing has been found to reduce heat strain in construction and mining industries
in Australia,114, 115
Germany,111
and the United Arab Emirates.82
Currently, there is no consensus
about whether self-pacing should be encouraged in the workplace. Positive self-adjustment of
work pace to a safe level could be considered as a flexible management approach to maintain

Chapter one: Literature review
49
productivity without compromising workers’ safety in hot environments.82
This can be subject to
the conditions that the task has no urgent character and does not involve work output based
payment incentives that workers should be well trained in their job, and that self-pacing may be
associated with close supervisory surveillance.231
On the contrary, if self-pacing is workers’
passive physiological or/and psychological reactions to thermally stressful conditions by slowing
work pace, it may be inefficient either in terms of productivity or in terms of heat strain
reduction. Evidence from field studies in Australia has suggested that few workers will
voluntarily work at a pace that requires an average heart rate over 110 bpm for any length of
time,114
a level consistent with WHO recommendation.232
In addition, there are few studies to investigate how decision-makers, occupational hygienists,
employers, supervisors, unions, workers and relevant stakeholders perceive the role of self-
pacing for reducing the risk of heat-related illnesses and injuries in the workplace. This can be
important for the formulation of heat-related policies, guidelines and regulations and more
studies in this area should be encouraged.
1.7 Summary and research gaps
With the predicted increasing frequency and intensity of extremely hot weather due to climate
change,30-32
workplace heat exposure is presenting an increasing challenge to employers and
employees.19-21, 30
Manual workers who are exposed to extreme heat or work in hot environments
may be at risk of heat stress, especially for workers in low-middle income countries in tropical
regions.233, 234
Those workers include farmers, construction workers, fire-fighters, miners,
soldiers, and manufacturing workers working around process-generated heat.56, 64
If effective
prevention measures are taken in the workplace, the negative effects from extreme heat on the

Chapter one: Literature review
50
occupational health and safety for workers may be reduced.66, 85, 121, 123
There is lack of research
exploring the quantitative association between temperatures and heat/work-related injuries in
Australia despite the hot climate. The potential impacts of workplace heat exposure are to some
extent underestimated due to the underreporting of heat illnesses and the lack of awareness that
heat exposure can increase the risk of work-related injuries.
There are significant gaps in knowledge in this area. These may include: (1) a lack of
epidemiological evidence of the extent to which Australian workers are affected by or adapted to
weather-related extreme heat; (2) a lack of the knowledge about which types of work-related
illnesses/injuries are associated with heat exposure; (3) a lack of the incidence and
epidemiological characteristics of occupational heat illnesses; (4) a lack of relevant
investigations about perceptions of weather-related extreme heat exposure in workplaces in
Australia; and (5) a lack of threshold temperature based specific heat regulations. The knowledge
gaps summarized here represent important areas for future research regarding extreme heat and
workers’ health and safety. Other possible future research directions are discussed in Chapter 9.

Chapter two: Study design and methodology
51
Chapter 2
Study design and methodology
2.1 Introduction
This chapter describes the geographical and demographic characteristics of the study region, and
outlines the overall research aims and objectives of the thesis. The research questions are listed
and the framework of the study is explained together with an overview of study design and
justification of methodologies used in data analysis.
2.2 The study region
South Australia (SA) had a population of 1.60 million with a labour force of 784,328 in 2011.235
The industries which play an important part of SA’s economy include meat, wheat, wine, wool,
machinery, mining, fishing, vehicle manufacturing, and petroleum products. Adelaide (latitude
34º55’ S and longitude 138º35’ E) is the capital city of South Australia (Figure 2.1), with a
population of 1.23 million and a labour force of 576,823 in 2011.236
According to the Australian
Bureau of Statistics, the most common occupations in Adelaide included ‘professionals’(21.6%),
‘clerical and administrative workers’(15.4%), ‘technicians and trades workers’(14.0%),
‘managers’(11.1%), ‘community and personal service workers’(10.7%), ‘sale workers’ (9.9%),
‘labourers’ (9.9%), and ‘machinery operators and drivers’ (5.8%).236
Characterized by the influences of heat and aridity from the north and moisture and coolness
from the south and west, Adelaide has a Mediterranean climate. Of all Australian capital cities,
Adelaide is the driest with very limited rainfall during hot dry summers and maximum

Chapter two: Study design and methodology
52
temperatures reaching as high as 46.1℃. According to weather projections for Adelaide, the
average number of days with temperatures over 35°C will triple by 2070.32
Thus, high ambient
temperatures may have and will continue to pose a growing challenge for occupational health
and safety.
Figure 2.1 Location of metropolitan Adelaide, Adelaide, South Australia (adapted from Google map)
Adelaide metropolitan area

Chapter two: Study design and methodology
53
2.3 Aims and objectives of the study
The aim of the study was to identify the effects of workplace heat exposure on workers’ health
and safety in Adelaide, South Australia, to investigate how workers and occupational hygienists
perceive the risk of workplace heat exposure, and to provide scientific evidence for the
development of heat prevention and adaptation strategies in a warming climate.
The objectives of the study are:
To explore the association between daily ambient temperatures and work-related injuries by
analysing workers’ compensation claims data and weather data in Adelaide;
To identify which categories of workers are most vulnerable to extreme heat;
To investigate workers’ perceptions, knowledge, and heat adaptation barriers towards
extreme heat exposure in the workplace; and
To understand the perceptions of occupational hygienists towards extreme heat exposure in
the workplace;
To provide recommendations and suggestions for the development of heat adaptation and
prevention strategies.
2.4 Research questions
The research questions to be addressed in this thesis include:
To what extent workers are impacted by weather-related heat exposure in Adelaide, South
Australia?
What is the association between ambient temperature and work-related illnesses and
injuries?
Which groups of workers are at higher risk of illnesses and injuries during heatwaves?

Chapter two: Study design and methodology
54
Which types of illnesses and injuries are most prevalent during heatwaves?
What are the risk perceptions of workers and relevant stakeholders? What are the existing
barriers for prevention and adaptation?
What new intervention and adaptation strategies can be developed to reduce the risk of work-
related illnesses or injuries when working in hot environments?
2.5 Framework of the study
To address the research questions, this study can broadly be divided into two parts, as shown in
Figure 2.2. Part I assesses the impact of extreme heat on workers’ health and safety, using
workers’ compensation claim data and weather information, obtained respectively from the
SafeWork South Australia and the Bureau of Meteorology for the period of 2001-2010. In
Chapter 3, the epidemiological distribution characteristics of injury claims reported in SA during
the study period is first described. Despite previous evidence showing that heat stress was an
occupational hazard in South Australia,46
the incidence rate and the epidemiological distribution
characteristics of occupational heat illnesses in SA remains unknown. These issues are addressed
in Chapter 4. To evaluate the extent to which heat exposure may increase the risk of work-related
injuries, the analyses were restricted to the Adelaide metropolitan areas, and the association of
age, gender, business size, industry, occupation, and daily maximum temperature was assessed
(Chapter 5). Furthermore, the impact of consecutive extreme heat exposure (heatwaves) on
workers’ health and safety was examined, and the illnesses and injuries significantly associated
with extreme heat are identified (Chapter 6).

Chapter two: Study design and methodology
55
Part II is a questionnaire survey, to investigate perceptions of workers (Chapter 7), occupational
hygienists and relevant stakeholders (Chapter 8) about workplace heat exposure in the context of
a warming climate.
Findings of this study may provide scientific evidence to help relevant stakeholders develop
preventive strategies targeted on vulnerable subgroups and prioritize work-related illnesses and
injuries associated with heat exposure. A diagrammatic representation of the overall framework
of the study is shown in Figure 2.2.

Chapter two: Study design and methodology
56
Part I Part II
Merge with weather data
in daily time-series format
Epidemiological
description of injury claims
Identification of heat-
related injury claims
Self-administered questionnaire survey Analyses of workers’ compensation claims
data
Workers Hygienists and relevant
occupational stakeholders
Characteristics of
heat-related injury
claims
Association between
daily temperatures
and injury claims
Impact of extreme
heat events on
injury claims
Perceptions of workplace heat exposure,
behavioural responses, and the identification of
heat adaptation barriers
Identify vulnerable sub-groups and specific
illnesses and injuries associated with heat
Provide recommendations for the development of
heat prevention policies and strategies
Figure 2.2 Flowchart outlining the framework of the study

Chapter two: Study design and methodology
57
2.6 Methodology used in the study
2.6.1 Analysis of occupational surveillance data
2.6.1.1 Data collection
Under the South Australian WorkCover Scheme directed by the Workers Rehabilitation and
Compensation Act 1986,237
injured workers can lodge a compensation claim to WorkCover SA.
All reported compensation cases are required to be aggregated to the government-run regulator
SafeWork SA (SWSA).Workers’ compensation data have been used as a tool monitoring work-
related injuries and diseases in South Australia since 1987.The Type of Occurrence
Classification System (TOOCS2) for claims was introduced in 1999 as coding guidelines for
describing details of reported workers’ compensation cases.238
The information needed for the allocation of appropriate codes is mainly sourced from the
description given on the medical certificate or claim application form. Four classifications are
designed in the TOOCS to assist in describing the type of injury or disease sustained by the
worker, including the nature of injury (based on the International Classification of Diseases,
ICD-10), bodily location, mechanism, and agency of injury/disease.238
Each case is allocated 4
codes according to the above four categories. Workers’ compensation claim data are a good
occupational surveillance data resource currently available for measuring the trend of workers’
health and safety at population level.
De-identified workers’ compensation claims data for the period of 1st July 2001 to 30
th June 2010
were obtained from SafeWork South Australia. The data included all accepted compensation
claims from both registered and self-employed employers during the 9-financial year periods (1
July to 30 June next year). Individual identifiable information was removed prior to receipt of the

Chapter two: Study design and methodology
58
data. A confidentiality agreement (Appendix C) was signed between the SWSA and the
University of Adelaide to ensure the dataset was only used for research purposes. Data included
demographic and employment information (including age, gender, occupation, and industry),
injury information (where and when the injury occurred, the nature and bodily location of the
injury, and details of the cause), and outcome information (i.e. time lost from work and total
medical expenditure).
To assess the impact of extreme heat on workers’ health and safety, climatic data (daily
maximum and minimum temperatures and relatively humidity) in Adelaide over the study period
were obtained from the Bureau of Meteorology, Kent Town station, centrally situated in
metropolitan Adelaide.
Ethics approval for the analysis of workers’ compensation claims data was obtained from the
Human Research Ethics Committee at the University of Adelaide (H-111-2011) (Appendix B1-2).
2.6.1.2 Data analysis
Summary frequency statistics were used to describe the epidemiological distribution
characteristics of workers’ injury claims and occupational heat illness claims. Time series design
was chosen for the analyses of heat-injury claims association, which has been widely used in
environmental epidemiology in recent years.222, 227
A ‘time-series’ design refers to a sequence of
data points recorded at regular time intervals. The main unit of analysis is represented by
aggregated or grouped observations, not the individual person. Therefore, individual related
confounding factors such as age, gender, smoking status, and body mass index do not apply to
this method, because the distribution of these factors do not change from day to day at
population level and cannot be associated with fluctuations in environmental exposures.227
The

Chapter two: Study design and methodology
59
main feature of the analytical methods is the temporal decomposition of the outcome and
exposure series, where the variability is partitioned into contributions related to different
timescales.222, 227, 239
Time series is a valid method to investigate whether some of the short-term
variation in the health outcomes can be explained by the changes in the main exposure.227
In this
study, time series design is used to investigate whether day-to-day changes in the number of
injury claims can be explained, at least in part, by heat exposure (daily temperature or
consecutive days with high temperatures).
After determining the time series study design for the analysis of the workers’ compensation
claim data, it is important to select a best-fit model to estimate the outcome-exposure
association.222
In this study, the generalized estimating equations (GEE) model was selected,
based on the following two considerations. First, the time series format temperature-injury claim
dataset in essence can be treated as a longitudinal study, with the assumption that daily injury
claims were repetitively collected among different years of the study period. Second, injury
claims may be correlated within each year. Failure to incorporate correlation of responses can
lead to incorrect estimation of regression model parameters.240
The GEE approach was created
by Liang and Zeger in 1986 for use in analysing longitudinal or repeated measures research
designs,241, 242
and hence is suited to this application. Another strength of GEE is its
appropriateness for the analysis of data that the dependent variable is not normally distributed
and correlated within sub-groups,240
compared with the Ordinary Least Squares (OLS) regression
models. Therefore, GEE has been widely used in the heat-health outcomes studies.18, 243-248
Correctly fitting a GEE model is important for the estimates of the heat-injury association, which
is sensitive to the choice of link functions, the distribution and the correlation structure of the
dependent variables.222, 240
For count data (e.g. daily injury claims), generally the most

Chapter two: Study design and methodology
60
appropriate link function is the logarithm of the mean which make the GEE techniques part of
the log-linear models.240
Regression coefficients represent the expected change in the log of the
mean of the dependent variable for each change in a covariate.240
Regarding the distribution of
the dependent variable (daily injury claims), negative binominal regression accounting for over-
dispersion was selected.229, 240
The last step is the specification of a working correlation structure.
Incorrect specification of the correlation structure can affect the efficiency of the estimates,
although GEE models are robust to misspecification of the correlation structure.240
In this study,
first order autocorrelation structure was selected, as in other similar heat-health studies.244, 245, 247
The relationship between temperature and health outcomes is usually non-linear, being described
as U, V, or J-shaped.11, 13, 15, 16, 18, 27, 139, 222
Thus, a simple log-linear function is not adequate to
capture the real relationship between temperature and work-related injury risk. Based on the
assumption of more than one segment in the relationship between daily injury claims and
temperatures, a hockey-stick model was selected to determine the cut point in the curve at which
the change in slope occurs.12
Parameters are determined using informative initial estimates of the
slope and threshold temperatures in iterative non-linear regression models. Calculated threshold
temperatures should approximate visual estimates and have a statistical significance level of 0.05.
The threshold model can be defined as:12
E(Y) = β0 for Tmax<x0[1]
and
E(Y) = β0 + β1 (Tmax- x0) for Tmax ≥x0 [2]

Chapter two: Study design and methodology
61
Where E(Y) is the expected value of the outcome variable, β0 is the baseline number of daily
admissions, x0 is the threshold temperature value to be determined, β1 is the slope of the segment
of the regression line prior to the change point; β0 is the slope after the change point. If a nonzero
slope is expected in Equation 1, the model becomes:
E(Y) = β0 + β1 (Tmax) for Tmax<x0[3]
and
E(Y) = β0 + β1(x0) + β2 (Tmax- x0) for Tmax ≥x0 [4]
The Stata command ‘nl hockey’ was used to estimate the threshold temperatures.12, 139
Additionally, case-crossover design was chosen to evaluate to the extent to which extreme heat
(heatwave) may increase the risk of occupational heat illnesses, given that the number of injury
claims due to environmental heat is likely to be very small according to the findings of previous
literature.72
The case-crossover design is suited to the study of transient effects of exposure (e.g.
heatwave) on acute events (e.g. occupational heat illnesses).249
The key feature of the design is
that each case serves as its own matched control. Therefore, this design can automatically control
for individual related confounders such as age, gender and occupation.250 An effect estimate is
calculated by dividing the number of cases exposed during the hazard period (heatwave) by the
number exposed during the control period (non-heatwave). Conditional logistic regression
analysis is typically used to calculate risk estimates.251, 252

Chapter two: Study design and methodology
62
2.6.2 Questionnaire survey
There are two cross-sectional self-administered questionnaire surveys in this study. The first
questionnaire survey aims to investigate worker’s perceptions of workplace heat exposure in the
context of climate change, and to identify existing heat prevention and adaptation barriers in the
workplace. Target workers were determined according to the findings of occupational
surveillance data analyses and previous literature. With the support of SafeWork South Australia
(Appendix D), employers who were interested in participating in the research helped the
distribution of questionnaires and reply-paid envelopes to workers and TAFE students meeting
the inclusion criteria.
Another questionnaire survey was conducted during the 2012 Australian Institute of
Occupational Hygienists Conference period, the aim of which was to investigate how
professional hygienists and relevant occupational stakeholders perceive the risk of workplace
heat exposure. Descriptive analysis was used to summarize the percentage distribution of
perceptions by different strata e.g. age, gender, occupation, and industry. Bivariate and
multivariate logistic regression analysis was used to explore factors relating to the perceptions of
heat exposure.
Ethics approval for the two questionnaire surveys was obtained from the Human Research Ethics
Committee at the University of Adelaide (H-200-2011) (Appendix H).

63
SECTION II
HEAT EXPOSURE AND
WORK-RELATED INJURY

64
Introduction
This Section comprises 4 chapters, utilizing workers’ compensation claim data and weather data
to investigate the effects of heat exposure on workers’ health and safety at the population level.
Chapter 3 describes the epidemiological distribution characteristics of workers’ compensation
claims reported during the study period in South Australia (SA), to provide some background
information and implications for the following three chapters.
Chapter 4 is intended to estimate the incidence rates of occupational heat illnesses in SA, to
describe its distribution characteristics, to quantify the association between ambient temperatures
and occupational heat illnesses using time-series analysis, and to investigate to what extent
heatwaves may increase the risk of occupational heat illnesses using case-crossover design.
In Chapter 5, time-series analyses with GEE models are used to explore the association between
daily maximum temperatures and daily injury claims by age group, gender, industry, occupation,
and business size. Using the same analysis methods as Chapter 5, Chapter 6 investigates the
impacts of several consecutive days’ of high temperatures (i.e. heatwave) on injury claims, to
identify the high risk sub-groups, and to examine which types of work-related illnesses and
injuries are associated with heat exposure.
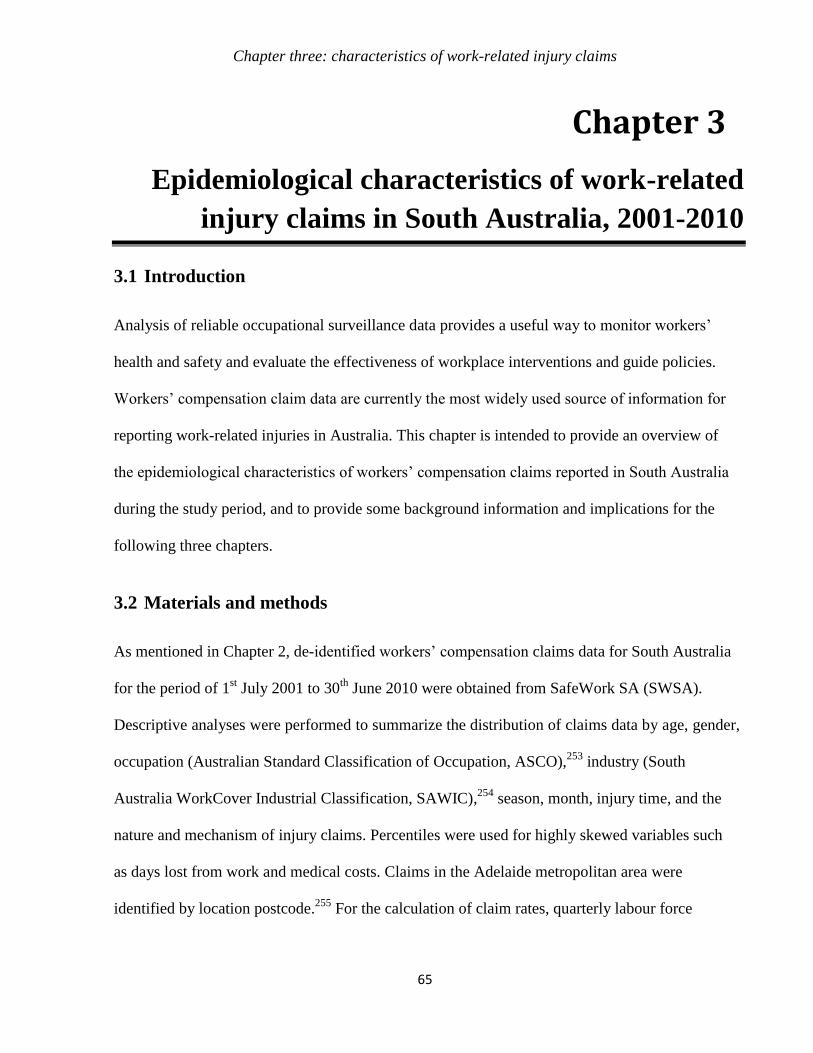
Chapter three: characteristics of work-related injury claims
65
Chapter 3
Epidemiological characteristics of work-related
injury claims in South Australia, 2001-2010
3.1 Introduction
Analysis of reliable occupational surveillance data provides a useful way to monitor workers’
health and safety and evaluate the effectiveness of workplace interventions and guide policies.
Workers’ compensation claim data are currently the most widely used source of information for
reporting work-related injuries in Australia. This chapter is intended to provide an overview of
the epidemiological characteristics of workers’ compensation claims reported in South Australia
during the study period, and to provide some background information and implications for the
following three chapters.
3.2 Materials and methods
As mentioned in Chapter 2, de-identified workers’ compensation claims data for South Australia
for the period of 1st July 2001 to 30
th June 2010 were obtained from SafeWork SA (SWSA).
Descriptive analyses were performed to summarize the distribution of claims data by age, gender,
occupation (Australian Standard Classification of Occupation, ASCO),253
industry (South
Australia WorkCover Industrial Classification, SAWIC),254
season, month, injury time, and the
nature and mechanism of injury claims. Percentiles were used for highly skewed variables such
as days lost from work and medical costs. Claims in the Adelaide metropolitan area were
identified by location postcode.255
For the calculation of claim rates, quarterly labour force
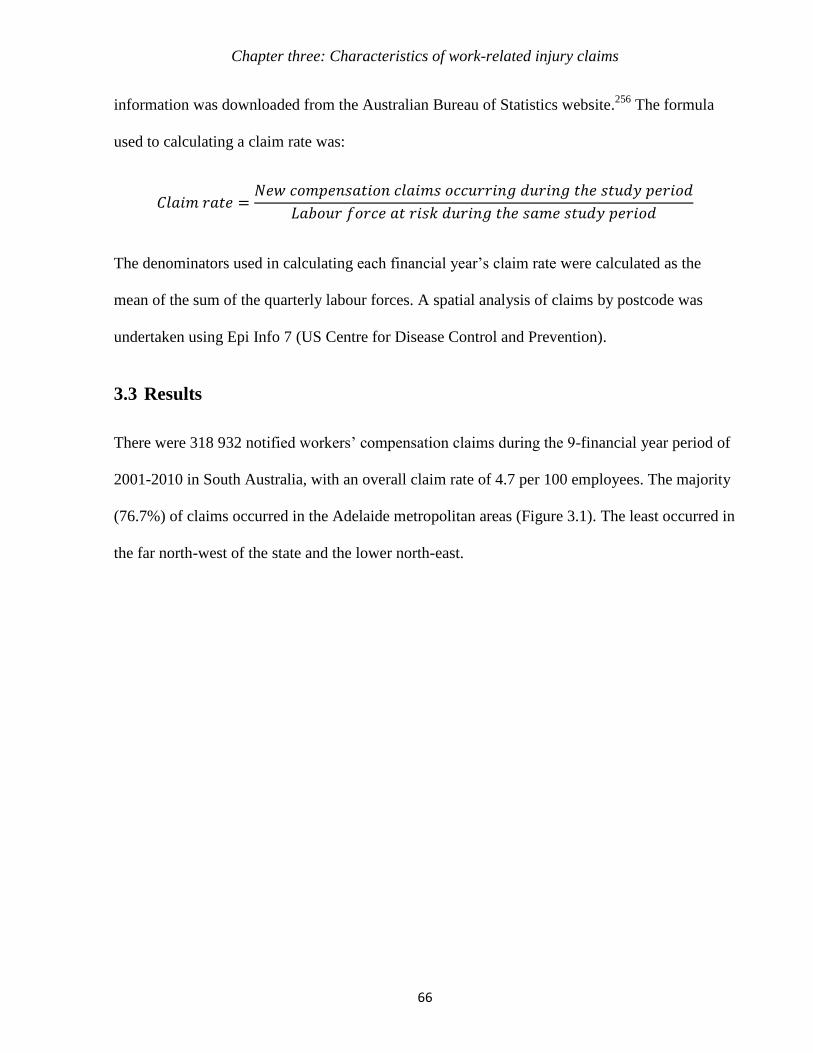
Chapter three: Characteristics of work-related injury claims
66
information was downloaded from the Australian Bureau of Statistics website.256
The formula
used to calculating a claim rate was:
𝐶𝑙𝑎𝑖𝑚 𝑟𝑎𝑡𝑒 =𝑁𝑒𝑤 𝑐𝑜𝑚𝑝𝑒𝑛𝑠𝑎𝑡𝑖𝑜𝑛 𝑐𝑙𝑎𝑖𝑚𝑠 𝑜𝑐𝑐𝑢𝑟𝑟𝑖𝑛𝑔 𝑑𝑢𝑟𝑖𝑛𝑔 𝑡ℎ𝑒 𝑠𝑡𝑢𝑑𝑦 𝑝𝑒𝑟𝑖𝑜𝑑
𝐿𝑎𝑏𝑜𝑢𝑟 𝑓𝑜𝑟𝑐𝑒 𝑎𝑡 𝑟𝑖𝑠𝑘 𝑑𝑢𝑟𝑖𝑛𝑔 𝑡ℎ𝑒 𝑠𝑎𝑚𝑒 𝑠𝑡𝑢𝑑𝑦 𝑝𝑒𝑟𝑖𝑜𝑑
The denominators used in calculating each financial year’s claim rate were calculated as the
mean of the sum of the quarterly labour forces. A spatial analysis of claims by postcode was
undertaken using Epi Info 7 (US Centre for Disease Control and Prevention).
3.3 Results
There were 318 932 notified workers’ compensation claims during the 9-financial year period of
2001-2010 in South Australia, with an overall claim rate of 4.7 per 100 employees. The majority
(76.7%) of claims occurred in the Adelaide metropolitan areas (Figure 3.1). The least occurred in
the far north-west of the state and the lower north-east.

Chapter three: Characteristics of work-related injury claims
67
Figure 3.1 Spatial distribution of workers’ compensation claims in South Australia, 2001-2010 by
postcode
3.3.1 Age and gender
As shown in Table 3.1 and Figure 3.2, claim counts and claim rates across the state for both
genders during the study period demonstrated a gradually downward trend from 2001 to 2010.
The number of claims lodged by male workers (218 554) was about twice that of female workers
(100 343). Moreover, male workers’ claim rate was significantly higher than that of female
workers (2=620 000, p<0.001).
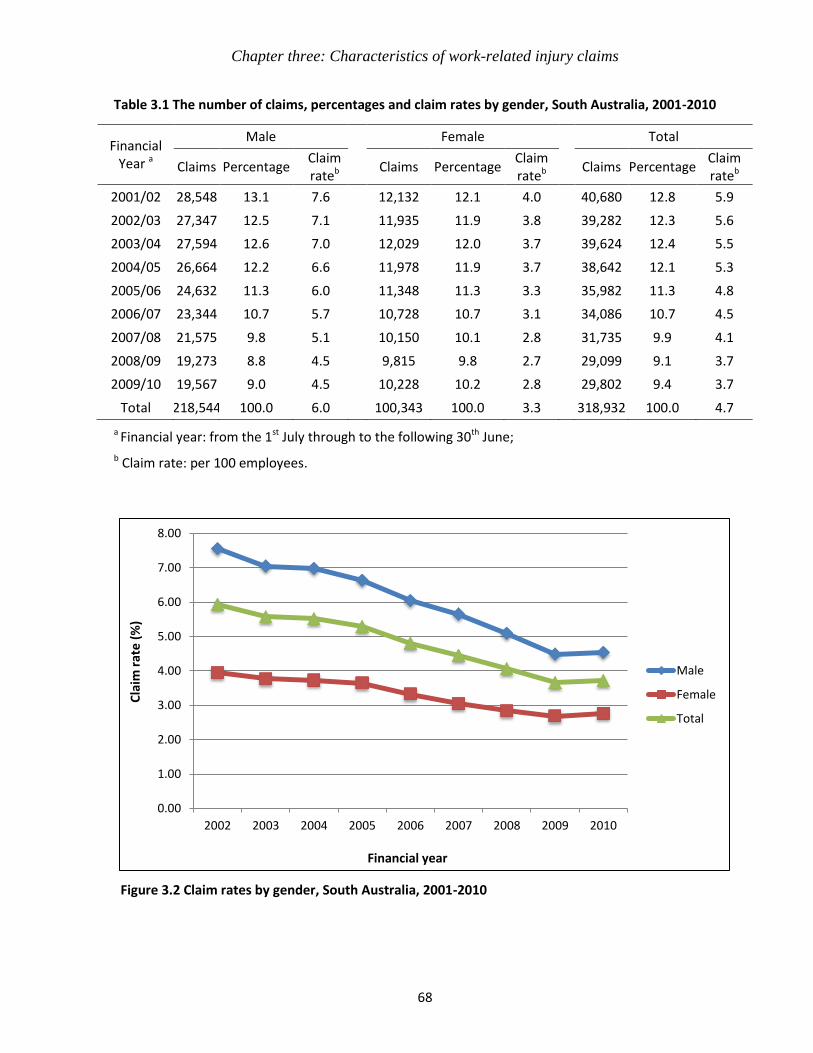
Chapter three: Characteristics of work-related injury claims
68
Table 3.1 The number of claims, percentages and claim rates by gender, South Australia, 2001-2010
Financial Year a
Male Female Total
Claims Percentage Claim rateb
Claims Percentage Claim rateb
Claims Percentage Claim rateb
2001/02 28,548 13.1 7.6 12,132 12.1 4.0 40,680 12.8 5.9
2002/03 27,347 12.5 7.1 11,935 11.9 3.8 39,282 12.3 5.6
2003/04 27,594 12.6 7.0 12,029 12.0 3.7 39,624 12.4 5.5
2004/05 26,664 12.2 6.6 11,978 11.9 3.7 38,642 12.1 5.3
2005/06 24,632 11.3 6.0 11,348 11.3 3.3 35,982 11.3 4.8
2006/07 23,344 10.7 5.7 10,728 10.7 3.1 34,086 10.7 4.5
2007/08 21,575 9.8 5.1 10,150 10.1 2.8 31,735 9.9 4.1
2008/09 19,273 8.8 4.5 9,815 9.8 2.7 29,099 9.1 3.7
2009/10 19,567 9.0 4.5 10,228 10.2 2.8 29,802 9.4 3.7
Total 218,544 100.0 6.0 100,343 100.0 3.3 318,932 100.0 4.7
a Financial year: from the 1st July through to the following 30th June;
b Claim rate: per 100 employees.
Figure 3.2 Claim rates by gender, South Australia, 2001-2010
0.00
1.00
2.00
3.00
4.00
5.00
6.00
7.00
8.00
2002 2003 2004 2005 2006 2007 2008 2009 2010
Cla
im r
ate
(%
)
Financial year
Male
Female
Total

Chapter three: Characteristics of work-related injury claims
69
As shown in Table 3.2, 99.2% of reported claims were distributed in the working age groups of
15-64 years. Young workers (aged 15-24 years)140
represented about 17.1% of all claims. The
distribution pattern of the proportion of claims in different age groups between males and
females was similar, and increased gradually with the increase of age, peaking at 35-44 years for
males and 45-54 years for females. Claim rates for male workers decreased gradually as age
increased. By contrast, for female workers claim rates increased gradually between 15-54 years
and then declined in the over 55 years age bracket.
Table 3.2 Claims, percentages, and claim rates by age group and gender, South Australia, 2001-2010
Age range Male Female Total
Claims Percentage Claim rateb Claims Percentage Claim rateb Claims Percentage Claim rateb
<15a 98 0.1 - 81 0.1 - 180 0.1 -
15-24 40,171 18.4 6.6 14,374 14.3 2.5 54,556 17.1 4.6
25-34 52,519 24.0 6.7 17,751 17.7 2.9 70,283 22.0 5.0
35-44 55,879 25.6 6.5 25,641 25.6 3.5 81,525 25.6 5.1
45-54 45,088 20.6 5.5 30,170 30.1 4.1 75,266 23.6 4.8
55-64 22,967 10.5 4.7 11,907 11.9 3.3 34,881 10.9 4.1
65+ 1,822 0.8 1.9 419 0.4 0.9 2,241 0.7 1.6
Total 218,544 100.0 6.0 100,343 100.0 3.3 318,932 100.0 4.7
a <15: The denominator (labour force information) for <15 age group is not available;
b Claim rate: per 100 employees.
3.3.2 Season, month, and injury time
No significant differences were found in the number of claims between the four seasons during
the study period (ANOVA, F=0.985, p=0.412). Nevertheless, claims reported in summer were
the least among the four seasons (Table 3.3). The percentages of claims by month had significant

Chapter three: Characteristics of work-related injury claims
70
differences (ANOVA, F=2.801, p=0.003), ranging from the highest percentage (9.0%) in March
to the lowest (7.1%) in December when workers often take their annual leave (Table 3.4).
Table 3.3 Claims by season, South Australia, 2001-2010
Season Claims Percentage (%)
Summer (December-February) 74,710 23.4
Autumn (March-May) 81,394 25.5
Winter (June-August) 81,489 25.6
Spring (September-November) 81,294 25.5
Total 318,887 100.0
Table 3.4 Claims by month, South Australia, 2001-2010
Month Claims Percentage (%)
January 23,972 7.5
February 28,197 8.8
March 28,600 9.0
April 24,757 7.8
May 28,053 8.8
June 25,657 8.0
July 27,469 8.6
August 28,376 8.9
September 26,247 8.2
October 26,846 8.4
November 28,210 8.9
December 22,548 7.1
Total 318,932 100.0

Chapter three: Characteristics of work-related injury claims
71
As shown in Figure 3.3, the distribution of claims by time of day showed that injuries were at a
low level between 1am-6am and began to increase at 7am. The first peak appeared between
10am-12pm. The second peak was observed at 3pm, and thereafter decreased gradually.
Figure 3.3 Distribution of claims by injury time and gender, South Australia, 2001-2010
3.3.3 Industry
As shown in Table 3.5, approximately two-thirds of work-related compensation claims during
the study period involved three industrial sectors: ‘community services (e.g. health, school
education, museum, library, and meteorology services)’ (27.4%), ‘manufacturing’ (26.7%), and
‘wholesale and retail trade’ (15.8%). The ‘manufacturing industry’ had the highest claim rate,
followed by ‘community services’, ‘transport and storage’, ‘mining’, ‘wholesale and retail trade’,
‘construction’, and ‘electricity, gas and water’ during the study period.
0
5000
10000
15000
20000
25000
30000
35000
1am
2am
3am
4am
5am
6am
7am
8am
9am
10
am
11
am
12
pm
1p
m
2p
m
3p
m
4p
m
5p
m
6p
m
7p
m
8p
m
9p
m
10
pm
11
pm
12
am
The
nu
mb
er
of
clai
ms
Injury time
Female
Male
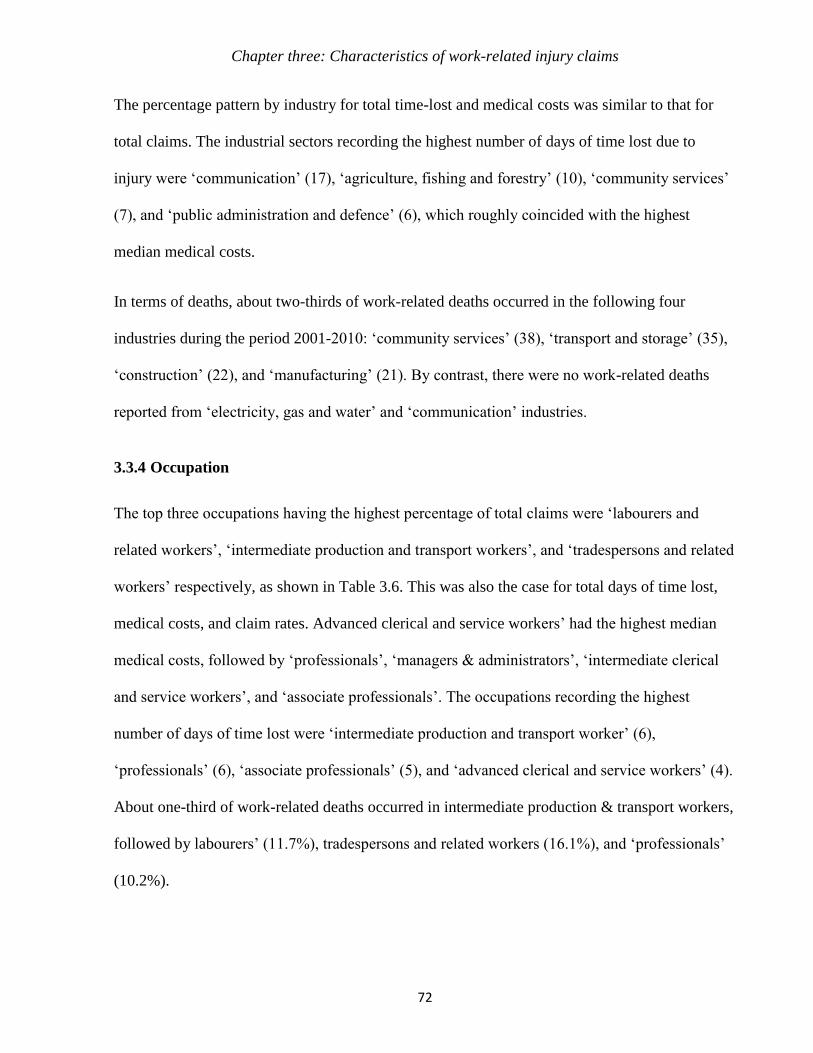
Chapter three: Characteristics of work-related injury claims
72
The percentage pattern by industry for total time-lost and medical costs was similar to that for
total claims. The industrial sectors recording the highest number of days of time lost due to
injury were ‘communication’ (17), ‘agriculture, fishing and forestry’ (10), ‘community services’
(7), and ‘public administration and defence’ (6), which roughly coincided with the highest
median medical costs.
In terms of deaths, about two-thirds of work-related deaths occurred in the following four
industries during the period 2001-2010: ‘community services’ (38), ‘transport and storage’ (35),
‘construction’ (22), and ‘manufacturing’ (21). By contrast, there were no work-related deaths
reported from ‘electricity, gas and water’ and ‘communication’ industries.
3.3.4 Occupation
The top three occupations having the highest percentage of total claims were ‘labourers and
related workers’, ‘intermediate production and transport workers’, and ‘tradespersons and related
workers’ respectively, as shown in Table 3.6. This was also the case for total days of time lost,
medical costs, and claim rates. Advanced clerical and service workers’ had the highest median
medical costs, followed by ‘professionals’, ‘managers & administrators’, ‘intermediate clerical
and service workers’, and ‘associate professionals’. The occupations recording the highest
number of days of time lost were ‘intermediate production and transport worker’ (6),
‘professionals’ (6), ‘associate professionals’ (5), and ‘advanced clerical and service workers’ (4).
About one-third of work-related deaths occurred in intermediate production & transport workers,
followed by labourers’ (11.7%), tradespersons and related workers (16.1%), and ‘professionals’
(10.2%).

Chapter three: Characteristics of work-related injury claims
73
3.3.5 Nature of injury
As shown in Table 3.7, claims due to ‘traumatic joint/ligament and muscle/tendon injury’
accounted for 42.0% of total claims, 41.1% of total time lost and 41.9% of medical costs.
‘Digestive system diseases’ resulted in the highest median number of days of time lost (10) and
medical costs ($5,643), although the percentages for total claims, time-loss, and medical costs
for digestive system diseases were as low as 1.0%, 0.8%, and 0.7% respectively. Claims due to
‘mental disorders’ represented 3.8% of total claims, with the second highest median time-lost
days (5) and medical costs ($5,248). ‘Circulatory system diseases’ were the most common
causes of work-related deaths, representing about 26.3% of total deaths, followed by intracranial
injuries (7.0%), and fractures (6.5%).
3.3.6 Mechanism of injury
As shown in Table 3.8, injury claims due to ‘body stressing’(injuries or diseases resulting from
stress placed on muscles, tendons, ligaments and bones)238
accounted for 38.0% of all claims
during the study period. About half of total time-loss days and medical costs resulted from body
stressing. Among all injury mechanisms, ‘mental stress’ had the highest median time-loss days
(5) and the second highest median medical costs ($5,445). Although ‘sound and pressure’ related
claims only represented 1.5% of total claims, resulting in 1.1% of total time-lost and 1.1% of
total medical expenditure, they resulted in the highest median medical costs ($6,316). Claims due
to “heat, electricity and other environmental factors” accounted for 2.6% of all claims. About 0.6%
of total time lost and 0.8% of medical costs were attributable to “heat, electricity and other
environmental factors” which ranked in the lowest third for median medical costs. Eight workers
died from “heat, electricity and other environmental factors”, representing about 4.3% of total
deaths during the study period.

Chapter three: characteristics of work-related injury claims
74
Table 3.5 The number of claims, percentage, time-loss days, medical costs, and deaths by industry, South Australia, 2001-2010
a SAWIC: South Australia WorkCover Industrial Classification (SAWIC);
b Claim rate: per 100 employees.
SAWIC a Industrial Classification Claims: n (%) Claim rateb
Total time-loss days: n (%)
Time-loss days: median (25-75th
percentile)
Total medical costs ($): n (%)
Medical costs($): median (25-75th
percentile)
Death: n (%)
Community services 87,525 (27.4) 6.6 3,147,472 (30.6) 0 (0-7) 1,148,644,412 (28.8) 576 (144-3,533) 38 (20.4)
Manufacturing 85,131 (26.7) 10.2 2,062,355 (20.0) 0 (0-1) 946,990,274 (23.7) 400 (135-2,356) 21 (11.3)
Wholesale and retail trade 50,271 (15.8) 4.9 1,402,715 (13.6) 0 (0-0) 503,170,268 (12.6) 332 (116-1,821) 14 (7.5)
Construction 22,062 (6.9) 4.6 945,978 (9.2) 0 (0-0) 369,179,594 (9.2) 382 (119-3,480) 22 (11.8)
Recreational, personal and other services
16,648 (5.2) 2.1 643,476 (6.2) 0 (0-1) 198,163,959 (5.0) 350 (115-2,493) 7 (3.8)
Transport and storage 16,388 (5.1) 5.4 701,837 (6.8) 0 (0-3.5) 292,929,550 (7.3) 528 (168-4,013) 35 (18.8)
Finance, property and business services
12,163 (3.8) 1.3 591,880 (5.7) 0 (0-2) 199,840,951 (5.0) 520 (134-4,326) 14 (7.5)
Agriculture, fishing and forestry 9,800 (3.1) 2.7 482,379 (4.7) 0 (0-10) 162,178,359 (4.1) 465 (113-4,325) 18 (9.7)
Public administration and defence
10,700 (3.4) 2.6 153,111 (1.5) 0 (1-6) 77,522,584 (1.9) 964 (279-4,101) 4 (2.2)
Mining 3,496 (1.1) 5.0 101,176 (1.0) 0 (0-1) 62,489,395 (1.6) 621 (139-5,916) 7 (3.8)
Electricity, gas and water 2,408 (0.8) 3.2 12,927 (0.1) 0 (0-0) 13,244,011 (0.3) 399 (120-1,892) 0 (0.0)
Communication 213 (0.1) 0.2 17,466 (0.2) 0 (0-17) 6,406,118 (0.2) 813 (145-11,787) 0 (0.0)
Non-classified 2,127 (0.7) - 36,121 (0.4) 0 (0-0) 12,561,232 (0.3) 0 (0-0) 6 (3.2)
Total 318,932 (100) 4.7 10,298,893 (100) 0 (0-3) 3,993,320,712 (100) 443 (132-2,943) 186
(100.0)

Chapter three: Characteristics of work-related injury claims
75
Table 3.6 The number of claims, percentage, time-loss days, medical costs, and deaths by occupation, South Australia, 2001-2010
a Occupation classification: Australian Standard Classification of Occupation;
b Claim rate: per 100 employees.
Occupation classification a Claims: n (%) Claim
rate b
Total time-loss
days: n (%)
Time-loss days:
median (25-75th
percentile)
Total medical costs
($): n (%)
Medical costs($):
median (25-75th
percentile)
Death:
n (%)
Labourers and related workers 71,687 (22.5) 10.2 2,709,247 (26.3) 0 (0-3) 972,672,890 (24.4) 427 (133-2937) 33 (17.7)
Tradespersons and related workers 64,759 (20.3) 7.5 1,514,787 (14.7) 0 (0-0) 614,851,376 (15.4) 303 (114-1,826) 30 (16.1)
Intermediate production and transport workers
60,355 (18.9) 9.8 2,105,044 (20.4) 0 (0-2) 894,755,781 (22.4) 489 (155-3314) 61 (32.8)
Intermediate clerical and service workers
33,123 (10.4) 2.9 1,296,555 (12.6) 0 (0-6) 440,998,252 (11.0) 577 (143-3,800) 4 (2.2)
Associate professionals 28,899 (9.1) 3.5 841,871 (8.2) 0 (0-5) 345,736,611 (8.7) 577 (151-3,626) 0 (0.0)
Elementary clerical, sales and service workers
24,245 (7.6) 3.9 747,667 (7.3) 0 (0-3) 251,754,238 (6.3) 443 (137-2,704) 7 (3.8)
Professionals 23,800 (7.5) 2.0 769,609 (7.5) 0 (0-6) 328,804,269 (8.2) 748 (166-4,387) 19 (10.2)
Managers & administrators 5,336 (1.7) 0.9 218,173 (2.1) 0 (0-2) 106,029,683 (2.7) 706 (154-5,655) 14 (7.5)
Advanced clerical and service workers
3,162 (1.0) 1.4 86,126 (0.8) 0 (0-4) 34,220,974 (0.9) 909 (206-5,100) 0 (0.0)
None-classified 3,566 (1.1) - 9,814 (0.1) 0 (0-0) 3,496,637 (0.1) 0 (0-0) 1 (0.5)
Total 318,932 (100) 4.7 10,298,893 (100) 0 (0-3) 3,993,320,712 (100) 443 (132-2,943) 186 (100.0)

Chapter three: Characteristics of work-related injury claims
76
Table 3.7 The number of claims, percentage, time-loss days, medical costs, and deaths by nature of injury or illness, South Australia, 2001-2010
Diagnosis of injury Claims: n (%) Total time-loss
days: n (%)
Time-loss days:
median (25-75th
percentile)
Total medical costs
($): n (%)
Medical costs($):
median (25-75th
percentile)
Death:
n (%)
Traumatic joint/ligament and muscle/tendon injury
134,027 (42.0) 4,234,184 (41.1) 0 (0-4) 1,672,460,964 (41.9) 621 (196-3,177) 1 (0.5)
Wounds, lacerations, amputations and internal organ damage
69,406 (21.8) 504,467 (4.9) 0 (0-0) 229,457,297 (5.7) 182 (77-426) 11 (5.9)
Musculoskeletal and connective tissue diseases
34,713 (10.9) 2,684,300 (26.1) 0 (0-27) 949,695,770 (23.8) 1,908 (432-14,742) 2 (1.1)
Fractures 12,986 (4.1) 773,162 (7.5) 1 (0-33) 298,308,098 (7.5) 2,387 (410-11,547) 12 (6.5)
Mental disorders 12,061 (3.8) 1,249,934 (12.1) 5 (0-88) 433,448,192 (10.9) 5,284 (792-30,887) 6 (3.2)
Nervous system and sense organ diseases
11,177 (3.5) 339,317 (3.3) 0 (0-0) 161,073,465 (4.0) 1,885 (203-12,169) 0 (0.0)
Burn 6,839 (2.1) 48,394 (0.5) 0 (0-0) 27,955,494 (0.7) 183 (76-516) 4 (2.2)
Skin and subcutaneous tissue diseases 5,153 (1.6) 68,455 (0.7) 0 (0-0) 25,247,342 (0.6) 231 (86-1,020) 0 (0.0)
Digestive system diseases 3,055 (1.0) 78,391 (0.8) 10 (0-25) 29,665,895 (0.7) 5,643 (2,945-9,206) 1 (0.5)
Intracranial injuries 2,209 (0.7) 65,454 (0.6) 0 (0-1) 32,915,981 (0.8) 345 (80-1,108) 13 (7.0)
Respiratory system diseases 1,012 (0.3) 37,891 (0.4) 0 (0-6) 13,063,102 (0.3) 1,197 (283-6,025) 2 (1.1)
Circulatory system diseases 606 (0.2) 45,864 (0.4) 0 (0-29) 26,165,823 (0.7) 2,535 (223-19,339) 49 (26.3)
Infectious and parasitic diseases 762 (0.2) 15,513 (0.2) 0 (0-5) 4,578,673 (0.1) 437 (58-1,420) 1 (0.5)
Injury to nerves and spinal cord 387 (0.1) 27,027 (0.3) 0 (0-22) 15,175,460 (0.4) 2,918 (497-9,718) 0 (0.0)
Neoplasms (cancer) 134 (0.0) 1,960 (0.0) 0 (0-2) 1,405,007 (0.0) 1,431 (269-5,808) 5 (2.7)
Other illnesses and injuries 24,405 (7.7) 124,580 (1.2) 0 (0-0) 72,704,149 (1.8) 487 (69-2,016) 79 (42.5)
Total 318,932 (100) 10,298,893 (100) 0 (0-3) 3,993,320,712 (100) 443 (132-2,943) 186 (100.0)
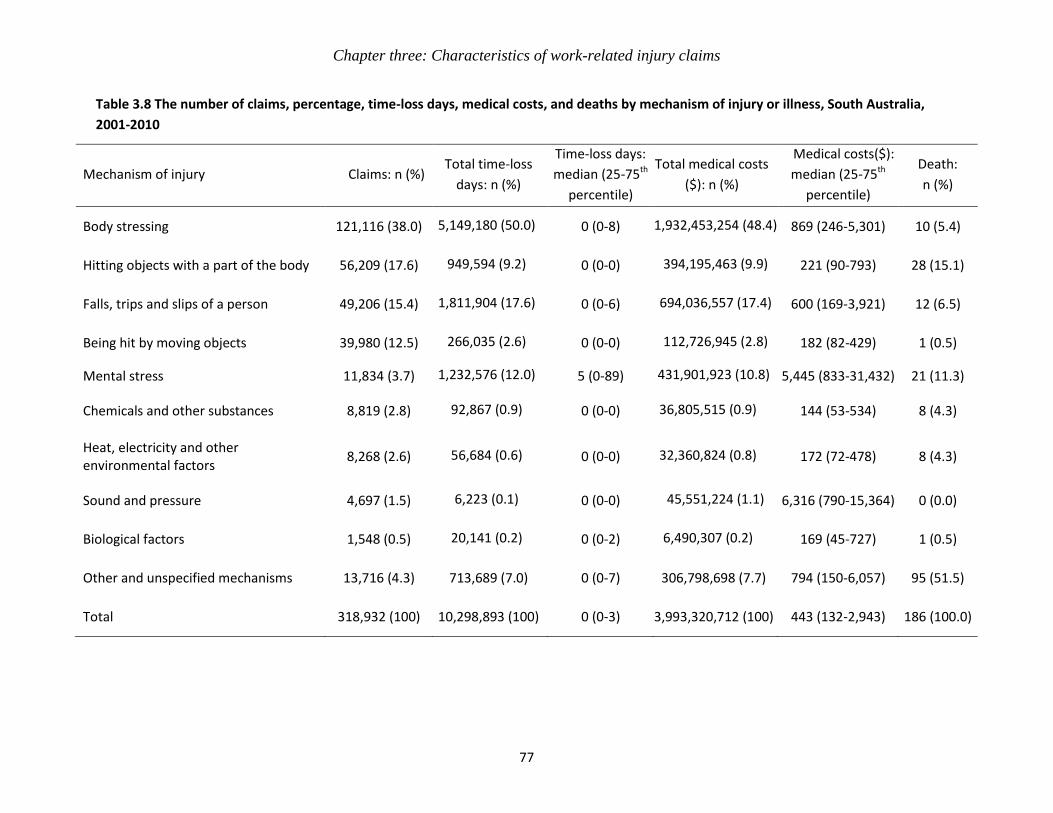
Chapter three: Characteristics of work-related injury claims
77
Table 3.8 The number of claims, percentage, time-loss days, medical costs, and deaths by mechanism of injury or illness, South Australia,
2001-2010
Mechanism of injury Claims: n (%) Total time-loss
days: n (%)
Time-loss days:
median (25-75th
percentile)
Total medical costs
($): n (%)
Medical costs($):
median (25-75th
percentile)
Death:
n (%)
Body stressing 121,116 (38.0) 5,149,180 (50.0) 0 (0-8) 1,932,453,254 (48.4) 869 (246-5,301) 10 (5.4)
Hitting objects with a part of the body 56,209 (17.6) 949,594 (9.2) 0 (0-0) 394,195,463 (9.9) 221 (90-793) 28 (15.1)
Falls, trips and slips of a person 49,206 (15.4) 1,811,904 (17.6) 0 (0-6) 694,036,557 (17.4) 600 (169-3,921) 12 (6.5)
Being hit by moving objects 39,980 (12.5) 266,035 (2.6) 0 (0-0) 112,726,945 (2.8) 182 (82-429) 1 (0.5)
Mental stress 11,834 (3.7) 1,232,576 (12.0) 5 (0-89) 431,901,923 (10.8) 5,445 (833-31,432) 21 (11.3)
Chemicals and other substances 8,819 (2.8) 92,867 (0.9) 0 (0-0) 36,805,515 (0.9) 144 (53-534) 8 (4.3)
Heat, electricity and other environmental factors
8,268 (2.6) 56,684 (0.6) 0 (0-0) 32,360,824 (0.8) 172 (72-478) 8 (4.3)
Sound and pressure 4,697 (1.5) 6,223 (0.1) 0 (0-0) 45,551,224 (1.1) 6,316 (790-15,364) 0 (0.0)
Biological factors 1,548 (0.5) 20,141 (0.2) 0 (0-2) 6,490,307 (0.2) 169 (45-727) 1 (0.5)
Other and unspecified mechanisms 13,716 (4.3) 713,689 (7.0) 0 (0-7) 306,798,698 (7.7) 794 (150-6,057) 95 (51.5)
Total 318,932 (100) 10,298,893 (100) 0 (0-3) 3,993,320,712 (100) 443 (132-2,943) 186 (100.0)

Chapter three: characteristics of work-related injury claims
78
3.3.7 Other distribution characteristics
Claims lodged by new workers (the duration of work less than one year or those aged ≤18
years)257
accounted for 19.3% of total claims. The vast majority (97.9%) of claimants reported
that English was their first language. Approximately three-quarters of workers sustaining work-
related injuries or illnesses were born in Australia (75.9%), followed by UK (7.7%) and New
Zealand (1.2%). During the study period, over half (50.7%) of claims were reported by large
businesses (≥201 employees).258
The percentages for medium (21-200 employees) and small (1-
20 employees)258
businesses were 31.5% and 15.8% respectively.
3.4 Discussion
This chapter has depicted a picture of the distribution characteristics of workers’ compensation
claims in South Australia in the period 2001-2010. Both the number of claims and claim rates
demonstrated a gradual downward trend over the study period due to the increasing improved
occupational health and safety interventions, which is consistent with the results of WorkCover
South Australia’ statistical reviews259 and in alignment with the designated goals of the National
OH&S Strategy 2002-2012.39
3.4.1 Gender
In this study, it was found that male workers’ claim rates were obviously higher than that of
female workers in all age groups. This may be due to the over-representation of males in high-
risk industries. According to the Australian Bureau of Statistics (ABS), in 2012 male workers
represented around 70% of the labour force in ‘agriculture, fishing and forestry’, 75% in
manufacturing, 82% in mining, 88% in construction, and 82% in transport and storage in South
Chapter three: Characteristics of work-related injury claims
79
Australia.256
Another reason resulting in gender differences on claim rates may be that female
workers may be less likely to apply for workers’ compensation for their work-related injury than
male workers.260
According to the Work-Related Injuries Survey (WRIS) conducted by the ABS
for the period of 2005-2006,260
44% of female workers who sustained injuries that resulted in
some time lost from work did not apply for a compensation claim compared to 36% of male
workers. Regarding the specific reasons for not applying for workers’ compensation, equal
percentages of male and female workers cited “minor injury / not necessary” (38%) and
“inconvenient / too much effort” (18%). However, a much greater percentage of male (20%) than
female (10%) workers thought they were “not covered / not eligible”. By contrast, female
workers (20%) were more concerned that making a compensation claim would have a “negative
impact on employment” than male workers (10%).260
3.4.2 Age
The results in the present study showed that claim rates of male workers decreased as age
increased. Higher non-fatal injury rates among young workers have also been observed in other
countries,140, 261
although young workers can be less likely to make injury claims than older
workers according to the ABS WRIS survey.260 Young workers’ vulnerability to injury in the
workplace has generally been attributed to lack of occupational risk awareness, training, and
relevant work skills, together with peer pressure.140 According to the ABS, young workers
represented about 17.0% of the labour force in South Australia,262
accounting for 17.2% of all
reported injury claims in this study. Young workers’ health and safety has been listed as one of
the occupational research priorities according to the recently released Australian Work Health
and Safety Strategy 2012-2022 by SafeWork Australia.38, 263

Chapter three: Characteristics of work-related injury claims
80
3.4.3 Season, industry, and occupation
In this study, relatively less claims occurred in December and January compared with other
months. This may be due to public holidays and that people are more likely to take annual leave
during the summer months.
‘Manufacturing’, ‘community services’, ‘transport and storage’, and ‘mining’ were the four
industries with the highest claim rates in South Australia. ‘Community services’, ‘transport and
storage’, and ‘construction’ had the greatest number of work-related deaths. ‘Public
administration and defence’ had the highest median medical costs. All of these industries were
on the list of national priority industries for prevention activities.38
Labourers, tradespersons,
intermediate clerical and service workers were the top three occupations with the highest
percentages of total claims, time-loss days, medical costs, and deaths. However, advanced
clerical and service workers, professionals, and managers and administrators had the highest
median medical costs for injury claims, possibly indirectly reflecting the high salaries associated
with these occupations.264
3.4.4 Heat-related claims
According to the latest Type of Occurrence Classification System (TOOCS) version,265
which
has incorporated the International Classification of Diseases (ICD10) to code the type of
occupational diseases and injuries, heat-related illnesses were classified as “other illnesses and
injuries”. This indirectly reflects that heat illnesses are not recognized as a major occupational
health issue. In terms of time-lost, medical expenditure, and fatalities, the results indicate that
injuries/illnesses due to exposure to heat and other environmental factors rank lower than
injuries/illnesses due to mental stress, sound and pressure, and body stressing. This may explain

Chapter three: Characteristics of work-related injury claims
81
why heat stress was not on the list of national occupational priorities.39
The underlying impact of
heat exposure on workers’ health and safety may be substantial, as working in hot environments
can increase the risk of work-related injury, reduce work efficiency, and compromise
productivity.19, 44, 116
However, many heat-aggravated diseases such as cardiovascular and
respiratory diseases and mental disorders may not be clinically attributed to heat exposure. In
many circumstances, heat is a synergistically contributing factor to illness or injury. Therefore,
the effects of heat on workers’ health and safety may be inevitably underestimated to some
extent. Moreover, few studies have investigated the incidence and epidemiological distribution
characteristics of heat illnesses, using historical occupational surveillance data.
In recent years, there has been growing research interest regarding the extent to which workers
(especially those work outdoors or indoors without air conditioning) will be affected by heat in
the context of a warming climate. The analysis of workers’ compensation claims data provides a
useful tool to explore this issue. The incidence of occupational heat illness claims in SA is
discussed in the following chapter.
3.5 Conclusion
This Chapter provides implications for the time-series analyses of workers compensation claim
data and weather data in the following chapters. First, the downward trend of claim rates during
the study period indicates the necessity to adjust the effect of long-term trends. Second, the
apparent less percentages of injury claims in December and January suggest a need to exclude
public holidays from time-series analysis. Third, the effect of seasonality should be taken into
account, as the number of injury claims differed significantly across months during the study
period. Last, the majority of injury claims occurred in the Adelaide metropolitan area ensures the

Chapter three: Characteristics of work-related injury claims
82
feasibility of selecting this as the study area and of using one weather station to represent the
heat exposure status when analysing the association between claims and temperatures/heatwaves.

Chapter four: Occupational heat illness
83
Chapter 4
Occupational heat illness in South Australia,
2001-2010
4.1 Introduction
Heat illness occurs as a direct consequence of thermoregulatory failure, and ranges from minor
heat cramps to life-threatening heat stroke.3 Compared with other occupational injuries,
occupational heat illnesses are relatively uncommon due to a wide variety of reasons which may
include underreporting, misclassification, increased use of machines, and air-conditioned
workplaces.37 Previous heat illness related epidemiological data analyses mainly focus on
military personnel,76, 129
athletes,69, 266
or heat-related morbidity and mortality in the general
community.267
To date there is limited research using long-term historical surveillance data to
investigate the comprehensive characteristics of heat illnesses among occupationally exposed
populations72
and their association with extreme heat exposure in the workplace.
The objectives of this Chapter are to describe the characteristics of occupational heat illnesses in
South Australia, to quantify the association with ambient temperature in Adelaide, and to
examine the impact of heatwaves on occupational heat illnesses.
4.2 Materials and methods
4.2.1 Workers’ compensation claim data
As mentioned in Chapter 2, workers’ compensation claim data were obtained from SWSA for
the period from 1st July 2001 to 30
th June 2010. The data included all accepted compensation

Chapter four: Occupational heat illness
84
claims from both registered and self-employed employers during the 9-financial year period. The
Type of Occurrence Classification System (TOOCS) has been developed as coding guidelines
for recording details of reported workers’ compensation claims reported to workers’
compensation agencies.238
Four classifications are designed in the TOOCS to assist in describing
the type of injury or disease sustained by the worker, including the nature of injury, bodily
location, mechanism, and agency of injury/disease.238
Each case is allocated 4 codes according to
the above four categories. Quarterly labour force information in South Australia (denominator
data) was downloaded from the Australian Bureau of Statistics website for the calculation of
claim incidence rates.256
4.2.2 Identification of compensation claims due to heat illnesses in workplaces
As shown in the flowchart (Figure 4.1), workers’ compensation claims for SA due to heat
illnesses in the workplace were identified through a three step process. First, claims due to heat
illnesses were searched for using each of the following four codes: TOOCS nature classification
G313 (heat stress/heat stroke), TOOCS mechanism classification G53 (exposure to
environmental heat), TOOCS agency classification G7100 (weather and water), and TOOCS
agency classification G7110 (sun). Second, identified claims were verified as being heat-related
by reviewing text-based diagnosis-related comments and workers’ descriptions sourced from the
WorkCover South Australia database. Finally, duplicate heat illness claims found using this
search method were excluded.

Chapter four: Occupational heat illness
85
Figure 4.1 Flowchart: identification of heat-related compensation claims, South Australia, 2001-2010
4.2.3 Meteorological data
Historical weather data were obtained from the Australian Bureau of Meteorology. To quantify
the temperature-occupational heat illness association and the impact of heatwaves on occupational
heat illnesses, the analyses were restricted to the metropolitan area of Adelaide. The Kent Town
weather station near the central business district was selected to represent the weather conditions
across the Adelaide metropolitan area.11, 12
In this study, daily maximum temperature (Tmax) was

Chapter four: Occupational heat illness
86
selected as the heat exposure indicator. A heatwave was defined as three or more consecutive days
with Tmax ≥35°C, as reported in previous studies in South Australia.11, 12
4.2.4 Statistical analyses
Descriptive analysis was first used to describe the epidemiological distribution of occupational
heat illnesses occurring during the study period in South Australia. The second part of the
analyses (daily temperature-heat illness claims association and the impact of heatwaves on heat
illness claims) focussed specifically on data relating to the Adelaide metropolitan area where,
unlike the rest of the state, heat exposure (daily maximum temperature and the identification of
heatwave periods) could be determined using local meteorological data.
Therefore, the association between daily heat illness claims and maximum temperatures in
Adelaide was initially explored graphically using a LOWESS (locally weighted scatter plot
smoothing) smoother performing a locally weighted nonparametric regression.12
The association
of Tmax with daily heat illness claims in Adelaide was assessed using generalized estimating
equation models with negative binominal distribution, a log link function and a first order
autocorrelation structure. Confounding factors were adjusted for, including day of the week,
public holiday and long-term trends.27, 139
Given the relationship between temperature and health outcomes is usually non-linear, a
piecewise linear spline function with one knot (the junction between two splines) was utilized to
quantify the effect of ambient temperature on heat illness claims below and above a threshold
temperature,228
which was estimated using the hockey-stick model.12 Results for the negative
binominal regression models are expressed as incidence rate ratios (IRR) with 95% confidence

Chapter four: Occupational heat illness
87
interval (CIs), and interpreted as percentage change in heat illness claims with per degree
increase of Tmax below or above threshold temperatures.
The case-crossover design was applied to investigate the impact of heatwaves on occupational
heat illnesses in Adelaide. In this study, both unidirectional (retrospective) and bidirectional
(combination of retrospective and prospective) control samplings were used.251, 268
For the
retrospective sampling, the same weekdays 1, 2, 3 weeks before the occurrence of heat illness
were selected as the control periods. For bidirectional sampling, the same weekdays 1, 2, 3
weeks before and after the occurrence of heat illness were defined as the control periods.
Choosing the same weekdays as control periods avoids the day-of-the-week effect. The effects of
heatwaves on heat illness claims were estimated using conditional logistic regression.
All analyses were performed with Stata v12.0 (StataCorp LP, College Station, Texas). The 0.05
level of statistical significance was adopted for each test. A spatial analysis of heat-related claims
by postcode was undertaken using Epi Info 7 (US Centre for Disease Control and Prevention).
4.3 Results
4.3.1 Characteristics of occupational heat illness claims in South Australia
The distribution characteristics of heat illness claims and all claims are summarized in Table 4.1.
For the details of the distribution characteristics of all compensation claims, refer to Chapter 3.
There were 306 compensation claims identified as occupational heat illnesses from 1st July 2001
to 30th
June 2010 in South Australia, representing 0.1% of all 318,932 claims reported during the
study period. Of the 306 heat illness claims, 69.0% (211) occurred in the Adelaide metropolitan
area as defined by postcode (Figure 4.2). The proportion of heat illness claims occurring in the
metropolitan area was significantly less than that of all claims (Pearson χ²=10.255, p=0.001).

Chapter four: Occupational heat illness
88
Table 4.1 Characteristics of heat illness compensation claims and all compensation claims reported in
South Australia, 2001-2010
Classification Heat illness compensation claims All compensation claims
Total N=306 N=318,932
Male (n/ (%)) 248 (81.0) 218,544 (68.5)
Age group (n/ (%))
≤24 51 (16.7) 54,736 (17.2)
25-34 66 (21.6) 70,283 (22.0)
35-54 144 (47.1) 156,791 (49.2)
≥55 45 (14.7) 37,122 (11.6)
New workersa (n/ (%)) 52 (17.0) 61,624 (19.3)
First language (n/ (%))
English 302 (98.7) 312,219 (97.9)
Other 4 (1.3) 6,713 (2.1)
Injury location (n/ (%))
Adelaide 211 (69.0) 244,614 (76.7)
Rest of South Australia 95 (31.0) 74,318 (23.3)
Seasons (n/ (%))
Warm (Oct-Mar) 266 (86.9) 158,373 (49.7)
Cool (Apr-Sept) 40 (13.1) 160,559 (50.3)
Employer sizeb (n/ (%))
Large (>200) 163 (53.3) 161,683 (50.7)
Medium (20-200) 105 (34.3) 100,562 (31.5)
Small (<20) 38 (12.4) 56,687 (17.8)
Employer type (n/ (%))
Registered 244 (79.7) 25,4668 (79.9)
Self-employed 62 (20.3) 64,264 (20.1)
Compensated claims n=262 n=292,912
Average cost per claim ($AU) 5,868 12, 520
Median cost ($AU) 436 423
Time lost from work n=79 n=97,468
Average days lost per claim 9 32
Median days lost 0 0
Death (n/(‰)) 1 (3.3) 186 (0.5)
a New worker: new workers are defined as the duration between injury date and start date with
employer less than 1 year or a worker is less or equal to 18 years old; b Employer size: the employer size is grouped by the number of employees as follows: small (1-20),
medium (21-200), and large (≥201).258

Chapter four: Occupational heat illness
89
Figure 4.2 Spatial distribution of heat-related injury claims in South Australia, 2001-2010
4.3.1.1 Age and gender
Approximately 81% (248) of the total heat illness claims were for males. Male workers’
proportion of heat illness claims was significantly more than that in all claims (68.3%) (Pearson
χ²=22.229, p<0.001). The average age of heat illness claimants was 39.4 years old and the
median age was 39 years. Accordingly, the average and median ages for all claims were 38.6 and
39 years respectively.

Chapter four: Occupational heat illness
90
4.3.1.2 Season, month, and injury time
Approximately 86.9% of heat illness claims occurred in the warm season from October to March
for South Australia, with 64.3% occurring in summer (Figure 4.3). By contrast, the percentage of
all compensation claims reported in warm seasons was 49.7%. Roughly 65% of heat illness
claims occurred during the hottest part of the day between 10am and 6pm (Figure 4.4). Similar to
all compensation claims, about half of heat illness claims occurred in large businesses.
Figure 4.3 Distribution of heat illness compensation claims by month in South Australia, 2001-2010
Figure 4.4 Distribution of heat illness compensation claims by injury time in South Australia, 2001-2010
0
10
20
30
40
50
60
70
80
Jan Feb Mar Apr May Jun Jul Aug Sep Oct Nov Dec
He
at-r
ela
ted
co
mp
en
sati
on
cla
ims
Month
Female
Male
0
5
10
15
20
25
30
35
1am
2am
3am
4am
5am
6am
7am
8am
9am
10
am
11
am
12
am
1p
m
2p
m
3p
m
4p
m
5p
m
6p
m
7p
m
8p
m
9p
m
10
pm
11
pm
12
pmHe
at-r
ela
ted
co
mp
en
sati
on
cla
ims
Injury time
Female
Male

Chapter four: Occupational heat illness
91
4.3.1.3 Medical expenditure and time lost
The expenditure for heat illness claims ranged from $0 to $487,055, with a total cost of
$1,795,641 during the study period (Table 4.1). The average expenditure for each heat illness
claim was $5,868, which was about half of the average expenditure for all claims. Seventy-nine
claims (25.8%) due to heat illnesses resulted in time lost from work. Days lost due to heat
illnesses ranged from 0 to 827 days, with an average of 9 days. One heat-related death occurred
during the study period. The death rate for heat illness claims (3.3 ‰) was roughly more than 6
times that for all claims (0.5‰).
4.3.1.4 Industry
As shown in Table 4.2, the distribution by industrial sectors was similar between heat illness
claims and all claims. However, characteristics of incidence rates between the two were different.
Overall, the heat illness claim rate was 4.5 per 100,000 employees. Specifically, the mining
industry had the highest heat illness claim rate (18.9 per 100,000 employees), followed by
‘electricity, gas and water’ (9.2 per 100,000 employees), public administration and defense (8.8
per 100,000 employees), and community services (7.3 per 100,000 employees). For all claims,
the manufacturing industry had the highest claim rate (10.2%).

Chapter four: Occupational heat illness
92
Table 4.2 The number, percentage and claim rate of all and heat illness compensation claims by South
Australia WorkCover Industrial Classification System (SAWICS) in South Australia, 2001-2010
Industry (SAWICS)
Heat illness compensation claims
All compensation claims
n % Incidence
ratea n % Claim rateb
Agriculture, forestry and fishing 13 4.3 3.5 9,770 3.1 2.7
Communication 1 0.3 0.8 205 0.1 0.2
Community services 97 31.7 7.3 87,291 27.4 6.6
Construction 33 10.8 6.8 22,036 6.9 4.6
Electricity, gas and water 7 2.3 9.2 2,420 0.8 3.2
Finance, property and business services 7 2.3 7.6 12,129 3.8 1.3
Manufacturing 50 16.3 6.0 85,037 26.7 10.2
Mining 13 4.3 18.9 3,463 1.1 5.0
Public administration and defence 36 11.8 8.8 10,681 3.4 2.6
Recreational, personal and other services 10 3.3 1.2 16,569 5.2 2.1
Transport and storage 20 6.5 6.6 16,338 5.1 5.4
Wholesale and retail trade 16 5.2 1.6 50,211 15.7 4.9
Non-classifiable 3 1.0 - 2,782 0.9 -
Total 306 100.0 4.5 318,932 100.0 4.7
a Incidence rate: per 100,000 employees;
b Claim rate: per 100 employees
4.3.1.5 Occupation
As shown in Table 4.3, the distribution characteristics of percentage and claim rate by
occupation were consistent for both occupational heat illness claims and all compensation claims.
Tradespersons (who typically operate a wide variety of complex precision machinery or plant to
complete several stages in the fabrication and maintenance of products) had the highest
occupational heat illness claim rate (12.3 per 100,000 employees), followed by labourers (8.6 per
100,000 employees), and intermediate production and transport workers (7.8 per 100,000
employees).
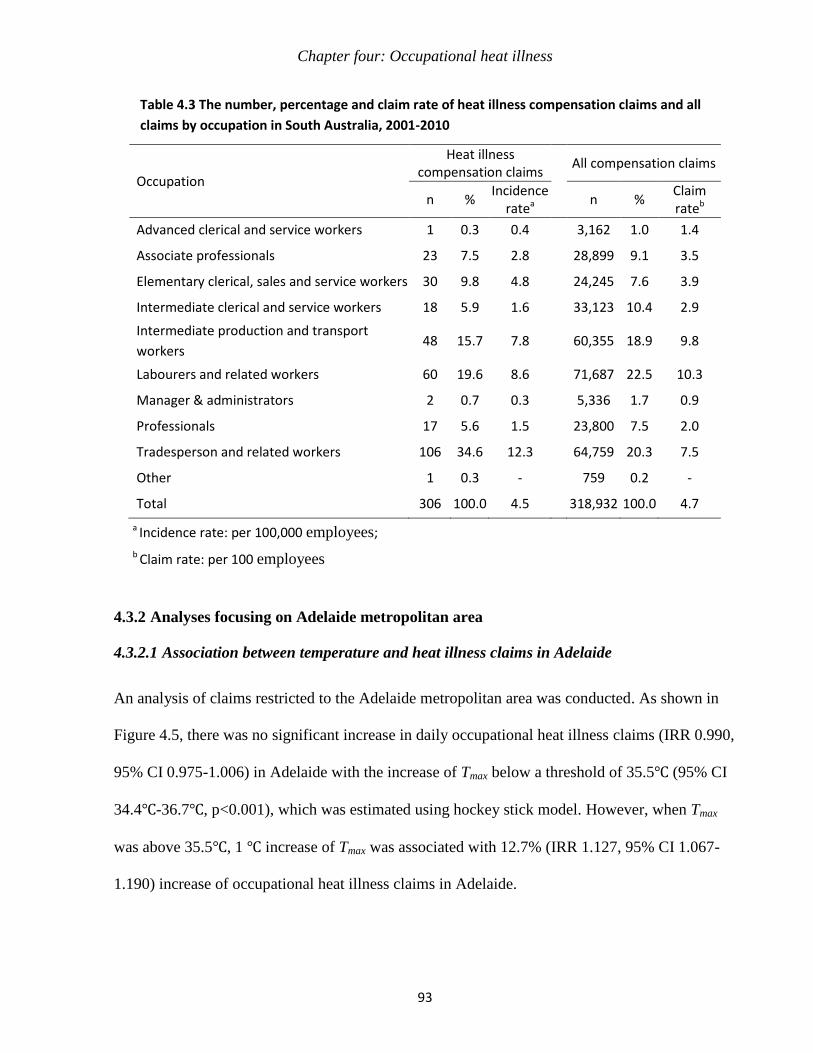
Chapter four: Occupational heat illness
93
Table 4.3 The number, percentage and claim rate of heat illness compensation claims and all
claims by occupation in South Australia, 2001-2010
Occupation
Heat illness compensation claims
All compensation claims
n % Incidence
ratea n %
Claim rateb
Advanced clerical and service workers 1 0.3 0.4 3,162 1.0 1.4
Associate professionals 23 7.5 2.8 28,899 9.1 3.5
Elementary clerical, sales and service workers 30 9.8 4.8 24,245 7.6 3.9
Intermediate clerical and service workers 18 5.9 1.6 33,123 10.4 2.9
Intermediate production and transport
workers 48 15.7 7.8
60,355 18.9 9.8
Labourers and related workers 60 19.6 8.6 71,687 22.5 10.3
Manager & administrators 2 0.7 0.3 5,336 1.7 0.9
Professionals 17 5.6 1.5 23,800 7.5 2.0
Tradesperson and related workers 106 34.6 12.3 64,759 20.3 7.5
Other 1 0.3 - 759 0.2 -
Total 306 100.0 4.5 318,932 100.0 4.7
a Incidence rate: per 100,000 employees;
b Claim rate: per 100 employees
4.3.2 Analyses focusing on Adelaide metropolitan area
4.3.2.1 Association between temperature and heat illness claims in Adelaide
An analysis of claims restricted to the Adelaide metropolitan area was conducted. As shown in
Figure 4.5, there was no significant increase in daily occupational heat illness claims (IRR 0.990,
95% CI 0.975-1.006) in Adelaide with the increase of Tmax below a threshold of 35.5℃ (95% CI
34.4℃-36.7℃, p<0.001), which was estimated using hockey stick model. However, when Tmax
was above 35.5℃, 1 ℃ increase of Tmax was associated with 12.7% (IRR 1.127, 95% CI 1.067-
1.190) increase of occupational heat illness claims in Adelaide.

Chapter four: Occupational heat illness
94
Figure 4.5 Association between daily maximum temperature and daily occupational heat
illness claims in Adelaide, South Australia, 2001-2010
4.3.2.2 Impact of heatwaves on heat illness claims in Adelaide
A total of 21 heatwaves were recorded during the study period in Adelaide over the study period.
Of the 211 heat illness claims which occurred in the Adelaide metropolitan area, 92 (43.6%)
occurred during 103 heatwave days. Results of a case-crossover analysis yielded differences
according to the control period used. Using unidirectional design 3 control periods before the
case period, the risk of occupational heat illness during heatwaves was about 7 times that during
non-heatwaves (OR=6.775, 95% CI 4.032-11.383). Case-crossover models with one or two
control referent periods before the case period when heat illness occurred produced similar
results (OR=4.500, 95% CI 2.268-8.929; OR=5.341, 95% CI 3.074-9.279, respectively). For
35.5°C
01
1.5
20.5
Da
ily h
ea
t ill
ne
ss c
laim
s
10 20 30 40 50
Daily maximum temperature (°C)

Chapter four: Occupational heat illness
95
bidirectional sampling, ORs for 1, 2, 3 weeks before and after the occurrence of occupational
heat illness were 6.121, 5.908, and 5.942 respectively.
Table 4.4 The odds ratios (OR) of occupational heat illness claims during heatwave periods
compared with non-heatwave periods in different control groups, Adelaide, South Australia,
2001-2010
Control OR 95% CI
Before case period
7 d 4.500 2.268-8.929
7 and 14 d 5.341 3.074-9.279
7, 14 and 21 d 6.775 4.032-11.383
Before and after case period
7 d 6.121 3.345-10.906
7 and 14 d 5.908 3.663-9.528
7, 14 and 21 d 5.942 3.888-9.081
4.4 Discussion
With predictions of increasing temperatures,32, 35, 36
the baseline occupational heat illness
incidence data from this study in South Australia may be used for a comparative risk assessment
in the future. Although the number of occupational heat illnesses may be underestimated due to
mis-diagnosis, underreporting, and misclassification, it can still provide an overview of the
magnitude of the heat illness problem in the workplace. The results may also aid relevant
stakeholders in policy-making and in developing occupational health and safety education and
promotion campaigns for extreme heat.

Chapter four: Occupational heat illness
96
4.4.1 Incidence of occupational heat illness
A total of 306 injury claims due to occupational heat illnesses were identified during 2001-2010
in South Australia. This compares with 480 cases reported in Washington State USA, during
1995-2005.72
However, the incidence rate in South Australia (4.5 per 100,000 employees) was
higher than that in Washington State (3.1 per 100,000 employees).
Studies overseas have shown the reported heat stroke incidence rate in the US general population
varies from 17.6 to 26.5 cases per 100,000 people.269
In Saudi Arabia, the heat stroke incidence
has been shown to vary seasonally, from 22 to 250 cases per 100,000 population. By contrast,
reports show the incidence of mild heat illnesses such as heat exhaustion in Saudi Arabia ranges
from 450 to more than 1,800 cases per 100,000 population.270
The remarkably higher heat illness
incidence rates in the community compared to the workplace may be firstly attributed to the
healthy worker effect, as infants, children (<15 years), the elderly (>75 years), and people with
disabilities and chronic diseases in the community are relatively more vulnerable to extreme heat
than healthy working people. Secondly, it may be because of underreporting of heat illnesses in
the workplace. This is could be due to (1) some workers believing their condition is too minor to
make a claim, (2) too inconvenient to claim, or (3) the workers could be worried about future
employment.260
The occupational heat illness incidence rate in this study was also far less than
recorded heat illness claims among the military personnel271
and athletes,272
as they often
perform strenuous exercise during extremely hot weather.
In Australia, heat stress has not been listed in the six national 2012-2022 occupational health
priorities,38
which could be due to its low incidence when compared with other occupational
injuries. The results in this study showed that both average cost and average days lost per heat

Chapter four: Occupational heat illness
97
illness claim were much less than the average levels for all claims, which is consistent with the
findings of Bonuato et al’s USA study.72
That a heat-related fatality occurred during the study
period indicates the potential severity of heat-illnesses and that early detection, diagnosis and
treatment of mild forms of heat illnesses are vital to prevent life-threatening heat stroke.3
Additionally, the substantial indirect impacts of workplace heat exposure cannot be neglected, as
extreme heat may increase the risk of work-related injuries, reduce work efficiency, and result in
loss of work time.36
This is particularly so for low-middle income countries where adequate
protective measurements may be lacking.234
4.4.2 Risk factors of occupational heat illness
The majority (81%) of heat illness claims occurred in male workers, which is consistent with the
findings of other similar studies.72, 76
However, although studies have shown women to be less
heat tolerant than men,116, 146
both male and females workers should be targeted in the preventive
measurements. The results also showed that about half of heat illnesses occurred in the 35-54
years age group. This is similar to previous published literature, which suggested that middle-
aged and older workers were more work-heat-intolerant and suffer more physiological strain than
young individuals when working in hot environments.273
This could be due to aging-induced
degraded thermoregulation functions, relatively high prevalence of some heat-triggered chronic
diseases, the use of certain medications, or pertinent morphological factors.14, 274
However,
young workers are likely to have greater heat exposure, undertake more strenuous tasks during
hot days and lack heat prevention skills when compared with older workers.139, 141
Therefore,
preventive measures should be targeted to all age groups.

Chapter four: Occupational heat illness
98
The results showed that the majority (87%) of heat illness claims occurred in the warm season
from October to March for South Australia (in particular during summer months) and the hottest
part of the day. This is consistent with other similar studies elsewhere.71, 72, 76
The findings in this
study showed that approximately 65% of heat illness claims occurred between 10am and 6pm,
which is similar to the hour distribution of overall injury claims as shown in Figure 3.2 (Chapter
3). Therefore, the distribution pattern of heat illness by the hour of injury may coincide with
normal work shifts and the hottest times of the day.
The association between temperature and heat illness claims was quantified after controlling for
confounding factors such as day of the week, public holiday and long-term trends. The estimated
35.5℃ threshold above which claims increase is consistent with the current Extreme Heat
Guideline of the Construction, Forestry, Mining and Energy Union (CFMEU) South Australia
Branch.181
This study may provide scientific evidence to develop or refine heat-related
regulations and guidelines in relevant industries. Moreover, the results showed that relatively
higher heat illness incidence rates were observed in the mining and ‘electricity, gas and water’
industries, and those employed as labourers and tradespersons.
In addition to the temperature-heat illness claim relationship, the effects of heatwaves on heat
illness claims in Adelaide were examined by using a case-crossover approach. The results
showed that the risk of heat illness during heatwaves was between 4-7 times higher than that
during non-heatwave periods in the workplace, indicating there is a need to: comprehensively
review current heat-related policies and regulations, taking into account the impact of heatwaves;
and consecutive days of extreme heat on worker’ health and safety; identify who are the high risk
subgroups; and investigate the heat prevention and adaptation barriers existing in the workplace.

Chapter four: Occupational heat illness
99
4.4.3 Heat illness prevention
Occupational heat illness is preventable. Strategies to reduce the effects of heat stress include
policy and regulation implementation, engineering controls, administrative controls, education
and training, and personal adaptation, which have been well described in previous publications53,
54. Multidisciplinary collaboration is essential for the successful control and management of heat
stress. This may involve employers, employees, occupational physicians and nurses, and worker
health and safety representatives, occupational hygienists, managers, and decision makers. To
prepare for the challenge of increasing weather-related heat stress the following two issues
should be addressed.
First, it is important to understand how workers and relevant stakeholders perceive the risk of
heat exposure in the context of global warming, as their perceptions and views are important for
the formulation, development, and implementation of heat policies and regulations. Studies of
the 'high occupational temperature health and productivity suppression' programme (HOTHAPS)
suggest that workplaces in participating countries were not well prepared for climate change
related rising temperatures.108, 116
To address lack of awareness of the dangers of working in hot
weather, the US Occupational Safety & Health Administration recently launched a nationwide
campaign.171
Second, more evidence is needed to assess the current mainstream heat policies and
regulations to make them fit for the future warming climate. The system of International
Standards (ISO) is currently re-considering its current heat-related standards to meet future
requirements.52

Chapter four: Occupational heat illness
100
4.4.4 Limitations
There are several limitations in this study. First, to facilitate the understanding of the
temperature-heat illness relationship, maximum dry air temperature was selected as the heat
exposure indicator rather than some composite heat indices which take account of the combined
effects of temperature, relative humidity, wind speed, and solar radiation (i.e. WBGT). However,
evidence shows that different heat indices have similar predictive abilities.275
Second, the
quantitative effects of heatwaves on occupational heat illnesses may be overestimated, as health
care providers may more readily recognize and diagnose heat illnesses during hot days in
summer.72
Third, the relatively small number of occupational heat illnesses (306 over the 10 year
period) dictates cautious interpretation of results. Fourth, workers are more likely to take
holidays over summer, which may result in occupational heat illnesses being underestimated due
to a decreased workforce. Fifth, heat-related injury claims identified using the classification of
“weather and water” may include claims not relating to heat. Nevertheless the impact would be
limited as the number of heat-related claims due to weather and water was very small. Finally,
we did not investigate the impacts of some personal risk factors such as medical conditions, use
of certain medications, and levels of fitness and acclimatization on the occurrence of heat illness,
due to unavailability of data.
4.5 Conclusion
Relatively high heat illness incidence rates were observed in mining and ‘electricity, gas and
water’ industries, and those employed as labourers and tradespersons in South Australia during
the study period. The overall risk of heat illness was positively associated with Tmax,
characterized with a significant increase when Tmax over 35.5℃. During heatwave periods in

Chapter four: Occupational heat illness
101
Adelaide, the risk of heat illness was about 4-7 times higher than that of non-heatwave periods.
This highlights the need to consider regulations and guidelines to minimize the risk of heat-
related health outcomes in workers, particularly in the light of predictions of heatwaves
increasing in frequency and intensity in the future.

Chapter five: Temperature-injury claims association
102
Chapter 5
The association between high temperature and
work-related injuries
5.1 Introduction
As mentioned in Chapter 1, excessive workplace heat exposure without sufficient protection may
not only directly cause heat illnesses but also increase the risk of work-related
injuries/accidents.27-29, 226
Moreover, it has been recognized that working in hot environments
may result in considerable economic productivity loss due to the reduced work efficiency and
afternoon work time.20, 36, 41, 42, 44, 45, 131, 276
In recent years, there has been a growing concern in
the literature about the impact of heat-related events on workers’ health and safety,19-21
especially
with the projected increase of extremely hot weather in a warming climate. However, the specific
categories of workers impacted by heat exposure remain unknown. It is also unclear if there is a
direct link between occupational injuries/accidents and high temperatures, given possible
impacts on hydration and concentration levels;20, 29
and of profuse sweating on visual acuity60
and ability to safely handle tools and machinery.166
The paucity of international literature on this
topic highlights the fact that this important area of occupational heat-health remains under-
researched.
Many epidemiological studies have found that extremely hot weather was associated with excess
morbidity and mortality in the general population. 5-9, 11-18
However, research on occupational
heat exposure is more limited than those from general communities and it has been argued that
occupational heat exposure due to climate change effects has received little attention.19-21, 37, 40, 64,

Chapter five: Temperature-injury claims association
103
168 The purposes of this chapter were therefore to: (1) examine the association between hot
weather and work-related injuries in Adelaide; and (2) identify which industrial sectors,
occupations, genders, and age groups are more vulnerable to heat exposure in order to provide
evidence for relevant stakeholders for adaptation purposes.
5.2 Materials and methods
5.2.1 Workers’ compensation claim data
As mentioned previously, workers’ injury claims data for Adelaide were obtained from SWSA
for the period of 1st July 2001 to 30
th June 2010. The data include all accepted injury claims from
both registered and self-employed employers in the Adelaide metropolitan area during the 9-
financial year period. Information identifying individual workers or employers was removed
prior to receipt of the data. The collected data included demographic and employment
information (including age, gender, occupation, and industry), injury information (where and
when the injury occurred, the nature and bodily location of the injury, and details of the cause),
and outcome information (i.e. time lost from work and total medical expenditure).
5.2.2 Meteorological data
Weather data for Adelaide including daily maximum and minimum temperatures, and daily
average relative humidity for the study period, were obtained from the Australian Bureau of
Meteorology Kent Town observation station near the central business district of Adelaide.11, 12
In
this study, daily maximum temperature (Tmax) was selected as the heat exposure indicator to
facilitate the understanding of the heat-injury relationship. Evidence has shown that different
heat indices have the similar predictive abilities,275
although some composite heat indices such as

Chapter five: Temperature-injury claims association
104
WBGT (wet bulb globe temperature) and AT (apparent temperature) take account of the
combined effects of temperature, relative humidity, wind speed, and solar radiation.
5.2.3 Statistical analyses
The workers injury claim data were transformed into time series format and merged with daily
meteorological data. The crude relationship between daily injury claims and maximum
temperatures was explored graphically using a LOWESS (locally weighted scatter plot
smoothing) smoother performing a locally weighted nonparametric regression, with a bandwidth
of 0.8 (utilizing 80% of the data).12
The association of temperature with daily workers’ injury claims was assessed by using
generalized estimating equation (GEE) models with negative binominal distribution accounting
for over-dispersion, a log link function and a first order autocorrelation structure. The GEE
approach extends generalized linear models to the analysis of longitudinal data with the
assumption that observations are independent among summers of different years and correlated
within each summer. The relationship between temperature and health outcomes is usually non-
linear, being described as U, V or J-shaped.11, 13, 15, 16, 18, 27, 139, 222
Thus, a simple log linear
function is not adequate to capture the real relationship between temperature and work-related
injury risk. A piecewise linear spline function with one knot (the junction between two splines)
was utilized to account for non-linearity and quantify the effect of workplace heat exposure on
work-related injuries below and above a threshold temperature.228
The threshold temperatures
were estimated by using a hockey-stick model.12
To minimise the impact of seasonality, the study period was restricted to the warm season for
Adelaide (1 October-31 March). As work-related injury claims were significantly reduced during

Chapter five: Temperature-injury claims association
105
weekends and public holidays, all analyses were focused on week days. Possible confounding
factors were adjusted for, including day of the week, calendar month, and long-term trends
(putting calendar year in the GEE model as a categorical variable). Stratified analyses were
conducted based on gender, age, business size, and specific industrial sectors and occupations.
Business size categories based on the number of employees are defined by the Australian Bureau
of Statistics as 1-19 employees for a small business, 20-199 employees for a medium business,
and ≥200 employees for a large business.258
As those working outdoors are at high risk of weather-related heat exposure, the impact of
temperature on ‘outdoor industries’ was analysed. Data for industrial sectors: ‘agriculture,
forestry and fishing’, ‘construction’, and ‘electricity, gas and water’ were combined into one
variable named ‘outdoor industries’. Accordingly, data for remaining other industries were
combined into one variable named ‘indoor industries’. As almost all mine sites were located in
rural areas of the state, to avoid misrepresentation, mining claims were excluded from the
analysis.
The potential lagged effect of temperature on injury claims for entire and outdoor industries was
investigated for temperatures above the threshold, with appropriate lagged effects considered.
The number of lags (15) was determined by Schwarz’s Bayesian information criterion (SBIC),
the Akaike’s information criterion (AIC), and the Hannan-Quinn information criterion (HQIC),
using the Stata command ‘varsoc’.139
The 0.05 level of statistical significance was adopted for
each test. Results for the GEE models are expressed as incidence rate ratios (IRR) with 95%
confidence interval (CIs), and interpreted as percent change in daily injury claims per degree
increase of Tmax below or above threshold temperatures. All analyses were conducted using Stata
v12.0 (StataCorp LP, College Station, Texas).

Chapter five: Temperature-injury claims association
106
5.3 Results
The daily average maximum and minimum temperatures during the period of 1st July 2001 to
30th
June 2010 were 22.8℃ and 12.4℃ respectively. The average daily relative humidity (9am
and 3pm readings) was 59.2%. The corresponding indicators in the warm season were 27.0℃,
15.2 ℃, and 50.6%, respectively (Table 5.1).
This study included 252,183 workers’ injury claims reported during the 9-financial year period in
the Adelaide metropolitan area, representing 76.7% of all injury claims during the same period in
SA. Figure 5.1 demonstrates the scatter plot of daily injury claims for Adelaide. Overall, there is
a gradual downward trend with two clusters, the upper cluster representing daily claims during
week days, the lower representing weekends and public holidays.
Figure 5.1 Characteristics of daily injury claims in 2001–2010, Adelaide, South Australia
As shown in Table 5.2, during the study period the percentage of workers’ injury claims for
males was twice that of females. Almost half (48.8%) of total injury claims in Adelaide occurred

Chapter five: Temperature-injury claims association
107
in the 35-54 age group. A total of 65,798 injury claims occurred in the large enterprises,
representing just over half (52.5%) of all claims. Mean daily injury claims on weekdays (121.1)
were more than three times that on weekends (35.1) and more than twice that on public holidays
(47.8) during the study period.
Table 5.1 Summary statistics for meteorological indicators in Adelaide, South Australia, 2001-2010
Meteorological indicators Warm seasons
All seasons
Mean (SD*)
5% Percentile
95% Percentile
Mean (SD*)
5% Percentile
95% Percentile
Daily maximum temperature 27.0 (6.2) 17.9 38.5
22.8 (6.8) 14.2 36.1
Daily minimum temperature 15.2 (4.4) 8.8 23.3
12.4 (4.7) 5.1 21.3
Daily average temperature 20.6 (5.1) 13.3 30.6
17.2 (5.5) 10.0 27.9
Daily mean relative humidity 50.6 (15.2) 23.0 73.5 59.2 (17.0) 28.0 85.0
*SD: Standard deviation
Table 5.2 Number and percentage of workers' injury claims in Adelaide, South Australia, 2001-2010
Classification Warm season All seasons
Total 125,267 252,183
Gender
Male 85,138 (68.0%) 170,864 (67.8%)
Female 40,129(32.0%) 81,319 (32.2%)
Age group
≤24 21,526 (17.2%) 42,641 (16.9%)
25-34 28,026 (22.4%) 56,268 (22.3%)
35-54 61,088 (48.8%) 123,881 (49.1%)
≥55 14,627 (11.7%) 29,393 (11.7%)
Business size
Large 65,798 (52.5%) 132,685 (52.6%)
Medium 39,660 (31.7%) 79,448 (31.5%)
Small 19,809 (15.8%) 40,050 (15.9%)
Daily claims (Mean/SD)
Weekdays 121.1 (35.0) 122.0 (32.2)
Weekends 35.1 (14.3) 34.6 (14.2)
Public holidays 47.8 (26.0) 47.6 (26.5)

Chapter five: Temperature-injury claims association
108
5.3.1 Threshold temperature
A reversed U-shaped exposure-response relationship between Tmax and overall daily injury
claims was observed (Figure 5.2-A). Daily workers’ injury claims increased with the increase of
Tmax, but declined markedly when temperatures were extremely hot. In principle, three or more
piecewise regressions may more accurately reflect the shape of the temperature-claim association,
but the introduction of two or more cut-points may make the interpretation of results and
comparison within each stratum more difficult.22
Therefore, one cut-point (threshold) was used
to reduce the impact of non-linearity.
Often, extreme heat is defined as above 95% percentile of local maximum temperature,11, 277, 278
which was 38.5℃ in this study. The threshold estimated by a hockey stick model was 37.7℃ for
all claims (Table 5.3). Therefore, 37.7℃ was determined as the threshold temperature above and
below which the association between temperature and all injury claims was quantified. As
threshold temperatures may differ in different sub-groups, specific thresholds were estimated by
different strata to quantify the temperature-claim association (Table 5.3). The threshold
temperatures ranged from 31.8℃ to 38.9℃, with an average of 37.1℃.
5.3.2 Total effects
As shown in Table 5.3 (IRR estimates for 0 lagged effect), overall there was an average of 100
injury claims lodged per day during the study period in Adelaide. A 0.2% (IRR 1.002 95% CI
1.001-1.004) increase in daily injury claim was observed with an increase of 1 degree of Tmax
below 37.7℃. However, the overall daily injury claims decreased by 1.4% (IRR 0.986, 95% CI
0.975-0.998) per degree when the Tmax was above 37.7℃.

Chapter five: Temperature-injury claims association
109
5.3.3 Age and gender
Daily claims increased by 0.4% for male workers (IRR 1.004, 95% CI 1.002-1.006) per degree
increase of Tmax below 37.7℃. By contrast, significant change for female workers was not
observed. When the temperature exceeded threshold temperatures, daily injury claims
significantly decreased by 1.8% (IRR 0.982, 95% CI 0.964-0.999) for male workers.
Among all age groups, only young workers aged ≤24 years were significantly affected by
temperature with a 0.5% (IRR 1.005, 95% CI 1.002-1.008) increase in injury claims per degree
of Tmax below 37.9℃. When the Tmax exceeded threshold temperatures, a significant decrease in
injury claims was observed in all age groups except the ≥55 years age group.
5.3.4 Business size
As shown in Table 5.3, significant associations of temperature with injury claims were observed
in small and medium sized enterprises, with daily claims increased by 0.7% (IRR 1.007, 95% CI
1.003-1.011) and 0.4% (IRR 1.004, 95% CI 1.002-1.006), respectively with degree increase of
Tmax below thresholds. In contrast, no significant change for large enterprises was observed.
5.3.5 Industry and occupation
As shown in Table 5.3, there was considerable variation between industries in daily injury claims
(from 0.1 to 28.4). The top three industries with the highest number of daily average claims were
community services (28.4), manufacturing (27.2), and wholesale and retail trade (16.9). In terms
of occupation, tradespersons (21.5) recorded the highest daily claims, followed by labourers
(20.4), and intermediate production and transport workers (19.8).

Chapter five: Temperature-injury claims association
110
Table 5.3 Daily injury claims, thresholds, and IRR estimates of Tmax (lag 0) on daily injury claims by gender, age group, industry and occupation in warm seasons (October-March), Adelaide, South Australia, 2001-2010
Classification Daily claims (Mean (SD))
Threshold estimates (95% CI)
Below threshold Over threshold
IRR (95%CI) p-value IRR (95%CI) p-value
Total 100.0 (25.3) 37.7 (35.2-40.1) 1.002 (1.001-1.004) 0.027
0.986 (0.975-0.998) 0.017 Gender
Male 69.1 (18.9) 37.7 (35.2-40.2) 1.004 (1.002-1.006) 0.000
0.982 (0.964-0.999) 0.048
Female 30.9 (9.1) 37.5 (34.8-40.1) 0.998 (0.994-1.001) 0.206
0.995 (0.981-1.011) 0.550 Age group
≤24 17.1 (5.7) 37.9 (35.5-40.3) 1.005 (1.002-1.008) 0.000
0.977 (0.960-0.994) 0.009
25-34 22.5 (8.2) 37.4 (34.8-40.0) 1.002 (0.999-1.005) 0.206
0.979 (0.961-0.998) 0.036 35-54 48.7 (13.9) 37.7 (35.3-40.0) 1.001 (0.999-1.003) 0.211
0.982 (0.967-0.998) 0.028
≧55 11.6 (4.4) 38.2 (32.4-43.9) 1.000 (0.997-1.003) 0.928
1.020 (0.984-1.057) 0.284 Business size
Large 51.8 (15.1) 36.2 (32.1-40.3) 1.000 (0.997-1.002) 0.741
0.996 (0.978-1.014) 0.656
Medium 32.1 (8.8) 37.1 (34.8-39.4) 1.004 (1.002-1.006) 0.001
0.978 (0.953-1.005) 0.110 Small 16.0 (5.6) 31.8 (27.9-35.6) 1.007 (1.003-1.011) 0.001
0.982 (0.958-1.007) 0.153
Industrial sectors
Outdoor industries (sub-total) 8.9 (3.5) 37.8 (34.2-41.3) 1.005 (1.001-1.009) 0.009
0.966 (0.956-0.977) 0.000 Agriculture, forestry and fishing 0.9 (1.0) 37.9 (33.5-42.3) 1.007 (1.001-1.013) 0.018
0.905 (0.808-1.013) 0.083
Construction 7.3 (3.1) 37.7 (34.1-41.3) 1.006 (1.002-1.011) 0.002
0.954 (0.936-0.972) 0.000 Electricity, gas and water 0.8 (0.9) 37.2 (34.8-40.0) 0.992 (0.977-1.008) 0.328
1.029 (1.002-1.058) 0.039
Indoor industries (sub-total) 91.0 (23.6) 37.0 (34.9-39.1) 1.002 (0.999-1.004) 0.063
0.988 (0.977-1.000) 0.052 Communication 0.1 (0.3) 36.7 (26.0-47.4) 1.006 (0.975-1.038) 0.685
0.841 (0.449-1.576) 0.589
Community services 28.4 (8.5) 37.1 (34.4-39.9) 1.001 (0.998-1.004) 0.547
0.991 (0.976-1.006) 0.225 Finance, property and business services 4.4 (2.4) 38.3 (30.7-45.9) 1.008 (0.999-1.017) 0.073
0.905 (0.808-1.013) 0.083
Manufacturing 27.2 (10.9) 37.0 (34.7-39.4) 1.002 (0.998-1.006) 0.271
0.991 (0.957-1.026) 0.592 Public administration and defense 3.3 (2.1) 36.9 (30.0-43.8) 0.998 (0.993-1.004) 0.542
0.956 (0.894-1.023) 0.197
Recreational, personal and other services 4.7 (2.4) 37.7 (34.0-41.4) 1.002 (0.996-1.007) 0.576
0.965 (0.922-1.010) 0.124 Transport and storage 5.5 (2.7) 37.0 (33.4-40.6) 1.006 (1.000-1.012) 0.062
0.987 (0.945-1.030) 0.542
Wholesale and retail trade 16.9 (5.2) 37.9 (34.7-41.1) 1.001 (0.999-1.004) 0.304
0.991 (0.963-1.020) 0.554 Occupations
Advanced clerical and service workers 1.3 (1.7) 35.0 (32.5-39.4) 1.014 (0.994-1.034) 0.180 0.974 (0.923-1.034) 0.342 Associate professionals 9.0 (4.8) 38.4 (35.7-41.0) 1.002 (0.999-1.005) 0.146 0.970 (0.943-0.998) 0.037

Chapter five: Temperature-injury claims association
111
Shaded cells denote statistical significance at the p<0.05 level
Figure 5.2 (A-E) Exposure–response relationships between daily maximum temperature and daily injury claims for (A) total effects, (B)
outdoor industries,(C) agriculture, forestry and fishing, (D) construction and (E) electricity, gas and water. Data were smoothed using a
LOWESS (locally weighted scatter plot smoothing) smoother, bandwidth=0.8.
Elementary clerical, sales and service workers 7.6 (4.8) 35.2 (23.1-47.3) 0.998 (0.992-1.004) 0.466 1.003 (0.980-1.027) 0.788 Intermediate clerical and service workers 10.3 (4.4) 36.0 (32.6-39.4) 0.997 (0.992-1.002) 0.307 0.996 (0.967-1.026) 0.805 Intermediate production and transport workers 19.8 (7.5) 37.6 (34.1-39.5) 1.003 (1.001-1.005) 0.004 0.987 (0.965-1.009) 0.233 Labourers and related workers 20.4 (10.4) 36.8 (34.1-39.5) 1.005 (1.001-1.010) 0.018 0.988 (0.965-1.012) 0.323 Manager & administrators 1.6 (1.5) 38.9 (31.9-45.9) 1.002 (0.993-1.011) 0.622 0.995 (0.894-1.109) 0.933 Professionals 8.1 (3.8) 32.9 (28.4-37.5) 1.000 (0.994-1.006) 0.969 0.983 (0.965-1.001) 0.069 Tradespersons and related workers 21.5 (7.6) 37.3 (34.8-39.8) 1.002 (1.001-1.005) 0.035 0.988 (0.961-1.015) 0.379

Chapter five: Temperature-injury claims association
112
For overall outdoor industries (IRR 1.005, 95% CI 1.001-1.009), a 0.5% increase of injury
claims was observed with degree increase of Tmax below 37.8℃, however, daily claims decreased
by 3.4% when Tmax exceeded 37.8℃ (Figure 5.2-B). By contrast, no significant association
between claims and temperature was detected in overall indoor industries. Industry-specific
analysis showed that the following industries had an increase of injury claims with increasing
Tmax below the thresholds: agriculture, fishing and forestry (IRR 1.007, 95% CI 1.001-1.013)
(Figure 5.2-C); and construction (IRR 1.006, 95% CI 1.002-1.011) (Figure 5.2-D). However, a
significant increase of 2.9% (IRR 1.002, 95% CI 0.998-1.058) was observed in ‘electricity, gas
and water’ (Figure 5.2-E), when Tmax was above 37.2℃, indicating the workers in this industry
may have been working outside for service purposes. Occupation-specific analysis showed that
labourers (IRR 1.005, 95% CI 1.001-1.010), intermediate production and transport workers (IRR
1.003, 95% CI 1.001-1.005), and tradespersons (IRR 1.002, 95% CI 1.001-1.005) had a
significant increase of injury claims with the increase of Tmax below threshold temperatures.
Significant decreases of injury claims were observed in associate professionals when Tmax
exceeded thresholds.
In addition, there were no delayed effects of hot weather (Tmax above thresholds) on injury claims
for all industries and outdoor industries, indicating the impact of temperature on workers’ health
was acute.
5.4 Discussion
Despite increasing concerns about heat-related impacts on occupational health,19, 21, 233
few
studies have examined the extent to which workers are affected by heat exposure, perhaps due to
the limited availability and quality of occupational health and safety databases.20
This study, the

Chapter five: Temperature-injury claims association
113
first of its kind in Australia, utilizes workers’ injury claim data to investigate the association
between temperatures and work-related injuries in a temperate city.
5.4.1 Association between temperatures and work-related injuries
The results from this study demonstrated a reversed U-shaped relationship between daily Tmax
and total workers’ injury claims, which is consistent with findings from a study of Italian
workplaces.27
Australia currently has no released mandatory regulations and guidelines
specifying standards for maximum temperature in the workplace,19
leaving some industrial
sectors at high risk of heat stress in hot weather. Therefore the identified threshold temperatures
may provide preliminary evidence for planning local specific workplace extreme heat early
warning guidelines. These however may vary in different industries and countries due to the
variations in work environments, preventive measures, heat acclimatization level, and public
health infrastructure.
The results suggest that the overall risk of work-related injuries was positively associated with
Tmax below 37.7℃. However, daily injury claims dropped noticeably when the weather was
extremely hot, as some workplaces, industries and trade unions in South Australia may have in
place effective protective measures such as hot weather policies which advise the cessation of
work when the temperature is extreme.181
This may explain the observed decline in injury claims
when the temperature reaches the threshold. The unexpected increase observed in “electricity,
gas and water” when Tmax exceeded the threshold (37.2℃), may be attributed to the fact that
workers may need to keep working to ensure the continuous supply of electricity, gas and water
when the weather is extremely hot, especially for outdoor power line and pipeline maintenance
workers.

Chapter five: Temperature-injury claims association
114
5.4.2 Vulnerable sub-groups
The vulnerable groups in workplaces during hot weather have been identified by gender, age
group, business size, industry, and occupation. The results indicate that male workers had a
significant increase of injury claims with the increase of Tmax up to 37.7℃. In contrast, no
association between injury claims and Tmax was found among female workers. This may be due
to gender differences in the nature of work with male workers being more likely to undertake
outdoor work with an inherently high risk of heat-related injuries during hot days. Age-specific
analysis in our study showed that only young workers (aged less than 24 years) had an increase
in injury claims in association with temperature. However, studies elsewhere on heat tolerance
suggest that middle-aged workers are more work-heat intolerant and suffer from more heat strain
than younger individuals,138
which was not evident in this study. The greater risk for the young
experiencing work-related injuries in hot weather could be due to a number of reasons. Firstly,
young workers often undertake more strenuous tasks and have less safety training and skills
compared with older workers. Secondly, studies have shown that young workers can be less
likely to recognize the risk of heat exposure and have low compliance with preventive
measures.140, 141
Additionally, young workers may experience peer and supervisor pressure in the
workplace and may feel they have to keep working beyond individual heat tolerance especially
in male-dominated industries.
The results suggest that workers in small and medium sized enterprises were vulnerable to work-
related injuries with increasing Tmax below thresholds, which is consistent with findings of
previous literature.40
A study from Germany has estimated that small and medium sized
enterprises had a 33% greater accident rate (from all origins) than large enterprises.279
It can be
assumed that it is likely to be the same for heat stress problems. Usually, small and medium

Chapter five: Temperature-injury claims association
115
sized enterprises are the most common employer. The number of small businesses occupied 44%
of all businesses in 2001 in South Australia, with about one-third of the state’s labour force
working in companies with less than 20 employees.258
Therefore, it is essential to put more focus
on small and medium sized enterprises in terms of workplace heat exposure prevention.
The association between injury claims and temperature varies by occupation and industry. The
results in this study demonstrated that ‘labourers and related workers’ had the greatest injury risk
with increasing Tmax. This would be due to the work generally being outdoors and physical in
nature. The wearing of impermeable personal protective equipment by labourers may also
increase the risk of injuries in the heat. In addition to labourers, tradespersons, and intermediate
production and transport workers were also identified as having an elevated injury risk. Even
though some may work indoors and out of direct sunlight, working environments can become
very hot when a cooling system is not available or ventilation is insufficient during hot days.
This is especially the case for those working around heat sources such as furnaces, ovens,
smelters and boilers.122
In terms of industrial sectors, analyses showed that for outdoor industries (combined ‘agriculture,
forestry and fishing’, ‘construction’, and ‘electricity, gas and water’), one degree increase of Tmax
below the threshold of 37.7℃ was associated with 0.5% increase in daily claims. Agriculture,
forestry and fishing had the greatest risk of work-related injury with 0.7% increase of daily
injuries per degree increase of Tmax. These industries are generally exposed to outdoor heat
extremes for long periods of time due to the nature of their work, and often there is a lack of
occupational health and safety guidelines. Currently, there has been very limited published
literature assessing heat stress in agricultural workers. A cross-sectional survey found that
approximately 94% of farmers in North Carolina US reported working in extreme heat in 2009,

Chapter five: Temperature-injury claims association
116
among which 40% experienced heat stress related symptoms.92
According to the US heat-related
mortality statistics for the period of 1992-2006, the heat-related mortality rate of crop production
farmers was approximately 20 times greater than for all civilian workers.74
These findings,
together with our results, indicate the importance and necessity of the establishment of heat
prevention and adaptation measures for workers in agriculture, forestry and fishing.
Findings also showed that there was an association between injury claims and temperature in the
construction industry. The constant use of machinery and powered tools, working on elevated
surfaces, heavy workload, being sub-contracted on a daily payment basis, and constant and direct
exposure to sunlight may all contribute to the higher injuries. Many field studies have
investigated the impacts of heat exposure on construction workers’ health and safety, most of
which showed that construction workers were physiologically challenged by heat exposure and
suffered from heat strain symptoms.66, 87
However, if preventive measures were sufficient on
building sites, workers may be able to reduce the risk of heat-related illnesses and injuries.85, 86
Therefore, relevant regulations and guidelines should be considered in all jurisdictions, together
with occupational health and safety education among the workers to ensure their health and
safety could be protected.
5.4.3 Limitations
There are several limitations to this study. First, as mentioned previously daily injury claims may
be underestimated due to underreporting of workers’ compensation claims.260
Second, the
relatively small number of daily injury claims in some industries such as ‘communication’ and
‘electricity, gas and water’ dictates cautious interpretation of results. Third, analysis based on
time series format design in our study was characterized by aggregated daily observations.222

Chapter five: Temperature-injury claims association
117
This may result in the inherent risk of biases due to the lack of information about individual
characteristics. Fourth, the possible variation of labour force during the study period may
potentially bias the results, as it is usually assumed that the denominator does not change
meaningfully when analysing the exposure-count outcome association in a time-series study,227
although the impact of long-term trends has been adjusted. The validity of effect estimates may
be improved if utilizing daily injury claim rates. However, denominator data are not available for
Adelaide. The number of people onsite in many workplaces declines over the summer period
when workers take annual leave. Although this is an issue which could potentially bias our
findings, the effect should be minimal as an examination of Australian Bureau of Statistics data
show a non-significant decrease in the labour force during the summer quarter.256
Different
industries may have variations in the age profiles of employees which may account for some
age-effects observed. Although this could not be accounted for methodologically, individual
characteristic related confounders such as age and gender are time-fixed and do not change on a
daily basis.227
Nevertheless, different industries will have variations in the age profiles of
employees which may account for some age-effects observed. Additionally, some potentially
possible time-varying confounders such as air pollutants were not taken into account in this study.
Lastly, only one weather station was selected for representing daily temperature of the Adelaide
metropolitan area, although the station should be representative of the whole city.
5.5 Conclusion
The results of this study suggest that the risk of work-related injuries is significantly associated
with heat exposure in Adelaide, especially for vulnerable groups in the workplace. Specifically,
these include: males; young workers aged ≤24 years; those working in the industries such as
‘agriculture, forestry and fishing’, ‘construction’, and ‘electricity, gas and water’; or employed as

Chapter five: Temperature-injury claims association
118
labourers, production and transport workers, and tradespersons in small and medium sized
businesses. This study may provide essential epidemiological evidence for policy-makers,
occupational health practitioners and industry that may assist in the formulation of heat
adaptation policies to decrease the risk of relevant injuries. Industrial specific workplace hot
weather alert and response mechanisms need to be developed via multi-sectoral cooperation to
improve vulnerable groups’ risk perceptions and knowledge about harm minimisation strategies
during extremely hot weather. Policies need to be formulated to strengthen workers’ self-
protection capability by providing heat stress relevant trainings via induction and ongoing
continuing education programs. Consideration needs to be given to means of reducing workplace
heat exposure through ergonomic design, and improving workers’ heat adaptability and
resilience through the adjustment of individual work habits.
Further research may be needed to assess the association between hot weather, relative humidity
and work-related injuries in different regions with various climatic characteristics; to estimate the
health burden and productivity loss due to heat exposure and work-related injuries, and to
evaluate the potential cost-effectiveness of heat and work-related injury prevention plans and
guidelines.

Chapter six: Impact of heatwave on injury claims
119
Chapter 6
The effects of heatwaves on work-related injuries
6.1 Introduction
The empirical association between daily ambient temperature and work-related injuries has
drawn little attention in the international literature, although some work has been undertaken in
Italy27
and USA28
. A recent study in Adelaide has preliminarily found that there was a three-fold
increase in work-related ambulance callouts during heatwaves in the industrial suburbs.280
However, so far little is known about the extent to which workers are affected by heatwaves and
which types of illnesses/injuries are associated with heatwaves i.e. when ambient temperatures
remain high over several consecutive days. It is possible that heatwaves may have an effect on
worker’s level of fatigue122
and sleep quality at hot summer nights,63
and consequently
compromise health and safety. According to the weather projections for Adelaide, 32, 35
extremely
hot weather may present a growing challenge for occupational health and safety,20
particularly
for those working outdoors or those close to heat sources.
This Chapter builds on the study in Chapter 5 (‘The association between high temperature and
work-related injuries’139
) and aims to assess the extent to which workers are impacted by
heatwaves in Adelaide; to identify vulnerable workers, to examine which types of work-related
illnesses and injuries are associated with heatwaves in the workplaces. In addition, currently
there is no standard heatwave definition, a small change of which may considerably affect the
heat-health outcomes in the general population.281
Therefore, two different heatwave definitions
were used in this study to compare the differences in effect estimates. Understanding the impact

Chapter six: Impact of heatwave on injury claims
120
of heatwaves on workers’ health and safety (WHS) may provide valuable information to decision
makers and relevant stakeholders to formulate extreme heat preparedness and emergency
response plans in the workplace.
6.2 Materials and methods
6.2.1 Workers’ compensation claim data
As stated in previous chapters,139
de-identified workers’ compensation claim data were obtained
from Safe Work South Australia (SWSA) for the period from 1st July 2001 to 30
th June 2010.
Compensation claims were restricted to those in the Adelaide metropolitan areas as identified by
location postcode.255
6.2.2 Meteorological data
Climatic data for Adelaide including daily maximum and minimum temperature for the study
period were obtained from the Australian Bureau of Meteorology. As suggested in previous
studies,8, 11, 12, 139
an observation station near the central business district was selected to
represent weather conditions across the Adelaide metropolitan area.
6.2.3 Heatwave definition
Currently, there is no universal definition of a heatwave although generally it can be broadly
defined as a prolonged period of excessive heat. In this study, we have defined a heatwave as ≥3
consecutive days with daily maximum temperatures (Tmax) ≥35°C as in previous Adelaide
studies.8, 11, 12
We also used the Australian Bureau of Meteorology (BOM) definition of ≥5
consecutive days of Tmax ≥35°C; or ≥3 consecutive days of Tmax ≥40°C to compare findings.282

Chapter six: Impact of heatwave on injury claims
121
6.2.4 Statistical analyses
The impacts of heatwaves on daily workers’ compensation claims were assessed by using
generalized estimating equation models with negative binominal distribution accounting for
over-dispersion, a log link function and a first order autocorrelation structure as in previous
studies in this thesis. A goodness-of-fit test was applied to the model. The analyses were
stratified by gender, age group, industrial sector, occupation and nature and mechanism of
illness/injury. Seasonality was controlled for by restricting the analysis to the warm season (1
October-31 March). Relative humidity was not adjusted for, as Adelaide is characterized as
typically having dry hot weather in summers.139
As work-related compensation claims reduced significantly during weekends and public holidays,
all analyses were focused on week days in this study. Possible confounding factors were adjusted
for including day of the week, calendar month, and long term trends (with calendar year as a
categorical variable). As those working outdoors are presumably at high risk of weather-related
heat exposure, the impact of temperature on ‘outdoor industries’ was analysed. These were
defined as ‘agriculture, forestry and fishing’, ‘construction’, and ‘electricity, gas and water’ and
were combined into one variable named ‘outdoor industries’ as in the previous chapter.
Accordingly, data for remaining other industries were named ‘indoor industries’. As almost all
mine sites are located in remote areas of the State, mining claims were therefore excluded from
the analysis to avoid misrepresentation.
The 0.05 level of statistical significance was adopted for each test. Results are expressed as
incidence rate ratios (IRR) with 95% confidence interval (CIs), and interpreted as percent change
in the number of daily work-related injury claims during heatwave periods compared with non-
Chapter six: Impact of heatwave on injury claims
122
heatwave periods. All analyses were conducted using Stata v12.0 (StataCorp LP, College Station,
Texas).
6.3 Results
The mean daily Tmax during the period of 1st July 2001 to 30
th June 2010 was 22.8°C, with the
corresponding mean Tmax during the cool season (1 April-30 September), warm season (1
October-31 March) and heatwaves being 18.6°C, 27.0°C and 38.8°C, respectively. A total of 21
heatwaves (≥3 consecutive days over 35℃) were identified during the 9-financial year period,
with a maximum of four heatwaves in one calendar year. The highest temperature was 45.7°C on
28 January, 2009 during a 9-day heatwave with six continuous days over 40°C. The duration of
individual heatwaves ranged from 3-15 days, with a mean of 4.9 days.
This study included 252,183 accepted workers’ compensation claims recorded during the 9-
financial year period in Adelaide metropolitan area, accounting for 76.7% of all claims in South
Australia during the same period. Of these, 7,043 (2.8%) claims occurred during 103 heatwave
days (21 heatwaves), representing a daily mean of 95 claims compared with 100 during non-
heatwave periods in the warm season. By contrast, using the stricter heatwave definition of the
BOM, 3,885 (1.5%) claims occurred during 59 heatwave days (8 heatwaves), with a daily mean
of 91 claims compared with 100 during non-heatwave periods.
6.3.1 Effect estimates by gender, age, occupation and industry
As shown in Table 6.1, the number of compensation claims for male workers was more than
twice that for female workers. During heatwaves, there were no significant changes in the
number of compensation claims among male workers. By contrast, female workers had a
Chapter six: Impact of heatwave on injury claims
123
significant decrease of 6.5% (95% CI 2.6%-10.3%) in claims during heatwaves. Almost half of
the claims were from middle-aged workers (35-54 years). Overall no particular age group
showed a significant increase of compensation claims during heatwave periods compared with
control periods.
Regarding occupations, ‘tradespersons and related workers’ had the highest number of claims
during heatwaves, followed by ‘intermediate production and transport workers’ and ‘labourers
and related workers’. The latter showed a significant increase in claims during heatwaves of 5.4%
(95% CI 2.3%-8.6%) compared to 5.6% (95% CI 2.8%-8.4%) for ‘tradespersons and related
workers’. Significant decreases of 11.6% (95% CI 5.9%-16.9%) were observed in claims for
‘intermediate clerical and service workers’ and 9.4% (95% CI 1.5%-16.7%) for ‘professionals’
during heatwaves.
In terms of industries, ‘outdoor industries’ showed a 6.2% (95% CI 2.2%-10.3%) increase in
claims during heatwaves. ‘Agriculture, forestry and fishing’ and ‘electricity, gas and water’ had
increases of 44.7% (95% CI 12.5%-86.1%) and 29.7% (95% CI 4.9%-60.4%) respectively.

Chapter six: Impact of heatwave on injury claims
124
Table 6.1 The incidence rate ratio (IRR) of workers' compensation claims by gender, age group, industry and
occupation during heatwave periods compared with non-heatwave periods in the warm season, Adelaide,
South Australia, 2001-2010
Classification H/W Non-H/W IRR (95%CI) p-value
Total 7,043 118,224 0.983 (0.943-1.024) 0.408
Gender
Male 4,794 80,344 1.001 (0.947-1.012) 0.960
FemaleΔ- 2,249 37,880 0.935 (0.897-0.974) 0.001
Age group
≤24 1,250 20,276 1.035 (0.981-1.091) 0.213
25-34 1,511 26,515 0.973 (0.928-1.019) 0.246
35-54 3,369 57,719 0.951 (0.898-1.007) 0.086
≥55 913 13,714 1.024 (0.940-1.115) 0.583
Industrial sectors
Outdoor industries (sub-total)Δ+ 659 10,090 1.062 (1.022-1.103) 0.003
Agriculture, forestry and fishingΔ+ 71 1,059 1.447 (1.125-1.861) 0.004
Construction 521 8,145 1.012 (0.936-1.093) 0.767
Electricity, gas and waterΔ+ 67 886 1.297 (1.049-1.604) 0.016
Indoor industries (sub-total) 6,384 108,970 0.976 (0.930-1.025) 0.338
Communication 3 83 0.402 (0.096-1.679) 0.211
Community servicesΔ- 2,061 34,769 0.931 (0.878-0.986) 0.015
Finance, property and business services 346 5,184 1.067 (0.885-1.286) 0.498
Manufacturing 1,780 32,115 1.009 (0.928-1.098) 0.832
Public administration and defence 192 3,719 0.839 (0.722-0.975) 0.022
Recreational, personal and other services 385 6,440 0.987 (0.888-1.097) 0.811
Transport and storage 381 6,635 0.932 (0.859-1.012) 0.094
Wholesale and retail trade Δ+ 1,236 20,025 1.015 (0.965-1.069) 0.559
Occupations
Advanced clerical and service workers 101 1,260 0.941 (0.789-1.121) 0.495
Associate professionals 731 11,517 0.950 (0.912-1.028) 0.203
Elementary clerical, sales and service workers 653 9,510 0.990 (0.919-1.068) 0.803
Intermediate clerical and service workersΔ- 708 12,825 0.884 (0.831-0.941) 0.000
Intermediate production and transport workers 1,335 22,674 1.021 (0.942-1.107) 0.615
Labourers and related workersΔ+ 1,332 23,583 1.054 (1.023-1.086) 0.000
Manager & administrators 120 1,878 0.960 (0.842-1.096) 0.548
ProfessionalsΔ- 554 9,580 0.906 (0.833-0.985) 0.021
Tradespersons and related workersΔ+ 1,463 24,881 1.056 (1.028-1.084) 0.000
Abbreviations: H/W, heatwave; Non-H/W, non-heatwave. Shaded cells denote statistical significance at the
p<0.05 level when heatwaves defined as ≥3 consecutive days with Tmax ≥35°C. Δ+ / Δ- represents IRR estimates
are positively or negatively significant at the 0.05 level for heatwaves defined by the Australian Bureau of
Meteorology for Adelaide as ≥5 consecutive days with Tmax ≥35°C or ≥3 consecutive days with Tmax ≥40°C, where
detailed IRR estimates and p values were not listed in the Table.

Chapter six: Impact of heatwave on injury claims
125
Table 6.2 shows the age and gender specific analyses for ‘agriculture, forestry and fishing’ and
‘electricity, gas and water’ industries. An increase of 65.3% (95% CI 19.8%-228.1%) was
observed for claims among male workers in ‘agriculture, forestry and fishing’; and a significant
increase of 67.3% (95% CI 4.9%-266.7%) was seen among workers aged ≥55 years. In the
‘electricity, gas and water’ industry, male workers had a 38.7% (95% CI 16.5%-65.2%) increase
in claims during heatwaves; and in terms of age, only workers aged ≥55 years showed a
significant increase of 76.3% (95% CI 16.1%-267.6%).
Table 6.2 Specific injury risk estimates (IRR) stratified by gender and age groups for industrial sectors
significantly related to heatwaves in the warm season, Adelaide, South Australia, 2001-2010
Classification Agriculture, forestry and fishing Electricity, gas and water
H/W Non-H/W IRR (95%CI) p-value
H/W Non-H/W IRR (95%CI) p-value
Gender
Male 58 799 1.653 (1.198-2.281) 0.002
66 814 1.387 (1.165-1.652) 0.000
Female 13 260 0.936 (0.649-1.351) 0.725
1 72 0.279 (0.044-2.952) 0.173
Age group
≤24 11 171 1.662 (0.719-3.843) 0.235
2 58 0.623 (0.177-2.194) 0.461
25-34 16 261 1.384 (0.785-2.439) 0.261
11 119 1.384 (0.785-2.439) 0.261
35-54 29 501 1.309 (0.922-1.857) 0.132
36 548 1.129 (0.882-1.446) 0.336
≥55 15 126 1.673 (1.049-2.667) 0.031
18 161 1.763 (1.161-2.676) 0.008
Abbreviations: H/W, heatwave; Non-H/W, non-heatwave. Shaded cells denote statistical significance at the
p<0.05 level.
6.3.2 Types of work-related illnesses and injuries
As shown in Table 6.3, during heatwaves the three most common diagnoses for compensation
claims were ‘traumatic injuries’, ‘wounds, lacerations, and amputations’, and ‘musculoskeletal
and connective tissue diseases’. Regression analyses showed that ‘heat stress’ increased by
approximately12-fold, ‘occupational burns’ (including electrical, chemical, heat, and friction
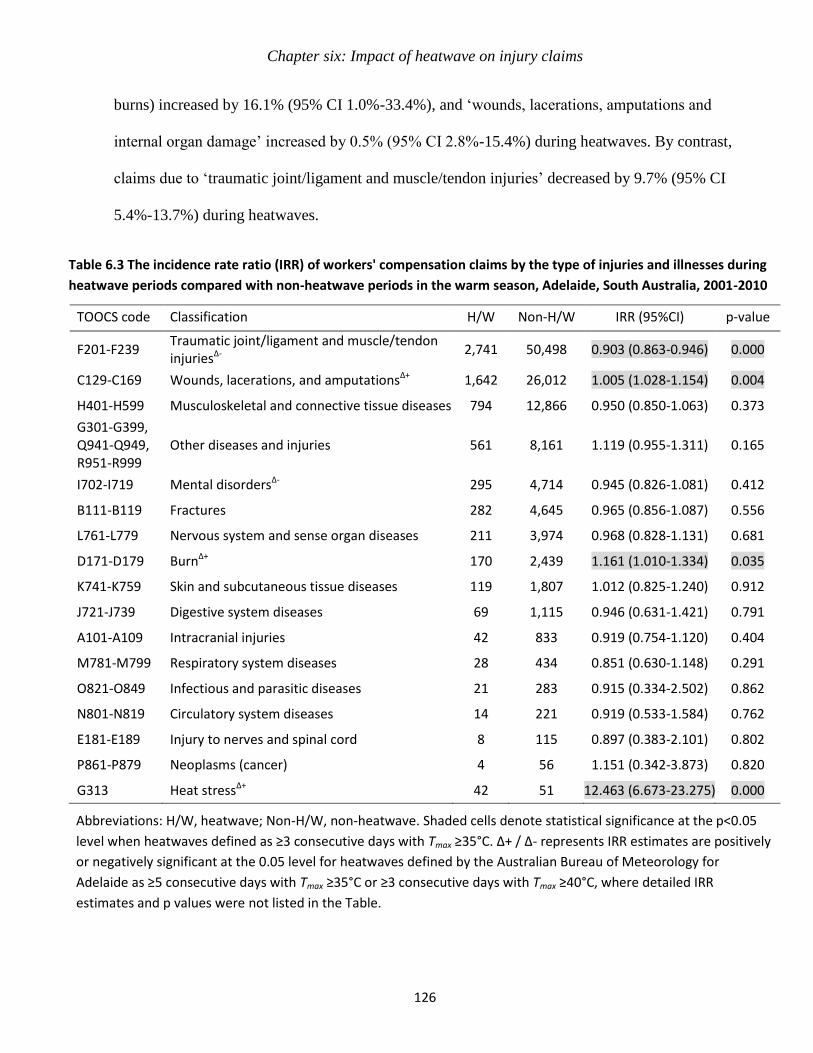
Chapter six: Impact of heatwave on injury claims
126
burns) increased by 16.1% (95% CI 1.0%-33.4%), and ‘wounds, lacerations, amputations and
internal organ damage’ increased by 0.5% (95% CI 2.8%-15.4%) during heatwaves. By contrast,
claims due to ‘traumatic joint/ligament and muscle/tendon injuries’ decreased by 9.7% (95% CI
5.4%-13.7%) during heatwaves.
Table 6.3 The incidence rate ratio (IRR) of workers' compensation claims by the type of injuries and illnesses during
heatwave periods compared with non-heatwave periods in the warm season, Adelaide, South Australia, 2001-2010
TOOCS code Classification H/W Non-H/W IRR (95%CI) p-value
F201-F239 Traumatic joint/ligament and muscle/tendon injuriesΔ-
2,741 50,498 0.903 (0.863-0.946) 0.000
C129-C169 Wounds, lacerations, and amputationsΔ+ 1,642 26,012 1.005 (1.028-1.154) 0.004
H401-H599 Musculoskeletal and connective tissue diseases 794 12,866 0.950 (0.850-1.063) 0.373
G301-G399, Q941-Q949, R951-R999
Other diseases and injuries 561 8,161 1.119 (0.955-1.311) 0.165
I702-I719 Mental disordersΔ- 295 4,714 0.945 (0.826-1.081) 0.412
B111-B119 Fractures 282 4,645 0.965 (0.856-1.087) 0.556
L761-L779 Nervous system and sense organ diseases 211 3,974 0.968 (0.828-1.131) 0.681
D171-D179 BurnΔ+ 170 2,439 1.161 (1.010-1.334) 0.035
K741-K759 Skin and subcutaneous tissue diseases 119 1,807 1.012 (0.825-1.240) 0.912
J721-J739 Digestive system diseases 69 1,115 0.946 (0.631-1.421) 0.791
A101-A109 Intracranial injuries 42 833 0.919 (0.754-1.120) 0.404
M781-M799 Respiratory system diseases 28 434 0.851 (0.630-1.148) 0.291
O821-O849 Infectious and parasitic diseases 21 283 0.915 (0.334-2.502) 0.862
N801-N819 Circulatory system diseases 14 221 0.919 (0.533-1.584) 0.762
E181-E189 Injury to nerves and spinal cord 8 115 0.897 (0.383-2.101) 0.802
P861-P879 Neoplasms (cancer) 4 56 1.151 (0.342-3.873) 0.820
G313 Heat stressΔ+ 42 51 12.463 (6.673-23.275) 0.000
Abbreviations: H/W, heatwave; Non-H/W, non-heatwave. Shaded cells denote statistical significance at the p<0.05
level when heatwaves defined as ≥3 consecutive days with Tmax ≥35°C. Δ+ / Δ- represents IRR estimates are positively
or negatively significant at the 0.05 level for heatwaves defined by the Australian Bureau of Meteorology for
Adelaide as ≥5 consecutive days with Tmax ≥35°C or ≥3 consecutive days with Tmax ≥40°C, where detailed IRR
estimates and p values were not listed in the Table.

Chapter six: Impact of heatwave on injury claims
127
6.3.3 Injury mechanisms
As shown in Table 6.4, the most common injury mechanisms resulting in claims during
heatwaves were ‘body stressing’, ‘hitting objects with a part of the body’, and ‘falls, trips and
slips of a person’. Injury claims during heatwaves for ‘being hit by moving objects’, ‘chemicals
and other substances’, and ‘heat, electricity, and other environmental factors’ increased by 9.7%
(95% CI 0.2%-20.2%), 20.1% (95% CI 5.0%-37.3%) and 39.0% (95% CI 18.0%-63.8%),
respectively. By contrast, injury claims due to ‘body stressing’ and ‘falls, trips and slips’
decreased by 9.1% (95% CI 4.9%-13.0%) and 9.3% (95% CI 5.3%-13.1%) during heatwaves,
respectively.
6.3.4 Comparison of the two heatwave definitions
Using two heatwave definitions, similar results were observed in overall claims and the effects
stratified by gender, age, outdoor industry, and occupation. The differences were found in indoor
industries where significant decrease of claims in ‘public, administration and defence’ was
observed only for the definition of ≧3 consecutive days over 35℃, and claims in ‘wholesale and
retail trade’ increased significantly only for the BOM definition (Table 6.1). In terms of injury
diagnosis, only the BOM definition had a significant decrease of mental disorders claims (Table
6.3). The results of injury mechanism specific analysis between the two definitions were
basically consistent, except ‘hitting objects with a part of the body’ increased significantly during
heatwaves for the BOM heatwave definition (Table 6.4).

Chapter six: Impact of heatwave on injury claims
128
Table 6.4 The IRR of workers' compensation claims by the mechanism of injury during heatwave periods
compared with non-heatwave periods in the warm season, Adelaide, South Australia, 2001-2010
TOOCS code Classification H/W Non-H/W IRR (95%CI) p-value
G41-G44 Body stressingΔ- 2,517 45,673 0.909 (0.870-0.951) 0.000
G11-G13 Hitting objects with a part of the body Δ+ 1,312 20,883 1.052 (0.972-1.139) 0.211
G01-G03 Falls, trips and slips of a person Δ- 1,013 17,941 0.907 (0.869-0.947) 0.000
G21-G29 Being hit by moving objectsΔ+ 945 14,885 1.097 (1.002-1.202) 0.045
G91-G99 Other and unspecified mechanisms of incident 327 5,674 0.894 (0.747-1.071) 0.224
G81-G88 Mental stress 292 4,625 0.949 (0.819-1.110) 0.487
G51-G59 Heat, electricity and other environmental factorsΔ+ 251 3,035 1.390 (1.180-1.638) 0.000
G61-G69 Chemicals and other substancesΔ+ 233 3,248 1.201 (1.050-1.373) 0.007
G31-G39 Sound and pressure 111 1,686 1.181 (0.972-1.435) 0.094
G71-G72 Biological factors 42 574 1.009 (0.674-1.510) 0.966
Abbreviations: H/W, heatwave; Non-H/W, non-heatwave. Shaded cells denote statistical significance at the p<0.05
level when heatwaves defined as ≥3 consecutive days with Tmax ≥35°C. Δ+ / Δ- represents IRR estimates are positively
or negatively significant at the 0.05 level for heatwaves defined by the Australian Bureau of Meteorology for
Adelaide as ≥5 consecutive days with Tmax ≥35°C or ≥3 consecutive days with Tmax ≥40°C, where detailed IRR
estimates and p values were not listed in the Table.
6.4 Discussion
The previous study (Chapter 5) examined the association between daily high temperature and
injury claims.139
In this paper, the impact of heatwaves (consecutive extreme heat exposure) on
work-related illnesses and injuries in a temperate Australian city was investigated, using workers’
compensation claims data. To the author’s knowledge, this is the first study of its kind in
Australia. The findings suggest that overall there was no significant increase in compensation
claims in Adelaide during heatwaves. However, a 6.2% increase in claims was observed for
outdoor industry workers during heatwaves.

Chapter six: Impact of heatwave on injury claims
129
To date many cross-sectional field surveys have been conducted internationally assessing
outdoor workplace heat exposure during hot days in summer,93, 95, 101, 116
with the majority
showing that heat stress levels exceed the recommended criteria of American Conference of
Governmental Industrial Hygienists.179
Outdoor workers, in particular those undertaking highly
intensive and physical activities are at high risk of heat-related illnesses and injuries during
extremely hot weather if preventive measures are not adequately adopted in the workplace. This
is particularly the case in some middle-low income countries.234
Factors that may contribute to
potential injury risk in hot environments include loss of concentration and coordination, sweaty
palms, fogged-up safety glasses, and accidental contact with hot surfaces.
6.4.1 Vulnerable sub-groups during heatwaves
The identification of high risk groups is essential for heat stress management and targeted
intervention programmes. In this study, the identified vulnerable groups in the workplace in
South Australia during heatwaves were male labourers and tradespersons ≥55 years of age in
‘agriculture, forestry and fishing’ and ‘electricity, gas and water’ industries. Although
construction workers are often considered to be at high risk of injury during heatwaves, this was
not detected in Adelaide. Evidence shows that construction workers in Japan are not physically
challenged by heat stress if effective prevention measures are taken on building sites.86
According to the heat stress management policy of Construction, Forestry, Mining and Energy
Union (CFMEU) South Australia Branch, “if temperature is over 35°C work in exposed areas
ceases; if temperature is over 37°C all work ceases unless working in air conditioned area” 181
which may explain, at least in part, this observation.

Chapter six: Impact of heatwave on injury claims
130
For outdoor workers in ‘electricity, gas and water’, ceasing work or working in an air-
conditioned area may be impractical as the nature of work may involve ensuring the continuous
supply of utilities during periods of extreme heat. Indeed, pipe failure rates and electric power
outage rates in the summer can be considerably higher than that in other seasons,134, 135
indicating
a potential increased work load for workers in this industry.
The findings suggest that workers in ‘agriculture, forestry and fishing’ had a significant increase
of injury claims during heatwaves. This may be attributed to the physically demanding work
outdoors or a lack of effective occupational health strategies. Recently, there has been increased
recognition of heat hazards to agricultural workers due to noticeably high heat-related death rates
in the industry.74, 283
Studies have reported a high prevalence of heat stress related symptoms
among US migrant farm workers (33%),93
Japanese forestry workers (32%),101
Costa Rican
sugarcane workers,95
and South African horticultural workers.116 These findings highlight the
importance of heat strategies for agricultural workers, especially for seasonal migrant workers
who have less knowledge of the local extreme heat impact and their legal OH&S rights93
and
more work needs to be done in this area. In addition to field equipment to monitor heat stress
conditions,74
enforceable legal regulations may be needed to ensure the implementation of heat
stress control and prevention standards such as the California Code of Regulations (Title 8,
Section 3395),49
particularly in industries with a large proportion of temporally employed non-
union workforces.
It has been reported that compared with older workers, young workers are more vulnerable to
occupational injuries due to undertaking more strenuous tasks and lack of safety training and
skills.139, 141
However, in this study middle-aged and older workers (≥55 years of age) were

Chapter six: Impact of heatwave on injury claims
131
found to be more prone to illnesses/injuries in certain outdoor industries during heatwaves. Older
male workers were also found at higher risk of heat-related deaths in the US agricultural
workers.78
Previous literature on heat tolerance suggests that middle-aged and older men and
women are more work-heat-intolerant and more likely suffer from physiological heat strain than
younger individuals.274
They may also have ageing-induced dysfunctional thermoregulatory
mechanisms, and a higher prevalence of pre-existing illnesses.14
Therefore, age-related variations
in the vulnerability to heat-related injury/accident should be taken into account when developing
new heat prevention policies/regulations and service guidelines.
6.4.2 Diseases and injuries associated with heatwaves
The impact of heatwaves on claims due to heat stress was also investigated, and it was found that
heat illnesses increased by approximately 12 fold compared with non-heatwave periods. Heat
illnesses are relatively uncommon when compared with other injuries. The number of heat stress
related claims was very small, perhaps due to underreporting and misclassification,260
however
its potential impact on heat-induced injuries and heat-aggravated diseases should not be
neglected.
Mechanism-specific analyses show that workers being hit by moving objects increased by 9.7%
during heatwaves. Core temperature elevation and dehydration can result in fatigue, lethargy,
vigilance decrement, and loss of concentration which may account for these injuries. The
significant increase of injuries due to ‘contact with chemicals’ during heatwaves may be due to
workers reducing the use of personal protective equipment (PPE) under conditions of extreme
heat,284
or the increased absorption rate of liquid chemicals through the skin in higher ambient
temperatures.285 This highlights the importance of continued education in the use of PPE during

Chapter six: Impact of heatwave on injury claims
132
heatwaves among those exposed to chemical substances.284 By contrast, the decrease of ‘falls,
trips and slips’ may be attributable to effective heat intervention policies in South Australia.181
6.4.3 Limitations
There are several limitations to this study. First, work-related illnesses and injuries during
heatwaves may be underestimated due to the underreporting of compensation claims as
previously mentioned,260
or because of the number of workers on summer vacations when
heatwaves occur. The validity of effect estimates may be improved if using daily injury claim
rates, however denominator data for Adelaide are not available. Additionally, the relatively small
number of daily injury claims in some categories requires cautious interpretation of results.
Second, interaction effects between heatwaves and subgroup variables were not considered as
the focus was on investigating the impact of heatwaves on injury claims within subgroups rather
than comparing associations across subgroups. Different industries may have variations in the
age or/and gender profiles of employees which may account for some age or/and gender effects
observed. However, this could not be accounted for methodologically as some individual
characteristics and related confounders are time-fixed and do not change on a daily basis.139, 227
Third, evidence has shown that a small change in heatwave definition may appreciably affect the
heat health outcome estimates.281
In this study, two heatwave definitions were used, which
produced similar but slightly different outcomes. A community-based study has found that a
stricter heatwave definition may be not able to fully capture the real impact of extreme heat on
health outcomes.286 It is especially true for the workplace as more preventive measures (e.g. the
cessation of work) will be taken during a more severe heatwave. In addition, a stricter heatwave
definition means smaller sample size, which may reduce statistical power. Further research is
needed to develop regional appropriate heatwave definitions for the purpose of either workplace

Chapter six: Impact of heatwave on injury claims
133
health impact assessment or heatwave warning. Finally, specific characteristics such as duration,
intensity, timing, and lag effects were not taken into account when analysing the heatwave
effects.
6.5 Conclusion
Outdoor male labourers and tradespersons aged ≥55 years in ‘agriculture, forestry and fishing’
and ‘electricity, gas and water’ industries are at higher risk of injury during heatwaves in
Adelaide. Occupational burns, lacerations, amputations, and heat illnesses are examples of health
outcomes which were found to be significantly associated with extreme heat, together with
injuries resulting from moving objects, chemical exposures, and environmental factors. This
study may provide valuable implications for policy makers and relevant stakeholders to develop
strategies locally or/and internationally to reduce the impacts of extreme heat events on WHS,
particularly in susceptible subgroups.

134
SECTION III
PERCEPTIONS OF
WORKPLACE HEAT
EXPOSURE

135
Introduction
In the study of climate change adaptation, adaptive strategies need to be considered to protect
human health during higher temperatures, particularly for those subject to higher exposure. It is
therefore useful to understand the perceptions, knowledge, attitudes, behaviour and adaptation
barriers among different community members, risk groups and relevant stakeholders so that
better solutions, measurements, strategies, policies and guidelines could be developed to protect
population health. Many research activities have been conducted about the perceptions of the
impact of climate change, global warming and heatwaves among different levels of the society in
North America,287-293
Europe,294-297
China,298
and Australia.299-301
Findings of these studies have
provided useful baseline information, indications and evidence for the formulation of effective
heat adaptation and mitigation policies to minimize the impact of climate change on population
health.302
In recent years, studies have found that extreme heat events may not only present a growing
challenge to workers’ health and safety, but also affect economic productivity.20, 42-44, 61, 63, 303, 304
46 A good understanding of how workers, employers, and relevant stakeholders involved in heat
stress prevention and management perceive the risk of workplace heat exposure may benefit the
development of extreme heat and occupational health and safety policies, contribute to the
development and implementation of relevant heat regulations, and promote the co-operation and
collaborations among different government organisations, service providers, employers, unions
and workers. However, as mentioned in the literature review chapter, limited studies have
investigated the perceptions of workplace heat exposure.

136
This section comprises two chapters. Chapter 7 investigates how workers perceive the risk of
heat exposure, whilst Chapter 8 provides occupational hygienists’ views on heat stress
management and current preparedness for the likelihood of increasing hot weather.

Chapter seven: Workers’ perceptions on workplace heat exposure
137
Chapter 7
Workplace heat exposure and OH&S:
Perceptions from workers
7.1 Introduction
Studies undertaken in Sydney and Adelaide have shown that a high proportion of residents are
concerned about the impacts of climate change related extreme heat on population health.299-301
The findings of studies investigating the public’s heat knowledge, attitudes, and adaptive
behaviours provide valuable implications for the development of extreme heat action plans.305
Heat illnesses are largely preventable and heat risk awareness and knowledge are an important
integral part of heat preventive measures. However, few studies have investigated how working
people perceive the risk of extreme heat in Australia, although heat stress levels have be found to
be high in some occupations (e.g. miners, shearers, and road maintenance workers).46, 64, 139
Moreover, recently several heat-related deaths have been reported in Australian workplaces,306-
308 and the results in Chapters 5 and 6 also indicated that work-related injury claims are
significantly associated with ambient temperatures and heatwaves.139, 329
With predictions of more frequent and intense bouts of hot weather,31, 32
outdoor workers and
those undertaking physically demanding work in non-cooled environments will become more
vulnerable to extreme summer heat if prevention measures are not sufficient.19-21
As an existing
occupational hazard with the progress of ongoing climate change, there is a need to understand
workers’ beliefs and views about heat exposure, which is important for the implementation of
extreme heat preparedness and action plans. Therefore, this Chapter aims to investigate workers’
Chapter seven: Workers’ perceptions on workplace heat exposure
138
perceptions and behavioural responses towards extreme heat exposure in the South Australian
workplaces.
7.2 Materials and methods
A cross-sectional study design was implemented, with a questionnaire survey conducted between
15 August and 6 November 2012 in Adelaide, South Australia amongst workers and trades
apprentices.
7.2.1 Questionnaire design
The questionnaire, which aimed to gather perceptions about working in hot conditions, was
developed after a comprehensive review of the literature on heat exposure and occupational
health. The draft questionnaire was reviewed by relevant experts and piloted among 10 outdoor
workers in Adelaide. Relevant revisions were made to ensure all questions were clear and
understandable.
The questionnaire consisted of 5 demographic variables and 16 questions involving aspects of
the working environments, previous history of heat-related illness and injury, heat prevention
management, perceptions of extreme heat exposure and OH&S, and specific attitudes towards
the development of heat prevention strategies and measurements. Some questions had both
closed and open-ended responses. Some multiple choice questions investigated individual work
habits, access to heat stress prevention information, and heat prevention measures. Likert-scale
questions were used to measure heat-related perceptions and attitudes.

Chapter seven: Workers’ perceptions on workplace heat exposure
139
7.2.2 Participant recruitment
The inclusion criteria for participants were those working outdoors, or indoors but close to heat
sources without air conditioning, in the following four industries: “agriculture, fishing and
forestry”, “construction”, “electricity, gas and water”, and “mining”, according to the findings of
literature review (Chapter 1) and the results from workers compensation claims data analyses
(Chapter 5 and 6).
With the support of SafeWork South Australia (SWSA), a total of 164 employers in South
Australia were invited (Appendix D) to participate in the study and to provide assistance in the
distribution of survey questionnaires (Appendix F), envelopes, and information sheets (Appendix
E) to workers who meet the inclusion criteria.
As shown in Table 7.1, in each of above four industries, 41 employers were contacted for each
industry through invitation letters (Appendix D). Considering the potential impacts of business
size on the perception of heat exposure on their employees (due to the differences in heat
prevention measures), in each selected industry the numbers of employers from small, medium,
and large businesses were 21, 10, and 10, respectively. Within each business size stratum,
companies (indicated only by code numbers so no identity could be disclosed) with relatively
more injury claims during the period of 2001-2010 were selected, according to the workers
compensation claims dataset obtained from the SWSA.

Chapter seven: Workers’ perceptions on workplace heat exposure
140
Table 7.1 Sampling framework: the number of employers invited to provide assistance in the
distribution of questionnaires to workers
Business size* Construction Agriculture Electricity, gas and water Ming Total
Large 10 10 10 10 40
Medium 10 10 10 10 40
Small 21 21 21 21 84
Total 41 41 41 41 164
*: Business size categories based on the number of employees are defined by the Australian Bureau
of Statistics as 1–19 employees for a small business, 20–199 employees for a medium business, and
≥200 employees for a large business.258
It was believed important to include the perceptions of young workers in this study. However,
considering young workers may be less inclined to participate in surveys due to various reasons,
TAFE (Technical and Further Education) students, who are largely young people, were recruited.
A large proportion of part-time students enrolled in the TAFE system, many of whom undertake
their studies while working as apprentices. Therefore, TAFE students were selected to represent
young workers and trainees.
In total, 309
students enrolled in the courses likely to lead to outdoor work such as “building,
construction and furnishing”, automotive, “electrical and refrigeration”, “electrical and metal
fabrication”, “carpentry, furnishing and plumbing”, and “horticulture” in a local TAFE College
were invited to participate in the survey. After initial contact and meeting with the TAFE College
management team and relevant lecturers, questionnaires were distributed to target students by the
course lecturers. On the basis of the questionnaire for workers (Appendix F), the questionnaires

Chapter seven: Workers’ perceptions on workplace heat exposure
141
for TAFE students (Appendix G) were slightly modified on the two demographic questions
relating to occupation and industry.
Participants filled out the questionnaires independently in their own time. Completed
questionnaires were returned by participants using supplied reply-paid envelopes. The
participants were therefore free of any potential pressure from their employers and supervisors
during the completion of the questionnaire.
7.2.3 Data analyses
A total of 1,471 questionnaires were distributed and 749 were returned, with a response rate of
50.9%. Data entry and validation were performed using ‘Microsoft Excel 2007’, and imported
into Stata (version 12.0) for data manipulation and analyses. The “SVY” commands of Stata
were used to calculate point estimates and 95% confidence intervals for the prevalence
estimates.301
Five indicators were used to represent workers’ perceptions of workplace heat exposure from
different aspects. They were (1) workers’ concerns about heat exposure, (2) attitudes towards
more training, (3) policy support, (4) the adjustment of work habits, and (5) degree of
satisfaction of current preventive measures. To identify the factors significantly associated with
perceptions of workplace heat exposure, bivariate and multivariate logistic regression analyses
were conducted using a stepwise backwards model. All variables with statistical significance of
p<0.05 were included in the final model.

Chapter seven: Workers’ perceptions on workplace heat exposure
142
7.3 Results
7.3.1 Demographic characteristics
The 749 participants consisted of 511 TAFE students and 238 workers, accounting for 68.3%
and 31.7%, respectively. Of the 511 TAFE students, 91.4% were part-time, with only 8.6% were
full-time. As shown in Table 7.2, the majority (96.0%) of participants were male young people
(≤24 years) accounted for more than half (53.5%) of all participants. In terms of highest
educational attainment, more than half (51.3%) of participants had completed high school, 42.6%
had a trade certificate, and 6.1% had a university degree. Almost three-quarters (73.2%) of
participants were employed as tradespersons and related workers. Labourers accounted for 5.7%
of participants. More than half (51.0%) of participants mainly undertook work outdoors. The
construction industry had the highest percentage (37.1%) of participants, followed by
manufacturing (27.5%), mining (14.6%), ‘electricity, gas and water’ (13.1%), and ‘agriculture,
forestry & fishing’ (2.0%). Approximately three-quarters (75.9%) of participants considered that
their jobs were moderately or highly physically demanding, while 38.1% reported that they
worked close to heat sources. Two-thirds (67.8%) of participants were required to wear personal
protective equipment at work.

Chapter seven: Workers’ perceptions on workplace heat exposure
143
Table 7.2 Perceptions of workplace heat exposure: prevalence estimates and 95% CI by different subgroups
Independent variable n % Concern for extreme
heat %(95% CI) Attitude for more
trainings %(95% CI) Attitude for more
regulations %(95% CI) Attitude for adjusting work habits %(95% CI)
Satisfaction for preventive
measures %(95% CI)
Total 749 100 51.2 (50.0-57.4) 56.3 (50.1-61.9) 63.8 (57.3-69.9) 68.8 (63.4-73.7) 51.4 (42.6-60.0)
Gender
Male 719 96.0 51.1 (44.7-57.5) 56.5 (51.1-61.7) 64.1 (57.5-70.2) 69.2 (63.9-74.0) 50.9 (42.3-59.5)
Female 30 4.0 53.3 (34.1-71.6) 53.3 (28.9-76.3) 56.7 (37.7-78.9) 60.0 (40.5-76.8) 62.1 (39.8-80.2)
Age group
≤24 401 53.5 44.0 (38.5-49.6) 50.0 (43.1-56.9) 66.9 (58.7-74.3) 66.4 (59.2-73.0) 42.0 (35.6-48.7)
25-34 101 13.5 58.5 (48.9-67.5) 63.5 (56.4-70.1) 74.0 (63.8-82.0) 76.3 (64.0-85.5) 44.1 (31.7-57.3)
35-54 161 21.5 63.5 (48.3-76.4) 66.7 (53.2-77.9) 59.0 (48.2-69.0) 73.7 (63.2-82.1) 68.8 (58.1-77.9)
≧55 86 11.5 59.8 (44.3-73.5) 64.6 (46.5-79.4) 48.8 (37.2-60.5) 65.9 (51.3-78.0) 70.9 (55.7-82.5)
Education level
High school 384 51.3 46.8 (40.7-53.0) 53.4 (46.6-60.1) 66.2 (58.4-73.2) 67.6 (60.5-73.9) 46.4 (37.1-55.9)
Trade certificate 319 42.6 56.1 (48.5-63.3) 58.7 (52.6-64.5) 64.0 (56.7-70.7) 69.8 (63.5-75.4) 51.8 (42.0-61.5)
University degree 46 6.1 53.3 (43.4-63.0) 62.2 (49.3-73.6) 42.2 (24.1-62.7) 73.3 (52.8-87.1) 86.7 (71.9-94.3)
Occupation
Tradespersons and related workers 548 73.2 50.5 (44.5-56.4) 55.1 (49.5-60.6) 66.7 (59.9-72.8) 70.0 (65.3-74.4) 46.6 (38.5-55.0)
Clerical and administrative workers 30 4.0 40.0 (19.8-64.2) 70.0 (28.1-93.3) 46.7 (21.6-73.6) 66.7 (36.6-87.4) 86.2 (64.8-95.5)
Machinery operators and drivers 55 7.3 65.5 (32.1-88.4) 58.2 (27.8-83.4) 61.8 (36.9-81.7) 54.6 (42.9-65.7) 63.6 (42.7-80.4)
Labourers and related workers 43 5.7 51.2 (32.5-69.5) 55.8 (47.7-63.7) 62.8 (38.3-82.1) 69.8 (54.4-81.7) 45.2 (30.0-61.4)
Full-time TAFE students 44 5.9 40.9 (21.0-79.0) 54.6 (39.6-68.7) 59.1 (48.3-69.1) 67.4 (53.4-78.9) 56.1 (35.6-74.7)
Professionals 16 2.1 81.3 (62.0-92.0) 68.8 (30.0-91.9) 37.5 (15.7-65.9) 81.3 (53.1-94.3) 87.5 (51.5-97.9)
Other 13 1.7 46.2 (17.2-77.9) 61.5 (24.9-88.5) 46.2 (16.7-78.6) 69.2 (37.7-89.3) 76.9 (34.1-95.6)
Industry
Agriculture, forestry & fishing 15 2.0 50.0 (24.4-75.6) 62.5 (41.3-79.8) 66.7 (49.4-80.4) 58.3 (37.2-76.8) 69.6 (51.6-83.0)
Mining 109 14.6 57.0 (45.5-67.8) 51.3 (35.2-67.2) 59.1 (38.4-77.0) 67.3 (44.9-83.8) 59.5 (32.6-81.7)
Manufacturing 206 27.5 44.2 (37.9-50.8) 49.5 (32.5-66.7) 67.5 (45.7-83.6) 66.7 (48.7-80.8) 36.4 (25.8-48.6)
Construction 278 37.1 52.4 (38.8-65.6) 58.8 (51.6-65.6) 67.0 (59.5-73.8) 69.3 (63.9-74.3) 50.2 (43.2-57.2)

Chapter seven: Workers’ perceptions on workplace heat exposure
144
Electricity, gas & water 98 13.1 57.6 (33.3-78.7) 67.9 (60.7-74.4) 52.8 (43.4-62.1) 75.5 (64.4-84.0) 71.7 (43.8-89.2)
Other 43 5.7 38.5 (9.4-78.9) 53.9 (28.8-77.1) 61.5 (23.8-89.1) 69.2 (35.6-90.1) 46.2 (12.8-83.3)
Workplace environment
Completely indoors 59 7.9 45.7 (37.0-54.8) 74.6 (57.5-86.4) 71.2 (53.9-83.9) 69.0 (52.1-82.0) 37.3 (21.4-56.5)
Mainly indoors 282 37.7 44.4 (35.7-53.6) 52.5 (43.0-61.8) 58.5 (48.4-68.0) 68.6 (62.7-74.0) 59.5 (44.6-72.8)
Completely outdoors 82 10.9 71.6 (55.7-83.5) 63.4 (49.5-75.4) 70.7 (58.6-80.5) 63.8 (46.3-78.2) 44.3 (29.9-59.7)
Mainly outdoors 300 40.1 53.2 (48.6-58.3) 55.3 (50.0-60.6) 63.7 (57.1-69.7) 68.9 (61.6-75.4) 49.0 (41.5-56.5)
Physically demanding
Not at all 49 6.5 40.4 (29.3-52.7) 63.8 (38.8-83.1) 51.1 (32.4-69.4) 73.9 (61.8-83.2) 82.6 (69.0-91.0)
A little 132 17.6 44.5 (35.9-53.5) 53.1 (39.1-66.6) 47.7 (35.5-60.2) 59.8 (47.3-71.2) 70.6 (53.5-83.4)
Moderately 280 37.4 48.0 (40.3-55.8) 56.1 (50.3-61.8) 64.0 (56.6-70.8) 72.0 (65.4-77.7) 50.9 (44.8-57.0)
Very much 288 38.5 59.9 (50.7-68.4) 56.6 (50.0-63.1) 72.7 (66.3-78.4) 69.5 (63.9-74.6) 37.8 (30.0-46.5)
Work close to heat sources
Yes 285 38.1 52.4 (46.7-58.0) 56.8 (49.9-63.4) 67.0 (59.1-74.0) 69.8 (64.9-74.2) 44.8 (35.6-54.4)
No 464 61.9 49.3 (39.8-58.8) 56.5 (46.5-66.0) 59.3 (50.8-67.3) 68.4 (60.1-75.6) 61.7 (50.5-71.7)
Use of personal protective equipment
Yes 508 67.8 55.8 (49.7-61.8) 58.0 (52.4-63.3) 64.2 (58.0-70.0) 69.9 (64.4-74.8) 50.1 (40.5-59.7)
No 241 32.2 41.4 (34.0-49.4) 52.9 (45.0-60.7) 62.9 (49.7-74.5) 66.5 (58.1-74.0) 54.1 (40.7-66.9)
Heat illness experience
Yes 279 37.2 62.4 (52.2-71.5) 65.2 (56.8-72.8) 70.3 (62.9-76.7) 73.9 (67.8-79.2) 38.5 (30.6-47.0)
No 470 62.8 44.5 (39.5-49.6) 51.4 (44.2-58.5) 60.4 (52.9-67.4) 66.1 (60.1-71.6) 59.0 (48.2-69.1)
Injury experience during hot weather
Yes 194 25.9 67.0 (57.0-75.7) 65.0 (57.0-72.1) 72.2 (60.6-81.4) 71.2 (62.7-78.4) 29.5 (23.5-36.2)
No 555 74.1 45.6 (39.9-51.5) 53.3 (47.5-59.1) 60.9 (54.0-67.4) 68.0 (62.5-73.0) 59.0 (48.8-68.5)

Chapter seven: Workers’ perceptions on workplace heat exposure
145
7.3.2 Heat illnesses and injuries occurring during hot weather
Overall, 37.2% of participants had experienced heat illnesses during hot days. The most common
type of heat illnesses reported were heat exhaustion (60.6%), followed by heat rashes (43.0%),
heat stroke (26.2%), and heat cramps (18.3%) (Figure 7.1). The percentage of participants
injured at work during very hot weather was 25.9%. More than half (54.1%) of injuries were
caused by burns, 44.3% by falls, trips and slips, 27.8% by hitting objects, and 10.3% by being hit
by moving objects (Figure 7.2).
Figure 7.1 Heat-related illnesses experienced by participants: number and percentage
Figure 7.2 Type of injuries experienced by participants during hot weather: number and percentage
8 (2.9%)
51 (18.3%)
73 (26.2%)
120 (43.0%)
169 (60.6%)
0 20 40 60 80 100 120 140 160 180
Other
Heat cramps
Heat stroke
Heat rashes
Heat exhaustion
20 (10.3%)
32 (16.5%)
54 (27.8%)
86 (44.3%)
105 (54.1%)
0 20 40 60 80 100 120
Being hit by moving objects
Other injuries
Hitting objects
Falls, trips and slips
Burn

Chapter seven: Workers’ perceptions on workplace heat exposure
146
About one-quarter (25.2%) of participants responded that they have witnessed an injury to
another worker during very hot weather. The most common type of injuries witnessed was falls,
trips and slips (55.0%), followed by burns (42.3%), hitting objects (22.8%), and being hit by
moving objects (17.5%), as demonstrated in Figure 7.3.
Figure 7.3 Type of injuries witnessed by participants during hot weather: number and percentage
7.3.3 Risk perceptions of workplace heat exposure
7.3.3.1 Concerns about heat exposure
Overall, 51.2% of participants were moderately or very much concerned about the risk of heat
illness at work during very hot weather (Table 7.2). Results of bivariate analyses (Table 7.3)
showed that the following respondents were significantly more concerned about extreme heat
exposure than the comparison group: age in categories (25-34; 35-54; and ≥55 years, comparing
to ≤24 years group), education level of trade certificate, employed as professionals, working in
mining industry, undertaking work completely outdoors, conducting very physically demanding
33 (17.5%)
43 (22.8%)
48 (25.4%)
80 (42.3%)
104 (55.0%)
0 20 40 60 80 100 120
Being hit by moving objects
Hitting objects
Other injuries
Burn
Falls, trips and slips

Chapter seven: Workers’ perceptions on workplace heat exposure
147
work, wearing personal protective equipment (PPE), and previous heat illness and injury
experience during hot weather.
Results of stepwise logistic regression analyses (Table 7.3) indicated that the following factors
were associated with workers’ concerns over heat exposure, including age in categories (25-34;
35-54; and ≥55 years), physically demanding (very much), and the use of PPE, heat illness
history, and injury experience during hot weather.
7.3.3.2 Attitudes towards more heat-related training
Analysis showed that 56.3% of respondents indicated that there was a need for more heat-related
training for workers to reduce the risk of heat stress (Table 7.2). Results of bivariate analyses
(Table 7.3) showed that the following workers tended to support more heat training: those aged
≥25 years, working in “electricity, gas and water” industry, and respondents having experienced
previous heat illness and injury during hot weather. On the contrary, compared with those
working completely indoors, respondents working mainly outdoors or indoors, thought that there
was less need for more heat-related trainings.
In the multiple logistic regression analyses (Table 7.3), the results suggested that the following
factors were significantly associated with workers’ attitudes towards heat-related trainings: those
aged 25-54 years, previous heat illness history, and injury experience during hot weather.
7.3.3.3 Attitudes towards more heat-related policies
Results showed that 63.8% of participants agreed that there should be more heat-related
regulations and guidelines for working during very hot weather (Table 7.2). Regarding the
reasons why the remaining 36.2% held the opposite view, as shown in Figure 7.4, over half
(52.3%) thought “there are enough regulations”, while 21.5% considered workplace heat

Chapter seven: Workers’ perceptions on workplace heat exposure
148
exposure to not be a serious problem. Using attitudes towards more heat-related policies as the
dependent variable, bivariate logistic regression indicated that workers who undertook physically
demanding work (very much) or had experienced heat illness were more likely to support there
being more regulations or guidelines regarding heat stress (Table 7.3). However, the following
workers were not supportive of more legal requirements or restrictions for working during very
hot weather: those aged 55 years, with a university degree, and working mainly indoors. Multiple
logistic regression analyses results (Table 7.3) suggested that very physically demanding work
and heat illness experience were the two factors associated with workers’ attitudes toward more
heat-related policy support.
Figure 7.4 Reasons why there is no need for more heat-related regulations and guidelines
7.3.3.4 Attitudes towards the adjustment of work habits
More than two-thirds (68.8%) of participants answered they were willing to adjust their current
work habits to adapt to the impact of extreme heat (Table 7.2). As to the reasons the remaining
31.2% did not consider the adjustment of work habits during hot weather (Figure 7.5), one-third
32 (13.5%)
47 (19.8%)
51 (21.5%)
124 (52.3%)
0 20 40 60 80 100 120 140
Other
I haven't thought about it
I don't think it is a serious problem
There are enough regulations

Chapter seven: Workers’ perceptions on workplace heat exposure
149
(33.3%) thought “Enough has been done already”, followed by “I don’t think I am at risk”
(30.3%), and “I don’t think it is a serious problem” (24.4%).
Figure 7.5 Reasons why workers did not consider adjusting work habits during hot weather
Results of bivariate logistic analyses showed that workers undertaking little physically
demanding work were less likely to undertake adaptive behaviours, whereas workers having
experienced previous heat illness were more likely to adjust their work habits during hot weather.
Multiple logistic regression analyses indicated that only previous heat illness experience (OR
1.45, 95% CI 1.15-1.84) affected workers’ heat-related work habits.
7.3.3.5 Satisfaction degree of current heat-related prevention measures
More than half (51.4%) of participants were satisfied with the heat prevention measures currently
adopted in the workplace in South Australia (Table 7.2).These included workers aged ≥35 years,
those with a university degree, working mainly indoors, and employed in “agriculture, forestry
and fishing”, “construction”, and “electricity, gas and water” (Table 7.3). Occupation-specific
analyses showed that tradespersons, machinery operators and drivers, labourers and related
14 (6.6%)
39 (18.3%)
52 (24.4%)
65 (30.5%)
71 (33.3%)
0 10 20 30 40 50 60 70 80
Other
I haven't thought about it
I don't think it is a serious problem
I don't think I am at risk
Enough has been done already

Chapter seven: Workers’ perceptions on workplace heat exposure
150
workers, and full-time TAFE students were not satisfied with current heat prevention measures.
In addition, workers undertaking moderately and very physically demanding work, working
close to heat sources, and having had a previous heat illness and injury during hot weather were
also not satisfied with current heat prevention measures.
As shown in Table 7.3, multiple logistic regression analyses suggested that the following
variables could affect workers’ satisfaction in terms of current heat prevention measures: age in
categories (35-54 and ≥55 years), education level (university degree), physically demanding
(moderate to very much), previous heat illness experience and injury experience during hot
weather.
7.3.4 Personal behaviours during hot days
As shown in Figure 7.6, the majority (64.4%) of participants drank fluids regularly during work,
while 16.4% responded that they only drank when feeling thirsty, and 15.2% answered that they
drank plenty of fluids before starting work. About one-fifth of participants’ claimed all of these
were applicable.
Figure 7.6 Participants’ drinking habits during hot weather
156 (20.8%)
114 (15.2%)
123 (16.4%)
482 (64.4%)
0 100 200 300 400 500 600
All of the above
I drink plent of fluids before starting work
I only drink when thirsty
I drink fluids regularly while at work

Chapter seven: Workers’ perceptions on workplace heat exposure
151
Table 7.3 Factors associated with attitude and perception for workplace heat exposure, more heat-related training and regulations, the change of work habits, and satisfaction for prevention
measures: bivariate analysis and multiple stepwise logistic regression an
Independent variable
Concern for extreme heat Attitude for more trainings Attitude for more regulations Attitude for adjusting work habits Satisfaction degree of prevention
measures
Unadjusted OR
(95% CI)
Adjusted OR
(95% CI)
Unadjusted OR
(95% CI)
Adjusted OR
(95% CI)
Unadjusted OR
(95% CI)
Adjusted OR
(95% CI)
Unadjusted OR
(95% CI)
Adjusted OR
(95% CI)
Unadjusted OR
(95% CI)
Adjusted OR
(95% CI)
Gender
Female 1.00 1.00 1.00 1.00 1.00
Male 0.92 (0.44-1.91) 1.13 (0.49-2.65) 1.37 (0.66-2.82) 1.50 (0.76-2.95) 0.63 (0.29-1.39)
Age group
≤24 1.00 1.00 1.00 1.00 1.00 1.00 1.00 1.00
25-34 1.80 (1.25-2.57) 1.82 (1.18-2.80) 1.74 (1.24-2.45) 1.75 (1.27-2.39) 1.40 (0.76-2.61) 1.63 (0.77-3.48) 1.09 (0.65-1.82) 0.94 (0.61-1.44)
35-54 2.21 (1.18-4.16) 2.73 (1.45-5.12) 2.00 (1.06-3.79) 1.96 (1.05-3.65) 0.71 (0.43-1.17) 1.42 (0.83-2.42) 3.05 (1.92-4.85) 2.54 (1.66-3.88)
≥55 1.19 (1.01-3.52) 2.77 (1.73-4.43) 1.83 (0.87-3.83) 1.93 (0.99-3.76) 0.47 (0.28-0.80) 0.98 (0.51-1.85) 3.36 (1.61-7.00) 2.12 (1.00-4.48)
Education level
High school 1.00 1.00 1.00 1.00 1.00 1.00
Trade certificate 1.45 (1.14-1.84) 1.24 (0.92-1.66) 0.91 (0.66-1.24) 1.11 (0.77-1.61) 1.24 (0.83-1.87) 1.12 (0.75-1.67)
University degree 1.30 (0.85-1.99) 1.44 (0.94-2.19) 0.37 (0.17-0.83) 1.32 (0.59-2.93) 7.51 (2.73-20.69) 4.79 (1.65-13.94)
Occupation
Clerical and administrative workers 1.00 1.00 1.00 1.00 1.00
Tradespersons and related workers 1.53 (0.72-3.24) 0.53 (0.13-2.16) 2.28 (0.90-5.76) 1.17 (0.46-3.00) 0.14 (0.05-0.41)
Machinery operators and drivers 2.84 (0.65-12.45) 0.60 (0.20-1.74) 1.85 (0.74-4.65) 0.60 (0.26-1.40) 0.28 (0.11-0.69)
Labourers and related workers 1.57 (0.65-3.79) 0.54 (0.13-2.20) 1.93 (0.41-9.05) 1.15 (0.44-3.00) 0.13 (0.04-0.39)
Full-time TAFE students 1.04 (0.36-2.99) 0.51 (0.12-2.23) 0.98 (0.21-4.62) 1.04 (0.35-3.05) 0.20 (0.07-0.63)
Professionals 6.50 (2.20-19.20) 0.94 (0.17-5.16) 0.69 (0.23-2.07) 2.17 (0.75-6.27) 1.12 (0.16-7.78)
Other 1.29 (0.51-3.21) 0.69 (0.21-2.20) 0.98 (0.21-4.62) 1.13 (0.42-2.99) 0.53 (0.07-3.85)
Industry
Manufacturing 1.00 1.00 1.00 1.00 1.00
Agriculture, forestry & fishing 1.26 (0.65-2.46) 1.70 (0.81-3.56) 0.97 (0.43-2.19) 0.70 (0.33-1.49) 3.99 (2.22-7.18)

Chapter seven: Workers’ perceptions on workplace heat exposure
152
Shaded cells denote statistical significance at the p<0.05 level
Mining 1.67 (1.10-2.55) 1.07 (0.50-2.31) 0.70 (0.27-1.83) 1.03 (0.41-2.60) 2.56 (0.99-6.60)
Construction 1.39 (0.81-2.36) 1.45 (0.77-2.74) 0.98 (0.45-2.12) 1.13 (0.60-2.14) 1.76 (1.12-2.77)
Electricity, gas & water 1.71 (0.94-3.11) 2.16 (1.20-3.89) 0.77 (0.13-4.44) 1.54 (0.80-2.97) 4.42 (2.05-9.56)
Other 0.79 (0.18-3.38) 1.19 (0.42-3.35) 0.54 (0.26-1.13) 1.13 (0.30-4.19) 1.50 (0.42-5.34)
Workplace environment
Completely indoors 1.00 1.00 1.00 1.00 1.00
Mainly indoors 0.95 (0.64-1.42) 0.38 (0.19-0.74) 0.57 (0.37-0.87) 0.98 (0.54-1.80) 2.47 (1.80-3.38)
Completely outdoors 2.99 (1.44-6.22) 0.59 (0.24-1.46) 0.98 (0.44-2.18) 0.79 (0.33-1.91) 1.34 (0.56-3.17)
Mainly outdoors 1.19 (0.70-2.01) 0.42 (0.21-0.86) 0.71 (0.37-1.38) 1.00 (0.54-1.84) 1.61 (0.77-3.39)
Physically demanding
Not at all 1.00 1.00 1.00 1.00 1.00 1.00 1.00 1.00
A little 1.18 (0.81-1.73) 1.26 (0.87-1.83) 0.64 (0.32-1.28) 0.87 (0.55-1.39) 0.87 (0.56-1.34) 0.53 (0.33-0.83) 0.51 (0.22-1.19) 0.67 (0.28-1.58)
Moderately 1.36 (0.77-2.40) 1.73 (0.92-3.28) 0.72 (0.30-1.77) 1.71 (0.79-3.68) 1.66 (0.79-3.49) 0.91 (0.58-1.41) 0.21 (0.11-0.44) 0.43 (0.24-0.79)
Very much 2.20 (1.27-3.82) 2.77 (1.73-4.43) 0.74 (0.26-1.92) 2.56 (1.28-5.11) 2.38 (1.21-4.66) 0.80 (0.54-1.19) 0.13 (0.07-0.24) 0.31 (0.16-0.60)
Work close to heat sources
No 1.00 1.00 1.00 1.00 1.00
Yes 1.21 (0.83-1.52) 1.02 (0.63-1.67) 1.41 (0.94-2.12) 1.08 (0.80-1.46) 0.51 (0.33-0.79)
Use of personal protective equipment
No 1.00 1.00 1.00 1.00 1.00 1.00
Yes 1.79 (1.34-2.40) 1.47 (1.13-1.91) 1.23 (0.95-1.58) 1.06 (0.63-1.77) 1.17 (0.84-1.62) 0.85 (0.50-1.44)
Heat illness experience
No 1.00 1.00 1.00 1.00 1.00 1.00 1.00 1.00 1.00 1.00
Yes 2.07 (1.41-3.02) 1.57 (1.01-2.45) 1.77 (1.16-2.72) 1.58 (0.97-2.58) 1.55 (1.16-2.07) 1.39 (1.05-1.83) 1.45 (1.15-1.84) 1.45 (1.15-1.84) 0.43 (0.29-0.65) 0.53 (0.36-0.76)
Injury experience during hot weather
No 1.00 1.00 1.00 1.00 1.00 1.00 1.00 1.00
Yes 2.42 (1.71-3.44) 2.05 (1.47-2.86) 1.62 (1.23-2.14) 1.44 (1.09-1.91) 1.66 (0.99-2.80) 1.17 (0.84-1.63) 0.29 (0.20-0.43) 0.38 (0.27-0.54)

Chapter seven: Workers’ perceptions on workplace heat exposure
153
As shown in Figure 7.7, heat-related training (49.7%) and at the workplace (48.9%) were the
most common way for participants to obtain information about heat stress prevention, followed
by information from friends and families (22.4%), colleagues (21.6%), TV and radio (15.8%),
SafeWork SA (15.1%), the internet (8.1%), and newspapers (5.5%). Some 10.3% of participants
stated that they could not access any information about heat stress prevention.
Figure 7.7 Main sources of information about heat prevention
Respondents were asked if they worked at their own pace during very hot weather and the
majority (70.4%) answered in the affirmative. As to the reasons why the remaining 29.6% did
not work at their own pace, more than two-thirds (68.0%) attributed this to the pressure from
work demands, followed by the pressure from supervisors (46.1%), and peer pressure (24.3%).
51 (6.8%)
41 (5.5%)
61 (8.1%)
77 (10.3%)
113 (15.1%)
118 (15.8%)
162 (21.6%)
168 (22.4%)
366 (48.9%)
372 (49.7%)
0 50 100 150 200 250 300 350 400
Others
Newspaper
Internet
None
SafeWork SA
TV and radio
Colleagues
Friends and families
Workplace
Training

Chapter seven: Workers’ perceptions on workplace heat exposure
154
In addition, 11.2% replied that there was no need to slow down work rate during hot weather
because “Enough has been done to cool the workplace” (Figure 7.8).
Figure 7.8 Reasons that some workers did not work in their own pace during very hot weather
7.3.5 Current heat prevention measures
As shown in Figure 7.9, the provision of cool drinking water (69.8%) was the most common
prevention measure adopted in the workplace against heat exposure, followed by wearing broad
brimmed hats (39.0%), rescheduling work time (33.8%), central cooling and air conditioning
(33.6%), electric fans (33.6%), and shady rest area (33.1%). Only 19.6% answered “stopping
work” or a prevention measure when the temperature was extremely hot (e.g. >40℃).
When asked if there were guidelines for heat stress prevention during extremely hot weather,
50.9% of respondents answered “Yes”. Whilst 43.4% had attended a heat-related training course,
60.0% participants had received instructions on first aid procedures for serious heat illnesses.
8 (3.9%)
23 (11.2%)
50 (24.3%)
95 (46.1%)
140 (68.0%)
0 20 40 60 80 100 120 140 160
Other
Enough has been done to cool the workplace
Pressure from co-workers
Pressure from supervisors
Pressure from work demand

Chapter seven: Workers’ perceptions on workplace heat exposure
155
Figure 7.9 Heat prevention measures currently adopted in the workplace
7.4 Discussion
It is important to understand workers’ perceptions on workplace extreme heat exposure, as this
information may provide scientific evidence for relevant stakeholders for policy-making and
adaptation strategy and practical guideline development. However, most of the currently
available information is from qualitative studies conducted amongst Indian industrial workers,108
South African outdoor manual workers,116
and Costa Rican sugarcane workers.97
This survey is a
modest step towards this goal in a developed country, using a quantitative approach.
It is generally considered that workers in middle-low income countries will be more vulnerable
to heat-related illnesses and injuries if global warming continuously progresses. This may be due
to a number of factors including poor services in the countries, inadequate workplace legislation
and guidelines, and workers’ poor awareness of the negative health impacts of working in the
70 (9.4%)
147 (19.6%)
248 (33.1%)
252 (33.6%)
252 (33.6%)
253 (33.8%)
292 (39.0%)
523 (69.8%)
0 100 200 300 400 500 600
Others
Stopping work if the temperature exceeds 40℃
Shady rest area
Electric fan
Central cooling system or air conditioning
Rescheduling work time
Broad brimmed hats supplied
Provision of cool drinking water

Chapter seven: Workers’ perceptions on workplace heat exposure
156
heat.233 There appears to be a mismatch between the growing concerns regarding the impact of
extreme heat on workers’ health and safety in the literature, and the overall heat stress risk
perceptions among workers in the middle-low income countries (e.g. India, South Africa, and
Costa Rica). For instance, many interviewees in South Africa said they had not perceived any
changes in weather patterns, and some of them even felt that the average temperatures were
declining.116
Limited evidence suggests that workers’ perceptions regarding extreme heat exposure in high
income countries are not optimistic. In recent years, the impacts of heat exposure on
farmworkers’ health and safety have drawn much research attention in the USA,21, 37
due to the
disproportionate heat-related deaths73
and high prevalence of heat illness symptoms among
farmworkers.92, 93
In the Mexican Immigration to California: Safety and Acculturation (MICASA)
Study, more than 92% of 474 hired farmworkers were not at all or a little concerned about the
risk of heat illness at work in 2008-2010.169
This may be partly the reason why the US OSHA
launched the national-wide Heat Illness Prevention Campaign in 2011 to raise awareness of the
harm that can caused by heat exposure in the workplace.171
7.4.1 Heat exposure concern in Australia
To the author’s knowledge only one qualitative study has explored Australian workers’ heat risk
perceptions. This study, which involved semi-structured telephone interviews,43 revealed that
exposure to high temperatures during the hot summer months in Australia was regarded by
participants as ‘routine’ and ‘cannot easily be avoided’. The author also found that “vestigial
stereotypical attitudes” to heat exposure (e.g. strong masculine cultures) prevailed in the
Australian workforce.43
Given Australia’s existing thermal environments and predicted

Chapter seven: Workers’ perceptions on workplace heat exposure
157
increasingly hot summers, there was a misalignment of perceived occupational health risk 43
. To
the author’s best knowledge, the present study is the first in Australia to investigate workers’ risk
perceptions of heat exposure and identify factors affecting individuals’ heat perceptions using a
questionnaire survey.
This study revealed that about half of respondents were moderately to very much concerned
about their occupational health and safety when working during very hot weather. The
percentage (50%) concerned in “agriculture, forestry and fishing” in South Australia was about 6
times higher than that (8%) in a study of Californian hired farmworkers in the USA.169
The
relatively higher heat awareness among the Australian public may reflect cultural and
demographic difference in study populations.
The results from this study suggested that young workers were less concerned about heat
exposure than older workers. Moreover, middle aged workers supported having more heat-
related training compared to young and older workers. There are many concerns about Australian
young workers’ attitudes towards occupational health and safety, of which heat stress is only one.
According to the national Motivations, Attitudes, Perceptions and Skills (MAPS) survey, up to
28% of Australian young workers reported resenting dealing with workplace health and safety
requirements, and 42% forgot about safety during working practice.310
As mentioned in Chapter
5, young workers are at high risk of heat-related illnesses and injuries when the temperature
below a certain threshold (e.g. 37.9℃).27, 28, 139
By contrast, older workers (≥55 years of age) are
more vulnerable to heat-related illnesses/injuries in certain outdoor industries during heatwaves
(Chapter 6). Therefore, more educational programmes should be targeted to these two age groups.
Further research is also needed to explore the paradoxical phenomena that young workers were
less satisfied with heat prevention measures but expressed more negative attitudes towards heat

Chapter seven: Workers’ perceptions on workplace heat exposure
158
prevention efforts, compared with older workers. The compliance and implementation of heat
prevention and adaptation policies would be undermined if the sentiments of unwillingness to
cooperate existed among young workers.310
Undertaking very physically demanding work and wearing PPE was also found to be associated
with workers’ concern about heat exposure. Both of these are very important factors determining
human body heat balance, and can be indirectly reflected in the standard workplace heat stress
management procedure.53
The results also suggest that heat exposure concern is also related to
whether or not individuals have had a previous heat illness and injury.
7.4.2 Heat-related training
Although one study in California found that over 91% of farmworkers received training on heat-
related illness,169 most of the recent studies conducted among USA farmworkers have revealed
that a majority of workers did not receive any heat-related training.93, 173, 174
In this study in South
Australia, about 43% of respondents indicated that they have received heat-related training. The
relatively higher proportion of workers receiving heat prevention training in this study maybe
partly because of the lessons learnt from the past. Previously, less training and education had
been provided in OH&S, and this was identified as one of the top three causes of occupational
injuries and accidents in Australia.311
Therefore relevant work health and safety training has
recently been incorporated into secondary, vocational and university level education from the
mid-to late 1990s in Australia.311
The results indicated that heat training was the workers’ major source of information about heat
stress prevention, and this is the case for occupational health and safety in general.311
Overseas,
published literature has suggested that the majority of outdoor physical workers in the USA and
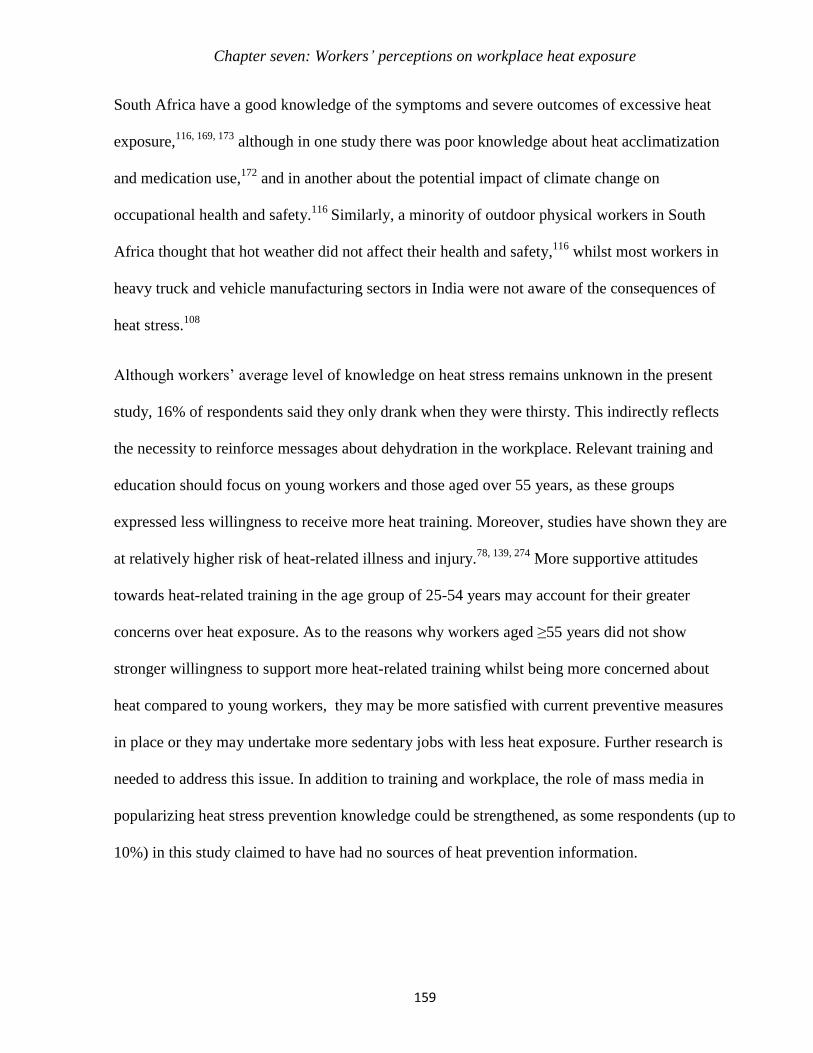
Chapter seven: Workers’ perceptions on workplace heat exposure
159
South Africa have a good knowledge of the symptoms and severe outcomes of excessive heat
exposure,116, 169, 173
although in one study there was poor knowledge about heat acclimatization
and medication use,172
and in another about the potential impact of climate change on
occupational health and safety.116
Similarly, a minority of outdoor physical workers in South
Africa thought that hot weather did not affect their health and safety,116
whilst most workers in
heavy truck and vehicle manufacturing sectors in India were not aware of the consequences of
heat stress.108
Although workers’ average level of knowledge on heat stress remains unknown in the present
study, 16% of respondents said they only drank when they were thirsty. This indirectly reflects
the necessity to reinforce messages about dehydration in the workplace. Relevant training and
education should focus on young workers and those aged over 55 years, as these groups
expressed less willingness to receive more heat training. Moreover, studies have shown they are
at relatively higher risk of heat-related illness and injury.78, 139, 274
More supportive attitudes
towards heat-related training in the age group of 25-54 years may account for their greater
concerns over heat exposure. As to the reasons why workers aged ≥55 years did not show
stronger willingness to support more heat-related training whilst being more concerned about
heat compared to young workers, they may be more satisfied with current preventive measures
in place or they may undertake more sedentary jobs with less heat exposure. Further research is
needed to address this issue. In addition to training and workplace, the role of mass media in
popularizing heat stress prevention knowledge could be strengthened, as some respondents (up to
10%) in this study claimed to have had no sources of heat prevention information.

Chapter seven: Workers’ perceptions on workplace heat exposure
160
7.4.3 Individual behavioural response
The majority of respondents expressed their willingness to adjust work habits to adapt to possible
increasing hot weather, and this may be useful for future heat intervention measures. The results
from this study suggested that previous heat illness experience was the only factor associated
with the adjustment of work habits. A good level of heat stress knowledge and awareness does
not necessarily translate into individual behavioural change. For instance, some Latino
farmworkers in the USA drank alcohol, coffee, and energy beverages to quench thirst or increase
alertness, although they realized it was inappropriate.173
Some female farmworkers even
deliberately wore dark clothes at work to lead to sweating for weight loss.173
Such knowledge-
behaviour gaps may provide opportunities for additional heat prevention and education strategies.
In addition, a study conducted among US farmworkers has shown that cultural beliefs and
incorrect heat strain treatment using traditional medicine were also identified as potential barriers
to individual heat adaptation behaviours.97, 173
In particular, for the culturally diverse Australian
workforce, about 28% of which were born overseas,312
heat prevention measures should take into
account the role of cultural beliefs and language barriers.
Self-pacing (adjusting work rate to avoid physiological heat strain) has been used to explain (at
least partially) why workers were not heat stress challenged when working in hot
environments.82, 111, 114, 115, 231
In the present study, up to 70% of respondents expressed that they
worked at their own pace during very hot weather. For others, pressure from work demand and
supervisors was the major reason that workers did not slow down their work rate. Profit-oriented
production and performance targets have been shown to be a common reason overshadowing or
marginalizing heat stress prevention.43

Chapter seven: Workers’ perceptions on workplace heat exposure
161
Heat stress is not commonly considered as major occupational risk43 and employee-based
behavioural change is not enough to reduce heat-related illness and injury as employees may be
powerless in an occupational health and safety management system.43, 93
Relevant heat
prevention campaigns, even legislation, should target employers to highlight the importance of
heat stress prevention, which not only impacts workers health and safety but also may
compromise productivity.19-21
However, to date few studies have investigated how employers in
industry perceive the risk of heat exposure.
7.4.4 Heat prevention measures
In this study about one-quarter of respondents claimed to have witnessed heat-related illnesses or
injuries during extremely hot weather which indirectly reflects the high incidence, despite the
limited numbers of heat-related compensation claims identified in previous chapters. Fortunately,
all heat-related illnesses, injuries and deaths are preventable. Heat prevention strategies mainly
include regulations, administrative controls, and engineering modifications. Currently, there is no
federal occupational standard specifically addressing heat illness and injury prevention in
Australia.19
About 64% of respondents in this study thought there was a need for more heat-
related regulations. Meanwhile, about half of respondents were not satisfied with current
prevention measures, indicating the necessity of the development of policies, especially for
young workers with low education levels and undertaking physically demanding work outdoors.
Maintaining hydration is very important for heat prevention. In this study, approximately 30% of
respondents replied that cool drinking water was not available in the workplace. Moreover, about
16% of respondents only drank when thirsty. Thirst cannot be relied upon as a guide for the need
for water, as 1% of the total body weight in water is already lost when an individual senses

Chapter seven: Workers’ perceptions on workplace heat exposure
162
thirst.156
According to the national Model Code of Practice (managing the work environment and
facilities),313
“an adequate supply of clean drinking water must be provided free of charge for
workers at all times.” However, its implementation and effectiveness are questionable, as
evidence has shown that a poor hydration status has been observed among workers employed in
a range of industries in Australia.112, 113
Heat prevention measures seem straightforward,
common-sense, and simple (e.g., drinking water frequently, wearing light colour and permeable
clothes, taking breaks in the shade, and responding to early symptoms), however a variety of
factors at multiple levels in the workplace may constrain such implementation, such as the piece-
rate payment systems, production quotas, worries of being considered ‘soft’, and workers’ fears
of losing their job.43, 314
In this study, findings showed that when the temperature was extremely hot e.g. over 40℃, only
20% of respondents selected “stopping work” as a heat prevention measure. However, according
to the heat stress management policy of the Construction, Forestry, Mining and Energy Union
(CFMEU) South Australia Branch, “if temperature is over 37°C all work ceases unless working
in air conditioned area”.181
In this study, the majority (67%) of participants were recruited from
agriculture, forestry, mining, construction, and energy industries, and about half of them worked
outdoors. Therefore, this raises concerns regarding the compliance of heat policies. In 2010,
California became the first State in the USA to enact a stringent heat law to protect workers from
heat exposure.49
Two years later, however, inspectors found that more than half of the employers
they audited did not comply with the heat standard.315
It has been proven that without proper
enforcement heat standards are likely to pose little restrictions to non-compliant employers.314
Therefore, local regulators should enforce regulations during extremely hot days.

Chapter seven: Workers’ perceptions on workplace heat exposure
163
7.4.5 Limitations
There are several limitations in this study. First, the vast majority (96%) of respondents were
males. Caution should be used when generalizing the results to female workers. Moreover, as the
participation of the survey was completely voluntary, those with previous heat illness and injury
experience may have been more likely to participate in the survey, which may generate potential
selection bias and therefore overestimate workers’ heat concerns. Second, the level of workers’
heat-related knowledge was not specifically measured in this study. However, published papers
have consistently found that most workers in both developing and developed countries have a
good knowledge of heat illnesses.116, 169, 173, 174
Third, evidence has shown that mail surveys
published in medical journals had a response rate of 60% on average.316
The relatively low
response rate (50.9%) in this study may generate potential non-respondent bias. Although there
is not necessarily a relationship between response rates and bias, there are more opportunities for
non-response bias if respondents significantly differ from non-respondents.316
Fourth, 31.7% of
participants were TAFE students rather than established workers, although the majority worked
as apprentices on a part-time basis. Lastly, the survey was not conducted during the hottest part
of the year, posing the opportunity for recall bias. Moreover, seasonal migrant workers may not
be included in this study.
7.5 Conclusion
This study provides important insights and baseline information regarding workers’ perceptions
and attitudes towards workplace heat exposure. Workers in South Australia were moderately
concerned about heat exposure. Heat educational programmes and training should focus on those
undertaking physically demanding work outdoors, in particular young workers and those over 55

Chapter seven: Workers’ perceptions on workplace heat exposure
164
years with low education level. Further qualitative research is required to explore how workers in
different heat-exposed industries and employers perceive the risk of heat exposure and better
understand their heat experiences and coping strategies. Effective heat stress prevention and
management needs intersectoral joint efforts from multiple aspects of the OH&S system. In
addition, workers’ heat risk perception investigations should be expanded to employers,
government OH&S decision makers, and other relevant stakeholders (e.g. occupational nurses,
physicians, and consultants).
Chapter eight: Occupational hygienists’ perceptions on workplace heat exposure
165
Chapter 8
Workplace heat exposure and OH&S:
Perceptions from occupational hygienists
8.1 Introduction
As mentioned previously, the growing threat of heat stress and its potential impacts on
occupational health and safety (OH&S) and productivity loss has been addressed in recent
years.19-21, 37
Evidence has shown that higher average temperatures and increasing periods of
extremely hot weather could may place outdoor physical workers in Australia at moderate to
high risk of heat strain by 2070.32, 35
This may result in a significant reduction in afternoon work
time,36
as well as possible increases in heat-related illnesses and injuries.19, 20, 64, 139
Effective heat stress management in the workplace needs comprehensive efforts and cooperation
from a range of stakeholders as previously mentioned. Better understanding of how people
involved in OH&S at different levels view the risk of workplace heat exposure will help to
inform heat prevention and adaptation strategies and practical guidelines.
Occupational hygienists are at the frontline protecting workers’ health and safety by recognizing,
evaluating, and controlling environmental hazards. As professionals, they play central and
crucial roles in heat stress training, monitoring, assessment and management, and prescribe heat
prevention recommendations to employers. Hence, their perspectives are of particular
importance and may be helpful when considering heat-related health and safety reforms. This
Chapter aims to provide insights into hygienists’ and related occupational specialists’
perceptions on this issue and current and future preparedness for extreme heat.

Chapter eight: Occupational hygienists’ perceptions on workplace heat exposure
166
8.2 Materials and methods
A cross-sectional self-administered survey was conducted with a questionnaire during the 30th
Annual Conference & Exhibition of the Australian Institute of Occupational Hygienists Inc. held
in Adelaide from 1st to 5
th December 2012.
8.2.1 Questionnaire design
The design of the survey questions was guided by both previous relevant academic literature20,
108, 116, 317 and our research questions (Chapter 2). The instrument contained three demographic
questions (job position, years of OH&S experience, and State/Territory) and questions focusing
on the following aspects (Appendix I). First, to measure concern and awareness of current
workplace extreme heat exposure and climate change, three 5-point Likert-scale questions were
asked (see Table 8.2 for the wording of questions). Second, to investigate participants’ heat
stress management experience and companies’ preparedness for such challenge in a warming
climate, eight specific items were developed, as shown in Table 8.4. Third, to understand current
heat preventive measures and identify existing adaptation barriers, participants were asked: (1)
“What measures are adopted in the workplace or workplaces that you consult in during very hot
weather?” and (2) “What do you foresee as potential barriers for the prevention of heat stress in
the workplace?” The final question was open-ended: “Do you have any further recommendations
or suggestions for the prevention of heat-related illnesses and injuries in Australian workplaces?”
Some secondary questions also had open-ended responses.
The survey instrument was pre-tested for length, clarity and comprehension with a convenience
sample of five hygienists recruited from the Occupational and Environmental Health Laboratory,

Chapter eight: Occupational hygienists’ perceptions on workplace heat exposure
167
The University of Adelaide. Minor modifications were made according to the feedback before
the instrument was finalized.
8.2.2 Participant recruitment
With the support of the conference organizing committee, 371 registered conference delegates
(professional hygienists and relevant occupational specialists) in attendance were invited to
participate in this survey. A purposive convenience sampling method was used.318
Questionnaires (Appendix I) and information sheets (Appendix J) were distributed to the
delegates at the conference registration desk. Participation was totally voluntary. An eye-
catching questionnaire return box was placed at the conference reception desk to facilitate the
return of completed questionnaires. To promote the participation rate, delegates who returned the
completed questionnaire were included in a draw for a $100 gift card and a $200 Christmas
donation to charity. The survey was approved by both the Human Research Ethics Committee at
the University of Adelaide (H-200-2011) and the conference organizing committee.319
8.2.3 Data analyses
Data input and validation were performed using Microsoft Excel 2010. Data analyses were
conducted using Stata v12.0 (StataCorp LP, College Station, Texas). Descriptive analysis was
used to calculate the frequency of variables. Chi-square tests were used to investigate the
correlation between heat concern, satisfaction, and attitudes towards further heat prevention
efforts, and to compare the differences in heat concern between occupational hygienists and non-
occupational hygienists. In addition, due to the booming mining industry (where heat stress can
be common) in Western Australia and Queensland in recent years in Australia, the heat concern
level between participants from these two States and other States was compared.

Chapter eight: Occupational hygienists’ perceptions on workplace heat exposure
168
8.3 Results
As shown in Table 8.1, 180 of the 371 conference delegates participated in the survey during the
5-day conference period, with a participation rate of 48.5%. Of the 180 participants, 94.4% (170)
had OH&S work experience, ranging from 1 to 44 years, with an average of 16 years. There
were 89 occupational hygienists, representing about half (49.4%) of all respondents, followed by
occupational consultants (26.7%), relevant stakeholders such as OH&S product exhibitors and
staff from companies providing OH&S services (21.1%), and workplace OH&S managers
(2.8%). Of the 89 hygienists, 35 (39.3%) were general industry hygienists. The numbers and
percentages of hygienists from the mining industry, government, university, and military
hygienists were 34 (38.2%), 12 (13.5%), 7 (7.9%), and 1 (1.1%), respectively (Figure 8.1). The
majority of participants were from Western Australia, followed by New South Wales (20.6%),
Victoria (16.7%), South Australia (12.2%), and Queensland (10%).
Table 8.1 Demographic information of the participants
Category n %
Total 180 100.0
Occupation
Hygienist 89 49.4
Occupational consultant 48 26.7
OH&S manager 5 2.8
Other 38 21.1
Area
Western Australia 45 25.0
New South Wales 37 20.6
Victoria 30 16.7
South Australia 22 12.2
Queensland 18 10.0
Overseas 13 7.2
Tasmania 9 5.0
Australian Central Territory 4 2.2
Northern Territory 2 1.1

Chapter eight: Occupational hygienists’ perceptions on workplace heat exposure
169
Figure 8.1 Number and percentage of different hygienist categories
8.3.1 Concern and awareness
As shown in Table 8.2, nearly 90% of participants were moderately or more concerned about
extreme heat resulting in increased hazards in the workplace. Almost two thirds of participants
agreed that extremely hot weather due to a changing climate may present a future challenge for
heat stress management. Half (50.0%) of participants were satisfied or strongly satisfied with the
heat preventive measures currently adopted in workplaces. By contrast, 19.4% were not satisfied.
As shown in Table 8.3, no significant differences were observed between hygienists and others
on heat concern, attitudes toward climate change-related heat stress challenge, and satisfaction
level of current heat prevention measures. Similarly, no significant differences were identified
between Western Australia and Queensland and other Australian States.
General industry hygienist, 35
(39.3%)
Mining hygienist, 34 (38.2%)
Government hygienist, 12
(13.5%)
University hyginest, 7 (7.9%)
Military hygienist, 1 (1.1%)

Chapter eight: Occupational hygienists’ perceptions on workplace heat exposure
170
Table 8.2 Number and percentage of respondents' concern and awareness on workplace extreme heat
exposure
Question Response n %
1. How concerned are you about extreme heat resulting in
increased hazards in the workplace?
Extremely 27 15.0
Very 93 51.7
Moderately 43 23.9
A little 13 7.2
Not at all 4 2.2
2. Do you agree or disagree that extremely hot weather due
to changing climate presents a future challenge for
workplace heat management?
Strongly agree 21 11.7
Agree 96 53.3
Neutral 44 24.4
Disagree 15 8.3
Strongly disagree 4 2.2
3. Overall, are you satisfied or dissatisfied with the measures
currently adopted for reducing the risk of heat illnesses
and injuries in the workplace or workplaces that you
consult in during very hot weather?
Strongly satisfied 5 2.8
Satisfied 85 47.2
Neutral 55 30.6
Dissatisfied 35 19.4
Strongly dissatisfied 0 -
Table 8.3 Comparison of heat concern, attitudes toward future heat challenge, and satisfaction level
of heat prevention measures by occupation and area
Heat concern
Future heat stress challenge
Satisfaction of heat prevention measures
Yes No p-value Yes No p-value Yes No p-value
Occupation
Hygienists 63 26 0.246
58 31 0.963
48 42 0.297
Non-Hygienists 57 34
59 32
41 49
Area
WA and Qld* 43 20
0.740 36 27
0.105
36 27 0.130
Other States 77 40 81 36 53 64
*WA and Qld: Western Australia and Queensland

Chapter eight: Occupational hygienists’ perceptions on workplace heat exposure
171
8.3.2 Preparedness and management
As shown in Table 8.4, 68.9% of participants indicated that there were hot weather plans or heat
stress policies currently available in their workplaces or workplaces where they consult. When
further asked which industrial sectors had hot weather plans or polices (data not shown), 62.1%
mentioned the mining industry, followed by manufacturing (25.0%), electricity, gas and water
(8.9%), construction (8.1%), and defence (3.2%). Ninety percent of participants responded that
they had heard workers express concerns over heat during hot weather, of which 7.4% said it was
“always”, with the frequency for “often”, “sometimes”, and “seldom” being 36.8%, 44.2%, and
10.4%, respectively. About half (52.8%) of respondents reported that they have investigated
heat-related illnesses or injuries in the past five years.
Roughly 61% of respondents agreed that there was a need to increase heat-related training in
workplaces. Approximately one third of respondents held the opposite view, with 85.3%
believing that “training is generally adequate” and 14.8% considered “it is not a serious problem”
(data not shown). When asked which aspects of heat-related training should be strengthened, one
respondent suggested:
“Hydration maintenance, self-pacing, heat acclimatization, and early symptoms of heat illness”
When asked if there is a need for more heat-related regulations, 51.7% answered “yes”, 36.7%
said “no”, and 11.7% replied “not sure”. Among those with negative responses, 65.1% thought
“there are enough heat-related regulations already” and 11.1% considered “it is not a serious
problem” (data not shown).
The results showed that most (81.7%) respondents did not know of organizations planning for
the predicted increase of extremely hot weather. Furthermore, 73.3% of respondents did not

Chapter eight: Occupational hygienists’ perceptions on workplace heat exposure
172
know of companies that have made changes to reduce the impact of extremely hot weather. Only
26.1% of respondents intended to alter their heat-related prevention recommendations in a
warming climate. By contrast, 52.8% of respondents did not intend to alter recommendations to
management or companies.
Table 8.4 Number and percentage of extreme heat preparedness and management
Question Number (%)
Yes No Not sure
1. Is there a hot weather plan or heat stress policy in your
workplace or any workplaces that you consult in? 124 (68.9) 42 (23.3) 14 (7.8)
2. In your experience have workers ever expressed concern
about heat in your workplace (or workplaces you consult in)
during very hot weather?
162 (90.0) 18 (10.0) -
3. In the last five years, have you had to investigate the
circumstances around injuries or illnesses that could be
attributed to extreme heat (air temp greater than 38℃)?
95 (52.8) 85 (47.2) -
4. Do you think there is a need for more training about working
in very hot weather in your workplace or workplaces that
you consult in?
109 (60.6) 69 (38.3) 2 (1.1)
5. Do you think there should be more regulations for reducing
the risk of heat-related illnesses and injuries in very hot
weather applicable to your workplace or workplaces that you
consult in?
93 (51.7) 66 (36.7) 21 (11.7)
6. Do you know of any organizations planning for increased
frequency of extremely hot weather events? 33 (18.3) 147 (81.7) -
7. Do you know of any companies that have recently made
changes to maintain OH&S in work environments where
extreme heat may become more common? 48 (26.7) 132 (73.3) -
8. Do you intend to alter your recommendations to
management or companies due to the likelihood of
increased hot weather? 47 (26.1) 95 (52.8) 38 (21.1)

Chapter eight: Occupational hygienists’ perceptions on workplace heat exposure
173
8.3.3 Preventive measures and adaptation barriers
As shown in Figure 8.2, “provision of cool drinking water” was the most commonly mentioned
preventive measure currently adopted in the Australian workplaces for reducing the impact of
heat exposure, followed by “heat stress related training” (76.1%), “central cooling system or air
conditioning” (70.0%), “shady rest area” (68.9%), “rescheduling work time” (67.2%), and
“electric fan” (52.2%). Furthermore, 41.7% of participants recommended “the cessation of work
if the temperature is extreme”. Other heat prevention measures suggested by the respondents
through the “other” option mainly included:
“Standardized heat checklist”, “personal heat stress monitoring”, “heat vulnerability
screening”, and “raising awareness through school education and mass media”
Figure 8.2 Heat-related preventive measures currently adopted in the workplace
61 (33.9%)
75 (41.7%)
94 (52.2%)
121 (67.2%)
121 (67.2%)
124 (68.9%)
126 (70.0%)
137 (76.1%)
175 (97.2%)
0% 10% 20% 30% 40% 50% 60% 70% 80% 90% 100%
Other
Stop outdoor work if the temperature is extreme
Electric fan
Broad brimmed hats supplied
Rescheduling work time
Shady rest area
Central cooling system or air conditioning
Heat stress related training
Provision of cool drinking water

Chapter eight: Occupational hygienists’ perceptions on workplace heat exposure
174
As shown in Figure 8.3, the most frequently mentioned heat prevention barrier was “lack of
awareness” (68.3%), followed by “lack of training” (56.1%), “lack of management commitment”
(52.2%), “low compliance and implementation of heat stress prevention programs” (40.0%),
“lack of financial resources to bring in engineering controls” (37.2%), and “lack of specific heat-
related guidelines and regulations” (36.7%). Other potential barriers suggested by the
respondents through the “other” option were:
“The conflict between increased personal protective equipment (PPE) requirements and heat
dissipation”, “work demands/priority”, “peer pressure”, “workers’ poor self-management”,
“lack of engineering controls”, “cultural and ethnic issues”, and “lack of heat acclimatization
due to the fly-in/fly-out (FIFO) work regime”
Figure 8.3 Heat prevention and adaptation barriers existing in the workplace
4 (2.2%)
21 (11.7%)
66 (36.7%)
67 (37.2%)
72 (40.0%)
94 (52.2%)
101 (56.1%)
123 (68.3%)
0% 10% 20% 30% 40% 50% 60% 70% 80% 90% 100%
None
Other
Lack of specific heat-related guidelines and regulations
Lack of financial resources to bring in engineeringcontrols
Low compliance and implementation of heat stressprevention programs
Lack of management commitment
Lack of training
Lack of awareness

Chapter eight: Occupational hygienists’ perceptions on workplace heat exposure
175
8.3.4 Relationship between heat concern, satisfaction and heat prevention efforts
As shown in Table 8.5, participants who have concern about heat exposure were more likely to
support the strengthening of heat-related training and regulations, and also more likely to alter
their recommendations to their management team or companies. Those not satisfied with current
heat prevention measures showed stronger views on more heat-related training and regulations
and the adjustment of heat prevention advice.
Table 8.5 Relationship of heat concern and satisfaction level on the attitudes towards more training
and regulations, and the adjustment of heat prevention recommendations
Classification
More training required
More regulations required
Suggested amending recommendations
Yes No p-value Yes No p-value Yes No p-value
Concern about heat exposure
Yes 82 38 0.003
75 45 0.000
40 80 0.002
No 27 33
18 42
7 53
Satisfied with heat prevention
Yes 45 45 0.004
40 52 0.025
21 69 0.396
No 64 26 53 35 26 64
8.4 Discussion
Perceptions about weather-related heat stress and its potential impacts on OH&S have been
investigated among South African outdoor labourers,116 Indian manufacturing workers,
108 US
migrant farmers,169
and Australian outdoor physical workers (Chapter 7). However, to date there
is no research investigating the perceptions and activities from the perspective of professionals
such as occupational hygienists who work at the coalface in controlling environmental and

Chapter eight: Occupational hygienists’ perceptions on workplace heat exposure
176
occupational hazards. Therefore, this study, the first of its kind in Australia or elsewhere,
provides valuable baseline information and expert opinion on heat-related OHS hazards.
8.4.1 Heat exposure concern
The results of this survey showed that a vast majority of occupational hygienists and specialists
were concerned about workplace heat exposure. Almost all respondents often heard workers’
concerns on heat exposure during hot weather, indicating that workers’ thermal comfort has been
compromised by heat exposure in the Australian workplaces. This is supported by previously
published studies investigating workers’ physiological responses to heat exposure.46, 112, 320
A
study conducted in Western Australian showed that nearly 70% of aboveground miners were
poorly hydrated.112 Heat strain has also been reported among South Australian shearers,
carpenters, and railway track maintenance workers when temperatures exceeded 37℃.46
Moreover, in the present study more than half of respondents had the experience of investigating
injuries and accidents occurring during extremely hot weather, supporting the notion that the
occurrence of serious heat-related illnesses, injuries and even deaths in Australian workplaces is
not uncommon.70, 306-308
This suggests that heat stress prevention methods currently adopted in
Australian workplaces may not sufficiently and effectively protect vulnerable workers from heat-
related illnesses and injuries. Relevant actions should be taken on the aspects of administrative
controls, educational training, personal behaviours adjustment, and the development of heat
prevention policies.
With projections of warmer temperatures, heat exposure may present a growing challenge on
workers’ health and safety.19, 20, 35
The results in this study showed that a majority of
occupational hygienists and specialists agreed with this view. However, only 26% of participants

Chapter eight: Occupational hygienists’ perceptions on workplace heat exposure
177
intended to amend their heat-related prevention recommendations to companies. The awareness-
practice gaps may be explained by the fact that some participants believed that climate change
related heat impacts on OH&S are not a current threat. Using a respondent’s words from an
open-ended question, it is “not confirmed science”.
The major reasons accounting for some hygienists’ lack of concern over heat exposure were they
felt there were adequate measures already being implemented and scepticism about the realistic
impact of climate change on workers’ health and safety. Relevant training, workshops, or forums
in the future may improve occupational hygienists’ awareness of the impact of climate change on
workers’ health and safety.
8.4.2 Heat exposure preparedness
From the surveyed delegates’ point of view in this survey, Australian workplaces are not well-
prepared for the likelihood of a warmer climate, as most of these skilled OH&S professionals did
not know of any companies that have taken actions to reduce the impact of heat stress. Although
most workplaces reportedly had hot weather plans, significant increase of injury claims for
vulnerable sub-groups were still observed during heatwaves in Adelaide according to the
findings in Chapter 6.
When asked which industries had a hot weather plan, the respondents mentioned mining,
manufacturing, ‘electricity, gas and water’, construction, and defence. However, agricultural
sectors and seasonal workers were not mentioned, probably because hygienists are not usually
employed in this sector and therefore could not draw from their experience in that industry.
Evidence has also shown that farmworkers and forestry workers are at high risk of heat illnesses
and injuries,92-94, 97, 101, 139
especially for seasonal and migrant workers.125, 321, 322
Australia has a

Chapter eight: Occupational hygienists’ perceptions on workplace heat exposure
178
large group of seasonal and migrant farmworkers due to farm labour shortages, relatively high
hourly wages, and the provision of working holiday visa (sub-class 416 and 417).160
Some
undocumented (illegal) workforce participants e.g. unauthorized residents, overseas students
working in excess of permitted hours, and travellers working without authorisation, may also
meet Australian seasonal labour market needs in the harvest season of some labour-intensive
crops such as fruits and vegetables.160
Agricultural workers, especially migrant and seasonal
farm labourers, are one of the most underserved and understudied occupational populations.321
Therefore, more heat prevention programmes should be directed to this heat vulnerable group.
8.4.3 Current heat prevention measures
The results showed that about half of respondents were not satisfied with current heat prevention
measures, reflecting the necessity to upgrade current policies and strategies. Australia has
mandatory heat regulations in place to protect workers from extreme heat; however at present
there are many ambiguities which may hinder the implementation and effectiveness. According
to the survey results, provision of cool drinking water was the most common heat prevention
measures, which is also required by the national Model Code of Practice (managing the work
environment and facilities);313
however, this is not available in all Australian workplaces. A
similar problem exists in other countries as well, especially in some low-middle income
countries. According to a study in Costa Rica, sugarcane workers had to supply their own
drinking water and wrapped water jugs in wet clothes to keep water from over-heating in the
direct sunlight, as sometimes there was no shady rest area nearby.97
Some non-governmental institutions (e.g. the Australian Institute of Occupational Hygienists Inc.
(AIOH)53
or trade unions (e.g. the Construction, Forestry, Mining and Energy Union

Chapter eight: Occupational hygienists’ perceptions on workplace heat exposure
179
(CFMEU)181
) have made specific heat stress management guidelines. Nevertheless, the
unenforceable and non-mandatory nature of the guidelines may raise the problem of low
compliance. As some respondents reported:
“Guidelines and procedures are available but not used efficiently and consistently” and “A lot of
people do not take it seriously, guidelines such as ACGIH WBGT should be taken up into
regulations”.
According to the Construction, Forestry, Mining and Energy Union (CFMEU), “if temperature is
over 37°C all work ceases unless working in air conditioned area”.181
However, in this study
only 40% of respondents selected “stop outdoor work” as a preventive measure when the
temperature was extremely hot. Some workers such as emergency (e.g. fire-fighting) and utility
maintenance staff are inevitably exposed to extreme heat due to the nature of tasks. In this case,
the incorporation of technology advances into engineering controls may be a solution. For
example, more breathable personal protective equipment could be developed or the wearing of
cooling vests considered.
8.4.4 Heat prevention barriers
In this study, a majority of Australian respondents thought that lack of awareness was the major
barrier for heat stress prevention, which is supported by a study conducted in the USA.169
In
2011, the US OSHA launched a nationwide campaign to raise heat risk awareness in the
workplace.171
Heat prevention barriers may also include lack of training and management
commitment, low compliance and implementation of heat prevention policies, and lack of
financial resources, which have been identified by previous heat studies in the USA.173, 314
In
addition, the increase of the fly-in/fly-out (FIFO) work regime may prove a challenge for heat

Chapter eight: Occupational hygienists’ perceptions on workplace heat exposure
180
acclimatisation. Currently, approximately 49% of Western Australia’s mining sites are operating
on a FIFO basis.48
If workers are flown in from a cool area to an extremely hot area, they may be
not acclimatized to heat and would be more susceptible to heat-related injuries.
8.4.5 Limitations
The limitations to this study include that a purposive convenience sampling method was
employed. Due to the relatively small sample size, caution should be exercised regarding the
generalization of the results. Nevertheless, a large proportion (estimated to be about 50%) of
senior occupational hygienists in Australia participated in the survey. Further research is needed
to explore why a considerable proportion of occupational hygienists and associated professionals
were not satisfied with current heat prevention measures, and how employers and policy-makers
perceive the risk of workplace heat exposure. Despite the limitations, this survey may add to
current knowledge and provide valuable expert opinion in terms of the development of heat
prevention strategies.
8.5 Conclusion
Australian occupational hygienists and specialists showed concerns over heat stress, but did not
show strong willingness to amend heat prevention recommendations to management or
companies. The Australian workplaces may not be well-prepared for the likelihood of increasing
incidence of heat stress due to climate change. The major heat prevention barriers recognized by
the participants were lack of awareness, lack of training, lack of management commitment, and
low compliance of heat prevention policies. The high proportion of participants not satisfied with
current heat prevention measures indicates there is a need to further develop current heat
management strategies in the Australian workplaces.

181
SECTION IV
DISCUSSION AND
CONCLUSION

Chapter nine: Discussion and conclusion
182
Chapter 9
Discussions and conclusions
9.1 Introduction
This thesis mainly explored two issues on occupational heat exposure: (1) the effects of hot
weather on workers’ health and safety at the population level; and (2) the risk perceptions of
workplace heat exposure and preparedness for a likelihood of increasing hot weather in South
Australia. Time-series regression analyses were used to investigate the association between daily
high temperatures and workers’ injury claims (Chapter 5). Beyond the daily temperature-injury
claims relationship, additional effects of several consecutive days’ high temperatures on workers’
health and safety were also examined (Chapter 6). Two separate questionnaire surveys (Chapter
7 and 8) were conducted to investigate workers and occupational hygienists’ heat risk
perceptions. This Chapter outlines the key findings of the thesis, addresses strengths and
limitations of the study as well as the significance of the study. Implications and
recommendations are discussed. Several options for further research on occupational heat
exposure are suggested.
9.2 Key findings of this thesis
A synthesis of the key findings of previous chapters is summarized as below:
9.2.1 Analyses of workers’ compensation claim data
Characteristics of overall workers’ compensation claims during the study period

Chapter nine: Discussion and conclusion
183
There were 318 932 notified workers’ compensation claims during the 9-financial year
period of 2001-2010 in South Australia, with an overall claim rate of 4.7 per 100 employees.
The majority (76.7%) of claims occurred in the Adelaide metropolitan area.
Workers’ compensation claim rates demonstrated a downward trend over the study period,
indicating the necessity to adjust the effect of long-term trends when conducting time-series
analysis.
Relatively less claims occurred in December and January compared with other months. This
may be due to public holidays and that people are more likely to take annual leave during the
summer months. It suggests a need to exclude public holidays from time-series analysis.
Characteristics of occupational heat illnesses
There were 306 injury claims identified due to heat exposure during the period of 2001-2010
in South Australia, with an incidence rate of 4.5 per 100,000 employees, representing 0.1%
of all injury claims during the study period. The majority (69.0%) of heat illness claims
occurred in the Adelaide metropolitan area. Approximately 81% of heat illness claims were
made by males. The average age of heat illness claimants was 39.4 years old and the median
age was 39 years.
The majority of heat illness claims occurred in the warm season (October to March for South
Australia), and the hottest part of the day between 10am and 6pm.
Relatively higher heat illness incidence rates were observed in ‘mining’ and ‘electricity, gas
and water’ industries, and those employed as labourers and tradespersons in South Australia
during the study period.

Chapter nine: Discussion and conclusion
184
There was no significant increase in daily occupational heat illness claims in Adelaide with
the increase of Tmax below a threshold of 35.5℃. However, when Tmax was above 35.5℃, 1 ℃
increase of Tmax was associated with 12.7% increase of occupational heat illness claims.
The results of case-crossover analysis suggest that during heatwave periods the risk of heat
illness was about 4-7 times higher than that of non-heatwave periods.
The association between high temperature and work-related injuries in Adelaide
A reversed U-shaped exposure response relationship between daily maximum temperature
(Tmax ) and overall daily injury claims were observed. The overall risk of work-related
injuries was positively associated with Tmax below 37.7 ℃. However, daily injury claims
dropped noticeably when the weather was extremely hot.
For overall outdoor industries, a 0.5% increase of injury claims was associated with per
degree increase of Tmax below 37.8℃, however, daily claims decreased by 3.4% when Tmax
exceeded 37.8℃. By contrast, no significant association between claims and temperature was
detected in overall indoor industries.
Significant temperature-injury claims relationships were also found in the following sub-
groups with increasing Tmax below certain threshold temperatures ranging from 31.8℃ to
38.9℃: young workers aged ≤24 years; those working in the industries such as ‘agriculture,
forestry and fishing’, ‘construction’, and ‘electricity, gas and water’; or employed as
labourers, production and transport workers, and tradespersons in small and medium sized
businesses.
When the temperature was extremely hot (e.g. over 38℃), almost all industries decreased in
injury claims. The only exception is ‘electricity, gas and water’ industry. Daily injury claims
increased by 2.9% with per degree increase of Tmax above 37.2℃.

Chapter nine: Discussion and conclusion
185
No delayed effects of hot weather (Tmax above thresholds) on injury claims were found for all
industries and outdoor industries, indicating the impact of temperature on workers’ health
was acute.
The impact of heatwaves on workers’ health and safety
During heatwaves, there were no significant changes in the number of injury claims among
male workers. By contrast, female workers had a significant decrease of 6.5% in claims
during heatwaves. Almost half of the claims were from middle-aged workers (35-54 years).
Overall no particular age group showed a significant increase of injury claims during
heatwave periods compared with control periods.
Outdoor male labourers and tradespersons aged ≥55 years in ‘agriculture, forestry and fishing’
and ‘electricity, gas and water’ industries are at higher risk of injury during heatwaves in
Adelaide.
Occupational burns, lacerations, amputations, and heat illnesses are found to be significantly
associated with extreme heat, together with injuries resulting from moving objects, chemical
exposures, and environmental factors.
Using two heatwave definitions, similar results were observed in overall claims and the
effects stratified by gender, age, outdoor industry, and occupation. The differences in effect
estimates were found in indoor industries such as ‘public, administration and defence’ and
‘wholesale and retail trade’. The results of injury mechanism specific analysis between the
two definitions were basically consistent, except ‘hitting objects with a part of the body’
which only increased significantly for the stricter BOM heatwave definition.

Chapter nine: Discussion and conclusion
186
9.2.2 Workers’ perceptions on workplace heat exposure
Overall, workers in South Australia were moderately concerned about heat exposure. Young
workers were less concerned than older workers. Workers undertaking very physically
demanding work, wearing PPE, or having heat illness/injury experience were more
concerned about heat exposure.
Less than half of the respondents in South Australia indicated that they have received heat-
related training and more than half indicated that there was a need for more training to help
reduce the risk of heat stress. More supportive attitudes towards heat-related training were
reported in workers those 25-54 years who had experienced a heat illness/injury. Heat-related
training (49.7%) was the most common way for workers to obtain information about heat
prevention.
Roughly 63.8% of participants agreed that there should be more heat-related regulations and
guidelines for working during very hot weather whereas the remainder thought “there are
enough regulations” or considered workplace heat exposure to not be a serious problem.
More than two-thirds of participants were willing to adjust their current work habits in the
heat, and having a previous heat illness experience was an influencing factor.
More than half of the participants were satisfied with current heat prevention measures. The
provision of cool drinking water was the most common prevention measure, followed by
wearing broad brimmed hats, rescheduling work time, having central cooling and air
conditioning, the use of electric fans, and having a shady rest area. Only 19.6% answered
“stopping work” as a prevention measure when the temperature was extremely hot
(e.g. >40℃).

Chapter nine: Discussion and conclusion
187
Up to 70% of respondents expressed that they worked at their own pace during very hot
weather.
9.2.3 Occupational hygienists’ perceptions on heat exposure
Australian occupational hygienists and specialists showed great concerns over heat stress, but
they did not show strong willingness to amend heat prevention recommendations to
management or companies.
From occupational hygienists’ point of view, Australian workplaces may not be well-
prepared for the likelihood of increasing heat stress due to climate change.
The major heat prevention barriers recognized by occupational hygienists were lack of
awareness among workers, lack of training, lack of management commitment, and low
compliance of heat prevention policies.
The high proportion (50%) of participants not satisfied with current heat prevention measures
indicates there is a need to further develop current heat management strategies in Australian
workplaces.
9.3 Significance of this Thesis
Heat exposure is an important but overlooked occupational hazard, which is not only a matter of
occupational health and safety but also productivity and economic loss. It may affect all levels of
our society – socially (due to health impacts and their broader implications) and economically
(due to loss of productivity in industry and health sector costs), and deserves special
consideration. Many epidemiological studies have confirmed that extremely hot weather may
result in excess morbidity and mortality in the general population. However, research on the
impact of hot weather on occupational health and safety has received little attention.

Chapter nine: Discussion and conclusion
188
This study is significant firstly because it fills knowledge gaps in the field of occupational heat
exposure on the following two aspects: (1) Findings of workers’ compensation claim data
analyses (Section II) provide valid and reliable epidemiological evidence for confirming the
effects of high temperatures on workers’ health and safety at the population level. The estimation
of the quantitative heat-injury claims relationship and the characteristics of occupational heat
illnesses enable a better understanding of the extent to which workers are affected by high
temperatures. This information may be meaningful for decision makers to develop strategies
against the possible OH&S-related impacts of climate change. (2) The two questionnaire surveys
are the first of their kind in Australia to investigate heat exposure perceptions from the
perspective of workers and occupational health experts, the results will provide baseline
information for the development of heat health promotion methods in the workplace.
In addition to filling knowledge gaps, this study is also significant from the perspective of heat
prevention practice. The identification of heat vulnerable sub-groups and work-related
illnesses/injuries associated with heat exposure is useful when formulating targeted heat
prevention measures and optimizing the allocation of heat prevention resources. The
investigation of perceptions of heat exposure among workers and occupational hygienists
provides firsthand information from the workplace regarding current heat prevention and
adaptation problems, and preparedness for the likelihood of warmer weather. Therefore, findings
of this study provide valuable implications for the development of heat policies to reduce the
impact of hot weather on workers’ health and safety. A potential reduction of heat-related
injuries may contribute to the fulfilment of the Australian Work Health & Safety Strategy 2012-
2022 national targets.38

Chapter nine: Discussion and conclusion
189
From a wider perspective, effective control of workplace heat exposure may not only benefit
workers but also employers, in terms of reducing heat-related claims costs due to productivity
loss and the improvement of workers retention rates.
9.4 Strengths and limitations
There are several strengths of this study. First, the study is unique in that no previous study has
investigated in detail the effects of extreme heat on workers’ health and safety at the population
level using compensation claims data. Standard time-series analysis with GEE models and
linear-spline functions has been used to quantify the heat-injury claims relationships after the
adjustment of confounding factors. Case-crossover design was used to estimate the risk of heat
illness during heatwaves.
Until now, there has been a knowledge deficit regarding the risk perceptions of workplace heat
exposure in Australia, despite several studies undertaken in other countries such as the USA,169,
173, 174 India,
108 and South Africa.
116 Therefore, the investigation of workers and occupational
hygienists’ perceptions of heat exposure may be of great interest to employers, policy-makers,
occupational hygienists and relevant stakeholders involved with OH&S.
Findings of this study may make a valuable contribution to the knowledge of the impact of heat
exposure on workers’ health and safety. It may also provide implications for heat-related policy
development and practical interventions locally and internationally.
The main limitations of this study have generally been addressed in each chapter. In summary,
for the analyses of workers’ compensation claims (Section II), work/heat-related injuries may be
underestimated due to the underreporting of compensation claims. Second, daily maximum dry
air temperature for Adelaide was selected as the heat exposure index when analysing the heat-

Chapter nine: Discussion and conclusion
190
injury claim relationships. Indeed, some composite heat indices such as AT (apparent
temperature) which have been applied in some heat-related morbidity and mortality studies in
Europe244, 245, 247, 323
and the USA324
might better represent the approximate thermal comfort
status in the workplace. However, an Australian study has shown that different heat indices have
similar predictive abilities when analysing the temperature-health outcomes association.275
Moreover, Adelaide is known as the driest capital city in Australia, and humidity keeps
consistent and is not considered to be a major concern during the warm season because of its
climatic characteristics. Third, only one weather station (Kent Town, Adelaide) was selected for
representing the heat exposure status of all workplace in the Adelaide metropolitan area.
Nevertheless, the temperature of each individual’s workplace may vary considerably. Fourth, the
temperature/heatwave-injury claims association for mining industry was not examined in this
study, as the analyses were restricted to the Adelaide metropolitan area; however, almost all
mine sites were located in rural areas of the state. Fifth, due to the unavailability of some
surveillance variables and the inherent nature of ecological study, the effects of some personal
risk factors such as the use of certain medication, chronic disease history, and levels of fitness
and acclimatization have not investigated. Sixth, the relatively small number of some category-
specific analyses dictates cautious interpretation of results. Seventh, in recent years distributed
lag non-linear models have been increasingly used in time-series analysis to quantify the non-
linear exposure-response relationships.354, 355
This methodology is recommended in the future
studies, as it can flexibly and accurately model the exposure-lag-response association. Finally,
specific characteristics of heatwaves such as duration, intensity, timing, and possible lag effects
were not taken into account when analysing the heatwave effects.

Chapter nine: Discussion and conclusion
191
For the survey of workers’ perceptions of workplace heat exposure (Chapter 7), limitations may
include the relatively low response rate (50.9%), the over-representation of male workers, and
possible recall bias as the survey was partly conducted during the cold season. Additionally,
workers’ knowledge of heat was not investigated in this study. For the survey of occupational
hygienists’ views of heat exposure (Chapter 8), limitations are mainly in relation to the
convenience sampling method and the generalization of the results due to the small sample size.
9.5 Implications and recommendations for workplace heat prevention
Many cross-sectional studies have found that outdoor workers are affected by extremely hot
weather58, 71, 86, 98, 112, 115, 117, 122
, as summarized in Chapter one. With the predicted increase in the
frequency and intensity of extremely hot weather,31, 32, 276
occupational heat exposure may
present a growing realistic threat to workers’ health and safety in the future.19, 20, 35
By estimating
the effects of heat exposure on work-related injuries at the population level and investigating the
heat risk perceptions among workers and occupational hygienists, findings of the present study
provide useful implications for the possible development of heat stress management and
prevention as follows.
9.5.1 Heat policy implications
As mentioned previously, many heat studies focusing on the general population have found a U,
V, or J-shaped relationship between high temperature and health outcomes.11, 13, 15, 16, 18, 222
Morbidity and mortality risks start to slowly increase when ambient temperatures extend beyond
a certain thermal comfort range and when they become extremely hot, poor health outcome risks
increase sharply. In this study, a reversed U-shaped relationship between daily high temperatures
and occupational injury claims was observed in almost all industries. This apparently

Chapter nine: Discussion and conclusion
192
contradictory finding can be probably explained by the fact that some effective heat prevention
measures may be taken when temperatures become extreme. However, workers in some
industries where production cannot be stopped (e.g. electricity, gas and water) or undertaking
tasks with emergency nature are still at high risk of heat-related injuries and accidents.
Appropriate heat management programs and policies can reduce the risk of occupational heat
exposure. Heat prevention strategies for those who are expected to or have to work in extremely
hot environments may first include pre-placement health assessment screening. Screening for
heat stress vulnerable individuals for some occupations (e.g. miners, firefighters, and foundry
workers) and jobs susceptible to extreme heat should consider the following factors: physically
demanding level of the work; and for the worker, consideration of any prior cardiovascular or
pulmonary conditions; previous history of heat stress, and use of certain medications. In the
increasingly warmer global climates, job specific heat vulnerability screening is of
importance.325
Other measures may include heat acclimatisation, wearing lighter and more
breathable clothing (or smart clothing) that can change thermal properties dynamically,168
and
intensified training to increase workers’ heat prevention knowledge and risk perceptions.
In this study, significant temperature-injury relationships were also observed in some sub-groups.
The human body heat balance can be affected by environmental and non-environmental factors.
The latter includes work demand, clothing, and the proximity to heat sources. Thus, exertional
heat-related illnesses and injuries can still occur when the weather is not unduly hot. However,
current heat prevention regulations and guidelines mainly focus on outdoor workers in extremely
hot weather. Indeed, mild days occur more often than extremely hot days, and may importantly
contribute to the burden of work-related injuries. Therefore, this needs to be taken into account
when developing new heat prevention policies and education plans to reduce the adverse effects

Chapter nine: Discussion and conclusion
193
of environmental and process-generated heat in the workplace.226
Additionally, heat vulnerable
sub-groups can differ in different settings. For instance, in this study young workers have been
shown to be at higher risk of work-related injury among all age groups when the temperature is
below 38℃, while older workers are more vulnerable to heat during heatwaves, perhaps due to
the extended duration of high temperature days.
9.5.2 Establishment of workplace heat alert system
After 2003 European heatwaves, the introduction of heat warning systems and some specific
public health interventions have successfully contributed to the decline of heat-related
mortality.302, 326
However, it is not known if temperature-based thresholds18, 225, 305
for the general
population can be directly applied to the workplaces. Therefore, the development of locally
suitable early heat warning system is needed to alert workers and relevant stakeholders in
advance and then to implement effective measures to reduce the risk of harmful effects of
extreme heat on workers’ health and safety. The principal components of a workplace early
warning system may include threshold temperature detection, weather forecasting, prediction of
the possible health outcomes, an effective and timely response plan, and an ongoing evaluation
of the system.326
The system should be developed in collaboration with all relevant stakeholders
to ensure that the issues of greatest concern are identified and addressed, thus increasing the
likelihood of success. Relevant stakeholders may include local meteorological services, safe
work departments, government health departments, and emergency response departments.
The selection of trigger temperatures for workplace heat alert levels is very important for the
activation of action responses, which needs to take into account the sensitivity, reliability, and
validity issues. In the present study, the threshold estimates stratified by industry ranged from

Chapter nine: Discussion and conclusion
194
36.7℃ to 38.3℃ for Adelaide. As illustrated in Figure 9.1, the hot weather action guidelines
suggested by the Construction, Forestry, Mining and Energy Union (CFMEU) South Australia
Branch has three heat alert levels: <35℃, 35-37℃, and >37℃.181 However, one threshold
temperature (two-piece linear spline function with one knot) was estimated for industry-specific
analysis in this study, which can only provide two heat alert levels. Nevertheless, threshold
estimates in this study still provides supportive evidence for the CFMEU hot weather plan. It
should be noted that different regions may need different threshold temperatures due to the
differences in climatic characteristics, work environments, and public health infrastructure.18, 327
According to the CFMEU working procedure under hot weather conditions (Figure 9.1),181
outdoor work continues normally but some measures should be taken to minimize heat
discomfort and stress with the increase of air temperature below 35℃. This is supported by the
findings in Chapter 5 as the risk of work-related injury increases among some vulnerable sub-
groups even when the temperature is not extremely hot. If the temperature is between 35-37℃,
the CFMEU SA Branch suggests that outdoor work ceases and indoor work continues normally
but relevant actions should be taken to avoid heat strains. If the temperature is over 37°C all
work ceases unless working in air conditioned area. This may explain the observed decline in
injury claims reported from the construction industry when the temperature reaches the threshold.
However, a low proportion (19.6%) of surveyed outdoor workers in this study answered
“stopping working if the temperature exceeds 40°C”, indicating there is a need to make the
unenforceable CFMEU heat alert guideline mandatory to ensure its implementation in some
specific heat risk industries instead of just depending on employers’ self-discipline. For
industries with a high proportion of casual and self-employed workers such as agriculture,
enforceable implementation of the heat alert procedures may be impractical or ineffective. In this

Chapter nine: Discussion and conclusion
195
case, heat-related training and education programs should be strengthened before summer to
improve workers’ heat knowledge and self-protection/adaptation awareness and capacity.
Usually, daily maximum air temperature is used as the indicator of heat alert systems. However
it does not take into account other heat balance affecting factors such as humidity, radiation,
wind speed, work demands, clothing, heat tolerance and acclimatization. Currently, the Wet Bulb
Globe Temperature (WBGT) is the most widely used heat index providing a simple method for
heat stress assessment in the workplace.54, 177
In addition, real time monitoring of occupational
health data (e.g. workers’ compensation claims) and weather data may be used to forecast the
risk of heat-related illnesses and injuries.327
In addition to the temperature-based heat alert systems, the development of a locally suitable
heatwave definition is needed to activate heat alerts.223
A heatwave is generally defined using
daily maximum temperature plus other meteorological factors with a specified duration ranging
from one to several days. Currently, there is arguably no standard heatwave definition. The
impacts of different heatwave definitions on heat outcome estimates have been investigated in
the general population.281, 328
The results of this study suggest that different heatwave definitions
produced similar but slightly different outcomes (Chapter 6).329
Currently, there is no a
standardized procedure regarding how to define a standard heatwave which may vary regionally
in terms of thresholds and metric but can represent the onset of physiological stress.330, 331
One major shortcoming for threshold-based workplace heat alert systems is that they do not
consider the unique characteristics of each individual during its prediction. Even for the same
individual heat vulnerability may vary in different days due to the change of work demands,
acclimatization status, and clothing. The establishment of early heat alert and warning systems

Chapter nine: Discussion and conclusion
196
can be regarded as a rough defence line to protect the majority of at risk workers from heat-
related illnesses and injuries.

Chapter nine: Discussion and conclusion
197
Figure 9.1 The Construction, Forestry, Mining and Energy Union (CFMEU) hot weather guideline181

Chapter nine: Discussion and conclusion
198
9.5.3 Real time health surveillance
Regarding heat stress management for certain occupations or work circumstances where high
heat exposure cannot be avoided, real-time physiological monitoring is a good option,168
as it can
detect early health impacts of hot weather and take timely actions to limit individual heat
exposure to safe levels. In general, physiological monitoring on heat strains relies on the measure
of heat rate and a surrogate of human body’s internal core temperature (e.g. skin, ear, oral, and
rectal temperature).54
Validation of these monitoring systems based on heart rate and some
surrogate temperatures is urgently needed.168
Currently, there are commercial devices to measure core temperature directly. They can report
the individuals’ dynamitic surveillance core temperatures to a remote central station in real time
and inform decision making. Meanwhile, it enables individuals to know their heat stress status in
real time and take adaptation measures (e.g. self-pacing) timely once the core temperature
exceeds the exposure limits (e.g. 38℃54). This approach is feasible for heat stress management
among those at high risk of heat exposure, whereas the costs remain high for direct core
temperature measurement particularly for small or self-employed businesses.
A practical obstacle limiting the popularization of direct core temperature measurement in real
time is the use of an invasive sensor which is generally undesirable.54, 168
Some attempts have
been made to predict the onset of core temperature rise and generate alerts in real time,332-334
obviating the need for ingestion of a temperature pill. Further efforts are needed to develop easy-
to-use, affordable, and economical real time core temperature surveillance systems. It will have a
great application prospect among industries and occupations susceptible to extreme heat,168
especially in a warming climate.30, 32

Chapter nine: Discussion and conclusion
199
9.5.4 The combination of self-regulated and mandatory heat management
The Australian Institute of Occupational Hygienists (AIOH) has adapted the ACGIH and NIOSH
heat stress management programs for use in the Australian environments.53, 54
It provides a useful
guide in a staged manner for occupational health and safety professionals to design an
appropriate heat prevention program taking into account their workplace context. Heat control
methods can be divided into two broad categories: general and specific.54
General controls
should be implemented anytime there is a reasonable potential for heat stress on the job and
applicable across all heat stress jobs. By contrast, specific controls are directed to individual jobs.
A heat stress assessment follows the traditional hierarchy of hazards controls, including
elimination or substitution of the hazard, engineering control (e.g. equipment for air movement,
mechanical aids to reduce manual handling requirements, and a provision of cooling facilities),
administrative controls (e.g. job rotation, work/rest regimes, and documented procedures for
inspection), and personal protective equipment.54
These standard traditional heat stress control
protocols can be well implemented in some large businesses with institutionalized work
environments, as heat regulations and guidelines can be enforced and easily regulated not only
by the organizations themselves but also by the local regulators.167
This may in part explain the
findings of Chapter 5 - i.e. that a significant temperature-injury claims relationships was not
found in the large businesses but in the medium-small businesses in Adelaide.139
Out of necessity, heat-related standards and regulations are generally conservative and are
stricter than they need to be for protecting the majority of workers. This may unnecessarily
constrain some individuals with high heat tolerance and reduce their work rate.167
Subjective
feelings of thermal comfort can indicate workers’ heat stress level. Self-pacing is the human
body’s autonomous safeguards intuitively activated to manage thermally stressful conditions and

Chapter nine: Discussion and conclusion
200
reduce heat strain, which can attenuate fatigue, maximize long-term endurance and enable
sustained activity over the workday.82, 114
In this study, about 70% of participants answered that
they worked at their own pace during extremely hot weather (Chapter 7). Workers’ self-pacing
phenomena have also been found in another two Australian studies conducted in Western
Australia.114, 115
Currently, whilst the real time core temperature surveillance method is not
popularized, self-regulated management (perceptual heat awareness in conjunction with
autonomous control over work conditions, work rates and work limits) may be the most valid
and cheapest means of determining heat exposure limits at an individual level.167
It is worth
noting that self-regulated protection is subject to the conditions that the task has no urgent
character and does not involve work rate based payment incentives.40
Therefore, the flexible
combination of mandatory regulations and self-regulated protection is a very good heat stress
management pattern, especially suitable for large businesses such as the ‘electricity, gas and
water’ and ‘construction’ industries.
Self-regulated heat prevention has some requirements in workers’ heat risk awareness and
knowledge. For large businesses, there are normally formal opportunities for educating
individuals. For medium-small size businesses with a high proportion of casual and self-
employed workers such as ‘agriculture, forestry and fishing’, specific heat campaigns before
summer can be used to improve workers’ heat risk awareness and knowledge.171
9.5.5 Heat education, training, and individual capacity building
Education and training have been proved to be a successful strategy for increasing workers’
occupational hazards knowledge, building their heat prevention skills and confidence, and
supporting the effective implementation of workplace health and safety requirements.335
In this
Chapter nine: Discussion and conclusion
201
study, training is the most common way for workers to obtain heat prevention information,
however less than half of the respondents have received heat-related training. Occupational
hygienists surveyed in this study suggested that lack of awareness and training is the major heat
prevention barriers existing in the workplace. Therefore, there is a need to launch timely heat
campaigns before summer to raise heat awareness, teach workers and employers about the
dangers of working in hot weather, and provide valuable resources to address these concerns. As
part of heat campaigns, a 24-hour hotline or email sponsored by an alliance of government
agencies and non-profit organizations could be set up during the warm season for workers to
access heat-related counselling services. Meanwhile this would provide workers with a channel
to report violations of local heat regulations to protect their rights and ensure the implementation
of heat regulations.
Heat-related training can be mandatorily incorporated into workplace health and safety induction
programs and emergency response plans. Heat-related training should be strengthened before
each summer, especially among the heat vulnerable sub-groups identified such as young and
older workers undertaking outdoor physically demanding work in ‘agriculture, forestry and
fishing’, ‘construction’, and ‘electricity, gas and water’ industries in this study. Annual training
for all employees may cover the following contents: the hazards of heat stress, recognition of
predisposing heat risk factors, early signs and symptoms of heat illnesses, first aid procedures of
heat stroke, increased injury risk when working in hot environments, and current heat prevention
regulations and policies in place.
Specific training workshops and seminars can be extended to occupational health physicians,
nurses and hygienists, as well as managers, to improve their knowledge and skills in relation to
heat prevention and treatment and recent research results and recommendations. In addition,

Chapter nine: Discussion and conclusion
202
some efforts should be made to help employers realize the benefits of effective heat stress
management (e.g. the reduction of productivity loss due to heat and the decreased occupational
diseases burden), because employers’ support is very important for the implementation of heat
regulations and policies. Heat education and training can be served as software to improve
workplace heat adaptive capacity.
In addition to formal heat training and education, some mass media such as newspapers,
magazines, radio, TV, internet, leaflets and posters can also be used to provide heat promotion
information. However, it should be noted that passive dissemination of workplace heat
prevention advice may not be sufficient to reach those workers most at risk.336
The appropriate
channels of heat information promotion need to be selected according to the characteristics of the
targeted vulnerable sub-groups.337
9.5.6 Establishment of collaborative mechanisms
The implementation and development of heat regulations and policies, the establishment of early
heat alert and warning systems, the launch of heat prevention campaigns, and heat education and
training need the cooperation between institutions from various sectors and administrative levels.
Involved institutions may include SafeWork Departments, the Bureau of Meteorology, State
Emergency Service, Health Departments, trade associations, unions and professional bodies, and
training institutions. It is important to decide who are the overall responsible lead bodies
coordinating cooperation, interventions, joint activities, and resource allocation. During
extremely hot weather, the lead organization is required to trigger specific activities and
interventions on the basis of the heat warning issued by the weather service.326

Chapter nine: Discussion and conclusion
203
9.6 Further research directions
This study has answered defined questions related to the impact of heat exposure on workers’
health and safety at the population level and the heat risk perceptions among workers and
occupational hygienists. However, there is still a need for further research to be conducted in the
field of occupational heat exposure in a warming climate. The following areas should be
explored in the future:
9.6.1 Heat exposure and occupational disease/injury burden
As the direct health outcomes of excess heat exposure, the number of occupational heat illnesses
is relatively small when compared with other occupational diseases/injuries, according to the
results of this study in Chapter 4 and previous statistics from Washington DC.72
Moreover, the
average time lost and medical expenditure due to heat illnesses were relatively less than the
average levels of overall occupational diseases and injuries in the present study (Chapter 4),
similarly to the Washington DC study.72
Evidence has shown that working in hot environments
may increase the risk of work-related injuries and accidents,21, 27-29
which may not be reported as
a result of heat exposure.37, 64
Estimating the occupational disease/injury burden due to heat is
meaningful to better understand the possible additional disease/injury burden resulting from
global warming and the predicted increase in extreme heat events.30
9.6.2 Heat exposure and productivity loss
Occupational heat exposure may result in productivity loss through the following two ways: (1)
physical (e.g. self-pacing) and cognitive performance decrement,20, 41, 44, 46, 233, 234, 338
and (2) the
loss of afternoon outdoor work time during extremely hot weather.36, 276
A 2% loss of body fluid
can result in physical performance impairment.339
In indoor environments, a consistent decrease

Chapter nine: Discussion and conclusion
204
in the performance of typical office work was observed when air temperature exceeded 24-
26℃.340
By contrast, in outdoor environments, two recent field studies conducted among rice
harvesters and construction workers in India have found that work efficiency may reduce 2-5%
per degree increase of ambient temperature exceeding certain thresholds.42, 45
With the predicted increase of extremely hot weather due to climate change,30, 31
the reduction of
afternoon work time may result in considerable productivity loss in some labour-intense
industries involving outdoor work (e.g. agriculture and construction),36, 46, 276
especially in some
low-middle income in the tropical regions.233, 234
The first global attempt to estimate the
economic loss due to climate change and cost benefit analyses was published in the Climate
Vulnerability Monitor 2012.341
Further local and industry-specific analyses are needed to
estimate the impact of climate change related extremely hot weather on productivity loss,20, 63
taking into account not only the local climate conditions but also workforce composition.276
9.6.3 Heat risk perceptions among employers, policy-makers and relevant stakeholders
Multidisciplinary collaboration and comprehensive efforts from all levels of the workplaces is
the key to the development and implementation of a successful heat stress control program. The
team may consist of workers, employers, management, regulators, occupational physicians,
nurses, hygienists, ergonomists, and toxicologists. In this study, workers and occupational
hygienists’ heat risk perceptions have been investigated in Chapter 7 and 8. Employers and heat
policy-makers play an important role in heat stress management, implementation, and the
development of heat prevention policies; Occupational medicine physicians serve several
important functions in preventing heat-related illnesses and injuries, such as heat illness

Chapter nine: Discussion and conclusion
205
diagnosis and treatment, pre-placement medical screening; Occupational nurses provide care and
symptom relief for patients with heat illnesses.
Thus, there remains a critical need to investigate their views on occupational heat exposure and
workers’ health and safety and productivity loss in a warming climate. Qualitative research such
as interviews and focus group discussions is recommended, given its strength in exploring how
people are thinking about an issue.342
In particular for employers and policy-makers, it may be
very difficult to recruit enough participants to meet sample size requirement if conducting a
quantitative questionnaire survey among them.
9.6.4 Heat exposure and workers’ reproductive health
Occupational heat exposure can be a significant risk factor for male workers’ infertility.343
Currently, there is lack of research to investigate the exposure-outcome association between high
temperature and male infertility at the population level. For female workers, a recently published
paper has shown that high ambient temperature may result in earlier delivery among term
births.344
More evidence is needed for better understanding of the adverse impact of extreme heat
on maternal and pregnancy outcomes.317
9.6.5 The development of heat standards for different climatic conditions and local use
To date many heat standards have been developed to protect workers from heat-related illnesses
and injuries, as summarized in Chapter 1. Most of these standards (e.g. ISO and ACGIH heat
standards) are designed for the use in the temperate western settings. Whether these heat
standards are suitable for the use in different geographical, cultural, socioeconomic, and climatic
contexts in terms of validity and reliability deserves further investigation.167, 345
In addition, new
types of work in relation to some new technologies, climate change, accelerated urbanization,

Chapter nine: Discussion and conclusion
206
globalisation and diverse populations all provide significant heat challenges and will require
continual review and development of existing standards and strategies for the future.52
9.7 Conclusion
Heat exposure is an invisible and silent occupational hazard, which is often overlooked and not
considered as occupational health prevention priority due to the relatively small number of heat
illnesses recorded compared with other occupational diseases/injuries.72, 259, 346
In recent years,
there is increasing recognition of the importance of occupational heat exposure,19-21, 33, 37, 40, 64, 167,
168 driven by the projected increase of global average temperature and extremely hot weather
events.31, 32, 35
The association between high temperatures and work-related injuries is confirmed in this study.
For outdoor industries, one degree increase of Tmax below the threshold of 37.7℃ was associated
with 0.5% increase in work-related injuries. When the weather is not extremely hot, the
following workers are at higher risk of work-related injuries: young workers aged ≤24 years;
those working in the industries such as ‘agriculture, forestry and fishing’, ‘construction’, and
‘electricity, gas and water’; or employed as labourers, production and transport workers, and
tradespersons in small and medium sized businesses. While during heatwave periods, vulnerable
sub-groups are outdoor male labourers and tradespersons aged ≥55 years in ‘agriculture, forestry
and fishing’ and ‘electricity, gas and water’ industries. Occupational burns, lacerations,
amputations, and heat illnesses are found to be significantly associated with extreme heat in
Adelaide, together with injuries resulting from moving objects, chemical exposures, and
environmental factors. The identification of heat vulnerable workers and diseases/injuries

Chapter nine: Discussion and conclusion
207
associated with heat provides very useful information for the development of targeted heat
intervention measures.
Both workers and occupational hygienists are concerned about the impacts of weather-related
heat exposure. However, a high proportion of them are not satisfied with current heat regulations
and guidelines, indicating the need to develop heat prevention policies and strategies. Current
heat regulations are too ambiguous to effectively protect workers from heat-related illnesses and
injuries,19, 314
although an unexpected decline of work-related injuries is observed when the
temperature is extremely hot.27, 139, 226
There are some specific heat guidelines already in place,181
whereas they are unenforceable and cannot ensure the implementation.347
Heat prevention
barriers existing in the workplace include lack of awareness, lack of training, lack of
management commitment, and low compliance of heat prevention policies.
Australian workplaces are not well-prepared for the likelihood of increasing heat stress due to
climate change. Regarding the suggestions for heat stress control and management, in the short
term it may include the establishment of workplace heat alert systems, real time health
surveillance for workers undertaking tasks with emergency nature, the flexible combination of
self-regulated and mandatory heat management pattern, specific and clear enforceable heat
regulations, and heat awareness campaign and promotion. In the long-term, it may include
changes to building and urban design to mitigate the impacts of increasing global temperatures,
the improvement of work conditions, and measures to reduce greenhouse gas emission. Inter-
disciplinary and multi-sectorial efforts are required to minimize the negative impacts of a
changing and warming climate on workers’ health and safety.

Appendices
208
APPENDICES
Appendix A
209
Appendix A: Overseas heat-related regulations and standards
1. The United States
1.1 Legal requirements
To date there are no specific national regulatory standards available in the United States to
protect workers from excessive environmental heat exposure37
, although heat-related illness has
been a well-recognized occupational hazard in outdoor work environments. Under the General
Duty Clause of the Occupational Safety and Health Act (OSH Act) of 1970348
, in Title 29 USC
654, employers are required to provide their employees with a place of employment that “is free
from recognized hazards that are causing or likely to cause death or serious harm to his
employees.” Hence, an employer has a legal obligation to provide a workplace free of heat-
related hazards that are likely to cause death or injury. Twenty-five states plus Puerto Rico and
the Virgin Islands have OSHA-approved State Plans and are required to adopt standards that are
at least as effective as those adopted by the Federal OSHA. Most of the remaining State Plans
have standards and enforcement policies beyond what is required by the Federal OSHA. No
federal occupational standards specifically address heat stress prevention, although three state-
based regulations that have been adopted in California, Washington, and Minnesota.
In 2005, the California Occupational Safety and Health Administration implemented the nation’s
first heat stress regulation49
. Under the Title 8 California Code of Regulations, Section 3395,
employers in agriculture, construction, landscaping, oil/gas extraction, and transportation or
delivery of agricultural products, construction materials or other heavy materials are explicitly
required to provide shade when the temperature exceeds 85 degrees Fahrenheit (29.4℃). They
also need to provide drinking water, access to regular breaks, and training to workers and
supervisors regarding heat stress prevention. When the temperature equals or exceeds 95 degrees

Appendix A
210
Fahrenheit (35.0℃), employers are required to implement high-heat procedures including
ensuring effective communication, observing early signs and symptoms of heat illness,
reminding employees throughout the work shift to consume small quantities of water regularly,
and close supervision of new employees.
In 2007, Washington State issued a similar heat regulation (WAC 296-62-095) for workplace
outdoor heat exposure50
which has been updated in 2009. To my knowledge, it is the first official
definition regarding outdoor work environment: an environment where work activities are
conducted outside. Employees inside transportation road vehicles are not considered to be
“working outdoors” while driving or occupying the vehicles if the vehicles are able to maintain
airflow throughout the vehicle by use of fans, vents, or open windows. Construction activity is
considered to be work in an indoor environment when performed inside a structure after the
inside walls and roof are erected. Work performed within outdoor containment areas such as lead
removal projects on bridges, or where an employee must enter a manhole, tunnel, or outdoor
vault are considered outdoor work activities. The Washington heat regulation operates between 1
May and 30 September of each calendar year, only when outdoor heat at or above an applicable
temperature listed in Table A1 of WAC 296-62-09510 or WAC 296-307-09710. To ensure
effective and meaningful application of the rules, all violations are cited as serious with
appropriate penalty. This may be one of the strictest mandatory heat management regulations in
place.

Appendix A
211
Table A1 Outdoor temperature action levels
Clothing WBGT*, ℉
Non-breathing clothes including vapor barrier clothing or PPE such as chemical resistant suits
52
Double-layer woven clothes including coveralls, jackets and sweatshirts
77
All other clothing 89
*WBGT: wet bulb globe temperature.
In 2008, Minnesota issued a standard for indoor heat exposure 349
. It requires employees shall not
be exposed to indoor environmental heat conditions in excess of the values listed in Table A2,
where the values apply to fully clothed and acclimatized workers. In addition, a minimum air
temperature of 60 degrees Fahrenheit (15.6℃) shall be maintained in all indoor workrooms
where work of a strenuous nature is performed, and a minimum air temperature of 65 degrees
Fahrenheit (18.3℃) shall be maintained in all other workrooms unless prohibited by process
requirements.
Table A2 Two-hour time-weighted average permissible heat exposure limits
Work activity WBGT*, ℉
Heavy work 77
Moderate work 80
Light work 86
*WBGT: wet bulb globe temperature.
Note: “Heavy work” means 350-500 kcal/hour, for example: heavy lifting and pushing, shove work; “Moderate work” means 200-350 kcal/hour, for example: walking about with moderate lifting and pushing; “Light work” means up to 200 kcal/hour, for example: sitting or standing performing light hand or arm work.

Appendix A
212
In 2011, Occupational Safety and Health Administration (OSHA) launched a heat illness
prevention campaign in order to raise awareness and teach employers and outdoor workers about
the risk of working in hot weather,171
with the support of the California OSHA, NIOSH, and the
National Oceanic and Atmospheric Administration (NOAA). Apart from developing a heat-
themed webpage to provide educational resources on risk, prevention, signs and symptoms, and
first aid for heat illnesses, the OSHA also provides a free on-site consultation about occupational
heat exposure for small businesses with fewer than 250 workers.350
Moreover, on-site
consultations services are separate from enforcement and do not result in penalties and citations.
In addition, the US Mine Safety & Health Administration (MSHA) also has voluntary guidelines
and recommendations for heat stress prevention in miners.
1.2 Heat standards and guidelines
The American Conference of Governmental Industrial Hygienists (ACGIH) is a membership-
based professional association of industrial hygienists and practitioners of related professions. In
1956, ACGIH established the concept of threshold limit value (TLV). Its major purpose is to
provide guidelines to assist in the control of occupational hazards such as heat stress. The TLVs
for heat stress and strain were introduced in 1974, with the goal of maintaining core body
temperature within +1℃ of normal (37℃). It should be realized that TLVs for the assessment of
heat stress and strain are only recommendations by ACGIH with a guideline or suggestion status.
ACGIH TLVs do not have a legal force. Therefore, it should not be confused with heat exposure
limits having a regulatory status, like those published and enforced by the OHSA.
A five-step easy-to-use decision making process has been first suggested by ACGIH in 2001 for
evaluating the risk to workers health and safety due to heat stress and strains, taking clothing and

Appendix A
213
work demands factors into account, as shown in Figure A1. The decision process should be
stated when (1) a qualitative exposure assessment indicates the possibility of heat stress, (2) there
are reports of discomfort due to heat stress, or (3) professional judgement indicates heat stress
conditions. The guidance provided in the Figure 1 should be used together with the
accompanying Documentation, including WBGT-based “screening criteria for TLV and Action
Limit for heat stress exposure”, “clothing adjustment factors for some clothing ensembles”,
“metabolic rate categories and the representative metabolic rate with example activities”,
“guidelines for limiting heat strain”, and “elements to consider in establishing a heat stress
management program”. It must be recognized that the ACIGH guidelines provide means for
determining conditions under which it is believed that an acceptable percentage of healthy
workers can be repeatedly exposed without adverse heat effects54
. Therefore, the level of heat
exposure to be permitted by the management, or by regulatory requirements, is subject to a
socio-economic decision on the proportion of the exposed population for whom safeguarding is
to assured.
The American National Institute for Occupational Safety and Health (NIOSH) is another federal
agency, conducting research and making recommendations for the control of occupational
hazards including heat exposure. NIOSH recommended a heat exposure standard to the US
OSHA in 1972 and updated that recommendation (recommended heat stress alarm limits, RAL;
recommended heat stress exposure limits, REL) in 1986.179
Similar to the ACGIH standards in
terms of authority, NIOSH standards are not mandatory and enforceable. The NIOSH website
provides information relating to heat stress. The ACGIH and NIOSH heat standards provide a
useful template for other countries to develop their own locally suitable heat guidelines or/and
regulations.

Appendix A
214
Figure A1 Evaluating heat stress and strain180
2. Canada
Currently, almost all Canadian provinces and territories employ the ACGIH TLVs standard as
either guidelines or legal regulations for all or particular working environments such as
construction and underground mines. However, under the Canadian Occupational Health and

Appendix A
215
Safety Regulations of 2014, heat stress related clauses do not exist. In 2003 the Occupational
Health Clinics for Ontario Workers (OHCOW) developed a new heat stress measurement
method called “Humidx”. However, it is only used by the Treasury Board Secretariat (TBS) as
basis for a legal health and safety regulation to determine the indoor thermal conditions.
3. Europe
3.1 Legal requirements
As summarized in Table A3, there are no specific regulations regarding heat stress control and
prevention in the EU member countries.
3.2 Heat standards and guidelines
The European Committee for Standardization has developed two heat stress standards: EN
27243:1993 and EN ISO 7933:2004. On the basis of the two standards, every EU member
country’s standardization committee developed the equivalent or identical standards. Basically,
all European countries use the ISO heat standards.
4. Japan
Japan is one of the participating countries involved in the production of ISO heat standards.52
In
Japan, the heat and cold stress threshold limit values (TLVs) are established by the Society for
Occupational Health and the thermal standard for offices is set up by the Ministry of Health,
Labour and Welfare.351
The criteria for the occupational heat stress limits are described for
healthy male workers who are acclimatized and wear normal working clothes, which is similar
with the ACGIH TLVs. These criteria are mainly set up for working in mines and factories.352

Appendix A
216
Table A3 Legal requirements relating to workplace heat exposure in some European Union countries
Country Key legislation Requirement
Austria Occupational Safety and Health at Work Act
“Employees may only be employed after suitability tests (before starting work)
and follow-up tests (on a regular basis if the work continues) are carried out in
the case of heat which places a particular strain on the body”; “Workplaces and
work processes must additionally be designed in such a way that vibrations and
other physical effects and other stress factors (such as heat …) are kept as low
as possible”
Germany EU directives and German OSH Strategy None required
United
Kingdom
The Workplace (Health, Safety and Welfare)
Regulations, 1992
"7(1) During working hours, the temperature in all workplaces inside buildings
shall be reasonable."; "7(3) A sufficient number of thermometers shall be
provided to enable persons at work to determine the temperature in any
workplace inside a building."; "22(1) An adequate supply of wholesome
drinking water shall be provided for all persons at work in the workplace.(2)
Every supply of drinking water required by paragraph (1) shall - (a) be readily
accessible at suitable places; and (b) be conspicuously marked by an
appropriate sign where necessary for reasons of health or safety..."
The Management of Health and Safety at Work
Regulations 1999
"19(2) no employer shall employ a young person for work in which there is a
risk to health from (i) extreme cold or heat."
France Labour Code No.262/2006 None required
Belgium
Royal Decree of 3 May 1999 on the assignments
and operation of the Committees for prevention
and protection at work
None required

Appendix A
217
The
Netherlands Working Conditions Act, 1999
"Chapter 6.1 Temperature: (1) the temperature at the workplace should not
cause damage to the health of the employees. (2) If because of the
temperature in the workplace or by unfavourable weather conditions damage
can still be caused to the health of the employees, personal protective
equipment should be made available..."; "Article 7.9 High and low
temperatures. Employees should be prevented as much as possible from
coming into the direct surroundings of work equipment or its parts which are at
very high or very low temperatures..."; "Article 3.27 General requirements:
Sufficient drinking water or other soft drinks should be available on the
construction site."
Bulgaria Law on health and safety at work 1997 None required
Croatia
Act on safety and health protection at the
workplace None required
Czech Republic Labour Code None required
Denmark Working Environment Act
"39(1) The Minister for Employment may lay down more detailed regulations
on the requirements which shall be complied with in order that the work may
be regarded as planned, organised and performed in such a way as to ensure
health and safety, including regulations on heat..."
Estonia Occupational Health and Safety Act
"6(2) An employer shall implement measures to prevent a health risk arising
from physical hazards or reduce it as much as possible."; "6(4) The indoor
climate at a workplace – air temperature and humidity and air velocity – shall
be appropriate for the performance of official duties..."
Finland
Act on Occupational Safety and Health
Enforcement and Cooperation on Occupational
Safety and Health at Workplaces No 44/2006
None required

Appendix A
218
Hungary Act No. 93 of 1993 on Occupational Safety and
Health
"13(a) Any factor present during or in connection with the performance of work
that might endanger or harm employees or persons present in the area in
which the work is being carried out, including the pressure, temperature,
humidity and ionization level of air..."; "Section 24 (a): All employees shall be
entitled to have access to appropriate amounts of drinking water..."
Ireland Safety, Health and Welfare at Work Act 2005 None required
Poland
Labour Code: Section X Work safety and hygiene
None required Law on Social Labour Inspection, 1983
Portugal
Law No. 102/2009 the legal arrangements for the
promotion of occupational safety and health 10
September 2009
"Article 69. Preventive measures should be taken if the temperature below 0℃
or higher than 42℃…"
Romania Law No. 319, 14 July 2006 – Law on Safety and
Health at Work None required
Spain Law 31/1995: Prevention of Occupational risks, 8
November 1995 None required
Sweden The Swedish Work Environment Act
"2. Occupational exposure limit values are a useful aid to practical work
environment policy. Limit values can also be specified for temperature…"
The Work Environment Ordinance None required

Appendix A
219
5. Selected major developing countries
5.1 China
Due to the increased heat-related deaths that have occurred among outdoor labourers during hot
summer days in recent years, the State Administration of Work Safety, the Ministry of Health,
the Ministry of Human Resources and Social Security, and the all-China Federation of Trade
Unions issued a notice on 29 June 2012 to promulgate the “Administrative Measures on
Preventing Heat Stroke and Lowering Temperature” 51
. Employers are required to take
appropriate measures to ensure workers’ health and safety according to the local hot weather
warning or alert.
Apart from some general requirements such as rescheduling work time, increasing rest times,
reducing work intensity, the provision of drinking water and other cooling facilities, heat stress
training and education, heat vulnerability screening among some special occupations, the
Administrative Measures explicitly require that “(1) All outdoor work should be ceased when the
maximum air temperature (Tmax) exceeds 40℃; (2) When the Tmax is between 37-40℃, the
accumulative work time should not exceed 6 hour, and employers should not arrange outdoor
work during the hottest 3 hours of a day unless otherwise inevitable; (3) When the Tmax is
between 35-37℃, requirements include the use of a work rotation pattern, reducing continuous
work time, and avoid working overtime for outdoor workers; (4) Employers should not arrange
pregnant workers and young workers to undertake outdoor work when the temperature over
35℃”. Moreover, employers are required to pay workers for the time lost due to heat exposure.
In addition, employers are required to provide high temperature allowance for employees
working outdoors in temperatures above 35℃ and when indoor temperatures are above 33℃.

Appendix A
220
The high temperature allowance is part of an employee’s salary, and payment is mandatory. A
selection of the high temperature allowance standards in China’s major cities and provinces was
summarized in Table A4. Problems appeared during the implementation of this requirement.
Many employers are too concerned about their costs to pay the high temperature allowance and
some of them have taken advantage of the loopholes in laws and regulations to avoid the
payment. Although relevant rules stipulate that employees can file a complaint with competent
authorities if their employers fail to provide the allowances, they seldom do so due to fears of
being fired. Therefore, it has been suggested that labour unions should shoulder the
responsibility to protects workers’ rights and interests, and ensure they receive the relevant
benefits and allowances when working in hot environments.
China is one of the participating countries involved in the production of ISO heat standards.
Technical standards for the evaluation of heat stress include ‘Classified Standards of Working in
the Hot Environment (GBZ/T229.3)’, ‘Limit Values of Allowable Continuous Heat Exposure
Time in Hot Environment (GBZ2.2)’, and the ‘Measurement of physical agents in workplace.
Part 7: Heat stress (GBZ/T 189.7-2007)’. They are similar with the ISO standards in terms of
heat measurement methods and prevention strategy.
5.2 Other developing countries
In India, the measurements of heat stress comply with the US ACGIH TLVs.180
Currently, there
are no specific regulations and codes for the prevention of heat stress. In South Africa legislation
requires that workers be provided with a safe work environment, but there is no specific heat
regulations for outdoor workers in terms of minimizing exposure to hazards including extreme
heat.116
A similar situation exists in Costa Rica.97

Appendix A
221
Table A4 High temperature allowance standards in major municipalities/provinces, China353
Municipality
/Province Operation requirement
Operation
period
Allowance standard on a monthly
basis in 2013
Beijing Work outdoors or indoors in temperature above
33℃ Jun - Aug
RMB 120 (≈AUD 22) for outdoor
workplaces; RMB 90 (≈AUD 18) for
indoor workplaces in 2010
Shanghai Work outdoors or indoors in temperature above
33℃ Jun - Sept
RMB 200 (≈AUD 37) per person for all
workplaces
Tianjin Work outdoors in temperature above 35℃or
indoors in temperature above 33℃ Jun - Aug
RMB 120 (≈AUD 22) per person for all
workplaces
Zhejiang Work outdoors in temperature above 35℃ or
indoors in temperature above 33℃ Jun - Sept
RMB 200 (≈AUD 37) per person for all
workplaces
Jiangsu Work outdoors or indoors in temperature above
33℃ Jun - Sept
RMB 160 (≈AUD 29) for outdoor
workplaces; RMB 130 (≈AUD 24) for
indoor workplaces
Guangdong Work outdoors or indoors in temperature above
33℃ Jun - Oct
RMB 150 (≈AUD 27) per person per
month or RMB 10 ( ≈AUD 1.8) per day
for all workplaces
Shaanxi Work outdoors in temperature above 35℃ or
indoors in temperature above 33℃ Jun - Sept
RMB 10 ( ≈AUD 1.8) per day for all
workplaces
Shandong Work outdoors or indoors in temperature above
33℃ Jun - Sept
RMB 120 (≈AUD 22) per person for all
workplaces
Hubei Work outdoors in temperature above 35℃ or
indoors in temperature above 33℃ Jul - Sept
RMB 8 ( ≈AUD 1.5) per day for all
workplaces
Sichuan Work outdoors in temperature above 35℃ or
indoors in temperature above 33℃ Jun - Sept
RMB 12 ( ≈AUD 2.1) per day for all
workplaces

Appendix B1
222
Appendix B1: Ethical approval letter for the analysis of workers’ compensation claim data

Appendix B2
223
Appendix B2: Renewal of the ethical approval for the workers’ compensation claim data

Appendix C
224
Appendix C: SafeWork SA Research Dataset Confidentiality Agreement

Appendix C
225

Appendix C
226

Appendix C
227

Appendix C
228

Appendix C
229

Appendix C
230
Appendix C
231

Appendix C
232

Appendix C
233

Appendix D
234
Appendix D: Research invitation letter for employers

Appendix E
235
Appendix E: Information sheet for workers
INFORMATION SHEET
Extreme Heat Exposure and Workers’ Health & Safety in South Australia
Research Background
Occupational exposure to extreme heat may lead to adverse health
effects and contribute to work-related injury. Those at risk of heat
stress include outdoor workers and workers in hot environments
such as those working outdoors in the building and construction
trades, firefighters, agricultural workers, miners, boiler room
workers and factory workers. With the predicted increase in the
frequency and intensity of extremely hot weather in South Australia,
workplace heat exposure is presenting a growing challenge to
occupational health and safety.
Aims of the research
This project aims to: (a) explore the extent to which manual workers are affected by or adapt to
extreme heat exposure in South Australia; (b) identify which industrial sectors and occupations
are most vulnerable to heat-related illness and injury in SA; (c) investigate how stakeholders and
manual workers perceive the impact of workplace extreme heat exposure on OH&S and
productivity loss; and (d) utilize the findings to inform policy implications and guidelines.
Study Design
Using both qualitative and quantitative methods, this research will be conducted in Adelaide in
three stages:
Stage I is the analysis of historical OH&S data to explore the association of heat exposure
and occupational compensation claims in SA.
Stage II will ascertain views and experiences of various stakeholders and key informants
regarding extreme heat in the workplace.
Stage III is a questionnaire survey of workers to explore perceptions of workplace heat
exposure, behavioural responses and adaptation barriers in South Australian workplaces.
DISCIPLINE OF PUBLIC HEALTH
Level 8, Hughes Building
North Terrace Campus

Appendix E
236
How do I participate?
If you are interested in this project and would like to participate, please email:
[email protected]. We are currently seeking workers to complete a questionnaire.
Target workers are those mainly undertaking manual work outdoors or in hot environments. For
this we require the permission and support of their employers. Questionnaires could be provided
to employers for distribution to workers. Stamped and addressed envelopes will be provided for
the return of completed questionnaire. Alternatively we could visit workplaces and conduct face-
to-face surveys which would take about 5-10 minutes to complete. Participation is voluntary and
people can withdraw from the study at any time without any reasons given.
Confidentiality would be assured
The questionnaire is anonymous and neither worker nor workplace will be identifiable in the
final analysis. Only members of the research team will have access to data. The study findings
will be published in a completely attributable format in order to ensure that no participants will
be identified.
What if I have a complaint or any concerns?
If you wish to raise concerns about the conduct of the project with an independent person or
discuss matters related to the University policy on research involving human participants or your
rights as a participant, contact: The Human Research Ethics Committee’s Secretary, Ph.: 08 8303
6028 or visit:http://www.adelaide.edu.au/ethics/human/guidelines/applications/#complaint.
For further information, please contact:
Jianjun Xiang, Discipline of Public Health, the University of Adelaide,
John Horrocks, Principal Data Analyst and Statistician, SafeWork SA,
Your contribution to this survey is very greatly appreciated.

Appendix F
237
Appendix F: Survey questionnaires for workers

Appendix F
238

Appendix F
239

Appendix F
240

Appendix F
241

Appendix G
242
Appendix G: Survey questionnaires for TAFE students

Appendix G
243

Appendix G
244

Appendix G
245

Appendix G
246

Appendix H
247
Appendix H: Ethical approval for questionnaire surveys

Appendix I
248
Appendix I: Survey questionnaires for hygienists

Appendix I
249
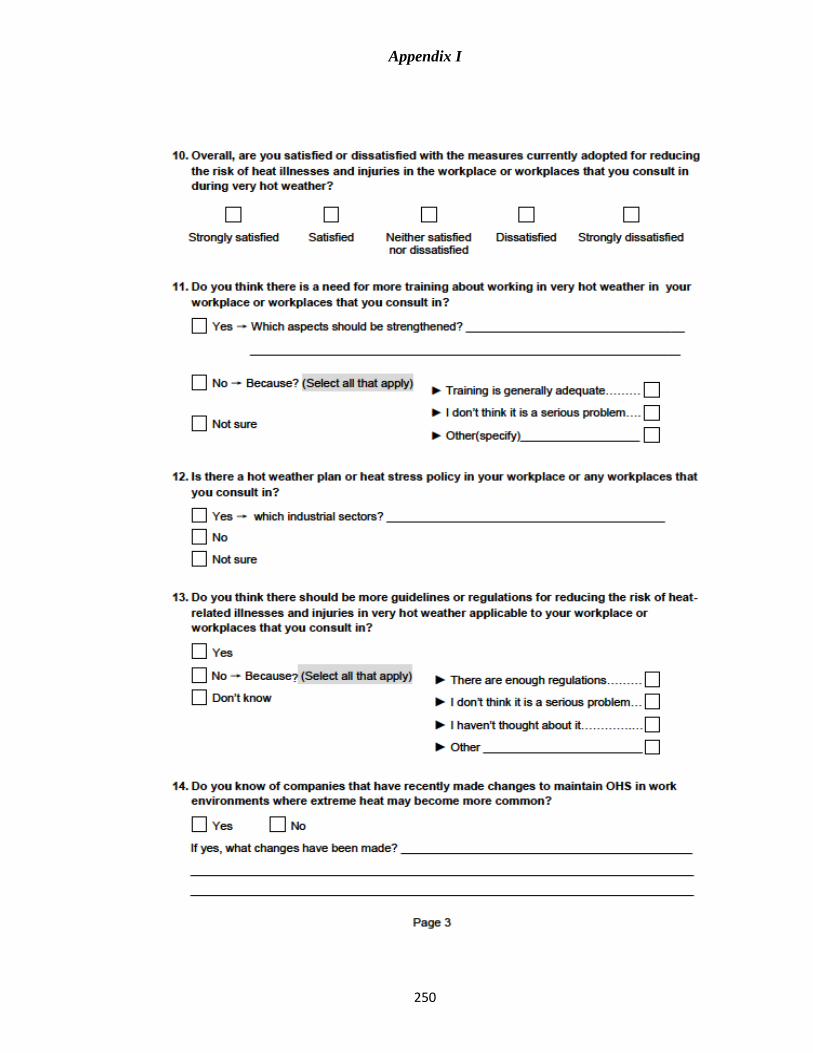
Appendix I
250

Appendix I
251

Appendix J
252
Appendix J: Information sheets for hygienists

Appendix K
253
Appendix K: Abstracts of published manuscripts

Appendix K
254
A Xiang, J., Bi, P., Pisaniello, D., Hansen, A. & Sullivan, T. (2013) Association between high temperature and work-related injuries in Adelaide, South Australia, 2001-2010. Occupational and Environmental Medicine, v. 71(4), pp. 246-252
NOTE:
This publication is included on page 254 in the print copy of the thesis held in the University of Adelaide Library.
It is also available online to authorised users at:
http://doi.org/10.1136/oemed-2013-101584

Appendix K
255
NOTE:
This publication is included on page 255 in the print copy of the thesis held in the University of Adelaide Library.
It is also available online to authorised users at:
http://doi.org/10.1016/j.envres.2014.04.042
A Xiang, J., Bi, P., Pisaniello, D. & Hansen, A. (2014) The impact of heatwaves on workers' health and safety in Adelaide, South Australia. Environmental Research, v. 133, pp. 90-95

Appendix L
256
Appendix L: Journal commentary on a published manuscript based on Chapter 5
A Basagana, X. (2014) High ambient temperatures and work-related injuries. Occupational and Environmental Medicine, v. 71(4), pp. 231
NOTE:
This publication is included on page 256 in the print copy of the thesis held in the University of Adelaide Library.
It is also available online to authorised users at:
http://doi.org/10.1136/oemed-2013-102031

References
257
REFERENCES
1. Kovats RS, Kristie LE. Heatwaves and public health in Europe. Eur J Public Health.
2006;16(6):592-9.
2. Semenza JC, Rubin CH, Falter KH, et al. Heat-related deaths during the July 1995 heat
wave in Chicago. N Engl J Med. 1996;335(2):84-90.
3. Naughton MP, Henderson A, Mirabelli MC, et al. Heat-related mortality during a 1999
heat wave in Chicago. Am J Prev Med. 2002;22(4):221-7.
4. Wolfe MI, Kaiser R, Naughton MP, et al. Heat-related mortality in selected United States
cities, summer 1999. Am J Forensic Med Pathol. 2001;22(4):352-7.
5. Bustinza R, Lebel G, Gosselin P, et al. Health impacts of the July 2010 heat wave in
Quebec, Canada. BMC Public Health. 2013;13:56. doi:10.1186/1471-2458-13-56.
6. Ostro BD, Roth LA, Green RS, et al. Estimating the mortality effect of the July 2006
California heat wave. Environ Res. 2009;109(5):614-9.
7. Knowlton K, Rotkin-Ellman M, King G, et al. The 2006 California heat wave: Impacts on
hospitalizations and emergency department visits. Environ Health Perspect.
2009;117(1):61-7.
8. Nitschke M, Tucker GR, Bi P. Morbidity and mortality during heatwaves in metropolitan
Adelaide. Med J Aust. 2007;187(11-12):662-5.
9. Tong S, Ren C, Becker N. Excess deaths during the 2004 heatwave in Brisbane, Australia.
Int J Biometeorol. 2010;54(4):393-400.
10. Bi P, Williams S, Loughnan M, et al. The effects of extreme heat on human mortality and
morbidity in Australia: implications for public health. Asia Pac J Public Health.
2011;23(2):27-36.
11. Hansen A, Bi P, Ryan P, et al. The effect of heat waves on hospital admissions for renal
disease in a temperate city of Australia. Int J Epidemiol. 2008;37(6):1359-65.

References
258
12. Hansen A, Bi P, Nitschke M, et al. The effect of heat waves on mental health in a
temperate Australian city. Environ Health Perspect. 2008;116(10):1369-75.
13. Turner LR, Barnett AG, Connell D, et al. Ambient temperature and cardiorespiratory
morbidity: a systematic review and meta-analysis. Epidemiology. 2012;23(4):594-606.
14. Astrom DO, Forsberg B, Rocklov J. Heat wave impact on morbidity and mortality in the
elderly population: a review of recent studies. Maturitas. 2011;69(2):99-105.
15. Ye X, Wolff R, Yu W, et al. Ambient temperature and morbidity: A review of
epidemiological evidence. Environ Health Perspect. 2012;120(1):19-28.
16. Basu R. High ambient temperature and mortality: a review of epidemiologic studies
from 2001 to 2008. Environ Health. 2009;8:40. doi:10.1186/1476-069X-8-40.
17. Nitschke M, Tucker GR, Hansen AL, et al. Impact of two recent extreme heat episodes on
morbidity and mortality in Adelaide, South Australia: a case-series analysis. Environ
Health. 2011;10:42. doi:10.1186/1476-069X-10-42.
18. Williams S, Nitschke M, Sullivan T, et al. Heat and health in Adelaide, South Australia:
assessment of heat thresholds and temperature relationships. Sci Total Environ.
2012;414:126-33.
19. Hanna EG, Kjellstrom T, Bennett C, et al. Climate change and rising heat: Population
health implications for working people in Australia. Asia Pac J Public Health. 2010;23(2
Suppl):14-26.
20. Kjellstrom T, Gabrysch S, Lemke B, et al. The ‘Hothaps’ programme for assessing climate
change impacts on occupational health and productivity: an invitation to carry out field
studies. Glob Health Action. 2009;2. doi:10.3402/gha.v2i0.2082.
21. Schulte PA, Chun H. Climate change and occupational safety and health: establishing a
preliminary framework. J Occup Environ Hyg. 2009;6(9):542-54.
22. Hunt PA, Smith JE. Heat illness. J R Army Med Corps. 2005;151(4):234-42.

References
259
23. Kjellstrom T, Butler AJ, Lucas RM, et al. Public health impact of global heating due to
climate change: potential effects on chronic non-communicable diseases. Int J Public
Health. 2010;55(2):97-103.
24. Vangelova K, Deyanov C, Ivanova M. Dyslipidemia in industrial workers in hot
environments. Cent Eur J Public Health. 2006;14(1):15-7.
25. Tawatsupa B, Lim L, Kjellstrom T, et al. Association between occupational heat stress
and kidney disease among 37 816 workers in the Thai Cohort Study (TCS). J Epidemiol.
2012;22(3):251-60.
26. Luo H, Turner LR, Hurst C, et al. Exposure to ambient heat and urolithiasis among
outdoor workers in Guangzhou, China. Sci Total Environ. 2013;472C:1130-6.
27. Morabito M, Cecchi L, Crisci A, et al. Relationship between work-related accidents and
hot weather conditions in Tuscany (central Italy). Ind Health. 2006;44(3):458-64.
28. Fogleman M, Fakhrzadeh L, Bernard TE. The relationship between outdoor thermal
conditions and acute injury in an aluminum smelter. Int J Ind Ergon. 2005;35(1):47-55.
29. Froom P, Caine Y, Shochat I, et al. Heat stress and helicopter pilot errors. J Occup Med.
1993;35(7):720-4.
30. Intergovernmental Panel on Climate Change (IPCC). Fourth assessment report. Geneva:
Inter-governmental Panel on Climate Change. Available from: www.ipcc.ch. [cited 25
March 2011].
31. Intergovernmental Panel on Climate Change (IPCC). Climate change 2013 (the fifth
assessment report): the phycial science basis. Available from:
http://www.ipcc.ch/report/ar5/wg1/. [cited 28 July 2014].
32. Commonwealth Scientific and Industrial Research Organization (CSIRO) and Australian
Bureau of Meteorology (BOM). Climate change in Australia Technical Report 2007-
Chapter 5: Regional climate change projections (temperature and precipitation).
Available from: http://www.climatechangeinaustralia.gov.au/technical_report.php.
[cited 31 July 2012].

References
260
33. Jay O, Kenny GP. Heat exposure in the Canadian workplace. Am J Ind Med.
2010;53(8):842-53.
34. Intergovernmental Panel on Climate Change (IPCC). Climate Change 2014 (the fifth
assessment report): Impacts, adaptation and vulnerability. Available from:
http://www.ipcc.ch/report/ar5/wg2/. [cited 18 June 2014].
35. Hyatt OM, Lemke B, Kjellstrom T. Regional maps of occupational heat exposure: past,
present, and potential future. Glob Health Action. 2010;3. doi:10.3402/gha.v3i0.5715.
36. Maloney SK, Forbes CF. What effect will a few degrees of climate change have on
human heat balance? Implications for human activity. Int J Biometeorol. 2010;52(2):1-14.
37. Gubernot DM, Anderson GB, Hunting KL. The epidemiology of occupational heat
exposure in the United States: a review of the literature and assessment of research
needs in a changing climate. Int J Biometeorol. 2013;58(8):1779-88.
38. SafeWork Australia. Australian Work Health and Safety Strategy 2012–2022. Available
from: http://www.safework.sa.gov.au/uploaded_files/Australian-WHS-Strategy-2012-
2022.pdf. [cited 11 May 2014].
39. SafeWork Australia. The National OHS Strategy 2002-2012. Available from:
http://www.safeworkaustralia.gov.au/AboutSafeWorkAustralia/Whatwedo/Publications
/Pages/SP200208NationalOHSStrategy2002To2012.aspx. [cited 1 May 2013].
40. Lundgren K, Kuklane K, Gao C, et al. Effects of heat stress on working populations when
facing climate change. Ind Health. 2013;51(1):3-15.
41. Hancock PA, Vasmatzidis I. Human occupational and performance limits under stress:
The thermal environment as a prototypical example. Ergonomics. 1998;41(8):1169-91.
42. Sahu S, Sett M, Kjellstrom T. Heat exposure, cardiovascular stress and work productivity
in rice harvesters in India: Implications for a climate change future. Ind Health.
2013;51(4):424-31.
43. Singh S, Hanna EG, Kjellstrom T. Working in Australia's heat: Health promotion concerns
for health and productivity. Health Promot Int. 2013. doi:10.1093/heapro/dat027.

References
261
44. Kjellstrom T, Kovats RS, Lloyd SJ, et al. The direct impact of climate change on regional
labor productivity. Arch Environ Occup Health. 2009;64(4):217-27.
45. Sett M, Sahu S. Effects of occupational heat exposure on female brick workers in West
Bengal, India. Glob Health Action. 2014;7:219-23.
46. Gun RT. Studies of heat stress in selected occupations in South Australia. Adelaide (AU):
Occupational Health and Radiation Control Branch, South Australian Health Commission;
1987. 215 p.
47. Nilsson M, Kjellstrom T. Climate change impacts on working people: how to develop
prevention policies. Glob Health Action. 2010;3. doi:10.3402/gha.v3i0.5774.
48. Maté J, Oosthuizen J. Environmental Health - Emerging Issues and Practice. Rijeka,
Croatia: InTech; 2012. Chapter 13, Global warming and heat stress among western
Australian mine, oil and gas workers. p. 289-306. doi: 10.5772/34794.
49. California Code of Regulations. Heat illness prevention; Subchapter 7, Section 3395.
Available from: http://www.dir.ca.gov/title8/3395.html. [cited 12 November 2013].
50. Washington State Legislature. General occupational health standards: outdoor heat
exposure. Available from: http://apps.leg.wa.gov/wac/default.aspx?cite=296-
62&full=true#296-62-095. [cited 12 December 2013].
51. Chinese State Administration of Work Safety. Administrative Measures on preventing
seat stroke and lowering temperature. Available from:
http://www.chinasafety.gov.cn/newpage/Contents/Channel_6288/2012/0704/172990/
content_172990.htm. [cited 15 August 2013].
52. Parsons K. Occupational health impacts of climate change: current and future ISO
standards for the assessment of heat stress. Ind Health. 2013;51(1):86-100.
53. Corleto RD, Coles G, Firth I. Heat stress standard and documentation developed for use
in the Australia environment. Tullamarine Victoria: The Australian Institute of
Occupaitonal Hygienists Inc (AIOH); 2003. 47 p.

References
262
54. Corleto RD, Firth I, Mate J. A guide to managing heat stress: developed for use in the
Australian environment. 2nd edition. Tullamarine Victoria: The Australian Institute of
Occupational Hygienists Inc (AIOH); 2013. 110 p.
55. Bray P, Sokas R, Ahluwalia J. Heat-related illnesses: opportunities for prevention. J
Occup Environ Med. 2010;52(8):844-5.
56. Rogers B, Stiehl K, Borst J, et al. Heat-related illnesses: The role of the occupational and
environmental health nurse. AAOHN J. 2007;55(7):279-89.
57. Tawatsupa B, Lim LL, Kjellstrom T, et al. The association between overall health,
psychological distress, and occupational heat stress among a large national cohort of
40,913 Thai workers. Glob Health Action. 2010;3. doi:10.3402/gha.v3i0.5034.
58. Smith DL, Petruzzello SJ, Kramer JM, et al. The effects of different thermal environments
on the physiological and psychological responses of firefighters to a training drill.
Ergonomics. 1997;40(4):500-10.
59. Wyon DP, Wyon I, Norin F. Effects of moderate heat stress on driver vigilance in a
moving vehicle. Ergonomics. 1996;39(1):61-75.
60. Hohnsbein J, Piekarski C, Kampmann B, et al. Effects of heat on visual acuity. Ergonomics.
1984;27(12):1239-46.
61. Kjellstrom T, Crowe J. Climate change, workplace heat exposure, and occupational
health and productivity in Central America. Int J Occup Environ Health. 2011;17(3):270-
81.
62. Langkulsen U, Vichit-Vadakan N, Taptagaporn S. Health impact of climate change on
occupational health and productivity in Thailand. Glob Health Action. 2010;3.
doi:10.3402/gha.v3i0.5607.
63. Lin RT, Chan CC. Effects of heat on workers' health and productivity in Taiwan. Glob
Health Action. 2009;2. doi:10.3402/gha.v2i0.2024.
64. Xiang J, Bi P, Pisaniello D, et al. Health impacts of workplace heat exposure: An
epidemiological review. Ind Health. 2013;52(2):91-101.

References
263
65. Inaba R, Mirbod SM. Subjective musculoskeletal symptoms in winter and summer
among indoor working construction electricians. Ind Health. 2010;48(1):29-37.
66. Inaba R, Mirbod SM. Comparison of subjective symptoms and hot prevention measures
in summer between traffic control workers and construction workers in Japan. Ind
Health. 2007;45(1):91-9.
67. Bhattacherjee A, Bertrand JP, Meyer JP, et al. Relationships of physical job tasks and
living conditions with occupational injuries in coal miners. Ind Health. 2007;45(2):352-8.
68. Shearer S. Dehydration and serum electrolyte changes in South African gold miners with
heat disorders. Am J Ind Med. 1990;17(2):225-39.
69. Finch CF, Boufous S. The descriptive epidemiology of sports/leisure-related heat illness
hospitalisations in New South Wales, Australia. J Sports Sci Med. 2008;11(1):48-51.
70. Donoghue AM, Sinclair MJ, Bates GP. Heat exhaustion in a deep underground
metalliferous mine. Occup Environ Med. 2000;57(3):165-74.
71. Kampmann B, Piekarski C. Assessment of the risks of heat disorders encountered during
work in hot conditions in German hard coal mines. Elsevier Ergonomics Book Series.
2005;3:79-84.
72. Bonauto D, Anderson R, Rauser E, et al. Occupational heat illness in Washington State,
1995-2005. Am J Ind Med. 2007;50(12):940-50.
73. US CDC. Heat-related deaths among crop workers, United States, 1992-2006. Morb
Mortal Wkly Rep. 2008;57(24):649-80.
74. Jackson LL, Rosenberg HR. Preventing heat-related illness among agricultural workers. J
Agromedicine. 2010;15(3):200-15.
75. Donoghue AM. Heat illness in the US mining industry. Am J Ind Med. 2004;45(4):351-6.
76. Carter R, Cheuvront SN, Williams JO, et al. Epidemiology of hospitalizations and deaths
from heat illness in soldiers. Med Sci Sports Exerc. 2005;37(8):1338-44.

References
264
77. Bedno SA, Li Y, Han W, et al. Exertional heat illness among overweight US Army recruits
in basic training. Aviat Space Environ Med. 2010;81(2):107-11.
78. Petitti DB, Harlan SL, Chowell-Puente G, et al. Occupation and environmental heat-
associated deaths in Maricopa county, Arizona: a case-control study. PLoS One.
2013;8(5):e62596. doi:10.1371/journal.pone.0062596.
79. Tawatsupa B, Yiengprugsawan V, Kjellstrom T, et al. Association between heat stress
and occupational injury among Thai workers: findings of the Thai Cohort Study. Ind
Health. 2013;51(1):34-46.
80. Pradhan B, Shrestha S, Shrestha R, et al. Assessing climate change and heat stress
responses in the Tarai region of Nepal. Ind Health. 2013;51(1):101-12.
81. Noweir MH, Bafail AO. Study of summer heat exposure at the ground services
operations of a main international airport in Saudi Arabia. Environ Monit Assess.
2008;145(1-3):103-11.
82. Miller V, Bates G, Schneider JD, et al. Self-pacing as a protective mechanism against the
effects of heat stress. Ann Occup Hyg. 2011;55(5):548-55.
83. Maiti R. Workload assessment in building construction related activities in India. Appl
Ergon. 2008;39(6):754-65.
84. Yoopat P, Toicharoen P, Glinsukon T, et al. Ergonomics in practice: Physical workload
and heat stress in Thailand. Int J Occup Saf Ergon. 2002;8(1):83-93.
85. Bates GP, Schneider J. Hydration status and physiological workload of UAE construction
workers: A prospective longitudinal observational study. Occup Med Toxicol.
2008;3(1):21-30.
86. Morioka I, Miyai N, Miyashita K. Hot environment and health problems of outdoor
workers at a construction site. Ind Health. 2006;44(3):474-80.
87. Holmes NA, Miller VS, Schneider J, et al. Plasma sodium levels and dietary sodium intake
in manual workers in the Middle East. Ann Occup Hyg. 2011;55(4):397-402.

References
265
88. Montazer S, Farshad AA, Monazzam MR, et al. Assessment of construction workers'
hydration status using urine specific gravity. Int J Occup Med Environ Health.
2013;26(5):762-9.
89. Matsuzuki H, Ayabe M, Haruyama Y, et al. Effects of heating appliances with different
energy efficiencies on associations among work environments, physiological responses,
and subjective evaluation of workload. Ind Health. 2008;46(4):360-8.
90. Haruyama Y, Muto T, Matsuzuki H, et al. Evaluation of subjective thermal strain in
different kitchen working environments using subjective judgment scales. Ind Health.
2010;48(2):135-44.
91. Matsuzuki H, Ito A, Ayabe M, et al. The effects of work environments on thermal strain
on workers in commercial kitchens. Ind Health. 2011;49(5):605-13.
92. Mirabelli MC, Quandt SA, Crain R, et al. Symptoms of heat illness among Latino farm
workers in North Carolina. Am J Prev Med. 2010;39(5):468-71.
93. Fleischer NL, Tiesman HM, Sumitani J, et al. Public health impact of heat-related illness
among migrant farmworkers. Am J Prev Med. 2013;44(3):199-206.
94. Crowe J, Moya-Bonilla JM, Roman-Solano B, et al. Heat exposure in sugarcane workers
in Costa Rica during the non-harvest season. Glob Health Action. 2010;3.
doi:10.3402/gha.v3i0.5619.
95. Crowe J, Wesseling C, Solano BR, et al. Heat exposure in sugarcane harvesters in Costa
Rica. Am J Ind Med. 2013;56(10):1157-64.
96. Nag PK, Nag A, Ashtekar SP. Thermal limits of men in moderate to heavy work in tropical
farming. Ind Health. 2007;45(1):107-17.
97. Crowe J, van Wendel de Joode B, Wesseling C. A pilot field evaluation on heat stress in
sugarcane workers in Costa Rica: What to do next? Glob Health Action. 2009;2.
doi:10.3402/gha.v2i0.2062.
98. Selkirk GA, McLellan TM. Physical work limits for Toronto firefighters in warm
environments. J Occup Environ Hyg. 2004;1(4):199-212.

References
266
99. McLellan TM, Selkirk GA. The management of heat stress for the firefighter: a review of
work conducted on behalf of the Toronto Fire Service. Ind Health. 2006;44(3):414-26.
100. Sinclair WH, Brownsberger JC. Wearing long pants while working outdoors in the tropics
does not yield higher body temperatures. Aust N Z J Public Health. 2013;37(1):70-5.
101. Maeda T, Kaneko SY, Ohta M, et al. Risk factors for heatstroke among Japanese forestry
workers. J Occup Health. 2006;48(4):223-9.
102. Gomes J, Lloyd O, Norman N. The health of the workers in a rapidly developing country:
Effects of occupational exposure to noise and heat. Occup Med (Lond). 2002;52(3):121-8.
103. Logan PW, Bernard TE. Heat stress and strain in an aluminum smelter. Am Ind Hyg Assoc
J. 1999;60(5):659-65.
104. Dang BN, Dowell CH. Factors associated with heat strain among workers at an aluminum
smelter in Texas. J Occup Environ Med. 2014;56(3):313-8.
105. Bhanarkar AD, Srivastava A, Joseph AE, et al. Air pollution and heat exposure study in
the workplace in a glass manufacturing unit in India. Environ Monit Assess. 2005;109(1-
3):73-80.
106. Srivastava A, Kumar R, Joseph E, et al. Heat exposure study in the workplace in a glass
manufacturing unit in India. Ann Occup Hyg. 2000;44(6):449-53.
107. Ayyappan R, Sankar S, Rajkumar P, et al. Work-related heat stress concerns in
automotive industries: A case study from Chennai, India. Glob Health Action. 2009;2:1-7.
108. Balakrishnan K, Ramalingam A, Dasu V, et al. Case studies on heat stress related
perceptions in different industrial sectors in southern India. Glob Health Action. 2010;3.
doi:10.3402/gha.v3i0.5635.
109. Varley F. A study of heat stress exposures and interventions for mine rescue workers.
Transactions. 2004;316:133-42.

References
267
110. Kampmann B, Bresser G. Heat stress and flame protective clothing in mine rescue
brigadesmen: inter- and intraindividual variation of strain. Ann Occup Hyg.
1999;43(5):357-65.
111. Kalkowsky B, Kampmannk B. Physiological strain of miners at hot working places in
German coal mines. Ind Health. 2006;44(3):465-73.
112. Miller VS, Bates GP. Hydration of outdoor workers in north-west Australia. Journal of
Occupational Health and Safety Australia and New Zealand. 2007;23(1):79-88.
113. Brake DJ, Bates GP. Fluid losses and hydration status of industrial workers under thermal
stress working extended shifts. Occup Environ Med. 2003;60(2):90-6.
114. Brake DJ, Bates GP. Deep body core temperatures in industrial workers under thermal
stress. J Occup Environ Med. 2002;44(2):125-35.
115. Brake DJ, Bates GP. Fatigue in industrial workers under thermal stress on extended shift
lengths. Occup Med (Lond). 2001;51(7):456-63.
116. Mathee A, Oba J, Rose A. Climate change impacts on working people (the HOTHAPS
initiative): findings of the South African pilot study. Glob Health Action. 2010;3.
doi:10.3402/gha.v3i0.5612.
117. Bates GP, Miller VS, Joubert DM. Hydration status of expatriate manual workers during
summer in the middle East. Ann Occup Hyg. 2010;54(2):137-43.
118. Bates GP, Miller VS. Sweat rate and sodium loss during work in the heat. J Occup Med
Toxicol. 2008;3(4). doi:10.1186/1745-6673-3-4.
119. Tsujimura H, Taoda K, Kitahara T. A field study on the physiological workload of garbage
collectors in the Japanese summer. Ind Health. 2012;50(6):556-66.
120. Cotter JD, Roberts WS, Amos D, et al. Soldier performance and heat strain during
evaluation of a combat fitness assessment in Northern Australia. Australian Defence &
Technology Organisation, DESTO-TR-1023, 1-32, Melbourne. 2000.

References
268
121. Kristal-Boneh E, Harari G, Green MS. Heart rate response to industrial work at different
outdoor temperatures with or without temperature control system at the plant.
Ergonomics. 1997;40(7):729-36.
122. Chen ML, Chen CJ, Yeh WY, et al. Heat stress evaluation and worker fatigue in a steel
plant. J Occup Environ Hyg. 2003;64(3):352-9.
123. Fujii RK, Horie S, Tsutsui T, et al. Heat exposure control using non-refrigerated water in
Brazilian steel factory workers. Ind Health. 2007;45(1):100-6.
124. Miller VS, Bates GP. The thermal work limit is a simple reliable heat index for the
protection of workers in thermally stressful environments. Ann Occup Hyg.
2007;51(6):553-61.
125. Hansen E, Donohoe M. Health issues of migrant and seasonal farmworkers. J Health
Care Poor Underserved. 2003;14(2):153-64.
126. Mirabelli MC, Richardson DB. Heat-related fatalities in North Carolina. Am J Public
Health. 2005;95(4):635-7.
127. Sung TI, Wu PC, Lung SC, et al. Relationship between heat index and mortality of 6 major
cities in Taiwan. Sci Total Environ. 2013;442:275-81.
128. Riddell NJ. Heat illness and the armed forces. The Lancet. 1989;2(8670):1042.
129. Bricknell MCM. Heat illness in the army in Cyprus. Occup Med (Lond). 1996;46(4):304-12.
130. Prezant DJ, Freeman K, Kelly KJ, et al. Impact of a design modification in modern
firefighting uniforms on burn prevention outcomes in New York City firefighters. J Occup
Environ Med. 2000;42(8):827-34.
131. Furtado AL, Craig BN, Chard JT, et al. Cooling suits, physiological response, and task
performance in hot environments for the power industry. Int J Occup Saf Ergon.
2007;13(3):227-39.
132. Brown EN. Evaluation of heat stress and strain in electric utility workers [dissertation].
Los Angeles (CA): University of California; 2013. 102 p.

References
269
133. Fordyce TA, Kelsh M, Lu ET, et al. Thermal burn and electrical injuries among electric
utility workers, 1995-2004. Burns. 2007;33(2):209-20.
134. Gabel S, Boulaire F, Marlow D, et al. Understanding how the Australian climate can
affect pipe failure. In: Proceedings of the OzWater 09 Australia’s International Water
Conference & Exhibition, Melbourne, 2009.
135. Simonoff JS, Zimmerman R, Restrepo CE, etal. Electricity case: statistical analysis of
electric power outages, Create Research Archive, Paper 162, 2005
(http://research.create.usc.edu/published_papers/162/).
136. Crandall CG, Gonzalez-Alonso J. Cardiovascular function in the heat-stressed human.
Acta Physiol (Oxf). 2010;199(4):407-23.
137. Wild P, Moulin JJ, Ley FX, et al. Mortality from cardiovascular diseases among potash
miners exposed to heat. Epidemiology. 1995;6(3):243-7.
138. Pandolf KB. Aging and heat tolerance at rest or during work. Exp Aging Res.
1991;17(3):189-204.
139. Xiang J, Bi P, Pisaniello D, et al. Association between high temperature and work-related
injuries in Adelaide, South Australia, 2001–2010. Occup Environ Med. 2013;71(4):246-52.
140. US CDC. Occupational injuries and deaths among younger workers, United States, 1998-
2007. Morb Mortal Wkly Rep. 2010;59(15):449-55.
141. US Centers for Disease Control and Prevention. Preventing deaths, injuries and illnesses
of young workers. Morb Mortal Wkly Rep. 2003:1-22.
142. Kovats RS, Johnson H, Griffith C. Mortality in southern England during the 2003 heat
wave by place of death. Health Stat Q. 2006;(29):6-8.
143. Fouillet A, Rey G, Laurent F, et al. Excess mortality related to the August 2003 heat wave
in France. Int Arch Occup Environ Health. 2006;80(1):16-24.
144. Grizea L, Hussa A, Thommena O, et al. Heat wave 2003 and mortality in Switzerland.
Schweiz Med Wochenschr. 2005;135:200-5.

References
270
145. US CDC. Heat-related deaths-four states, July-August 2001, and United States, 1979-
1999. Morb Mortal Wkly Rep. 2002;51(26):567-70.
146. Kenney WL. A review of comparative responses of men and women to heat stress.
Environ Res. 1985;37(1):1-11.
147. Nunneley SA. Physiological responses of women to thermal stress: a review. Med Sci
Sports Exerc. 1978;10(4):250-5.
148. Dellinger AM, Kachur PS, Sternberg E, et al. Risk of heat-related injury to disaster relief
workers in a slow-onset flood disaster. J Occup Environ Med. 1996;38(7):689-92.
149. Canoui-Poitrine F, Cadot E, Spira A. Excess deaths during the August 2003 heat wave in
Paris, France. Rev Epidemiol Sante Publique. 2006;54(2):127-35.
150. Borrell C, Mari-Dell'Olmo M, Rodriguez-Sanz M, et al. Socioeconomic position and
excess mortality during the heat wave of 2003 in Barcelona. Eur J Epidemiol.
2006;21(9):633-40.
151. Kaiser R, Le Tertre A, Schwartz J, et al. The effect of the 1995 heat wave in Chicago on
all-cause and cause-specific mortality. Am J Public Health. 2007;97(1):158-62.
152. Michenot F, Sommet A, Bagheri H, et al. Adverse drug reactions in patients older than
70 years during the heat wave occurred in France in summer 2003: a study from the
French PharmacoVigilance Database. Pharmacoepidemiol Drug Saf. 2006;15(10):735-40.
153. Cuddy ML. The effects of drugs on thermoregulation. AACN Clin Issues. 2004;15(2):238-
53.
154. Saini J, Boisvert P, Spiegel K, et al. Influence of alcohol on the hydromineral hormone
responses to exercise in a warm environment. Eur J Appl Physiol Occup Physiol.
1995;72(1):32-6.
155. Berry JG, Pidd K, Roche AM, et al. Prevalence and patterns of alcohol use in the
Australian workforce: findings from the 2001 National Drug Strategy Household Survey.
Addiction. 2007;102(9):1399-410.

References
271
156. US Department of Labor. OSHA Technical Manual (OTM) on heat stress Section III:
Chapter 4. Available from: https://www.osha.gov/dts/osta/otm/otm_iii/otm_iii_4.html.
[cited 5 July 2013].
157. Peter J, Wyndham CH. Activity of the human eccrine sweat gland during exercise in a hot
humid environment before and after acclimatization. J Physiol. 1966;187(3):583-94.
158. Bates GP, Gazey C, Cena K. Factors affecting heat illness when working in conditions of
thermal stress. Journal of Human Ergology. 1996;25(1):13.
159. Maher HK. Preventing heat-related illness. AAOHN J. 2007;55(9):388.
160. Mares P. Seasonal migrant labour: a boon for Australian country towns? 2nd Future of
Australia's Country Towns Conference; 11-13 July, 2005; Bendigo, Victoria. La Trobe
University; 2005.
161. Vandentorren S, Bretin P, Zeghnoun A, et al. August 2003 heat wave in France: risk
factors for death of elderly people living at home. Eur J Public Health. 2006;16(6):583-91.
162. Kenefick RW, Sawka MN. Hydration at the work site. J Am Coll Nutr.
2007;26(Supplement 5):597-603.
163. Brake DJ. Fluid consumption, sweat rates and hydration status of thermally stressed
underground miners and the implications for heat illness and shortened shifts. 2001 Qld
Mining Industry Occupational Health and Safety Conference, Townsville, 2001.
Queensland Mining Council, Brisbane, 2001.
164. Miller VS, Bates GP. Hydration, hydration, hydration. Ann Occup Hyg. 2009;54(2):134-6.
165. Delgado Cortez O. Heat stress assessment among workers in a Nicaraguan sugarcane
farm. Glob Health Action. 2009;2. doi:10.3402/gha.v2i0.2069.
166. US National Institute for Occupational Safety and Health (NIOSH). Workplace safety and
health topics: Heat stress. Available from: http://www.cdc.gov/niosh/topics/heatstress/.
[cited 13 Feburary 2014]

References
272
167. Lucas RA, Epstein Y, Kjellstrom T. Excessive occupational heat exposure: a significant
ergonomic challenge and health risk for current and future workers. Extreme physiology
& medicine. 2014;3:14.
168. Bernard TE. Occupational heat stress In USA: Whither we go? Ind Health. 2014;52(1):1-4.
169. Stoecklin-Marois M, Hennessy-Burt T, Mitchell D, et al. Heat-related Illness Knowledge
and Practices among California Hired Farm Workers in The MICASA Study. Ind Health.
2013;51(1):47-55.
170. Shendell DG, Alexander MS, Lorentzson L, et al. Knowledge and awareness of heat-
related morbidity among adult recreational endurance athletes. Int J Biometeorol.
2010;54(4):441-8.
171. The US Department of Labor. Campaign to prevent heat illness in outdoor workers.
Available from: https://www.osha.gov/SLTC/heatillness/index.html. [cited 23 August
2013].
172. Rogers M, Curtis A, Mazur N. The influence of cognitive processes on rural landholder
responses to climate change. Journal of environmental management. 2012;111:258-66.
173. Lam M, Krenz J, Palmandez P, et al. Identification of barriers to the prevention and
treatment of heat-related illness in Latino farmworkers using activity-oriented,
participatory rural appraisal focus group methods. BMC Public Health. 2013;13:1004.
doi:10.1186/1471-2458-13-1004.
174. Flocks J, Vi Thien Mac V, Runkle J, et al. Female farmworkers' perceptions of heat-
related illness and pregnancy health. J Agromedicine. 2013;18(4):350-8.
175. US CDC. Heat-related mortality-Arizona, 1993-2002, and United States, 1979-2002.
Morb Mortal Wkly Rep. 2005:628-30.
176. Epstein Y, Moran DS. Thermal comfort and the heat stress indices. Ind Health.
2006;44(3):388-98.
177. Budd GM. Wet-bulb globe temperature (WBGT)-its history and its limitations. J Sci Med
Sport. 2008;11(1):20-32.

References
273
178. Lemke B, Kjellstrom T. Calculating Workplace WBGT from Meteorological Data: A Tool
for Climate Change Assessment. Ind Health. 2012;50(4):267-78.
179. National Institute for Occupational Safety and Health (NIOSH). Criteria for a
Recommended Standard: Occupational Exposure to Hot Environments (Revised Criteria
1986). Available from: http://www.cdc.gov/niosh/86-113.html.
180. The American Conference of Governmental Industrial Hygienists (ACGIH). ACGIH Heat
Stress and Strain TLV. Available from:
http://www.acgih.org/SiteSearch/Results.cfm?CFID=1766749&CFTOKEN=36256303.
[cited 1 May 2010].
181. Australian Construction Forestry, Mining and Energy Union (CFMEU). Inclement weather
- Heat Policy. Available from:
http://www.cfmeu.asn.au/branch/sa/campaign/inclement-weather-heat-policy. [cited
20 April 2013].
182. Safe Work Australia. Model Work Health and Safety Regulations 2014. Available from:
http://www.safeworkaustralia.gov.au/sites/SWA/about/Publications/Documents/616/
Model-WHS-Regulations-January-2014.pdf. [cited 12 May 2014].
183. Safe Work Australia. Model Work Health and Safety Act 2011. Available from:
http://www.safeworkaustralia.gov.au/sites/swa/about/publications/pages/model-
work-health-safety-act-23-june-2011. [cited 12 May 2014].
184. Safe Work Australia. Model Code of Practice - Construction Work 2013. Available from:
http://www.safeworkaustralia.gov.au/sites/SWA/about/Publications/Documents/696/Construct
ion-Work-V2.pdf. [cited 12 May 2014].
185. Safe Work Australia. Model Code of Practice - Managing the Work Environment and
Facilities. Available from:
http://www.safeworkaustralia.gov.au/sites/swa/about/publications/pages/environmen
t-facilities-cop. [cited 12 May 2014].

References
274
186. SafeWork South Australia. Work Health and Safety Act 2012. Available from:
http://www.legislation.sa.gov.au/LZ/C/A/Work%20Health%20and%20Safety%20Act%20
2012.aspx. [cited 13 May 2014].
187. SafeWork South Australia. Mines and Works Inspection Regulations 2013. Available
from:
http://www.legislation.sa.gov.au/LZ/C/R/Mines%20and%20Works%20Inspection%20Re
gulations%202013.aspx. [cited 11 May 2014].
188. SafeWork South Australia. Work Health and Safety Regulations 2012. Available from:
http://www.legislation.sa.gov.au/LZ/C/R/Work%20Health%20and%20Safety%20Regulat
ions%202012.aspx. [cited 9 May 2014].
189. Australian Capital Territory Government. Work Health and Safety Act 2011. Available
from: http://www.legislation.act.gov.au/a/2011-35/. [cited 10 May 2014].
190. Australian Capital Territory Government. Work Health and Safety Regulation 2011.
Available from: http://www.legislation.act.gov.au/sl/2011-36/default.asp. [cited 10 May
2014].
191. Australian Captial Territory Government. Work Health and Safety (Construction Work
Code of Practice). Available from: http://www.legislation.act.gov.au/ni/2014-97/. [cited
13 May 2014].
192. Australian Captial Territory Government. Work Health and Safety (Managing the Work
Environment and Facilities) Code of Practice 2011. Available from:
http://www.legislation.act.gov.au/ni/2011-751/default.asp.
193. New South Wales Government. Work Health and Safety Act 2011. Available from:
http://www.legislation.nsw.gov.au/maintop/view/inforce/act+10+2011+cd+0+N. [cited
11 May 2014].
194. New South Wales Government. Work Health and Safety Regulation 2011. Available from:
http://www.legislation.nsw.gov.au/maintop/view/inforce/subordleg+674+2011+cd+0+
N. [cited 10 May 2014].

References
275
195. New South Wales Government. Managing the work environment and facilities: Code of
practice 2011. Available from:
http://www.workcover.nsw.gov.au/formspublications/publications/Documents/managi
ng-work-environment-facilities-code-of-practice-3567.pdf. [cited 11 May 2014].
196. Northern Territory Work Safe. Model Work Health and Safety (WHS) Act 2011. Available
from:http://www.worksafe.nt.gov.au/Legislation/New%20Work%20Health%20and%20S
afety%20Laws/Pages/default.aspx. [cited 12 May 2014].
197. Northern Territory Work Safe. Model Work Health and Safety (WHS) Regulations 2011.
Available from:
http://www.worksafe.nt.gov.au/Legislation/New%20Work%20Health%20and%20Safety
%20Laws/Pages/default.aspx. [cited 12 May 2014].
198. Northern Territory Work Safe. Transitional Arrangements for Construction Work.
Available from:
http://www.worksafe.nt.gov.au/Bulletins/Bulletins/transitional_arrangements_construc
tion_work.docx. [cited 12 May 2014].
199. Queensland Government of Australia. Work Health and Safety Act 2011. Available from:
https://www.legislation.qld.gov.au/LEGISLTN/CURRENT/W/WorkHSA11.pdf. [cited 12
May 2014].
200. Queensland Government of Australia. Managing the Work Environment and Facilities
Code of Practice 2011. Available from:
http://www.deir.qld.gov.au/workplace/resources/pdfs/work-environment-facilities-
cop-2011.pdf. [cited 13 May 2014].
201. Queensland Government of Australia. Foundry Code of Practice 2004. Available from:
http://www.deir.qld.gov.au/workplace/resources/pdfs/foundry-cop-2004.pdf. [cited 14
May 2014].

References
276
202. Queensland Government of Australia. Hazardous Manual Tasks Code of Practice 2011.
Available from: http://www.deir.qld.gov.au/workplace/resources/pdfs/hazardous-
manual-tasks-cop-2011.pdf. [cited 15 May 2014].
203. Queensland Government of Australia. Forest Harvesting Code of Practice 2007.
Available from: http://www.deir.qld.gov.au/workplace/resources/pdfs/forest-
harvesting-cop-2007.pdf. [cited 14 May 2014].
204. Queensland Government of Australia. Children and Young Workers Code of Practice
2006. Available from: http://www.deir.qld.gov.au/workplace/resources/pdfs/children-
young-workers-cop-2006.pdf. [cited 15 May 2014].
205. Queensland Government of Australia. Managing the risk of falls at workplaces, 2011.
Available from: http://www.deir.qld.gov.au/workplace/resources/pdfs/managing-risk-
falls-workplaces-cop-2011.pdf. [cited 16 May 2014].
206. Queensland Government of Australia. Traffic Management for Construction or
Maintenance Work Code of Practice 2008. Available from:
http://www.deir.qld.gov.au/workplace/resources/pdfs/traffic-management-
construction-cop-2008.pdf. [cited 15 May 2014].
207. Victorian WorkCover Authority. Occupational Health and Safety Act 2004. Available
from:
http://www.legislation.vic.gov.au/domino/Web_Notes/LDMS/LTObject_Store/ltobjst8.n
sf/DDE300B846EED9C7CA257616000A3571/88CEE886A417DF9DCA257D0400176C02/$
FILE/04-107a022bookmarked.pdf. [cited 15 May 2014].
208. Victorian WorkCover Authority. Occupational Health and Safety Regulations 2007.
Available from:
http://www.legislation.vic.gov.au/domino/Web_Notes/LDMS/LTObject_Store/ltobjst8.n
sf/DDE300B846EED9C7CA257616000A3571/C3BAF79A934469B1CA257D0E001C4FEA/$
FILE/07-54sr011.pdfbookmarked.pdf. [cited 12 May 2014].

References
277
209. Victorian WorkCover Authority. Mines Act 1958. Available from:
http://www.legislation.vic.gov.au/Domino/Web_Notes/LDMS/LTObject_Store/LTObjSt5
.nsf/DDE300B846EED9C7CA257616000A3571/AD211A8400A95C83CA2577BC001499CF
/$FILE/58-6320a066.pdf. [cited 15 May 2014].
210. Victorian WorkCover Authority. Working Safely With Trees, 2012. Available from:
http://www.vwa.vic.gov.au/__data/assets/pdf_file/0010/3889/Guidance_-
_Working_with_trees.pdf. [cited 13 May 2014].
211. Victorian WorkCover Authority. Health And Safety In Shearing 2001. Available from:
http://www.vwa.vic.gov.au/__data/assets/pdf_file/0017/12374/Shearing.pdf. [cited 15
May 2014].
212. Victorian WorkCover Authority. Guidance Note: Working in heat (advice about how to
prevent heat illness from working outdoors in hot weather or where heat is generated
as part of work), 2012. Available from:
http://www.vwa.vic.gov.au/__data/assets/pdf_file/0006/59415/guidance-working-in-
heat2012_may2013.pdf. [cited 15 May 2014].
213. Victorian WorkCover Authority. Foundries-Compliance Code 2008. Available from:
http://www.vwa.vic.gov.au/__data/assets/pdf_file/0016/9232/cc_foundries.pdf. [cited
15 May 2014].
214. Government of Western Australia. Occupational Health, Safety and Welfare Act 1984.
Available from:
http://www.slp.wa.gov.au/pco/prod/FileStore.nsf/Documents/MRDocument:8384P/$FI
LE/OccupHealthSftyandWlfrAct1984_00-00-00.pdf?OpenElement. [cited 15 May 2014].
215. Government of Western Australia. Occupational Safety and Health Regulations 1996.
Available from:
http://www.slp.wa.gov.au/pco/prod/filestore.nsf/Documents/MRDocument:26010P/$F
ILE/Occupational%20Safety%20and%20Health%20Regulations%201996%20-%20[09-e0-
00].pdf?OpenElement. [cited 13 May 2014].

References
278
216. Government of Tasmania. Construction Industry (Long Service) Act 1997. Available from:
http://www.thelaw.tas.gov.au/tocview/index.w3p;cond=;doc_id=83%2B%2B1997%2BA
T%40EN%2B20140805000000;histon=;prompt=;rec=;term=. [cited 15 May 2014].
217. Government of Tasmania. Work Health and Safety Act 2012. Available from:
http://www.thelaw.tas.gov.au/tocview/index.w3p;cond=;doc_id=1%2B%2B2012%2BAT
%40EN%2B20140805000000;histon=;prompt=;rec=;term=. [cited 15 May 2014].
218. Government of Tasmania. Mines Work Health and Safety (Supplementary Requirements)
Act 2012. Available from:
http://www.thelaw.tas.gov.au/tocview/index.w3p;cond=ALL;doc_id=46%2B%2B2012%2
BAT%40EN%2B20140805210000;histon=;prompt=;rec=;term=Mines%20Work%20Healt
h%20and%20Safety%20. [cited 15 May 2014].
219. Government of Tasmania. Construction Work: Code of Practice 2012. Available from:
http://worksafe.tas.gov.au/__data/assets/pdf_file/0009/203598/construction_work_co
de.pdf. [cited 12 May 2014].
220. Government of Tasmania. Managing the Work Environment and Facilities 2012.
Available from:
http://worksafe.tas.gov.au/data/assets/pdf_file/0008/193589/managing_work_environment_c
ode.pdf. [cited 15 May 2014].
221. Government of Tasmania. Work Health and Safety Regulations 2012. Available from:
http://www.austlii.edu.au/au/legis/tas/num_reg/whasr20122012n122389/. [cited 12
May 2014].
222. Gasparrini A, Armstrong B. Time series analysis on the health effects of temperature:
advancements and limitations. Environ Res. 2010;110(6):633-8.
223. Pascal M, Wagner V, Le Tertre A, et al. Definition of temperature thresholds: the
example of the French heat wave warning system. Int J Biometeorol. 2013;57(1):21-9.
224. Lin S, Luo M, Walker RJ, et al. Extreme high temperatures and hospital admissions for
respiratory and cardiovascular diseases. Epidemiology. 2009;20(5):738-46.

References
279
225. Nicholls N, Skinner C, Loughnan M, et al. A simple heat alert system for Melbourne,
Australia. Int J Biometeorol. 2008;52(5):375-84.
226. Basagana X. High ambient temperatures and work-related injuries. Occup Environ Med.
2014;71(4):231.
227. Bhaskaran K, Gasparrini A, Hajat S, et al. Time series regression studies in environmental
epidemiology. Int J Epidemiol. 2013;42(4):1187-95.
228. Desquilbet L, Mariotti F. Dose-response analyses using restricted cubic spline functions
in public health research. Stat Med. 2010;29(9):1037-57.
229. Gardner W, Mulvey EP, Shaw EC. Regression analyses of counts and rates: Poisson,
overdispersed Poisson, and negative binomial models. Psychol Bull. 1995;118(3):392-
404.
230. SafeWork Australia. Occupational Health and Safety Statistics Report: Number of Cases.
Available from: http://www.safeworkaustralia.gov.au/Pages/NOSIDecommission.aspx.
[cited 28 April 2011].
231. Mairiaux P, Malchaire J. Workers self-pacing in hot conditions: A case study. Appl Ergon.
1985;16(2):85-90.
232. World Health Organization. Health factors in workers under conditions of heat stress.
Available from: http://whqlibdoc.who.int/trs/WHO_TRS_412.pdf. [cited 23 June 2012].
233. Kjellstrom T. Climate change, direct heat exposure, health and well-being in low and
middle-income countries. Glob Health Action. 2009;2. doi:10.3402/gha.v2i0.1958.
234. Kjellstrom T, Holmer I, Lemke B. Workplace heat stress, health and productivity: An
increasing challenge for low and middle-income countries during climate change. Glob
Health Action. 2009;2. doi:10.3402/gha.v2i0.2047.
235. Australian Bureau of Statistics. 2011 Census QuickStats: South Australia. Available from:
http://www.censusdata.abs.gov.au/census_services/getproduct/census/2011/quickstat
/4?opendocument&navpos=220. [cited 22 October 2013].

References
280
236. Australian Bureau of Statistics. 2011 Census QuickStats: Greater Adelaide. Available
from:
http://www.censusdata.abs.gov.au/census_services/getproduct/census/2011/quickstat
/4GADE. [cited 22 October 2013].
237. Government of South Australia. Workers Rehabilitation and Compensation Act 1986.
Available from:
http://www.legislation.sa.gov.au/lz/c/a/workers%20rehabilitation%20and%20compens
ation%20act%201986.aspx. [cited 12 May 2013].
238. Australian National Occupational Health and Safety Commission. Type of Occurrence
Classification System 2nd Edition (TOOCS2), 1999. Availabel from:
http://www.safeworkaustralia.gov.au/sites/SWA/about/Publications/Documents/496/Type_of_
Occurrence_Classification_System_2nd_Edition.pdf. [cited 22 March 2011].
239. Zeger SL, Irizarry R, Peng RD. On time series analysis of public health and biomedical
data. Annu Rev Public Health. 2006;27:57-79.
240. Ballinger GA. Using generalized estimating equations for longitudinal data analysis.
Organizational Research Methods. 2004;7(2):127-50.
241. Liang KY, Zeger SL. Longitudinal data analysis using generalized linear models.
Biometrika. 1986;73(1):13-22.
242. Zeger SL, Liang K-Y. Longitudinal data analysis for discrete and continuous outcomes.
Biometrics. 1986;42(1):121-30.
243. Leone M, D'Ippoliti D, De Sario M, et al. A time series study on the effects of heat on
mortality and evaluation of heterogeneity into European and Eastern-Southern
Mediterranean cities: results of EU CIRCE project. Environ Health. 2013;12:55.
244. Michelozzi P, Accetta G, De Sario M, et al. High temperature and hospitalizations for
cardiovascular and respiratory causes in 12 European cities. Am J Respir Crit Care Med.
2009;179(5):383-9.

References
281
245. D'Ippoliti D, Michelozzi P, Marino C, et al. The impact of heat waves on mortality in 9
European cities: results from the EuroHEAT project. Environ Health. 2010;9:37-45.
246. Analitis A, Katsouyanni K, Biggeri A, et al. Effects of cold weather on mortality: results
from 15 European cities within the PHEWE project. Am J Epidemiol. 2008;168(12):1397-
408.
247. Baccini M, Biggeri A, Accetta G, et al. Heat effects on mortality in 15 European cities.
Epidemiology. 2008;19(5):711-9.
248. Hajat S, Armstrong B, Baccini M, et al. Impact of high temperatures on mortality: Is
there an added heat wave effect? Epidemiology. 2006;17(6):632-8.
249. Maclure M, Mittleman MA. Should we use a case-crossover design? Annu Rev Public
Health. 2000;21(1):193-221.
250. Greenland S. Confounding and exposure trends in case-crossover and case-time-control
designs. Epidemiology. 1996;7(3):231-9.
251. Kan H, Chen B. A case-crossover analysis of air pollution and daily mortality in Shanghai.
J Occup Health. 2003;45(2):119-24.
252. Hansen A, Bi P, Nitschke M, et al. Particulate air pollution and cardiorespiratory hospital
admissions in a temperate Australian city: A case-crossover analysis. Sci Total Environ.
2012;416:48-52.
253. Australian Bureau of Statistics. Australian Standard Classification of Occupations (ASCO),
2nd edition. ABS cat. no. 1220.0. p. 703. Available from:
http://www.abs.gov.au/AUSSTATS/[email protected]/DetailsPage/1220.01997?OpenDocument. [cited
15 May 2012].
254. WorkCover South Australia. Industry levy rates. Available from:
http://www.workcover.com/site/employer/employer_responsibilities/registering_with_
workcover.aspx?str=Industry%20guide%20levy%20rates. [cited 10 March 2012].

References
282
255. Department for Environment and Heritage (South Australia). Map of Adelaide
metropolitan area showing postcode boundaries and numbers, suburb names, roads
and railway lines. 2005.
256. Australian Bureau of Statistics. Labour force, Australia, detailed, quarterly. Cat. no.
6291.0.55.003. Available from:
http://www.abs.gov.au/AUSSTATS/[email protected]/DetailsPage/6202.0Mar%202013?OpenDo
cument. [cited 18 November 2011].
257. SafeWork South Australia (SWSA). SWSA workers' compensation claims data for
research. Available from: http://www.safework.sa.gov.au/show_page.jsp?id=111283. [cited
18 November 2010].
258. Australian Bureau of Statistics. Small business in Australia. Cat. no. 1321.0. Available
from:
http://www.abs.gov.au/AUSSTATS/[email protected]/DetailsPage/1321.02001?OpenDocument.
[cited 25 June 2013].
259. WorkCover South Australia. Statistical review of workers compensation claims 2010-
2011. Available from: http://www.workcover.com/workcover/resources/publications.
[cited 10 November 2013]. 2011, p. 67.
260. Safe Work Australia. Work-Related Injuries in Australia, 2005-2006: Factors affecting
applications for workers' compensation. 2009, p. 14. Available from:
http://www.safeworkaustralia.gov.au/AboutSafeWorkAustralia/WhatWeDo/Publication
s/Pages/SR200908WorkRelatedInjuriesinAustralia2005To2006.aspx. [cited 19 June
2011].
261. Breslin FC, Day D, Tompa E, et al. Non-agricultural work injuries among youth: A
systematic review. Am J Prev Med. 2007;32(2):151-62.
262. Australian Bureau of Statistics. Labour force status by Age (detailed), State and Territory,
Marital status and Sex, February 1978 onwards. Available from:

References
283
http://www.abs.gov.au/AUSSTATS/[email protected]/DetailsPage/6291.0.55.001Feb%202014?O
penDocument. [cited 22 June 2013].
263. Blewett V. OHSW Research Strategy for South Australia. University of South Australia,
2009, p. 49. Available from: http://www.safework.sa.gov.au/uploaded_files/CRG7-
OHSWResearchStrategyForSA.pdf. [cited 20 May 2014].
264. Safe Work Australia. Compendium of workers' compensation statistics Australia 2008-09.
2011, p. 102. Available from:
http://www.safeworkaustralia.gov.au/sites/SWA/about/Publications/Documents/570/C
ompendium_Workers_Compensation_Statistics_2008-09.pdf. [cited 11 September
2013].
265. Australian Safety and Compensation Council. Type of Occurrence Classification System,
3rd Edition, 2008, p. 284. Available from:
http://www.safeworkaustralia.gov.au/sites/SWA/about/Publications/Documents/207/TypeOfO
ccurrenceClassificationSystem(TOOCS)3rdEditionRevision1.pdf. [cited 22 March 2011].
266. US CDC. Heat illness among high school athletes, United States, 2005-2009. Morb
Mortal Wkly Rep. 2010;59(32):1009-13.
267. Hajat S, Kosatky T. Heat-related mortality: A review and exploration of heterogeneity. J
Epidemiol Community Health. 2010;64(9):753-60.
268. Janes H, Sheppard L, Lumley T. Case-crossover analyses of air pollution exposure data:
referent selection strategies and their implications for bias. Epidemiology.
2005;16(6):717.
269. Jones TS, Liang AP, Kilbourne EM, et al. Morbidity and mortality associated with the July
1980 heat wave in St Louis and Kansas City, Mo. JAMA. 1982;247(24):3327-31.
270. Bouchama A, Knochel JP. Heat stroke. N Engl J Med. 2002;346(25):1978-88.
271. Hakre S, Gardner JW, Kark JA, et al. Predictors of hospitalization in male Marine Corps
recruits with exertional heat illness. Mil Med. 2004;169(3):169-75.

References
284
272. Barrow MW, Clark KA. Heat-related illnesses. American Family Physician.
1998;58(3):749-56, 59.
273. Pandolf KB. Aging and human heat tolerance. Exp Aging Res. 1997;23(1):69-105.
274. Blatteis CM. Age-Dependent Changes in Temperature Regulation: A mini review.
Gerontology. 2011;58(4):289-95.
275. Barnett AG, Tong S, Clements A. What measure of temperature is the best predictor of
mortality? Environ Res. 2010;110(6):604-11.
276. Kjellstrom T, Lemke B, Otto M. Mapping occupational heat exposure and effects in
South-East Asia: ongoing time trends 1980-2011 and future estimates to 2050. Ind
Health. 2013;51(1):56-67.
277. Tobias A, Armstrong B, Zuza I, et al. Mortality on extreme heat days using official
thresholds in Spain: a multi-city time series analysis. BMC Public Health. 2012;12(1):133.
doi:10.1186/1471-2458-12-133.
278. Anderson GB, Bell ML. Heat waves in the United States: mortality risk during heat waves
and effect modification by heat wave characteristics in 43 U.S. communities. Environ
Health Perspect. 2011;119(2):210-8.
279. Malchaire J, Gebhardt HJ, Piette A. Strategy for evaluation and prevention of risk due to
work in thermal environments. Ann Occup Hyg. 1999;43(5):367-76.
280. Hansen A, Bi P, Nitschke M, et al. The effect of heatwaves on ambulance callouts in
Adelaide, South Australia. Epidemiology. 2011;22(1):S14-S5.
281. Tong S, Wang XY, Barnett AG. Assessment of heat-related health impacts in Brisbane,
Australia: comparison of different heatwave definitions. PloS one. 2010;5(8):e12155.
doi:10.1371/journal.pone.0012155.
282. Australian Bureau of Meteorology. The first heatwave for Adelaide in 2010. Available from:
http://www.bom.gov.au/announcements/media_releases/sa/20100115_First_Heatwave
_SA_Jan.shtml. [cited 20 January 2014].

References
285
283. Safe Work Australia. Agriculture, forestry and fishing workers experienced the highest
number of work-related injuries. Available from:
http://www.safeworkaustralia.gov.au/AboutSafeWorkAustralia/WhatWeDo/Media/Pag
es/MR20091019A.aspx. [cited 20 May 2012].
284. Park EK, Hannaford-Turner K, Lee HJ. Use of personal protective equipment in
agricultural workers under hot and humid conditions. Ind Health. 2009;47(2):200-1.
285. Cherrie JW, Semple S, Brouwer D. Gloves and dermal exposure to chemicals: proposals
for evaluating workplace effectiveness. Ann Occup Hyg. 2004;48(7):607-15.
286. Tian Z, Li S, Zhang J, et al. The characteristic of heat wave effects on coronary heart
disease mortality in Beijing, China: A time series study. PLoS One. 2013;8(9):e77321.
doi:10.1371/journal.pone.0077321.
287. Akerlof K, DeBono R, Berry P, et al. Public perceptions of climate change as a human
health risk: Surveys of the United States, Canada and Malta. Int J Environ Res Public
Health. 2010;7(6):2559-606.
288. Wardekker JA, Petersen AC, van der Sluijs JP. Ethics and public perception of climate
change: Exploring the Christian voices in the US public debate. Glob Environ Change.
2009;19(4):512-21.
289. Maibach EW, Chadwick A, McBride D, et al. Climate change and local public health in the
United States: Preparedness, programs and perceptions of local public health
department directors. PloS one. 2008;3(7):1-8.
290. Sheridan SC. A survey of public perception and response to heat warnings across four
North American cities: An evaluation of municipal effectiveness. Int J Biometeorol.
2007;52(1):3-15.
291. Leiserowitz AA. American risk perceptions: Is climate change dangerous? Risk Analysis.
2005;25(6):1433-42.
292. Stedman RC, Davidson DJ, Wellstead A. Risk and climate change: Perceptions of key
policy actors in Canada. Risk Analysis. 2004;24(5):1395-406.

References
286
293. O'Connor RE, Bord RJ, Fisher A. Risk perceptions, general environmental beliefs, and
willingness to address climate change. Risk Analysis. 1999;19(3):461-71.
294. Abrahamson V, Wolf J, Lorenzoni I, et al. Perceptions of heatwave risks to health:
Interview-based study of older people in London and Norwich, UK. J Public Health (Oxf).
2008;31(1):119-26.
295. Debono R, Vincenti K, Calleja N. Risk communication: Climate change as a human-health
threat, a survey of public perceptions in Malta. Eur J Public Health. 2010;22(1):144-9.
296. Semenza JC, Wilson DJ, Parra J, et al. Public perception and behavior change in
relationship to hot weather and air pollution. Environ Res. 2008;107(3):401-11.
297. Leiserowitz A. Climate change risk perception and policy preferences: The role of affect,
imagery, and values. Clim Change. 2006;77(1):45-72.
298. Bai L, Cirendunzhu D, Pengcuociren D, et al. Rapid warming in Tibet, China: public
perception, response and coping resources in urban Lhasa. Environ Health.
2013;12(1):71.
299. Akompab DA, Bi P, Williams S, et al. Awareness of and attitudes towards heat waves
within the context of climate change among a cohort of residents in Adelaide, Australia.
Int J Environ Res Public Health. 2012;10(1):1-17.
300. Hansen A, Bi P, Nitschke M, et al. Perceptions of heat-susceptibility in older persons:
Barriers to adaptation. Int J Environ Res Public Health. 2011;8(12):4714-28.
301. Agho K, Stevens G, Taylor M, et al. Population risk perceptions of global warming in
Australia. Environ Res. 2010;10(8):756-63.
302. Schifano P, Leone M, De Sario M, et al. Changes in the effects of heat on mortality
among the elderly from 1998-2010: Results from a multicenter time series study in Italy.
Environ Health. 2012;11:58. doi:10.1186/1476-069X-11-58.
303. Hole J, Pande M, editors. Worker productivity, occupational health, safety and
environmental issues in thermal power plant. 2009 IEEE Internatinal Conference on
Robotics and Automation, Kobe, Japan, 12-17 May, 2009.

References
287
304. Gun RT, Budd GM. Effects of thermal, personal and behavioural factors on the
physiological strain, thermal comfort and productivity of Australian shearers in hot
weather. Ergonomics. 1995;38(7):1368-84.
305. SA Health. Extreme heat operational plan. Available from:
http://www.sahealth.sa.gov.au/wps/wcm/connect/f5a784004d2dc67da0e0f3f08cd2a4a
7/ExtremeHeatOperationalPlan-phce-
Jan2013.pdf?MOD=AJPERES&CACHEID=f5a784004d2dc67da0e0f3f08cd2a4a7. [cited 15
July 2014].
306. Mckean B. Bricklayer dies in heat. Available from:
http://www.thechronicle.com.au/news/bricklayer-dies-in-heat/488357/. [cited 10
November 2013].
307. Australian Department of Commerce. Death of Queensland worker prompts warning on
heat stress. Available from:
http://www.commerce.wa.gov.au/corporate/media/statements/2009/December/Deat
h_of_Queensland_worker_pro.html. [cited 5 May 2014].
308. Cutforth P. Workers death linked to heat exposure. Available from:
http://www.whitecardaustralia.com.au/blog/workers-death-linked-to-heat-exposure/.
[cited 5 May 2014].
309. Vickers M, Lamb S, Hinkley J. Student workers in high school and beyond: The effects of
part-time employment on participation in education, training and work. Australian
Council for Education Research, Report No. 30. Camberwell, Victoria, 2003.
310. Safe Work Australia. Motivations, attitudes, perceptions and skills: Pathways to safe
work. Australian National University, 2011, p. 60. Available from:
http://www.safeworkaustralia.gov.au/sites/SWA/about/Publications/Documents/581/Motivatio
n_Attitude_Perceptions_and_Skills_Pathways_to_Safe_Work.pdf. [cited 2 March 2014].
311. Safe Work Australia. Motivations, attitudes, perceptions and skills: What they said about
work health and safety in 2010. Australian National University, 2011, p. 9. Available

References
288
from:
http://www.safeworkaustralia.gov.au/sites/SWA/about/Publications/Documents/603/Motivatio
ns_attitudes_perceptions_skills_what_they_said.pdf. [cited 15 March 2014].
312. Australian Bureau of Statistics. Australian labourforce status by country of birth, 2010-
2011. Cat. no. 1301.0. Available from:
http://www.abs.gov.au/ausstats/[email protected]/Lookup/by%20Subject/1301.0~2012~Main%
20Features~Labour%20force~44. [cited 5 April 2014].
313. Safe Work Australia. Model Code of Practice: Managing the work environment and
facilities 2011. Available from:
http://www.safeworkaustralia.gov.au/sites/swa/about/publications/pages/environmen
t-facilities-cop. [cited 5 April 2014].
314. Riley K, Delp L, Cornelio D, et al. From agricultural fields to urban asphalt: the role of
worker education to promote California's heat illness prevention standard. New Solut.
2012;22(3):297-323.
315. Khokha S. Teen farmworker's heat death sparks outcry. Available from:
http://www.npr.org/templates/story/story.php?storyId=91240378. [cited 1 May 2014].
316. Asch DA, Jedrziewski MK, Christakis NA. Response rates to mail surveys published in
medical journals. J Clin Epidemiol. 1997;50(10):1129-36.
317. Kjellstrom T, Odland JO, Nilsson M. "Hothaps" program for climate change impact
assessment and prevention: Progress report on a program for assessment and
prevention of climate change impacts on working people. Ruby Coast Research Centre,
Auckland, 2011, p. 13. Available from:
http://www.climatechip.org/sites/default/files/publications/140629%20Hothaps%20program%
20update.pdf. [cited 1 August 2014].
318. Tongco MDC. Ethnobotany Research and Applications. ScholarSpace, University of
Hawaii at Manoa. Purposive sampling as a tool for informant selection. 2007;5:147-158.
References
289
319. Australian Institute of Occupational Hygienists Inc. (AIOH). Meeting global challenges in
occupational hygiene. 2012 AIOH Annual Conference, Adelaide, 20-22 December, 2012.
320. Donoghue AM, Bates GP. The risk of heat exhaustion at a deep underground
metalliferous mine in relation to surface temperatures. Occup Med (Lond).
2000;50(5):259-63.
321. Mobed K, Gold EB, Schenker MB. Occupational health problems among migrant and
seasonal farm workers. West J Med. 1992;157(3):367-73.
322. Quandt SA, Wiggins MF, Chen H, et al. Heat index in migrant farmworker housing:
implications for rest and recovery from work-related heat stress. Am J Public Health.
2013;103(8):e24-6.
323. Almeida SP, Casimiro E, Calheiros J. Effects of apparent temperature on daily mortality
in Lisbon and Oporto, Portugal. Environ Health. 2010;9:12-8.
324. O'Neill MS, Zanobetti A, Schwartz J. Modifiers of the temperature and mortality
association in seven U.S. cities. Am J Epidemiol. 2003;157(12):1074-82.
325. Ramphal-Naley L. Screening for heat stress in workers and athletes. Proc (Bayl Univ Med
Cent). 2012;25(3):224-8.
326. Ebi KL, Schmier JK. A stitch in time: improving public health early warning systems for
extreme weather events. Epidemiol Rev. 2005;27(1):115-21.
327. Florida Department of Health, Division of Disease Control and Health Protection, Bureau
of Epidemiology. Assessing the relationship of ambient temperature and heat related
illness in Florida: Implications for setting heat advisories and warnings. 2012.
328. Kent ST, McClure LA, Zaitchik BF, et al. Heat waves and health outcomes in Alabama
(USA): The importance of heat wave definition. Environ Health Perspect.
2014;122(2):151-8.
329. Xiang J, Bi P, Pisaniello D, et al. The impact of heatwaves on workers health and safety in
Adelaide, South Australia. Environ Res. 2014;133C:90-5.

References
290
330. Robinson PJ. On the definition of a heat wave. J Clim. 2001;40(4):762-75.
331. Nairn J, Fawcett R. Defining heatwaves: Heatwave defined as a heatimpact event
servicing all community and business sectors in Australia. CAWCR Technical Report No.
060, Australian Bureau of Meteorology South Australian Regional Office, 2013.
332. Laxminarayan S, Buller M, Tharion W, et al. Human core temperature prediction for
heat-injury prevention. IEEE journal of biomedical and health informatics. 2014.
doi:10.1109/JBHI.2014.2332294.
333. Gribok AV, Buller MJ, Hoyt RW, et al. A real-time algorithm for predicting core
temperature in humans. IEEE Trans Inf Technol Biomed. 2010;14(4):1039-45.
334. Gribok AV, Buller MJ, Reifman J. Individualized short-term core temperature prediction
in humans using biomathematical models. IEEE Trans Biomed Eng. 2008;55(5):1477-87.
335. Lingard H. The effect of first aid training on Australian construction workers'
occupational health and safety motivation and risk control behavior. Journal of Safety
Research. 2002;33(2):209-30.
336. Bero LA, Grilli R, Grimshaw JM, et al. Closing the gap between research and practice: an
overview of systematic reviews of interventions to promote the implementation of
research findings. BMJ. 1998;317(7156):465-8.
337. Glasgow RE, McCaul KD, Fisher KJ. Participation in worksite health promotion: A critique
of the literature and recommendations for future practice. Health Education Quarterly.
1993;20(3):391-408.
338. Hancock PA, Vasmatzidis I. Effects of heat stress on cognitive performance: The current
state of knowledge. Int J Hyperthermia. 2003;19(3):355-72.
339. Murray B. Hydration and physical performance. J Am Coll Nutr. 2007;26(Supplement
5):542-8.
340. Seppanen O, Fisk WJ, Lei QH. Effect of temperature on task performance in office
environment. eScholarship, Lawrence Berkeley National Laboratory, University of
California. 2006.
References
291
341. DARA. Climate vulnerability monitor 2012. Available from: http://daraint.org/wp-
content/uploads/2012/09/CVM2ndEd-FrontMatter.pdf. [cited 12 June 2013].
342. Denzin NK, Lincoln YS. The SAGE handbook of qualitative research. 3rd edition. California:
Sage Publications, Inc.; 2011. 1209 p.
343. Thonneau P, Bujan L, Multigner L, et al. Occupational heat exposure and male fertility: A
review. Hum Reprod. 1998;13(8):2122-5.
344. Auger N, Naimi AI, Smargiassi A, et al. Extreme heat and risk of early delivery among
preterm and term pregnancies. Epidemiology. 2014;25(3):344-50.
345. Kahkonen E, Swai D, Dyauli E, et al. Estimation of heat stress in Tanzania by using ISO
heat stress indices. Appl Ergon. 1992;23(2):95-100.
346. Adam-Poupart A, Smargiassi A, Busque M-A, et al. Summer outdoor temperature and
occupational heat-related illnesses in Quebec (Canada). Environ Res. 2014;134:339-44.
347. Nevarez J. OSHA compliance issues: OSHA heat stress fatality investigation of a Latino
landscaping worker. J Occup Environ Hyg. 2013;10(6):D67-70.
348. US Department of Labour. The Occupational Safety and Health Act (OSH Act) of 1970.
Available from:
https://www.osha.gov/pls/oshaweb/owadisp.show_document?p_table=OSHACT&p_id=2743.
[cited 29 January 2014].
349. Minnesota Administrative Rules. Chapter 5205, Section 5205.0110. Indoor workroom
ventilation and temperature. 2012. Available from:
https://www.revisor.mn.gov/rules/?id=5205.0110. [cited 29 January 2014].
350. US Department of Labour. Occupational heat exposure: on-site consulation. Available
from: https://www.osha.gov/dcsp/smallbusiness/consult.html. [cited 29 January 2014].
351. Tanaka M. Heat stress standard for hot work environments in Japan. Ind Health.
2007;45(1):85-90.

References
292
352. Japan Society for Occupational Health. Recommendation of occupational exposure
limits (2007-2008). J Occup Health. 2007;49(4):328-44.
353. Provincial Governments. High temperature allowance standards in major
municipalities/provinces, 2013, China. Available from:
http://www.tianqi.com/news/15321.html. [cited 20 January 2014].
354. Gasparrini A, Armstrong B, Kenward MG, et al. Distributed lag non-linear models. Stat
Med. 2010;29(21):2224-34.
355. Gasparrini A. Modeling exposure-lag-response associations with distributed lag non-
linear models. Stat Med. 2014;33(5):881-99.