extreme july 2009 forex tom strignano - …system.tradingninja.com/go/headfakesystem.pdfextremejuly...
TRANSCRIPT

[1]
Head Fake Downside trade.Measure the distance between last 2 up closes.If close to high is greater on recent bar, its a head fake.
EXTREMEJULY 2009 FOREX
TOM STRIGNANOThe ForexConfidanteInner Circle Head Fake TradeConfidential Tading Secrets!
Head fake Trade Rules, Set up and Stop Loss!
The ground rules.
The first thing that we need
to understand is exactly what a
head fake is. A head fake is the
measurement of how many
traders are trapped at an
intermediate high or
intermediate low. We are looking
to capitalize on their out of the
money position. We must
always understand that a high is
made in the marketplace when
the last buyer has bought.
Conversely, a low is made in the
marketplace when the last seller
has sold. Markets tend to
reverse at these points and
trigger stop losses. We are
looking to capitalize on that. I
have developed a system that
will look for these areas and
enter a calculated low risk
trade. I will give the parameters
of this trade. You must always
take into consideration money
management, if the point of the
stop loss is greater then your
risk allotment, you must trade
smaller. Always plan your trade,
and trade your plan. Set your
stops.
Calculated Risk Is Good. The Head Fake Is
Calculated Risk!

[2]
STEP ONE IDENTIFY! The first step that we need
to do is to identify a head fake
in the marketplace. A head fake
is defined by a series of up
closes. If we have two
consecutive up close’s in a row
we will measure the distance
between the close and the high
of each bar. If the distance
between the close and the high
of the most recent bar(that just
closed) is greater than the close
to the high of the previous bar
we have a head fake on the
downside. This means that we
are going to assume that the
top of the present bar will hold,
so we shall sell the open of the
next bar.(Stop Loss 35 pips
above top of head fake bar.)
Head fake to the upside, is
the exact opposite or we have
two consecutive down closes
we will measure the distance
between the close in the low of
the current bar( that just closed.)
And the close to the low of the
previous bar. If the distance
between the close and the low
of the present bar is greater
than the previous bar we have a
head fake towards the upside.
So we shall buy the open of the
next bar.
In the video series, you will
see several techniques in order
to enter this trade. I’m going to
explain how we measure the
head fake wave, and calculate
profit levels and stop loss levels.
We are going to use a simple
pivot formula to accomplish
this.(In an unconventional way.)
In this trading system you’ll
find several other trading
systems, if a head fake does not
work and we break a pivot point
in either direction the
marketplace is telling us
something, we can take the
opposite trade with a tight stop
loss against the pivot points. It
is important to be flexible in
trading and realize that no
system is perfect, it’s just as
important as what the market is
not doing as to what it’s
supposed to do. This is an
excellent little mini trading
system itself, I encourage you to
go back and test this and see
how the market reacts at these
points. You will then be able to
develop your own style and
techniques which is my ultimate
goal, to make you
independent!
[3]
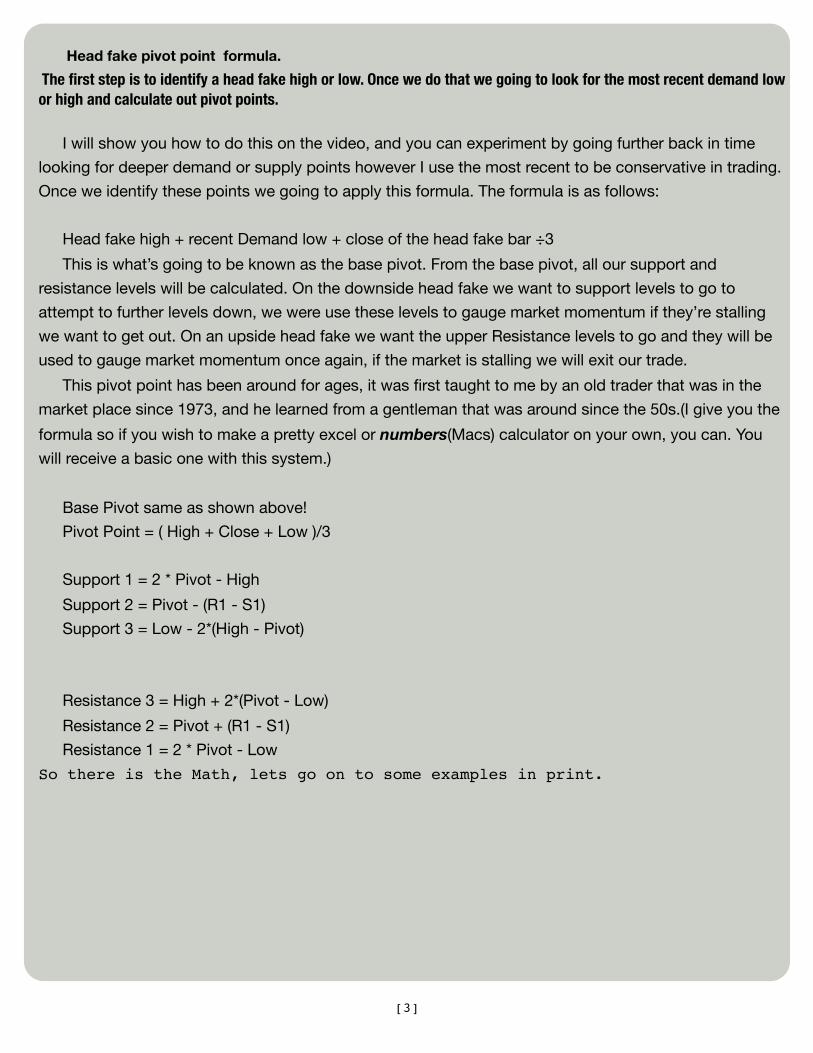
Head fake pivot point formula.
The first step is to identify a head fake high or low. Once we do that we going to look for the most recent demand low or high and calculate out pivot points.
I will show you how to do this on the video, and you can experiment by going further back in time
looking for deeper demand or supply points however I use the most recent to be conservative in trading.
Once we identify these points we going to apply this formula. The formula is as follows:
Head fake high + recent Demand low + close of the head fake bar ÷3
This is what’s going to be known as the base pivot. From the base pivot, all our support and
resistance levels will be calculated. On the downside head fake we want to support levels to go to
attempt to further levels down, we were use these levels to gauge market momentum if they’re stalling
we want to get out. On an upside head fake we want the upper Resistance levels to go and they will be
used to gauge market momentum once again, if the market is stalling we will exit our trade.
This pivot point has been around for ages, it was first taught to me by an old trader that was in the
market place since 1973, and he learned from a gentleman that was around since the 50s.(I give you the
formula so if you wish to make a pretty excel or numbers(Macs) calculator on your own, you can. You
will receive a basic one with this system.)
Base Pivot same as shown above!
Pivot Point = ( High + Close + Low )/3
Support 1 = 2 * Pivot - High
Support 2 = Pivot - (R1 - S1)
Support 3 = Low - 2*(High - Pivot)
Resistance 3 = High + 2*(Pivot - Low)
Resistance 2 = Pivot + (R1 - S1)
Resistance 1 = 2 * Pivot - Low
So there is the Math, lets go on to some examples in print.

[4]
Measure the difference between the close and the high of the two bars. It’s an important point that we note that there are
two head fakes in play here. These three up closes show two head fakes . I will use the most recent one for our example.( the first head fake was never stopped out) so now that we have identified two consecutive up closes, where the difference between the close and the high of the most recent bar is greater than the previous bar we have a potential top that should hold. You will see in the example above that the previous bars distance is only six pips from close to high. The most recent bar that
closed, the distance between the close in the high is 23 pips. So we have identified a head fake. The name had fake comes from the fact that there are more traders trapped up top on this recent bar than there were on the previous bar. They went for the head fake high only the fine a price retreat. They need greater demand to come and rescue them out of their
position. I am looking to capitalize on their out of the money positions and ride the wave of the triggered
stop losses down into profits. Picture A identifies the three points that we will use in our pivot calculator. We have our head fake bar (top)that we will assume will hold. We
have the 35 pip stop loss(added to the
high of bar) if we are wrong. The green arrow identifies the most recent demand point. We will
use that point as our low. We will use the top of the head fake bar as our high, we will also use the close of a head fake bar as our close. These numbers are 1.0891 High, Swing low value (green arrow) 1.0837. Head Fake Bar Close 1.0884. These points yield us the following values. First level of resistance 1.0904, second level of resistance 1.0925( right at our stop loss) and finally third level of resistance 1.0958. First level of support we need to break 1.0850.
Consecutive up or down
closes
HEAD FAKE DOWNSIDE IDENTIFIED !

[5]
Watch momentum!
Now that we have identified our points will be watching how the market reacts at these points. Obviously I would want my first resistance level at 1.0904 to hold, actually I would prefer the trade to move straight down. These points are extremely important, they help us gauge market momentum to let us know what the market wants to do. Our first level of support at 1.0850 is the first level that we need to break. The speed and force at which it breaks the level is an indication of how powerful the move can be. If we breakdown to the 1.0817 level, all stops should be moved down to the first level (1.0850) you can then use a trailing stop loss in order to attempt to catch a bigger move if the third and final level is broken at 1.0796.
This is a trade that I took, and it took several hours before the trade finally broke level 3. I needed to exercise patience to capture a huge move in the dollar versus the Swiss franc. I closed my trade out at 1.0716. The low of the move was 1.0666 . Obviously this was an exceptional move down and an excellent head fake trade. We do get these often, but not most often. That is why it’s important to gauge market momentum at the pivot points. My personal rule is if I break a pivot by more than 25 pips I’m most likely going to attempt the next pivot. Study the next chart and see how the market reacted at these pivot points. Take note on how the market speeded up its dissent once it broke level 3. There was a huge shift in supply versus demand. These of the trades that are going to make our week. That is why it is important to practice patience, and use trailing take profits. I find that a 40 pip trailer helps me capture larger moves.

[6]
Head Fake Upside
Here is an example of a
head fake towards the upside.
The difference between the
close and the low of the present
bar that just closed, is greater
than the previous. I will buy the
open up the next bar with a 35
pip stop loss below the bottom
of this recent bar. (Green arrow)
The red arrow, identifies the
most recent supply point that
we will measure off of. We will
import the high of that bar with
the low of the present bar. We
will use the close of the present
bar for our close point in the
pivot calculator. The points are
as follows: recent supply point
high( red arrow) is 155.87, head
fake low is 153 .90 and a head
fake close is 154.20
We will import these points
into our pivot calculator. It yields
the following:

[7]
Targets and Stop Loss Set!
All my profit levels and
target levels are now set. I’ll buy
the open of the next bar with a
stop loss at 153.55. notice that
support level 1 is just slightly
below my stop loss.
My thinking at this point
would be that if I get stopped
out I will look to sell the break of
support level 1 with a tight stop
above that point.
I be risking another 35 pips
towards the upside. However I
would enter a smaller amount
on that reversal. I would use the
support levels beyond( level two
and level 3) as take profits.
So as you can see there are
several trading systems within
this one system itself.
Remember always to use
money management.
If you feel uncomfortable
with the reversal than don’t do
it. Look for another trade set up
and take that trade, the system
must fit your personality. Don’t
force anything,trade in your own
comfort level or you’ll commit
self sabotage. Let’s look at the
next page to see how the trade
developed

[8]
Notice how the market dips down first!

[9]
Waves Inside Of Waves! This should be a good
time to bring up the fact that
there are several other down
side head fake filters that also
come into play as this move
develops towards the upside.
If we missed this bottom head
fake to the upside ,there were
several(downside head fakes)
that occurred in between that
brought us down towards our
first primary target levels of
resistance one. Why is that?
Because there are waves
inside of waves, as the
market moves up and down it
constantly creates these
points. It is what Ralph Elliott
had stressed in the Laws of
Nature, and why market
moves sometimes seem very
elusive.
It is my philosophy that
once I enter a trade and I see
my first pivot or target break I
will stay in the trade looking
for the next level to the
challenged. I’ll take note of all
the other wave patterns that
set up( Head fakes) within my
overall trading plans. As soon
as I notice a head fake in the
opposite direction I’ll move
my stop losses up to break
even.
Several of my students
exit the trade when this
pattern develops and actually
go in that direction to attempt
to capture the next
subsequent wave measuring
market momentum as
discussed previously. This is
entirely up to your trading
style and once again it must
fit your personality type.
You personally have to
have objectives as a trader,
perhaps you’ll develop a mix
of head fake trades one set
going for larger percentage
gains, and others to capture a
good amount of pips in the
short-term to fund those
longer term trades. Check out
the video series for some set
ups.
[10]
The big print giveth, and the small print taketh away. Warning!!
Risk disclosure
Risk Disclosure
Forex trading has a large potential risk. You
must be aware of the risks and be willing to
accept them in order to invest in the Forex
market. Don't trade with money you can't afford
to lose. This website is neither a solicitation nor
an offer to Buy/Sell Forex. No representation is
being made that any account will or is likely to
achieve profits or losses similar to those
discussed on this website. The past
performance of any trading system or
methodology is not necessarily indicative of
future results.
Trading foreign currencies is a challenging
and potentially profitable opportunity for
educated and experienced investors. However,
before deciding to participate in the Forex
market, you should carefully consider your
investment objectives, level of experience and
risk appetite. Most importantly, do not invest
money you cannot afford to lose.
There is considerable exposure to risk in
any foreign exchange transaction. Any
transaction involving currencies involves risks
including, but, not limited to, the potential for
changing political and/or economic conditions
that may substantially affect the price or liquidity
of a currency.
More over, the leveraged nature of Forex
trading means that any market movement will
have an equally proportional effect on your
deposited funds. This may work against you as
well as for you. The possibility exists that you
could sustain a total loss of initial margin funds
and be required to deposit additional funds to
maintain your position. If you fail to meet any
margin call within the time prescribed, your
position will be liquidated and you will be
responsible for any resulting losses. Investors
may lower their exposure to risk by employing
risk-reducing strategies such as 'stop-loss' or
'limit' orders.