extreme patterns of variance in small populations: placing ... · human communities, and...
TRANSCRIPT
doi: 10.1111/j.1469-1809.2006.00327.x
Extreme Patterns of Variance in Small Populations:Placing Limits on Human Y-Chromosome Diversitythrough Time in the Vanuatu Archipelago
M. CoxArizona Research Laboratories – Biotechnology, 1041 East Lowell Street, Biological Sciences West, Room 246B, University ofArizona, Tucson, AZ 85721, USA
Summary
Small populations are dominated by unique patterns of variance, largely characterized by rapid drift of allele frequen-
cies. Although the variance components of genetic datasets have long been recognized, most population genetic
studies still treat all sampling locations equally despite differences in sampling and effective population sizes. Be-
cause excluding the effects of variance can lead to significant biases in historical reconstruction, variance components
should be incorporated explicitly into population genetic analyses. The possible magnitude of variance effects in small
populations is illustrated here via a case study of Y-chromosome haplogroup diversity in the Vanuatu Archipelago.
Deme-based modelling is used to simulate allele frequencies through time, and conservative confidence bounds
are placed on the accumulation of stochastic variance effects, including diachronic genetic drift and contempo-
rary sampling error. When the information content of the dataset has been ascertained, demographic models with
parameters falling outside the confidence bounds of the variance components can then be accepted with some
statistical confidence. Here I emphasize how aspects of the demographic history of a population can be disentangled
from stochastic variance effects, and I illustrate the extreme roles of genetic drift and sampling error for many small
human population datasets.
Keywords: Demography, Variance Components, Monte Carlo Simulation
Introduction
A detailed reconstruction of prehistoric demography
remains the primary goal of human molecular an-
thropology. One standard approach towards this aim
involves screening history-informative genetic loci
(usually mitochondrial or from the non-recombining
Y-chromosome, NRY) in a small number of individuals
sampled at discrete locations over a broad geographical
area (e.g. Cox & Lahr 2006). Subsequently, past relation-
ships are inferred by calculating similarities and differ-
ences within and between these contemporary groups,
and extrapolating the patterns observed today backwards
Corresponding Author: Dr. Murray P. Cox. Tel: +1-520-
621 9791; Fax: +1-520-626 8050, E-mail: mpcox@
email.arizona.edu
into the past. This practice has proved highly informative
for recognizing patterns in the modern genetic record on
broad geographical scales (e.g. Cavalli-Sforza et al. 1994;
Jobling & Tyler-Smith 2003), but has proved less success-
ful at reconstructing the historical processes underlying
those patterns. In particular, few contemporary studies
explicitly account for the extensive stochastic variance
that occurs from generation to generation in small hu-
man communities – even though this effect has long
been recognized as an important component of genetic
demography (Wright, 1931). Even fewer studies quan-
titatively address the effects that variance components
have on historical reconstructions from contemporary
patterns of genetic diversity. However, because demo-
graphic processes in small groups are the currency of
large-scale demographic events, a better appreciation of
stochasticity in small human populations is a prerequisite
390 Annals of Human Genetics (2006) 71,390–406 C© 2006 The AuthorJournal compilation C© 2006 University College London
Diachronic Variance in Small Populations
to understanding major demographic events in human
history. Here I illustrate the extreme effects of histori-
cal and contemporary variance components on a rep-
resentative genetic dataset, and present simple analytical
framework to address them.
Monte Carlo genetic simulation can be used to infer
minimum levels of stochastic variance in experimentally
determined genetic profiles from small populations. Be-
cause sampling effects involve random events, only sim-
ulation methods can estimate the relative contributions
of the two main variance factors: diachronic (through
time) genetic drift and modern sampling error. How-
ever, this approach is not readily available to population
genetic researchers. Because the timeframe over which
small population studies are useful is so short, mutation
events are rare, and therefore simulation under the coa-
lescent (e.g. Hudson, 2002) is impractical. Deme-based
simulation is a more practical approach, but generally
requires relatively sophisticated programming skills (e.g.
Thomas et al. 2006). Software intended for evolution-
ary prediction in a classroom setting (e.g. Alstad, 2003;
Felsenstein, 2005) is often less useful for research infer-
ence. The approach implemented here is a simple way to
fit historical reconstructions with statistical confidence
bounds inferred from contemporary genetic datasets.
This allows the researcher to address two fundamental
questions: which aspects of a genetic pattern likely re-
flect real underlying demographic processes, and which
are probably just random distortions in the data?
The Indo-Pacific region provides a textbook model
system in which to examine variance dynamics in small
human communities, and Y-chromosome haplogroup
data from ten islands in the Vanuatu Archipelago are
presented here as an exemplar. Genetic surveys in Ocea-
nia typically involve small sample sizes, although these
are often proportionally large relative to the magni-
tude of local communities. In Cox and Lahr’s (2006)
compilation of published Indo-Pacific Y-chromosome
data, samples had a median size of only 38 individuals
[range: 11-94]. Island communities are also small rela-
tive to many continental groups. Using ethno-linguistic
group sizes as a proxy for the maximum extent of lo-
cal communities, the median group size in Vanuatu is
only 450 individuals [range: 50-7,000], and this dis-
tribution is skewed markedly towards populations of
fewer than a thousand (Gordon, 2005). Because these
ethno-linguistic communities develop relatively slowly,
it seems reasonable that similar conditions have held in
Oceania through history, and the genetic profiles ob-
served in small human populations today must have been
influenced strongly by stochastic processes of genetic
drift in the past. Furthermore, although limited sam-
ple collection is a natural outcome of the difficulties
inherent in human population sampling (Cox & Lahr
2006), this factor still strongly biases the observed fre-
quencies of alleles and their inferred geographic dis-
tributions. Confounding influences such as these are
not commonly factored into reconstructions of human
genetic history, particularly those of the Indo-Pacific
region, although attempts to estimate the founding pop-
ulation size of New Zealand remain notable exceptions
(Murray-McIntosh et al. 1998; Whyte et al. 2005).
Here, I illustrate the extreme effects of variance com-
ponents in representative population genetic datasets
from small human communities, and I present an an-
alytical approach to help discriminate between demog-
raphy and stochastic variance using these data. Firstly, I
show how minimum bounds for the confounding effects
of diachronic genetic drift and modern sampling error
can be estimated from contemporary genetic data, and
secondly, I show how this information helps to deter-
mine how much confidence can be placed on historical
reconstructions inferred from a given genetic dataset.
This reconstructive approach is explained via a small
scale case study of Y-chromosome haplogroup varia-
tion in 235 men (called ni-Vanuatu) from ten island
groups in the Vanuatu Archipelago (Cox, 2003). Aspects
of the reconstructed genetic history are compared with
anthropological evidence for the initial settlement and
subsequent history of the Vanuatu archipelago, and the
tangled effects of historical demography and stochas-
tic variance are exposed within this exemplar dataset.
The primary focus of this paper is variance factors in
small communities. Readers interested in a broader his-
tory of the Indo-Pacific region as inferred from genetic
data should consult the recent extensive literature on
this topic (e.g. Capelli et al. 2001; Forster et al. 2001;
Kayser et al. 2001a; Underhill et al. 2001; Friedlaen-
der et al. 2002; Hurles et al. 2002; Lum et al. 2002;
Tommaseo-Ponzetta et al. 2002; Hurles et al. 2003;
Ingman & Gyllensten 2003; Kayser et al. 2003; Cann
& Lum 2004; Cox, 2005b; Friedlaender et al. 2005;
C© 2006 The AuthorJournal compilation C© 2006 University College London
Annals of Human Genetics (2006) 71,390–406 391
M. Cox
Table 1 Vanuatu Population Samples: island group, island sampling location, sample size, Y-chromosome haplogroup frequencies,
estimated total census size, and estimated male effective population size.
Y-Chromosome Haplogroup Frequencies
Group Sampling Location NS C K∗ K5 M O3 R Nc Nm
North Banks and Torres 3 0.33 0.33 0 0.33 0 0 - -
Central Lamenu 27 0.26 0.56 0.04 0.15 0 0 1,177 466
Maewo 20 0.40 0.25 0 0.25 0.10 0 1,679 664
Malekula 23 0.17 0.83 0 0 0 0 25,737 10,186
Maskelynes 22 0 0.05 0 0.95 0 0 1,883 745
Nguna 28 0 0.54 0 0.46 0 0 4,707 1,863
Paama 36 0 0.61 0 0.17 0.22 0 9,413 3,725
South Aniwa 27 0.74 0.11 0 0.04 0 0.11 471 186
Futuna 24 0.04 0.25 0.54 0.13 0 0.04 471 186
Tanna 25 0 0.40 0 0.60 0 0 26,278 10,400
Total 235 0.174 0.413 0.060 0.294 0.043 0.017 71,816 28,421
Karafet et al. 2005; Trejaut et al. 2005; Cox & Lahr
2006; Scheinfeldt et al. 2006).
Materials and Methods
Biological Samples
Don Bowden (Monash University, Australia) and Mary
Ganczakowski (Queen Alexandra Hospital, U.K.) ob-
tained blood samples from ni-Vanuatu volunteers
during the early 1990s. Biological collections were
made with the informed consent of participants, who
came from rural communities and displayed symp-
toms putatively associated with haemoglobin disor-
ders. A sampling strategy focused on individuals with
haemoglobinopathies should not bias genetic varia-
tion observed on the non-recombining Y-chromosome
(NRY), because there is complete lineage sorting
between NRY markers and autosomal loci, and
haemoglobin disorders are common in the archipelago
(and therefore not restricted to kin groups with cor-
respondingly biased Y-chromosome diversity; Williams
et al. 1996).
Screening NRY Variation
Male DNA samples (N = 235) from ten island popula-
tions in the Vanuatu Archipelago (Table 1) were screened
for Y-chromosome haplogroup lineages (Y Chromo-
some Consortium, 2002; Jobling & Tyler-Smith 2003).
Men were assigned to six Y-chromosome haplogroups:
C-M130, K∗-M9(xK1-M177, K5-M230, L-M11,
M-M106, NO-M214, P-92R7), K5-M230, M-M106,
O3-M122, and R-M207 (Cox, 2003). All lineages, ex-
cept K5-M230 and O3-M122, were screened using the
hierarchical protocols of Cox (2006). K5-M230 was
assayed using the method of Kayser et al. (2003). An
amplicon containing the O3-M122 marker was gen-
erated with primers M122f 5′-TGG TAA ACT CTA
CTT AGT TGC CTT T-3′ and M122r 5′-TTT GCT
TTG TTA GAT TCT GGT GTT G-3′ , and if ances-
tral, cleaved into two fragments of 147 and 74 bp with
the restriction endonuclease Hsp92II (Cox, 2003).
Estimating Demographic Parameters
The dynamics of human populations in the Vanuatu
Archipelago have been characterized only superficially.
The best information sources include the 1999 national
census (National Statistics Office, 2000), which is ac-
curate but does not present demographic data on geo-
graphic/linguistic groupings; and the 2005 Ethnologue
report (Gordon, 2005), which has older and less accurate
information, but provides more detailed regional data
focusing on the languages present in Vanuatu and the
numbers of their speakers. Census sizes (Nc) of the geo-
graphic/linguistic groups studied here (Table 1) are es-
timated from both sources. For each sampling location,
the number of individuals speaking each language was
calculated from Ethnologue statistics, and scaled pro-
portionally to contemporary levels by weighting against
the total population size registered by the 1999 national
census.
392 Annals of Human Genetics (2006) 71,390–406 C© 2006 The AuthorJournal compilation C© 2006 University College London

Diachronic Variance in Small Populations
Census population sizes include individuals who do
not contribute biologically to following generations,
and therefore overestimate effective population sizes
(Ne). For Y-chromosome studies, effective male popula-
tion sizes (Nm, Table 1) are more realistic estimates of the
number of men contributing to each study population
over time than raw census values (cf. Hedrick, 2005).
Nm estimates were calculated by scaling regional census
sizes (Nc) by a ratio of the total effective population size
to the census population size (Ne/Nc = 0.786) and a ra-
tio of female to male effective population sizes (Nf /Nm
= 0.984). These values were derived from ethnologi-
cal data of the Gainj (northern New Guinea), the only
Oceanic population for which such detailed informa-
tion is currently available (Storz et al. 2001). These val-
ues represent best approximations for the ni-Vanuatu.
Population History by Monte Carlo
Simulation
Estimates of sampling error and genetic drift were
inferred using time-reversible genetic simulation im-
plemented in the programe, DRIFTER (Cox, 2005a).
Isolated, panmictic and constant-sized Fisher-Wright
demes of size Nm were conditioned with allele fre-
quencies t0[A1, A2, . . . , An] at generation g0. Allele
frequencies were allowed to drift within demes for a dis-
crete number of non-overlapping generations until final
allele frequencies tn[A1, A2, . . . , An] were produced at
generation gn.
To mimic the effects of sampling error, a fraction
of each simulated deme equivalent to the experimen-
tal sample size, Ns, was chosen randomly from the final
generation. Sampling errors inferred by simulation were
checked by comparing against their deterministic solu-
tion,
s 2(pa ) =pa (1 − pa )
n(1)
where pa is the allele frequency, and n the sample size.
Final allele frequencies were recorded after this sampling
step, and the entire process repeated 10,000 times for
each population.
The demographic model employed here makes three
initial assumptions. Firstly, new mutations do not arise
during the course of the simulation (μ = 0). This can
be justified because the Vanuatu Archipelago was only
settled ca. 3,200 years ago (Spriggs, 1997; Bedford et al.
1998), by which time the observed Y-chromosome lin-
eages had already developed (e.g. Kayser et al. 2000,
2001b, 2003; Scheinfeldt et al. 2006). This absence of
mutation events over short time periods is a primary
reason why coalescent approaches cannot be used to
model the sort of demographic system under study here.
Secondly, population sizes are treated as constants. The
paucity of archaeological and genetic information on
population size change over time necessarily imposes
this assumption, although current archaeological evi-
dence is entirely consistent with populations spreading
rapidly across Vanuatu and quickly reaching carrying
capacity. Thirdly, no migration occurs between popula-
tions within the timeframe of the simulation (m = 0).
Deviations from these premises are discussed later in the
text.
Placed in real terms, this demographic equilibrium
model assumes that demes are geographically scattered
and genetically isolated before the simulation begins.
This can be interpreted as a near instantaneous disper-
sal of populations across the Vanuatu archipelago, which
seems a reasonable proxy for the incredibly swift settle-
ment of these islands by rapidly expanding agricultural
populations (Bedford, 2003). Nevertheless, all Oceanic
populations involved themselves in some level of gene
flow – soon after settlement and during later history.
Here, the effects of migration in Vanuatu are initially
assumed to be significantly less than the combined ef-
fects of genetic drift and sampling error. This assump-
tion is supported by some Oceanic ethnographic data
(Friedlaender, 1975; Long et al. 1986; M. Cox, un-
published genealogies from Solomon Islands, 2004), al-
though less well by others (Friedlaender et al. 2005).
However, the Y-chromosome data themselves further
espouse this assumption.
Deme-based genetic simulation must be conditioned
on a set of founding allele frequencies. Because historical
lineage frequencies cannot be determined directly from
modern sources, simulation studies must use practical
alternatives. Backwards-in-time simulation with initial
frequencies from experimental modern data is useful for
placing confidence limits on historical allele frequencies.
Within the limits of the simulation model, genetic drift
could not have produced the allele frequencies observed
C© 2006 The AuthorJournal compilation C© 2006 University College London
Annals of Human Genetics (2006) 71,390–406 393

M. Cox
in the present if historical allele frequencies had fallen
outside these bounds in the past.
Alternatively, we can mimic the effect of popula-
tion subdivision on allele frequency distributions using
forward-in-time simulation. Because the effect of ge-
netic drift is inversely proportional to Ne, large pop-
ulations diverge more slowly from ancestral lineage
frequencies than small populations. Therefore, for a
model of populations with homogeneous initial allele
frequencies, the averages of modern allele frequencies
weighted by each island group’s effective population size
are reasonable proxies:
f a =∑
Nmi pa i∑Nmi
(2)
where fa is the weighted frequency of allele a, and Nm
and pa are the male effective population size and fre-
quency of allele a in the ith population, respectively. For
a model of populations with heterogeneous initial allele
frequencies, simulations can be conditioned on allele
frequencies chosen by dual-step bootstrapping of the
experimental data. Demic arrangements with allele fre-
quencies showing the desired range of starting FST
values can be adopted to seed genetic simulations.
Given that historical allele frequency distributions are
inherently unknowable, approaches such as these are
necessary approximations for any deme-based simula-
tion framework.
Finally, times inferred in generation intervals in the
simulations were converted to chronological time using
a mean male inter-generation interval of 31 years, as cal-
culated from cross-cultural ethnographic data (Fenner,
2005).
Geographical Distances and Matrix
Correlation
Geographical distances between sampling locations were
calculated as geodesic arcs with EARTH (Byers, 2005),
and correlated against genetic distances using the
Mantel (1967) test implemented in the ADE4 module
of the R statistical package (R Project, 2006). Geo-
graphical distances were ln transformed to compensate
for two-dimensional spatial analysis, and pairwise FST
values were linearised by FST /(1 − FST ) to generate
values varying from 0 → ∞ in analogy with geograph-
ical distance (Rousset, 1997).
Moment Estimators for Migration and
Population Subdivision
Hierarchical F statistics, a moment estimator measure of
population subdivision, were calculated using the hierar-
chical method of Yang (1998) implemented in HIERFSTAT
(Goudet, 2005), a module of the statistical package R
(R Project, 2006). The significance of pairwise FST val-
ues was determined by bootstrapping the experimental
data (10,000 replicates), and setting the observed value’s
rank as its probability.
Equilibrium values for inter-deme migration rates
were inferred using Wright’s moment estimator
(Wright, 1931, 1951; Slatkin, 1985) for haploid data:
FST ≈ 1
2Nm m + 1(3)
where m is the migration rate per generation between
two given populations averaged over time. Although
the assumptions of this statistic (e.g. an island model,
no selection, no mutation) are invalid for many real-
world situations (Whitlock & McCauley 1999), they
are reasonable first approximations for the case study
region.
Results
Experimental Results
Cox (2003) identified six Y-chromosome haplogroup
lineages in 235 men from ten islands in the Vanuatu
Archipelago: C-M130, K∗-M9(xK1-M177, K5-M230,
L-M11, M-M106, NO-M214, P-92R7) – hereafter ab-
breviated to K∗-M9, K5-M230, M-M106, O3-M122,
and R-M207 (Figure 1). All lineages, except R-M207,
are prevalent in Oceania and Southeast Asia. The four
R-M207 carriers identified in this study most likely
descend from recent European ancestors, and are only
found on two southern islands (Aniwa and Futuna) with
a long history of Western influence (e.g. Buxton, 1926).
These individuals were therefore ignored in the fol-
lowing analysis, which has its primary focus on recon-
structing variance in pre-contact demography. The small
size of the Banks or Torres assemblage (N = 3) limits
its statistical power, and so these individuals were also
excluded.
394 Annals of Human Genetics (2006) 71,390–406 C© 2006 The AuthorJournal compilation C© 2006 University College London
Diachronic Variance in Small Populations
Figure 1 Sampling Locations and Observed Y-Chromosome
Haplogroup Frequencies in the Vanuatu Archipelago. Pie charts
are proportional to sample size (except for Banks and Torres, as
this pie chart has been enlarged for readability). Dashed lines
delineate the northern, central and southern regions of the
archipelago.
F statistics were adopted as a measure of popula-
tion subdivision. Panmictic populations are indicated
by FST ≈ 0, and populations are increasingly subdi-
vided as FST → 1. Extensive population substructuring
is not expected among communities in Vanuatu, because
the archipelago was settled only ∼ 3,200 years before
present (BP). Yet contemporary geographic/linguistic
groups show strong signals of subdivision (FST = 0.34,
p < 0.001) equivalent to those at inter-continental scales
(Hammer et al. 2001). However, Y-chromosome subdi-
vision (as measured by FST distances) is not correlated
with geographical distance (Mantel test, r = −0.077,
ns). This pattern – genetically divergent populations
with no geographical structuring – most likely reflects
stochastic, rather than deterministic, processes. There
is an increased rate of stochastic genetic drift both in
small island communities and with haploid loci, where
the effective population size (Ne) is one-fourth that of
autosomal regions (4Ne). To help place minimum con-
fidence limits on the demographic information content
of this dataset, Monte Carlo simulation was performed
to infer the relative contributions of stochastic genetic
drift and sampling error alone to the genetic profiles
observed from each population sample. Employing a
subtractive approach, confidence bounds could then be
placed on selected demographic parameters of inter-
est, such as estimates of historical allele frequencies and
the extent of ancestral population substructure. These
bounds are likely to underestimate the true uncertainty
of the genetic data – the vagaries of history will naturally
increase the variance of the dataset while simultaneously
preventing us from modelling it absolutely.
Confounding Effects of Migration
The demographic model implemented here assumes
that migration does not occur between populations
during the course of the simulation. Violations of this
assumption have little impact if migration rates are
low. In practice, some human populations can exhibit
very high rates of inter-deme mobility, but supporting
evidence suggests that inter-island male gene flow is
probably infrequent for the case study region. Firstly,
historical records of human mobility (male or female)
between island groups are sparse (e.g. Rivers, 1914, pp.
25, 47ff, 189, 340, 355) and suggest that men tra-
ditionally stayed in their home village after marriage
(i.e. patrilocality dominated; Rodman, 1979, p. 189).
Furthermore, the high rate of linguistic subdivision in
Vanuatu (greater than one hundred extant Austronesian
languages; Gordon, 2005), and the brief period in which
this must have developed (∼3,200 years), are also con-
sistent with limited historical mobility. Secondly (and
more quantitatively), approximate migration rate esti-
mates support historically low levels of gene flow within
Vanuatu (Table 2). The exceptions are three popula-
tion pairs – Lamenu/Maewo, Lamenu/Malekula and
Nguna/Tanna – which have genetic profiles consistent
C© 2006 The AuthorJournal compilation C© 2006 University College London
Annals of Human Genetics (2006) 71,390–406 395

M. Cox
Table 2 Moment Estimators for Population Subdivision and Migration Rates: pairwise FST values (below diagonal) and mean inter-
population migration rates (bidirectional number of individuals per generation, above diagonal). Bolded values are not significant and
reflect large inter-population migration rates. Highlighted areas represent comparisons between the Central and Southern groups of
Vanuatu populations; unhighlighted areas represent comparisons within the Central group of Vanuatu populations (top left) and within
the Southern group (bottom right).
Lamenu Maewo Malekula Maskelynes Nguna Paama Aniwa Futuna Tanna
Lamenu – 8.8 7.3 0.4 4.5 7.1 1.0 1.7 2.2
Maewo 0.054 – 1.2 0.6 2.5 2.4 2.4 1.7 2.3
Malekula 0.064 0.288 – 0.1 1.4 3.8 0.3 0.7 0.8
Maskelynes 0.551 0.456 0.795 – 0.7 0.4 0.1 0.4 1.4
Nguna 0.101 0.168 0.262 0.408 – 5.0 0.4 1.2 ∞Paama 0.066 0.174 0.115 0.554 0.091 – 0.5 1.3 2.2
Aniwa 0.342 0.174 0.600 0.791 0.548 0.511 – 0.5 0.4
Futuna 0.226 0.231 0.407 0.584 0.292 0.279 0.504 – 1.1
Tanna 0.183 0.177 0.399 0.267 -0.002 0.185 0.566 0.316 –
with substantial inter-island mobility (non-significant
FST values where FST → 0 and m → ∞ ). These island
pairs are effectively unified population groups from the
perspective of the NRY. However, even with elevated
levels of gene flow between some island groups, the me-
dian number of individuals moving between the sam-
pled locations are estimated at only ∼1.25 individuals
per generation. Male migration in Vanuatu has proba-
bly been negligible throughout much of prehistory (cf.
Spriggs, 1997, p. 136), especially when compared to
the effects of intra-deme genetic drift and sampling er-
ror.
Modelling Variance Factors via Monte Carlo
Simulation
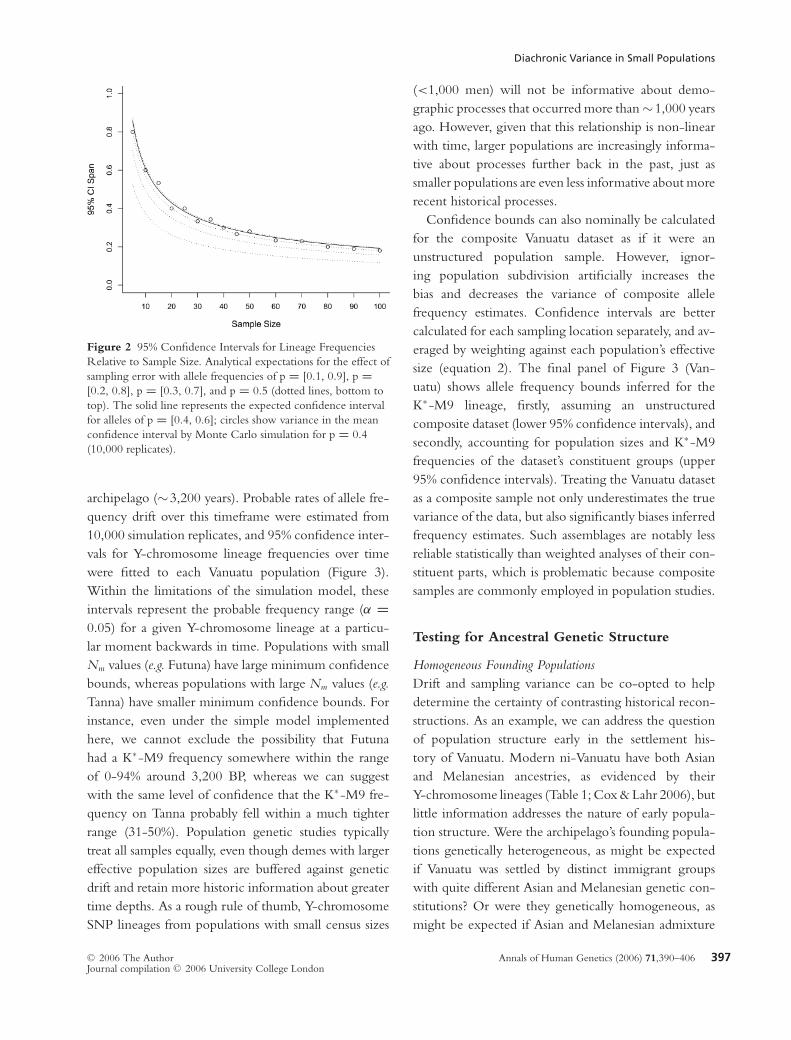
Sampling Error
The effects of sampling error were estimated by deter-
ministic approximation (equation 1) and by genetic sim-
ulation. Theoretical uncertainty limits can be calculated
for specific allele frequency/sample size combinations
(Figure 2, solid and dotted lines), but this determinis-
tic solution masks important random deviations that are
observable in practice (Figure 2, circles). Sampling error
limits the accuracy of inferences about human history
that can be made from population genetic datasets. For
instance, allele frequency (p) estimates have an uncer-
tainty that decreases non-linearly with sample size as
p → [0,1]; alleles with intermediate frequency are in-
ferred less confidently. Increased sampling from a pop-
ulation also yields diminishing returns. Therefore, pop-
ulation samples with different sizes and different allele
frequency profiles are not directly comparable.
Genetic Drift
Genetic drift is a stochastic process, which is also
time-reversible under the specific demographic model
implemented here. Allele frequency change between
non-overlapping generations can be approximated by
a Markov process:
pt+1 = pt + ε (4)
where pt is the current allele frequency, pt+1 is the allele
frequency in the following generation, and ε is a normal
random variable with variance inversely proportional to
the effective population size,
ε ∼ N
(μ = 0, σ 2 ∝ 1
4Ne
)(5)
Because genetic drift involves a random component, it
has no strictly deterministic representation and must be
modelled by simulation.
Genetic drift is the variance factor most likely to con-
found inferences from modern experimental data be-
cause its effect increases as populations become smaller.
To illustrate the influence of historical genetic drift on
Y-chromosome variation in Vanuatu, simulations were
conditioned on the observed frequency data and ef-
fective male population size (Nm) of each sampling
location. Simulations were run for 102 generations,
a period equivalent to the settlement history of the
396 Annals of Human Genetics (2006) 71,390–406 C© 2006 The AuthorJournal compilation C© 2006 University College London
Diachronic Variance in Small Populations
Figure 2 95% Confidence Intervals for Lineage Frequencies
Relative to Sample Size. Analytical expectations for the effect of
sampling error with allele frequencies of p = [0.1, 0.9], p =[0.2, 0.8], p = [0.3, 0.7], and p = 0.5 (dotted lines, bottom to
top). The solid line represents the expected confidence interval
for alleles of p = [0.4, 0.6]; circles show variance in the mean
confidence interval by Monte Carlo simulation for p = 0.4
(10,000 replicates).
archipelago (∼3,200 years). Probable rates of allele fre-
quency drift over this timeframe were estimated from
10,000 simulation replicates, and 95% confidence inter-
vals for Y-chromosome lineage frequencies over time
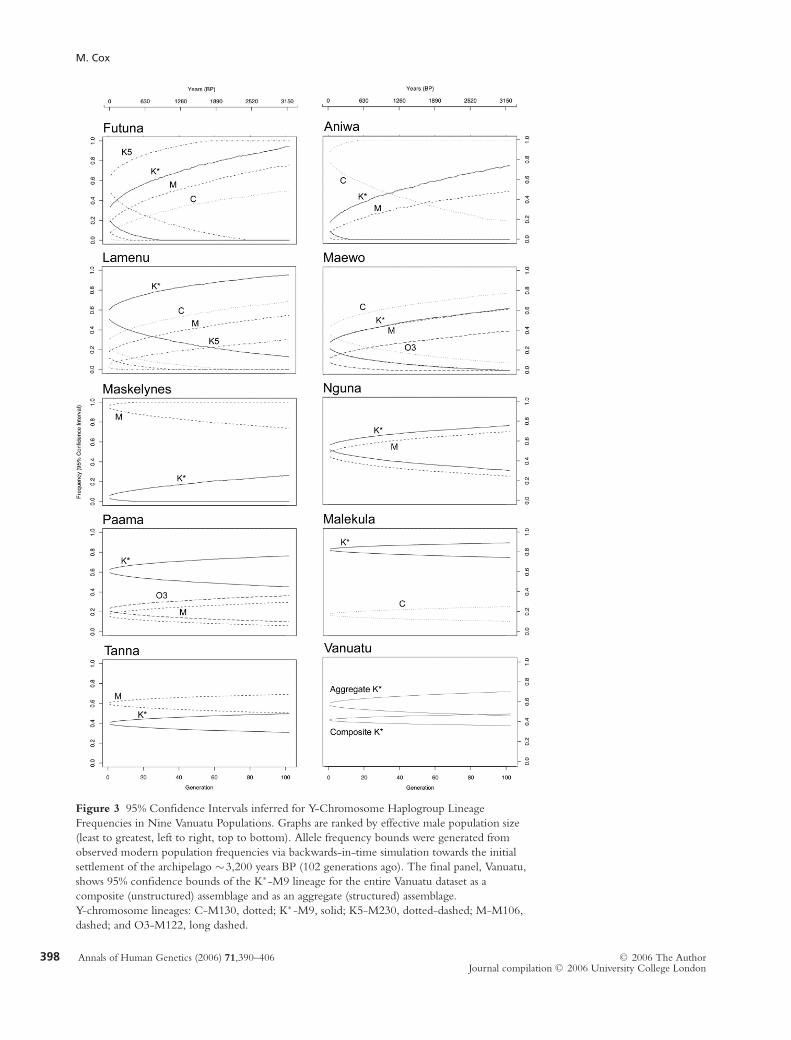
were fitted to each Vanuatu population (Figure 3).
Within the limitations of the simulation model, these
intervals represent the probable frequency range (α =0.05) for a given Y-chromosome lineage at a particu-
lar moment backwards in time. Populations with small
Nm values (e.g. Futuna) have large minimum confidence
bounds, whereas populations with large Nm values (e.g.
Tanna) have smaller minimum confidence bounds. For
instance, even under the simple model implemented
here, we cannot exclude the possibility that Futuna
had a K∗-M9 frequency somewhere within the range
of 0-94% around 3,200 BP, whereas we can suggest
with the same level of confidence that the K∗-M9 fre-
quency on Tanna probably fell within a much tighter
range (31-50%). Population genetic studies typically
treat all samples equally, even though demes with larger
effective population sizes are buffered against genetic
drift and retain more historic information about greater
time depths. As a rough rule of thumb, Y-chromosome
SNP lineages from populations with small census sizes
(<1,000 men) will not be informative about demo-
graphic processes that occurred more than ∼1,000 years
ago. However, given that this relationship is non-linear
with time, larger populations are increasingly informa-
tive about processes further back in the past, just as
smaller populations are even less informative about more
recent historical processes.
Confidence bounds can also nominally be calculated
for the composite Vanuatu dataset as if it were an
unstructured population sample. However, ignor-
ing population subdivision artificially increases the
bias and decreases the variance of composite allele
frequency estimates. Confidence intervals are better
calculated for each sampling location separately, and av-
eraged by weighting against each population’s effective
size (equation 2). The final panel of Figure 3 (Van-
uatu) shows allele frequency bounds inferred for the
K∗-M9 lineage, firstly, assuming an unstructured
composite dataset (lower 95% confidence intervals), and
secondly, accounting for population sizes and K∗-M9
frequencies of the dataset’s constituent groups (upper
95% confidence intervals). Treating the Vanuatu dataset
as a composite sample not only underestimates the true
variance of the data, but also significantly biases inferred
frequency estimates. Such assemblages are notably less
reliable statistically than weighted analyses of their con-
stituent parts, which is problematic because composite
samples are commonly employed in population studies.
Testing for Ancestral Genetic Structure
Homogeneous Founding Populations
Drift and sampling variance can be co-opted to help
determine the certainty of contrasting historical recon-
structions. As an example, we can address the question
of population structure early in the settlement his-
tory of Vanuatu. Modern ni-Vanuatu have both Asian
and Melanesian ancestries, as evidenced by their
Y-chromosome lineages (Table 1; Cox & Lahr 2006), but
little information addresses the nature of early popula-
tion structure. Were the archipelago’s founding popula-
tions genetically heterogeneous, as might be expected
if Vanuatu was settled by distinct immigrant groups
with quite different Asian and Melanesian genetic con-
stitutions? Or were they genetically homogeneous, as
might be expected if Asian and Melanesian admixture
C© 2006 The AuthorJournal compilation C© 2006 University College London
Annals of Human Genetics (2006) 71,390–406 397
M. Cox
Figure 3 95% Confidence Intervals inferred for Y-Chromosome Haplogroup Lineage
Frequencies in Nine Vanuatu Populations. Graphs are ranked by effective male population size
(least to greatest, left to right, top to bottom). Allele frequency bounds were generated from
observed modern population frequencies via backwards-in-time simulation towards the initial
settlement of the archipelago ∼3,200 years BP (102 generations ago). The final panel, Vanuatu,
shows 95% confidence bounds of the K∗-M9 lineage for the entire Vanuatu dataset as a
composite (unstructured) assemblage and as an aggregate (structured) assemblage.
Y-chromosome lineages: C-M130, dotted; K∗-M9, solid; K5-M230, dotted-dashed; M-M106,
dashed; and O3-M122, long dashed.
398 Annals of Human Genetics (2006) 71,390–406 C© 2006 The AuthorJournal compilation C© 2006 University College London

Diachronic Variance in Small Populations
primarily occurred farther north in Melanesia (Hill &
Serjeantson 1989) with only a few already-admixed
founding groups settling the archipelago. To address this
question, minimum confidence bounds were placed on
the level of substructuring likely in the founding popu-
lations by conditioning genetic simulations with either
homogeneous or heterogeneous starting conditions.
After accounting for modern sampling error and ge-
netic drift over 102 generations (∼3,200 years), subdi-
vision in the simulated data was compared to the level
of subdivision observed today. The null hypothesis for
homogeneous founding populations is:
H0: Homogeneous founding populations, FST = 0, are
consistent with the modern observed value of population
subdivision, FST = 0.34.
Nine demes with Nm values equivalent to the sampled
populations were conditioned with weighted experi-
mental allele frequencies (equation 2). Genetic drift was
simulated (10,000 replicates) for each population over
102 generations (∼ 3,200 years), the experimental sam-
ple size (NS) was chosen randomly from the final gen-
eration, and allele frequencies recorded. The aggregate
FST was calculated for each set of Vanuatu replicates,
and the probability of the observed FST value was ascer-
tained by its rank in the distribution of simulated FST
values.
The mean simulated FST (= −3.1×10⁻⁴ ≈ 0) had
a 95% confidence interval distributed about zero (95%
CI [−0.023, 0.033]) suggesting that the subdivision ob-
served in Vanuatu today (FST = 0.34) is highly sig-
nificantly unlikely (p << 0.0001) under a model with
no ancestral structure (Figure 4, FST 0). Simply boot-
strapping the observed experimental data gave identi-
cal results (Figure 4, Resampled). Therefore, drift alone
produces only low levels of population subdivision after
102 generations given homogeneous founding popu-
lations, and the null hypothesis can be discounted in
this instance. Modern ni-Vanuatu men display signifi-
cant demic structure, which is inconsistent with genet-
ically homogeneous founding populations.
Heterogeneous Founding Populations
Alternative hypotheses are those in which genetically
heterogeneous populations founded Vanuatu. Because
there is no a priori reason for assuming a particular level
Figure 4 Distributions of Simulated FST Values. Population
samples bootstrapped (10,000 replicates) using observed allele
frequencies from the composite Vanuatu sample (Resampled),
and FST ranges for simulated population samples (10,000
replicates) after 102 generations (∼3,200 years) of genetic drift
(incorporating final-generation sampling error) starting from
four founding arrangements with variable levels of substructure,
FST = [0, 0.05, 0.10, 0.15]. The lower horizontal lines
demarcate founding FST values, and the uppermost horizontal
line delineates the observed level of population subdivision (FST
= 0.34).
of heterogeneity in the founding populations, a range
of subdivision values were simulated:
H0: Heterogeneous founding populations, FST = [0.05,
0.10, 0.15], are consistent with the modern observed value,
FST = 0.34.
Population sets with desired FST values were chosen
randomly from the experimental data using a dual-step
selection scheme implemented in the statistical pack-
age R. Nine populations with experimental Nm val-
ues were conditioned to give the desired aggregate FST
value. Simulations were run as described above. The
FST value of the experimental data (= 0.34) did not
differ significantly from any of the simulated FST dis-
tributions (Figure 4), even when founding populations
were given only minor levels of subdivision (e.g. initial
FST = 0.05; final FST = 0.22, 95% Confidence Inter-
val [0.095-0.38]). The extent of modern subdivision is
therefore consistent with all of these models. It seems
C© 2006 The AuthorJournal compilation C© 2006 University College London
Annals of Human Genetics (2006) 71,390–406 399
M. Cox
probable that the founding populations of Vanuatu bore
at least low levels of genetic heterogeneity, but consis-
tent with the extreme effects of variance components,
the true extent of ancestral subdivision in Vanuatu can
no longer be reconstructed from the information con-
tent of this dataset.
Discussion
Dissecting the processes behind broad-scale genetic
patterns is currently a major focus in molecular anthro-
pology (e.g. Pinhasi et al. 2005; Thomas et al. 2006).
However, little research has been directed towards re-
constructing the unique population dynamics of small
human communities, even though small populations
are the currency of large demographic processes. The
genetics of small groups are often treated in a similar
fashion to the genetics of large groups, but the role of
variance factors differs markedly between the two. Pop-
ulation genetic studies in many parts of the world,
particularly the Indo-Pacific region, involve limited
sampling from very small human groups (Merriwether
et al. 1999; Cox & Lahr 2006; Friedlaender, 2007). In
this setting, two major variance factors strongly affect
the genetic record: stochastic genetic drift and sampling
error. Studies with significant sampling coverage (e.g.,
for Bali, Indonesia; Karafet et al. 2005) may be less af-
fected by sampling error, just as studies of large popu-
lations (e.g., for Japanese groups; Hammer et al. 2005)
may be less affected by genetic drift. However, vari-
ance from diachronic genetic drift and sampling error is
probably a significant bias for historical reconstructions
of many regions of the world, and are better incor-
porated explicitly into population genetic analyses. In
situations involving small effective population sizes, sig-
nificant population subdivision or suboptimal sampling,
robust reconstructions of prehistory require more than
a synchronic comparison of modern genetic diversity.
Genetic data from archaeological remains, sampled
consistently through time, is one theoretical approach
towards this problem (e.g. Hagelberg & Clegg 1993).
However, regular sampling of ancient DNA is unreal-
istic for most study regions. In practice, ancient DNA
data points are usually sparse, irregularly spaced through
time, unavailable for all geographical regions of inter-
est, extremely expensive, and often restricted solely to
analyses of mitochondrial DNA (but see Pearson, 2006).
Furthermore, the problems of drift and sampling vari-
ance apply equally to all sampling schemes, modern and
archaeological. Although ancient DNA approaches may
be useful in certain circumstances (e.g. Shapiro et al.
2004; Chan et al. 2006), less direct theoretical methods
will generally be necessary to reconstruct recent histor-
ical demography. Deme-based Monte Carlo simulation
represents one viable alternative.
Here, I have illustrated how genetic simulation can in-
corporate diachronic and contemporary variance com-
ponents into standard human population genetic analy-
ses. Minimum confidence limits are subsequently placed
on the magnitude of genetic drift and sampling error ef-
fects for experimentally derived datasets. The software
employed here was developed solely for this aim. Re-
lated programmes, such as PopG (Felsenstein, 2005) and
Populus (Alstad, 2003) are commonly employed for di-
dactic purposes, but cannot readily be conditioned on
real data and have limited utility as inference tools. The
R statistical package (R Project, 2006) has also proved
useful for studies of variance (Thomas et al. 2006), but
requires its user to have relatively sophisticated cod-
ing skills. Consequently, while most genetic studies ac-
knowledge the confounding effects of drift and sampling
error on observed genetic data (often as a one-line state-
ment), the paucity of ready tools leads few to try placing
quantitative bounds on their effects.
The experimental Vanuatu dataset considered here
for illustration contains only a limited number of
Y-chromosome haplogroups (C-M130, K∗-M9, K5-
M230, M-M106, O3-M122, R-M207), but lineage fre-
quencies vary widely even among populations in very
close geographic proximity (Figure 1). The FST value for
the entire Vanuatu dataset implies substantial population
subdivision, but this seems at odds with the archipelago’s
recent settlement. The discrepancy is probably a joint
outcome of three factors: firstly, inaccurate estimates of
lineage frequencies due to sampling error; secondly, di-
vergence from ancestral lineage frequencies over time
through genetic drift; and thirdly, a complex underlying
demographic history. Synchronic comparisons of con-
temporary data cannot disentangle these effects. How-
ever, analysis methods with a diachronic perspective can
help infer the relative contributions of each factor to the
observed modern data, and therefore increase a dataset’s
interpretative power.
400 Annals of Human Genetics (2006) 71,390–406 C© 2006 The AuthorJournal compilation C© 2006 University College London
Diachronic Variance in Small Populations
For example, simulation analyses on the Vanuatu
dataset reinforce two key points. Firstly, the inac-
curacy of observed allele frequencies is greatest for
small sample sizes and intermediate allele frequencies
(Figure 2). Secondly, observed allele frequencies deviate
more from ancestral allele frequencies for communities
with smaller effective population sizes (Figure 3). Given
the aim of reconstructing ancestral information about
a dataset, genetic profiles should be weighted towards
observed genetic profiles from populations with large
effective sizes (e.g. Paama, Malekula, Tanna) rather than
smaller habitation groups (e.g. Futuna, Aniwa, Lamenu).
In fact, by studying communities with different effec-
tive population sizes, it should theoretically be possi-
ble to query a region’s history at different stratigraphic
time depths. Importantly, however, reconstruction of
these variance components requires knowledge of three
variables: the effective population size (Ne), the sample
size (Ns), and the population’s allele frequencies (pa).
The latter two can be determined directly from genetic
data, but effective population sizes are harder to infer
from many datasets. (For instance, they cannot be esti-
mated with any accuracy from the Y-SNP data exam-
ined here). Therefore, census sizes, genealogical history
and other cultural information will prove necessary to
answer many genetic questions, even though this evi-
dence is not usually collated by geneticists. In practice,
surveying communities about parameters of their de-
mographic history are as central to population genetics
analyses as are sample collections.
Assuming such information is available, inference of
confidence bounds for these variance components pro-
vides one approach to more accurately reconstruct a
community’s genetic prehistory. For instance, here we
asked whether founding populations in Vanuatu were
genetically homogeneous or heterogeneous. The for-
mer scenario would fit a model in which Asian and
Melanesian individuals were already substantially ad-
mixed further north in Melanesia (Hill & Serjeantson
1989; Green, 1991, 2003), and the founding popula-
tions in Vanuatu were therefore approaching genetic
homogeneity. The latter scenario would fit a model in
which Asian and Melanesian populations in northern
Melanesia were only partially admixed (or not admixed
at all), and the groups founding Vanuatu were genetically
heterogeneous. This question cannot be answered ar-
chaeologically, or genetically using standard synchronic
analysis methods. Genetic methods that account for
variance components therefore seem obligatory. Within
the limitations of the demographic model, the first Van-
uatu populations were probably not genetically homo-
geneous, although even low levels of ancestral demic
heterogeneity would have been sufficient to produce the
population subdivision observed today. Figure 4 demon-
strates the extreme variance that can be generated even
over short timeframes. One repercussion that is not im-
mediately obvious from standard synchronic analysis is
that genetic studies on human remains from early ar-
chaeological sites (for instance, at Teouma, Efate; Bed-
ford et al. 2006) may well identify a near contemporary
range of Y-chromosome lineages. However, studies of
different archaeological sites from the same time period
should harbor these lineages at quite different frequen-
cies, and the results from one site are unlikely to directly
reflect the genetic profiles of surrounding regions, or
flanking time periods for the site locality. It follows that
the interpretative utility of ancient DNA studies on small
ancestral populations will probably be limited.
Simulation results also suggest that composite allele
frequencies are not well suited to reconstructions of
historic demography. Data from multiple small sampling
locations are often combined to form a larger sample for
analysis purposes. For instance, a Y-chromosome sample
commonly used to represent coastal Papua New Guinea
is really a composite assemblage (Kayser et al. 2003);
it represents individuals from several sampling locations
along the northern and southern coasts of New Guinea
(Stoneking et al. 1990; Kayser et al. 2000). Such struc-
tured datasets have biased allele frequencies and higher
levels of uncertainty than would be expected given their
nominal effective population and sample sizes (Vanuatu;
Figure 3). Corrected levels of uncertainty can be in-
ferred by weighting the uncertainty estimates of individ-
ual demes by their effective population sizes, but this re-
quires knowledge of the composite sample’s constituent
parts (unavailable in this coastal Papua New Guinea
case). All these findings suggest that additional research
on the meta-analysis of population samples with differ-
ent collection schemes, sample and effective population
sizes, and historical demographies are necessary prereq-
uisites for more sophisticated historical reconstructions
from single-locus, particularly haploid, genetic data.
C© 2006 The AuthorJournal compilation C© 2006 University College London
Annals of Human Genetics (2006) 71,390–406 401

M. Cox
Even though the sampling coverage in Vanuatu – 235
individuals out of a census population of 184,000 (or
0.1% of the national total) – is proportionally one of
the best in the region, the uncertainty bounds of ob-
served lineage frequencies are still large for most com-
munities. Simple variance processes, such as genetic drift
and sampling error, have obviously had a large impact
on genetic profiles in modern Vanuatu, which severely
limits the interpretative power of historical construc-
tions made from these particular data. By extension,
the extreme geographical structuring of mtDNA and
Y-chromosome diversity observed in other extant small
communities from Island Melanesia (e.g. Friedlaender
et al. 2005; Scheinfeldt et al. 2006) is often explained
as a relict patchwork of ancient population substruc-
ture. However, although these lineages are undoubtedly
old and have clear regional specificities, their current
spatial arrangement on the landscape far more likely re-
sults from recent demographic events and extreme lev-
els of drift acting in small human groups (cf. Figure 3).
Such strong population structuring is perhaps better in-
terpreted as being very young, which parsimoniously
circumvents many of the discrepancies that otherwise
appear to arise between arguments for ancient struc-
ture and the archaeological and linguistic records (e.g.
Wilder & Hammer 2007). Such interpretive problems
probably affect many human population genetic studies
where sampling sizes are limited and population groups
subdivided, including those from continental regions.
Although the approach used here improves on how
we view and interpret contemporary genetic data, it still
has important limitations. For instance, these simulation
analyses implement an equilibrium model, a represen-
tation of human demography that currently dominates
analytical approaches to human genetic history (Hey
& Machado 2003). However, equilibrium models force
unrealistic constraints on the data (e.g. depending on the
model: no inter-deme migration, no explicit geographi-
cal structure, population size stationary relative to time),
all of which probably bias historical inferences. Such
assumptions may never hold strictly time for human
populations. For instance, migrants move between all
human groups. Conversely, migration cannot be mod-
elled unless estimates of migration rates through time are
available, often from non-genetic sources. Furthermore,
human mobility is probably not linear with time. Migra-
tion may have peaked twice in Vanuatu; once soon after
the founding populations initially diverged while kin
relationships were still strong (Fix, 2004), and again in
the modern period when novel modes of transport and a
common lingua franca (Bislama) facilitated greater inter-
island mobility (see Friedlaender et al. 2005 for interpre-
tations on changing island migration rates). Other more
exceptional factors may also have influenced the popu-
lations under study here, possibly including: fluctuations
in population size (e.g. bottlenecks resulting from intro-
duced diseases and indentured labor in the immediate
post-European contact period; Buxton, 1926; Wawn,
1973; Spriggs, 1997, p. 261; Cox, 2003, p. 140); in-
ternal extinctions and the resettlement of communities
(e.g. following volcanic eruptions or endemic warfare;
Spriggs, 1997, p. 178 ff.); post-founding immigration
into the Vanuatu archipelago from the immediate north
(e.g. from the Solomons or Bismarcks; Cox, 2003, p. 140
ff.); back migrations from Polynesia (e.g. as evidenced by
the O3 lineage’s restricted distribution in the eastern-
most islands of Vanuatu; Figure 1; Spriggs, 1997, p. 187
ff.; Cox, 2003, p. 138 ff.); and extreme variance in male
reproductive rates (e.g. a biological ‘Big Man’ effect;
Eldon & Wakeley 2006). There is not sufficient infor-
mation on these factors in Vanuatu to incorporate them
into simulation models, although they do lend additional
uncertainty to the analyses undertaken here. Neverthe-
less, models are by necessity relatively simple; the real
world is more complex – and decidedly more human.
These simulations were designed solely to capture the
main effects of major variance factors (at which task
they succeed), but the confidence bounds given here
represent only conservative estimates of the stochastic
variation in these populations over time. Still, even the
magnitudes of these major variance components, which
are frequently ignored in historical reconstructions from
genetic data, should by themselves be sufficient cause for
concern.
One approach towards improving reconstructions of
human demography is to adopt non-equilibrium model
systems. Significant progress has also been made on
more sophisticated inference tools, including impor-
tance sampling (Griffiths & Tavare 1995; Stephens &
Donnelly 2000), Markov chain Monte Carlo (Kuhner
et al. 1995; Wilson & Balding 1998), and Bayesian tech-
niques (Beaumont et al. 2002; Beaumont, 2004). These
402 Annals of Human Genetics (2006) 71,390–406 C© 2006 The AuthorJournal compilation C© 2006 University College London

Diachronic Variance in Small Populations
are increasingly being used to address historical genetic
questions (Hey, 2005). However, the price of these im-
proved models is their large parameter space, and the
substantial information content of genetic data required
to implement them. Single loci with a common ge-
nealogical history (such as the NRY or mitochondrial
DNA) cannot meet this requirement, and if future hu-
man population studies wish to reconstruct human his-
tory with greater accuracy than represented here, these
traditional mainstays will have to be abandoned for au-
tosomal loci with unlinked (and therefore statistically
independent) genetic histories.
Regardless, the Monte Carlo simulation approach
employed here provides an intermediary step, through
which additional information about patterns of human
demography over time can be extracted from current
single-locus studies. Simulation approaches can never
infer exact values for demographic parameters (such as
absolute allele frequencies for a given location at a given
moment in prehistory), but they do allow conservative
confidence limits to be placed on the variance compo-
nents of genetic datasets. This exposes the non-trivial
effects of stochastic variance that have influenced the
population genetic profiles we observe today, which in
turn permits historical inferences from a more quanti-
tative, as opposed to qualitative, analytical basis.
Acknowledgements
I wish to thank the individuals and communities from Vanu-
atu whose participation made this study possible, and I of-
fer in return this partial reconstruction of their extraordi-
nary prehistory. I also extend my appreciation to D. Bowden
(Monash University, Australia) and M. Ganczakowski (Queen
Alexandra Hospital, U.K.) for kindly providing access to DNA
samples; F. Mendez (University of Arizona, U.S.A.) for help-
ful discussion; and E. Hagelberg (University of Oslo, Nor-
way) for research support. This work was partially supported
by grants from the Foundation for Research, Science and
Technology (New Zealand), Thor Heyerdahl and the Kon-
Tiki Museum (Norway), the University of Otago Research
Committee (New Zealand); and by the patronage of the
University of Otago (New Zealand) and the University of
Oslo (Norway).
References
Alstad, D. (2003) Populus: Simulations of population biology.
URL: http://www.cbs.umn.edu/software/populus.html.
Beaumont, M. A., Zhang, W. & Balding, D. J. (2002) Approxi-
mate Bayesian computation in population genetics. Genetics
162, 2025–2035.
Beaumont, M. A. (2004) Recent developments in genetic data
analysis: what can they tell us about human demographic
history? Heredity 92, 365–379.
Bedford, S., Spriggs, M. & Wilson, M. (1998) The Australian
National University–National Museum of Vanuatu Archae-
ological Project: a preliminary report on the establishment
of cultural sequences and rock art research. Asian Perspect
37, 165–193.
Bedford, S. (2003) NZAA 2003 Conference Abstract – From
gaps to galore: Lapita sites in Northern Vanuatu. Archaeology
in New Zealand 46, 62–63.
Bedford, S., Spriggs, M. & Regenvanu, R. (2006) Lapita pots
along with the people: preliminary archaeological investi-
gations at the Teouma Lapita site, Efate, Central Vanuatu.
Antiquity In Press.
Buxton, P. A. (1926) The depopulation of the New Hebrides
and other parts of Melanesia. T Roy Soc Trop Med H 19,
420–454.
Byers, J. A. (2005) Surface distance between two points
of latitude and longitude. URL: http://www.wcrl.
ars.usda.gov/cec/java/lat-long.htm.
Cann, R. L. & Lum, J. K. (2004) Dispersal ghosts in Oceania.
Am J Hum Biol 16, 440–451.
Capelli, C., Wilson, J. F., Richards, M., Stumpf, M. P. H., Gra-
trix, F., Oppenheimer, S., Underhill, P., Pascali, V. L., Ko,
T.-M. & Goldstein, D. B. (2001) A predominantly indige-
nous paternal heritage of the Austronesian-speaking peoples
of Insular Southeast Asia and Oceania. Am J Hum Genet 68,
432–443.
Cavalli-Sforza, L. L., Menozzi, P. & Piazza, A. (1994) The
history and geography of human genes. Princeton: Princeton
University Press.
Chan, Y. L., Anderson, C. N. K. & Hadly, E. A. (2006)
Bayesian estimation of the timing and severity of a pop-
ulation bottleneck from ancient DNA. PLoS Genet 2, e59.
Cox, M. P. (2003) Genetic Patterning at Austronesian Contact
Zones. Ph.D. thesis, University of Otago, Dunedin, New
Zealand.
Cox, M. P. (2005a) Drifter: Simulation software for modelling
demography in small Fisher-Wright populations. URL:
http://www.u.arizona.edu/∼mpcox/.
Cox, M. P. (2005b) Indonesian mitochondrial DNA and
its opposition to a Pleistocene era origin of proto-
Polynesians in Island Southeast Asia. Hum. Biol. 77, 179–
188.
Cox, M. P. (2006) Minimal hierarchical analysis of global
human Y-chromosome SNP diversity by PCR-RFLP.
Anthropol Sci 114, 69–74.
Cox, M. P. & Lahr, M. M. (2006) Y-Chromosome
diversity is inversely associated with language affiliation
C© 2006 The AuthorJournal compilation C© 2006 University College London
Annals of Human Genetics (2006) 71,390–406 403
M. Cox
in paired Austronesian- and Papuan-speaking communities
from Solomon Islands. Am J Hum Biol 18, 35–50.
Eldon, B. & Wakeley, J. (2006) Coalescent processes when
the distribution of offspring number among individuals is
highly skewed. Genetics 172, 2621–2633.
Felsenstein, J. (2005) PopG genetic simulation program. URL:
ftp://evolution.gs.washington.edu/pub/popgen/popg.html.
Fenner, J. N. (2005) Cross-cultural estimation of the hu-
man generation interval for use in genetics-based pop-
ulation divergence studies. Am J Phys Anthropol 128,
415–423.
Fix, A. G. (2004) Kin-structured migration: causes and con-
sequences. Am J Hum Biol 16, 387–394.
Forster, P., Torroni, A., Renfrew, C. & Rohl, A. (2001)
Phylogenetic star contraction applied to Asian and Papuan
mtDNA evolution. Mol Biol Evol 18, 1864–1881.
Friedlaender, J., Gentz, F., Friedlaender, F., Kaestle, F., Schurr,
T., Koki, G., Schanfield, M., McDonough, J., Smith, L.,
Cerchio, S., Mgone, C. & Merriwether, D. A. (2005) Mi-
tochondrial genetic diversity and its determinants in Island
Melanesia. In: Papuan Pasts: Cultural, Linguistic and Biologi-
cal Histories of Papuan-Speaking Peoples. Eds. Pawley, A., At-
tenborough, R., Golson, J., & Hide, R. Canberra: Pacific
Linguistics, pp. 693–716.
Friedlaender, J. S. (1975) The Demography, Genetics, and Phenet-
ics of Bougainville Islanders. Cambridge: Harvard University
Press.
Friedlaender, J. S., Gentz, F., Green, K. & Merriwether, D.
A. (2002) A cautionary tale on ancient migration detec-
tion: mitochondrial DNA variation in Santa Cruz Islands,
Solomon Islands. Hum Biol 74, 453–471.
Friedlaender, J. S. (Ed.). (2007). Population Genetics, Linguis-
tics, and Culture History in the Southwest Pacific: A Synthesis.
Oxford: Oxford University Press, In Press.
Gordon, R. G., Jr. (2005) Ethnologue: Languages of the World.
Dallas: SIL International.
Goudet, J. (2005) Hierfstat, a package for R to compute and
test hierarchical F-statistics. Mol Ecol Notes 5, 184–186.
Green, R. C. (1991) The Lapita Cultural Complex: Cur-
rent evidence and proposed models. In: Indo-Pacific Prehis-
tory 1990. Ed. Bellwood, P. S. Canberra and Jakarta: IPPA
and Asosiasi Prehistorisi Indonesia pp. 295–305.
Green, R. C. (2003) The Lapita Horizon and tradition – Sig-
nature for one set of oceanic migrations. In: Pacific Archaeol-
ogy: Assessments and Anniversary of the First Lapita Excavation
(July 1952) Kone, Noumea, 2002. Ed. Sand, C. Noumea:Le
Cahiers de l’Archeologie en Nouvelle-Caledonie, pp. 95–
120.
Griffiths, R. C. & Tavare, S. (1995) Unrooted genealogical
tree probabilities in the infinitely-many-sites model. Math
Biosci 127, 77–98.
Hagelberg, E. & Clegg, J. B. (1993) Genetic polymorphisms
in prehistoric Pacific Islanders determined by analysis of
ancient bone DNA. Proc R Soc Lond, B, Biol Sci 252, 163–
170.
Hammer, M., Karafet, T., Park, H., Omoto, K., Harihara,
S., Stoneking, M. & Horai, S. (2005) Dual origins of the
Japanese: common ground for hunter-gatherer and farmer
Y chromosomes. J Hum Genet 51, 47–58.
Hammer, M. F., Karafet, T. M., Redd, A. J., Jarjanazi,
H., Santachiara-Benerecetti, S., Soodyall, H. & Zegura,
S. L. (2001) Hierarchical patterns of global human Y-
chromosome diversity. Mol Biol Evol 18, 1189–1203.
Hedrick, P. (2005) Large variance in reproductive success and
the Ne/N ratio. Evolution 59, 1596–1599.
Hey, J. & Machado, C. A. (2003) The study of structured
populations–new hope for a difficult and divided science.
Nat Rev Genet 4, 535–543.
Hey, J. (2005) On the number of New World founders: a
population genetic portrait of the peopling of the Americas.
PLoS Biol 3, e193.
Hill, A. V. S. & Serjeantson, S. (1989) The colonization of the
Pacific: a genetic trail. Oxford: Oxford University Press.
Hudson, R. R. (2002) Generating samples under a Wright-
Fisher neutral model of genetic variation. Bioinformatics 18,
337–338.
Hurles, M. E., Nicholson, J., Bosch, E., Renfrew, C., Sykes,
B. C. & Jobling, M. A. (2002) Y chromosomal evidence
for the origins of Oceanic-speaking peoples. Genetics 160,
289–303.
Hurles, M. E., Matisoo-Smith, E., Gray, R. D. & Penny, D.
(2003) Untangling Oceanic settlement: The edge of the
knowable. Trends Ecol Evol 18, 531–540.
Ingman, M. & Gyllensten, U. (2003) Mitochondrial genome
variation and evolutionary history of Australian and New
Guinean Aborigines. Genome Res 13, 1600–1606.
Jobling, M. A. & Tyler-Smith, C. (2003) The human Y chro-
mosome: An evolutionary marker comes of age. Nature Rev
Genet 4, 598–612.
Karafet, T. M., Lansing, J. S., Redd, A. J., Reznikova, S.,
Watkins, J. C., Surata, S. P., Arthawiguna, W. A., Mayer, L.,
Bamshad, M., Jorde, L. B. & Hammer, M. F. (2005) Balinese
Y-chromosome perspective on the peopling of Indonesia:
genetic contributions from pre-Neolithic hunter-gatherers,
Austronesian farmers, and Indian traders. Hum Biol 77, 93–
114.
Kayser, M., Brauer, S., Weiss, G., Underhill, P. A., Roewer,
L., Schiefenhovel, W. & Stoneking, M. (2000) Melanesian
origin of Polynesian Y chromosomes. Curr Biol 10, 1237–
1246.
Kayser, M., Brauer, S., Weiss, G., Schiefenhovel, W., Under-
hill, P. A. & Stoneking, M. (2001a) Independent histories
of human Y chromosomes from Melanesia and Australia.
Am J Hum Genet 68, 173–190.
Kayser, M., Brauer, S., Weiss, G., Underhill, P. A., Roewer,
L., Schiefenhovel, W. & Stoneking, M. (2001b) Correction:
404 Annals of Human Genetics (2006) 71,390–406 C© 2006 The AuthorJournal compilation C© 2006 University College London
Diachronic Variance in Small Populations
Melanesian origin of Polynesian Y chromosomes. Curr Biol
11, 141–142.
Kayser, M., Brauer, S., Weiss, G., Schiefenhovel, W., Un-
derhill, P., Shen, P., Oefner, P., Tommaseo-Ponzetta, M.
& Stoneking, M. (2003) Reduced Y-chromosome, but not
mitochondrial DNA, diversity in human populations from
West New Guinea. Am J Hum Genet 72, 281–302.
Kuhner, M. K., Yamato, J. & Felsenstein, J. (1995) Estimat-
ing effective population size and mutation rate from se-
quence data using Metropolis-Hastings sampling. Genetics
140, 1421–1430.
Long, J. C., Naidu, J. M., Mohrenweiser, H. W., Gershowitz,
H., Johnson, P. L., Wood, J. W. & Smouse, P. E. (1986)
Genetic characterization of Gainj- and Kalam-speaking
peoples of Papua New Guinea. Am J Phys Anthropol 70,
75–96.
Lum, J. K., Jorde, L. B. & Schiefenhovel, W. (2002) Affinities
among Melanesians, Micronesians, and Polynesians: a neu-
tral biparental genetic perspective. Hum Biol 74, 413–430.
Mantel, N. (1967) The detection of disease clustering and a
generalized regression approach. Cancer Res 27, 209–220.
Merriwether, D. A., Friedlaender, J. S., Mediavilla, J., Mgone,
C., Gentz, F. & Ferrell, R. E. (1999) Mitochondrial DNA
variation is an indicator of Austronesian influence in Island
Melanesia. Am J Phys Anthropol 110, 243–270.
Murray-McIntosh, R. P., Scrimshaw, B. J., Hatfield, P. J. &
Penny, D. (1998) Testing migration patterns and estimat-
ing founding population size in Polynesia by using human
mtDNA sequences. Proc Natl Acad Sci USA 95, 9047–9052.
National Statistics Office. (2000) The 1999 Vanuatu National
Population and Housing Census. Port Vila: National Statistics
Office.
Pearson, H. (2006) Neanderthal DNA yields to genome foray.
Nature 441, 260–261.
Pinhasi, R., Fort, J. & Ammerman, A. J. (2005) Tracing the
origin and spread of agriculture in Europe. PLoS Biol 3,
e410.
R Project. (2006) The R project for statistical computing.
URL: http://www.r-project.org/.
Rivers, W. H. R. (1914) The history of Melanesian society. Cam-
bridge: Cambridge University Press.
Rodman, M. (1979) Following peace: Indigenous pacification
of a northern New Hebridean society. In: The Pacification
of Melanesia. Ann Arbor: University of Michigan Press.
Rousset, F. (1997) Genetic differentiation and estimation of
gene flow from F-statistics under isolation by distance. Ge-
netics 145, 1219–1228.
Scheinfeldt, L., Friedlaender, F. R., Friedlaender, J., Latham,
K., Koki, G., Karafet, T., Hammer, M. & Lorentz, J. (2006)
Unexpected NRY chromosome variation in Northern Is-
land Melanesia. Mol Biol Evol 23, 1628–1641.
Scheinfeldt, L., Friedlaender, F. R., Friedlaender, J., Latham,
K., Koki, G., Karafet, T., Hammer, M. & Lorentz, J.
(2006) Unexpected Y chromosome variation in Northern
Island Melanesia. Mol Biol Evol 23, 1628–1641.
Shapiro, B., Drummond, A. J., Rambaut, A., Wilson, M. C.,
Matheus, P. E., Sher, A. V., Pybus, O. G., Gilbert, M. T.
P., Barnes, I., Binladen, J., Willerslev, E., Hansen, A. J.,
Baryshnikov, G. F., Burns, J. A., Davydov, S., Driver, J. C.,
Froese, D. G., Harington, C. R., Keddie, G., Kosintsev, P.,
Kunz, M. L., Martin, L. D., Stephenson, R. O., Storer, J.,
Tedford, R., Zimov, S. & Cooper, A. (2004) Rise and fall
of the Beringian Steppe Bison. Science 306, 1561–1565.
Slatkin, M. (1985) Gene flow in natural populations. Ann Rev
Ecol Syst 16, 393–430.
Spriggs, M. (1997) The Island Melanesians. Oxford: Blackwell
Publishers.
Stephens, M. & Donnelly, P. (2000) Inference in molec-
ular population genetics. J R Statist Soc B 62, 605–
655.
Stoneking, M., Jorde, L. B., Bhatia, K. & Wilson, A. C. (1990)
Geographic variation in human mitochondrial DNA from
Papua New Guinea. Genetics 124, 717–733.
Storz, J. F., Ramakrishnan, U. & Alberts, S. C. (2001) Deter-
minants of effective population size for loci with different
modes of inheritance. J Hered 92, 497–502.
Thomas, M. G., Stumpf, M. P. H. & Harke, H. (2006) Evi-
dence for an apartheid-like social structure in early Anglo-
Saxon England. Proc R Soc B 273, 2651–2657.
Tommaseo-Ponzetta, M., Attimonelli, M., Roberts, M. D.,
Tanzariello, F. & Saccone, C. (2002) Mitochondrial DNA
variability of West New Guinea populations. Am J Phys
Anthropol 117, 49–67.
Trejaut, J. A., Kivisild, T., Loo, J. H., Lee, C. L., He, C. L.,
Hsu, C. J. & Li, Z. Y. (2005) Traces of archaic mitochon-
drial lineages persist in Austronesian-speaking Formosan
populations. PLoS Biology 3, e247.
Underhill, P. A., Passarino, G., Lin, A. A., Marzuki, S.,
Oefner, P. J., Cavalli-Sforza, L. L. & Chambers, G. K.
(2001) Maori origins, Y-chromosome haplotypes and im-
plications for human history in the Pacific. Hum Mutat 17,
271–280.
Wawn, W. T. (1973) The South Sea Islanders and the Queensland
labour trade. Canberra: Australian National University Press.
Whitlock, M. C. & McCauley, D. E. (1999) Indirect measures
of gene flow and migration: FST = 1/(4Nm + 1). Heredity
82, 117–125.
Whyte, A. L., Marshall, S. J. & Chambers, G. K. (2005) Hu-
man evolution in Polynesia. Hum Biol 77, 157–177.
Wilder, J. A. & Hammer, M. F. (2007) Extraordinary popula-
tion structure among the Baining of New Britain. In: Popu-
lation Genetics, Linguistics, and Culture History in the Southwest
Pacific: A Synthesis. Ed. Friedlaender, J. S. Oxford: Oxford
University Press. In Press.
Williams, T. N., Maitland, K., Bennett, S., Ganczakowski,
M., Peto, T. E. A., Newbold, C. I., Bowden, D. K.,
C© 2006 The AuthorJournal compilation C© 2006 University College London
Annals of Human Genetics (2006) 71,390–406 405
M. Cox
Weatherall, D. J. & Clegg, J. B. (1996) High inci-
dence of malaria in α-thalassaemic children. Nature 383,
522–525.
Wilson, I. A. & Balding, D. J. (1998) Genealogical inference
from microsatellite data. Genetics 150, 499–510.
Wright, S. (1931) Evolution in Mendelian populations. Ge-
netics 16, 97–159.
Wright, S. (1951) The genetical structure of populations. Ann
Eugenics 15, 323–354.
Y Chromosome Consortium. (2002) A nomenclature system
for the tree of human Y-chromosomal binary haplogroups.
Genome Res 12, 339–348.
Yang, R. C. (1998) Estimating hierarchical F-statistics. Evolu-
tion 52, 950–956.
Received: 29 May 2006
Accepted: 6 October 2006
406 Annals of Human Genetics (2006) 71,390–406 C© 2006 The AuthorJournal compilation C© 2006 University College London