extreme waves in the southern baltic sea olas gigantes en
TRANSCRIPT

Ciencias Marinas (2016), 42(2): 123–137 C http://dx.doi.org/10.7773/cm.v42i2.2599
o
elslirn
tuhe eu
ly
e iótr lta
iode
an
INTRODUCTION
Freak waves are probably the most dangerous type ofwaves that appear on the ocean surface. Accidents anddamages caused by extreme waves require a better under-standing of the origin and physics of these hazardous waves.Knowledge on freak waves is indispensible for the develop-ment of a warning system against the attack of extremewaves on maritime structures or their impact on ships.
Freak-type waves, usually defined as extreme waves ofheight exceeding twice the significant wave height, are prob-ably one of the most complex phenomena occurring duringextreme storms. Recently, considerable progress has beenmade in modeling of freak waves, their origin, and physicalproperties. Potential mechanisms of the formation of freakwaves are a linear superposition of component waves,wave–current interactions, modulational instability of deep-water wave trains, shallow water effects, crossing seas, andwind effects (Didenkulova and Pelinovsky 2011, Sergeevaet al. 2011, Toffoli et al. 2011, Onorato et al. 2013, Xiao et al.2013). Many theoretical and experimental studies have
Extreme waves in the southern Baltic Sea
Olas gigantes en la parte sur del mar Báltico
Wojciech Sulisz*, Maciej Paprota, Anna Reda
Institute of Hydroengineering of the Polish Academy of Sciences, K
* Corresponding author. E-mail: [email protected]
ABSTRACT. Freak waves are unique phenomena that appear unexpfishermen and yachtsmen, but are also capable of damaging large vessethat provide insight into the origin and physics of freak waves are very set of wave data comprising 19,025 wind-wave records from the southeprevailing conditions of the formation of freak waves. The complex naparameters of freak-wave-prone sea states using a wide set of tools. Tover 12 m high. The study indicates that these hazardous waves maywind-wave measurements are needed to provide more information abowarning system to avoid casualties.
Key words: freak waves, extreme storms, wave records, wind-wave ana
RESUMEN. Las olas gigantes son fenómenos únicos que aparecen inpeligro para pescadores y navegantes, sino que también son capaces depocas las mediciones de campo disponibles que proporcionan informacprincipal de este estudio fue analizar una base de datos de 19,025 regissobre la frecuencia, los parámetros y las condiciones prevalecientes degigantes, se obtuvieron parámetros espectrales y estadísticos de los esestudio mostró un gran número de olas gigantes, incluyendo olas de maltura durante tormentas severas en el mar Báltico. Se requieren medicla física de olas gigantes y eventualmente poder desarrollar un sistema
Palabras clave: olas gigantes, tormentas extremas, registros de oleaje,
123
M
INTRODUCCIÓN
Las olas gigantes probablemente son las olas más peligro-sas que aparecen en la superficie del océano. Debido a losaccidentes y daños que causan es necesario tener un mejorconocimiento del origen y la física de estas olas peligrosas.Este conocimiento es indispensable para poder desarrollar unsistema de alerta contra el impacto de olas extremas contraestructuras marítimas y embarcaciones.
Las olas gigantes, definidas como olas extremas cuyaaltura es más de 2 veces la altura significativa de las olas, sonuno de los fenómenos más complejos que se presentandurante tormentas severas. Recientemente, se han logradoavances considerables en el modelado de olas gigantes, suorigen y sus propiedades físicas. Los mecanismos potencialesde su formación incluyen la superposición lineal de ondas, lainteracción entre olas y corrientes, la inestabilidad modula-cional de trenes de olas de agua profunda, los efectos de aguasomera, mar cruzado y los efectos del viento (Didenkulova yPelinovsky 2011, Sergeeva et al. 2011, Toffoli et al. 2011,Onorato et al. 2013, Xiao et al. 2013). Se han realizado varios
ścierska 7, 80-328 Gdańsk, Poland.
ctedly on the ocean surface. These waves are not only a danger to and offshore and coastal structures. The available field measurementsmited. The main objective of the present study was to analyze a unique Baltic Sea to provide information on the occurrence, parameters, and
re of freak waves was investigated by obtaining spectral and statistical study revealed a large number of freak-type waves, including wavesven exceed 20 m during severe storms in the Baltic Sea. Multi-pointt the physics of freak waves and to eventually develop a prediction or
sis.
speradamente en la superficie del océano. Estas olas no sólo son undañar embarcaciones grandes y estructuras costeras y en alta mar. Sonn sobre el origen y la física de las olas gigantes, por lo que el objetivoos del oleaje en la parte sur del mar Báltico para obtener informacióna formación de éstas. Para estudiar la naturaleza compleja de las olasdos de mar propensos a olas gigantes usando varias herramientas. Elás de 12 m de altura, y que estas olas pueden sobrepasar los 20 m denes de oleaje de distintos sitios para recabar mayor información sobre predicción y advertencia para evitar desgracias.
álisis de oleaje.

Ciencias Marinas, Vol. 42, No. 2, 2016
recently been conducted to extend the understanding of freakwaves (e.g., Onorato et al. 2006; Sulisz and Paprota 2006,2011, 2013; Gramstad and Trulsen 2007; Paplińska-Swerpelet al. 2007; Kharif et al. 2009; Bitner-Gregersen and Toffoli2012; Chabchoub et al. 2012; Adcock and Taylor 2014;Majewski et al. 2014). Further progress in understanding theorigin and physics of freak waves can be achieved by theanalysis of data sets containing reliable wind-wave measure-ments. The problem is that available field measurements thatprovide insight into the origin and physics of freak waves arevery limited. In fact, only few studies based on extreme-wavefield data have been performed in the past (e.g., Chien et al.2002, Mori et al. 2002, Silva et al. 2002, Stansell 2004, Suliszand Paprota 2005, Didenkulova 2010, Montoya et al. 2013).
A unique set of time series of free-surface elevationrecords is available at the Institute of Hydroengineering ofthe Polish Academy of Sciences (IBW PAN), Gdańsk. Itconsists of measurements obtained by Waverider buoys atseveral locations along the southern Baltic Sea. It comprisesmore than 19,025 records including storm conditions. Thedatabase can provide useful information on extreme storms,extreme waves, and wave events, and eventually help tobetter define hazards and protection measures againstextreme situations. The problem is serious because during arecent field campaign in Polish territorial waters an individ-ual wave of 12 m in height was measured at a depth of 20.5 mand the waves in the open sea can be far higher (see, e.g.,Soomere et al. 2008). Measurements of such extremely largefreak-type waves are good arguments to publicize the prob-lem of extreme waves in the Baltic Sea and to conduct moresystematic studies on the origin and physics of freak waves.
In this work, time series of free-surface elevationrecorded by Waverider buoys in the southern Baltic Sea areanalyzed. The main goal of the study is to analyze wind-waverecords from the southern Baltic to provide information onparameters and prevailing conditions of freak wave occur-rence. First, the available data sets are described and extremewave records are defined. The wind-wave records areanalyzed with emphasis on extreme storm features. Then, theanalysis focuses on individual extreme waves and waveevents. The analysis includes a wide range of aspects relatedto extreme storms and individual extreme waves to collect asmuch information as possible on the occurrence and featuresof extreme waves, and to eventually contribute to a futurewarning system. Finally, conclusions arising from theanalysis of wave records are specified.
MATERIALS AND METHODS
The wind-wave records analyzed in this study werecollected by IBW PAN. The measurements of free-surfaceelevation were conducted in the southern part of the BalticSea at the buoy stations located in the vicinity of Lubiatowo(Fig. 1), where the coastline is straight over a long distance.
124
estudios teóricos y experimentales para ampliar el entendi-miento de las olas gigantes (e.g., Onorato et al. 2006; Sulisz yPaprota 2006, 2011, 2013; Gramstad y Trulsen 2007;Paplińska-Swerpel et al. 2007; Kharif et al. 2009; Bitner-Gregersen y Toffoli 2012; Chabchoub et al. 2012; Adcock yTaylor 2014; Majewski et al. 2014). Es posible ampliar aúnmás el conocimiento del origen y la física de las olas gigantesmediante el análisis de bases de datos de mediciones deoleaje confiables. El problema es que son limitadas las medi-ciones de campo disponibles que proporcionan informacióndel origen y la física de las olas gigantes, ya que son pocoslos estudios que se han llevado a cabo con datos de campo(e.g., Chien et al. 2002, Mori et al. 2002, Silva et al. 2002,Stansell 2004, Sulisz y Paprota 2005, Didenkulova 2010,Montoya et al. 2013).
Un conjunto único de series de tiempo de la elevación dela superficie libre del mar está disponible en el Instituto deHidroingeniería de la Academia Polaca de Ciencias (IBWPAN) en Gdańsk. Consiste de mediciones obtenidas conboyas de tipo Waverider en varios sitios en la parte sur delmar Báltico. Contiene más de 19,025 registros, incluyendodatos de las condiciones de tormenta. La base de datosproporciona información útil sobre tormentas severas, olasgigantes y eventos de oleaje, información que eventualmentepermitirá definir mejor los peligros y las medidas de protec-ción contra situaciones extremas. El problema es serio ya quedurante una campaña reciente en aguas territoriales polacasse registró una ola individual de 12 m de altura a una profun-didad de 20.5 m y las olas en mar abierto pueden ser muchomayor (ver, e.g., Soomere et al. 2008). Estas mediciones sonun buen argumento para difundir el problema de las olasgigantes en el mar Báltico y realizar estudios sistemáticos delorigen y la física de éstas.
En este trabajo se analizan las series de tiempo de la ele-vación de la superficie libre del mar registrada medianteboyas Waverider en la parte sur del mar Báltico. El objetivoprincipal del estudio es analizar los registros de oleaje paraproporcionar información de los parámetros y las condicio-nes prevalecientes de las olas gigantes. Primero se describenlos conjuntos de datos disponibles y se definen los registrosde olas gigantes. Las mediciones de oleaje se analizan conénfasis en las características de las tormentas extremas. Elanálisis luego se enfoca en los eventos de oleaje y las olasgigantes individuales. El análisis incluye una amplia gama deaspectos relacionados con tormentas extremas y olas gigantesindividuales para recopilar la mayor cantidad de informaciónposible de la frecuencia y las características de olas extremasy eventualmente poder contribuir a desarrollar un sistema dealerta. Finalmente, se discuten las conclusiones derivadas delanálisis.
MATERIALES Y MÉTODOS
Los registros de oleaje analizados en este estudio fueronrecopilados por IBW PAN. Las mediciones de la elevación

Sulisz et al.: Extreme waves in the southern Baltic Sea
The measurements were performed using a DirectionalWaverider (DWR) buoy. The raw data wave record contains20-min registration of free-surface elevations measured witha frequency of 1.28 Hz. The data were usually collectedevery hour. The measurement periods varied from a few toseveral months. The buoy was deployed 5 km away from theshore at a depth of 20 m. Buoy locations and measurementperiods are provided in Table 1. The wind-wave data setsspecified in Table 1 constitute a unique and valuable sourceof information on wind waves in the southern Baltic Sea.This database is the only available collection of wave mea-surements taken in Polish territorial waters. The total DWRdata set for the period 1996–2002 consists of 19,025 waverecords. The highest individual wave measured in the data setis 7.6 m and the highest significant wave height is 4.0 m. Thewater depth of 20 m and wavelengths corresponding to thetypical peak periods allow the exclusion of shallow waterfreak wave generation mechanisms. In a recent fieldcampaign the DWR buoy measured a huge 12-m-high waveat 20.5 m depth, which provides new arguments for conduct-ing studies on extreme waves and wave events in the BalticSea.
The analysis of the data set requires a selection of criteriato define extreme waves and wave records. The problem is
Figure 1. Southern part of the Baltic Sea and location of the studyarea.Figura 1. Parte sur del mar Báltico y ubicación del sitio demuestreo.
Table 1. Location of buoy (Directional Waverider) stations in thevicinity of Lubiatowo (Poland) and measurement periods.Tabla 1. Ubicación de las estaciones de mediciones con una boyadireccional tipo Waverider en la zona de Lubiatowo (Polonia) y losperiodos de medición.
Latitude, longitude Measurement period
54º51N, 17º48E 28 Oct 1996–27 Feb 1997
54º53N, 17º51E 15 Jan 1998–31 Aug 1999
54º50N, 17º48E 09 Oct 2000–21 Oct 2001
54º51N, 17º50E 30 Aug 2002–04 Dec 2002
12
de la superficie libre del mar se realizaron en la parte sur delmar Báltico, en las estaciones localizadas en la zona deLubiatowo (Fig. 1), donde la línea de costa es recta.
Las mediciones se realizaron con una boya direccionaltipo Waverider (DWR). El registro de los datos brutos con-tiene registros de 20 min de la elevación de la superficie libredel mar medida con una frecuencia de 1.28 Hz. Los datosusualmente fueron recolectados cada hora. Los periodos demedición variaron de unos cuantos a varios meses. La boyaDWR fue instalada 5 km de la costa a una profundidad de20 m. La ubicación de la boya y los periodos de medición semuestran en la Tabla 1. Los conjuntos de datos del oleaje quese presentan en la Tabla 1 constituyen una fuente de informa-ción valiosa del oleaje al sur del mar Báltico. Esta base dedatos es el único conjunto de mediciones de oleaje disponiblepara aguas territoriales polacas. La base de datos total para elperiodo de 1996 a 2002 consiste de 19,025 registros deoleaje. La ola individual más alta en la base de datos es de7.6 m y la mayor altura significativa es de 4.0 m. La profun-didad del agua de 20 m y las longitudes de onda que corres-ponden a los periodos de máxima altura permiten excluir losmecanismos de generación de olas insólitas en aguas some-ras. En una campaña reciente, se registró una ola de 12 m dealtura a 20.5 m de profundidad, lo cual proporciona nuevosargumentos para realizar estudios de olas gigantes y eventosde oleaje extremos en el mar Báltico.
El análisis del conjunto de datos requiere de una selecciónde criterios para definir las mediciones de eventos de oleaje yolas extremas. El problema no es trivial ya que la formacióny propagación de olas gigantes puede depender de factoresque afectan el oleaje, incluyendo la severidad de la tormenta,su duración, variación y dirección, etc. En el presente estu-dio, se escogió la altura significativa de las olas para definirlas olas gigantes, ya que es uno de los parámetros más impor-tantes que se usan para describir el oleaje. De hecho, la alturasignificativa frecuentemente se usa en la descripción y defini-ción de las olas gigantes y en el análisis de la frecuencia deeventos de oleaje extremos y olas gigantes. A partir del estu-dio realizado por el proyecto denominado MaxWave, las olasextremas en el mar Báltico se describen en términos de laaltura máxima (Hmax) y la altura significativa (Hs) de la olacomo sigue (Paprota et al. 2003, Rosenthal y Lehner 2008):
• olas cuya altura es más de 2 veces la altura significativa:Hmax/Hs > 2;
• la altura significativa de las olas es mayor que 1 m:Hs > 1 m.
El umbral de 1 m impuesto para la altura significativa essobrepasado por 4,975 de los registros de olas de tormentas.La aplicación de ambos límites (i.e., Hs > 1 m y Hmax/Hs > 2)arroja 261 registros de olas gigantes. El número de olasgigantes puede ser subestimada si se toma en cuenta loslímites y las desventajas del sistema de medición. De hecho,se subestiman las crestas medidas en condiciones severas
5

Ciencias Marinas, Vol. 42, No. 2, 2016
not trivial because extreme-wave formation and propagationmay depend on factors affecting wind waves, including stormseverity, its duration and variation, storm direction, etc. Inthis study, the significant wave height was chosen to defineextreme waves, because it is one of the most importantparameters used in the description of wind waves. In fact, thesignificant wave height is widely used to describe and defineextreme waves and in the analysis of the occurrence ofextreme waves and wave events. Following the studies con-ducted in the MaxWave project, extreme waves in the BalticSea are defined in terms of the maximum wave height (Hmax)and the significant wave height (Hs) as follows (Paprota et al.2003, Rosenthal and Lehner 2008):
• waves exceeding twice the significant wave height:Hmax/Hs > 2;
• significant wave height is larger than 1 m: Hs > 1 m.
The threshold of 1 m set for significant wave height isexceeded by 4,975 storm wave records. The application ofboth limits (i.e., Hs > 1 m and Hmax/Hs > 2) results in 261extreme wave records. The number of extreme wave recordsmay be underestimated taking into account the limits anddrawbacks of the applied measuring system. In fact, the wavecrests measured during severe conditions are underestimateddue to the quasi-Lagrangian motion of the buoy (Magnussonet al. 1999).
RESULTS
Analysis of extreme storms
First, the results from the statistical analysis of the set ofthe storm and extreme wave records are presented. The rela-tionships between Hmax and Hs for the extreme wave recordsare presented in Figure 2. The number of extreme waverecords corresponding to selected ranges of Hmax and Hs ispresented in the form of histograms.
It is worth noting that one can establish a different set ofconditions to define extreme waves, including the ratio of thewave crest height to wave height, the ratio of the crest heightto trough height, etc. (e.g., Chien et al. 2002). However,many available definitions are more appropriate for definingepisodic waves rather than extreme waves or wave events.Extreme waves considered in the present study can beregarded as the wave events or large waves characterized bythe extreme values of the tail of the statistical probability dis-tribution. This means that the extreme wave height is definedin such a way that it is the largest value among a particularsample of wave heights arbitrarily chosen from the popula-tion of wave heights.
The direction of extreme waves constitutes an importantsource of information on the occurrence of extreme wavesand wave events. Information on the direction of extremewaves, especially if there is any prevailing direction, is
126
debido al movimiento cuasi-lagrangiano de la boya(Magnusson et al. 1999).
RESULTADOS
Análisis de tormentas extremas
Primero se presentan los resultados del análisis estadís-tico del conjunto de datos de las tormentas y olas extremas.La relación entre Hmax y Hs de las olas se muestra en laFigura 2. El número de registros de olas extremas que corres-ponden a intervalos seleccionados de Hmax y Hs se presenta enforma de histogramas.
Cabe mencionar que se puede establecer un conjuntodiferente de condiciones para definir las olas gigantes, inclu-yendo la relación entre la altura de la cresta y la altura de laola, la relación entre la altura de la cresta y la altura de ladepresión, etc. (e.g., Chien et al. 2002). No obstante, variasde las definiciones disponibles son más apropiadas para defi-nir olas episódicas que olas gigantes o eventos de oleajesextremos. En este trabajo las olas extremas pueden conside-rarse como los eventos de oleaje o las olas grandes caracteri-zadas por los valores extremos de la cola de la distribución deprobabilidad estadística. Esto significa que la altura de olaextrema se define de tal forma que es el valor más alto de unamuestra particular de alturas de ola elegida arbitrariamentedel conjunto de datos.
La dirección de las olas extremas es una importantefuente de información sobre la frecuencia de olas gigantes yeventos de oleaje extremos. Cualquier información sobre ladirección de olas extremas, especialmente si hay una direc-ción predominante, es importante desde un punto de vistapráctico. La distribución de las direcciones de tormentas y la
Figure 2. Scatter plot of maximum (Hmax) and significant (Hs)wave heights with histograms for the extreme waves. N = numberof cases.Figura 2. Diagrama de dispersión de las alturas máximas (Hmax) ysignificativas (Hs) de las olas, con histogramas para las olasgigantes. N = número de casos.
Sulisz et al.: Extreme waves in the southern Baltic Sea
th
r
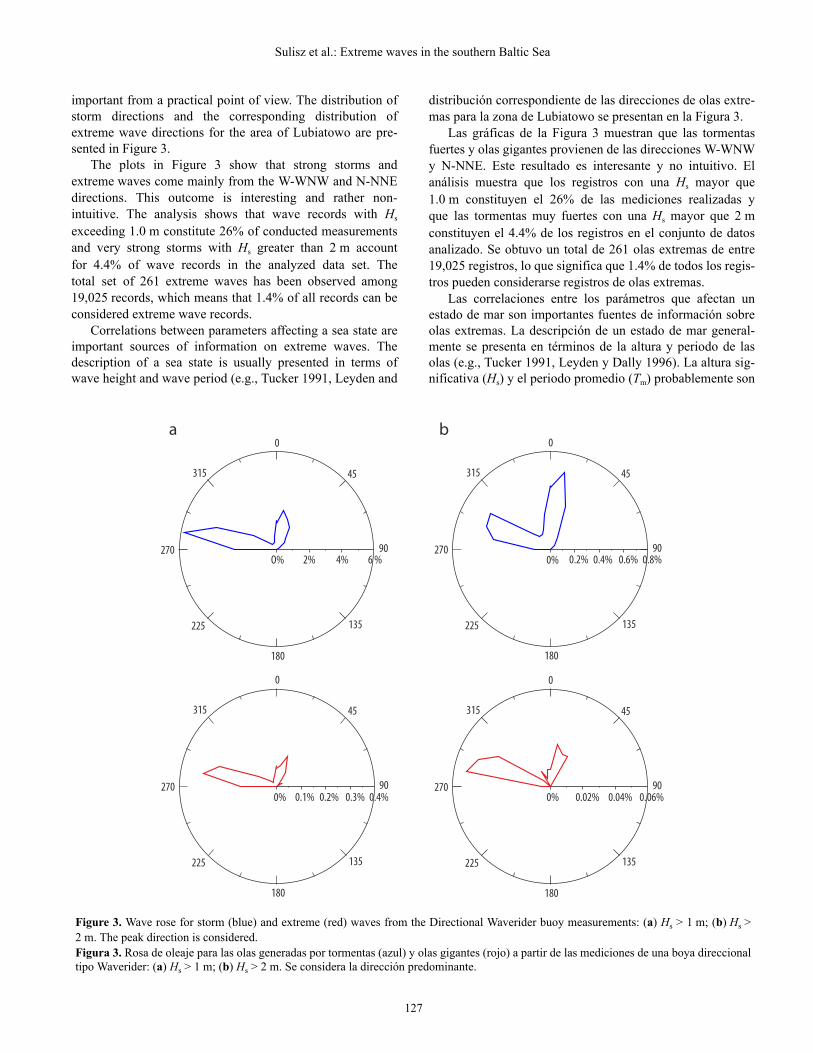
important from a practical point of view. The distribution ofstorm directions and the corresponding distribution ofextreme wave directions for the area of Lubiatowo are pre-sented in Figure 3.
The plots in Figure 3 show that strong storms andextreme waves come mainly from the W-WNW and N-NNEdirections. This outcome is interesting and rather non-intuitive. The analysis shows that wave records with Hs
exceeding 1.0 m constitute 26% of conducted measurementsand very strong storms with Hs greater than 2 m accountfor 4.4% of wave records in the analyzed data set. Thetotal set of 261 extreme waves has been observed among19,025 records, which means that 1.4% of all records can beconsidered extreme wave records.
Correlations between parameters affecting a sea state areimportant sources of information on extreme waves. Thedescription of a sea state is usually presented in terms ofwave height and wave period (e.g., Tucker 1991, Leyden and
Figure 3. Wave rose for storm (blue) and extreme (red) waves from 2 m. The peak direction is considered.Figura 3. Rosa de oleaje para las olas generadas por tormentas (azul) ytipo Waverider: (a) Hs > 1 m; (b) Hs > 2 m. Se considera la dirección p
12
distribución correspondiente de las direcciones de olas extre-mas para la zona de Lubiatowo se presentan en la Figura 3.
Las gráficas de la Figura 3 muestran que las tormentasfuertes y olas gigantes provienen de las direcciones W-WNWy N-NNE. Este resultado es interesante y no intuitivo. Elanálisis muestra que los registros con una Hs mayor que1.0 m constituyen el 26% de las mediciones realizadas yque las tormentas muy fuertes con una Hs mayor que 2 mconstituyen el 4.4% de los registros en el conjunto de datosanalizado. Se obtuvo un total de 261 olas extremas de entre19,025 registros, lo que significa que 1.4% de todos los regis-tros pueden considerarse registros de olas extremas.
Las correlaciones entre los parámetros que afectan unestado de mar son importantes fuentes de información sobreolas extremas. La descripción de un estado de mar general-mente se presenta en términos de la altura y periodo de lasolas (e.g., Tucker 1991, Leyden y Dally 1996). La altura sig-nificativa (Hs) y el periodo promedio (Tm) probablemente son
e Directional Waverider buoy measurements: (a) Hs > 1 m; (b) Hs >
olas gigantes (rojo) a partir de las mediciones de una boya direccionaledominante.
7

Ciencias Marinas, Vol. 42, No. 2, 2016
s
o
Dally 1996). The significant wave height (Hs) and the meanwave period (Tm) are probably the most common parametersused to represent wave height and wave period in a waverecord. Statistics of these parameters can be presented in theform of a bivariate histogram, where the number of cases (N)is presented in a two-dimensional grid. Appropriate Hs–Tm
histograms for the storm wave records (4,974) and theextreme wave records (261) are shown in Figure 4. Theimportant feature of the histogram is the narrow range ofwave periods for high values of Hs, which enables us to esti-mate Tm for extreme sea states. The Tm value for the southernBaltic Sea is about 5 s. The plots show that strong storms arecharacterized by a wider range of Tm values.
A different situation is observed in the bivariate Hs–Tm
histograms plotted for the storm and extreme wave records(Fig. 4). The plots are characterized by a wide range of meanwave lengths (Lm). The range of Lm values is relatively widefor both severe and extreme sea states. The wave lengthswere calculated according to the linear dispersion relation fora given depth and wave period.
Extreme storms are related to higher waves. Wave steep-ness, together with wave height, is often used to representhigher waves. This dimensionless parameter is very popular
Figure 4. Bivariate histograms in terms of significant wave height (Hwave period; Lm = mean wave length; and N = number of cases.Figura 4. Histogramas bivariantes en función de la altura significativay (b) conjunto de datos de olas gigantes. Tm = periodo promedio de las
128
los parámetros más comúnmente usados para representar laaltura y periodo de las olas en un registro de oleaje. La esta-dística de estos parámetros puede presentarse en forma de unhistograma bivariante, donde el número de casos (N) se pre-senta en una cuadrícula bidimensional. En la Figura 4 semuestran histogramas de Hs vs Tm para los registros de olasgeneradas por tormentas (4,974) y los registros de olas extre-mas (261). Un punto importante del histograma es el estrechointervalo de los periodos del oleaje para los valores altos deHs, lo que nos permite estimar Tm para los estados de marextremos. Para el mar Báltico, el valor de Tm sería de alrede-dor de 5 s. Las gráficas muestran que las tormentas fuertesestán caracterizadas por un mayor intervalo de valores de Tm.
Los histogramas bivariantes de Hs vs Tm para los registrosde tormentas y olas extremas muestran otra situación (Fig. 4).Las gráficas se caracterizan por un amplio intervalo de longi-tudes promedio de las olas (Lm). El intervalo de los valores deLm es relativamente amplio tanto para estados de mar severoscomo extremos. Las longitudes se calcularon según la rela-ción de dispersión lineal para una profundidad y periodo deoleaje dado.
Las tormentas se relacionan con olas más grandes, y fre-cuentemente se usa la inclinación de la ola junto con la altura
): (a) storm wave data set and (b) extreme wave data set. Tm = mean
del oleaje (Hs): (a) conjunto de datos de olas generadas por tormentaslas; Lm = longitud promedio de las olas; y N = número de casos.
Sulisz et al.: Extreme waves in the southern Baltic Sea
t
m
lalas.
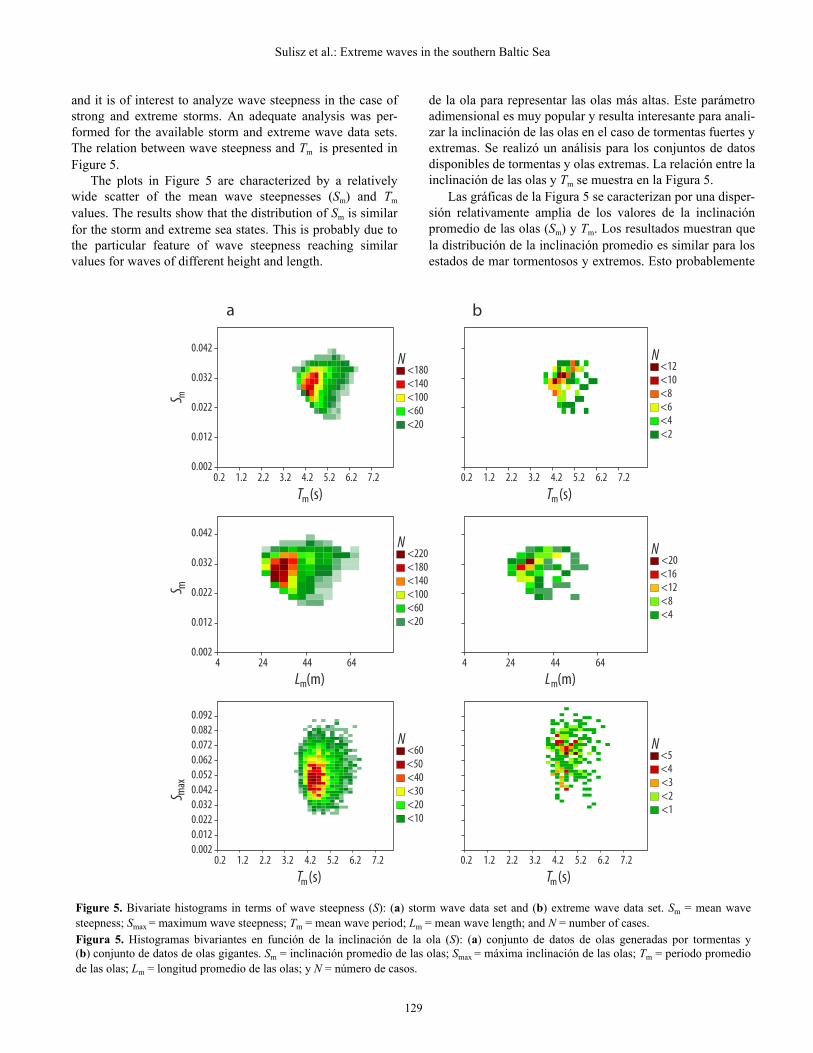
and it is of interest to analyze wave steepness in the case ofstrong and extreme storms. An adequate analysis was per-formed for the available storm and extreme wave data sets.The relation between wave steepness and Tm is presented inFigure 5.
The plots in Figure 5 are characterized by a relativelywide scatter of the mean wave steepnesses (Sm) and Tm
values. The results show that the distribution of Sm is similarfor the storm and extreme sea states. This is probably due tothe particular feature of wave steepness reaching similarvalues for waves of different height and length.
Figure 5. Bivariate histograms in terms of wave steepness (S): (a) ssteepness; Smax = maximum wave steepness; Tm = mean wave period; LFigura 5. Histogramas bivariantes en función de la inclinación de (b) conjunto de datos de olas gigantes. Sm = inclinación promedio de de las olas; Lm = longitud promedio de las olas; y N = número de caso
12
de la ola para representar las olas más altas. Este parámetroadimensional es muy popular y resulta interesante para anali-zar la inclinación de las olas en el caso de tormentas fuertes yextremas. Se realizó un análisis para los conjuntos de datosdisponibles de tormentas y olas extremas. La relación entre lainclinación de las olas y Tm se muestra en la Figura 5.
Las gráficas de la Figura 5 se caracterizan por una disper-sión relativamente amplia de los valores de la inclinaciónpromedio de las olas (Sm) y Tm. Los resultados muestran quela distribución de la inclinación promedio es similar para losestados de mar tormentosos y extremos. Esto probablemente
orm wave data set and (b) extreme wave data set. Sm = mean wave = mean wave length; and N = number of cases. ola (S): (a) conjunto de datos de olas generadas por tormentas ys olas; Smax = máxima inclinación de las olas; Tm = periodo promedio
9

Ciencias Marinas, Vol. 42, No. 2, 2016
A similar situation is observed in the bivariate Sm–Lm
histograms (Fig. 5). It is worth noting that the presentation ofresults in terms of Lm instead of Tm has a limited effect on thefinal plots. Additional information on extreme storm featuresis provided by the bivariate Smax–Lm histograms shown inFigure 5. The results are plotted for the storm and extremewave data sets.
The plots in Figure 5 show a relatively wide scatter of theTm values, as expected from previous analyses. However, theresults show that the maximum wave steepness is far higherfor the extreme wave data set than for the storm wave dataset. The maximum wave steepness for the extreme waverecords may reach the level of about 0.1. A higher value ofwave steepness may serve as an indication of the presence ofextreme waves. It should be emphasized, however, that theabove analysis was performed on the basis of a limited dataset. Thus, the deduced conclusions cannot be generalized atthis stage.
Analysis of individual extreme wave records
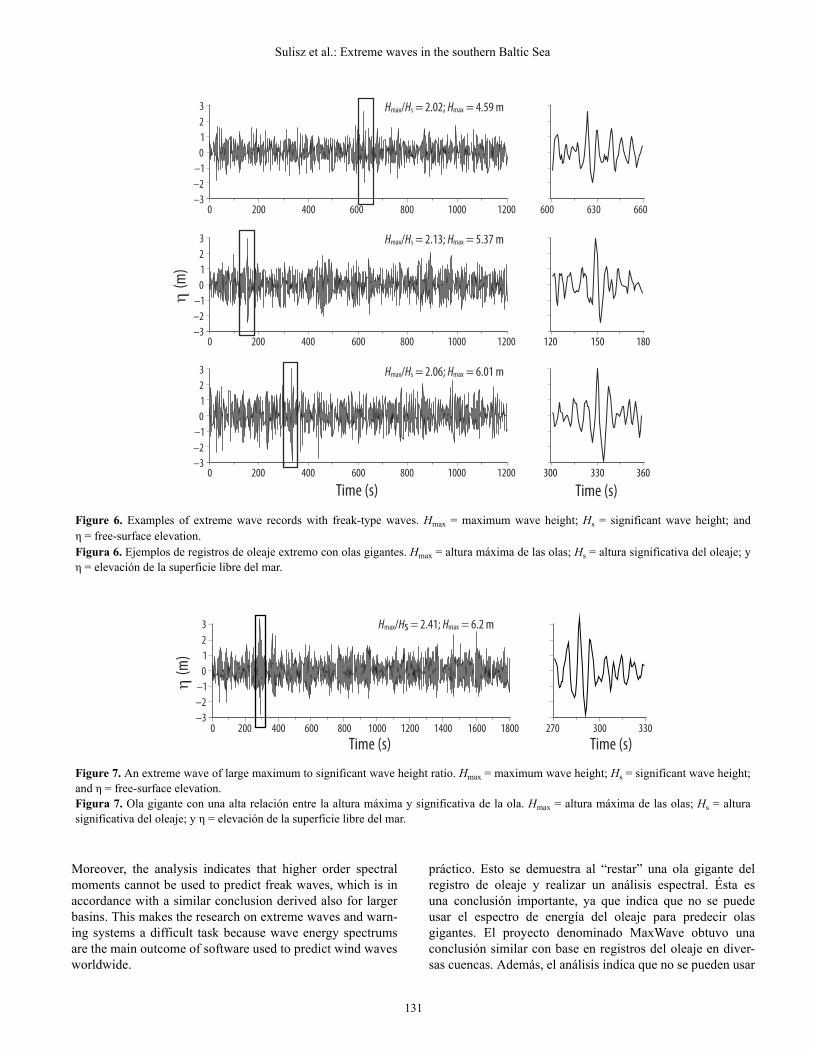
The available data set also provides the possibility of ana-lyzing wave groups, correlation between waves, individualwave shapes, etc. The analysis was performed for extremewave records and focused on records with a high Hmax/Hs
ratio. Typical examples of wave records with high Hmax/Hs
ratios and distinguished freak-type waves are presented inFigure 6. The plots illustrate strong deviations of freak wavesfrom the average sea state. A significant deviation of freak-type waves from the average sea state makes these wavesdangerous even for large vessels.
A successive example of a freak-type wave is shown inFigure 7. This is a particularly interesting case due to theextremely large Hmax/Hs ratio: 2.41; Hs = 2.57 m, Hmax =6.2 m. The wave buoy recorded this freak-type wave during astorm on 14 September 2002. These measurements indicatethat the Hmax/Hs ratio may occasionally reach 3. In fact, simi-lar results have been reported in other studies on freak waves(Stansell 2004). Because Hs during strong storms in theBaltic Sea may reach 10 m, or even higher values underfavorable wave generation conditions (Soomere et al. 2008),freak-type waves during such storms may exceed 20 m.
Freak-type waves have limited effects on wave energyspectrums that are usually multi-peaked, as indicated inFigure 8. Although more studies are required, the analysisconducted on the basis of our recent multi-point field mea-surements and laboratory experiments in a wave flume showsthat the differences between spectrums with and withoutfreak waves are negligibly small from a practical point ofview. This is demonstrated by “subtracting” a freak wavefrom the wave record and conducting a spectral analysis.This is an important conclusion, because it indicates that thewave energy spectrum cannot be used to predict freak waves.A similar conclusion was derived in the MaxWave project onthe basis of wind-wave records from different basins.
130
se relaciona con la característica particular de que la inclina-ción de la ola alcanza valores similares para olas de diferentealtura y longitud.
Se observa una situación similar en los histogramas biva-riantes de Sm vs Lm (Fig. 5). Cabe mencionar que la presenta-ción de los resultados en términos de Lm en vez de Tm tiene unefecto limitado en las gráficas finales. Los histogramas biva-riantes de Smax vs Lm (Fig. 5) muestran información adicionalsobre las características de tormentas extremas. Los resulta-dos se grafican para los conjuntos de datos de olas extremas yde tormentas.
Las gráficas de la Figura 5 muestran una dispersión relati-vamente amplia de los valores de Tm, como se esperaba deanálisis previos; sin embargo, los resultados indican que lamáxima inclinación de las olas es mucho mayor para el con-junto de datos de olas extremas que para el conjunto de datosde olas generadas por tormentas. La inclinación máxima paralos registros de olas extremas puede alcanzar un nivel de~0.1. Un valor de inclinación más alto puede servir como unaindicación de la presencia de olas extremas. No obstante, esimportante mencionar que el análisis se realizó con base enun conjunto de datos limitados. Por lo tanto, las conclusionesdeducidas no pueden generalizarse en este momento.
Análisis de registros de olas gigantes individuales
El conjunto de datos disponible permite analizar gruposde olas, la correlación entre olas, las formas de olas indivi-duales, etc. El análisis se realizó para los registros de olasgigantes y se centró en los registros que mostraban una altarazón Hmax/Hs. En la Figura 6 se muestran ejemplos típicos deregistros con una alta razón Hmax/Hs que distinguen olasgigantes. Las gráficas muestran desviaciones de olas gigantesdel estado de mar promedio. Una desviación importante delas olas gigantes del estado de mar promedio las hace peligro-sas inclusive para embarcaciones grandes.
En la Figura 7 se muestra un ejemplo sucesivo de una olagigante. Éste es un caso particularmente interesante debidoa la muy elevada razón Hmax/Hs: 2.41; Hs = 2.57 m, Hmax =6.2 m. La boya registró esta ola gigante durante una tormentael 14 de septiembre de 2002. Estas mediciones indican que larazón Hmax/Hs puede ocasionalmente alcanzar 3. En otrosestudios de olas gigantes se han obtenido resultados similares(Stansell 2004). Ya que la Hs durante tormentas fuertes en elmar Báltico puede alcanzar los 10 m, o valores más altos encondiciones favorables para la generación de olas (Soomereet al. 2008), las olas gigantes durante tales tormentas puedensobrepasar los 20 m de altura.
Las olas gigantes tienen efectos limitados en los espectrosde energía del oleaje que usualmente tienen picos múltiples,como se indica en la Figura 8. Aunque se requieren más estu-dios, el análisis realizado con base en mediciones de campoen varios sitios, y en experimentos de laboratorio en un canalde oleaje, muestra que las diferencias entre los espectros cony sin olas gigantes son muy pequeñas desde un punto de vista
Sulisz et al.: Extreme waves in the southern Baltic Sea
s.
H
g
s
Moreover, the analysis indicates that higher order spectralmoments cannot be used to predict freak waves, which is inaccordance with a similar conclusion derived also for largerbasins. This makes the research on extreme waves and warn-ing systems a difficult task because wave energy spectrumsare the main outcome of software used to predict wind wavesworldwide.
Figure 6. Examples of extreme wave records with freak-type waveη = free-surface elevation.Figura 6. Ejemplos de registros de oleaje extremo con olas gigantes. η = elevación de la superficie libre del mar.
Figure 7. An extreme wave of large maximum to significant wave heiand η = free-surface elevation.Figura 7. Ola gigante con una alta relación entre la altura máxima ysignificativa del oleaje; y η = elevación de la superficie libre del mar.
13
práctico. Esto se demuestra al “restar” una ola gigante delregistro de oleaje y realizar un análisis espectral. Ésta esuna conclusión importante, ya que indica que no se puedeusar el espectro de energía del oleaje para predecir olasgigantes. El proyecto denominado MaxWave obtuvo unaconclusión similar con base en registros del oleaje en diver-sas cuencas. Además, el análisis indica que no se pueden usar
Hmax = maximum wave height; Hs = significant wave height; and
max = altura máxima de las olas; Hs = altura significativa del oleaje; y
ht ratio. Hmax = maximum wave height; Hs = significant wave height;
ignificativa de la ola. Hmax = altura máxima de las olas; Hs = altura
1

Ciencias Marinas, Vol. 42, No. 2, 2016
=s
Since the work of Longuet-Higgins (1952), the Rayleighdistribution has been applied to describe the distribution ofindividual wave heights. Although the use of the Rayleighdistribution is not the most effective for the assessment ofstatistical properties of freak wave heights, it may serve forcomparisons with the outcome of other studies on the proba-bility of occurrence of extreme waves. The probability ofoccurrence of freak waves can be assessed by applying sev-eral distributions including Weibull, Gumbel, etc. (e.g., Goda2000). In Figure 9, examples are presented of the probabilityof exceedance of waves for empirical data and correspondingresults predicted by the Rayleigh cumulative distribution ofwave heights (H):
The plots in Figure 9 show that for H > 1.5 Hs, the predic-tions from the Rayleigh model become increasingly poor.The Rayleigh distribution underestimates the probability ofexceedance of the largest waves in the extreme wave records,which is in opposition to the common expectation that itover-predicts the probability of occurrence of large waveheights measured in the sea (see, e.g., Stansell 2004). The useof the corrected Rayleigh distribution according to Næss(1985) or the Forristall wave height distribution (Forristall1978) would result in an even larger disagreement in case offreak wave height statistics.
The Rayleigh distribution does not have an upper bound.The probability density decreases exponentially as the waveheight increases, but never becomes zero (Goda 2000).Therefore, the largest wave height is a statistically definedquantity in such a manner that it is the largest value amongthe population of wave heights. Nevertheless, one has to
F H 14--- H
H---- 2
–exp–=
Figure 8. Wave energy spectra corresponding to extreme storms. S(f) Figura 8. Espectros de energía del oleaje correspondientes a tormenta
132
momentos espectrales de mayor orden para predecir olasgigantes, lo que concuerda con una conclusión similar deri-vada para cuencas más grandes. Esto dificulta la investiga-ción de olas gigantes y sistemas de alerta ya que los espectrosde energía del oleaje son el principal producto de los progra-mas de cómputo que se usan globalmente para predecir eloleaje.
A partir del trabajo de Longuet-Higgins (1952), se hausado la distribución de Rayleigh para describir la distribu-ción de las alturas de olas individuales. Aunque el uso de ladistribución de Rayleigh no es la forma más efectiva deevaluar las propiedades estadísticas de las alturas de olasgigantes, puede servir para realizar comparaciones con losresultados de otros estudios en cuanto a la probabilidad deque ocurran olas extremas. La probabilidad de que ocurranolas gigantes puede evaluarse mediante la aplicación devarias distribuciones incluyendo las de Weibull, Gumbel, etc.(e.g., Goda 2000). En la Figura 9 se presentan ejemplos de laprobabilidad de excedencia de olas para datos empíricos y losresultados correspondientes predichos por la distribuciónacumulativa de Rayleigh para la altura de las olas:
Las gráficas de la Figura 9 muestran que para H > 1.5 Hs,las predicciones del modelo de Rayleigh se vuelven máspobres. La distribución de Rayleigh subestima la probabili-dad de excedencia de las olas más grandes en el registro deolas extremas, lo cual es opuesto a la expectativa común deque sobrepredice la probabilidad de excedencia de las alturasde olas grandes medidas en el mar (ver, e.g., Stansell 2004).El uso de la distribución de Rayleigh corregida según Næss(1985) o la distribución de la altura del oleaje de Forristall
F H 14--- H
H---- 2
–exp–=
spectral density and f = frequency.extremas. S(f) = densidad espectral y f = frecuencia.

Sulisz et al.: Extreme waves in the southern Baltic Sea
o
dlt
remember that despite the drawbacks, the Rayleigh distribu-tion and its modifications are widely applied by engineersand scientists and the results of the present study are a sourceof rare information of significant practical importance.
Application of transform techniques
The occurrence of extreme waves or extreme wavegroups is often a highly non-stationary phenomenon. In orderto investigate the structure of such waves, a proper method toanalyze the temporal and spectral characteristics is required.Standard methods used for spectral analysis are inappropriatefor studying non-stationary signals. The wavelet transformmethod has been proven to be an efficient tool in the analysisof extreme waves and extreme wave events. The method pro-vides the wave energy distribution and enables localizing itsimultaneously in the time and frequency domain (see, e.g.,Massel 2001, Chien et al. 2002, Mori et al. 2002). The alter-native time–frequency analysis techniques that could beapplied to evaluate energy in non-stationary wave signals are,for example, the Smoothed Instantaneous Wave EnergyHistory and Hilbert–Huang Transform (see, e.g., Funke andMansard 1980, Huang and Shen 2005, Dong et al. 2015).
The wavelet transform method was applied to analyzeseveral extreme wave records (Fig. 10). The results of theanalysis of a record with extreme waves are presented inFigure 10a and the results of the analysis of an extreme waverecord with more emphasis on wave groups are presented inFigure 10b. Both records refer to extreme storms that are usu-ally characterized by multi-peaked wave energy spectrums.
Figure 9. Probability of exceedance function for the extreme wave recline). F(H) = cumulative distribution and H = wave height.Figura 9. Función de probabilidad de excedencia para el registro empírica (línea discontinua). F(H) = distribución acumulativa y H = a
13
(Forristall 1978) produciría una discordancia aún mayor en elcaso de la estadística de la altura de olas gigantes.
La distribución de Rayleigh no tiene un límite superior.La densidad de probabilidad decrece exponencialmente con-forme aumenta la altura del oleaje, pero nunca llega a sercero (Goda 2000). Por lo tanto, la mayor altura del oleaje esuna cantidad definida estadísticamente de tal manera que esel valor más alto de todas las alturas. No obstante, es necesa-rio recordar que a pesar de las desventajas, la distribución deRayleigh y sus modificaciones son ampliamente usadas poringenieros y científicos, y que los resultados del presenteestudio son una fuente de información de considerableimportancia práctica.
Aplicación de técnicas de transformación
El acontecimiento de olas extremas o grupos de olasextremas frecuentemente es un fenómeno no estacionario.Para investigar la estructura de tales olas se requiere unmétodo apropiado para analizar las características temporalesy espectrales. Los métodos estándar usados para los análisisespectrales no son adecuados para estudiar señales no esta-cionarias. El método de transformación wavelet ha resultadoser una herramienta eficiente en el análisis de olas gigantes yeventos de oleaje extremos. El método proporciona ladistribución de energía del oleaje y permite su localizaciónsimultánea en el dominio del tiempo y la frecuencia (ver, e.g.,Massel 2001, Chien et al. 2002, Mori et al. 2002). Lastécnicas de análisis tiempo–frecuencia alternativas quepodrían usarse para evaluar la energía en señales no estacio-narias son, por ejemplo, el registro instantáneo de energía
rd: Rayleigh distribution (straight line); empirical distribution (dashed
e olas gigantes: distribución de Rayleigh (línea recta); distribuciónura de la ola.
3

Ciencias Marinas, Vol. 42, No. 2, 2016
ow
The plots in Figure 10 show that the wavelet transformmethod detects extreme waves and extreme wave groupsfairly well. A similar conclusion was derived in the Max-Wave project on the basis of other wind-wave records fromthe Baltic Sea (Paprota et al. 2003). Obviously, the possibilityof detecting extreme waves and wave groups is very impor-tant; however, from a practical point of view, we are moreinterested in a tool that can predict such extreme events.
Figure 10. Wavelet transform analysis Figura 10. Análisis de transformación
134
(Smoothed Instantaneous Wave Energy History) y la transfor-mada de Hilbert–Huang (ver, e.g., Funke y Mansard 1980,Huang y Shen 2005, Dong et al. 2015).
Se usó el método de transformación wavelet para analizarvarios registros de olas gigantes (Fig. 10). Los resultados delanálisis de un registro con olas extremas se presentan enla Figura 10a y los resultados del análisis de un registro deoleaje extremo con mayor énfasis en grupos de olas se
f extreme wave records.avelet de registros de olas gigantes.

Sulisz et al.: Extreme waves in the southern Baltic Sea
One should realize that despite some progress that hasbeen made in the studies on freak waves, including presentinvestigations, knowledge on the formation and physics ofextreme waves and wave events is still incomplete. One ofthe problems is the type of available data that are basicallylimited to waves recorded by Waverider buoys, laser altime-ters, and resistance-type wave gauges, and it is difficult toinvestigate the formation of freak waves, study their evolu-tion and spatial characteristics, learn more about theirphysics, etc., from single-point wave records. Models andsimulations derived on the basis of single-point wave recordsoften provide misleading information on freak waves. Thereis an obvious need to conduct more studies on the origin andphysics of extreme waves and wave events. Investigationsshould include multi-point wind-wave measurements to pro-vide more information on the physics of freak waves, whichmay be helpful in developing theoretical models, tools, andfinally warning systems.
DISCUSSION
Freak waves are unique and rare phenomena. They pose athreat to boats and even large vessels, as well as offshore andcoastal structures. The problem is that available field datathat provide insight into the origin and physics of freak wavesare very limited. In the present study, a unique set of wavedata comprising 19,025 wind-wave records from the southernBaltic Sea was analyzed to provide information on the occur-rence, parameters, and prevailing conditions of the formationof freak waves.
The analysis of the wind-wave records revealed a largenumber of extreme wave and wave events, including wavesexceeding 12 m in height. The results show that strongstorms with extreme waves come mainly from the W-WNWand N-NNE. This is an interesting and rather non-intuitiveoutcome. However, a wide range of analyses conducted onwind-wave records do not show any significant effect offreak waves on storm wave characteristics and description.The present analysis shows that a freak-type wave has a weakeffect on wave spectrums, higher-order spectral moments,wave instability indexes, etc., and it is hard to detect or pre-dict it from these quantities, which is challenging, becausethese hazardous waves may exceed 20 m even in the BalticSea. The study implies a need for multi-point wind-wavemeasurements to provide more information about the natureof freak waves.
One should realize that despite considerable progressmade in studies on freak waves, including the progress madein recent years, the mechanisms of the formation and physicsof extreme waves and wave events still require more investi-gation. Available data are basically limited to waves recordedby waveriders, laser altimeters, and resistance-type wavegauges, and it is difficult to investigate the formation of freakwaves, study their evolution and spatial characteristics, learnmore about their physics, etc., from single-point wave
presenta en la Figura 10b. Ambos registros corresponden atormentas extremas que normalmente están caracterizadaspor espectros de energía con varios picos. Las gráficas de laFigura 10 muestran que el método de transformación waveletdetecta olas extremas y grupos de olas extremas bastantebien. El proyecto denominado MaxWave obtuvo una conclu-sión similar con base en otros registros del oleaje del marBáltico (Paprota et al. 2003). Obviamente la posibilidad dedetectar olas y grupos de olas gigantes es muy importante; sinembargo, desde un punto de vista práctico, es de mayor inte-rés encontrar una herramienta que puede predecir eventosextremos.
A pesar de los avances logrados en los estudios de olasgigantes, el conocimiento de la formación y física de talesolas y de eventos de oleaje extremos aún es incompleto. Unode los problemas es que los datos disponibles básicamente selimitan a registros obtenidos con boyas de tipo Waverider,altímetros de láser y medidores de olas de tipo resistencia, yes difícil de estudiar la formación de olas gigantes, su evolu-ción, características espaciales, física, etc., de registros de unsolo punto. Los modelos y simulaciones derivadas a partir delos registros del oleaje de un solo punto frecuentemente pro-porcionan información engañosa. Es necesario realizar másestudios del origen y la física de olas gigantes y eventos deoleaje extremos. Los estudios deberían incluir mediciones deoleaje de distintos sitios para recabar más información sobrela física de las olas gigantes, lo cual podría ayudar a desarro-llar modelos teóricos, herramientas y un sistema de predic-ción y advertencia.
DISCUSIÓN
Las olas gigantes son fenómenos únicos y poco frecuen-tes, y representan una amenaza para los barcos, incluso losgrandes, y para estructuras costeras y en alta mar; sinembargo, los datos de campo que proporcionan informaciónsobre su origen y física son muy limitados. En el presente tra-bajo, analizamos un conjunto de 19,025 registros del oleajeen la parte sur del mar Báltico para recabar información sobrela frecuencia de olas gigantes, sus parámetros y las condicio-nes para su formación.
El análisis mostró que se registraron un número conside-rable de eventos de oleaje extremos y de olas gigantes,incluso olas de más de 12 m de altura. Las tormentas fuertescon olas extremas provienen del W-WNW y N-NNE. Éste esun resultado interesante y no intuitivo. No obstante, variosanálisis de registros del oleaje no muestran efectos significa-tivos de las olas gigantes en las características y descripciónde las olas generadas por tormentas. El presente estudiomuestra que una ola gigante tiene un efecto débil en losespectros de oleaje, momentos espectrales de mayor orden,índices de inestabilidad, etc., y resulta difícil detectarla o pre-decirla de estas cantidades, lo cual es un reto ya que estasolas peligrosas pueden sobrepasar los 20 m de altura inclu-sive en el mar Báltico. El estudio muestra que es necesario
135
Ciencias Marinas, Vol. 42, No. 2, 2016
records. Models and simulations adjusted to single-pointwave measurements are often sources of misleading informa-tion on freak waves. More studies on the origin and physicsof extreme waves and wave events are needed. These studiesshould include multi-point wind-wave measurements to pro-vide more information and eventually develop a predictiontool that can be applied to issue a warning against extremewaves or wave events.
ACKNOWLEDGMENTS
Financial support for this study was provided by theNational Science Centre, Poland, and the Institute of Hydro-Engineering of the Polish Academy of Sciences undercontract No. UMO-2012/05/13/ST8/01833. The authors areindebted to Barbara Paplińska for her valuable contributionsto this study and to Rafał Ostrowski for providing access tocomplementary wind-wave data.
REFERENCES
Adcock TAA, Taylor PH. 2014. The physics of anomalous ('rogue')ocean waves. Rep. Prog. Phys. 77: 105901.
Bitner-Gregersen EM, Toffoli A. 2012. On the probability ofoccurrence of rogue waves. Nat. Hazards Earth Syst. Sci. 12:751–762.
Chabchoub A, Hoffmann N, Onorato M, Akhmediev N. 2012. Superrogue waves: Observation of a higher-order breather in waterwaves. Phys. Rev. X 2: 011015.
Chien H, Kao CCK, Chuang LZH. 2002. On the characteristics ofobserved coastal freak waves. Coast. Eng. J. 44: 301–319.
Didenkulova I. 2010. Shapes of freak waves in the coastal zone ofthe Baltic Sea (Tallinn Bay). Boreal Environ. Res. 16: 138–148.
Didenkulova I, Pelinovsky E. 2011. Rogue waves in nonlinearhyperbolic systems (shallow-water framework). Nonlinearity24: R1.
Dong S, Wang N, Lu H, Tang L. 2015. Bivariate distributions ofgroup height and length for ocean waves using Copula methods.Coast. Eng. 96: 49–61.
Forristall GZ. 1978. On the statistical distribution of wave heights ina storm. J. Geophys. Res. 83: 2353–2358.
Funke ER, Mansard EPD. 1980. On the synthesis of realistic seastates in laboratory flume. In: Proceedings of the 17thInternational Conference on Coastal Engineering ASCE, Vol. 3,pp. 2974–2991.
Goda Y. 2000. Random seas and design of maritime structures.Advanced Series on Ocean Engineering, Vol. 15. WorldScientific, Singapore, 464 pp.
Gramstad O, Trulsen K. 2007. Influence of crest and group lengthon the occurrence of freak waves. J. Fluid Mech. 582: 463–472.
Huang NE, Shen SSP. 2005. Hilbert-Huang Transform and itsapplications. Interdisciplinary Mathematical Sciences, Vol. 5.World Scientific, Singapore, 324 pp.
Kharif C, Pelinovsky E, Slunyaev A. 2009. Rogue Waves in theOcean. Advances in Geophysical and Environmental Mechanicsand Mathematics. Springer-Verlag, Berlin, 216 pp.
Leyden VM, Dally WR. 1996. Probabilistic modeling of long-termwave climate. In: Proceedings of the 25th InternationalConference on Coastal Engineering ASCE, Vol. 1, pp. 808–821.
136
Longuet-Higgins MS. 1952. On the statistical distribution of theheights of sea waves. J. Mar. Res. 11: 245–266.
Magnusson AK, Donelan MA, Drennan WM. 1999. On estimatingextremes in an evolving wave field. Coast. Eng. 36: 147–163.http://dx.doi.org/10.1016/S0378-3839(99)00004-6
Majewski D, Stachurska B, Sulisz W. 2014. Investigation of theeffect of current on the formation of freak waves. In: Applicationof Physical Modelling to Port and Coastal Protection. Book ofProceedings of the 5th International Conference Coastlab 14,Vol. 1, pp. 153–160.
Massel SR. 2001. Wavelet analysis for processing of ocean surfacewave records. Ocean Eng. 28: 957–987.
Montoya RD, Osorio Arias A, Ortiz Royero JC, Ocampo-Torres FJ.2013. A wave parameters and directional spectrum analysis forextreme winds. Ocean Eng. 67: 100–118.
Mori N, Liu PC, Yasuda T. 2002. Analysis of freak wavemeasurements in the Sea of Japan. Ocean Eng. 29: 1399–1414.
Næss A. 1985. The joint crossing frequency of stochastic processesand its application to wave theory. Appl. Ocean Res. 7: 35–50.
Onorato M, Osborne AR, Serio M, Cavaleri L, Stansberg CT. 2006.Extreme waves, modulational instability and second ordertheory: Wave flume experiments on irregular waves. Eur. J.Mech. B/Fluids 25: 586–601.
Onorato M, Residori S, Bortolozzo U, Montina A, Arecchi FT. 2013.Rogue waves and their generating mechanisms in differentphysical contexts. Phys. Rep. 528: 47–89.
analizar mediciones del oleaje en varios sitios para obtenermayor información de la naturaleza de olas gigantes.
A pesar de los avances logrados en los estudios de olasgigantes, el conocimiento de la formación y física de talesolas y de eventos de oleaje extremos aún es incompleto. Losdatos disponibles básicamente se limitan a registros obteni-dos con boyas de tipo Waverider, altímetros de láser ymedidores de olas de tipo resistencia, y es difícil de estudiarla formación de olas gigantes, su evolución, característicasespaciales, física, etc., de registros de un solo punto. Losmodelos y simulaciones derivadas a partir de los registros deloleaje de un solo punto frecuentemente proporcionan infor-mación engañosa. Es necesario realizar más estudios del ori-gen y la física de olas gigantes y eventos de oleaje extremos.Los estudios deberían incluir mediciones de oleaje de distin-tos sitios para recabar mayor información y poder desarrollarmodelos teóricos, herramientas y un sistema de predicción yadvertencia.
AGRADECIMIENTOS
Este trabajo fue apoyado por el Centro Nacional deCiencias, Polonia, y el Instituto de Hidroingeniería de laAcademia de Ciencias de Polonia, bajo el contrato No.UMO-2012/05/13/ST8/01833. Los autores agradecen aBarbara Paplińska su valiosa contribución al estudio y aRafał Ostrowski, quien nos facilitó datos complementarios.
Traducido al español por Christine Harris.

Sulisz et al.: Extreme waves in the southern Baltic Sea
Paplińska-Swerpel B, Paszke Ł, Sulisz W, Bolaños R. 2007.Application of statistical methods for the prediction of extremewave events. J. Hydraul. Res. 46: 314–323.
Paprota M, Przewłócki J, Sulisz W, Swerpel BE. 2003. Extremewaves and wave events in the Baltic Sea. In: Rogue waves:Forecast and Impact on Marine Structures. GKSS PrintingOffice, Geesthacht, Germany
Rosenthal W, Lehner S. 2008. Rogue waves: Results of theMaxWave Project. J. Offshore Mech. Arct. Eng. Trans. ASME130: 21006–21013.
Sergeeva A, Pelinovsky E, Talipova T. 2011. Nonlinear randomwave field in shallow water: Variable Korteweg-de Vriesframework. Nat. Hazards Earth Syst. Sci. 11: 323–330.
Silva R, Govaere G, Salles P, Bautista G, Diaz G. 2002.Oceanographic vulnerability to hurricanes on the Mexicancoast. In: Proceedings of 6th International Workshop on WaveHind Casting and Forecasting (Melbourne), pp. 137–151.
Soomere T, Behrens A, Tuomi L, Nielsen W. 2008. Wave conditionsin the Baltic Proper and in the Gulf of Finland during windstormGudrun. Nat. Hazards Earth Syst. Sci. 8: 37–46.
Stansell P. 2004. Distributions of freak wave heights measured in theNorth Sea. Appl. Ocean Res. 26: 35–48.
Sulisz W, Paprota M. 2005. Analysis of wave parameters in extremewave records. In: Maritime Transportation and Exploitation of
13
Ocean and Coastal Resources. Proceedings of the 12thInternational Congress of the International MaritimeAssociation of the Mediterrenean, Lisbon, Portugal, Vol. 2,pp. 1153–1158.
Sulisz W, Paprota M. 2006. Laboratory investigation of theformation of freak waves. In: Proceedings of the 1stInternational Conference on the Application of the PhysicalModelling to Port and Coastal Protection, Porto, Portugal,pp. 127–138.
Sulisz W, Paprota M. 2011. Modeling of the propagation andevolution of nonlinear waves in a wave train. Arch. Mech. 63:311–335.
Sulisz W, Paprota M. 2013. Modelling of the propagation andtransformation of transient nonlinear waves on a current. ChinaOcean Eng. 27: 579–592.
Toffoli A, Bitner-Gregersen EM, Osborne AR, Serio M, Monbaliu J,Onorato M. 2011. Extreme waves in random crossing seas:Laboratory experiments and numerical simulations. Geophys.Res. Lett. 38: L06605.
Tucker M.J. 1991. Waves in Ocean Engineering, Measurements,Analysis, Interpretation. Ellis Horwood, New York, 431 pp.
Xiao W, Liu Y, Wu G, Yue DKP. 2013. Rogue wave occurrence anddynamics by direct simulations of nonlinear wave-fieldevolution. J. Fluid Mech. 720: 357–392.
Received November 2015,accepted May 2016.
7