ey eurozone forecast - october 2015...ey eurozone forecast october 2015 stability returns and...
TRANSCRIPT

EY Eurozone Forecast October 2015
Stability returns and systemic risks fade

Highlights
4Implications for businesses
6
Foreword
2
Published in collaboration with
Contents
Investors look to the Eurozone as global economic uncertainty persistsCheap labor and low inflation mean it’s time for firms to make key investment decisions. Meanwhile, easier access to credit spurs transactions activity.
“After the summer’s uncertainty, the Eurozone is settling into slow but steady growth.”
Mark Otty, Area Managing Partner, Europe, Middle East, India and Africa
Published on 1 October 2015

Forecast for Eurozone countries
22Detailed tables and charts
43Detailed forecasts for the 19 Eurozone member states.
The data that underpins our analysis, including forecast assumptions and cross-country comparison tables.
October 2015 forecast
14Stability returns and systemic risks fadeLow energy prices, a weak euro and solid export demand are supporting consumer and business confidence, but growth will slow slightly after peaking in 2016.

EY Eurozone Forecast October 2015
Stability returns and systemic risks fade
Download the EY Eurozone Forecast at ey.com/eurozone.
After the summer’s uncertainty, the Eurozone is settling into slow but steady growth.
Foreword
2 EY Eurozone Forecast October 2015

Despite a turbulent summer, the Eurozone has once again emerged intact. The negotiations over Greece’s future had the world on tenterhooks and seemed like they would never end. The single currency zone came as close as perhaps it has ever been to losing a member, but in the end a “Grexit” was avoided. The Eurozone soldiers on. As I write this, Greece has just seen its fifth general election in six years. But hopefully the experience of this summer’s negotiations will have paved the way for more stability for a ravaged country and a shaken currency union.
As the world watched the Greek Government and its creditors fight out a settlement, the papers were full of dire warnings about the contagion that could spread from a Greek exit. But this masked another promising few months in the Eurozone as a whole, which, it’s easy to forget amid talk of exits, has gained two new members in the last two years.
On the upside, consumers and businesses continue to benefit from low energy prices. In addition, consumers are beginning to feel more positive about the prospects of a recovery in the labor market. The weaker euro has continued to be favorable for exporters, and strong performances by the UK and US economies mean that export demand is solid. Against this background, business confidence is improving. The Eurozone as a whole grew by 0.4% in Q2 this year, and we expect the pace to creep up in Q3.
All in all, we expect to see 1.6% GDP growth for the Eurozone in 2015 — as we did in our June report. However, we’ve downgraded slightly our forecast for next year, to 1.8% from 1.9%. And we still expect that this will be the fastest growth rate for some years to come. We see GDP expansion stabilizing at around 1.6%. This is because we think the current recovery is chiefly based on the low energy prices and the weaker euro — and the impact of both these factors is likely to fade from next year.
So rapid growth is unlikely to materialize, and businesses working in Europe should acclimatize themselves to this
“new normal” of slow but steady growth across the Eurozone.
There are plenty of reasons for caution too. The ongoing weakness of many of the emerging economies around the world will dampen trade outside the Eurozone well into the medium term, holding export growth below 4% from 2017 to 2019. Adding to this, the slowdown in China and the recent instability in global financial markets mean that it is very hard to make solid forecasts for export performance.
Throughout the Eurozone, governments are still focused on closing budget deficits. And, as recovery sets in, tax revenues should help facilitate this. But the financial crisis has left a large dent in government coffers and public spending will be restrained for years to come.
A stable overall recovery may have set in and this will mean, on average and over time, that conditions get better for everyone in the Eurozone. However, in the next few years, unemployment will remain a major issue for millions of people across the continent. We expect the jobless rate to fall steadily as the recovery becomes more established, but it will not fall below 10% until 2019. And, as has been well documented, in many countries it will remain much higher than that for the foreseeable future. Having said this, the peripheral countries with the highest rates of unemployment are also those that have made the most aggressive reforms over the crisis years — and whose economies are showing the most promise as a result.
Although unemployment will continue to cause pain, the outlook is still fairly bright. The major risks to the currency zone — fiscal crisis and deflation — have begun to fade. But on the other hand, high government debts are a burden for the whole of the Eurozone and will certainly slow growth.
In the main, I think that businesses, governments and people should be positive about the future of the Eurozone. The migrant crisis that has dominated headlines over the last few months is perhaps a salient reminder that, however much doom and gloom are forecast for the single currency, Europe remains a beacon of hope for many of those suffering economic and physical hardship in other parts of the world.
I hope that you find this edition of the EY Eurozone Forecast a useful and stimulating read. Don’t forget to visit ey.com/eurozone for the latest updates.
Mark OttyArea Managing Partner, Europe, Middle East, India and Africa
3EY Eurozone Forecast October 2015

Highlights
• The Eurozone remains in a “sweet spot”, benefiting from lower energy prices, a more competitive exchange rate and solid demand in the UK and US. It seems likely that GDP will have grown by 0.5% in Q3 2015, up from 0.4% in Q2, and we expect 1.6% expansion for 2015 as a whole. With business confidence improving, investment spending will pick up in 2016, lifting growth to 1.8%. But this will mark the high point of recovery, as growth is then seen at 1.7% in 2017 and easing to 1.5% in the following couple of years, as the boosts from lower energy prices and a weaker euro fade.
• Consumer demand remains a key driver of Eurozone recovery in H2 2015. Renewed weakness in oil prices is providing a second (albeit less substantial) boost to household incomes, while household views of labor market prospects are tentatively improving. We expect consumer spending growth of 1.7% in 2015, the strongest since 2007. However, from 2016 onward, with energy prices recovering, the pace of spending will ease to 1.4%, and 1.3% on average in 2017–19.
• Eurozone exporters posted the strongest year-on-year rate of export growth for four years in Q2 2015, benefiting from both the weaker euro and faster growth in the US and UK. We forecast export growth of 4.8% for the year. Weaker demand in a number of emerging economies will undermine trade prospects in the coming years however, restraining export growth to 4% in 2016, and around 3.4% a year in 2017–19. In addition, forecasts for export growth are subject to greater risk than for some time in the light of mounting uncertainty about the slowdown in China and associated recent financial market volatility.
• As a result of firmer consumer and export demand, profitability is improving for Eurozone firms, with signs this is feeding through to capital spending. Looking ahead, as capacity utilization continues to rise, we expect business investment to accelerate from 2016 onward. Tentative recoveries in housebuilding and public investment will also drive investment growth. Fixed investment growth will become an increasingly important driver of recovery from 2016, picking up from 1.8% in 2015 to 2.4% in 2016, and around 2.6% on average in 2017–19.
• The recovery will mean an increasing share of the work in closing budget deficits will be done by rising tax revenues. But given the extent to which the Eurozone’s debt burden has risen through the crisis years, government spending will remain constrained for some time. We expect only modest growth in current government spending through our forecast — around 1% a year from 2015–19.
• The systemic risks facing the Eurozone — widespread fiscal crisis and deflation — are fading, while the recent agreement between the Eurozone and Greece suggests renewed appetite to compromise on both sides. But the legacy of debt will mean the recovery will be slower than households and firms have been accustomed to. The “new normal” of slower growth need not be regarded as inevitable though — as some Eurozone economies have demonstrated, ambitious reform can boost job creation, spur investment and accelerate the pace of recovery.
4 EY Eurozone Forecast October 2015

Unemployment
2015
11.0%
GDP (annual change)
1.6% 1.8% 1.6%
Exports of goods and services(annual change)
4.8% 4.0% 3.4%
Eurozone forecast by sector (% change)
2015 2016
Manufacturing 1.5 2.1
Agriculture 1.6 1.9
Construction 1.6 1.5
Utilities 1.6 2.1
Trade 1.8 1.9
Financial and business services 1.8 2.1
Communications 2.9 3.5
Non–market services 1.0 0.7
2015 2016 2017–19
2015 2016 2017–19
Inflation
2015
0.2%
2016
1.2%
Fixed investment(annual change)
1.8%
2.4%
2.6%20
1520
1620
17–1
9
5EY Eurozone Forecast October 2015

6 EY Eurozone Forecast October 2015

Implications for businesses:
Investors look to the Eurozone as global economic uncertainty persists
7EY Eurozone Forecast October 2015

Investors look to the Eurozone as global economic uncertainty persists
At long last, things are going well for the Eurozone. Its relative attractiveness as a place to do business is growing, as the economic climate improves and some rival investment destinations lose their shine. The global economy remains in flux. China’s economic rebalancing and a looming interest rate rise in the US have spread uncertainty, while weak commodity prices have contributed to a slowdown in many emerging markets.
In this section, we explore the implications for businesses and governments of five features shaping Eurozone recovery: global economic rebalancing, improving credit availability, falling input costs, low wage growth and inflation, and a healthy flow of new companies to market.
For governments
Growth is good news for governments, since it augments tax receipts and reduces social spending outflows, especially on unemployment benefits. Many governments pared back capital spending to the bone during the crisis years: now it is time to review priorities and launch capital projects that are overdue or that offer a quick payback through efficiency gains.
• Have you revised capital spending priorities?
• Are you seeking opportunities in new technologies to enhance efficient service delivery?
• What policy initiatives can reinforce and accelerate recovery and employment creation?
For businesses
Spain is recovering strongly, with GDP growth of 3.2% on the cards for this year. Portugal has been preoccupied with vital elections but is still picking up pace, and Italy too is at last accelerating. Germany rumbles on; France’s sluggish reforms continue to frustrate. So the first step for firms in Europe is to review the recovery market by market. And to ask what and where the opportunities are for your firm within this emerging and accelerating recovery?
US businesses, historically the Eurozone’s biggest external investors, may now wish to reassess and ramp up their Eurozone investment strategies as spare capacity shrinks. Companies from emerging markets, facing contraction or slowdown at home, may feel the time is right to expand in Europe, making the most of their business models, expertise, or product advantages at a time when Eurozone companies and talent are affordable.
• Is your business positioned to respond to rising Eurozone demand?
• Are you monitoring Eurozone investment opportunities?
• Have you identified your optimal investment locations?
• Do you have the right go-to-market approach at a time when Eurozone consumers are becoming ever more addicted to their mobiles?
Eurozone recovery continues despite global economic rebalancing A weaker euro and solid demand growth in the US and UK have combined to bolster Eurozone exports and growth, reinforcing a nascent economic recovery. It seems likely that Eurozone GDP continued to grow during Q3, reinforcing prospects for annual growth of 1.6% in 2015, rising to 1.8% next year, though perhaps slowing thereafter. Consumer demand remains the main driver of recovery, though businesses may start to contribute. However, the export-led recovery may slow a little after China devalued its currency in August and stock markets slid. China’s economic rebalancing toward stronger growth in services to satisfy domestic consumers is progressing well, but inevitably involves new ways of thinking. But a changing global picture has prompted decision-makers to think again about where and how they should be investing.
8 EY Eurozone Forecast October 2015

Improving access to credit is underpinning recovery and M&A
Banking and capital markets seem more open, foreign direct investment (FDI) has held up well, and mergers and acquisitions (M&A) have accelerated, driven by innovation and sector convergence. Strong corporate liquidity is encouraging US and Japanese buyers to target European companies, while low energy prices are prompting consolidation across the oil and gas sector.
Cheap money is helping. According to the July bank lending survey from the European Central Bank (ECB) changes in lending conditions and increased loan demand continued to support a further recovery in bank credit in the Eurozone during Q2.
Companies were able to borrow on more attractive terms, while credit standards for home-buyers eased considerably. Net loan demand from companies rose 13%, while home-buyer demand surged 49% and demand for consumer credit was up 41%.
Funds are more readily available: banks reported improved access to the money market and to securitization, though fewer retail deposits and less financing from debt securities. It has become notably easier to borrow in Spain, but also in Italy, Germany and France.
Companies are taking advantage of the opportunity to engage in M&A, enabling them to consolidate markets or acquire new capacity or technologies. In early September, the volume of global deals passed US$3t, the highest since 2007. Cross-border deal-making was particularly active in Europe as a race for pan-European scale spreads across many sectors.
For governments
Improved credit availability is likely to drive a housing market recovery in many countries, though more slowly in countries that overbuilt before the crisis. It may increase construction demand and start to push up the cost of public projects. It may also make it still easier for governments to borrow at affordable rates, facilitating a recovery in public investment.
• Have you reviewed borrowing needs and grasped refinancing opportunities?
• Have you revised estimates of project costs?
• Are you augmenting planning and construction supervision resources to avoid bottlenecks?
For businesses
Easing loan conditions have big implications for customer demand and also for balance sheet and treasury management.
• Are you positioned to respond to demand arising from easier credit?
• Have you reviewed the cost of borrowing in-country, and optimized funding for your operations?
• Have you reviewed investment plans and recalibrated returns on investment to take into account improved funding availability?
• Are you tracking potential targets and making the most of M&A opportunities?
• Are you gearing up to respond to rising demand in sectors where credit availability will have the biggest impact, such as housebuilding and refurbishment, car sales, and furnishing and white goods?
9EY Eurozone Forecast October 2015

Investors look to the Eurozone as global economic uncertainty persists
Cheap energy and commodities are spurring the resurgence
At under US$50 per barrel in early September, the price of oil is down 57% from its June 2014 peak. And it looks set to stay low, as US shale producers learn how to cut costs while OPEC countries continue to pump at high levels in their attempt to maintain market share. Prices of copper and iron ore are down around 50% and 70% respectively from their 2011 peaks, and the United Nations Food and Agriculture Organization says food prices are at a six-year low.
For governments
Commodity price cuts stimulate growth and hence tax revenues. But weak prices for agricultural commodities are putting many of Europe’s farmers under pressure. Protests and demands for government intervention have already obliged the French Government to bolster farm aid.
• Are you ensuring public buyers benefit from lower prices?
• Are you monitoring sectors under pressure?
• Are you promoting market-led solutions to producer difficulties?
• Have you considered whether producers will need temporary aid, or how best to provide it?
For businesses
Commodity producers need to cut costs and consolidate; commodity users and consumers must adapt to more affordable inputs.
• Have you assessed the impact of falling commodity costs on your business?
• Are you making the necessary adaptations?
• Will you review supplier contracts to ensure you benefit?
• Have you recast medium-term plans in consequence?
• Have you considered the knock-on effects upon your customers?
10 EY Eurozone Forecast October 2015

Subdued labor costs, but even lower inflation, make investment decisions critical
Hourly labor costs in the Eurozone remain subdued, but vary widely, making location decisions critical to success in many industries. According to the Global Wage Report 2014/15, from the International Labour Organization, wages have scarcely risen in Europe since 2006, while rising on average at over 2% a year worldwide, and at 6% or more in Asia.
Hourly labor costs in the Eurozone averaged about €29 in 2014, up 1.1% from 2013, according to a Eurostat study unveiled in March, but ranged from just over €39 in Belgium and €36 in Luxembourg to only about €6.5 in Latvia and Lithuania. Non-wage costs added just over 26% to employment costs in the Eurozone as a whole, with the highest ratio (of 33%) being in France and the lowest being just under 7% in Malta.
Yet inflation in the Eurozone has been even lower, averaging just 0.4% in 2014 and expected to average 0.2% this year (having been negative in Q1), with the ECB failing to achieve its inflation target of “below, but close to, 2%.”
Strong security issuance confirms a return to “normal” business conditions
Eurozone stock markets have recovered after an early summer dip linked to the crisis in Greece and Chinese devaluation. New share issuance remains strong. In Germany, 15 companies listed on the Frankfurt exchange during the first half of 2015, up from 19 for 2014 as a whole. New listings in the first half of 2015 on Euronext, the largest European exchange, were valued at €61.7b, compared with €57.8b a year earlier.
For governments
• Stable prices and wages are a mixed blessing.
• Stable wages help contain state salary and pension costs, but they also limit increases in tax and insurance receipts.
• Debt repayments remain high, but that matters less — so long as borrowing remains cheap.
For governments
• Structural reforms via privatization are an attractive option.
• Selling assets can help in debt repayment.
• Healthy new issues markets can help investment and growth.
For businesses
• Parts of the Eurozone offer highly competitive labor costs.
• Pressure for wage rises remains weak.
• Overall labor availability is good.
• Production costs are relatively predictable.
• Raising product or service prices is hard.
For businesses
• The new issue pipeline remains strong, including, for instance, the privatization of an Italian core postal service.
• Strong demand will help private equity companies exit investments, and free up funds for reinvestment.
• Companies are finding it easier to reshape or realize other investments.
11EY Eurozone Forecast October 2015

Investors look to the Eurozone as global economic uncertainty persists
Viewpoint
Marc Lhermitte Global Leader, International Location Advisory Services, EY [email protected]
Focus on digital to turbocharge Europe’s improving attractiveness
EY’s attractiveness survey: Europe 2015 found that Europe drew a record 4,341 FDI projects last year, up 10%. Investors rated Europe as the world’s most attractive destination for investment, ahead of China and a resurgent US. And most investors reckoned that Europe’s attractiveness will go on improving over the next five years.
The upsurge in the Eurozone’s appeal is driven by multiple factors, led by a return to economic growth and rising consumer spending, which has underpinned a recovery in business confidence. We have also seen the resolution of key uncertainties — especially over the common currency — and a strong benefit from falls in the price of energy and other commodities. A marked weakening in the euro has also helped in this respect, as it enhanced Europe’s attractiveness as a place to export from.
But when investors look more closely, they find reasons to be somewhat cautious about Europe’s prospects.
Recent developments in China are clearly structural, and will have an impact. But Chinese investment in Europe isn’t yet happening on a large scale. It accounts for only 2%–3% of FDI in countries that are very open to Chinese investment, such as France.
What are the things I really think will shape the future attractiveness of investing in Europe?
The first is the issue of talent. There is a war for talent right now and Europe isn’t winning it. We are exporting too much of our talent to other
places in the world. We also need southern Europe to regain momentum and to feel good about itself again — especially the countries most affected by the current wave of immigration.
But for me, the largest threat is the inadequate momentum behind innovation in Europe. We lack critical mass and the ability to invest together. Individual European countries cannot go it alone. We need them to work together and invest in carefully selected innovation fields — fields that will put Europe and the European economy back on the global stage for the next wave of innovation, for the next wave of disruptive technologies. Europe is not there yet.
There is no Europe-wide telecoms industry, no European internet cluster, no European e-commerce giant. The internet of things (IoT) is developing in Europe, but Europe is a client of the IoT and the digital revolution, not a creator of solutions, services and technologies — and that worries me.
Europe needs to see more entrepreneurship, more innovation, and more digital transformation. Yet Europe doesn’t have the money, the critical mass, or the collaborative tools between countries and companies across borders, and its efforts are still very fragmented compared to the Asian and US giants.
There are fabulous discoveries being made and creative ideas blossoming in Barcelona, Berlin, London and Paris. But the clusters are still too small and too fragile to be deemed worthy of the large amounts of money they need — and there is still a lack of money and structured venture capital. These are the issues we need to address to promote a far-reaching resurgence of investment and growth in Europe.
12 EY Eurozone Forecast October 2015

13EY Eurozone Forecast October 2015

Stability returns and systemic risks fade
14 EY Eurozone Forecast October 2015

Table 1
Forecast for the Eurozone economy (annual percentage changes unless specified) 2014 2015 2016 2017 2018 2019
GDP 0.9 1.6 1.8 1.7 1.5 1.5
Private consumption 0.9 1.7 1.4 1.2 1.3 1.3
Fixed investment 1.3 1.8 2.4 2.8 2.7 2.4
Stockbuilding (% of GDP) –0.1 –0.3 –0.2 0.1 0.2 0.2
Government consumption 0.8 1.1 0.8 0.8 0.9 1.0
Exports of goods and services 3.9 4.8 4.0 3.6 3.4 3.3
Imports of goods and services 4.2 4.8 3.9 3.8 3.7 3.6
Consumer prices 0.4 0.2 1.2 1.5 1.6 1.6
Unemployment rate (level) 11.6 11.0 10.7 10.3 10.0 9.7
Current account balance (% of GDP) 2.1 2.8 2.7 2.5 2.4 2.3
Government budget (% of GDP) –2.4 –2.1 –1.8 –1.4 –1.1 –1.0
Government debt (% of GDP) 91.8 92.8 92.6 91.8 90.6 89.2
ECB main refinancing rate (%) 0.1 0.1 0.1 0.1 0.2 0.5
Euro effective exchange rate (1995 = 100)* 123.6 113.7 112.6 112.6 113.8 115.2
Exchange rate (US$ per €) 1.33 1.11 1.07 1.06 1.09 1.11
*A rise in the effective exchange rate index corresponds to an appreciation of the euro. Source: Oxford Economics.
Eurozone enjoying a “sweet spot” in the second half of 2015
After the turbulence of 2012–13, and the stabilization of 2014, the Eurozone has enjoyed a more encouraging pace of growth through 2015. A stronger dollar and weaker oil prices have been aided by some good policy-making at the Eurozone and domestic levels (in particular the ECB’s asset purchase program and ongoing reform efforts in some economies) and in combination delivered four consecutive quarters of Eurozone GDP growth of 0.4%–0.5% to Q3 2015. With demand looking robust in the Eurozone’s key advanced economy export markets, and renewed easing in oil prices, the outlook for the remainder of the year is positive.
Looking to 2016, the composition of growth should gradually become more balanced, with firms responding to better export and consumer demand to increase capital spending. In turn, this should boost GDP growth from 1.6% this year to 1.8% in 2016. But the prospects for further acceleration in growth are limited — the scale of unemployment in the Eurozone will restrain wage growth at the same time as consumer prices are rising, while in many countries government spending will remain constrained by the need to lower debt. We expect GDP growth of 1.7% in 2017 and, as the cyclical rebound in capital spending starts to ease in 2018–19, the pace will ease back to about 1.5% on average in these years.
Figure 1Contributions to Eurozone GDP growth
Source: Oxford Economics; Haver Analytics.
Forecast
% points
–2.5
–2.0
–1.5
–1.0
–0.5
0
0.5
1.0
1.5
2.0
2.5
2010 2011 2012 2013 2014 2015 2016 2017 2018 2019
Net trade
Government consumption
Stockbuilding
Fixedinvestment
Consumer spending
Exports and consumer spending benefit from global tailwinds
After a long period when global economic developments accentuated the effects of the internal crisis besetting the Eurozone, the past few quarters have seen a realignment of exchange rates, demand conditions and commodity prices. In conjunction with an increasing sense of security about the durability of the single currency area (Greece aside), this has found the Eurozone in something of a “sweet spot” for economic growth in the second half of 2015.
15EY Eurozone Forecast October 2015

Stability returns and systemic risks fade
Eurozone exporters are benefiting from the ongoing adjustment in global currency markets. The ECB’s quantitative easing program, begun in January, has already had a substantial impact on the euro-dollar exchange rate, which has been stable around US$1.10 for most of the past six months. But with the UK expected to start tightening monetary policy in 2016, the euro has weakened by around 10% against sterling. In conjunction with this realignment of exchange rates, demand in the UK and US continues to strengthen — the US posted its strongest annual rate of import growth for four years in Q1 2015, and this eased only modestly in Q2. As a result, Eurozone exports grew by 5.2% in the year to Q2 2015, the strongest since mid-2011, and we expect 4.8% growth for the full year.
Domestically, the collapse in global oil prices through the second half of 2014 boosted the real incomes of Eurozone households by around 1 percentage point in the year to Q1 2015, and there are signs of a similar (though less substantial) boost through the second half of this year. Brent crude in US dollars is down 25% since May and, with a more stable euro, household energy bills are starting to fall again — down 1.1% in July and a further 2.5% in August.
Figure 2Euro-denominated oil price and energy consumer price index (CPI)
Source: Oxford Economics; Haver Analytics.
€/barrel, Brent crude Energy CPI
125
130
135
140
145
150
20
30
40
50
60
70
80
90
100
Jan-13 Jul-13 Jan-14 Jul-14 Jan-15 Jul-15
€ denominated oil (left-hand side)
Energy CPI(right-hand side)
Forecast
Consumers responded to the previous round of oil price falls by picking up their spending substantially — the annual rate of growth in constant-price retail sales reached an eight-year high in Q1 2015 and was stable at this rate in Q2. With consumer confidence remaining at elevated levels through the summer, and energy bills falling again, there seems little reason to expect consumer spending to slow in the final months of the year. We forecast that consumer spending will grow 1.7% for 2015 as a whole, the fastest since 2007.
GDP growth in 2015 will be the fastest since 2011
As a result of robust consumer spending and an improving export climate, we expect GDP to continue to grow by 0.4%–0.5% a quarter in the second half of 2015, yielding 1.6% for the year as a whole. This will mark a third consecutive year of improving economic momentum in the Eurozone since the nadir of the Eurozone crisis in 2012, and the strongest annual outturn since 2011, and a further pickup to 1.8% is forecast for 2016, as investment grows more strongly.
Unfortunately though, without more widespread structural reform in the Eurozone (or additional favorable external shocks) it seems likely that growth will then start to slow in the years ahead, as uneven global growth and a number of Eurozone-specific structural factors weigh on the pace of recovery.
Emerging markets drag on export prospects
The weaker euro has undoubtedly been a welcome relief for Eurozone firms over the past year or so. Yet some countries have done better than others in pursuing new trade opportunities (see box 2). However, with the euro starting to stabilize against both the US dollar and sterling, the main gains from the cheaper euro look increasingly to have materialized already, making demand growth in trading partners the main driver of export growth in the future. And in this respect, prospects are mixed — although demand is growing robustly in many of the Eurozone’s advanced economy trading partners, the world’s major emerging economies are slowing, and some are in crisis.
16 EY Eurozone Forecast October 2015

Developments in the global economy
A rebalancing is occurring in the global economy, with momentum gathering in advanced economies and ebbing in key emergers. The US, UK, Japan and Eurozone economies are all set to grow in 2015, the first such year since 2010. Looking ahead, we expect the average rate of GDP growth in the advanced economies to be 2.1% in 2015–19, more than half a percentage point faster than during 2011–14. By contrast, the emerging economies will grow rather less rapidly than in previous years, at 4.3% in 2015–19 on average, 0.8 percentage points slower than in 2011–14.
Faster growth in the advanced economies is being driven by a range of factors. In the US, oil output has remained robust, in spite of falling prices, as producers have found ever-greater efficiency savings. More generally, consumers and corporate users of energy continue to benefit from lower prices. At the same time, housing market activity continues to recover, and though the stronger dollar is impinging on firms’ expectations of export orders, it is not deterring investment spending. The US should grow by 2.3% in 2015, picking up speed to 2.8% in 2016–17, and easing only a little thereafter.
In the UK, there are tentative signs that the rate of job creation is easing a little, possibly reflecting narrowing spare capacity in the labor market. But at the same time there is some evidence that wages are starting to rise, supporting household spending. Business investment also seems likely to gather pace in 2016, as firms increasingly expand capacity via capital spending, in lieu of scarcer and more expensive labor. We expect the UK to grow by 2.6% in 2015, picking up to 2.8% in 2016, before easing to 2.4% on average in 2017–19.
The Japanese recovery remains tentative — with GDP growth of 1.1% in Q1 2015, followed by a contraction of 0.3% in Q2. Nevertheless, the substantial depreciation of the yen (a result of aggressive quantitative easing) has generated an improved sense of business optimism. Combined with growing consumer confidence, we expect Japanese
GDP growth to pick up from less than 1% in 2015, toward 2% in 2016. However, from 2017 onward, fiscal tightening and demographic factors are likely to constrain growth to around 1% a year.
By contrast, growth in emerging markets is slowing. Growth in China is slowing as construction activity moderates toward more sustainable levels, and the Government aims to rebalance growth toward service sectors (which tend to be less capital-intensive). The International Monetary Fund projects growth in China will ease from 7.4% in 2014, to 6.8% in 2015 and 6.3% in 2016 and 2020, while Oxford Economics expects 6.6% in 2015 and movement toward a “new normal” of around 5.5% in the medium term. Although recent volatility in financial markets poses a risk to current forecasts.
Other major emergers are being impacted by a combination of global economic factors and limited room for countercyclical policy. In both Russia and Brazil, the fall in global oil prices has had a serious impact on government revenues and the exchange rate, necessitating tighter fiscal and monetary policy. In Russia’s case, the impacts are now starting to unwind (the rouble’s depreciation also being partly driven by the earlier impact of economic sanctions). Nevertheless, the Russian economy will contract by more than 3% in 2015 and grow by less than 1% in 2016.
Brazil’s economy is set to contract in both 2015 and 2016, before growing by around 1.5% a year in 2017–19. In both cases, developments in these major emerging markets will weigh on growth in their respective regions. Other oil-exporters are also likely to grow more slowly in the years ahead, as supply growth in both the US and Middle East keep oil prices below US$70 per barrel until 2019.
Meanwhile, the news is by no means all negative in emerging markets. In India, the reform program set out by the new Government has underpinned business confidence. We expect growth to pick up from 7.1% in 2014 to 7.5% in 2015–16, before easing slightly thereafter.
Figure 3GDP growth
Source: Oxford Economics; Haver Analytics.
% per year
0
1
2
3
4
5
6
7
2007–10 2011–14 2015–19
Advanced economies
Emerging economies
Figure 4World oil price
Source: Oxford Economics; Haver Analytics.
Brent crude, US$/barrel
0
20
40
60
80
100
120
140
2008 2009 2010 2011 2012 2013 2014 2015 2016 2017 2018 2019
Forecast
17EY Eurozone Forecast October 2015

Stability returns and systemic risks fade
This is more important than it would have been a few years ago, given the increasing importance of emerging markets as export customers. Capital goods, such as those used in extractive sectors in Russia and Brazil, or in the construction sector in China, have been a particularly important driver of Eurozone exports in recent years. Additionally, consumer goods firms across the continent have benefited from the growing middle class in these countries (and others). Both sectors will find demand conditions in emerging markets tougher in the next few years.
Figure 5Euro exchange rates
Source: Oxford Economics; Haver Analytics.
US$/€ £/€
Dollar/Euro(left-hand side)
£/Euro(right-hand side)
0.5
0.55
0.6
0.65
0.7
0.75
0.8
0.85
0.9
0.95
0.8
0.9
1.1
1.2
1.3
1.4
1.5
1.6
1.7
2006 2008 2010 2012 2014 2016 2018
Forecast
As such, with the euro remaining at exchange rates below US$1.10 and £0.75 throughout our forecast (compared with US$1.33 and £0.81 on average in 2014), it seems that 2015 will be the high-water mark for export growth during the Eurozone recovery. We forecast that exports will grow by 4% in 2016, easing to 3.6% in 2017, as growth in the advanced economies slows, and then 3.4% on average in 2018–19.
Household spending reliant on modest wage growth
As energy prices stabilize in the final months of this year, and with modest increases in oil prices likely through 2016 (see box 2 for our view on oil prices and the global economic outlook more generally) the boost from lower utility bills will turn to a moderate drag on real incomes. Household spending power will then become more reliant on rising nominal incomes, and in particular, labor market prospects. Recent news in this respect has been positive, with the Eurozone unemployment rate down by 0.5 percentage points over the past year, and rather more in countries such as Ireland, Portugal, Spain, and the Baltics.
Figure 6Change in unemployment rate in past year
Source: Oxford Economics; Haver Analytics.
% point change in unemployment rate, 12 months to Q2 2015. Data for Austria, Estonia, Grece, Italy and Latvia is 12 months to Q1 2015.
Lith
uani
a
Spai
n
Port
ugal
Irel
and
Latv
ia
Esto
nia
Slov
akia
Gre
ece
Net
herla
nds
Slov
enia
Euro
are
a
Luxe
mbo
urg
Ger
man
y
Mal
ta
Italy
Aus
tria
Cypr
us
Fran
ce
Belg
ium
Finl
and
–3.0
–2.5
–2.0
–1.5
–1.0
–0.5
0.0
0.5
1.0
1.5
Furthermore, the European Commission’s monthly business survey shows employment intentions in the service and construction sectors continuing to improve through the summer of 2015. The survey evidence is more mixed for manufacturing firms. We expect the Eurozone to continue creating jobs in the quarters ahead. We forecast that the Eurozone unemployment rate will fall from 11.1% in June, to 10.9% by the end of 2015 and 10.6% by the end of 2016. The country breakdown will continue to show a very wide range, from below 5% in Germany to over 26% in Greece.
18 EY Eurozone Forecast October 2015

The improvement in the labor demand will certainly boost household incomes. But the benefit will be muted by the fact that wage growth will be constrained by the availability of spare labor. The average earnings of those in work will grow by around 2%–2.5% per annum in the years to come. With inflation set to recover over the coming years (albeit to rates short of the ECB’s target of “below, but close to, 2%”) as firms become slightly more confident about pricing power and energy costs stabilize and then edge up, this means real wage rises of just 0.5%–1% over the medium term.
As a result, we expect rather slower growth in consumer spending in the years ahead than during a “normal” economic recovery. Indeed, without any further boost from falling energy bills, we expect consumer spending to grow by just 1.4% in 2016, easing to 1.3% on average in 2017–19.
Capital spending to play an increasing role in recovery
On a more positive note, capital spending (by firms, households and governments) should strengthen in the coming couple of years, providing a stimulus to the pace of recovery. Total capital investment is forecast to grow by 2.4% in 2016, significantly faster than this year, before picking up further to 2.8% in 2017 and then averaging 2.5% in 2018–19.
With domestic and external demand picking up through recent quarters, capacity utilization has started to move back toward “normal” levels, although with notable differences across sectors and economies. Nevertheless, with greater certainty about future demand, and improving access to finance, we expect firms to increase investment spending more aggressively. After growing by 2.3% in 2015, business investment should grow by closer to 3% in 2016 and a little faster than this in 2017.
Figure 7Contributions to Eurozone investment growth
Source: Oxford Economics; Haver Analytics.
% point contribution
Forecast
–4
–3
–2
–1
0
1
2
3
4
2010 2011 2012 2013 2014 2015 2016 2017 2018 2019
Housing
Business
Government
Alongside this, housing demand and construction will begin to recover. By and large, the economies where housing-market busts were most severe — Ireland and Spain in particular — are the same economies that have made the greatest strides in improving competitiveness and the environment for job creation. So even though housebuilding in such countries will remain well below the levels seen prior to the crisis (and in all likelihood may never regain these levels), there will be a rebound in the coming few years. Investment in housing stock should grow by 1.7% in 2016, the first increase since 2007, picking up a little pace toward 2% by the end of the decade.
Table 2
Forecast for the Eurozone by sector (annual percentage changes in gross added value)2014 2015 2016 2017 2018 2019
Manufacturing 1.3 1.5 2.1 2.0 1.7 1.4
Agriculture 2.4 1.6 1.9 1.6 1.3 1.1
Construction –0.8 1.6 1.5 1.5 1.5 1.6
Utilities –2.8 1.6 2.1 1.7 1.4 1.3
Trade 1.5 1.8 1.9 1.8 1.6 1.5
Financial and business services 1.1 1.8 2.1 2.0 1.8 1.7
Communications 1.2 2.9 3.5 3.4 3.0 2.8
Non-market services 0.8 1.0 0.7 0.8 0.8 0.9
Source: Oxford Economics.
19EY Eurozone Forecast October 2015
Stability returns and systemic risks fade
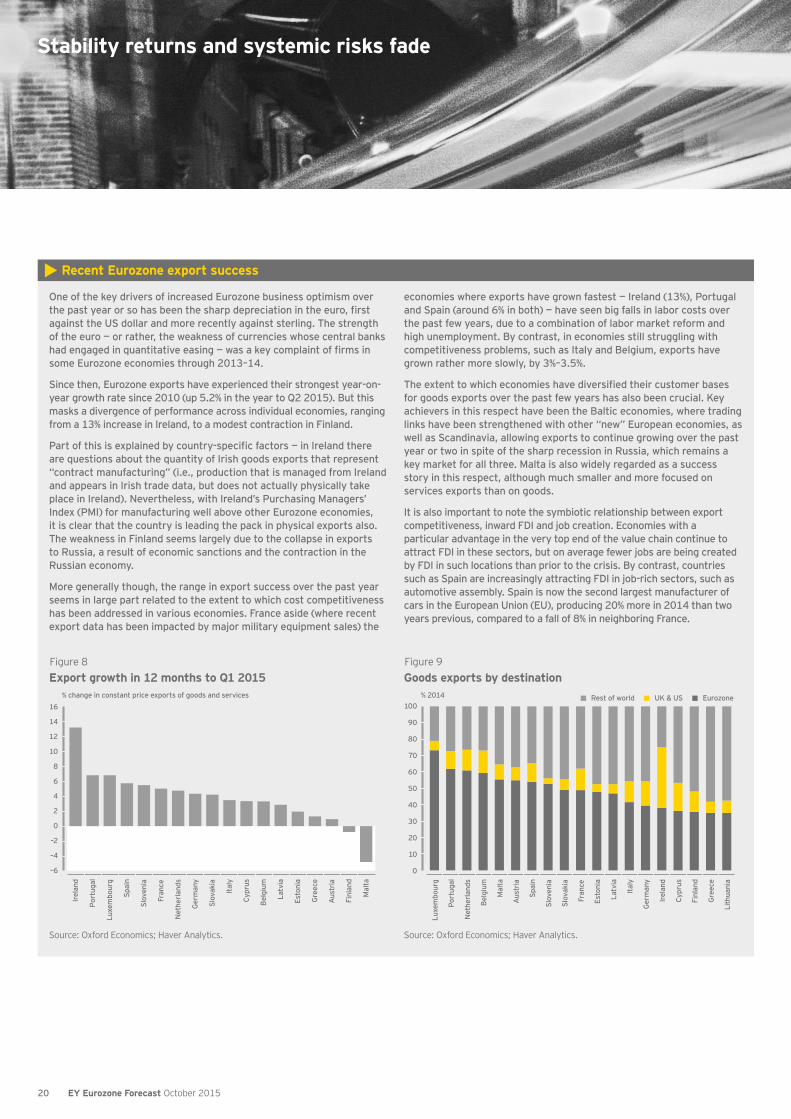
One of the key drivers of increased Eurozone business optimism over the past year or so has been the sharp depreciation in the euro, first against the US dollar and more recently against sterling. The strength of the euro — or rather, the weakness of currencies whose central banks had engaged in quantitative easing — was a key complaint of firms in some Eurozone economies through 2013–14.
Since then, Eurozone exports have experienced their strongest year-on-year growth rate since 2010 (up 5.2% in the year to Q2 2015). But this masks a divergence of performance across individual economies, ranging from a 13% increase in Ireland, to a modest contraction in Finland.
Part of this is explained by country-specific factors — in Ireland there are questions about the quantity of Irish goods exports that represent “contract manufacturing” (i.e., production that is managed from Ireland and appears in Irish trade data, but does not actually physically take place in Ireland). Nevertheless, with Ireland’s Purchasing Managers’ Index (PMI) for manufacturing well above other Eurozone economies, it is clear that the country is leading the pack in physical exports also. The weakness in Finland seems largely due to the collapse in exports to Russia, a result of economic sanctions and the contraction in the Russian economy.
More generally though, the range in export success over the past year seems in large part related to the extent to which cost competitiveness has been addressed in various economies. France aside (where recent export data has been impacted by major military equipment sales) the
economies where exports have grown fastest — Ireland (13%), Portugal and Spain (around 6% in both) — have seen big falls in labor costs over the past few years, due to a combination of labor market reform and high unemployment. By contrast, in economies still struggling with competitiveness problems, such as Italy and Belgium, exports have grown rather more slowly, by 3%–3.5%.
The extent to which economies have diversified their customer bases for goods exports over the past few years has also been crucial. Key achievers in this respect have been the Baltic economies, where trading links have been strengthened with other “new” European economies, as well as Scandinavia, allowing exports to continue growing over the past year or two in spite of the sharp recession in Russia, which remains a key market for all three. Malta is also widely regarded as a success story in this respect, although much smaller and more focused on services exports than on goods.
It is also important to note the symbiotic relationship between export competitiveness, inward FDI and job creation. Economies with a particular advantage in the very top end of the value chain continue to attract FDI in these sectors, but on average fewer jobs are being created by FDI in such locations than prior to the crisis. By contrast, countries such as Spain are increasingly attracting FDI in job-rich sectors, such as automotive assembly. Spain is now the second largest manufacturer of cars in the European Union (EU), producing 20% more in 2014 than two years previous, compared to a fall of 8% in neighboring France.
Recent Eurozone export success
Figure 8Export growth in 12 months to Q1 2015
Source: Oxford Economics; Haver Analytics.
% change in constant price exports of goods and services
–6
–4
–2
0
2
4
6
8
10
12
14
16
Irel
and
Port
ugal
Luxe
mbo
urg
Spai
n
Slov
enia
Fran
ce
Net
herla
nds
Ger
man
y
Slov
akia
Italy
Cypr
us
Belg
ium
Latv
ia
Esto
nia
Gre
ece
Aus
tria
Finl
and
Mal
ta
Figure 9Goods exports by destination
Source: Oxford Economics; Haver Analytics.
% 2014
0
10
20
30
40
50
60
70
80
90
100
Luxe
mbo
urg
Port
ugal
Net
herla
nds
Belg
ium
Mal
ta
Aus
tria
Spai
n
Slov
enia
Slov
akia
Fran
ce
Esto
nia
Latv
ia
Italy
Ger
man
y
Irel
and
Cypr
us
Finl
and
Gre
ece
Lith
uani
a
Rest of world UK & US Eurozone
20 EY Eurozone Forecast October 2015

Finally, it also seems likely that, with the era of emergency austerity increasingly in the past, governments can now start to address the shortfall in public investment caused by sharp spending cuts (the brunt of which was borne by capital spending in many economies). The case for public investment is augmented by the availability of long-term financing at nearly record-low interest rates, even for economies where public debt is over 100% of GDP. As such, after falling a further 0.6% in 2015 (a sixth consecutive annual fall) we expect capital spending by governments to increase 1.8% in 2016, 2.9% in 2017 and around 2.5% in the following couple of years.
Emergency austerity may be over, but fiscal restraint is here to stay
With the Eurozone economy now in recovery mode, more of the work in bringing government budgets back into balance should increasingly be done by rising tax revenues and less by spending cuts. Lower borrowing costs (and therefore lower interest payments on debt) will provide an additional source of relief to cash-strapped governments. Nevertheless, with government debt burdens over 100% of GDP on the Maastricht measure in eight Eurozone economies, there remains little room for growth in public spending. Current government spending should rise by just over 1% in 2015 (0.3 percentage points faster than in 2014) and by about the same in the years to 2019.
Figure 10Government debt-to-GDP ratios
Source: Oxford Economics; Haver Analytics.
%
0
20
40
60
80
100
120
140
160
180
200
Esto
nia
Luxe
mbo
urg
Latv
ia
Lith
uani
a
Slov
ak R
epub
lic
Finl
and
Mal
ta
Net
herla
nds
Ger
man
y
Slov
enia
Aus
tria
Fran
ce
Irel
and
Spai
n
Belg
ium
Cypr
us
Port
ugal
Italy
Gre
ece
“New normal” demands further ambition to improve prospects
At 1.6% in 2015, 1.8% in 2016, and an average of 1.6% in 2017–19, the rate of growth during this Eurozone recovery will be substantially lower than in the decade to 2007, when GDP grew by an average of 2.4% per annum.
Given that growth in many Eurozone member states during this earlier period was fueled in part by a housing boom, a consumer spending boom, or unsustainable public sector borrowing (or indeed a combination of all three) this is not entirely surprising. But nevertheless, the differential in growth prospects means that Eurozone households will see slower improvements in their financial well-being than has been the norm.
This “new normal” of weaker growth is by no means inevitable, however. The Eurozone crisis has forced governments to take bold action both at the regional level and nationally, and sustaining this ambition could materially change the medium-term outlook for the Eurozone.
At the Eurozone level, the political will shown in agreeing financial rescues and acquiescing in the implementation of the ECB’s bond purchase program now needs to be transposed to growth-enhancing measures. Internal liberalization of services markets and a greater willingness to open goods markets to economies outside the Eurozone would boost long-term trade prospects, and with it firms’ incentives to invest and create jobs in the coming years.
More immediately, further measures might be taken to improve business environments and reduce the barriers to job creation. Only four Eurozone economies make it into the top 20 of the World Bank’s rankings for ease of doing business. And the third largest Eurozone economy (Italy) is ranked outside the top 50. Recent improvements in Spain’s labor market and the impressive inflow of FDI into a range of sectors demonstrate the impact that an ambitious reform program can have.
21EY Eurozone Forecast October 2015

Forecast for Eurozone countries
Austria
Belgium
Cyprus
Estonia
Finland
France
Germany
Greece
Ireland
Italy
Latvia
Lithuania
Luxembourg
Malta
Netherlands
Portugal
Slovakia
Slovenia
Spain

Please visit ey.com/eurozone.
19 Eurozone countries
23EY Eurozone Forecast October 2015

GDP growth
2015
0.7%
Austria
• The Austrian economy will remain subdued for the second consecutive year in 2015 and is expected to expand by only 0.7%, underperforming the Eurozone as a whole. Growth should be firmer from next year, with GDP seen expanding 1.3% in 2016 and 1.8% a year in 2017–19.
• The economy grew just 0.1% in Q2 2015, after 0.7% in Q1. So far this year, consumption and stockbuilding have more than offset a negative contribution from net exports and investment. Investment fell in Q2 for the seventh consecutive quarter, but recent confidence indicators, such as the manufacturing PMI, point to improvement ahead.
• While Austria remains internationally competitive, net trade contributed negatively in the last three quarters and our measure of world trade growth is forecast to slow from last year. Against this background, exports of goods and services are expected to rise by only 0.9% this year, before a pickup to 3.7% in 2016 and to average 4.5% a year in 2017–19.
Austria (annual percentage changes unless specified)
2014 2015 2016 2017 2018 2019
GDP 0.5 0.7 1.3 1.8 1.8 1.8
Private consumption 0.0 0.3 1.2 1.5 1.4 1.4
Fixed investment –0.2 –0.8 1.6 2.8 2.3 1.6
Stockbuilding (% of GDP) 0.9 0.9 0.6 0.7 0.6 0.6
Government consumption 0.8 1.2 1.6 1.4 1.5 1.5
Exports of goods and services 2.2 0.9 3.7 4.5 4.9 4.4
Imports of goods and services 1.3 0.2 3.3 5.0 4.7 4.1
Consumer prices 1.5 1.0 1.7 1.9 1.8 1.8
Unemployment rate (level) 5.6 5.7 5.5 5.4 5.3 5.1
Current account balance (% of GDP) 0.8 3.1 2.5 2.5 2.6 2.7
Government budget (% of GDP) –2.4 –2.0 –1.7 –1.2 –0.9 –0.9
Government debt (% of GDP) 84.5 84.7 84.0 82.4 80.6 78.9
Source: Oxford Economics.
Figure 11Contributions to GDP
Source: Oxford Economics.
% year
–4
–3
–2
–1
0
1
2
3
4
5
2000 2002 2004 2006 2008 2010 2012 2014 2016 2018
GDP
Net exportsDomesticdemand
Forecast
Figure 12Government balance and debt
Source: Oxford Economics.
% of GDP % of GDP
40
45
50
55
60
65
70
75
80
85
90
–6
–5
–4
–3
–2
–1
0
1
2001 2003 2005 2007 2009 2011 2013 2015 2017 2019
ForecastGovernment balance(left-hand side)
Government debt(right-hand side)
Austria
24 EY Eurozone Forecast October 2015

• Belgium seems to be moving onto a path of above-trend growth, with GDP growth forecast to accelerate from 1.3% this year to 1.6% in 2016, and then about 1.8% a year in 2017–19. After specific factors affected the sectoral composition of growth in H1 2015, the economic expansion should become more balanced.
• More specifically, exports should accelerate further, given positive developments in the external environment and domestic policy measures aiming to improve competitiveness. Meanwhile, we expect consumption patterns to normalize and remain stronger than in the past four years, with consumers still benefiting from low prices.
• Looking at investment, base effects linked to one-off events should disappear, while favorable demand and supply-side factors suggest a strengthening underlying trend. But fiscal adjustment will continue to weigh on GDP growth, as the Government aims to reduce the debt burden by 2018.
Belgium (annual percentage changes unless specified)
2014 2015 2016 2017 2018 2019
GDP 1.1 1.3 1.6 1.9 1.8 1.8
Private consumption 0.9 2.1 1.5 1.5 1.5 1.5
Fixed investment 5.1 2.7 1.3 2.3 2.5 2.5
Stockbuilding (% of GDP) –1.0 –1.3 –1.0 –0.1 0.1 0.3
Government consumption 1.0 0.3 0.3 0.5 0.9 1.4
Exports of goods and services 3.8 4.0 4.1 3.4 3.6 3.5
Imports of goods and services 3.6 4.3 3.9 3.9 3.6 3.6
Consumer prices 0.5 0.5 1.5 1.7 1.6 1.7
Unemployment rate (level) 8.5 8.5 8.1 7.7 7.6 7.5
Current account balance (% of GDP) 1.6 2.4 1.1 –0.3 –0.6 –0.6
Government budget (% of GDP) –3.2 –2.4 –2.2 –1.7 –1.2 –0.9
Government debt (% of GDP) 106.5 109.3 110.4 110.8 110.6 110.1
Source: Oxford Economics.
Figure 13Components of GDP growth
Source: Oxford Economics; Haver Analytics.
% point contribution to q-on-q GDP growth
–3
–2
–1
0
1
2
3
4
2014 Q1 2014 Q2 2014 Q3 2014 Q4 2015 Q1
Governmentconsumption Private
consumption
Investment
Net exports
Governmentconsumption
Figure 14Unemployment and earnings
Source: Oxford Economics.
% % year
–1.0
–0.5
0
0.5
1.0
1.5
5.0
5.5
6.0
6.5
7.0
7.5
8.0
8.5
9.0
9.5
10.0
2011 2012 2013 2014 2015 2016 2017 2018
Forecast
Unemployment rate(left-hand side)
Earnings(right-hand side)
GDP growth
2015
1.3%
BelgiumBelgium
25EY Eurozone Forecast October 2015

• We expect GDP to grow 0.7% this year, as the resumption of external funding and greater stability in the banking sector support activity. Looking ahead to 2016, our forecast shows a pickup to 1.1%, driven by looser credit supply conditions and easing budgetary pressures.
• Deflation has persisted through H1, and we expect the fall in prices to average 0.9% for 2015 as a whole. Cyprus is now eligible for the ECB’s quantitative easing program, which started with the purchase of €100m of Cypriot bonds. This should help combat deflation, encourage growth and aid Cyprus’ return to market-based financing.
• Risks come from uncertainty in Greece and Russia, which could dampen growth in trade, tourism and foreign investment. Meanwhile, if reforms addressing the high level of non-performing loans are not fully implemented, external funding could be suspended again and credit conditions would stay tight, slowing the pace of growth.
Cyprus (annual percentage changes unless specified)
2014 2015 2016 2017 2018 2019
GDP –2.3 0.7 1.1 1.4 1.8 2.2
Private consumption 0.4 0.6 0.9 0.8 1.6 1.9
Fixed investment –18.8 –2.0 0.9 4.3 5.5 6.5
Stockbuilding (% of GDP) 1.4 2.2 2.3 2.3 2.0 1.7
Government consumption –8.7 –0.8 –0.6 0.5 1.0 1.4
Exports of goods and services 5.7 –0.4 1.5 3.2 3.6 4.0
Imports of goods and services 8.1 –0.3 0.9 2.9 3.5 3.9
Consumer prices –0.3 –0.9 0.8 1.5 2.0 2.2
Unemployment rate (level) 16.1 16.2 15.3 13.8 11.9 10.1
Current account balance (% of GDP) –5.1 –0.5 –0.3 –0.3 –0.4 –0.6
Government budget (% of GDP) –8.8 –3.0 –2.4 –2.2 –2.1 –1.2
Government debt (% of GDP) 107.5 110.7 111.0 110.1 108.1 104.7
Source: Oxford Economics.
Figure 15Real GDP growth
Source: Oxford Economics.
% year
–6
–4
–2
0
2
4
6
8
2000 2002 2004 2006 2008 2010 2012 2014 2016 2018
Eurozone
Cyprus
Forecast
Figure 16Misery index*
Source: Eurostat; Haver Analytics.
%
*National unemployment rate plus CPI inflation rate0
2
4
6
8
10
12
14
16
18
2001 2003 2005 2007 2009 2011 2013 2015
GDP growth
2015
0.7%
Cyprus
26 EY Eurozone Forecast October 2015

• Renewed growth in Q2 lifted annual GDP expansion to 1.9%. A further pickup in the second half will allow full-year growth of 2%, broadly matching last year’s result. Growth is then seen accelerating gradually to 3% in 2016 and 4% in 2018–19, with industrial output bouncing back strongly next year.
• This year’s expansion is being driven by private consumption, boosted by steady real income recovery since 2012, and exports, whose recovery from the loss of Russian markets in H1 reflects successful redirection toward the Eurozone.
• Fixed investment is set to stabilize this year, despite the blow to confidence from heightened NATO-Russia tensions, and
will stage a strong return to growth in 2016–18, helped by rising demand and Eurozone monetary policy that is still extremely relaxed.
• Growth rates are set to stay below the other Baltics, mainly because of the Government’s determination to rebalance the budget, which will be back in small surplus in 2018.
Estonia (annual percentage changes unless specified)
2014 2015 2016 2017 2018 2019
GDP 2.1 2.0 3.0 3.5 4.0 4.0
Private consumption 4.1 3.3 3.9 4.1 4.1 4.1
Fixed investment –2.8 0.2 4.5 5.3 5.5 5.3
Stockbuilding (% of GDP) 1.2 1.2 1.6 1.3 1.4 1.4
Government consumption 2.3 1.3 1.5 2.3 2.7 2.6
Exports of goods and services 2.9 1.4 5.2 7.4 7.5 7.0
Imports of goods and services 2.5 1.5 6.3 7.8 7.8 7.2
Consumer prices 0.5 0.3 1.9 2.5 2.5 2.5
Unemployment rate (level) 7.4 6.3 5.5 5.3 5.3 5.4
Current account balance (% of GDP) 0.0 1.2 0.4 –0.4 –0.5 –0.5
Government budget (% of GDP) 0.6 –0.1 –0.4 –0.1 0.1 0.3
Government debt (% of GDP) 10.6 10.5 10.4 10.0 9.3 8.3
Source: Oxford Economics.
Figure 17Real GDP growth
Source: Oxford Economics.
% year
–20
–15
–10
–5
0
5
10
15
2001 2003 2005 2007 2009 2011 2013 2015 2017 2019
Eurozone
Estonia
Forecast
Figure 18Government budget balance
Source: Oxford Economics.
€b % of GDP
% of GDP (right-hand side)
€b (left-hand side)
–3
–2
–1
0
1
2
3
–0.6
–0.4
–0.2
0
0.2
0.4
0.6
2001 2003 2005 2007 2009 2011 2013 2015 2017 2019
Forecast
GDP growth
2015
2.0%
Estonia
27EY Eurozone Forecast October 2015

Finland (annual percentage changes unless specified)
2014 2015 2016 2017 2018 2019
GDP –0.4 –0.4 1.0 1.8 2.1 2.2
Private consumption 0.5 0.7 0.7 1.5 1.6 1.6
Fixed investment –3.3 –3.6 2.0 2.3 2.4 2.3
Stockbuilding (% of GDP) 0.2 0.6 0.6 0.7 0.9 1.0
Government consumption –0.2 –0.2 0.4 0.8 1.3 1.9
Exports of goods and services –0.7 –1.1 2.0 2.3 2.4 2.7
Imports of goods and services 0.0 –0.2 1.8 1.7 1.9 2.0
Consumer prices 1.2 0.1 1.1 1.1 1.3 1.6
Unemployment rate (level) 8.7 9.4 9.0 8.2 7.9 7.5
Current account balance (% of GDP) –1.9 –0.7 –0.1 0.0 0.0 0.0
Government budget (% of GDP) –3.2 –3.0 –2.2 –1.3 –0.8 –0.7
Government debt (% of GDP) 61.0 64.0 64.5 63.4 61.7 59.9
Source: Oxford Economics.
• The Finnish economy remains very weak, with GDP rising just 0.2% in Q2 after being unchanged in Q1 and falling in H2 2014. After the disappointing H1, we now expect GDP to contract 0.4% in 2015. We forecast that growth will then rise moderately to 1% in 2016, before picking up to 2.2% in 2019.
• Exports remain very weak, unable to take advantage of the sharp fall in the euro as they are being hit by deep recession in Russia, one of Finland’s largest trading partners. We forecast that exports will contract 1.1% this year, before improving from 2016.
• The difficult external environment is spilling over into the domestic sector, with
both consumers and businesses affected by the overall negative sentiment. We forecast private consumption will grow just 0.7% both this year and next, as unemployment (at its highest in 15 years) continues to creep up. The outlook for capital expenditure is even bleaker; we expect fixed investment to contract 3.6% in 2015, before rising 2% in 2016.
Figure 19GDP growth
Source: Oxford Economics.
% year
–10
–8
–6
–4
–2
0
2
4
6
8
2001 2004 2007 2010 2013 2016 2019
Eurozone
Finland
Forecast
Figure 20International competitiveness
Source: Oxford Economics; Haver Analytics.
Unit labour costs Q1 2007 = 100
80
85
90
95
100
105
110
2007 2008 2009 2010 2011 2012 2013 2014 2015
Finland
Germany
OECD Eurozone countries*Sweden
*Cyprus, Latvia, Lithuania and Malta are not part of the OECD.
GDP growth
2015
–0.4%
Finland
28 EY Eurozone Forecast October 2015

France (annual percentage changes unless specified)
2014 2015 2016 2017 2018 2019
GDP 0.2 1.2 1.7 1.7 1.5 1.6
Private consumption 0.7 1.9 1.4 1.3 1.4 1.4
Fixed investment –1.2 –0.6 1.7 2.5 2.8 2.5
Stockbuilding (% of GDP) 0.7 0.6 0.6 0.6 0.7 0.8
Government consumption 1.5 1.7 1.5 1.2 1.0 1.0
Exports of goods and services 2.4 5.8 3.0 3.0 3.1 3.3
Imports of goods and services 3.9 5.6 2.4 2.5 3.3 3.6
Consumer prices 0.6 0.3 1.5 1.6 1.6 1.7
Unemployment rate (level) 10.3 10.2 10.1 9.9 9.7 9.7
Current account balance (% of GDP) –0.9 0.2 0.5 0.3 0.0 –0.3
Government budget (% of GDP) –4.0 –3.8 –3.5 –2.7 –2.1 –1.8
Government debt (% of GDP) 95.5 100.5 103.5 104.6 104.4 103.3
Source: Oxford Economics.
• After a healthy 0.7% rise in Q1, French GDP was unchanged in Q2. Nonetheless, we expect a stronger H2 to lead to growth of 1.2% for 2015 overall, with the recovery becoming more broad-based. We forecast GDP growth will rise to 1.7% in 2016 and then average 1.6% a year in 2017–19.
• More specifically, the economy will become less reliant on consumer spending and more dependent on exports, as well as a gradual investment recovery starting in H2. Consumption will soon start to normalize after the oil-related plunge in inflation. Meanwhile, French exporters will benefit from an improving external
environment and better domestic conditions, as well as the lower euro.
• With the business climate improving, firms should also start to boost investment spending. Finally, the slow pace of fiscal adjustment means that government expenditure will also continue to support growth in the near term.
Figure 21Manufacturing PMI and business sentiment
Source: Oxford Economics; Haver Analytics.
Long-term average = 100 >50 = expansion
30
35
40
45
50
55
60
60
70
80
90
100
110
120
2007 2008 2009 2010 2011 2012 2013 2014 2015
Manufacturing PMI (left-hand side)
Business sentiment indicator (right-hand side)
Figure 22Contribution to GDP
Source: Oxford Economics; Haver.
%, year-on-year
2005 2006 2007 2007 2008 2009 2010 2011 2012 2013 2014–5
–4
–3
–2
–1
0
1
2
3
4
5 Investment
Net exports
Private consumption
Government consumption
GDP growth
2015
1.2%
France
29EY Eurozone Forecast October 2015

Germany (annual percentage changes unless specified)
2014 2015 2016 2017 2018 2019
GDP 1.6 1.6 2.0 1.7 1.2 1.0
Private consumption 1.0 1.8 1.5 1.1 1.1 1.1
Fixed investment 3.5 1.9 3.4 3.5 2.7 1.9
Stockbuilding (% of GDP) –0.8 –1.1 –0.5 0.0 0.1 0.1
Government consumption 1.7 1.8 0.9 0.9 1.0 0.8
Exports of goods and services 3.9 5.5 4.2 3.6 3.5 3.4
Imports of goods and services 3.7 6.0 5.6 4.8 4.5 4.1
Consumer prices 0.8 0.3 1.5 1.9 1.8 1.6
Unemployment rate (level) 5.0 4.7 4.8 4.8 4.7 4.6
Current account balance (% of GDP) 7.6 8.1 7.5 7.0 6.8 6.6
Government budget (% of GDP) 0.7 0.5 0.2 0.1 0.1 0.0
Government debt (% of GDP) 74.7 71.5 68.9 66.6 64.6 62.9
Source: Oxford Economics.
• The Germany economy regained some momentum in Q2, growing 0.4% on the quarter, supporting our view that the slow start to 2015 was a temporary setback.
• Although household spending fundamentals remain strong, suggesting that consumer spending will remain a key contributor to growth, the pace of expansion is likely to weaken in late
2015, as real income growth slows in response to higher inflation.
• However, we expect the contribution to growth from exports and investment to increase over the coming quarters. As a result, we forecast GDP growth will rise from 1.6% this year to 2% in 2016.
• Weaker growth abroad and a re-escalation of the Greek crisis could mean that exports and investment are unable to take over the growth baton from households. Accordingly, the risks to our growth forecast lie to the downside. And beyond the next year or two, population aging will lead to a contraction in the labor supply, limiting Germany’s medium-term pace of growth.
Figure 23GDP and Ifo business expectations
Source: Oxford Economics; Haver Analytics.
Average = 100 % quarter
–5
–4
–3
–2
–1
0
1
2
3
70
75
80
85
90
95
100
105
110
115
120
2000 2002 2004 2006 2008 2010 2012 2014
Ifo business expectations index, advanced two months (left-hand side)
GDP (right-hand side)
Figure 24Consumer price inflation
Source: Oxford Economics.
% year
–1.0
–0.5
0.0
0.5
1.0
1.5
2.0
2.5
3.0
3.5
1996 1999 2002 2005 2008 2011 2014 2017
Forecast
GDP growth
2015
1.6%
Germany
30 EY Eurozone Forecast October 2015

Greece (annual percentage changes unless specified)
2014 2015 2016 2017 2018 2019
GDP 0.7 0.3 –2.9 –1.7 0.9 2.0
Private consumption 1.4 1.2 –3.0 –2.7 0.2 1.6
Fixed investment 2.9 –7.6 –14.7 –1.7 3.4 4.6
Stockbuilding (% of GDP) –0.4 –0.7 –0.9 –0.9 –0.9 –0.9
Government consumption –0.8 3.3 1.0 0.5 1.5 1.7
Exports of goods and services 8.7 –0.3 4.2 4.6 4.4 4.3
Imports of goods and services 7.4 –0.1 1.5 3.7 4.0 4.1
Consumer prices –1.4 –1.7 –0.4 1.1 1.8 1.9
Unemployment rate (level) 26.5 26.1 27.1 27.8 27.6 26.3
Current account balance (% of GDP) 0.6 2.9 4.9 4.9 4.8 0.2
Government budget (% of GDP) –3.5 –5.5 –4.3 –4.1 –3.9 –3.8
Government debt (% of GDP) 177.1 184.3 193.7 197.3 195.3 191.2
Source: Oxford Economics.
• After six months of negotiations, Greece and its international creditors have finally agreed a new three-year adjustment program. But there are major doubts about whether the Government can stay within the agreed €86b financing envelope, and the risk of a “Grexit” remains, despite renewed determination on all sides to make the deal work.
• Greek GDP actually held up well in H1, climbing 0.9% on the quarter in Q2 after a 0.1% rise in Q1. However, the surprisingly strong Q2 performance probably reflected consumers running down savings ahead of a possible Eurozone exit. As such, this bringing forward of future consumption will result in weakness in H2.
• The adjustment program and associated prior actions will require Greece to tighten fiscal policy by around €4b or about 2.5% of GDP next year. This is expected to be a substantial drag on the economy; we now expect GDP to grow just 0.3% this year and then contract by almost 3% in 2016.
Figure 25Contributions to GDP growth
Source: Oxford Economics.
% year
Domesticdemand
–12
–10
–8
–6
–4
–2
0
2
4
6
8
2001 2003 2005 2007 2009 2011 2013 2015 2017 2019
GDP
Net exports
Forecast
Figure 26Government deficit and debt
Source: Oxford Economics.
% of GDP % of GDP
Forecast0
50
100
150
200
250
1996 1999 2002 2005 2008 2011 2014 2017–16
–14
–12
–10
–8
–6
–4
–2
0
Government deficit(left-hand side)
Government debt (right-hand side)
GDP growth
2015
0.3%
Greece
31EY Eurozone Forecast October 2015

Ireland (annual percentage changes unless specified)
2014 2015 2016 2017 2018 2019
GDP 5.2 4.9 4.9 3.9 2.9 2.8
Private consumption 1.9 3.3 3.1 2.7 1.9 2.0
Fixed investment 13.2 8.8 7.0 5.1 3.3 3.1
Stockbuilding (% of GDP) 1.6 2.1 1.3 0.8 0.9 0.7
Government consumption 4.5 0.6 1.1 1.5 1.5 1.5
Exports of goods and services 12.2 7.3 7.2 5.7 3.2 3.3
Imports of goods and services 14.6 7.5 5.8 5.0 2.8 2.7
Consumer prices 0.3 0.4 1.9 2.0 2.3 2.0
Unemployment rate (level) 11.3 9.2 7.1 5.8 5.1 4.8
Current account balance (% of GDP) 3.6 4.2 3.5 3.5 3.5 3.5
Government budget (% of GDP) –4.1 –2.8 –2.1 –1.5 –0.9 –0.4
Government debt (% of GDP) 109.7 102.4 97.9 93.8 90.0 86.2
Source: Oxford Economics.
• Latest data and revisions reveal that Irish GDP grew 5.2% in 2014 and by 6.1% on the year in Q1 2015. However, a host of data-driven reasons is reducing the reliability of GDP as an indicator of growth.
• That said, the recovery in domestic demand is continuing, with retail sales and confidence levels remaining buoyant. And following a dip earlier this year, the
recent bounce in the construction PMI signals that the rebound in this sector is set to continue.
• While we suspect that the massive 13.2% growth in exports in Q1 was in part driven by a statistical quirk, exports will be supported in the year ahead by a weak euro and sustained growth in Ireland’s main trading partners.
• In light of these positives, but notwithstanding some key downside risks (notably potential destabilization within the Eurozone) we have raised our 2015 GDP forecast to 4.9%, with a similar pace seen in 2016.
Figure 27Contributions to GDP
Source: Oxford Economics.
% year
Domesticdemand
GDP
Net exports
–12
–9
–6
–3
0
3
6
9
12
15
2000 2002 2004 2006 2008 2010 2012 2014 2016 2018
Forecast
Figure 28Consumption and investment
Source: Oxford Economics.
% year
–40
–30
–20
–10
0
10
20
30
40
2001 2003 2005 2007 2009 2011 2013 2015 2017 2019
Consumption
Investment
Forecast
GDP growth
2015
4.9%
Ireland
32 EY Eurozone Forecast October 2015

Italy (annual percentage changes unless specified)
2014 2015 2016 2017 2018 2019
GDP –0.4 0.7 1.0 1.1 1.1 1.0
Private consumption 0.3 0.5 0.9 0.8 0.8 0.8
Fixed investment –3.2 0.9 1.4 2.0 2.0 2.0
Stockbuilding (% of GDP) –0.1 0.2 0.2 0.4 0.7 0.8
Government consumption –1.0 –0.1 –0.2 0.1 0.3 0.4
Exports of goods and services 2.4 3.8 3.1 3.1 3.0 3.0
Imports of goods and services 1.7 4.4 2.1 3.3 3.8 3.4
Consumer prices 0.2 0.0 0.8 1.1 1.3 1.7
Unemployment rate (level) 12.7 12.3 12.3 11.9 11.5 10.9
Current account balance (% of GDP) 1.9 2.5 2.7 2.7 2.6 2.6
Government budget (% of GDP) –3.0 –2.7 –2.0 –1.5 –1.3 –1.1
Government debt (% of GDP) 132.1 133.5 132.3 130.7 128.8 126.5
Source: Oxford Economics.
• After three years of recession, the Italian economy started to grow again in H1 2015, expanding by 0.4% in Q1 and 0.3% in Q2. Nevertheless, Italy will continue to underperform the Eurozone as whole, growing by 0.7% this year and 1% in 2016, well below the Eurozone average.
• While we expect private consumption to continue its recent positive trend — with
benefits coming from lower inflation — households will probably try to restore savings that were eroded during the prolonged crisis.
• In the coming quarters, we expect both net exports and investment to provide stronger contributions to the ongoing recovery.
• And if the Government accelerates the implementation of structural reforms, such as those in the judiciary and public administration, this could help the economy to pick up more strongly than expected.
Figure 29Industrial performance
Source: Haver Analytics.
% year Index 1995 = 100
Industrial production(left-hand side)
New orders(left-hand side)
Business confidence(right-hand side)
50
60
70
80
90
100
110
120
130
–40
–30
–20
–10
0
10
20
30
40
1995 1997 1999 2001 2003 2005 2007 2009 2011 2013 2015
Figure 30Contributions to GDP growth
Source: Oxford Economics.
% year
–6
–5
–4
–3
–2
–1
0
1
2
3
4
2001 2003 2005 2007 2009 2011 2013 2015 2017 2019
ForecastDomesticdemand
Net exports
GDP
GDP growth
2015
0.7%
Italy
33EY Eurozone Forecast October 2015
Latvia (annual percentage changes unless specified)
2014 2015 2016 2017 2018 2019
GDP 2.4 2.6 3.8 4.5 4.5 4.5
Private consumption 2.3 3.3 3.7 4.1 4.2 4.4
Fixed investment 1.3 1.3 4.8 5.7 5.3 4.6
Stockbuilding (% of GDP) 1.0 0.0 0.1 0.6 0.9 0.8
Government consumption 3.4 2.9 2.7 2.9 3.0 3.0
Exports of goods and services 2.2 2.6 4.6 5.5 5.5 5.8
Imports of goods and services 1.6 1.3 4.7 5.9 5.4 5.2
Consumer prices 0.7 0.5 2.1 2.4 2.4 2.4
Unemployment rate (level) 10.9 10.0 9.1 8.3 7.9 7.7
Current account balance (% of GDP) –3.2 –2.0 –2.0 –1.6 –1.3 –0.9
Government budget (% of GDP) –1.4 –1.4 –1.4 –1.4 –1.4 –1.4
Government debt (% of GDP) 35.4 35.8 35.2 34.3 33.5 32.8
Source: Oxford Economics.
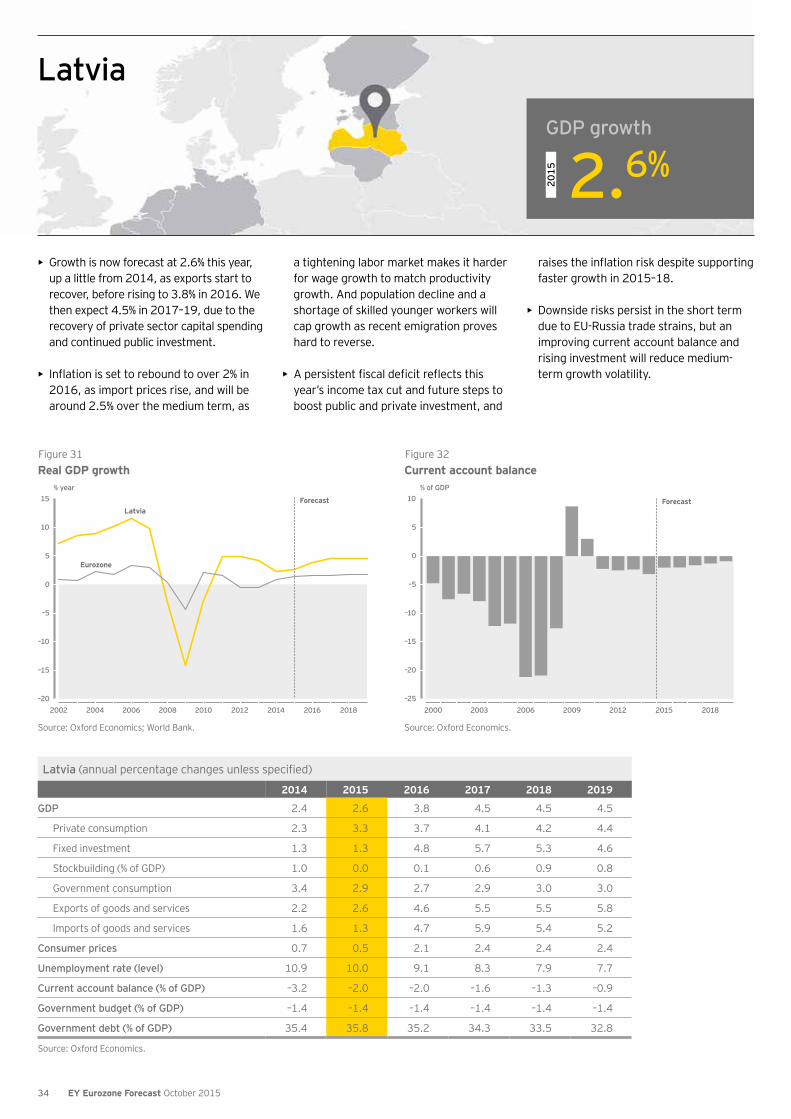
• Growth is now forecast at 2.6% this year, up a little from 2014, as exports start to recover, before rising to 3.8% in 2016. We then expect 4.5% in 2017–19, due to the recovery of private sector capital spending and continued public investment.
• Inflation is set to rebound to over 2% in 2016, as import prices rise, and will be around 2.5% over the medium term, as
a tightening labor market makes it harder for wage growth to match productivity growth. And population decline and a shortage of skilled younger workers will cap growth as recent emigration proves hard to reverse.
• A persistent fiscal deficit reflects this year’s income tax cut and future steps to boost public and private investment, and
raises the inflation risk despite supporting faster growth in 2015–18.
• Downside risks persist in the short term due to EU-Russia trade strains, but an improving current account balance and rising investment will reduce medium-term growth volatility.
Figure 31Real GDP growth
Source: Oxford Economics; World Bank.
% year
–20
–15
–10
–5
0
5
10
15
2002 2004 2006 2008 2010 2012 2014 2016 2018
Latvia
Eurozone
Forecast
Figure 32Current account balance
Source: Oxford Economics.
% of GDP
Forecast
2000 2003 2006 2009 2012 2015 2018–25
–20
–15
–10
–5
0
5
10
GDP growth
2015
2.6%
Latvia
34 EY Eurozone Forecast October 2015
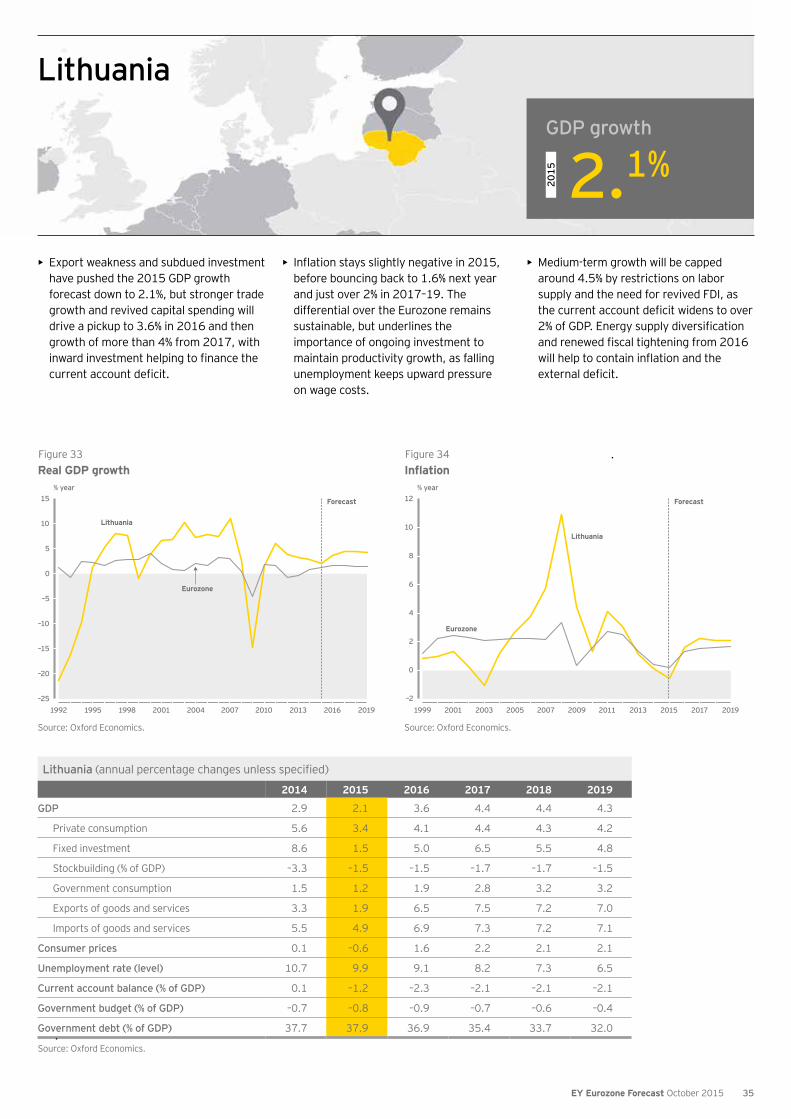
Lithuania (annual percentage changes unless specified)
2014 2015 2016 2017 2018 2019
GDP 2.9 2.1 3.6 4.4 4.4 4.3
Private consumption 5.6 3.4 4.1 4.4 4.3 4.2
Fixed investment 8.6 1.5 5.0 6.5 5.5 4.8
Stockbuilding (% of GDP) –3.3 –1.5 –1.5 –1.7 –1.7 –1.5
Government consumption 1.5 1.2 1.9 2.8 3.2 3.2
Exports of goods and services 3.3 1.9 6.5 7.5 7.2 7.0
Imports of goods and services 5.5 4.9 6.9 7.3 7.2 7.1
Consumer prices 0.1 –0.6 1.6 2.2 2.1 2.1
Unemployment rate (level) 10.7 9.9 9.1 8.2 7.3 6.5
Current account balance (% of GDP) 0.1 –1.2 –2.3 –2.1 –2.1 –2.1
Government budget (% of GDP) –0.7 –0.8 –0.9 –0.7 –0.6 –0.4
Government debt (% of GDP) 37.7 37.9 36.9 35.4 33.7 32.0
Source: Oxford Economics.
• Export weakness and subdued investment have pushed the 2015 GDP growth forecast down to 2.1%, but stronger trade growth and revived capital spending will drive a pickup to 3.6% in 2016 and then growth of more than 4% from 2017, with inward investment helping to finance the current account deficit.
• Inflation stays slightly negative in 2015, before bouncing back to 1.6% next year and just over 2% in 2017–19. The differential over the Eurozone remains sustainable, but underlines the importance of ongoing investment to maintain productivity growth, as falling unemployment keeps upward pressure on wage costs.
• Medium-term growth will be capped around 4.5% by restrictions on labor supply and the need for revived FDI, as the current account deficit widens to over 2% of GDP. Energy supply diversification and renewed fiscal tightening from 2016 will help to contain inflation and the external deficit.
Figure 33Real GDP growth
Source: Oxford Economics.
% year
Forecast
–25
–20
–15
–10
–5
0
5
10
15
1992 1995 1998 2001 2004 2007 2010 2013 2016 2019
Lithuania
Eurozone
Figure 34
Source: Oxford Economics.
Inflation% year
–2
0
2
4
6
8
10
12
1999 2001 2003 2005 2007 2009 2011 2013 2015 2017 2019
Lithuania
Eurozone
Forecast
GDP growth
2015
2.1%
Lithuania
35EY Eurozone Forecast October 2015
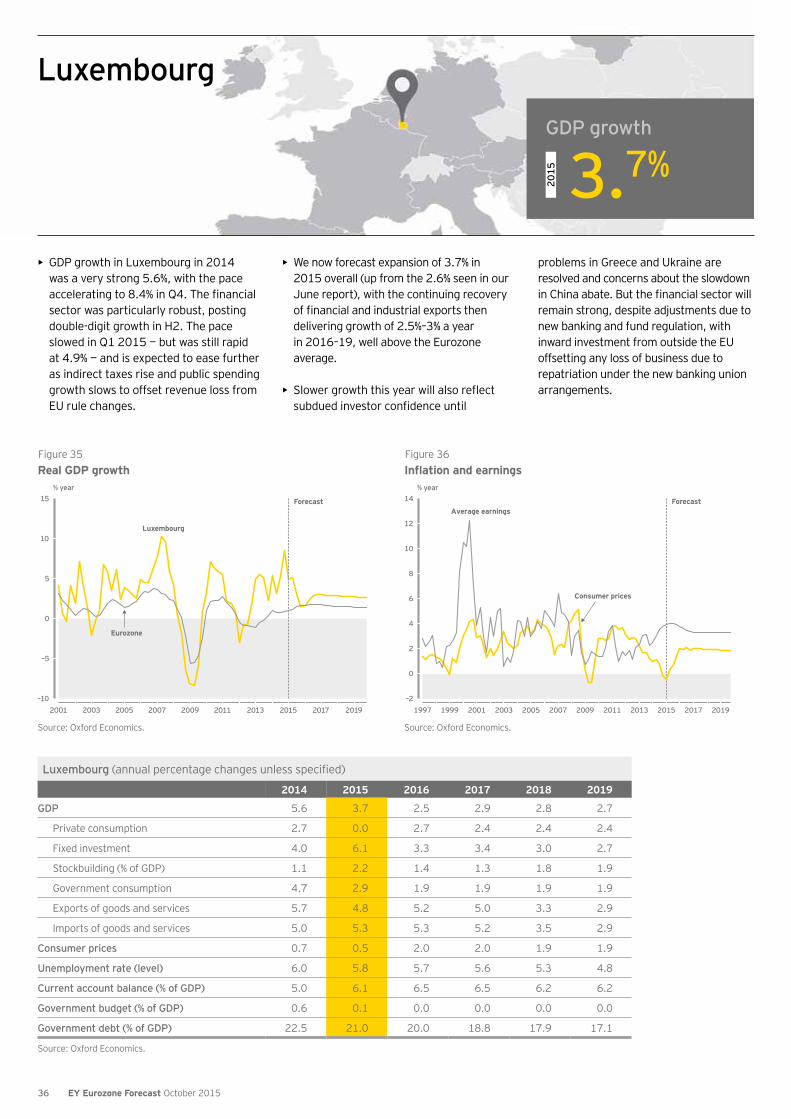
Luxembourg (annual percentage changes unless specified)
2014 2015 2016 2017 2018 2019
GDP 5.6 3.7 2.5 2.9 2.8 2.7
Private consumption 2.7 0.0 2.7 2.4 2.4 2.4
Fixed investment 4.0 6.1 3.3 3.4 3.0 2.7
Stockbuilding (% of GDP) 1.1 2.2 1.4 1.3 1.8 1.9
Government consumption 4.7 2.9 1.9 1.9 1.9 1.9
Exports of goods and services 5.7 4.8 5.2 5.0 3.3 2.9
Imports of goods and services 5.0 5.3 5.3 5.2 3.5 2.9
Consumer prices 0.7 0.5 2.0 2.0 1.9 1.9
Unemployment rate (level) 6.0 5.8 5.7 5.6 5.3 4.8
Current account balance (% of GDP) 5.0 6.1 6.5 6.5 6.2 6.2
Government budget (% of GDP) 0.6 0.1 0.0 0.0 0.0 0.0
Government debt (% of GDP) 22.5 21.0 20.0 18.8 17.9 17.1
Source: Oxford Economics.
• GDP growth in Luxembourg in 2014 was a very strong 5.6%, with the pace accelerating to 8.4% in Q4. The financial sector was particularly robust, posting double-digit growth in H2. The pace slowed in Q1 2015 — but was still rapid at 4.9% — and is expected to ease further as indirect taxes rise and public spending growth slows to offset revenue loss from EU rule changes.
• We now forecast expansion of 3.7% in 2015 overall (up from the 2.6% seen in our June report), with the continuing recovery of financial and industrial exports then delivering growth of 2.5%–3% a year in 2016–19, well above the Eurozone average.
• Slower growth this year will also reflect subdued investor confidence until
problems in Greece and Ukraine are resolved and concerns about the slowdown in China abate. But the financial sector will remain strong, despite adjustments due to new banking and fund regulation, with inward investment from outside the EU offsetting any loss of business due to repatriation under the new banking union arrangements.
Figure 35Real GDP growth
Source: Oxford Economics.
% year
–10
–5
0
5
10
15
2001 2003 2005 2007 2009 2011 2013 2015 2017 2019
Eurozone
Luxembourg
Forecast
Figure 36Inflation and earnings
Source: Oxford Economics.
% year
Forecast
–2
0
2
4
6
8
10
12
14
1997 1999 2001 2003 2005 2007 2009 2011 2013 2015 2017 2019
Average earnings
Consumer prices
GDP growth
2015
3.7%
Luxembourg
36 EY Eurozone Forecast October 2015

Malta (annual percentage changes unless specified)
2014 2015 2016 2017 2018 2019
GDP 3.5 3.9 2.9 2.3 1.9 1.8
Private consumption 3.3 3.1 2.4 2.0 1.9 1.8
Fixed investment 9.6 2.9 2.5 2.4 2.3 2.2
Stockbuilding (% of GDP) –2.9 –1.6 –0.2 0.3 0.6 0.8
Government consumption 6.4 4.7 2.0 1.7 1.7 1.6
Exports of goods and services 1.1 0.4 2.5 3.3 3.1 2.9
Imports of goods and services –0.2 0.9 3.1 3.6 3.4 3.1
Consumer prices 0.8 1.1 1.8 2.3 2.3 2.3
Unemployment rate (level) 5.9 5.5 5.5 5.6 5.6 5.6
Current account balance (% of GDP) 3.3 3.4 2.2 2.5 2.2 2.5
Government budget (% of GDP) –2.1 –1.6 –1.4 –1.3 –1.2 –1.0
Government debt (% of GDP) 68.5 66.8 65.2 63.6 62.1 60.6
Source: Oxford Economics.
• Since 2007, Malta has grown well ahead of the Eurozone and, after expansion of 4.8% in Q2, we now expect GDP growth of 3.9% in 2015 (up from our June forecast of 3%) and 2.9% in 2016. The strong labor market, rising tourist numbers and low inflation are all supporting consumer demand. Unemployment is half the Eurozone rate and programs to promote youth employment have been successful.
• Tourism has solid momentum and we expect this to continue. The lower oil import bill has also supported the current account surplus. But with almost 25% of Malta’s goods exports now going to emerging markets, the impact of the slowdown in China is weighing on trade prospects.
• In July 2015, Standard & Poor’s upgraded the outlook on Malta’s BBB+ credit rating from “stable” to “positive”, citing strong growth and fiscal consolidation. We expect government revenues to continue to grow strongly, helping the fiscal deficit to narrow to about 1% of GDP by 2019.
Figure 37Real GDP growth
Source: Oxford Economics.
% year
–5
–4
–3
–2
–1
0
1
2
3
4
5
2001 2003 2005 2007 2009 2011 2013 2015 2017 2019
Malta
Eurozone
Forecast
Figure 38Unemployment rate
Source: Oxford Economics.
%
5
6
7
8
9
10
11
12
13
2001 2003 2005 2007 2009 2011 2013 2015 2017
Eurozone
Malta
Forecast
GDP growth
2015
3.9%
Malta
37EY Eurozone Forecast October 2015

Netherlands (annual percentage changes unless specified)
2014 2015 2016 2017 2018 2019
GDP 1.0 1.8 1.6 1.6 1.7 1.6
Private consumption 0.0 0.9 0.5 1.1 1.4 1.6
Fixed investment 3.5 4.2 1.3 2.0 2.1 2.2
Stockbuilding (% of GDP) 0.0 –1.2 –1.0 –0.9 –0.8 –0.9
Government consumption 0.3 –0.9 –0.3 0.3 0.8 1.3
Exports of goods and services 4.0 4.4 3.6 3.1 2.6 2.2
Imports of goods and services 4.0 2.2 2.8 2.8 2.5 2.3
Consumer prices 0.3 0.3 1.4 1.4 1.5 1.6
Unemployment rate (level) 7.4 7.1 7.1 7.0 7.0 6.8
Current account balance (% of GDP) 10.8 11.2 11.3 11.4 12.0 11.9
Government budget (% of GDP) –2.3 –1.9 –1.6 –1.5 –1.3 –1.0
Government debt (% of GDP) 68.8 69.3 68.9 68.5 67.9 67.0
Source: Oxford Economics.
• The performance of the Dutch economy in H1 2015 points to a fairly modest recovery, despite the benefits of low interest rates, falling oil prices and the weaker euro. Quarterly GDP growth was just 0.1% in Q2, down from 0.6% in Q1 and the slowest pace in over a year.
• However, a major factor behind the Q2 slowdown lay with a government-imposed restriction on gas production from the Groningen gas field. Other indicators point to reasonable growth in non-oil GDP in the future, with activity benefiting from the weakness of commodity prices and high levels of business and consumer confidence.
• Consequently, although external conditions — including the slowdown in China and a still-possible messy outcome of the Greek debt crisis — pose risks to the very open Dutch economy, we still expect GDP to grow by 1.8% this year. We then forecast a followed rise of 1.6% in 2016 — comparable to growth in the Eurozone as a whole.
Figure 39Contributions to GDP growth
Source: Oxford Economics; Haver Analytics.
% year
–5
–4
–3
–2
–1
0
1
2
3
4
5
2001 2003 2005 2007 2009 2011 2013 2015 2017 2019
Forecast
Domesticdemand
Net exports
GDP
Figure 40Misery index*
Source: Haver Analytics.
%
5
6
7
8
9
10
11
12
13
2003 2004 2005 2006 2007 2008 2009 2010 2011 2012 2013 2014 2015
*CBS unemployment rate plus CPI inflation rate
GDP growth
2015
1.8%
Netherlands
38 EY Eurozone Forecast October 2015

Portugal (annual percentage changes unless specified)
2014 2015 2016 2017 2018 2019
GDP 0.9 1.5 1.4 1.3 1.2 1.2
Private consumption 2.2 1.9 1.4 1.3 1.0 0.9
Fixed investment 2.5 3.5 2.7 2.5 2.4 2.4
Stockbuilding (% of GDP) 0.3 0.6 0.5 0.2 0.0 0.1
Government consumption –0.3 –0.3 0.0 0.4 0.4 0.5
Exports of goods and services 3.3 5.6 3.9 3.8 3.6 3.0
Imports of goods and services 6.4 6.8 3.3 3.3 2.9 2.9
Consumer prices –0.2 0.5 0.9 1.2 1.4 1.7
Unemployment rate (level) 14.1 12.8 12.2 11.5 11.0 10.7
Current account balance (% of GDP) 0.5 0.2 0.6 0.7 0.8 0.8
Government budget (% of GDP) –4.5 –3.4 –2.6 –1.9 –1.4 –1.0
Government debt (% of GDP) 130.2 130.5 130.0 128.8 127.0 125.0
Source: Oxford Economics.
• Portuguese GDP expanded by 0.4% on the quarter in Q2 2015, the same as in the two preceding quarters. Looking ahead, we expect the economy to grow at a reasonable 1.5% in 2015 overall, before slowing to 1.4% in 2016 and then about 1.2% a year in 2017–19.
• Domestic demand, in particular investment and consumption, drove growth in H1 2015. We expect this trend to continue in the rest of the year, with net trade making a negative contribution. Imports have been rising on the back of solid domestic demand, but exports to Angola (a major trading partner) have plunged, offsetting a good performance elsewhere.
• The labor market improved in Q2, but we still think that the pace of improvement is likely to be gradual over the next few years, checking consumer spending in the medium term. And the high levels of domestic debt mean that deleveraging efforts will need to continue.
Figure 41Corporate sector deleveraging
Source: Oxford Economics; Haver Analytics.
% of GDP
100
110
120
130
140
150
160
2001 2003 2005 2007 2009 2011 2013 2015 2017 2019
Portugal
Eurozone
Forecast
Figure 42Government balance and debt
Source: Oxford Economics.
% of GDP % of GDP
40
50
60
70
80
90
100
110
120
130
140
1991 1994 1997 2000 2003 2006 2009 2012 2015 2018–12
–10
–8
–6
–4
–2
0
ForecastGovernment balance(left-hand side)
Government debt (right-hand side)
GDP growth
2015
1.5%
Portugal
39EY Eurozone Forecast October 2015

Slovakia (annual percentage changes unless specified)
2014 2015 2016 2017 2018 2019
GDP 2.4 3.1 3.1 3.2 3.4 3.4
Private consumption 2.2 2.2 2.9 2.7 2.7 2.5
Fixed investment 5.7 4.0 3.7 3.2 3.4 3.6
Stockbuilding (% of GDP) –0.4 –0.2 0.6 1.1 1.2 1.1
Government consumption 4.4 2.0 2.2 2.4 2.6 2.4
Exports of goods and services 4.6 5.8 3.3 4.9 5.2 4.9
Imports of goods and services 5.0 5.8 4.1 5.1 4.8 4.3
Consumer prices –0.1 0.3 1.9 2.5 2.6 2.5
Unemployment rate (level) 13.2 11.8 11.2 10.7 9.8 9.0
Current account balance (% of GDP) 0.1 0.0 0.9 0.9 0.9 0.9
Government budget (% of GDP) –2.9 –2.9 –2.5 –2.3 –1.7 –1.6
Government debt (% of GDP) 53.6 54.6 54.3 53.9 52.8 51.6
Source: Oxford Economics.
• The Slovakian economy continued to expand in Q2, growing by 0.8% after a similar rise in Q1. After expansion of 2.4% in 2014, we now forecast GDP growth of 3.1% this year, comfortably outperforming the Eurozone as a whole. We then expect the economy to grow by 3%–3.5% a year in 2016–19.
• Domestic demand was subdued in H1. But we expect domestic conditions to be generally supportive of growth during the rest of 2015 and into 2016. Growth in real wages, as well as the improving labor market, will support an increase in personal disposable incomes.
• Investment should be supported by positive financial conditions and a planned increase in new automotive factories. Although net trade will grow only marginally this year, this is due to the strengthening of the domestic economy and the recovery in the Eurozone, which will mean more inward investment and higher imports of capital goods.
Figure 43Real GDP growth
Source: Oxford Economics.
% year
–6
–4
–2
0
2
4
6
8
10
12
2001 2003 2005 2007 2009 2011 2013 2015 2017 2019
Slovakia
Eurozone
Forecast
Figure 44Inflation
Source: Oxford Economics; World Bank.
% year
–2
0
2
4
6
8
10
2001 2003 2005 2007 2009 2011 2013 2015 2017 2019
Forecast
GDP growth
2015
3.1%
Slovakia
40 EY Eurozone Forecast October 2015

Slovenia (annual percentage changes unless specified)
2014 2015 2016 2017 2018 2019
GDP 2.5 2.2 2.4 2.8 3.3 3.1
Private consumption 0.3 1.2 1.3 2.7 3.1 3.3
Fixed investment 4.7 5.6 4.4 4.9 4.6 5.0
Stockbuilding (% of GDP) 0.0 –0.2 0.7 1.1 1.5 1.2
Government consumption –0.5 –1.3 1.4 2.5 2.9 3.3
Exports of goods and services 5.7 4.8 3.3 2.9 2.8 2.7
Imports of goods and services 3.7 3.9 4.3 4.0 3.5 3.0
Consumer prices 0.2 –0.4 1.1 1.9 2.5 2.5
Unemployment rate (level) 9.7 9.6 8.9 8.1 7.2 6.4
Current account balance (% of GDP) 7.0 6.6 6.1 5.6 5.2 5.1
Government budget (% of GDP) –4.9 –3.9 –3.2 –2.8 –2.6 –2.5
Government debt (% of GDP) 80.9 75.5 71.0 68.7 67.5 66.4
Source: Oxford Economics.
• Slovenia’s GDP grew by 2.7% in H1 2015, well above the Eurozone average. We expect 2.2% expansion for the year as a whole, driven by robust export demand and a steady improvement in domestic activity. Stronger domestic demand will help underpin steadily rising growth, to over 3% in 2018–19.
• Lower oil prices and an improving labor market are encouraging a recovery in household spending. In 2015, we expect private spending to rise by 1.2%, the fastest pace since 2008.
• We expect the fiscal deficit to narrow to 3.9% of GDP this year (a much more cautious forecast than the Government’s 2.9% target due to delays to the
privatization program) and to 2.5% by 2019.
• Our baseline forecast assumes Greece remains in the Eurozone, but the threat of a “Grexit” remains significant. More than half of Slovenia’s exports go to the Eurozone and confidence would be sharply hit, constraining the recovery in domestic spending.
Figure 45Real GDP growth
Source: Oxford Economics.
% year
–10
–8
–6
–4
–2
0
2
4
6
8
2001 2003 2005 2007 2009 2011 2013 2015 2017 2019
Slovenia
Eurozone
Forecast
Figure 46Government budget balance
Source: Oxford Economics.
€b % of GDP
% of GDP (right-hand side)
€b (left-hand side)
–16
–14
–12
–10
–8
–6
–4
–2
0
2
–8
–7
–6
–5
–4
–3
–2
–1
0
1
2002 2004 2006 2008 2010 2012 2014 2016 2018
Forecast
GDP growth
2015
2.2%
Slovenia
41EY Eurozone Forecast October 2015

Spain (annual percentage changes unless specified)
2014 2015 2016 2017 2018 2019
GDP 1.4 3.2 2.7 2.3 2.2 2.1
Private consumption 2.4 3.4 2.6 2.1 1.9 1.8
Fixed investment 3.4 5.6 3.9 3.5 3.5 3.5
Stockbuilding (% of GDP) 0.7 0.5 0.6 0.6 0.5 0.4
Government consumption 0.1 1.4 1.1 1.0 1.1 1.3
Exports of goods and services 4.2 4.7 4.6 4.5 4.2 4.1
Imports of goods and services 7.6 5.2 4.7 4.4 3.9 3.8
Consumer prices –0.2 –0.2 1.0 1.0 1.3 1.5
Unemployment rate (level) 24.5 22.3 20.7 19.5 18.4 17.5
Current account balance (% of GDP) 0.8 0.7 1.1 1.1 1.2 1.2
Government budget (% of GDP) –5.8 –4.4 –3.1 –2.5 –2.1 –1.8
Government debt (% of GDP) 97.7 101.1 103.2 104.5 105.1 105.1
Source: Oxford Economics.
• Spain posted impressive 2.9% growth in H1 this year, one of the fastest rates in the Eurozone. A combination of temporary and structural factors is fueling growth, which we now expect to average 3.2% this year, up from 1.4% in 2014, before easing to 2.7% in 2016.
• Over the longer term, we anticipate GDP growth will moderate toward a more sustainable range of 2%–2.5% a year, still comfortably outpacing the Eurozone average.
• The acceleration this year is driven by strong domestic demand. Consumer spending will expand by 3.4%, reflecting the boost to household finances from
cheaper energy prices and strong job creation. We expect unemployment to fall to 21.5% by the end of 2015 and just over 20% at the end of 2016, prompting household spending to expand 2.6% next year, and then around 2% a year in 2017–19. Meanwhile, investment is forecast to rise 5.6% this year and just under 4% in 2016.
Figure 47Contributions to GDP growth
Source: Oxford Economics.
% year
Forecast
–3
–2
–1
0
1
2
3
4
2013 2014 2015 2016 2017 2018 2019
InvestmentNet exports
Privateconsumption Government
consumption
Figure 48Unemployment rate
Source: Oxford Economics.
%
15
17
19
21
23
25
27
29
2013 2014 2015 2016 2017 2018 2019
Forecast
GDP growth
2015
3.2%
Spain
42 EY Eurozone Forecast October 2015

Detailed tables and charts
43EY Eurozone Forecast October 2015

Forecast assumptions
2014 2015 2016 2017 2018 2019
Short-term interest rates (%) 0.2 0.0 –0.1 –0.2 0.1 0.5
Long-term interest rates (%) 2.0 1.3 2.0 2.6 3.0 3.3
Euro effective exchange rate (1995 = 100) 123.6 113.7 112.6 112.6 113.8 115.2
Oil prices (€/barrel) 74.5 48.8 50.9 55.7 58.2 60.7
Share prices (% year) 12.6 11.7 4.6 6.6 6.2 5.8
2014 2015
Q1 Q2 Q3 Q4 Q1 Q2 Q3 Q4
Short-term interest rates (%) 0.3 0.3 0.2 0.1 0.0 0.0 0.0 –0.1
Long-term interest rates (%) 2.7 2.2 1.8 1.5 1.0 1.3 1.5 1.6
Euro effective exchange rate (1995 = 100) 125.7 125.2 122.6 121.1 114.9 112.6 113.6 113.6
Oil prices (€/barrel) 79.0 80.0 76.8 61.1 47.9 55.8 46.1 45.6
Share prices (% year) 15.5 19.2 14.0 2.8 11.4 12.7 9.7 13.3
44 EY Eurozone Forecast October 2015
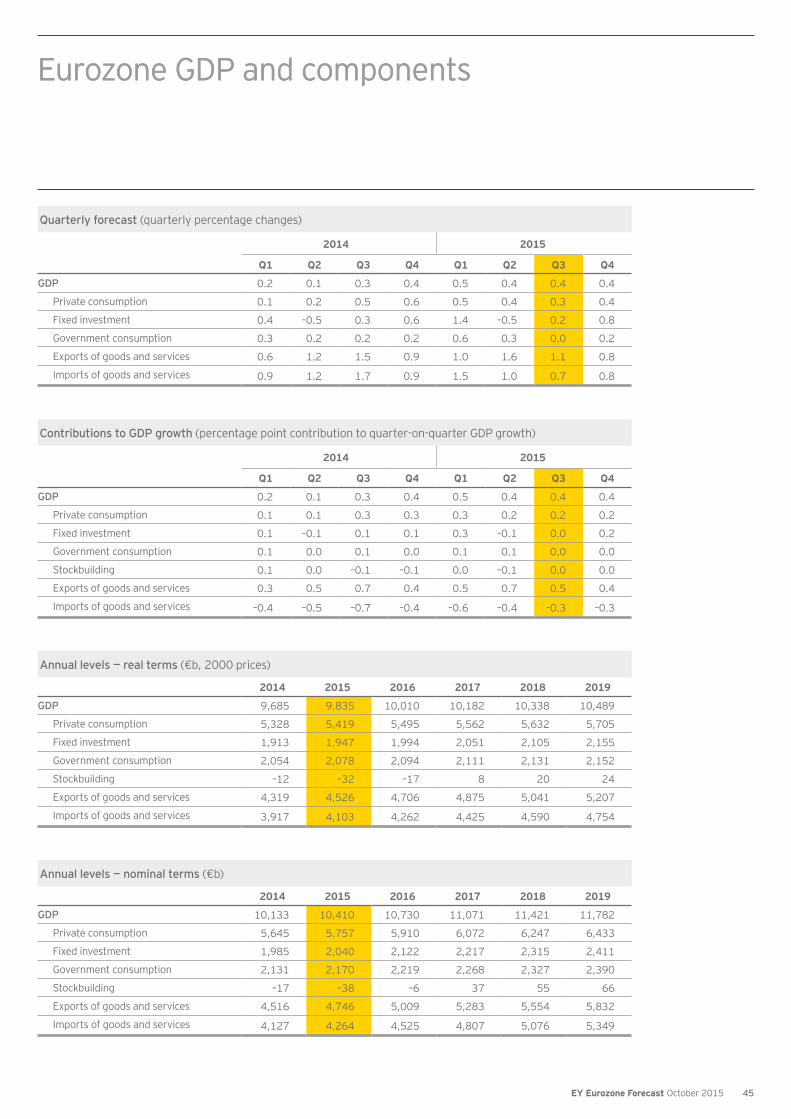
Quarterly forecast (quarterly percentage changes)
2014 2015
Q1 Q2 Q3 Q4 Q1 Q2 Q3 Q4
GDP 0.2 0.1 0.3 0.4 0.5 0.4 0.4 0.4
Private consumption 0.1 0.2 0.5 0.6 0.5 0.4 0.3 0.4
Fixed investment 0.4 –0.5 0.3 0.6 1.4 –0.5 0.2 0.8
Government consumption 0.3 0.2 0.2 0.2 0.6 0.3 0.0 0.2
Exports of goods and services 0.6 1.2 1.5 0.9 1.0 1.6 1.1 0.8
Imports of goods and services 0.9 1.2 1.7 0.9 1.5 1.0 0.7 0.8
Contributions to GDP growth (percentage point contribution to quarter-on-quarter GDP growth)
2014 2015
Q1 Q2 Q3 Q4 Q1 Q2 Q3 Q4
GDP 0.2 0.1 0.3 0.4 0.5 0.4 0.4 0.4
Private consumption 0.1 0.1 0.3 0.3 0.3 0.2 0.2 0.2
Fixed investment 0.1 –0.1 0.1 0.1 0.3 –0.1 0.0 0.2
Government consumption 0.1 0.0 0.1 0.0 0.1 0.1 0.0 0.0
Stockbuilding 0.1 0.0 –0.1 –0.1 0.0 –0.1 0.0 0.0
Exports of goods and services 0.3 0.5 0.7 0.4 0.5 0.7 0.5 0.4
Imports of goods and services –0.4 –0.5 –0.7 –0.4 –0.6 –0.4 –0.3 –0.3
Annual levels — real terms (€b, 2000 prices)
2014 2015 2016 2017 2018 2019
GDP 9,685 9,835 10,010 10,182 10,338 10,489
Private consumption 5,328 5,419 5,495 5,562 5,632 5,705
Fixed investment 1,913 1,947 1,994 2,051 2,105 2,155
Government consumption 2,054 2,078 2,094 2,111 2,131 2,152
Stockbuilding –12 –32 –17 8 20 24
Exports of goods and services 4,319 4,526 4,706 4,875 5,041 5,207
Imports of goods and services 3,917 4,103 4,262 4,425 4,590 4,754
Annual levels — nominal terms (€b)
2014 2015 2016 2017 2018 2019
GDP 10,133 10,410 10,730 11,071 11,421 11,782
Private consumption 5,645 5,757 5,910 6,072 6,247 6,433
Fixed investment 1,985 2,040 2,122 2,217 2,315 2,411
Government consumption 2,131 2,170 2,219 2,268 2,327 2,390
Stockbuilding –17 –38 –6 37 55 66
Exports of goods and services 4,516 4,746 5,009 5,283 5,554 5,832
Imports of goods and services 4,127 4,264 4,525 4,807 5,076 5,349
Eurozone GDP and componentsEurozone GDP and components
45EY Eurozone Forecast October 2015

Prices and cost indicators(annual percentage changes unless specified)
2014 2015 2016 2017 2018 2019
HICP headline inflation 0.4 0.2 1.2 1.5 1.6 1.6
Inflation ex. energy 0.9 0.8 1.1 1.3 1.5 1.6
GDP deflator 0.9 1.2 1.3 1.4 1.6 1.7
Import deflator 0.5 1.7 1.5 1.9 1.8 1.7
Export deflator –2.2 –1.7 2.5 2.5 1.9 1.9
Terms of trade –2.7 –3.4 1.0 0.7 0.2 0.1
Earnings 1.6 1.9 2.3 2.5 2.5 2.6
Unit labor costs 1.1 1.0 1.1 1.2 1.3 1.4
Output gap (% of GDP) –3.3 –3.0 –2.4 –1.8 –1.5 –1.2
Oil prices (€/barrel) 74.5 48.8 50.9 55.7 58.2 60.7
Euro effective exchange rate (1995 = 100) 123.6 113.7 112.6 112.6 113.8 115.2
2014 2015
Q1 Q2 Q3 Q4 Q1 Q2 Q3 Q4
HICP headline inflation 0.6 0.6 0.3 0.1 –0.3 0.2 0.2 0.7
Inflation ex. energy 1.0 0.9 0.8 0.7 0.6 0.8 0.8 1.1
GDP deflator 0.9 0.7 0.9 0.9 1.0 1.2 1.2 1.3
Import deflator –0.5 –0.4 1.5 1.4 2.6 3.0 0.3 1.0
Export deflator –2.7 –2.2 –1.8 –2.0 –3.0 –1.2 –2.3 –0.2
Terms of trade –2.2 –1.8 –3.3 –3.4 –5.6 –4.1 –2.6 –1.1
Earnings 1.8 1.5 1.6 1.6 1.6 1.9 1.9 2.1
Unit labor costs 0.9 1.2 1.3 1.3 1.0 1.1 0.9 1.1
Output gap (% of GDP) –3.3 –3.4 –3.4 –3.1 –3.1 –3.1 –2.9 –2.8
Oil prices (€/barrel) 79.0 80.0 76.8 61.1 47.9 55.8 46.1 45.6
Euro effective exchange rate (1995 = 100) 125.7 125.2 122.6 121.1 114.9 112.6 113.6 113.6
Note: HICP is the European Harmonized Index of Consumer Prices.
46 EY Eurozone Forecast October 2015

2014 2015 2016 2017 2018 2019
Employment 0.6 0.8 0.6 0.4 0.3 0.3
Unemployment rate (%) 11.6 11.0 10.7 10.3 10.0 9.7
NAIRU (%) 8.0 7.9 7.8 7.6 7.5 7.4
Participation rate (%) 76.5 76.5 76.6 76.7 76.8 76.9
Earnings 1.6 1.9 2.3 2.5 2.5 2.6
Unit labor costs 1.1 1.0 1.1 1.2 1.3 1.4
2014 2015
Q1 Q2 Q3 Q4 Q1 Q2 Q3 Q4
Employment 0.2 0.6 0.7 0.9 0.8 0.8 0.7 0.8
Unemployment rate (%) 11.8 11.6 11.5 11.5 11.2 11.1 10.9 10.9
NAIRU (%) 8.1 8.0 8.0 8.0 8.0 7.9 7.9 7.9
Participation rate (%) 76.4 76.5 76.6 76.6 76.4 76.5 76.5 76.5
Earnings 1.8 1.5 1.6 1.6 1.6 1.9 1.9 2.1
Unit labor costs 0.9 1.2 1.3 1.3 1.0 1.1 0.9 1.1
Labor market indicators(annual percentage changes unless specified)
Note: NAIRU is the non-accelerating inflation rate of unemployment; i.e., the rate of unemployment below which inflationary pressures would start to appear due to labor market tightness.
47EY Eurozone Forecast October 2015

Current account and fiscal balance
2014 2015 2016 2017 2018 2019
Trade balance (€b) 195.7 269.2 264.7 249.8 243.9 239.3
Trade balance (% of GDP) 1.9 2.6 2.5 2.3 2.1 2.0
Current account balance (€b) 210.8 287.5 293.8 280.4 279.1 272.0
Current account balance (% of GDP) 2.1 2.8 2.7 2.5 2.4 2.3
Government budget balance (€b) –247 –220 –191 –155 –128 –115
Government budget balance (% of GDP) –2.4 –2.1 –1.8 –1.4 –1.1 –1.0
Government debt (€b) 9,298 9,661 9,936 10,163 10,351 10,511
Government debt (% of GDP) 91.8 92.8 92.6 91.8 90.6 89.2
2005–09 2010–14 2015–19
Growth and incomes
Standard deviation of GDP growth rates 5.3 2.8 1.3
Growth rate gap (max — min) 5.5 8.6 4.3
Highest GDP per capita (Eurozone = 100) 251.9 240.0 235.2
Lowest GDP per capita (Eurozone = 100) 55.5 58.0 52.7
Inflation and prices
Standard deviation of inflation rates 2.5 1.4 0.9
Inflation rate gap (max — min) 6.9 2.7 1.4
Highest price level (Eurozone = 100) 134.3 138.7 141.7
Lowest price level (Eurozone = 100) 82.4 91.5 92.4
Measures of convergence and divergence within the Eurozone
48 EY Eurozone Forecast October 2015
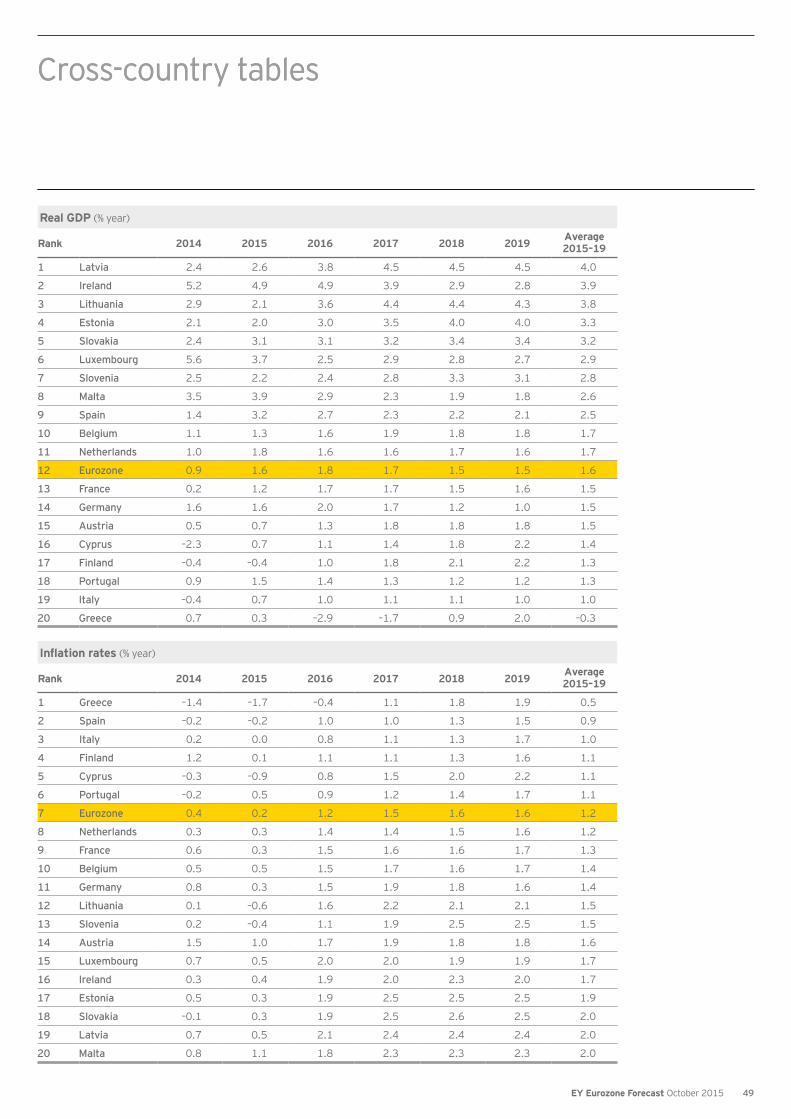
Real GDP (% year)
Rank 2014 2015 2016 2017 2018 2019 Average 2015–19
1 Latvia 2.4 2.6 3.8 4.5 4.5 4.5 4.0
2 Ireland 5.2 4.9 4.9 3.9 2.9 2.8 3.9
3 Lithuania 2.9 2.1 3.6 4.4 4.4 4.3 3.8
4 Estonia 2.1 2.0 3.0 3.5 4.0 4.0 3.3
5 Slovakia 2.4 3.1 3.1 3.2 3.4 3.4 3.2
6 Luxembourg 5.6 3.7 2.5 2.9 2.8 2.7 2.9
7 Slovenia 2.5 2.2 2.4 2.8 3.3 3.1 2.8
8 Malta 3.5 3.9 2.9 2.3 1.9 1.8 2.6
9 Spain 1.4 3.2 2.7 2.3 2.2 2.1 2.5
10 Belgium 1.1 1.3 1.6 1.9 1.8 1.8 1.7
11 Netherlands 1.0 1.8 1.6 1.6 1.7 1.6 1.7
12 Eurozone 0.9 1.6 1.8 1.7 1.5 1.5 1.6
13 France 0.2 1.2 1.7 1.7 1.5 1.6 1.5
14 Germany 1.6 1.6 2.0 1.7 1.2 1.0 1.5
15 Austria 0.5 0.7 1.3 1.8 1.8 1.8 1.5
16 Cyprus –2.3 0.7 1.1 1.4 1.8 2.2 1.4
17 Finland –0.4 –0.4 1.0 1.8 2.1 2.2 1.3
18 Portugal 0.9 1.5 1.4 1.3 1.2 1.2 1.3
19 Italy –0.4 0.7 1.0 1.1 1.1 1.0 1.0
20 Greece 0.7 0.3 –2.9 –1.7 0.9 2.0 –0.3
Inflation rates (% year)
Rank 2014 2015 2016 2017 2018 2019 Average 2015–19
1 Greece –1.4 –1.7 –0.4 1.1 1.8 1.9 0.5
2 Spain –0.2 –0.2 1.0 1.0 1.3 1.5 0.9
3 Italy 0.2 0.0 0.8 1.1 1.3 1.7 1.0
4 Finland 1.2 0.1 1.1 1.1 1.3 1.6 1.1
5 Cyprus –0.3 –0.9 0.8 1.5 2.0 2.2 1.1
6 Portugal –0.2 0.5 0.9 1.2 1.4 1.7 1.1
7 Eurozone 0.4 0.2 1.2 1.5 1.6 1.6 1.2
8 Netherlands 0.3 0.3 1.4 1.4 1.5 1.6 1.2
9 France 0.6 0.3 1.5 1.6 1.6 1.7 1.3
10 Belgium 0.5 0.5 1.5 1.7 1.6 1.7 1.4
11 Germany 0.8 0.3 1.5 1.9 1.8 1.6 1.4
12 Lithuania 0.1 –0.6 1.6 2.2 2.1 2.1 1.5
13 Slovenia 0.2 –0.4 1.1 1.9 2.5 2.5 1.5
14 Austria 1.5 1.0 1.7 1.9 1.8 1.8 1.6
15 Luxembourg 0.7 0.5 2.0 2.0 1.9 1.9 1.7
16 Ireland 0.3 0.4 1.9 2.0 2.3 2.0 1.7
17 Estonia 0.5 0.3 1.9 2.5 2.5 2.5 1.9
18 Slovakia –0.1 0.3 1.9 2.5 2.6 2.5 2.0
19 Latvia 0.7 0.5 2.1 2.4 2.4 2.4 2.0
20 Malta 0.8 1.1 1.8 2.3 2.3 2.3 2.0
Cross-country tablesCross-country tables
49EY Eurozone Forecast October 2015
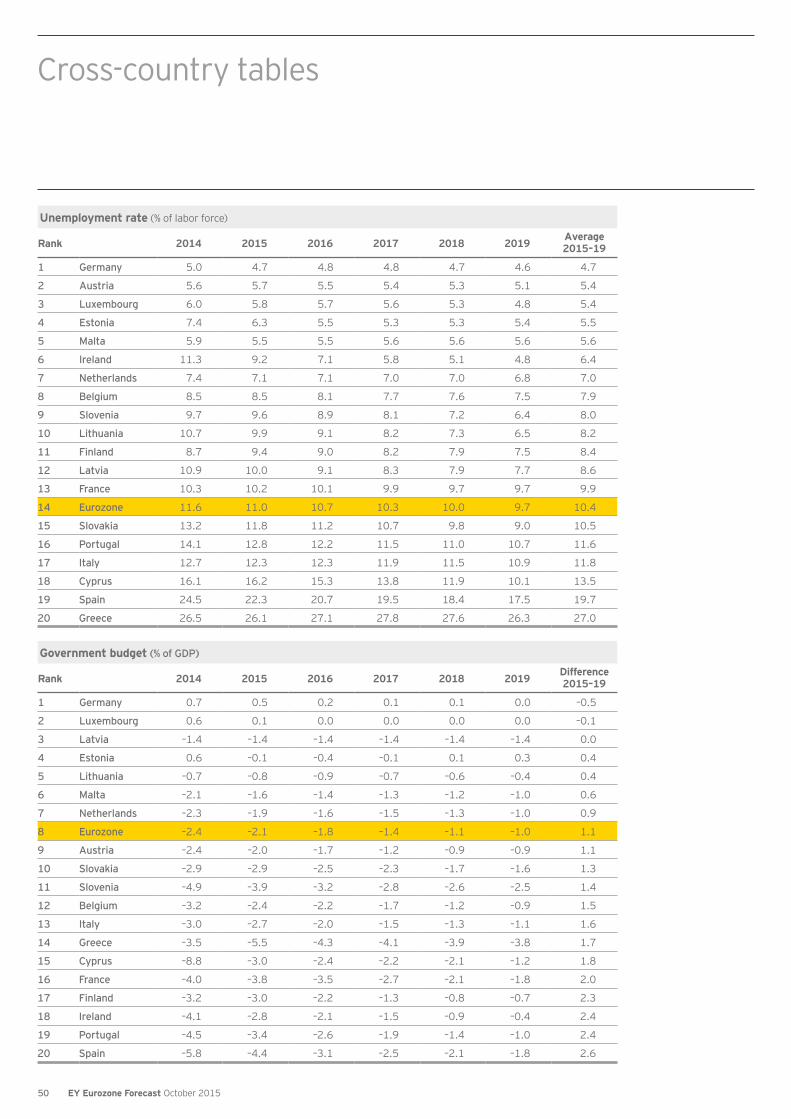
Unemployment rate (% of labor force)
Rank 2014 2015 2016 2017 2018 2019 Average 2015–19
1 Germany 5.0 4.7 4.8 4.8 4.7 4.6 4.7
2 Austria 5.6 5.7 5.5 5.4 5.3 5.1 5.4
3 Luxembourg 6.0 5.8 5.7 5.6 5.3 4.8 5.4
4 Estonia 7.4 6.3 5.5 5.3 5.3 5.4 5.5
5 Malta 5.9 5.5 5.5 5.6 5.6 5.6 5.6
6 Ireland 11.3 9.2 7.1 5.8 5.1 4.8 6.4
7 Netherlands 7.4 7.1 7.1 7.0 7.0 6.8 7.0
8 Belgium 8.5 8.5 8.1 7.7 7.6 7.5 7.9
9 Slovenia 9.7 9.6 8.9 8.1 7.2 6.4 8.0
10 Lithuania 10.7 9.9 9.1 8.2 7.3 6.5 8.2
11 Finland 8.7 9.4 9.0 8.2 7.9 7.5 8.4
12 Latvia 10.9 10.0 9.1 8.3 7.9 7.7 8.6
13 France 10.3 10.2 10.1 9.9 9.7 9.7 9.9
14 Eurozone 11.6 11.0 10.7 10.3 10.0 9.7 10.4
15 Slovakia 13.2 11.8 11.2 10.7 9.8 9.0 10.5
16 Portugal 14.1 12.8 12.2 11.5 11.0 10.7 11.6
17 Italy 12.7 12.3 12.3 11.9 11.5 10.9 11.8
18 Cyprus 16.1 16.2 15.3 13.8 11.9 10.1 13.5
19 Spain 24.5 22.3 20.7 19.5 18.4 17.5 19.7
20 Greece 26.5 26.1 27.1 27.8 27.6 26.3 27.0
Government budget (% of GDP)
Rank 2014 2015 2016 2017 2018 2019 Difference 2015–19
1 Germany 0.7 0.5 0.2 0.1 0.1 0.0 –0.5
2 Luxembourg 0.6 0.1 0.0 0.0 0.0 0.0 –0.1
3 Latvia –1.4 –1.4 –1.4 –1.4 –1.4 –1.4 0.0
4 Estonia 0.6 –0.1 –0.4 –0.1 0.1 0.3 0.4
5 Lithuania –0.7 –0.8 –0.9 –0.7 –0.6 –0.4 0.4
6 Malta –2.1 –1.6 –1.4 –1.3 –1.2 –1.0 0.6
7 Netherlands –2.3 –1.9 –1.6 –1.5 –1.3 –1.0 0.9
8 Eurozone –2.4 –2.1 –1.8 –1.4 –1.1 –1.0 1.1
9 Austria –2.4 –2.0 –1.7 –1.2 –0.9 –0.9 1.1
10 Slovakia –2.9 –2.9 –2.5 –2.3 –1.7 –1.6 1.3
11 Slovenia –4.9 –3.9 –3.2 –2.8 –2.6 –2.5 1.4
12 Belgium –3.2 –2.4 –2.2 –1.7 –1.2 –0.9 1.5
13 Italy –3.0 –2.7 –2.0 –1.5 –1.3 –1.1 1.6
14 Greece –3.5 –5.5 –4.3 –4.1 –3.9 –3.8 1.7
15 Cyprus –8.8 –3.0 –2.4 –2.2 –2.1 –1.2 1.8
16 France –4.0 –3.8 –3.5 –2.7 –2.1 –1.8 2.0
17 Finland –3.2 –3.0 –2.2 –1.3 –0.8 –0.7 2.3
18 Ireland –4.1 –2.8 –2.1 –1.5 –0.9 –0.4 2.4
19 Portugal –4.5 –3.4 –2.6 –1.9 –1.4 –1.0 2.4
20 Spain –5.8 –4.4 –3.1 –2.5 –2.1 –1.8 2.6
Cross-country tables
50 EY Eurozone Forecast October 2015

Please visit ey.com/eurozone
EY Eurozone Forecast: outlook for financial services — Spring 2015
• The EY Eurozone Forecast: outlook for financial services explores the implications of the latest Eurozone economic forecasts for banks, asset managers and insurers.
• Our latest forecast sees improving GDP, growth in consumer spending and falling unemployment across the Eurozone.
• Learn more and download the report at ey.com/fseurozone.
Download the latest EY Eurozone Forecast and learn more about it at ey.com/eurozone.
51EY Eurozone Forecast October 2015


About EYEY is a global leader in assurance, tax, transaction and advisory services. The insights and quality services we deliver help build trust and confidence in the capital markets and in economies the world over. We develop outstanding leaders who team to deliver on our promises to all of our stakeholders. In so doing, we play a critical role in building a better working world for our people, for our clients and for our communities.
EY refers to the global organization, and may refer to one or more, of the member firms of Ernst & Young Global Limited, each of which is a separate legal entity. Ernst & Young Global Limited, a UK company limited by guarantee, does not provide services to clients. For more information about our organization, please visit ey.com.
© 2015 EYGM Limited. All Rights Reserved.
EYG no. AU3443
BMC AgencyGA 0440_02891
ED None
In line with EY’s commitment to minimize its impact on the environment, this document has been printed on paper with a high recycled content.
This material has been prepared for general informational purposes only and is not intended to be relied upon as accounting, tax, or other professional advice. Please refer to your advisors for specific advice.
The views of third parties set out in this publication are not necessarily the views of the global EY organization or its member firms. Moreover, they should be seen in the context of the time they were made.
ey.com
About Oxford EconomicsOxford Economics was founded in 1981 to provide independent forecasting and analysis tailored to the needs of economists and planners in government and business. It is now one of the world’s leading providers of economic analysis, advice and models, with over 850 clients including international organizations, government departments and central banks around the world, and a large number of multinational blue-chip companies across the whole industrial spectrum.
Oxford Economics commands a high degree of professional and technical expertise, both in its own staff of over 150, including 90 economists, based in Oxford, London, Belfast, Paris, the UAE, Singapore, New York and Philadelphia, and through its close links with Oxford University and a range of partner institutions in Europe and the US. Oxford Economics’ services include forecasting for 200 countries, 100 sectors, and 3,000 cities and sub-regions in Europe and Asia; economic impact assessments; policy analysis; and work on the economics of energy and sustainability.
The forecasts presented in this report are based on information obtained from public sources that we consider to be reliable but we assume no liability for their completeness or accuracy. The analysis presented in this report is for information purposes only and Oxford Economics does not warrant that its forecasts, projections, advice and/or recommendations will be accurate or achievable. Oxford Economics will not be liable for the contents of any of the foregoing or for the reliance by readers on any of the foregoing.
EY | Assurance | Tax | Transactions | Advisory