ey renewable energy country attractiveness … energy country attractiveness index june 2014 chief...
TRANSCRIPT
RECAICreating a gold mineWith extraction industries facing increasing pressure from volatile energy prices and unreliable power supplies, it’s time for renewable energy to step in. But strategic partnerships are required.
Powering the America dreamFar from being a sector in crisis, clean energy deployment and investment opportunities in the US are growing as energy market dynamics change and new sources of capital appear.
Mitigate and prosperWith the most attractive renewable energy opportunities often in markets suffering from political instability or policy uncertainty, we look at the role of insurance in mitigating such risks.
A cautionary taleDomestic content requirements feature in many governments’ policy toolkits. Yet with market experience highlighting a less than perfect record, such policy measures should be handled with care.
The fi ght for the topAsia’s infl uence in the index continues to grow as China closes in on the US and other markets battle it out in the top 10. The entry of new markets and the rise of Latin America also feature.
Issue 41
Renewable energy country attractiveness index June 2014
2
Production contactsKlair WhiteRECAI Editor+44 161 333 [email protected]
Phil DominyRECAI Senior Advisor+44 139 228 [email protected]
Editorial contactsGil ForerRECAI Editorial Committee Chair+1 212 773 [email protected]
Ben WarrenRECAI Chief Editor+44 20 7951 [email protected]
Renewable energy country attractiveness index
June 2014
ChiefEditor’snote
If you build it, they will come, right? Wrong. The fact that renewable energy will make up an increasing proportion of the global energy mix is not in doubt — falling capital costs and minimal operating expenses will make the numbers stack up for energy consumers, stable and long-term returns will keep investors happy, and the reality of our planet’s fi nite resources will maintain a sustainability imperative.
However, this does not give the renewable energy sector a divine right to attract capital. Nor does it absolve policy-makers of the responsibility to establish well-considered, stable and transparent energy policy. To reap the full benefi ts of renewable energy, cost competition will continue to be critical, with capital costs and soft costs being two areas where there is still huge scope for improvement.
Rising from the ashes of the global economic recession, deep pools of capital — from public markets to institutional investors, from major corporations to individual consumers — are now searching for attractive investments. The renewables sector should therefore make it easier for them. Aggregation of assets, effective allocation of risk and reward and structuring of investor opportunities and capital instruments are just some of the ways developers and energy providers can attract and benefi t from highly liquid capital.
The use of risk mitigation tools, such as political risk insurance, will also help the sector tap into the most attractive opportunities, increasingly found in emerging markets. The need for tailored solutions and greater collaboration between energy providers and offtakers, exemplifi ed nowhere more than in the mining sector, are becoming critical to opening up new markets.
Our feature on domestic content requirements also fl ags the perils of ill-considered or blunt policy instruments to deal with the complex challenge of creating sustainable industry. Policy-makers must carefully deploy a range of measures to achieve long-term investment rather than short-term goals, often motivated by political objectives.
Is long-term policy-making too much to hope for? Perhaps not at a time when renewable energy continues to ask questions of the affordability of alternatives. Game on!
Ben Warren, RECAI Chief Editor
2 Chief Editor’s note3 At a glance ...4 Summary 6 Feature: RE-energizing the US
12 Key developments14 Our index16 Global view18 In-depth perspectives 18 Finance market — Covering the gap:
political risk insurance 20 Policy and regulation — Domestic
content: handles with care 22 In the market — Mining green to strike
gold
24 Country focus 24 China 26 India 28 Mexico 30 Ireland
32 Market to watch 32 Nigeria
34 Methodology35 Glossary36 EY global contacts36 Our global cleantech services37 Recent EY publications
Ben WarrenGlobal Cleantech Transactions Leader UK&I Environmental Finance Leader
3
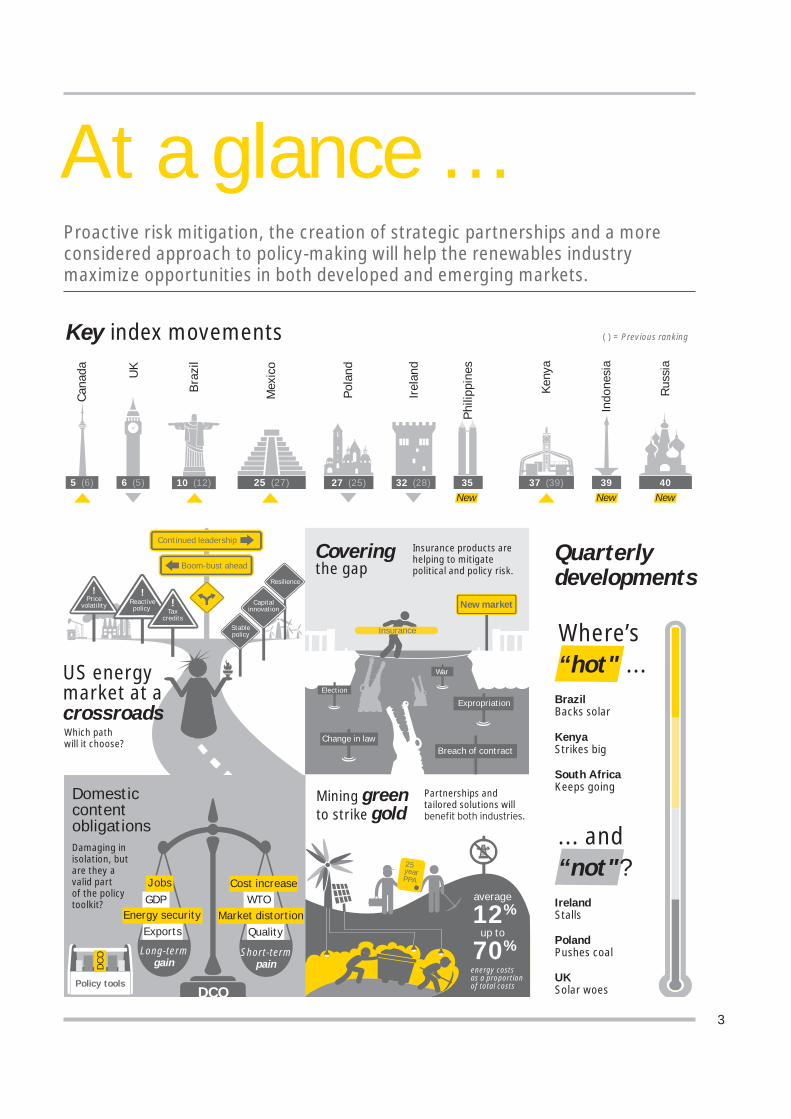
At a glance …Proactive risk mitigation, the creation of strategic partnerships and a more considered approach to policy-making will help the renewables industry maximize opportunities in both developed and emerging markets.
Quarterly developments
... and “not"?
PolandPushes coal
UKSolar woes
IrelandStalls
Where’s “hot" ...
KenyaStrikes big
South AfricaKeeps going
BrazilBacks solar
Key index movements ( ) = Previous ranking
UK
6 (5)
Irela
nd
32 (28)Ph
ilipp
ines
35New
Keny
a
37 (39) 39New
Indo
nesi
a
Boom-bust ahead
Continued leadership
New market
Covering the gap
Insurance products are helping to mitigate political and policy risk.
Partnerships and tailored solutions will
Mining green to strike gold
average
12%up to
70%energy costs as a proportion of total costs
25yearPPA
Insurance
Resilience
Stablepolicy
Pricevolatility
!Reactivepolicy
!
Taxcredits
! Capitalinnovation
US energymarket at a crossroadsWhich path will it choose?
Damaging in isolation, butare they avalid part of the policy toolkit?
Domestic content obligations
Policy tools
Energy securityExports
Jobs
DCO
GDPMarket distortion
Quality
Cost increaseWTO
Short-termpain
Long-termgainDCO
Election
Change in law
War
Expropriation
Breach of contract
Bra
zil
10 (12)
Mex
ico
25 (27)
Pola
nd
27 (25) 40New
Rus
sia
Cana
da
5 (6)
4
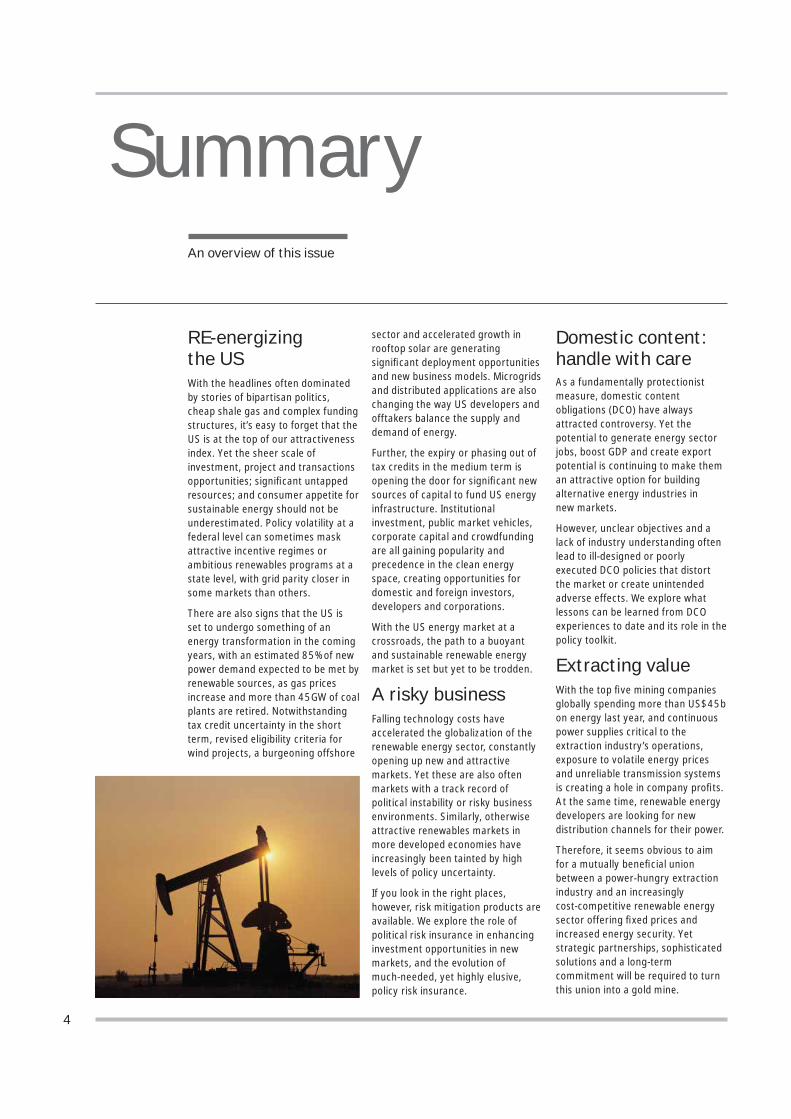
SummaryAn overview of this issue
RE-energizing the USWith the headlines often dominated by stories of bipartisan politics, cheap shale gas and complex funding structures, it’s easy to forget that the US is at the top of our attractiveness index. Yet the sheer scale of investment, project and transactions opportunities; signifi cant untapped resources; and consumer appetite for sustainable energy should not be underestimated. Policy volatility at a federal level can sometimes mask attractive incentive regimes or ambitious renewables programs at a state level, with grid parity closer in some markets than others.
There are also signs that the US is set to undergo something of an energy transformation in the coming years, with an estimated 85% of new power demand expected to be met by renewable sources, as gas prices increase and more than 45GW of coal plants are retired. Notwithstanding tax credit uncertainty in the short term, revised eligibility criteria for wind projects, a burgeoning offshore
sector and accelerated growth in rooftop solar are generating signifi cant deployment opportunities and new business models. Microgrids and distributed applications are also changing the way US developers and offtakers balance the supply and demand of energy.
Further, the expiry or phasing out of tax credits in the medium term is opening the door for signifi cant new sources of capital to fund US energy infrastructure. Institutional investment, public market vehicles, corporate capital and crowdfunding are all gaining popularity and precedence in the clean energy space, creating opportunities for domestic and foreign investors, developers and corporations.
With the US energy market at a crossroads, the path to a buoyant and sustainable renewable energy market is set but yet to be trodden.
A risky businessFalling technology costs have accelerated the globalization of the renewable energy sector, constantly opening up new and attractive markets. Yet these are also often markets with a track record of political instability or risky business environments. Similarly, otherwise attractive renewables markets in more developed economies have increasingly been tainted by high levels of policy uncertainty.
If you look in the right places, however, risk mitigation products are available. We explore the role of political risk insurance in enhancing investment opportunities in new markets, and the evolution of much-needed, yet highly elusive, policy risk insurance.
Domestic content: handle with careAs a fundamentally protectionist measure, domestic content obligations (DCO) have always attracted controversy. Yet the potential to generate energy sector jobs, boost GDP and create export potential is continuing to make them an attractive option for building alternative energy industries in new markets.
However, unclear objectives and a lack of industry understanding often lead to ill-designed or poorly executed DCO policies that distort the market or create unintended adverse effects. We explore what lessons can be learned from DCO experiences to date and its role in the policy toolkit.
Extracting valueWith the top fi ve mining companies globally spending more than US$45b on energy last year, and continuous power supplies critical to the extraction industry’s operations, exposure to volatile energy prices and unreliable transmission systems is creating a hole in company profi ts. At the same time, renewable energy developers are looking for new distribution channels for their power.
Therefore, it seems obvious to aim for a mutually benefi cial union between a power-hungry extraction industry and an increasingly cost-competitive renewable energy sector offering fi xed prices and increased energy security. Yet strategic partnerships, sophisticated solutions and a long-term commitment will be required to turn this union into a gold mine.
5
Eye on the prizeAlthough the top of the index has seen few major ranking shifts this issue, there is a sense that a storm is brewing that could shake up the top 10 in the months ahead.
The score gap has once again narrowed between the US and China. Notwithstanding the signifi cant deployment and investment opportunities in the US (see our article on page 6), overwhelming capacity forecasts in China and signs of a less centralized approach that could improve access to the market to private and foreign investors increase the likelihood of a Chinese challenge for the top spot.
Asia dominanceJapan and India look poised to overtake their closest rivals in the index, Germany and the UK, respectively. Yet the signifi cant investment potential of these two markets is being hampered in the short term. Japan’s recent national energy plan has created mixed signals over the country’s long-term energy strategy while high fi nancing costs and a subsidy backlog are jeopardizing project bankability in India.
This issue also sees the Philippines and Indonesia enter the index, given ambitious renewables targets, stable incentive regimes and high energy demand driven by a large and growing population.
Best of the restMixed fortunes have kept Germany in third place, while the prospect of solar market reforms have sparked another period of uncertainty for developers and investors in the UK, pushing it down to sixth place below Canada.
Strong capacity forecasts and approval of a new feed-in tariff (FIT) regime for wind projects have helped France up to eighth place above Australia, where a potential cancelation the Renewable Energy Target is slowing investment.
Brazil, Chile and South Africa have continued their climb up the index, with Brazil now featuring in the top 10. Structured offtake mechanisms in Brazil and South Africa continue to secure signifi cant volumes of capacity through competitive bidding while more large-scale projects and a proposed carbon tax have boosted Chile’s ranking.
High electricity prices, strong project pipelines and planned capacity auctions have taken Turkey and Mexico up to 20th and 25th place, respectively. Meanwhile, the US$870m fi nancing of the 300MW Lake Turkana project has helped move Kenya up to 37th place.
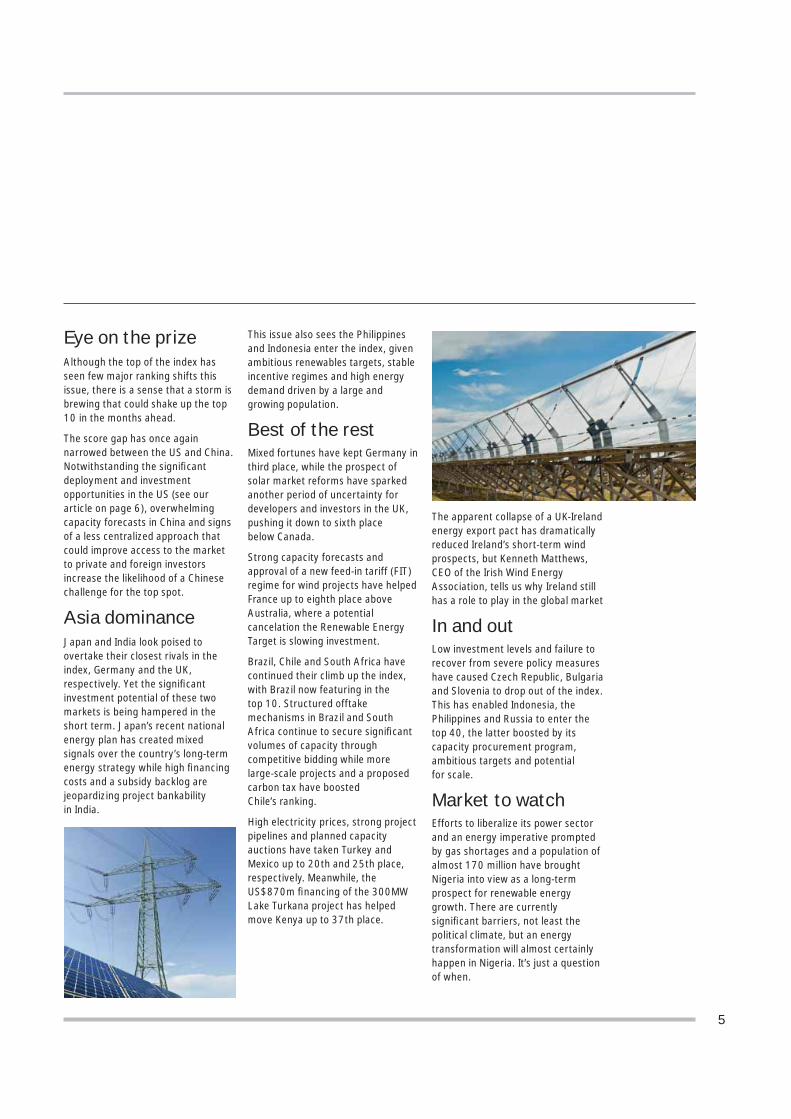
The apparent collapse of a UK-Ireland energy export pact has dramatically reduced Ireland’s short-term wind prospects, but Kenneth Matthews, CEO of the Irish Wind Energy Association, tells us why Ireland still has a role to play in the global market
In and outLow investment levels and failure to recover from severe policy measures have caused Czech Republic, Bulgaria and Slovenia to drop out of the index. This has enabled Indonesia, the Philippines and Russia to enter the top 40, the latter boosted by its capacity procurement program, ambitious targets and potential for scale.
Market to watchEfforts to liberalize its power sector and an energy imperative prompted by gas shortages and a population of almost 170 million have brought Nigeria into view as a long-term prospect for renewable energy growth. There are currently signifi cant barriers, not least the political climate, but an energy transformation will almost certainly happen in Nigeria. It’s just a question of when.

6
Tax credit expiries, cheap shale gas and congressional gridlock have painted the picture of a US renewable energy market in crisis. Yet with a fl ourishing solar market, changing energy dynamics and signs of a reinvigorated capital market, the US may well still be the land of opportunity.
Dash for gas: friend or foe?The fate of the US renewable energy market has become closely intertwined with shale gas, with increased extraction activity and low prices weakening the appetite and relative cost-competitiveness of renewables. However, the pending retirement of 45GW of coal-based capacity could disrupt this trend, not only increasing demand for renewables directly but also creating upward pressure on gas prices as demand increases to fi ll the gap left by coal. The potential for increased gas exports to Europe in the wake of the Russia-Ukraine confl ict could also increase the need for domestic renewable energy, though more speculative and long-term. Credit Suisse forecasts that 85% of future demand growth for power through to 2025, including the impact of coal retirements, could be met by renewable energy generation, representing over 100GW of additional capacity.
Further, the US gas boom should not necessarily be thought of as confl icting with the green agenda. The ability of gas-fi red generators to scale their output up or down by the hour can provide the necessary fl exibility to integrate more variable supplies from wind and solar projects into the grid. Increased gas price volatility should also prompt greater diversity, given that stable renewable energy prices can be visible through 25-year contracts compared to typical gas price hedges of just 5 years.
Blown off course but back on trackThe US wind market is currently in a state of recovery. The late renewal of the production tax credit (PTC) in early 2013 had stalled investment decisions in 2012 and reduced build-out activity in early 2013 as a consequence. However, changes to the eligibility criteria last year, requiring projects to simply “begin construction” by the new expiry date of December 2013, have effectively extended the PTC’s benefi ts through to 2015, prompting a signifi cant pickup in construction activity in late 2013. According to MAKE, more than 19GW of new capacity was under development by March 2014 for installation by 2016.
Efforts are now focused on securing another renewal of the PTC, which many see as critical to sustaining medium-term growth.Positively, both the PTC and investment tax credit (ITC) have been
included, with bipartisan support, in a broader tax extenders package that would see the construction threshold pushed out to 2015, though there is some skepticism as to whether the bill will be passed ahead of the November 2014 midterm elections. However, with the unsubsidized levelized cost of electricity (LCOE) for wind projects expected to reach grid parity in key US markets in 2016 and most of the country by 2023, long-term prospects for wind deployment are still relatively robust after a potential slowdown in 2017 to 2018 (assuming a PTC renewal in late 2014). Looking further ahead, the IEA forecasts 154GW of wind capacity in the US by 2035 (new policies scenario), up from 59GW at the end of 2013.
US wind capacity outlook, 2013–20e
Source: EY analysis of multiple datasets produced by BNEF, MAKE, BTM Consult and Recharge Insight
Solar to let: downsizing triggers growth While the long-term prospects for wind indicate recovery and then growth, the buoyancy of the US solar market is more immediately obvious. The country is host to some of the world’s largest projects, including the 300MW Topaz solar farm (550MW once complete) and the recently commissioned 392MW Ivanpah CSP project, both in California. The IEA forecasts 99GW of solar power by 2035, compared to just 13GW at the end of 2013.
RE-energizing the US
1.1
6.3 6.3
3.9
2.7
3.9
4.7
5.5
50
55
60
65
70
75
80
85
90
95
100
-
1
2
3
4
5
6
7
2013 2014e 2015e 2016e 2017e 2018e 2019e 2020e
(GW
)
Cumulative wind capacityOnshore wind Offshore wind
GW
7
However, the market is also seeing an accelerated shift toward residential and commercial rooftop applications, with demand for utility-scale projects dwindling as an increasing number of states meet their respective renewable portfolio standard (RPS) obligations. Goldman Sachs expects the booming rooftop market to grow by 45% per year between 2013 and 2016, compared to just 8% for large-scale solar installations. This shift has also been driven by the evolution of the solar leasing business model in the US, which eliminates the up-front cost of panel installation for homeowners and businesses and provides rental cash fl ows for the leasing company. SolarCity and Sunrun have pioneered this model to date, though it is rapidly gaining traction across the country. At least 22 solar lease funds were raised in 2013 according to Mercom Capital, totaling about US$3.34b, and in April this year, SunPower and Google unveiled a US$250m solar leasing program.
50 shades of greenCountry-wide capacity projects and high-profi le political wrangling at a federal level make it easy to forget that the US is not one market but 50, many of which are larger than whole European countries. In addition to varying levels of natural resources, each state is characterized by different targets, incentive programs, electricity pricing, infrastructure quality and fossil fuel exposure. While this makes it more diffi cult to immediately identify the most attractive sites, it also signifi cantly expands the range of deployment and investment opportunities.
Mandatory and voluntary RPS targets are in place for 30 and 8 states respectively, and although many have already met near-term obligations, some are now pulling in renewable energy-supported demand from later in the decade. Texas surpassed its RPS long ago but is still expected to install more than 8GW of wind power in the next three years. This is also largely driven by a forecast negative power capacity reserve margin as early as this year. A 2GW defi cit is also projected for the MISO network serving the northern Plains states by 2016. While most other markets have suffi cient capacity at present, several states will start to breach the reference margin levels by 2023 according to MAKE Consulting, triggering a need to procure new capacity over the next few years to maintain continuous system reliability.
High capacity factors driven by strong natural resource are helping some states reach grid parity quicker than others. The best wind farms in areas such as south Texas, for example, can be built for US$60/MWh on an LCOE basis compared to US$65/MWh for a high-effi ciency gas turbine, according to BNEF. State-specifi c incentive and funding programs are also having an impact. In April, the Governor of New York agreed to invest US$1b in incentives for solar PV through to 2023, and while favorable policies in New Jersey and Maryland are also driving momentum for offshore wind. Progress in the offshore sector has been slow to date, but with construction on the fi rst major project and a third government tender scheduled for this year, the signing of more than US$1b of supply contracts, and almost 4GW of projects already under in advanced stages of development, 2014 looks set to be a crucial year for crystalizing some of the sector’s signifi cant potential.
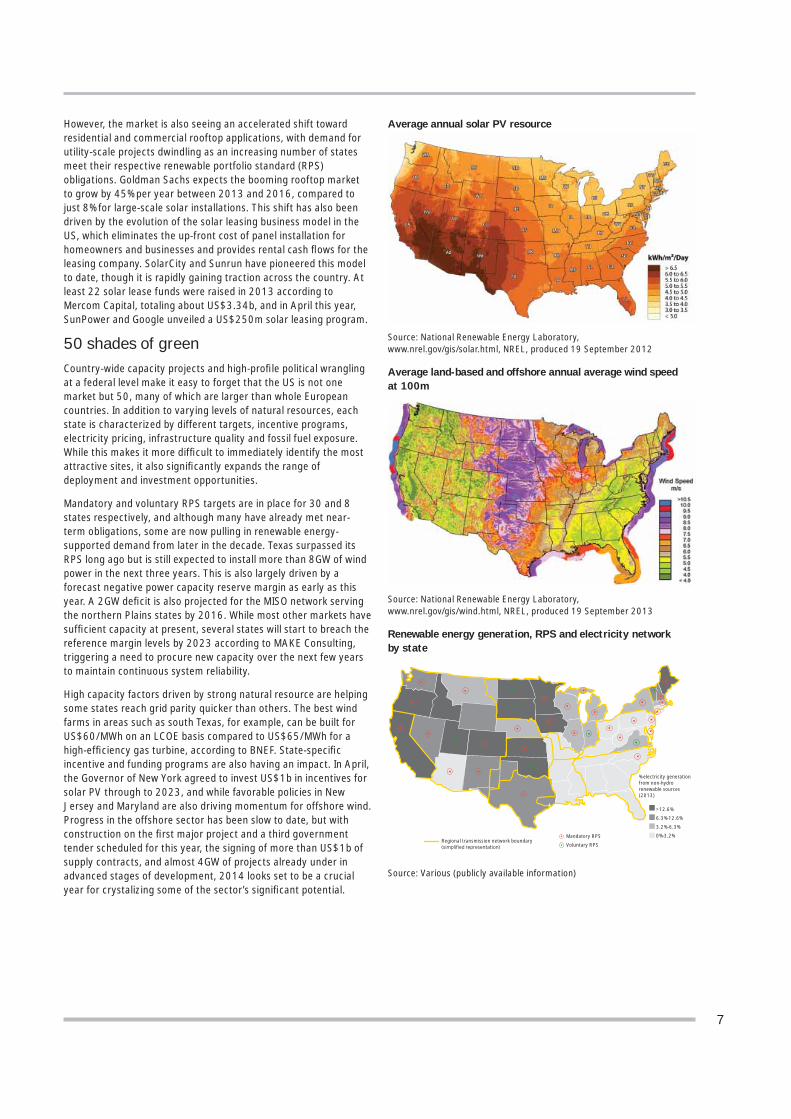
Average annual solar PV resource
Source: National Renewable Energy Laboratory,www.nrel.gov/gis/solar.html, NREL, produced 19 September 2012
Average land-based and offshore annual average wind speed at 100m
Source: National Renewable Energy Laboratory,www.nrel.gov/gis/wind.html, NREL, produced 19 September 2013
Renewable energy generation, RPS and electricity network by state
Source: Various (publicly available information)
>12.6%
6.3%-12.6%
3.2%-6.3%
0%-3.2%
% electricity generation from non-hydro renewable sources (2013)
Mandatory RPS
Voluntary RPSRegional transmission network boundary
8
Finding the gapsWhile the US wind turbine supply market remains highly concentrated, the absence of national dominance in most other parts of the value chain creates an opportunity for US and foreign companies of all sizes to carve out state-level or regional demand for their services. In the wind sector, for example, a focus on deployment and increasing project scale has created a need for greater operations and maintenance services. While major players such as Vestas are now actively trying to bolster such offerings in the US, state-level fragmentation should still allow a reasonable level of competition.
Vertical integration is also becoming increasingly prominent, with leading residential solar fi rms such as SolarCity and Vivint Solar now providing in-house sales, installation and fi nancing services. This provides opportunities for large international companies to act as vehicles for such integration in the US market, as well as smaller companies willing to be absorbed into an integrated value chain. There also remains signifi cant opportunity to reduce the “soft costs” of residential solar: while there is general consensus that component costs will continue to fall, the US must now focus on reducing the other project delivery costs that are making it more expensive than Europe and Asia, such as customer acquisition, permitting, installation and balance of system costs. Again, this should open up the market to increased competition at both national and state levels.
Off the gridDistributed applications and microgrids are playing an increasing role in US efforts to increase the resilience of its energy infrastructure in the wake of severe weather events such as Hurricane Sandy, which turned the lights out on more than 8.5 million Americans.
Once mainly used by colleges and hospitals, energy supplies with reduced reliance on national or regional grid networks are becoming increasingly prevalent in businesses and government entities. Navigant Consulting claims that more than 50 US military bases now operate, plan or are testing microgrids. Analysis released by the research group in 2013 also forecasts that the US will install 17.9GW of distributed solar PV capacity alone in the period 2013 to 2018, representing more than US$47b.
It should be noted that although solar PV often attracts the most attention, distributed energy applications span many technologies. Combined heat and power (CHP) systems, backup generators and demand response technology make up a large proportion of untapped distributed energy sources. It is reported that almost all the large-scale microgrid systems that kept running amid grid outages during Hurricane Sandy were centered around CHP systems, and in July, the Federal Energy Regulatory Commission issued an order urging utilities to pay microgrids higher prices for backup power.
An imperative to increase the resilience of US energy supplies and increased demand for localized energy, including solar leasing applications, are creating opportunities for innovation and investment in both technology and business model evolution. With the US by no means the only market facing severe weather events and transmission infrastructure challenges, developments in the US will likely have far-reaching implications for other markets around the world.
Political push in the right direction The adverse impact of bipartisan politics on the creation of a stable and long-term renewable energy policy in the US is well documented and unlikely to change dramatically anytime soon. However, a renewed focus on President Barack Obama’s “all of the above” approach to energy and an apparent push on climate change mitigation measures are creating some encouraging ripples in the political pond that should not only boost deployment but also inject much-needed confi dence into the US clean energy market.
The White House, for example, is looking to accelerate the permitting of another 10GW of renewable energy capacity on public lands, while Congress is reportedly moving forward a “signifi cant piece” of climate-change legislation as early as 2015. The revival of a US$4b loan guarantee program, President Obama’s backing of the Environment Protection Agency’s carbon emission regulatory proposals and an end to funding for new coal plants are also positive news for renewables.
9
No to policy uncertainty, yes to capital Policy uncertainty over issues such as the PTC and ITC incentive regimes are, however, continuing to drive unhealthy boom-bust cycles and greater clarity is needed to help stakeholders make long-term energy project and offtake decisions. Yet, with uncertainty over the phasing out or expiry of tax credits across various technologies still prevalent — having already technically occurred for wind and scheduled for the end of 2016 for solar, when the ITC is expected to drop from 30% of project value to 10% — the sector will need to drive down costs and take advantage of changing energy mix dynamics to prosper in a post-subsidy environment. The expiry of tax credits will also likely prompt the withdrawal of tax equity fi nancing, creating a need, and an opportunity, for new sources of capital. And lots of it.
Goodbye tax equity, hello silver liningTo be clear, tax equity is still likely to fund the vast majority of renewable energy activity in the US in the short to medium term. However, given the time and expense associated with structuring projects to attract tax equity investors and the complex requirements that have resulted in fewer than 20 active investors, the market is now eager to explore innovative vehicles and sources of capital for original fi nancing and refi nancing.
The National Renewable Energy Laboratory (NREL) estimates that by 2017, 20GW of wind and solar projects will be past their recapture period (the minimum time tax equity investors must hold onto their asset to avoid a clawback of benefi ts) and could be suitable for refi nancing. It forecasts that wind projects in 2013 alone could represent US$10b in freed up capital for reinvestment.
Recent trends are already indicating that the public capital markets are becoming a viable deep pool of capital for US renewable energy activity. As well as lowering transaction costs and increasing the availability and liquidity of funds, analysis by NREL indicates that greater use of public capital can lower the LCOE of a solar or wind project by 8%–16%.
Yieldcos go large From an equity perspective, yieldcos are becoming a popular route to capital for renewable energy fundraising. These publically traded companies are formed to own de-risked (i.e., operational) assets that produce predictable, long-term and stable cash fl ows, a large proportion of which are then paid out as above-average dividend yields. Typically, listed yieldcos offer a projected 5%–6% yield over
15 or more years, compared with Federal Reserve interest rates below 0.5% and 10-year government bond yields of around 2.75%.
While the trend originated in the UK, the sheer size and geographic diversity of the US market are helping to create greater fund differentiation, while average fund size is also much larger. The biggest US yieldcos in the sector to date — NRG Yield Inc. and Pattern Energy Group, both in 2013 — were close to US$1b in market capitalization terms, compared to around £350m (US$588m) for the largest UK listed fund. More recently, Abengoa announced plans to launch a US yieldco with a market capitalization of US$600m, while SunEdison secured a US$250m facility from Goldman Sachs in early April to help launch its fi rst yieldco. First Solar and SunPower are also reportedly considering yieldco options.
Although yieldcos provide an enticing opportunity to monetize cash-generating assets, a sizable portfolio is required to build the cash fl ows required to launch such an entity and justify the transaction costs. There is also some skepticism about the depth of the public market equity pool for such deals compared to, for example, direct institutional investment (see section on private placements below).
SolarCity blazes IPO trailIn addition to asset-based yieldcos, capital is also being raised in the US via IPOs of the underlying development or supply chain companies. SolarCity, which made its market debut in December 2012 and issued secondary stock and convertible debt offerings last year, remains one of the most high-profi le examples, though a tax equity gap could prompt a surge in IPOs in the years ahead. In March 2014, Chinese solar panel manufacturer ET Solar Group, announced plans to fl oat its project development business in the US to raise US$250m, the fi rst IPO of a China-based solar company in the US market since JinkoSolar in May 2010. Sungevity Inc., a closely held US developer of rooftop solar systems, also announced in May that is it is considering an IPO.
Climbingcapital hill

10
Not so taxing equityThe US is host to other public capital equity models that, although not currently widely applicable to renewable energy, may become relevant in the future or act as prototypes for other markets. Master limited partnerships (MLPs) combine the tax benefi ts of a partnership (i.e., income not taxed at the corporate level) with the fundraising advantages of a corporation. Renewable energy is currently excluded from the natural resources eligibility criteria, in part due to tax equity confl icts, though a bill introduced in 2012 is still working its way through Congress to open up MLP structures to renewable energy.
Real estate investment trusts (REITs), based on pools of income from real estate assets, are also generally not taxed at the corporate level. Wind and solar assets have not technically been recognized as real property by the US tax agency to date, though in 2013, clean energy fi nancier Hannon Armstrong Sustainable Infrastructure did secure approval to form a REIT with its clean energy assets, the fi rst such favorable ruling. In May 2014, however, the Internal Revenue Service released proposed regulations that could see solar systems that are part of a real estate project solely for the benefi t of that project (as opposed to equipment that is being leased or operated to sell electricity) become REIT eligible.
Private placements to dominateNotwithstanding some signifi cant recent success stories for listed yieldco vehicles and other equity models, there are some valid concerns around whether public equity is a sustainable and long-term source of funding for the capital-intensive renewable energy sector. Private placements, whereby institutional capital (debt and equity) is invested into renewable energy assets through private conduits or via direct investments, are likely to surpass the public equity markets as the preferred way to raise capital. Capital pools are deeper, and transaction costs are likely to be signifi cantly less than public deals.
An EY survey of institutional investors in 2013 revealed that nearly one-third of respondents expect their allocation to renewable energy to increase in the next three years and that more than one in four respondents have already made, or are considering, renewable energy infrastructure investments in the US. According to the Climate Policy Initiative, the US accounts for 57% of all OECD pension assets and one-quarter of OECD insurance assets.
Small steps but signifi cant prizeDespite the trillions of dollar of assets under management, institutional investment into renewables has been relatively limited to date. This is primarily due to a lack of suffi ciently sized deals, suggesting the industry needs to fi nd ways to aggregate assets more effectively. However, another barrier has been a lack of effective routes to market for investments, i.e., little has been done to structure capital to meet the needs of these investors. Clearly, policy uncertainty across many markets has also not been helpful in persuading these investors that the renewable energy sector is a relative safe haven for long-term capital.
However, the likely withdrawal of tax equity fi nancing in the long run; the prospect of stable long-term returns; and improved aggregation, structuring and presentation of renewable energy
assets to meet institutional investor requirements are expected to boost funding in clean energy companies and assets. The creation of Capistrano Wind Partners LLC by leading US fi nancial services provider TIAA-CREF and two partners in 2012 to develop and own wind assets in North America indicates that there is appetite for direct institutional investment as well as through private equity or infrastructure funds.
It is just a question of time before new conduits for these investments are formed, and private deals, not public ones, take over the headlines.
Securities in numbers On the debt side, the US renewables market is also seeing increased securitization activity, the process of transforming illiquid assets (such as the cash fl ows from a solar lease or power purchase agreement) into standardized, tradable instruments such as bonds, often split into risk-differentiated tranches. To date, these have more typically been used to fi nance multibillion dollar utility-scale projects: in the last two years, project bonds have been issued for the construction of MidAmerican's 550MW Topaz and 579MW Solar Star projects and the refi nancing of NextEra’s 40MW St. Clair project.
However, in late 2013, SolarCity made a splash by announcing a bond backed by a pool of its solar leasing contracts, a fi rst for US residential projects. Carrying a BBB+ rating and a yield of 4.80%, the US$54.4m offering was well received and may be followed by US$200m of additional notes this year. Given the shift in demand toward smaller-scale rooftop applications and the evolution of the solar leasing model, this is likely to become an increasingly popular source of low-cost fi nancing, with SolarCity rival SunPower already announcing plans to issue bonds this year.
Similar to the yieldco, these securitized offerings require signifi cant scale and name recognition and will therefore be challenging for new or inexperienced developers. However, the pooled nature of the assets should still open up opportunities for smaller projects or developers with less fi nancial backing.
11
Moving with the crowdMoving from the formal public capital markets to the informal but no less public individual investor market, “crowdfunding” is increasingly making headlines as an innovative source of fi nancing for small-scale projects across the US. According to SolarCity, which has rapidly established itself as the biggest US solar power provider by market value, crowdfunding may supply the rooftop solar sector with US$5b of investment within fi ve years, more than 50 times the amount raised to date. Mosaic Inc., the operator of an online fi nancing system enabling individuals to invest in commercial solar plants — and one of the pioneering US companies in this space — recently launched a new peer-to-peer network for people to directly fund residential projects, effectively connecting individuals seeking funding with those providing loans. Unlike the leasing model, it allows people to own their power systems, though still with little or no up-front cost.
There are some concerns that this funding model could be more sensitive to downturns given the “ordinary people” investor base. Further, ambiguous crowdfunding investment laws in the US mean it is currently in an experimentation phase, though this also increases opportunities for innovation (e.g., some states disallow investment returns, prompting companies to explore alternative payback such as discounts on utility bills). Yet, as a fairly new and untapped source of capital, the US is certainly a good testing ground given the size and diversity of its residential and commercial markets, creating opportunities for entrepreneurs and smaller developers outside the US as well as within.
Beyond search engine optimizationSome of the most high-profi le corporations in the world are also now heading into the US renewables space, having identifi ed not only energy mix optimization opportunities for their own operations, but also the prospect of long-term and stable returns.
Google’s tax-equity investments in energy, for example, are surpassed only by JPMorgan Chase & Co., US Bancorp and MetLife Inc., according to BNEF. With such companies looking for new ways to utilize deep pools of cash while also giving credence to their sustainability agendas, there is no reason to assume that corporate capital won’t continue to fl ow into the sector as alternative funding vehicles take hold in the US. Google’s clean energy investments also highlight opportunities for long-term value chain partnerships: in late 2013, Google and private equity fi rm KKR & Co. fi nanced six projects in California and Arizona being developed by Recurrent Energy, having invested US$94m in four projects with the same partners two years earlier.
Corporations from all sectors, but particularly those with energy-intensive operations, are also becoming key offtakers for off-site and on-site renewable energy capacity, in a bid to reduce exposure to volatile fossil fuel prices and minimize business disruption. In late 2013, for example, Microsoft signed a 20-year PPA with Renewable Energy Systems Americas for the electricity from its 110MW Keechi wind project in Texas. Other corporations pursuing long-term low-carbon energy strategies include P&G, Ikea, Facebook, L'Oréal, Apple and Mars.
US energy market at a crossroadsBoom–bust cycles triggered by the expiry of key tax credits and reactive policy-making, the realization of RPS obligations and the impact of cheap shale gas on renewable energy’s march toward grid parity threaten to dampen deployment activity and depress investor appetite.
But there is another path. Characterized by greater policy certainty, innovative business models that leverage the scale and diversity of deployment opportunities at a state level, and attractive funding models for a broad range of investors, this path must be actively chosen by stakeholders across the sector.
In return, the renewable energy value chain will profi t from increased demand and cheaper sources of capital, investors will secure long-term and stable returns, and the US economy as a whole will benefi t from a more secure and resilient energy market — particularly critical in light of the increasingly devastating impact of natural disasters such as Hurricane Sandy on infrastructure and business continuity.
But this path should also be open to the international community. It's food for thought perhaps, that only 20% of foreign direct investment into the US currently goes toward greenfi eld investments, compared to 50%–60% in China. Given that renewable energy represents only 8% of US electricity generation (excluding hydro), there are signifi cant opportunities for foreign businesses, large and small, to participate in the US energy revolution.
The path is set; the choice must now be made.
12
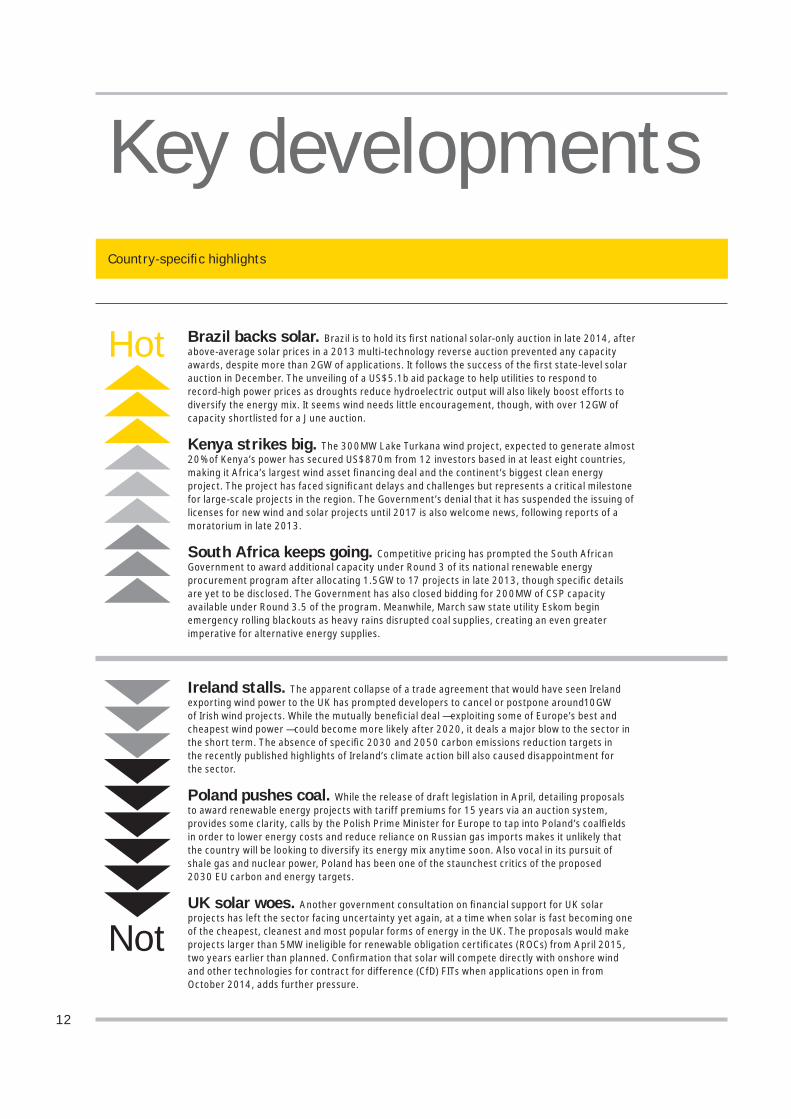
Brazil backs solar. Brazil is to hold its fi rst national solar-only auction in late 2014, after above-average solar prices in a 2013 multi-technology reverse auction prevented any capacity awards, despite more than 2GW of applications. It follows the success of the fi rst state-level solar auction in December. The unveiling of a US$5.1b aid package to help utilities to respond to record-high power prices as droughts reduce hydroelectric output will also likely boost efforts to diversify the energy mix. It seems wind needs little encouragement, though, with over 12GW of capacity shortlisted for a June auction.
Kenya strikes big. The 300MW Lake Turkana wind project, expected to generate almost 20% of Kenya’s power has secured US$870m from 12 investors based in at least eight countries, making it Africa’s largest wind asset fi nancing deal and the continent’s biggest clean energy project. The project has faced signifi cant delays and challenges but represents a critical milestone for large-scale projects in the region. The Government’s denial that it has suspended the issuing of licenses for new wind and solar projects until 2017 is also welcome news, following reports of a moratorium in late 2013.
South Africa keeps going. Competitive pricing has prompted the South African Government to award additional capacity under Round 3 of its national renewable energy procurement program after allocating 1.5GW to 17 projects in late 2013, though specifi c details are yet to be disclosed. The Government has also closed bidding for 200MW of CSP capacity available under Round 3.5 of the program. Meanwhile, March saw state utility Eskom begin emergency rolling blackouts as heavy rains disrupted coal supplies, creating an even greater imperative for alternative energy supplies.
Ireland stalls. The apparent collapse of a trade agreement that would have seen Ireland exporting wind power to the UK has prompted developers to cancel or postpone around10GW of Irish wind projects. While the mutually benefi cial deal — exploiting some of Europe’s best and cheapest wind power — could become more likely after 2020, it deals a major blow to the sector in the short term. The absence of specifi c 2030 and 2050 carbon emissions reduction targets in the recently published highlights of Ireland’s climate action bill also caused disappointment for the sector.
Poland pushes coal. While the release of draft legislation in April, detailing proposals to award renewable energy projects with tariff premiums for 15 years via an auction system, provides some clarity, calls by the Polish Prime Minister for Europe to tap into Poland’s coalfi elds in order to lower energy costs and reduce reliance on Russian gas imports makes it unlikely that the country will be looking to diversify its energy mix anytime soon. Also vocal in its pursuit of shale gas and nuclear power, Poland has been one of the staunchest critics of the proposed 2030 EU carbon and energy targets.
UK solar woes. Another government consultation on fi nancial support for UK solar projects has left the sector facing uncertainty yet again, at a time when solar is fast becoming one of the cheapest, cleanest and most popular forms of energy in the UK. The proposals would make projects larger than 5MW ineligible for renewable obligation certifi cates (ROCs) from April 2015, two years earlier than planned. Confi rmation that solar will compete directly with onshore wind and other technologies for contract for difference (CfD) FITs when applications open in from October 2014, adds further pressure.
Key developmentsCountry-specifi c highlights
Hot
Not
13
Deal, investment and policy highlights
Key developments
A deal of three halves. The battle for Alstom has already cemented its claim as one of the most exciting deals of the year. Vocal opposition by the French Government to GE’s US$17b offer for the French manufacturer’s energy assets has opened the door for a rival bid from Siemens, based on a potential asset swap that would create two major European businesses in the energy and rail industries. A counteroffer is expected from Siemens once it has examined Alstom’s fi nancial records, though it is also possible that an Alstom-Siemens deal could encounter European competition barriers.
The French Government, with the power to block deals involving strategic national assets, is favoring a deal with Siemens as a means of preserving jobs through the proposed asset exchange. Some commentators have suggested that a strong sense of nationalism is also behind the Government’s unwillingness to sign Alstom over to an American company. However, while the Government has opposed GE’s bid “as it stands,” it does seem willing to negotiate, though it has already indicated it would push for state-controlled Areva to acquire Alstom’s offshore operations should GE be successful. And so the drama continues.
EU lockdown. The implication of events in Ukraine on Europe’s energy security has prompted EU leaders to push back the deadline for reaching a consensus on 2030 climate and energy targets until October. With Russia supplying almost a third of Europe’s gas supplies, around half of which is carried through Ukraine’s pipelines, the European Commission has been given until late June to determine ways to reduce dependency on Russian imports. While a renewed focus on Europe’s energy security will likely benefi t the renewables sector, it also comes at a time when EU laws on state aid, published in April and calling for a shift to more market-based mechanisms, could make the funding of alternative energy more diffi cult in the short term.
Flat packing sweet success. The foray of major corporations into the renewables sector is showing no signs of abating, with Ikea and Mars the latest big names to announce signifi cant energy deals. Ikea has acquired the 98MW Hoopeston wind project under development in Illinois, US, its largest renewable energy investment to date and part of a US$2b effort to become a net-zero energy consumer. Mars, meanwhile, has signed a power purchase agreement (PPA) to acquire the electricity generated by a 200MW wind farm in Texas that will power its entire US operations, equivalent to around 24% of its global carbon footprint.
Desertec drama. E.ON is to leave the Desertec Industrial Initiative (DII) at the end of this year, citing the need to concentrate on its own renewables projects and cost-cutting program. It’s another blow for DII, after losing Siemens and Bosch in 2012 and the Desertec Foundation itself last year. However, the coup of securing support from the State Grid Corporation of China in late 2013, and a renewed focus on the Middle East and Africa (MEA) region deploying renewable energy for domestic use rather than export to Europe, could give DII a much-needed boost in light of limited progress to date. According to a recent NPD SolarBuzz report, annual solar PV demand in the MEA region will reach 4.4GW by 2018, with an upside potential of 10GW.1
0
10
20
30
40
50
60
70
0
100
200
300
400
500
600
700
800
Q12013
Q22013
Q32013
Q42013
Q12014
Inve
stm
ent v
alue
(US$
b)
investment (value)
Wind
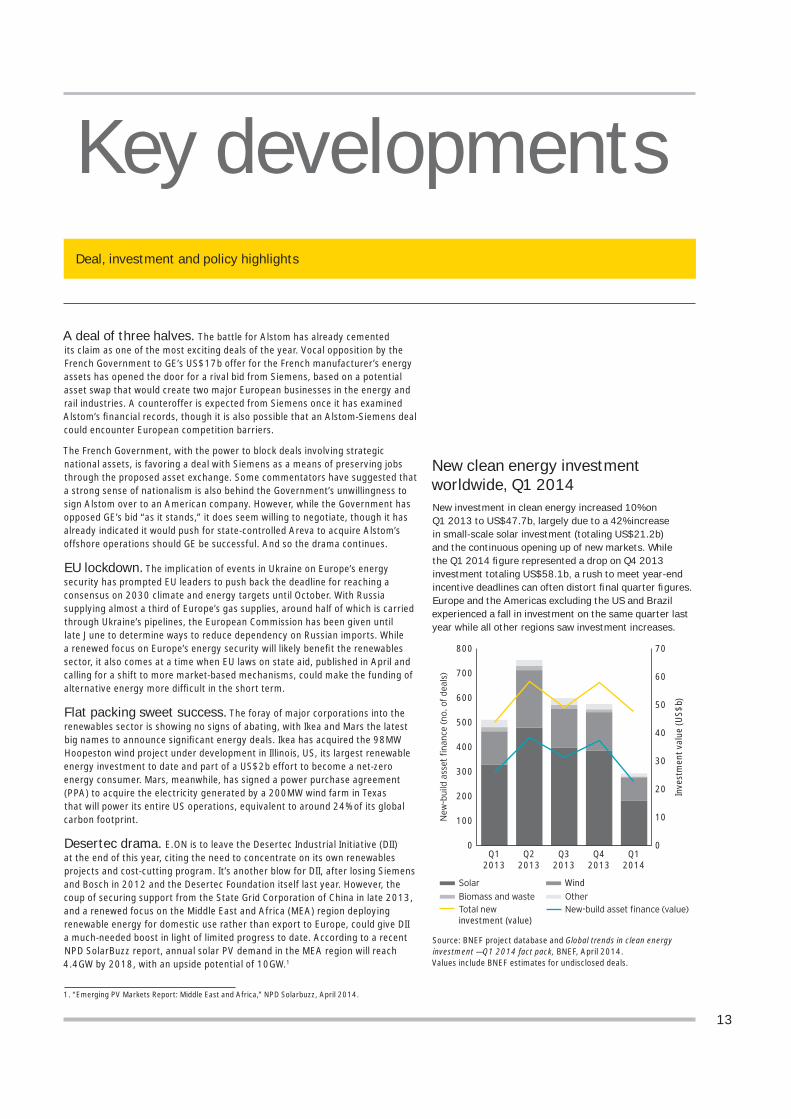
Source: BNEF project database and Global trends in clean energy investment — Q1 2014 fact pack, BNEF, April 2014.Values include BNEF estimates for undisclosed deals.
1. “Emerging PV Markets Report: Middle East and Africa,” NPD Solarbuzz, April 2014.
New clean energy investment worldwide, Q1 2014New investment in clean energy increased 10% on Q1 2013 to US$47.7b, largely due to a 42% increase in small-scale solar investment (totaling US$21.2b) and the continuous opening up of new markets. While the Q1 2014 fi gure represented a drop on Q4 2013 investment totaling US$58.1b, a rush to meet year-end incentive deadlines can often distort fi nal quarter fi gures. Europe and the Americas excluding the US and Brazil experienced a fall in investment on the same quarter last year while all other regions saw investment increases.
14
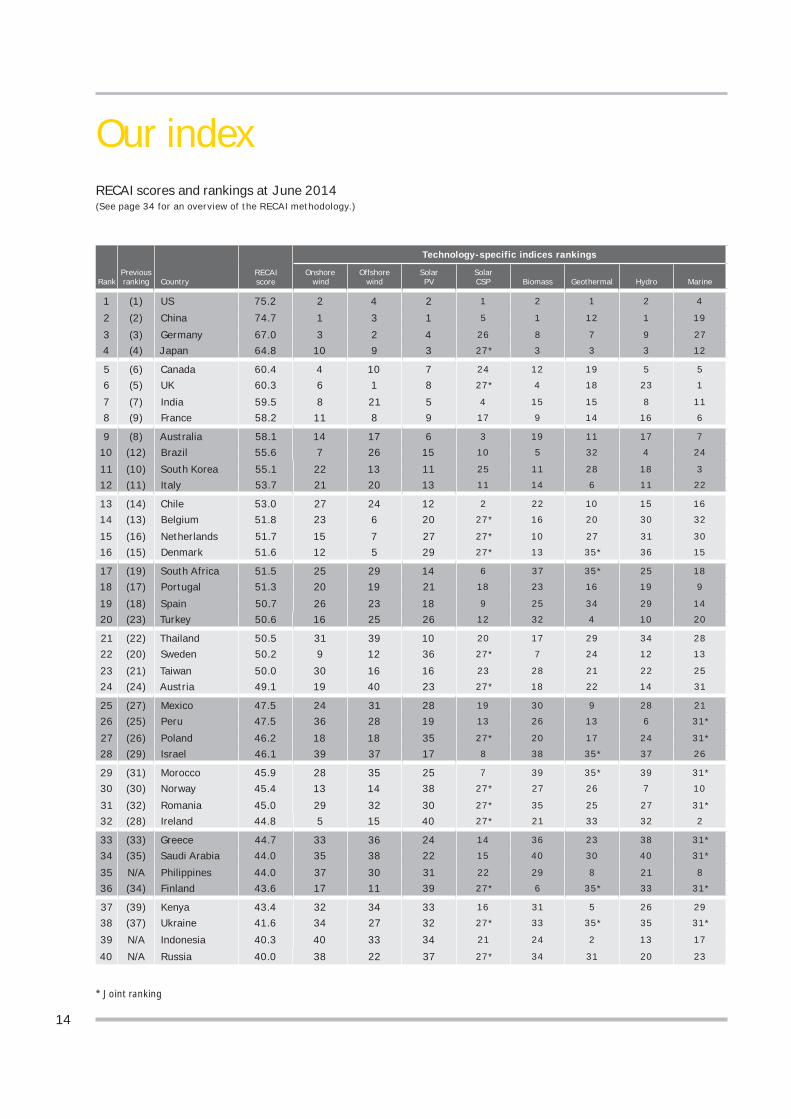
Our indexRECAI scores and rankings at June 2014(See page 34 for an overview of the RECAI methodology.)
RECAIscore
Technology-specific indices rankings
RankPrevious ranking Country
Onshore wind
Offshorewind
SolarPV
SolarCSP Biomass Geothermal Hydro Marine
1 (1) US 75.2 2 4 2 1 2 1 2 4
2 (2) China 74.7 1 3 1 5 1 12 1 19
3 (3) Germany 67.0 3 2 4 26 8 7 9 27
4 (4) Japan 64.8 10 9 3 27* 3 3 3 12
5 (6) Canada 60.4 4 10 7 24 12 19 5 5
6 (5) UK 60.3 6 1 8 27* 4 18 23 1
7 (7) India 59.5 8 21 5 4 15 15 8 11
8 (9) France 58.2 11 8 9 17 9 14 16 6
9 (8) Australia 58.1 14 17 6 3 19 11 17 7
10 (12) Brazil 55.6 7 26 15 10 5 32 4 24
11 (10) South Korea 55.1 22 13 11 25 11 28 18 3
12 (11) Italy 53.7 21 20 13 11 14 6 11 22
13 (14) Chile 53.0 27 24 12 2 22 10 15 16
14 (13) Belgium 51.8 23 6 20 27* 16 20 30 32
15 (16) Netherlands 51.7 15 7 27 27* 10 27 31 30
16 (15) Denmark 51.6 12 5 29 27* 13 35* 36 15
17 (19) South Africa 51.5 25 29 14 6 37 35* 25 18
18 (17) Portugal 51.3 20 19 21 18 23 16 19 9
19 (18) Spain 50.7 26 23 18 9 25 34 29 14
20 (23) Turkey 50.6 16 25 26 12 32 4 10 20
21 (22) Thailand 50.5 31 39 10 20 17 29 34 28
22 (20) Sweden 50.2 9 12 36 27* 7 24 12 13
23 (21) Taiwan 50.0 30 16 16 23 28 21 22 25
24 (24) Austria 49.1 19 40 23 27* 18 22 14 31
25 (27) Mexico 47.5 24 31 28 19 30 9 28 21
26 (25) Peru 47.5 36 28 19 13 26 13 6 31*
27 (26) Poland 46.2 18 18 35 27* 20 17 24 31*
28 (29) Israel 46.1 39 37 17 8 38 35* 37 26
29 (31) Morocco 45.9 28 35 25 7 39 35* 39 31*
30 (30) Norway 45.4 13 14 38 27* 27 26 7 10
31 (32) Romania 45.0 29 32 30 27* 35 25 27 31*
32 (28) Ireland 44.8 5 15 40 27* 21 33 32 2
33 (33) Greece 44.7 33 36 24 14 36 23 38 31*
34 (35) Saudi Arabia 44.0 35 38 22 15 40 30 40 31*
35 N/A Philippines 44.0 37 30 31 22 29 8 21 8
36 (34) Finland 43.6 17 11 39 27* 6 35* 33 31*
37 (39) Kenya 43.4 32 34 33 16 31 5 26 29
38 (37) Ukraine 41.6 34 27 32 27* 33 35* 35 31*
39 N/A Indonesia 40.3 40 33 34 21 24 2 13 17
40 N/A Russia 40.0 38 22 37 27* 34 31 20 23
* Joint ranking
15
Index highlights
Although this issue sees no major shifts at the top of the index, there is a sense that we are teetering on the edge of a major realignment of the most attractive markets.
The score gap between the US and China has narrowed again, indicating a possible return to the top for China. Signs of a more market-based approach in China could help break down some of the barriers to foreign investment while the scale of deployment remains unrivalled: the latest forecasts project almost 100GW of additional wind capacity in 2014 to 2018 and 60GW of solar, compared to 23GW and 33GW, respectively in the US. Meanwhile, the US continues to battle tax credit uncertainty, though the prospect of second place does not undermine the signifi cant opportunities.
Japan is becoming a strong contender for third place, with forecasts indicating as much as 36GW of new solar capacity by 2018 and Japan Wind Power Association estimating 144GW and 608GW onshore and offshore wind resource potential, respectively. However, the prominence of nuclear and absence of renewable energy targets in the country’s recent energy plan have held it in fourth place. Germany has avoided a fall down the rankings given a number of concessions that temper the severity of the renewable energy reforms approved in April.
The UK has slipped to sixth place, largely due to the threat of yet further reform of fi nancial support for solar, just weeks after the Conservative Party voiced plans to scrap onshore wind subsidies if re-elected. While reduced support for large-scale solar will inevitably put a dent in the 12GW of new solar capacity forecast by 2020, it is more likely to be constant policy tinkering that drives investors and developers away from the UK renewables market. A new auction program for utility-scale renewable energy in Ontario supports Canada’s move up into fi fth place.
India’s surging energy demand and ambitious targets will prompt an estimated 15GW of new wind and solar capacity (each) by the end of 2018, suggesting a jump up the rankings is in sight. However, progress is being hampered by a backlog of subsidy payments, controversial domestic content rules and high fi nancing costs.
France has leapfrogged Australia to eighth place. Clearance of a new wind FIT regime is welcome after the previous decree was ruled out on state aid grounds following years of uncertainty. A forecast 4GW of new wind and solar capacity (each) and a target of 100,000 new jobs in the sector should also boost investment. In Australia uncertainty over the Renewable Energy Target has left nearly US$11b of renewables projects in limbo.
Two power auctions planned for this year help Brazil climb into the top 10. Wind is expected to dominate again, but appetite for solar is growing rapidly with 3GW–5GW of new capacity forecast. The constant fl ow of project approvals
and a proposed tax on carbon emissions in Chile has moved it up to 13th place. The latest procurement program announcements in South Africa will boost an already expanding project pipeline, with forecasts projecting around 2.5GW of new wind capacity and up to 9GW of solar, lifting it to 17th place.
Turkey and Mexico have also jumped up the index, with high electricity prices mitigating overreliance on subsidies or policy exposure. Increased project activity has prompted an estimated 5GW of new wind power in both markets while planned solar and geothermal capacity tenders in Turkey and Mexico, respectively, have also helped boost the rankings.
The collapse of an agreement to export signifi cant volumes of wind capacity to the UK has dramatically reduced the deployment outlook in Ireland. Combined with an absent solar market, this has pushed it down to 32nd place. In Kenya, the fi nancing of Africa’s largest wind project has contributed to a two-place increase.
Political unrest and a weakened deployment outlook continue to push Ukraine down the index, though an energy supply imperative triggered by reduced imports from Russia could prompt a renewed focus on domestic renewable energy, helping it to hang on in 38th place.
Czech Republic and Bulgaria have fared less well, falling out of the index this issue. Both failed to recover from the mass exodus of investors and developers following severe subsidy reductions. Slovenia also drops out of the top 40 due to limited investment and deployment activity despite last year’s optimistic projections.
This has allowed the Philippines, Indonesia and Russia to jump up into the top 40, securing 35th, 39th and 40th place, respectively. A reliance on oil imports and the highest electricity prices in Asia have prompted the Philippines to target 15GW of renewables capacity by 2030. Meanwhile, Indonesia’s population of 247 million has created signifi cant energy demand growth and triggered a target of 25% of electricity from renewables by 2025. Both countries also have stable power offtake incentive regimes.
After a transformative 2013 for Russia’s renewable energy sector, seeing the country’s fi rst capacity auction and a 6.2GW 2020 target, the promise of a second auction in 2014 and reports of a possible carbon market to cut emissions indicate that energy mix diversifi cation is more than a passing phase for the largest country in the world.
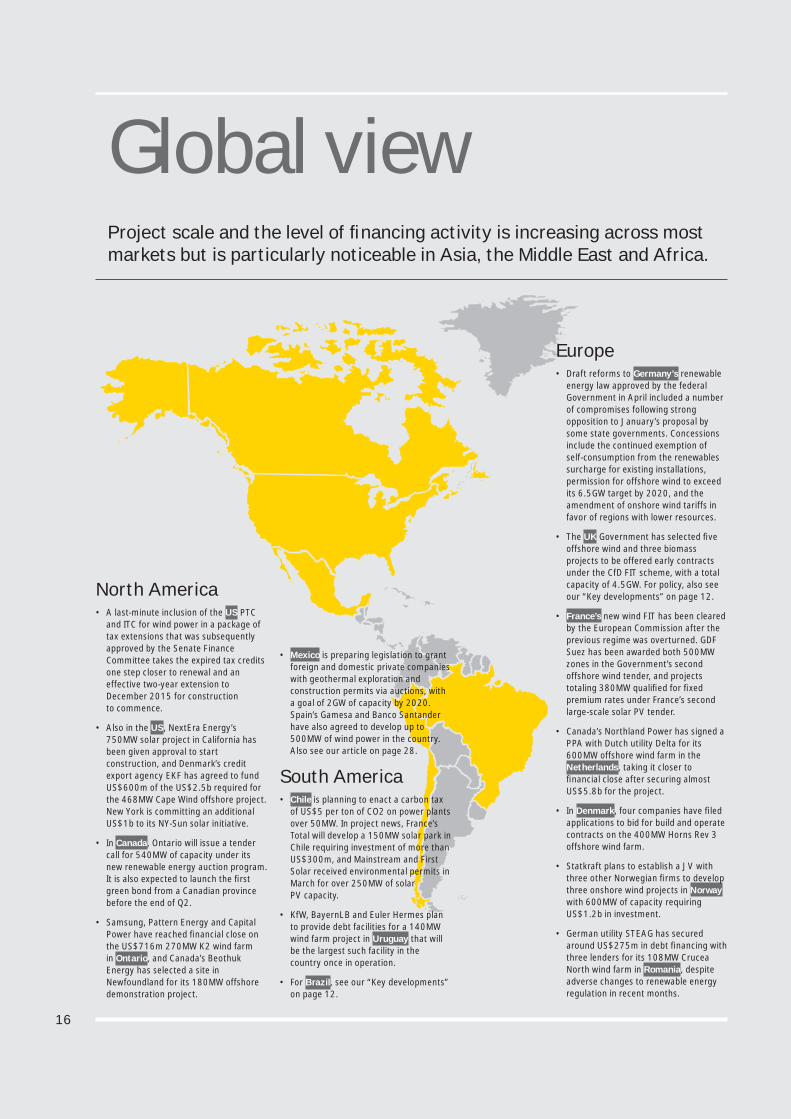
Global view
North America• A last-minute inclusion of the US PTC
and ITC for wind power in a package of tax extensions that was subsequently approved by the Senate Finance Committee takes the expired tax credits one step closer to renewal and an effective two-year extension to December 2015 for construction to commence.
• Also in the US, NextEra Energy’s 750MW solar project in California has been given approval to start construction, and Denmark’s credit export agency EKF has agreed to fund US$600m of the US$2.5b required for the 468MW Cape Wind offshore project. New York is committing an additional US$1b to its NY-Sun solar initiative.
• In Canada, Ontario will issue a tender call for 540MW of capacity under its new renewable energy auction program. It is also expected to launch the fi rst green bond from a Canadian province before the end of Q2.
• Samsung, Pattern Energy and Capital Power have reached fi nancial close on the US$716m 270MW K2 wind farm in Ontario, and Canada’s Beothuk Energy has selected a site in Newfoundland for its 180MW offshore demonstration project.
• Mexico is preparing legislation to grant foreign and domestic private companies with geothermal exploration and construction permits via auctions, with a goal of 2GW of capacity by 2020. Spain’s Gamesa and Banco Santander have also agreed to develop up to 500MW of wind power in the country. Also see our article on page 28.
South America• Chile is planning to enact a carbon tax
of US$5 per ton of CO2 on power plants over 50MW. In project news, France’s Total will develop a 150MW solar park in Chile requiring investment of more than US$300m, and Mainstream and First Solar received environmental permits in March for over 250MW of solar PV capacity.
• KfW, BayernLB and Euler Hermes plan to provide debt facilities for a 140MW wind farm project in Uruguay that will be the largest such facility in the country once in operation.
• For Brazil, see our “Key developments” on page 12.
Europe• Draft reforms to Germany’s renewable
energy law approved by the federal Government in April included a number of compromises following strong opposition to January’s proposal by some state governments. Concessions include the continued exemption of self-consumption from the renewables surcharge for existing installations, permission for offshore wind to exceed its 6.5GW target by 2020, and the amendment of onshore wind tariffs in favor of regions with lower resources.
• The UK Government has selected fi ve offshore wind and three biomass projects to be offered early contracts under the CfD FIT scheme, with a total capacity of 4.5GW. For policy, also see our “Key developments” on page 12.
• France’s new wind FIT has been cleared by the European Commission after the previous regime was overturned. GDF Suez has been awarded both 500MW zones in the Government’s second offshore wind tender, and projects totaling 380MW qualifi ed for fi xed premium rates under France’s second large-scale solar PV tender.
• Canada’s Northland Power has signed a PPA with Dutch utility Delta for its 600MW offshore wind farm in the Netherlands, taking it closer to fi nancial close after securing almost US$5.8b for the project.
• In Denmark, four companies have fi led applications to bid for build and operate contracts on the 400MW Horns Rev 3 offshore wind farm.
• Statkraft plans to establish a JV with three other Norwegian fi rms to develop three onshore wind projects in Norway with 600MW of capacity requiring US$1.2b in investment.
• German utility STEAG has secured around US$275m in debt fi nancing with three lenders for its 108MW Crucea North wind farm in Romania, despite adverse changes to renewable energy regulation in recent months.
16
Project scale and the level of fi nancing activity is increasing across most markets but is particularly noticeable in Asia, the Middle East and Africa.
17
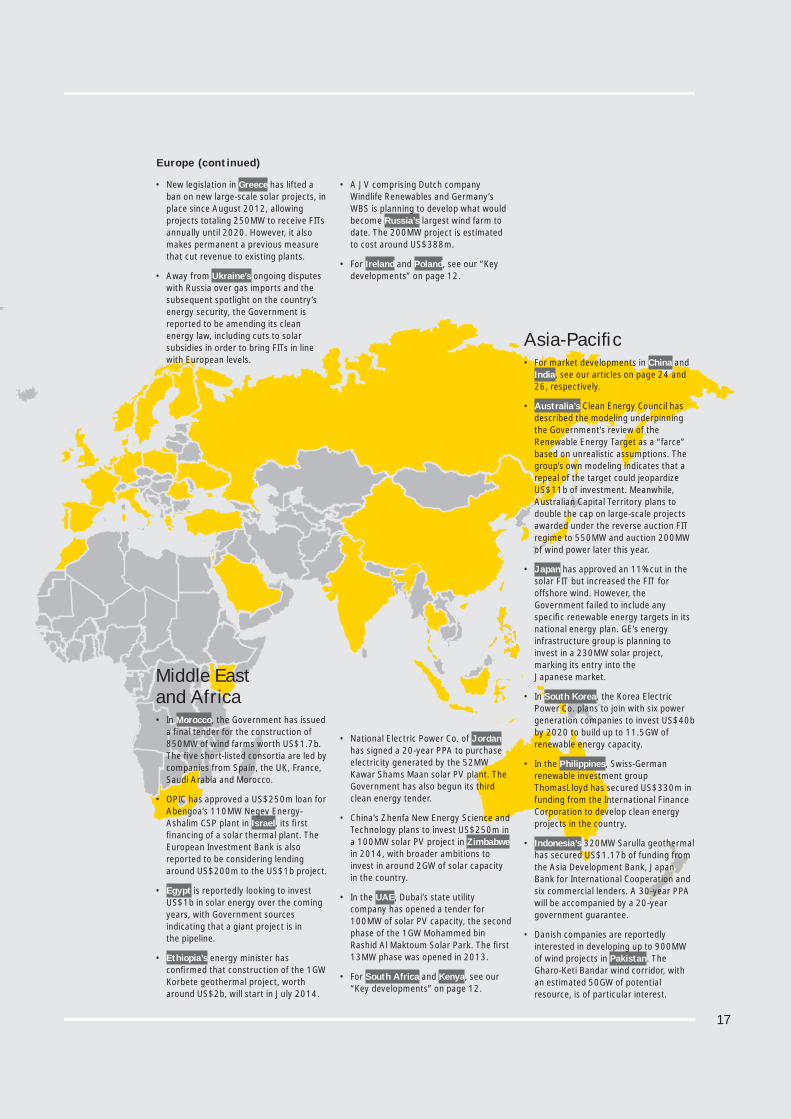
• New legislation in Greece has lifted a ban on new large-scale solar projects, in place since August 2012, allowing projects totaling 250MW to receive FITs annually until 2020. However, it also makes permanent a previous measure that cut revenue to existing plants.
• Away from Ukraine’s ongoing disputes with Russia over gas imports and the subsequent spotlight on the country’s energy security, the Government is reported to be amending its clean energy law, including cuts to solar subsidies in order to bring FITs in line with European levels.
• A JV comprising Dutch company Windlife Renewables and Germany’s WBS is planning to develop what would become Russia’s largest wind farm to date. The 200MW project is estimated to cost around US$388m.
• For Ireland and Poland, see our “Key developments” on page 12.
Middle Eastand Africa • In Morocco, the Government has issued
a fi nal tender for the construction of 850MW of wind farms worth US$1.7b. The fi ve short-listed consortia are led by companies from Spain, the UK, France, Saudi Arabia and Morocco.
• OPIC has approved a US$250m loan for Abengoa’s 110MW Negev Energy-Ashalim CSP plant in Israel, its fi rst fi nancing of a solar thermal plant. The European Investment Bank is also reported to be considering lending around US$200m to the US$1b project.
• Egypt is reportedly looking to invest US$1b in solar energy over the coming years, with Government sources indicating that a giant project is in the pipeline.
• Ethiopia’s energy minister has confi rmed that construction of the 1GW Korbete geothermal project, worth around US$2b, will start in July 2014.
• National Electric Power Co. of Jordan has signed a 20-year PPA to purchase electricity generated by the 52MW Kawar Shams Maan solar PV plant. The Government has also begun its third clean energy tender.
• China’s Zhenfa New Energy Science and Technology plans to invest US$250m in a 100MW solar PV project in Zimbabwe in 2014, with broader ambitions to invest in around 2GW of solar capacity in the country.
• In the UAE, Dubai’s state utility company has opened a tender for 100MW of solar PV capacity, the second phase of the 1GW Mohammed bin Rashid Al Maktoum Solar Park. The fi rst 13MW phase was opened in 2013.
• For South Africa and Kenya, see our “Key developments” on page 12.
Asia-Pacifi c• For market developments in China and
India, see our articles on page 24 and 26, respectively.
• Australia’s Clean Energy Council has described the modeling underpinning the Government’s review of the Renewable Energy Target as a “farce” based on unrealistic assumptions. The group’s own modeling indicates that a repeal of the target could jeopardize US$11b of investment. Meanwhile, Australian Capital Territory plans to double the cap on large-scale projects awarded under the reverse auction FIT regime to 550MW and auction 200MW of wind power later this year.
• Japan has approved an 11% cut in the solar FIT but increased the FIT for offshore wind. However, the Government failed to include any specifi c renewable energy targets in its national energy plan. GE’s energy infrastructure group is planning to invest in a 230MW solar project, marking its entry into the Japanese market.
• In South Korea, the Korea Electric Power Co. plans to join with six power generation companies to invest US$40b by 2020 to build up to 11.5GW of renewable energy capacity.
• In the Philippines, Swiss-German renewable investment group ThomasLloyd has secured US$330m in funding from the International Finance Corporation to develop clean energy projects in the country.
• Indonesia’s 320MW Sarulla geothermal has secured US$1.17b of funding from the Asia Development Bank, Japan Bank for International Cooperation and six commercial lenders. A 30-year PPA will be accompanied by a 20-year government guarantee.
• Danish companies are reportedly interested in developing up to 900MW of wind projects in Pakistan. The Gharo-Keti Bandar wind corridor, with an estimated 50GW of potential resource, is of particular interest.
Europe (continued)
18
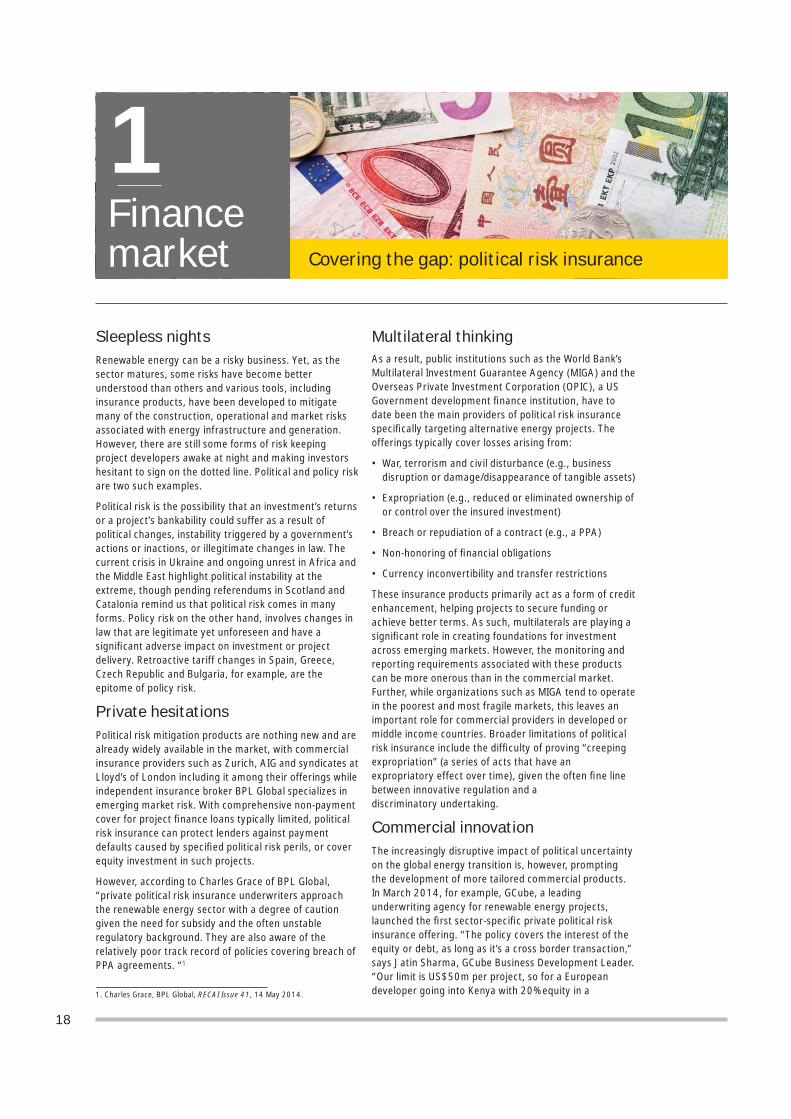
Covering the gap: political risk insurance
1Finance market
Sleepless nights Renewable energy can be a risky business. Yet, as the sector matures, some risks have become better understood than others and various tools, including insurance products, have been developed to mitigate many of the construction, operational and market risks associated with energy infrastructure and generation. However, there are still some forms of risk keeping project developers awake at night and making investors hesitant to sign on the dotted line. Political and policy risk are two such examples.
Political risk is the possibility that an investment’s returns or a project’s bankability could suffer as a result of political changes, instability triggered by a government’s actions or inactions, or illegitimate changes in law. The current crisis in Ukraine and ongoing unrest in Africa and the Middle East highlight political instability at the extreme, though pending referendums in Scotland and Catalonia remind us that political risk comes in many forms. Policy risk on the other hand, involves changes in law that are legitimate yet unforeseen and have a signifi cant adverse impact on investment or project delivery. Retroactive tariff changes in Spain, Greece, Czech Republic and Bulgaria, for example, are the epitome of policy risk.
Private hesitationsPolitical risk mitigation products are nothing new and are already widely available in the market, with commercial insurance providers such as Zurich, AIG and syndicates at Lloyd’s of London including it among their offerings while independent insurance broker BPL Global specializes in emerging market risk. With comprehensive non-payment cover for project fi nance loans typically limited, political risk insurance can protect lenders against payment defaults caused by specifi ed political risk perils, or cover equity investment in such projects.
However, according to Charles Grace of BPL Global, “private political risk insurance underwriters approach the renewable energy sector with a degree of caution given the need for subsidy and the often unstable regulatory background. They are also aware of the relatively poor track record of policies covering breach of PPA agreements. “1
Multilateral thinkingAs a result, public institutions such as the World Bank’s Multilateral Investment Guarantee Agency (MIGA) and the Overseas Private Investment Corporation (OPIC), a US Government development fi nance institution, have to date been the main providers of political risk insurance specifi cally targeting alternative energy projects. The offerings typically cover losses arising from:
• War, terrorism and civil disturbance (e.g., business disruption or damage/disappearance of tangible assets)
• Expropriation (e.g., reduced or eliminated ownership of or control over the insured investment)
• Breach or repudiation of a contract (e.g., a PPA)
• Non-honoring of fi nancial obligations
• Currency inconvertibility and transfer restrictions
These insurance products primarily act as a form of credit enhancement, helping projects to secure funding or achieve better terms. As such, multilaterals are playing a signifi cant role in creating foundations for investment across emerging markets. However, the monitoring and reporting requirements associated with these products can be more onerous than in the commercial market. Further, while organizations such as MIGA tend to operate in the poorest and most fragile markets, this leaves an important role for commercial providers in developed or middle income countries. Broader limitations of political risk insurance include the diffi culty of proving “creeping expropriation” (a series of acts that have an expropriatory effect over time), given the often fi ne line between innovative regulation and a discriminatory undertaking.
Commercial innovationThe increasingly disruptive impact of political uncertainty on the global energy transition is, however, prompting the development of more tailored commercial products. In March 2014, for example, GCube, a leading underwriting agency for renewable energy projects, launched the fi rst sector-specifi c private political risk insurance offering. “The policy covers the interest of the equity or debt, as long as it’s a cross border transaction,” says Jatin Sharma, GCube Business Development Leader. “Our limit is US$50m per project, so for a European developer going into Kenya with 20% equity in a 1. Charles Grace, BPL Global, RECAI Issue 41, 14 May 2014.
19
Risk mitigation products will play an increasing role in shaping the risk-reward equation for projects across both developed and emerging markets.
US$250m project, for example, we could underwrite 100% of the political risk insurance on that project.”2 Such a policy can also be bolted on to project insurance rather than having to source it separately, though it is yet to be seen whether coverage of up to US$50m will be suffi cient to help utility-scale projects expand globally.
The heart of the matterPolitical risk insurance can go a long way to mitigate many of the barriers of operating in new markets, yet it still fails to get to the heart of what is most troubling for project developers and investors — policy risk. One need only look at the slowdown in renewables activity across Europe and the US as a result of regulatory shifts and policy uncertainty. Further, political risk mitigation is typically only available to third-country investors while policy risk can also impact domestic stakeholders.
Partial coverageYet there is still little by way of tangible solutions to address the fear of further policy upheavals in developed markets, or the same happening in emerging markets. The most explicit policy risk insurance product to date is OPIC’s regulatory risk offering, covering retroactive changes to FITs that affect the economic viability of projects fi nanced by US investors in developing economies, critical changes to taxation and revocation of licenses or permits. However, the offering remains relatively limited and excludes small-medium enterprises.
Closer examination of MIGA’s and OPIC’s political risk insurance also indicates the potential for some policy risk protection (e.g., retroactive subsidy cuts), if the change qualifi es as an expropriatory breach of investors’ rights. However, the onus on the client to demonstrate causation has limited its use to date. Similarly, World Bank partial risk guarantees theoretically offer some form of mitigation if specifi c policy changes are covered in the guarantee’s clauses. Yet fewer than 10 renewable energy projects have taken up partial risk guarantees to date, and the fact that only debt holders are covered limits their relevance given policy risks such as tariff changes will typically affect many other parties.
A sector in its PRIMeAccording to Julian Richardson, CEO of Parhelion Underwriting Ltd, one of the main barriers to commercial policy risk insurance is the “misalignment of interest between the party most able to infl uence the risk (government) and those exposed to the risk (investors).”3 To address this, Parhelion, in conjunction with the United Nations Environment Programme, is developing a public/private-funded policy risk insurance mechanism (PRIMe) that would underwrite the specifi c risk of changes in policy that the private sector are unable to do on a stand-alone basis.
Such an offering could enhance the regulatory competitiveness of the host country, and ensure a credit-worthy counterparty through government and fi nancial institution backing. The opportunity to act as coinsurers or reinsurers in partnership with PRIMe could also “crowd-in” a signifi cant pool of capital from private sector insurers, a largely untapped source to date. Further, the capital structure and risk profi le of an insurer means more projects could be insured by a PRIMe than can be invested in by direct public capital injection.
A fully commercialized PRIMe is still some way off, however, and must not only fi nd a way to accurately price a policy risk premium but also establish a willingness by host countries to participate. Any such offering will also need to address high costs for small projects, develop standardized PPAs, create cross-country pooling mechanisms and ensure enforcement power.
Covering the gapWith developer and investor decisions on whether to enter a particular market increasingly infl uenced by the degree of political or policy uncertainty, risk mitigation products will play an increasing role in shaping the risk-reward profi le of projects in both developed and emerging markets. Political risk insurance products are already out there, with organizations such as MIGA leading the way, though there is scope for more tailored solutions and a need to address current limitations. Policy risk insurance is more elusive, yet the need perhaps is even greater. While efforts to bring down the cost of renewable energy and a better handling of policy changes by governments, should make the need for such products redundant in the long run, we are certainly not there yet. So on the issue of policy risk insurance, watch this space.
2. Jatin Sharma, GCube Business Development Leader, RECAI Issue 41, 22 March 2014.
3. Julian Richardson, Parhelion CEO, RECAI Issue 41, 2 May 2014.
20
Domestic content: handle with care
Policy andregulation
2
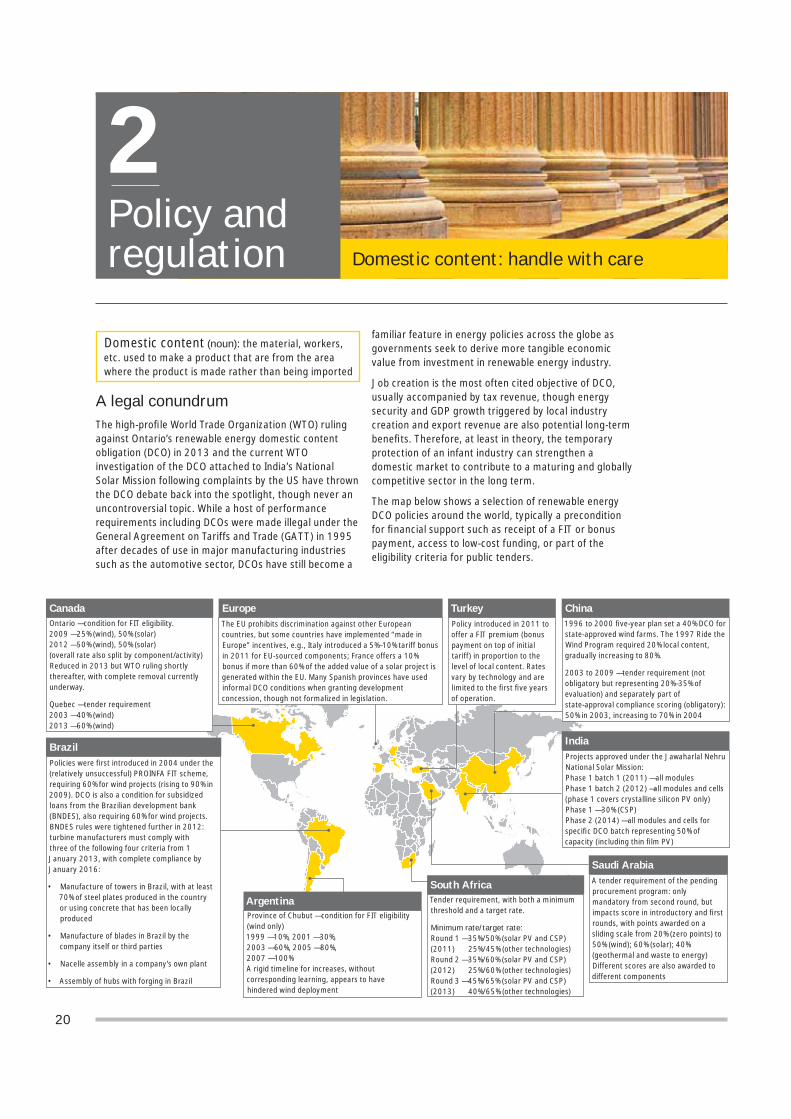
A legal conundrumThe high-profi le World Trade Organization (WTO) ruling against Ontario’s renewable energy domestic content obligation (DCO) in 2013 and the current WTO investigation of the DCO attached to India’s National Solar Mission following complaints by the US have thrown the DCO debate back into the spotlight, though never an uncontroversial topic. While a host of performance requirements including DCOs were made illegal under the General Agreement on Tariffs and Trade (GATT) in 1995 after decades of use in major manufacturing industries such as the automotive sector, DCOs have still become a
Domestic content (noun): the material, workers, etc. used to make a product that are from the area where the product is made rather than being imported
familiar feature in energy policies across the globe as governments seek to derive more tangible economic value from investment in renewable energy industry.
Job creation is the most often cited objective of DCO, usually accompanied by tax revenue, though energy security and GDP growth triggered by local industry creation and export revenue are also potential long-term benefi ts. Therefore, at least in theory, the temporary protection of an infant industry can strengthen a domestic market to contribute to a maturing and globally competitive sector in the long term.
The map below shows a selection of renewable energy DCO policies around the world, typically a precondition for fi nancial support such as receipt of a FIT or bonus payment, access to low-cost funding, or part of the eligibility criteria for public tenders.
Policies were fi rst introduced in 2004 under the (relatively unsuccessful) PROINFA FIT scheme, requiring 60% for wind projects (rising to 90% in 2009). DCO is also a condition for subsidized loans from the Brazilian development bank (BNDES), also requiring 60% for wind projects. BNDES rules were tightened further in 2012: turbine manufacturers must comply with three of the following four criteria from 1 January 2013, with complete compliance by January 2016:
• Manufacture of towers in Brazil, with at least 70% of steel plates produced in the country or using concrete that has been locally produced
• Manufacture of blades in Brazil by the company itself or third parties
• Nacelle assembly in a company’s own plant
• Assembly of hubs with forging in Brazil
Tender requirement, with both a minimum threshold and a target rate.
Minimum rate/target rate:Round 1 — 35%/50% (solar PV and CSP)(2011) 25%/45% (other technologies)Round 2 — 35%/60% (solar PV and CSP)(2012) 25%/60% (other technologies)Round 3 — 45%/65% (solar PV and CSP)(2013) 40%/65% (other technologies)
Province of Chubut — condition for FIT eligibility (wind only)1999 — 10%, 2001 — 30%, 2003 — 60%, 2005 — 80%,2007 — 100%A rigid timeline for increases, without corresponding learning, appears to have hindered wind deployment
Ontario — condition for FIT eligibility.2009 — 25% (wind), 50% (solar)2012 — 50% (wind), 50% (solar)(overall rate also split by component/activity)Reduced in 2013 but WTO ruling shortly thereafter, with complete removal currently underway.
Quebec — tender requirement2003 — 40% (wind)2013 — 60% (wind)
Canada
Brazil
The EU prohibits discrimination against other European countries, but some countries have implemented “made in Europe” incentives, e.g., Italy introduced a 5%–10% tariff bonus in 2011 for EU-sourced components; France offers a 10% bonus if more than 60% of the added value of a solar project is generated within the EU. Many Spanish provinces have used informal DCO conditions when granting development concession, though not formalized in legislation.
EuropePolicy introduced in 2011 to offer a FIT premium (bonus payment on top of initial tariff) in proportion to the level of local content. Rates vary by technology and are limited to the fi rst fi ve years of operation.
Turkey1996 to 2000 fi ve-year plan set a 40% DCO for state-approved wind farms. The 1997 Ride the Wind Program required 20% local content, gradually increasing to 80%.
2003 to 2009 — tender requirement (not obligatory but representing 20%–35% of evaluation) and separately part of state-approval compliance scoring (obligatory): 50% in 2003, increasing to 70% in 2004
China
Projects approved under the Jawaharlal Nehru National Solar Mission:Phase 1 batch 1 (2011) — all modulesPhase 1 batch 2 (2012) —all modules and cells (phase 1 covers crystalline silicon PV only)Phase 1 — 30% (CSP)Phase 2 (2014) — all modules and cells for specifi c DCO batch representing 50% of capacity (including thin fi lm PV)
India
A tender requirement of the pending procurement program: only mandatory from second round, but impacts score in introductory and fi rst rounds, with points awarded on a sliding scale from 20% (zero points) to 50% (wind); 60% (solar); 40% (geothermal and waste to energy) Different scores are also awarded to different components
Saudi Arabia
South AfricaArgentina
21
DCOs lack the sophistication to address the challenge of generating tangible economic benefi t from renewable energy investment in a way that leads to a sustainable local industry.
The range of DCO formats reinforces the fact that such policies are far from homogenous, and even economic theory refl ects the ambiguous impact of DCO on, for example, job creation. While the hope is that increased demand for local equipment or services will boost domestic green jobs, a DCO will also typically increase project costs in the short term relative to often cheaper imports, potentially reducing or slowing deployment activity and therefore demand for upstream and downstream labor.
Unintended consequencesGiven the diffi culty of isolating the impact of a DCO, it is hard to assess its net impact on economic growth or job creation. However, market experiences to date highlight the diffi culty of implementing such policies without distorting the market in some way.
The National Solar Energy Federation of India, for example, claims that 65%–70% of projects may not be built because local cell makers lack capacity to fulfi l orders while quality concerns are slowing lending to projects using Indian-made equipment. The initial exemption of thin-fi lm cells from the DCO has also distorted the market in favor of imported thin-fi lm panels supported by cheap US loans.
In Brazil, the 60% DCO attached to low-cost funding has put signifi cant pressure on wind manufacturers on top of already low system prices. BNEF reported in October 2013 that Vestas and Suzlon had failed to secure any new deals in 18 months following the loss of state-backed debt. The domestic production of turbine towers (necessitated by the DCO’s weight criteria), is particularly demanding given that Brazilian steel is around 70% more expensive than imported steel. Some developers have therefore begun experimenting with concrete towers, even though more costly in the short term given the need to assemble on-site.
The incentive scheme overhaul currently under way in Ontario (following the WTO’s ruling that it breached international trade law) is also a reminder that the protectionist nature of any DCO policy will create ongoing uncertainty for developers given the possibility of legal challenge. Failure to set clear and ambitious renewable energy targets that refl ected the signifi cant size and potential of Ontario’s renewable energy market is also likely to have limited the ability of the DCO to create competitive domestic players in the absence of strong
signals of secure long-term demand. However, Ontario’s allocation of different domestic content percentages to different value chain activities arguably resulted in a less distorting DCO relative to policies focusing on upstream manufacturing alone (such as in India and Brazil).
The extraordinary growth of China’s renewables market indicates a relatively successful DCO program, though the global dominance of Chinese manufacturers and the impact of cheap Chinese solar modules on global trade and its own solar market suggests a prolonged period of protectionism may have enabled companies to grow too large, thereby distorting global market competition.
South Africa now looks set to be one of the few markets able to demonstrate the potential for effective DCO policy, though it will always be diffi cult to isolate the impact relative to its broader procurement program. Yet engagement with industry in setting rates to foster vertical cooperation effi ciencies and support for phased increases in DCO rates appears to be encouraging, or at least not discouraging, the creation of a sustainable domestic renewable energy market.
One more tool in the toolboxDCOs have too often been used as blunt policy instruments, lacking the sophistication — particularly when applied in isolation — to address the challenge of generating tangible economic benefi t from renewable energy investment in a way that leads to a sustainable local industry. Complex interplays between short-term and long-term effects, and the non-homogeneous nature of DCO policy, means crude implementation as a political
“sweetener” or the expectation of instant industry creation will often lead to adverse effects.
Governments should not lose focus on attracting new investment as the primary objective, using DCO as part of a wider toolkit to enhance this investment rather than as an isolated policy measure. While the stringency, duration, fl exibility and legal standing of any DCO policy will inevitably impact its success, entrants will be happy to adapt to DCOs if the opportunity is big enough. New markets will therefore benefi t from temporary but well-considered protectionist measures, yet the goal should always be to open up markets to global competition as soon as possible. And the point at which DCO should be considered a success is when job creation and value is able to happen without it.
22
Mining green to strike gold
3In the market
Hitting the bottom line EY analysis indicates that energy costs represent around 12% of a mine’s total cash costs on average, increasing to as much as 40%-70% in some cases. Applying even the lower average to the world’s fi ve largest mining companies, an estimated US$45b was spent on energy by these companies alone in 2013.1
Such high levels of spending and the mining sector’s historical reliance on fossil fuels exacerbates its exposure to volatile and increasing energy prices, putting operating margins under increasing pressure and renewable energy fi rmly in the spotlight. “It is competitive with conventional energy sources,” says Diego Lizana Rojas, energy effi ciency superintendent at Collahuasi. “And it helps reduce our carbon footprint, but the cost of energy is what’s most important at the moment.”2 The average LCOE from diesel generators, often used as the primary generator in remote mining locations, currently ranges US$297–US$332 per MWh, compared to an equivalent LCOE of US$90-US$105 per MWh for utility-scale solar energy and just US$45-US$95 per MWh for wind power.3
With mining activity also requiring baseload power in new and often remote locations, near-site or on-site generation is critical to securing long-term power supplies, reducing water consumption for thermal generation and lowering fuel transportation costs. The move by many governments to introduce carbon pricing and emission reduction obligations is putting further cost and regulatory pressures on extraction industries.
Mining giant Anglo American has said it wants to “run cost-effi cient, low-carbon (if not carbon-neutral) mines by 2030” and is already investing in projects such as the 5GW Kalahari Solar Power Project in South Africa. Meanwhile, Navigant Research estimates that revenue generated by the sales of renewable energy systems into the mining industry could reach US$6b annually by 2022 (based on its aggressive investment scenario).
More than minor benefi tsHowever, it’s not just the mining sector that stands to gain from this energy transition. Private project developers and investors can develop, deliver, fund, own and operate this new generation infrastructure once they have long-term PPAs with credit-worthy counterparties demanding power for energy-intensive extraction activity.
The remoteness of many mining sites and existing regulatory awareness, local infrastructure and land use rights can also make permitting approvals for such assets less onerous. The increasing prevalence of mining activity in emerging economies offers renewable energy stakeholders a route into new markets with an energy consumer and access to abundant untapped renewable resources. The variety of mining sites ( in terms of scale, location and stage of development) creates an equally varied range of opportunities for investors and developers.
Joining forcesThe prospect of such mutually benefi cial enterprises calls for focus on strategic partnerships, tailored business models and technology innovation.
Talking strategyThe organizational structure of many extraction companies — frequently based on mineral type, mine location or geographic region — has often prevented a central control over electricity price exposure and volatility, making it diffi cult to assess the ad hoc but attractive opportunities brought to their door by renewable energy developers looking for PPAs. A global view of electricity price exposure and competitive process to secure IPP solutions will be critical in determining the appropriate approach to mitigating these risks.
Modeling solutions to fi tMines have typically purchased electricity directly from a local renewable energy project on a relatively ad hoc basis with local decision-making or taken complete control of the assets. However, an increasing aversion to signifi cant capital outlay for what many companies still consider to be non-core (although business-critical) activity, combined with a better understanding of the risk profi le of renewable energy procurement, is starting to shift the approach toward strategic PPAs and energy service companies.
1. Top fi ve companies based on market capitalization in 2013. Analysis based on operating cost data from the latest audited fi nancial statements as of March 2014 and mining sector cost data from the World Mine Cost Data Exchange.
2 Diego Lizana Rojas, Collahuasi Energy Effi ciency Superintendent, RECAI Issue 41, 29 April 2014.
3. Lazard's levelized cost of energy analysis—version 7.0, Lazard, August 2013.
23
Developers and investors must collaborate with the mining sector to create appropriate technical, contractual and fi nancing solutions that reduce risk and capital outlay.
Third-party developers and their capital providers are increasingly taking on all development, construction and operational risks associated with new renewable energy infrastructure while seeking adequate compensation for their 20- to 30-year investment in return. However, they must also be willing to offer increasingly tailored solutions to meet the offtaker’s requirements. More sophisticated PPAs, for example, could incorporate energy price hedges, supply guarantees, ventures with baseload power providers, commodity-indexed PPAs or variable terms to match the economic life of the mine. Creative funding structures, meanwhile, could prompt miners to lend their often superior credit ratings to developers or projects to secure better fi nancing terms.
At the other end of the spectrum, some mining groups are looking to renewable energy as an additional source of revenue. In 2012, for example, mining group Exxaro formed a JV with India’s Tata Power, Cennergi, and is now building two wind farms in South Africa totaling 229MW and requiring US$670m of investment.
Keeping the power fl owingOne of the fundamental barriers to increased renewable energy deployment by the mining sector is the perceived unreliability of power supplies given the variability of sources such as solar and wind. Developers must therefore address security of supply as a key part of their solutions, creating a market not only for niche technologies and service providers, but also hybrid and storage solutions and improved transmission networks.
Wind and solar PV will continue to be the most utilized technologies, though project scale is increasing as these technologies mature and costs fall. In Chile, for example, SunEdison is working with mining and steel group CAP to construct a 100MW solar PV project in the Atacama Desert.
Deployment of concentrated solar power (CSP) is increasing given its ability to generate valuable process heat and electricity and to combine with gas-fi red generation to provide a supply profi le that better meets demand. Steam from CSP solutions is also being deployed for “enhanced oil recovery,” rapidly improving the effi ciency of the extraction process. Advanced storage technology and interconnection, however, will be the key to addressing intermittency as renewable energy makes up an increasing proportion of total power supply.
Locating the opportunitiesMarkets that are already economically dependent on mining, such as Chile, South Africa and Australia, are simultaneously trying to address the high water consumption of coal-fi red generation, narrowing reserve margins, increasing industrial emissions and falling commodity prices. Such markets are therefore becoming hot spots for renewable energy deployment by energy-intensive users while emerging markets with signifi cant unexploited mineral resources and limited electricity infrastructure are also attracting attention.
Success in Chile is likely to be replicated in neighboring markets such as Brazil, Peru and Mexico, where renewable energy is also increasingly cost-competitive with other forms of energy generation. Political instability has slowed the pace of activity in the Middle East and Africa to date, though the signifi cant volume of mining activity in parts of West and East Africa, and the success of South Africa’s renewable energy procurement program, should be a catalyst for increased deployment.
A happy union? For a sector traditionally regarded as relatively risk-averse, the mining sector will fi nd it increasingly diffi cult to ignore the long-term impact of renewables on its bottom line as a cheaper and potentially more reliable source of energy, especially if it can be developed, funded and operated by third parties. However, developers and investors should not expect a sudden change in mindset. They must collaborate with the mining sector to create appropriate technical, contractual and fi nancing solutions that reduce risk and capital outlay for the industry.
Critically, with such a major energy transition unlikely to happen overnight and continued technology evolution key to its success, both parties must be willing to sign up for the long haul and with a global approach. If this happens, the union of a power-hungry extraction industry and an increasingly cost-effective renewables sector looking for offtakers will indeed have a happy ending.
To fi nd out more about how we can help with your energy transition, or the relevant EY renewable energy and mining teams in your area, please contact:
Barry O’Flynn, Environmental Finance Directorbarry.ofl [email protected]/+353 1221 1688
Lee Downham, Global Mining and Metals Transactions [email protected]/+44 20 7951 2178
24
Done it again. Just when it seemed that China’s solar ambitions couldn’t get any bigger, the Government has announced plans to install 70GW of solar capacity by 2017, double its previously announced target of 35GW by 2015. In the context of a current installed solar capacity of almost 20GW (at the end of 2013), this would be a near impossible feat for most countries. But China’s track record tells us that nothing is impossible.
The smog factor. The main impetus behind this revised target is a war on smog, fast becoming a top priority for the Government as pollution becomes an increasing cause of social unrest across the nation. China has 16 of the world’s 20 most polluted cities according to World Bank estimates, with the Government issuing warnings for children and the elderly to remain indoors earlier this year. From March 2014, the Ministry of Environment has been assigning credit ratings to companies in heavily polluting industries and advising banks not to offer new loans to companies with red ratings until they are upgraded.
Taking stock. Increased demand for solar panels as a result of this pollution reduction program has helped a number of Chinese solar companies return to profi t after a challenging 18 months, with stock market performance expected to recover further this year as the Government targets 14GW of new solar capacity. But there also other factors driving this market recovery. A major program of consolidation is reducing oversupply and increasing effi ciencies, favoring a smaller number of leading solar companies. In January, the Government published a list of 109 companies that will remain eligible for state support such as favorable fi nancing terms and participation in public tenders, (from over 500 applications). The Government is also compiling a list of specifi c solar projects across the value chain that will qualify for funding from China Development Bank Corp. (CDB), following recommendations by individual provinces in early April.
Country focus
Local office contacts:
Alan [email protected]
Highlights
• The Government has increased its solar capacity target to 70GW by 2017, double the previous target of 35GW by 2015.
• Pollution reduction has become an increasingly important driver for renewable energy investment in China.
• Consolidation and a focus on a more market-driven economy is creating stronger companies and opening the door for greater competition via more private and foreign investment.
• A Government commitment to spend US$162.8b on eight ultrahigh voltage transmission lines could help support almost 28GW of new wind capacity.
• An offshore wind revival is forecast to spark more than 7GW of offshore wind capacity through to 2018.
China
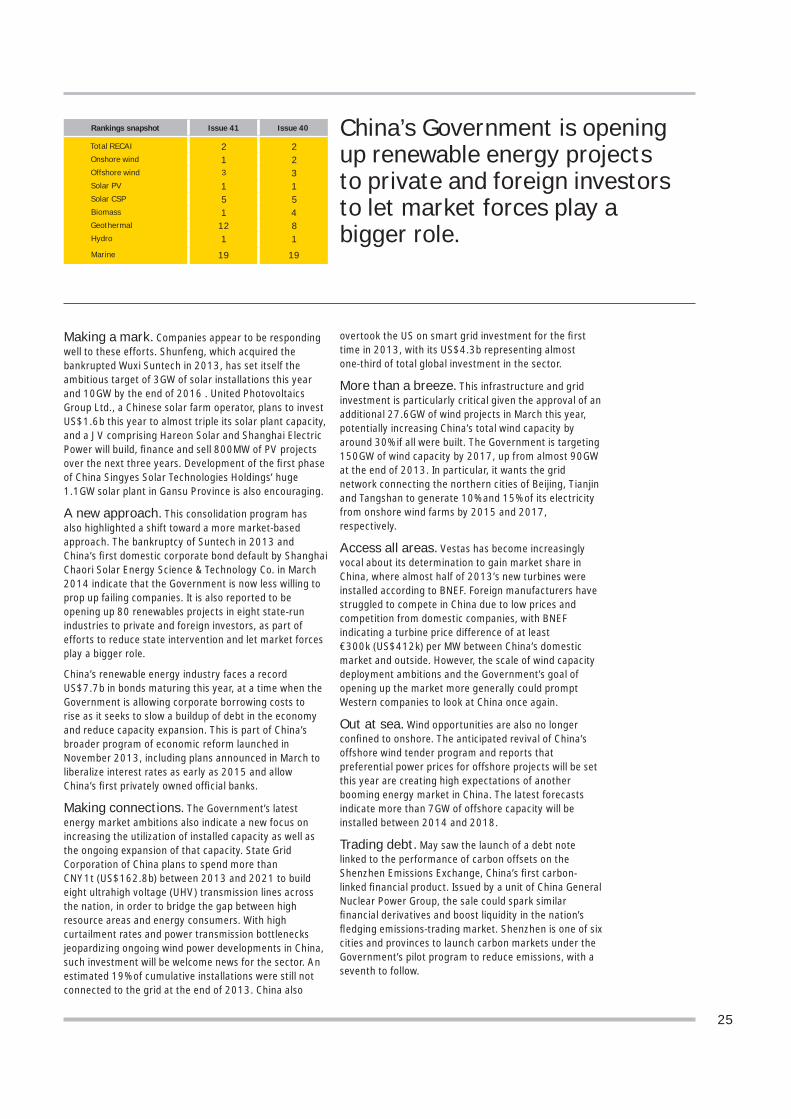
25
China’s Government is opening up renewable energy projects to private and foreign investors to let market forces play a bigger role.
Making a mark. Companies appear to be responding well to these efforts. Shunfeng, which acquired the bankrupted Wuxi Suntech in 2013, has set itself the ambitious target of 3GW of solar installations this year and 10GW by the end of 2016 . United Photovoltaics Group Ltd., a Chinese solar farm operator, plans to invest US$1.6b this year to almost triple its solar plant capacity, and a JV comprising Hareon Solar and Shanghai Electric Power will build, fi nance and sell 800MW of PV projects over the next three years. Development of the fi rst phase of China Singyes Solar Technologies Holdings’ huge 1.1GW solar plant in Gansu Province is also encouraging.
A new approach. This consolidation program has also highlighted a shift toward a more market-based approach. The bankruptcy of Suntech in 2013 and China’s fi rst domestic corporate bond default by Shanghai Chaori Solar Energy Science & Technology Co. in March 2014 indicate that the Government is now less willing to prop up failing companies. It is also reported to be opening up 80 renewables projects in eight state-run industries to private and foreign investors, as part of efforts to reduce state intervention and let market forces play a bigger role.
China’s renewable energy industry faces a record US$7.7b in bonds maturing this year, at a time when the Government is allowing corporate borrowing costs to rise as it seeks to slow a buildup of debt in the economy and reduce capacity expansion. This is part of China’s broader program of economic reform launched in November 2013, including plans announced in March to liberalize interest rates as early as 2015 and allow China’s fi rst privately owned offi cial banks.
Making connections. The Government’s latest energy market ambitions also indicate a new focus on increasing the utilization of installed capacity as well as the ongoing expansion of that capacity. State Grid Corporation of China plans to spend more than CNY1t (US$162.8b) between 2013 and 2021 to build eight ultrahigh voltage (UHV) transmission lines across the nation, in order to bridge the gap between high resource areas and energy consumers. With high curtailment rates and power transmission bottlenecks jeopardizing ongoing wind power developments in China, such investment will be welcome news for the sector. An estimated 19% of cumulative installations were still not connected to the grid at the end of 2013. China also
overtook the US on smart grid investment for the fi rst time in 2013, with its US$4.3b representing almost one-third of total global investment in the sector.
More than a breeze. This infrastructure and grid investment is particularly critical given the approval of an additional 27.6GW of wind projects in March this year, potentially increasing China’s total wind capacity by around 30% if all were built. The Government is targeting 150GW of wind capacity by 2017, up from almost 90GW at the end of 2013. In particular, it wants the grid network connecting the northern cities of Beijing, Tianjin and Tangshan to generate 10% and 15% of its electricity from onshore wind farms by 2015 and 2017, respectively.
Access all areas. Vestas has become increasingly vocal about its determination to gain market share in China, where almost half of 2013’s new turbines were installed according to BNEF. Foreign manufacturers have struggled to compete in China due to low prices and competition from domestic companies, with BNEF indicating a turbine price difference of at least €300k (US$412k) per MW between China’s domestic market and outside. However, the scale of wind capacity deployment ambitions and the Government’s goal of opening up the market more generally could prompt Western companies to look at China once again.
Out at sea. Wind opportunities are also no longer confi ned to onshore. The anticipated revival of China’s offshore wind tender program and reports that preferential power prices for offshore projects will be set this year are creating high expectations of another booming energy market in China. The latest forecasts indicate more than 7GW of offshore capacity will be installed between 2014 and 2018.
Trading debt. May saw the launch of a debt note linked to the performance of carbon offsets on the Shenzhen Emissions Exchange, China’s fi rst carbon-linked fi nancial product. Issued by a unit of China General Nuclear Power Group, the sale could spark similar fi nancial derivatives and boost liquidity in the nation’s fl edging emissions-trading market. Shenzhen is one of six cities and provinces to launch carbon markets under the Government’s pilot program to reduce emissions, with a seventh to follow.
Rankings snapshot Issue 41 Issue 40
Total RECAI 2 2Onshore wind 1 2Offshore wind 3 3Solar PV 1 1Solar CSP 5 5Biomass 1 4Geothermal 12 8Hydro 1 1Marine 19 19
26
Local office contacts:
Sanjay [email protected]
India
Change at the top. While India’s renewable energy sector has always enjoyed broad political support, the election victory of Narendra Modi’s Bharatiya Janata Party in May is expected to reinvigorate a sector that is still far from fulfi lling its potential. Modi, previously Chief Minister of Gujarat state, home to a third of India’s installed solar capacity, has always been a strong advocate of a clean energy revolution in India.
Beyond ambition. Notwithstanding the importance of aspiration, the scale of the challenge ahead should not be understated. India has suffered a power defi cit every year since 1984 and while this creates an imperative for new generating capacity and transmission infrastructure, it is also hindering efforts to combat slower economic growth and high levels of infl ation. The poor fi nancial health of the country’s debt-ridden energy companies has also prompted a US$31b government industry bailout and weakened the ability of state-run distribution companies to meet their renewable portfolio obligations.
Budget woes. Financial pressures have also resulted in a backlog of more than INR10b (US$171m) in subsidy payments owed to wind and solar developers, now facing potentially unviable projects. The Ministry of New and Renewable Energy (MNRE) received just one-third of its INR15.2b (US$260m) budgetary allocation for FY14, and the budget for next fi scal year has been cut by 71% to just INR4.4b (US$75m). This could jeopardize state-level rootop solar programs that partly rely on MNRE funding.
Changing policy. A recent study by the Climate Policy Initiative and the Indian Business School, however, claims that India could reduce the cost of wind and solar power support by up to 78% and 28%, respectively, by providing low-cost long-term debt, compared to the most cost-effective version of the current generation-based incentive. According to the report, high interest rates and
Country focus
Highlights
• An election victory for the Bharatiya Janata Party in May signals a renewed focus on India’s renewable energy transition.
• Macroeconomic challenges, budget cuts and a US$31b bailout of the country’s energy sector are hindering this transition.
• A shift in policy toward the provision of low-cost long-term funding could reduce the cost of supporting renewable energy by up to 78%.
• A strong project pipeline, including 4GW mega-scale solar projects, is being overshadowed by domestic content rules and trade disputes with the US and China.
• A national wind energy initiative and 100GW wind capacity target for 2020 are expected to reignite interest in a recovering sector.
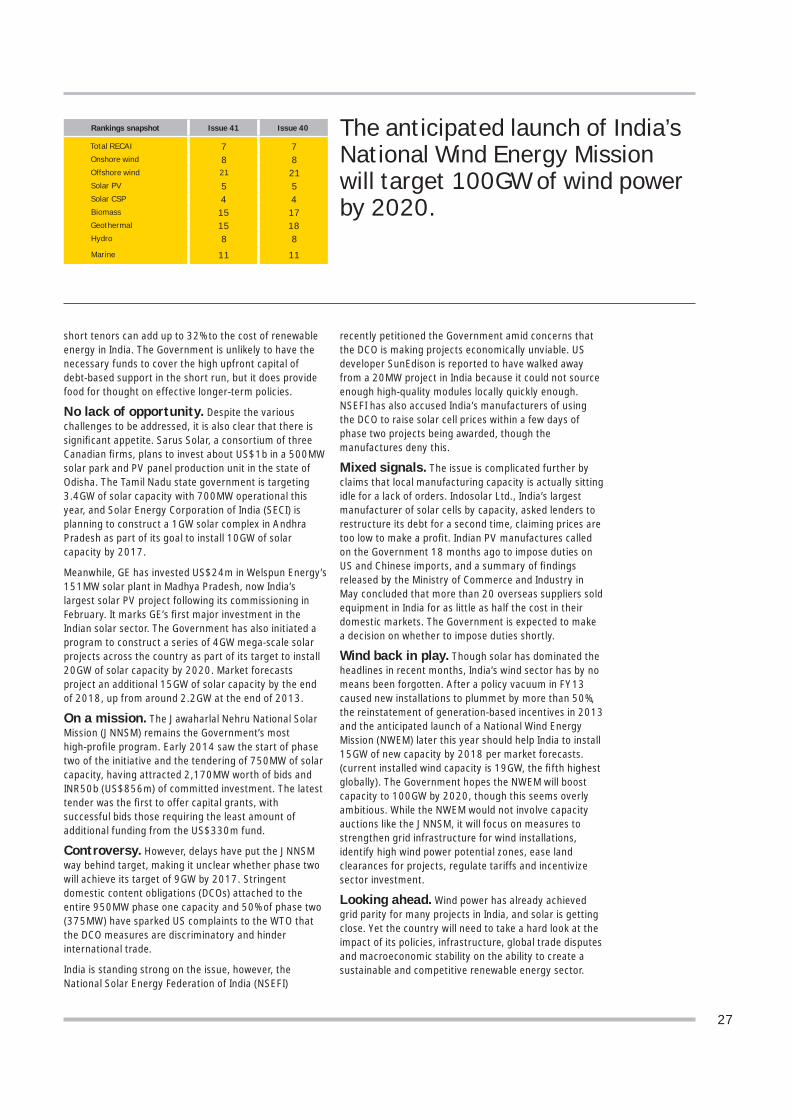
27
The anticipated launch of India’s National Wind Energy Mission will target 100GW of wind power by 2020.
short tenors can add up to 32% to the cost of renewable energy in India. The Government is unlikely to have the necessary funds to cover the high upfront capital of debt-based support in the short run, but it does provide food for thought on effective longer-term policies.
No lack of opportunity. Despite the various challenges to be addressed, it is also clear that there is signifi cant appetite. Sarus Solar, a consortium of three Canadian fi rms, plans to invest about US$1b in a 500MW solar park and PV panel production unit in the state of Odisha. The Tamil Nadu state government is targeting 3.4GW of solar capacity with 700MW operational this year, and Solar Energy Corporation of India (SECI) is planning to construct a 1GW solar complex in Andhra Pradesh as part of its goal to install 10GW of solar capacity by 2017.
Meanwhile, GE has invested US$24m in Welspun Energy’s 151MW solar plant in Madhya Pradesh, now India’s largest solar PV project following its commissioning in February. It marks GE’s fi rst major investment in the Indian solar sector. The Government has also initiated a program to construct a series of 4GW mega-scale solar projects across the country as part of its target to install 20GW of solar capacity by 2020. Market forecasts project an additional 15GW of solar capacity by the end of 2018, up from around 2.2GW at the end of 2013.
On a mission. The Jawaharlal Nehru National Solar Mission (JNNSM) remains the Government’s most high-profi le program. Early 2014 saw the start of phase two of the initiative and the tendering of 750MW of solar capacity, having attracted 2,170MW worth of bids and INR50b (US$856m) of committed investment. The latest tender was the fi rst to offer capital grants, with successful bids those requiring the least amount of additional funding from the US$330m fund.
Controversy. However, delays have put the JNNSM way behind target, making it unclear whether phase two will achieve its target of 9GW by 2017. Stringent domestic content obligations (DCOs) attached to the entire 950MW phase one capacity and 50% of phase two (375MW) have sparked US complaints to the WTO that the DCO measures are discriminatory and hinder international trade.
India is standing strong on the issue, however, the National Solar Energy Federation of India (NSEFI)
recently petitioned the Government amid concerns that the DCO is making projects economically unviable. US developer SunEdison is reported to have walked away from a 20MW project in India because it could not source enough high-quality modules locally quickly enough. NSEFI has also accused India’s manufacturers of using the DCO to raise solar cell prices within a few days of phase two projects being awarded, though the manufactures deny this.
Mixed signals. The issue is complicated further by claims that local manufacturing capacity is actually sitting idle for a lack of orders. Indosolar Ltd., India’s largest manufacturer of solar cells by capacity, asked lenders to restructure its debt for a second time, claiming prices are too low to make a profi t. Indian PV manufactures called on the Government 18 months ago to impose duties on US and Chinese imports, and a summary of fi ndings released by the Ministry of Commerce and Industry in May concluded that more than 20 overseas suppliers sold equipment in India for as little as half the cost in their domestic markets. The Government is expected to make a decision on whether to impose duties shortly.
Wind back in play. Though solar has dominated the headlines in recent months, India’s wind sector has by no means been forgotten. After a policy vacuum in FY13 caused new installations to plummet by more than 50%, the reinstatement of generation-based incentives in 2013 and the anticipated launch of a National Wind Energy Mission (NWEM) later this year should help India to install 15GW of new capacity by 2018 per market forecasts. (current installed wind capacity is 19GW, the fi fth highest globally). The Government hopes the NWEM will boost capacity to 100GW by 2020, though this seems overly ambitious. While the NWEM would not involve capacity auctions like the JNNSM, it will focus on measures to strengthen grid infrastructure for wind installations, identify high wind power potential zones, ease land clearances for projects, regulate tariffs and incentivize sector investment.
Looking ahead. Wind power has already achieved grid parity for many projects in India, and solar is getting close. Yet the country will need to take a hard look at the impact of its policies, infrastructure, global trade disputes and macroeconomic stability on the ability to create a sustainable and competitive renewable energy sector.
Rankings snapshot Issue 41 Issue 40
Total RECAI 7 7Onshore wind 8 8Offshore wind 21 21Solar PV 5 5Solar CSP 4 4Biomass 15 17Geothermal 15 18Hydro 8 8Marine 11 11

28
The end of an era. Mexico’s energy sector is undergoing a transformation. A legislative overhaul approved in late 2013 will end the 75-year state monopoly on oil, gas and electricity production; establish a competitive electricity market open to private investment; and facilitate the creation of an independent grid operator.
Price wars. A program of deregulation will inevitably also seek to reduce electricity prices, not least to support Mexico’s efforts to position itself as a global manufacturing hub. Electricity prices in some parts of the country are around 25% higher than those in the US for example, making renewable technologies such as wind and solar appear relatively cost competitive without subsidies. This is largely a product of Mexico’s reverse tiered retail pricing system, resulting in low rates of US$60–US$90/MWh for consumption up to 150kWh but as much as US$200–US$300/MWh above this threshold.
Feeling the pinch. Renewables developers have therefore primarily focused on consumers or regions likely to be paying these higher rates, which are also a stimulus for large corporations signing direct PPAs with renewables developers via the self-supply scheme. However, a push to lower electricity prices through increased market competition, and the fact that a large proportion of the country benefi ts from low electricity prices under the tiered system mean that renewable energy will likely come under increasing pressure to demonstrate its cost-effectiveness.
Aiming high. The Government has set itself the ambitious target of generating 35% of electricity from clean energy sources by 2024 (up from 15% currently, with only 1.5% from wind and solar), with a newly established Renewable Energy Council currently hammering out details on eight strategic steps to achieve this. Mexico‘s Energy Secretary Pedro Coldwell claims the country has 57GW of potential renewable energy capacity, of which 20GW can be generated at competitive prices. Earlier this year, the Government approved 10 renewable energy projects worth an estimated US$2.1b.
Country focus
Local office contacts:
Rafael [email protected]
Koen van’t [email protected]
Highlights
• A legislative overhaul of the energy sector will open up the market up more private sector competition and could generate an additional US$20b of foreign direct investment.
• The changes will likely prompt a shift from the current self-supply model to PPAs negotiated in the wholesale market.
• However, the reforms could also reduce the relative cost competitiveness of renewable energy by lowering electricity prices.
• An ambitious 35% renewable energy target and 57GW of potential capacity are continuing to drive large-scale projects and fi nancings.
• Government support mechanisms are helping to accelerate growth in the solar sector.
Mexico
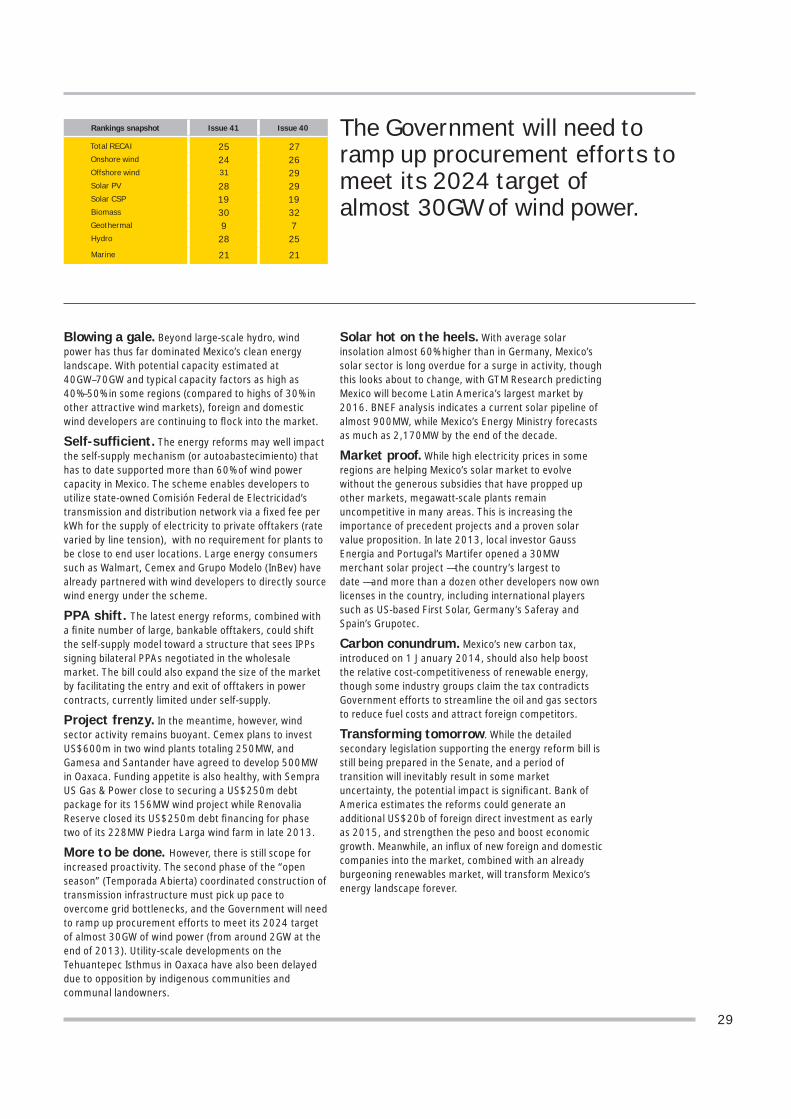
29
The Government will need to ramp up procurement efforts to meet its 2024 target of almost 30GW of wind power.
Blowing a gale. Beyond large-scale hydro, wind power has thus far dominated Mexico’s clean energy landscape. With potential capacity estimated at 40GW–70GW and typical capacity factors as high as 40%–50% in some regions (compared to highs of 30% in other attractive wind markets), foreign and domestic wind developers are continuing to fl ock into the market.
Self-suffi cient. The energy reforms may well impact the self-supply mechanism (or autoabastecimiento) that has to date supported more than 60% of wind power capacity in Mexico. The scheme enables developers to utilize state-owned Comisión Federal de Electricidad’s transmission and distribution network via a fi xed fee per kWh for the supply of electricity to private offtakers (rate varied by line tension), with no requirement for plants to be close to end user locations. Large energy consumers such as Walmart, Cemex and Grupo Modelo (InBev) have already partnered with wind developers to directly source wind energy under the scheme.
PPA shift. The latest energy reforms, combined with a fi nite number of large, bankable offtakers, could shift the self-supply model toward a structure that sees IPPs signing bilateral PPAs negotiated in the wholesale market. The bill could also expand the size of the market by facilitating the entry and exit of offtakers in power contracts, currently limited under self-supply.
Project frenzy. In the meantime, however, wind sector activity remains buoyant. Cemex plans to invest US$600m in two wind plants totaling 250MW, and Gamesa and Santander have agreed to develop 500MW in Oaxaca. Funding appetite is also healthy, with Sempra US Gas & Power close to securing a US$250m debt package for its 156MW wind project while Renovalia Reserve closed its US$250m debt fi nancing for phase two of its 228MW Piedra Larga wind farm in late 2013.
More to be done. However, there is still scope for increased proactivity. The second phase of the “open season” (Temporada Abierta) coordinated construction of transmission infrastructure must pick up pace to overcome grid bottlenecks, and the Government will need to ramp up procurement efforts to meet its 2024 target of almost 30GW of wind power (from around 2GW at the end of 2013). Utility-scale developments on the Tehuantepec Isthmus in Oaxaca have also been delayed due to opposition by indigenous communities and communal landowners.
Solar hot on the heels. With average solar insolation almost 60% higher than in Germany, Mexico’s solar sector is long overdue for a surge in activity, though this looks about to change, with GTM Research predicting Mexico will become Latin America’s largest market by 2016. BNEF analysis indicates a current solar pipeline of almost 900MW, while Mexico’s Energy Ministry forecasts as much as 2,170MW by the end of the decade.
Market proof. While high electricity prices in some regions are helping Mexico’s solar market to evolve without the generous subsidies that have propped up other markets, megawatt-scale plants remain uncompetitive in many areas. This is increasing the importance of precedent projects and a proven solar value proposition. In late 2013, local investor Gauss Energia and Portugal’s Martifer opened a 30MW merchant solar project — the country’s largest to date — and more than a dozen other developers now own licenses in the country, including international players such as US-based First Solar, Germany’s Saferay and Spain’s Grupotec.
Carbon conundrum. Mexico’s new carbon tax, introduced on 1 January 2014, should also help boost the relative cost-competitiveness of renewable energy, though some industry groups claim the tax contradicts Government efforts to streamline the oil and gas sectors to reduce fuel costs and attract foreign competitors.
Transforming tomorrow. While the detailed secondary legislation supporting the energy reform bill is still being prepared in the Senate, and a period of transition will inevitably result in some market uncertainty, the potential impact is signifi cant. Bank of America estimates the reforms could generate an additional US$20b of foreign direct investment as early as 2015, and strengthen the peso and boost economic growth. Meanwhile, an infl ux of new foreign and domestic companies into the market, combined with an already burgeoning renewables market, will transform Mexico’s energy landscape forever.
Rankings snapshot Issue 41 Issue 40
Total RECAI 25 27Onshore wind 24 26Offshore wind 31 29Solar PV 28 29Solar CSP 19 19Biomass 30 32Geothermal 9 7Hydro 28 25Marine 21 21
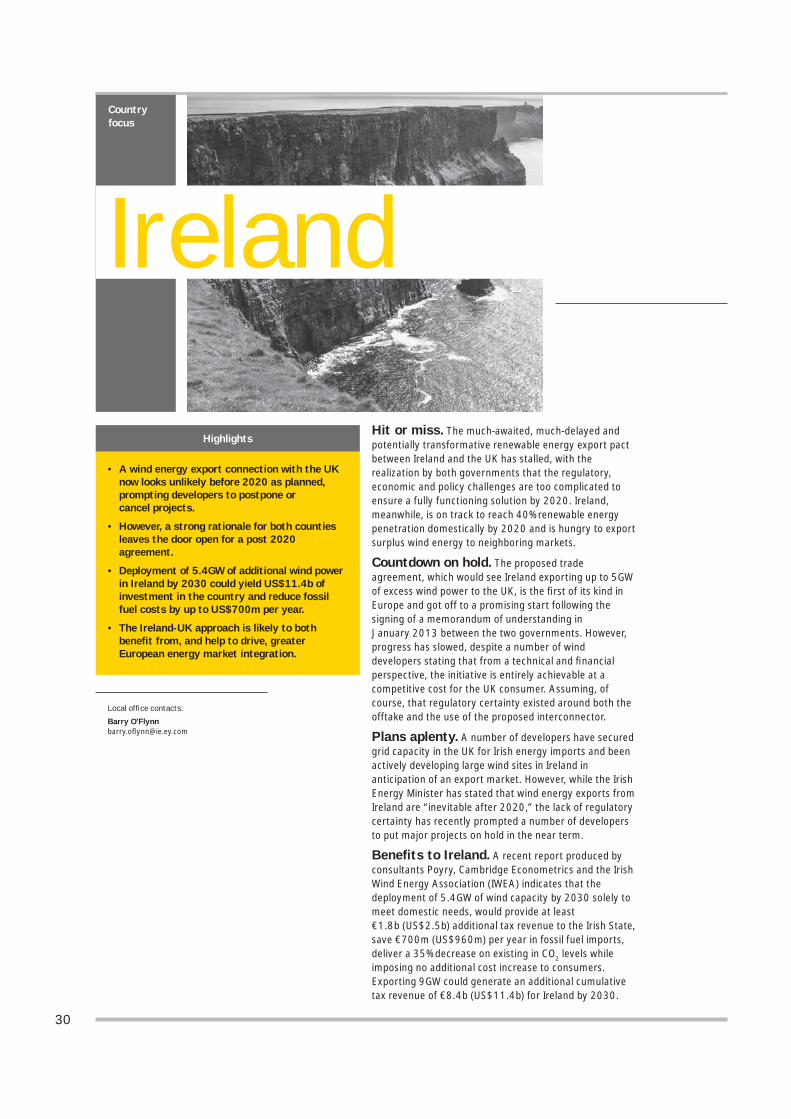
30
Hit or miss. The much-awaited, much-delayed and potentially transformative renewable energy export pact between Ireland and the UK has stalled, with the realization by both governments that the regulatory, economic and policy challenges are too complicated to ensure a fully functioning solution by 2020. Ireland, meanwhile, is on track to reach 40% renewable energy penetration domestically by 2020 and is hungry to export surplus wind energy to neighboring markets.
Countdown on hold. The proposed trade agreement, which would see Ireland exporting up to 5GW of excess wind power to the UK, is the fi rst of its kind in Europe and got off to a promising start following the signing of a memorandum of understanding in January 2013 between the two governments. However, progress has slowed, despite a number of wind developers stating that from a technical and fi nancial perspective, the initiative is entirely achievable at a competitive cost for the UK consumer. Assuming, of course, that regulatory certainty existed around both the offtake and the use of the proposed interconnector.
Plans aplenty. A number of developers have secured grid capacity in the UK for Irish energy imports and been actively developing large wind sites in Ireland in anticipation of an export market. However, while the Irish Energy Minister has stated that wind energy exports from Ireland are “inevitable after 2020,” the lack of regulatory certainty has recently prompted a number of developers to put major projects on hold in the near term.
Benefi ts to Ireland. A recent report produced by consultants Poyry, Cambridge Econometrics and the Irish Wind Energy Association (IWEA) indicates that the deployment of 5.4GW of wind capacity by 2030 solely to meet domestic needs, would provide at least €1.8b (US$2.5b) additional tax revenue to the Irish State, save €700m (US$960m) per year in fossil fuel imports, deliver a 35% decrease on existing in CO2 levels while imposing no additional cost increase to consumers. Exporting 9GW could generate an additional cumulative tax revenue of €8.4b (US$11.4b) for Ireland by 2030.
Country focus
Local office contacts:
Barry O’Flynnbarry.ofl [email protected]
Ireland
Highlights
• A wind energy export connection with the UK now looks unlikely before 2020 as planned, prompting developers to postpone or cancel projects.
• However, a strong rationale for both counties leaves the door open for a post 2020 agreement.
• Deployment of 5.4GW of additional wind power in Ireland by 2030 could yield US$11.4b of investment in the country and reduce fossil fuel costs by up to US$700m per year.
• The Ireland-UK approach is likely to both benefi t from, and help to drive, greater European energy market integration.
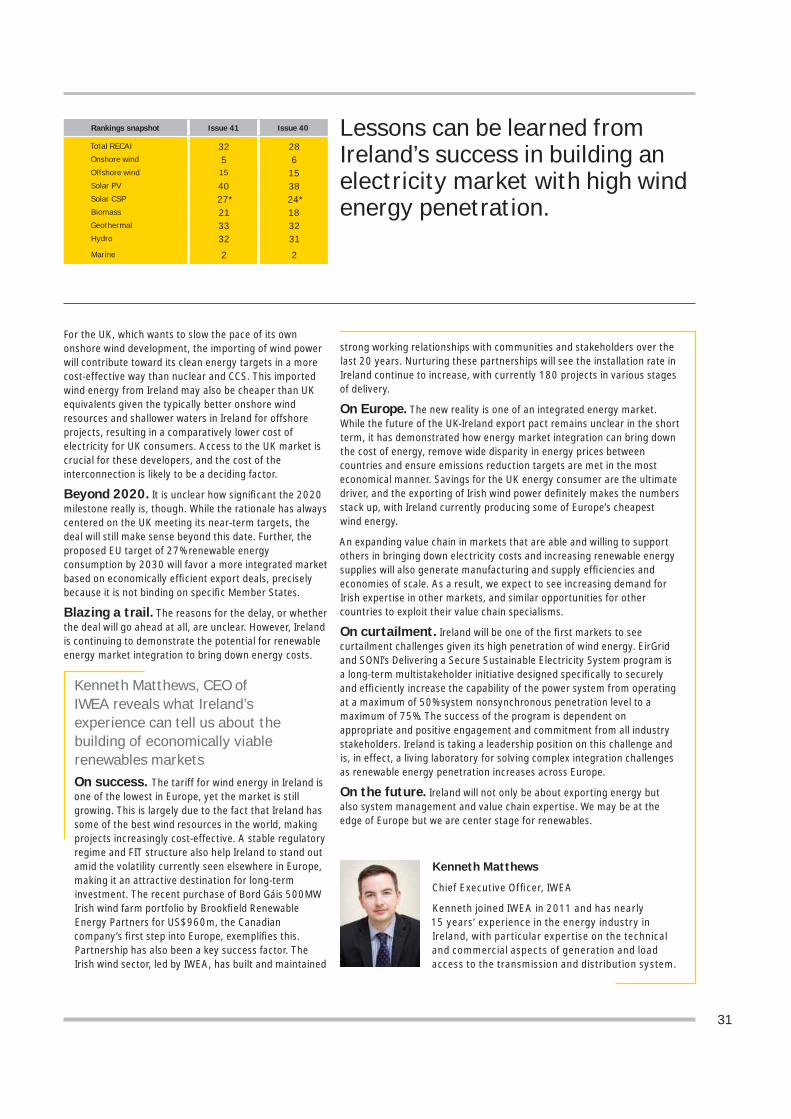
31
Lessons can be learned from Ireland’s success in building an electricity market with high wind energy penetration.
For the UK, which wants to slow the pace of its own onshore wind development, the importing of wind power will contribute toward its clean energy targets in a more cost-effective way than nuclear and CCS. This imported wind energy from Ireland may also be cheaper than UK equivalents given the typically better onshore wind resources and shallower waters in Ireland for offshore projects, resulting in a comparatively lower cost of electricity for UK consumers. Access to the UK market is crucial for these developers, and the cost of the interconnection is likely to be a deciding factor.
Beyond 2020. It is unclear how signifi cant the 2020 milestone really is, though. While the rationale has always centered on the UK meeting its near-term targets, the deal will still make sense beyond this date. Further, the proposed EU target of 27% renewable energy consumption by 2030 will favor a more integrated market based on economically effi cient export deals, precisely because it is not binding on specifi c Member States.
Blazing a trail. The reasons for the delay, or whether the deal will go ahead at all, are unclear. However, Ireland is continuing to demonstrate the potential for renewable energy market integration to bring down energy costs.
Rankings snapshot Issue 41 Issue 40
Total RECAI 32 28Onshore wind 5 6Offshore wind 15 15Solar PV 40 38Solar CSP 27* 24*Biomass 21 18Geothermal 33 32Hydro 32 31Marine 2 2
Kenneth Matthews
Chief Executive Offi cer, IWEA
Kenneth joined IWEA in 2011 and has nearly 15 years’ experience in the energy industry in Ireland, with particular expertise on the technical and commercial aspects of generation and load access to the transmission and distribution system.
Kenneth Matthews, CEO of IWEA reveals what Ireland’s experience can tell us about the building of economically viable renewables marketsOn success. The tariff for wind energy in Ireland is one of the lowest in Europe, yet the market is still growing. This is largely due to the fact that Ireland has some of the best wind resources in the world, making projects increasingly cost-effective. A stable regulatory regime and FIT structure also help Ireland to stand out amid the volatility currently seen elsewhere in Europe, making it an attractive destination for long-term investment. The recent purchase of Bord Gáis 500MW Irish wind farm portfolio by Brookfi eld Renewable Energy Partners for US$960m, the Canadian company’s fi rst step into Europe, exemplifi es this. Partnership has also been a key success factor. The Irish wind sector, led by IWEA, has built and maintained
strong working relationships with communities and stakeholders over the last 20 years. Nurturing these partnerships will see the installation rate in Ireland continue to increase, with currently 180 projects in various stages of delivery.
On Europe. The new reality is one of an integrated energy market. While the future of the UK-Ireland export pact remains unclear in the short term, it has demonstrated how energy market integration can bring down the cost of energy, remove wide disparity in energy prices between countries and ensure emissions reduction targets are met in the most economical manner. Savings for the UK energy consumer are the ultimate driver, and the exporting of Irish wind power defi nitely makes the numbers stack up, with Ireland currently producing some of Europe’s cheapest wind energy.
An expanding value chain in markets that are able and willing to support others in bringing down electricity costs and increasing renewable energy supplies will also generate manufacturing and supply effi ciencies and economies of scale. As a result, we expect to see increasing demand for Irish expertise in other markets, and similar opportunities for other countries to exploit their value chain specialisms.
On curtailment. Ireland will be one of the fi rst markets to see curtailment challenges given its high penetration of wind energy. EirGrid and SONI’s Delivering a Secure Sustainable Electricity System program is a long-term multistakeholder initiative designed specifi cally to securely and effi ciently increase the capability of the power system from operating at a maximum of 50% system nonsynchronous penetration level to a maximum of 75%. The success of the program is dependent on appropriate and positive engagement and commitment from all industry stakeholders. Ireland is taking a leadership position on this challenge and is, in effect, a living laboratory for solving complex integration challenges as renewable energy penetration increases across Europe.
On the future. Ireland will not only be about exporting energy but also system management and value chain expertise. We may be at the edge of Europe but we are center stage for renewables.
32
On the map. An agreement signed in May 2014 between a private sector joint venture and the Federal Government and Delta State Government represents a signifi cant milestone in Nigeria’s energy transition. The deal will see Canadian renewables developer SkyPower Ltd. and FAS Energy, a subsidiary of Saudi retail group Fawaz Alhokair, develop 3GW of utility-scale solar capacity in Nigeria over the next fi ve years, requiring an estimated US$5b of investment and creating around 30,000 jobs. In short, Nigeria’s renewable energy sector is now well and truly on the map.
Underway. However, the importance of this deal should not overshadow the broader energy sector transformation that is already underway, paving the way for such large-scale developments. Nigeria’s pro-reform government has initiated a 5- to 10-year Transitional Electricity Market (TEM) that will gradually liberalize the sector and eventually establish full wholesale and retail competition.
Sell-side. A prerequisite of this reform was the US$2.5b unbundling of state-owned Power Holding Company of Nigeria (PHCN) in late 2013, which saw ownership of 15 successor generation and distribution companies pass to the private sector (though two transactions are to be re-run). The dismantling of Nigeria’s power sector monopoly piqued both local and foreign investor appetite, with successful bidders including partners such as Siemens AG, Korea Electric Power Corp. and Forte Oil Plc. Attention has now turned to the auctioning of 80% stakes in 10 new gas-fi red power plants totaling 5GW, with preferred bidders selected in March this year.
On hold. Gas supply shortages attributed to inadequate gas production and the sabotage of existing pipelines have prompted the Federal Government to postpone the offi cial launch of the TEM, previously scheduled for 1 March 2014. The Federal Government has, however, confi rmed that the Nigerian Bulk Electricity Trading Plc. (NBET), which acts as a clearing house for
Market to watch
Local office contacts:
Bisi [email protected]
Norman NdabaEnergy sector leader, [email protected]
Nigeria
Highlights
• Government support for 3GW of solar power developments requiring US$5b of investment marks a critical milestone for Nigeria’s renewable energy sector.
• A 10-year reform plan and the US$2.5b unbundling of a state-owned power monopoly in 2013 puts energy market liberalization fi rmly on the agenda.
• Low gas prices, the sabotage of pipelines and surging energy demand have resulted in major supply shortages, prompting around 90% of industrial consumers to produce their own electricity.
• Nigeria is targeting 20% of renewable energy capacity by 2030, with a FIT regime also currently under development.
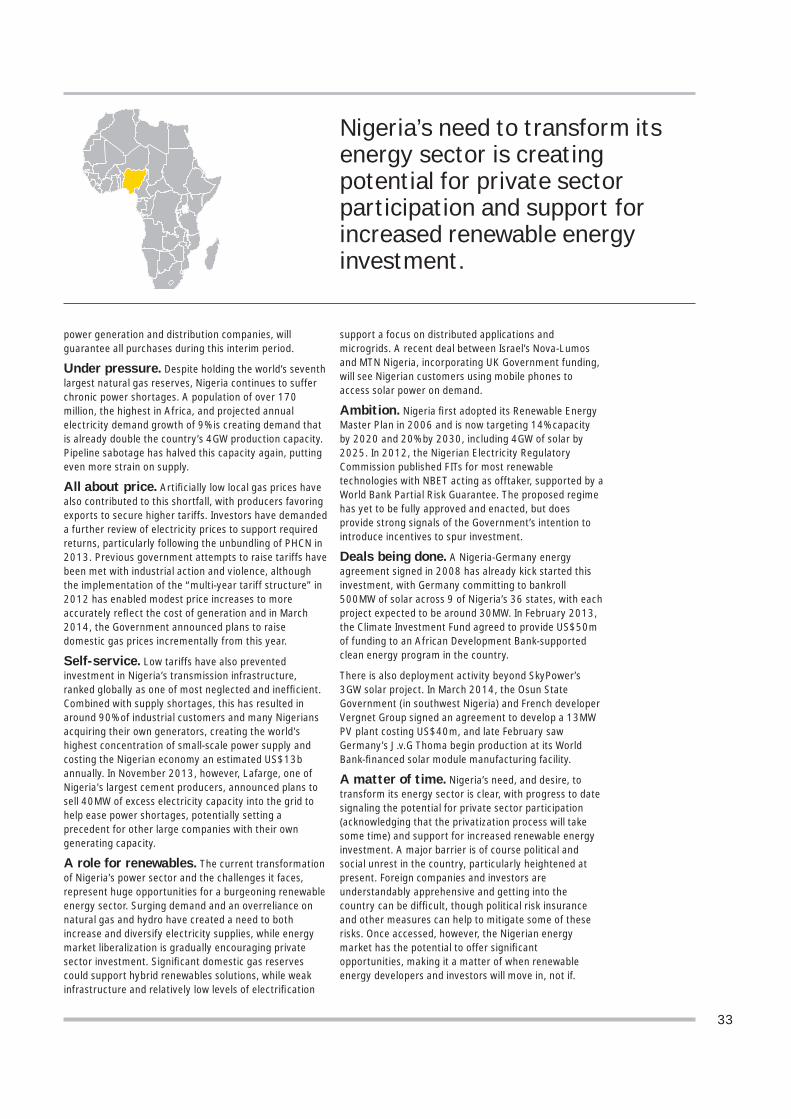
33
Nigeria’s need to transform its energy sector is creating potential for private sector participation and support for increased renewable energy investment.
power generation and distribution companies, will guarantee all purchases during this interim period.
Under pressure. Despite holding the world’s seventh largest natural gas reserves, Nigeria continues to suffer chronic power shortages. A population of over 170 million, the highest in Africa, and projected annual electricity demand growth of 9% is creating demand that is already double the country’s 4GW production capacity. Pipeline sabotage has halved this capacity again, putting even more strain on supply.
All about price. Artifi cially low local gas prices have also contributed to this shortfall, with producers favoring exports to secure higher tariffs. Investors have demanded a further review of electricity prices to support required returns, particularly following the unbundling of PHCN in 2013. Previous government attempts to raise tariffs have been met with industrial action and violence, although the implementation of the “multi-year tariff structure” in 2012 has enabled modest price increases to more accurately refl ect the cost of generation and in March 2014, the Government announced plans to raise domestic gas prices incrementally from this year.
Self-service. Low tariffs have also prevented investment in Nigeria’s transmission infrastructure, ranked globally as one of most neglected and ineffi cient. Combined with supply shortages, this has resulted in around 90% of industrial customers and many Nigerians acquiring their own generators, creating the world's highest concentration of small-scale power supply and costing the Nigerian economy an estimated US$13b annually. In November 2013, however, Lafarge, one of Nigeria's largest cement producers, announced plans to sell 40MW of excess electricity capacity into the grid to help ease power shortages, potentially setting a precedent for other large companies with their own generating capacity.
A role for renewables. The current transformation of Nigeria’s power sector and the challenges it faces, represent huge opportunities for a burgeoning renewable energy sector. Surging demand and an overreliance on natural gas and hydro have created a need to both increase and diversify electricity supplies, while energy market liberalization is gradually encouraging private sector investment. Signifi cant domestic gas reserves could support hybrid renewables solutions, while weak infrastructure and relatively low levels of electrifi cation
support a focus on distributed applications and microgrids. A recent deal between Israel’s Nova-Lumos and MTN Nigeria, incorporating UK Government funding, will see Nigerian customers using mobile phones to access solar power on demand.
Ambition. Nigeria fi rst adopted its Renewable Energy Master Plan in 2006 and is now targeting 14% capacity by 2020 and 20% by 2030, including 4GW of solar by 2025. In 2012, the Nigerian Electricity Regulatory Commission published FITs for most renewable technologies with NBET acting as offtaker, supported by a World Bank Partial Risk Guarantee. The proposed regime has yet to be fully approved and enacted, but does provide strong signals of the Government’s intention to introduce incentives to spur investment.
Deals being done. A Nigeria-Germany energy agreement signed in 2008 has already kick started this investment, with Germany committing to bankroll 500MW of solar across 9 of Nigeria’s 36 states, with each project expected to be around 30MW. In February 2013, the Climate Investment Fund agreed to provide US$50m of funding to an African Development Bank-supported clean energy program in the country.
There is also deployment activity beyond SkyPower’s 3GW solar project. In March 2014, the Osun State Government (in southwest Nigeria) and French developer Vergnet Group signed an agreement to develop a 13MW PV plant costing US$40m, and late February saw Germany’s J.v.G Thoma begin production at its World Bank-fi nanced solar module manufacturing facility.
A matter of time. Nigeria’s need, and desire, to transform its energy sector is clear, with progress to date signaling the potential for private sector participation (acknowledging that the privatization process will take some time) and support for increased renewable energy investment. A major barrier is of course political and social unrest in the country, particularly heightened at present. Foreign companies and investors are understandably apprehensive and getting into the country can be diffi cult, though political risk insurance and other measures can help to mitigate some of these risks. Once accessed, however, the Nigerian energy market has the potential to offer signifi cant opportunities, making it a matter of when renewable energy developers and investors will move in, not if.
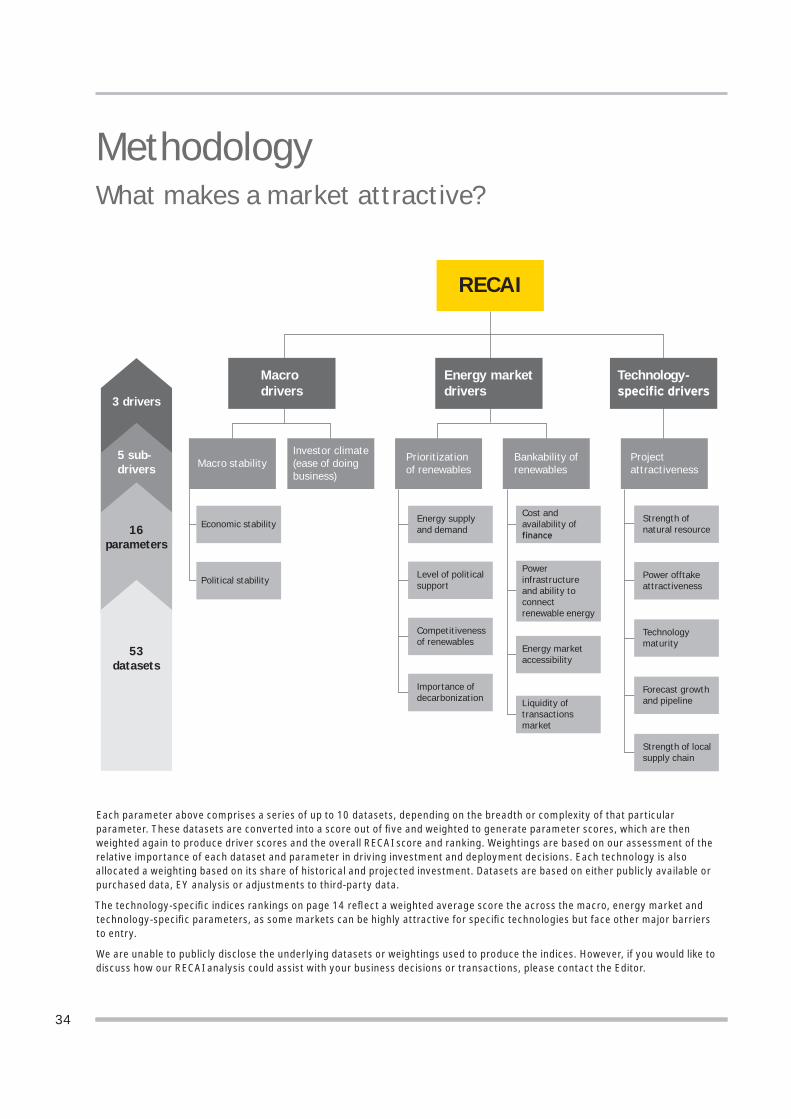
34
MethodologyWhat makes a market attractive?
Each parameter above comprises a series of up to 10 datasets, depending on the breadth or complexity of that particular parameter. These datasets are converted into a score out of fi ve and weighted to generate parameter scores, which are then weighted again to produce driver scores and the overall RECAI score and ranking. Weightings are based on our assessment of the relative importance of each dataset and parameter in driving investment and deployment decisions. Each technology is also allocated a weighting based on its share of historical and projected investment. Datasets are based on either publicly available or purchased data, EY analysis or adjustments to third-party data.
The technology-specifi c indices rankings on page 14 refl ect a weighted average score the across the macro, energy market and technology-specifi c parameters, as some markets can be highly attractive for specifi c technologies but face other major barriers to entry.
We are unable to publicly disclose the underlying datasets or weightings used to produce the indices. However, if you would like to discuss how our RECAI analysis could assist with your business decisions or transactions, please contact the Editor.
RECAI
Macrodrivers
Energy marketdrivers
Technology-
3 drivers
Macro stabilityInvestor climate(ease of doingbusiness)
Prioritizationof renewables
Bankability ofrenewables
Projectattractiveness
5 sub-drivers
16parameters
53datasets
Economic stability Energy supplyand demand
Cost andavailability of
Powerinfrastructureand ability toconnectrenewable energy
Energy marketaccessibility
Liquidity oftransactionsmarket
Strength ofnatural resource
Power offtakeattractiveness
Technologymaturity
Forecast growthand pipeline
Strength of localsupply chain
Level of politicalsupport
Competitivenessof renewables
Importance ofdecarbonization
Political stability
35
Glossary
Abbreviation Defi nition
b BillionBNEF Bloomberg New Energy FinanceCCS Carbon capture and storageCSP Concentrated solar power DCO Domestic content obligationDII Desertec Industrial InitiativeEU European UnionFIT Feed-in tariffGW GigawattIEA International Energy AgencyITC Investment tax creditkWh Kilowatt hoursLCOE Levelized cost of electricitym Million MEA Middle East and Africa MIGA Multilateral Investment Guarantee Agency OCED Organization for Economic Cooperation and
DevelopmentOPIC Overseas Private Investment Corporation MW MegawattMWh Megawatt hourPPA Power purchase agreement PRIMe Policy risk insurance mechanismPTC Production tax creditPV PhotovoltaicRPS Renewable Portfolio Standard t TrillionJV Joint venture
36
Global Cleantech Center:
Gil ForerGlobal Cleantech Center [email protected]
Scott SarazenGlobal Cleantech Markets [email protected]
Ben WarrenGlobal Cleantech Transactions [email protected]
Paul NaumoffGlobal Cleantech and Sustainability Tax [email protected]
Heather SibleyGlobal Cleantech Assurance [email protected]
John de YongeDirector, Cleantech Account [email protected]
Scott E. AndersonGlobal Marketing Director, [email protected]
Content enquiries should be addressed to the Editor:
Klair [email protected]+44 161 333 2734
RECAI production support by:
Sheena Popli (Advanced Analyst) Mohammad Majid (Advanced Analyst) Divya Jaitly (Assistant Manager)
To be added to the RECAI email distribution list, please contact:
Michael [email protected]+44 20 7951 8870
Renewable energy contacts by location
Asia-Pacifi c Australia Matt [email protected]
Jomo [email protected]
China Alan [email protected]
Japan Kunihiko [email protected]
Kenji [email protected]
South Korea Jun Hyuk [email protected]
Moon Ho [email protected]
Taiwan Kim [email protected]
Austen [email protected]
Thailand Wilaiporn [email protected]
Americas Argentina Enrique [email protected]
Brazil Luiz Claudio [email protected]
Lucio [email protected]
Canada Mark [email protected]
Cynthia [email protected]
Chile Tom [email protected]
Raul [email protected]
Mexico Rafael [email protected]
Koen van’t [email protected]
Peru Enrique [email protected]
US Michael [email protected]
Joseph [email protected]
EY global contacts
Please also visit our website: ey.com/recai
37
EMEIA Austria Elfriede [email protected]
Eva-Maria [email protected]
Belgium Tristan [email protected]
Franz [email protected]
Bulgaria Diana [email protected]
Nikolay [email protected]
Czech Republic David [email protected]
Stepan Fliegerstepan.fl [email protected]
Denmark Jonas [email protected]
Kasper Vejgaard [email protected]
Egypt Shady [email protected]
Finland Kari Pesonenkari.pesonen@fi .ey.com
Petri Leinonenpetri.leinonen@fi .ey.com
France Jean-Christophe [email protected]
Alexis [email protected]
Germany Frank [email protected]
Thomas [email protected]
Greece Georgios [email protected]
India Sanjay [email protected]
Ireland Barry O’Flynnbarry.ofl [email protected]
Israel Itay [email protected]
Italy Roberto [email protected]
Stefano [email protected]
Luxembourg Alain [email protected]
Olivier [email protected]
Morocco Khalil [email protected]
Ahlam [email protected]
Netherlands Diederik van [email protected]
Wolfgang [email protected]
Norway Torbjørn [email protected]
Vegard [email protected]
Poland Kamil [email protected]
Przemyslaw [email protected]
Portugal Miguel Farinha [email protected]
Florbela Limafl [email protected]
Romania Florin Vasilicafl [email protected]
Russia Ksenia [email protected]
Saudi Arabia David [email protected]
Nimer [email protected]
South Africa Norman [email protected]
Brunhilde [email protected]
Spain Victor Manuel [email protected]
Eva Maria [email protected]
Sweden Lars [email protected]
Niclas [email protected]
Tunisia Hichem Ben [email protected]
Hela [email protected]
Turkey Ethem [email protected]
Orcun [email protected]
UAE Nimer [email protected]
Ukraine Victor [email protected]
UK Andrew [email protected]
Arnaud [email protected]
Josephine [email protected]
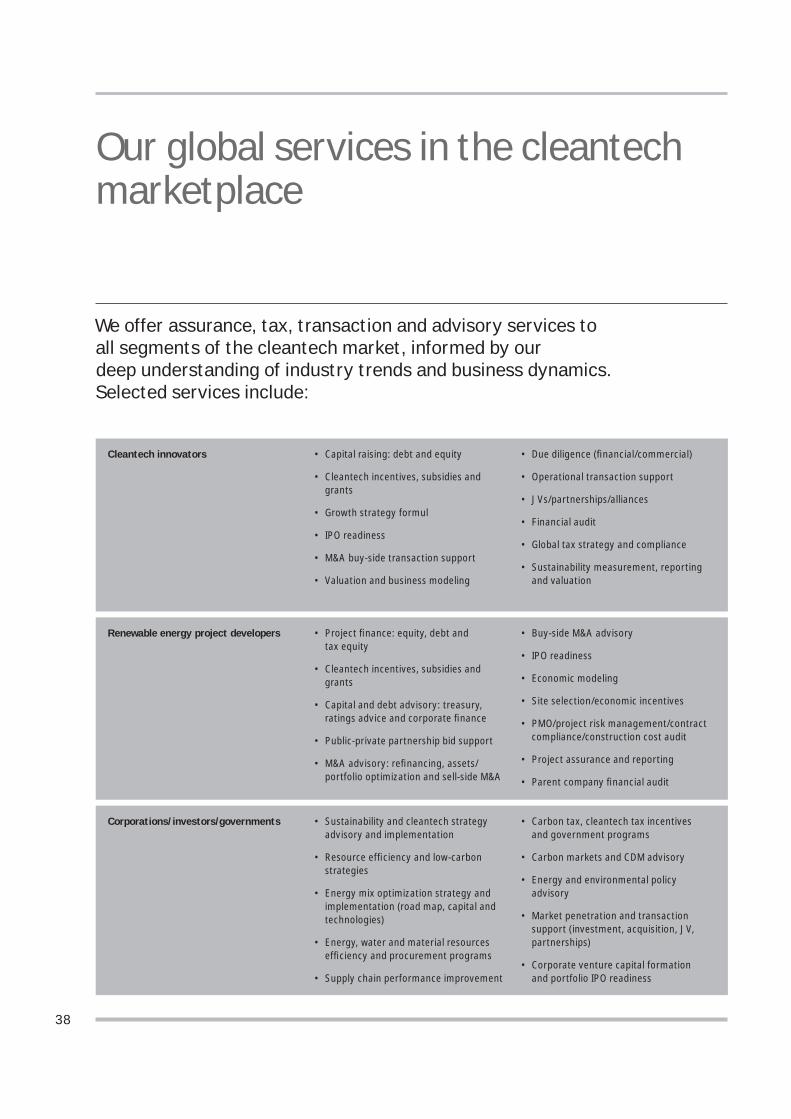
38
We offer assurance, tax, transaction and advisory services to all segments of the cleantech market, informed by our deep understanding of industry trends and business dynamics. Selected services include:
Our global services in the cleantech marketplace
Cleantech innovators • Capital raising: debt and equity
• Cleantech incentives, subsidies and grants
• Growth strategy formul
• IPO readiness
• M&A buy-side transaction support
• Valuation and business modeling
• Due diligence (fi nancial/commercial)
• Operational transaction support
• JVs/partnerships/alliances
• Financial audit
• Global tax strategy and compliance
• Sustainability measurement, reporting and valuation
Renewable energy project developers • Project fi nance: equity, debt andtax equity
• Cleantech incentives, subsidies and grants
• Capital and debt advisory: treasury, ratings advice and corporate fi nance
• Public-private partnership bid support
• M&A advisory: refi nancing, assets/portfolio optimization and sell-side M&A
• Buy-side M&A advisory
• IPO readiness
• Economic modeling
• Site selection/economic incentives
• PMO/project risk management/contract compliance/construction cost audit
• Project assurance and reporting
• Parent company fi nancial audit
Corporations/investors/governments • Sustainability and cleantech strategy advisory and implementation
• Resource effi ciency and low-carbon strategies
• Energy mix optimization strategy and implementation (road map, capital and technologies)
• Energy, water and material resources effi ciency and procurement programs
• Supply chain performance improvement
• Carbon tax, cleantech tax incentives and government programs
• Carbon markets and CDM advisory
• Energy and environmental policy advisory
• Market penetration and transaction support (investment, acquisition, JV, partnerships)
• Corporate venture capital formation and portfolio IPO readiness
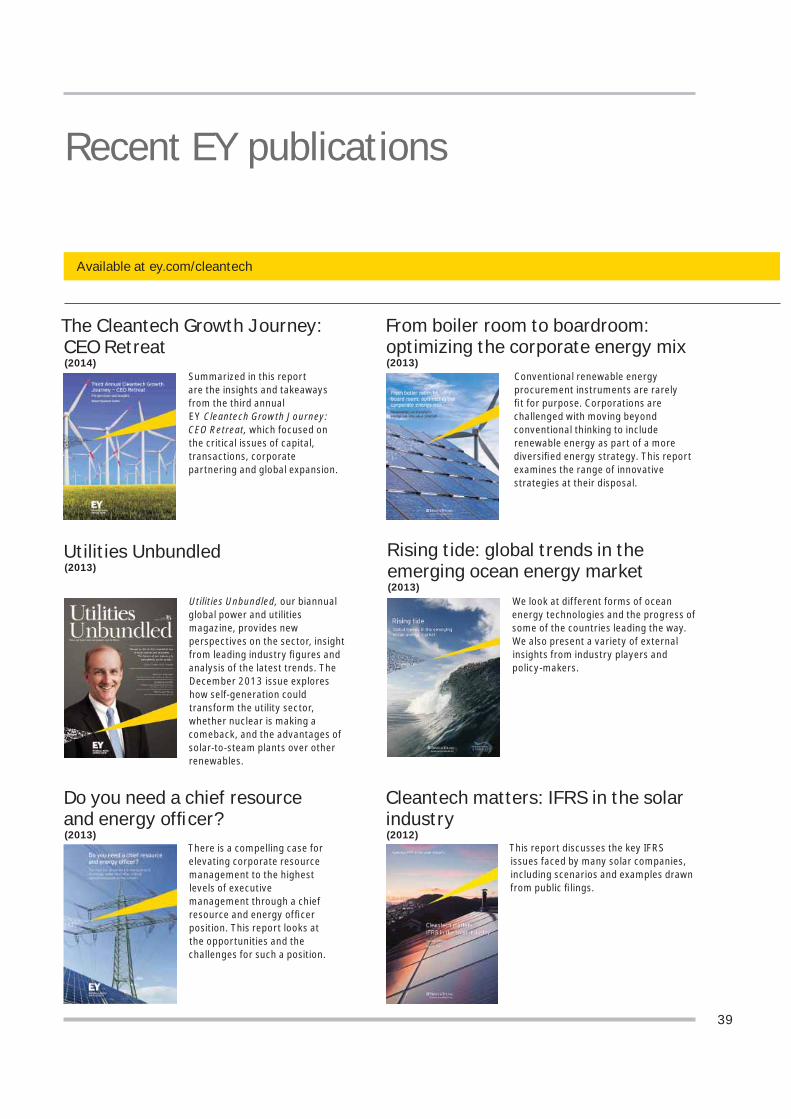
39
Available at ey.com/cleantech
Recent EY publications
Summarized in this report are the insights and takeaways from the third annual EY Cleantech Growth Journey: CEO Retreat, which focused on the critical issues of capital, transactions, corporate partnering and global expansion.
Utilities Unbundled, our biannual global power and utilities magazine, provides new perspectives on the sector, insight from leading industry fi gures and analysis of the latest trends. The December 2013 issue explores how self-generation could transform the utility sector, whether nuclear is making a comeback, and the advantages of solar-to-steam plants over other renewables.
There is a compelling case for elevating corporate resource management to the highest levels of executive management through a chief resource and energy offi cer position. This report looks at the opportunities and the challenges for such a position.
We look at different forms of ocean energy technologies and the progress of some of the countries leading the way. We also present a variety of external insights from industry players and policy-makers.
Conventional renewable energy procurement instruments are rarely fi t for purpose. Corporations are challenged with moving beyond conventional thinking to include renewable energy as part of a more diversifi ed energy strategy. This report examines the range of innovative strategies at their disposal.
This report discusses the key IFRS issues faced by many solar companies, including scenarios and examples drawn from public fi lings.
The Cleantech Growth Journey: CEO Retreat (2014)
Utilities Unbundled(2013)
Do you need a chief resource and energy offi cer?(2013)
Rising tide: global trends in the emerging ocean energy market(2013)
From boiler room to boardroom: optimizing the corporate energy mix(2013)
Cleantech matters: IFRS in the solar industry(2012)

EY | Assurance | Tax | Transactions | Advisory
About EYEY is a global leader in assurance, tax, transaction and advisory services. The insights and quality services we deliver help build trust and confidence in the capital markets and in economies the world over. We develop outstanding leaders who team to deliver on our promises to all of our stakeholders. In so doing, we play a critical role in building a better working world for our people, for our clients and for our communities.
EY refers to the global organization, and may refer to one or more, of the member firms of Ernst & Young Global Limited, each of which is a separate legal entity. Ernst & Young Global Limited, a UK company limited by guarantee, does not provide services to clients. For more information about our organization, please visit ey.com.
© 2014 EYGM Limited.All Rights Reserved.
EYG no. FW0046CSG/GSC2014/1365209ED 0515
This material has been prepared for general informational purposes only and is not intended to be relied upon as accounting, tax, or other professional advice. Please refer to your advisors for specific advice.
The views of third parties set out in this publication are not necessarily the views of the global EY organization or its member firms. Moreover, they should be seen in the context of the time they were made.
ey.com/recaiey.com/cleantech