@~&f-970~~~ *w3 sahjd- -77- osoac - digital library/67531/metadc684159/m2/1/high... ·...
TRANSCRIPT
@ ~ & F - 9 7 0 ~ ~ ~ *w3 SAhjD- -77- osoac
Semiconductor Microlasers with Intracavity Microfluidics for Biomedical Analyses
P. L. Gourley and A. E. McDonald, Sandia National Laboratories, MS 1415, Albuquerque, NM 87185
M. F. Gourley, National Institutes of Health, Bethesda, MI) 20892
T. Bocklage, University of New Mexico School of Medicine, Albuquerque,
Abstract I Recently demonstrated microfluidic “chips” have the potential to be usefbl bioanalytical
tools for DNA, protein, and cellular studies.’ To realize this potential, means for introducing
fluids, separating their components, and detection must be integrated onto the chip. We have
investigated semiconductor laser microcavity spectroscopy as a means for ultrasensitive detection
of various fI uids, cells, and
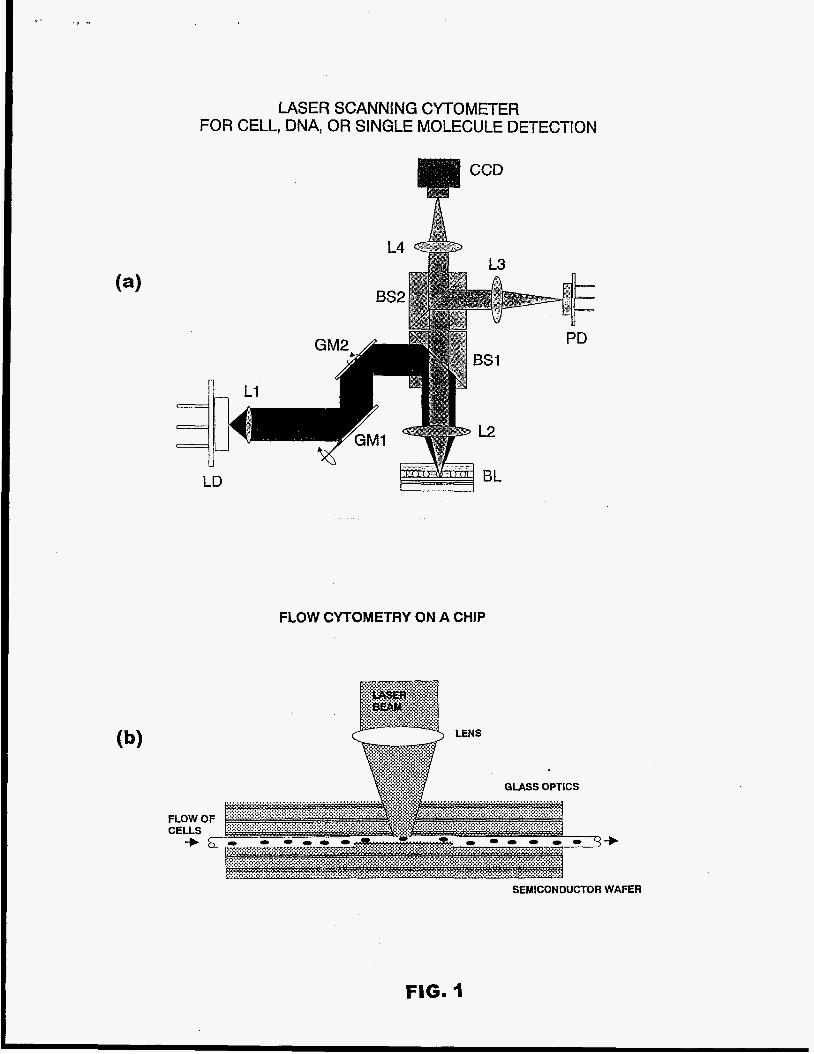
Two methods for implementing this laser device are illustrated in Fig. 1. Fig. l a shows a
scanning method for reading the light signals fiom a static fluid in the microcavity. The device
illustrated in Fig. l b shows a microfabricated flow structure formed between two surfaces, a
vertical cavity surface-emitting laser and a glass dielectric mirror. The resonance frequencies of
this Fabry-Perot microcavity are very sensitive to the dielectric properties of the fluids confined
inside the cavity. Further, the resonance linewidth or cavity Q is sensitive to the optical length of
the cavity, light absorption, and light scattering from the fluid and the surfaces forming the cavity.
If cells or particulates are present in the fluid, they confine light transverse to the cavity length and
develop additional sub-frequencies between the Fabry-Perot frequencies as shown in Fig. 2.
Thus, the spectrum of light emitted from or transmitted through the cavity comprises a wealth of
Sandia is a multiprogram taboratory operated by Sandia Corporation, a Lockheed Martin Company, for the United States Department of Energy Under contract DE-AC04-94AL85000,
infomation about the cavity contents.
CX’MS

DISCLAIMER
This report was prepared as an account of work sponsored by an agency of the United States Government, Neither the United States Government nor any agency thereof, nor any of their employees, make any warranty, express or implied, or itssumes any legal liabili- ty or rrsponn'bnity for the accuracy, completeness, or usefulness of any information, appa- ratus, product, or process disclosed, or represents that its use would not infringe privately owned rights. Reference herein to any specific comme& product, process, or service by trade name, trademark, manufacturer, or otherwise does not necessarily constitute or imply its endorsement, rec~mmetxlation, or favoring by the United States Government or any agency thereof. The views and opinions of authors expressed herein do not necesSar- ily state or reflect those of the United States Government or any agency thereof.

DISCLAIMER
Portions of this dowment may be illegible in electronic image products. Images are produced from the best available original dOCUmellt
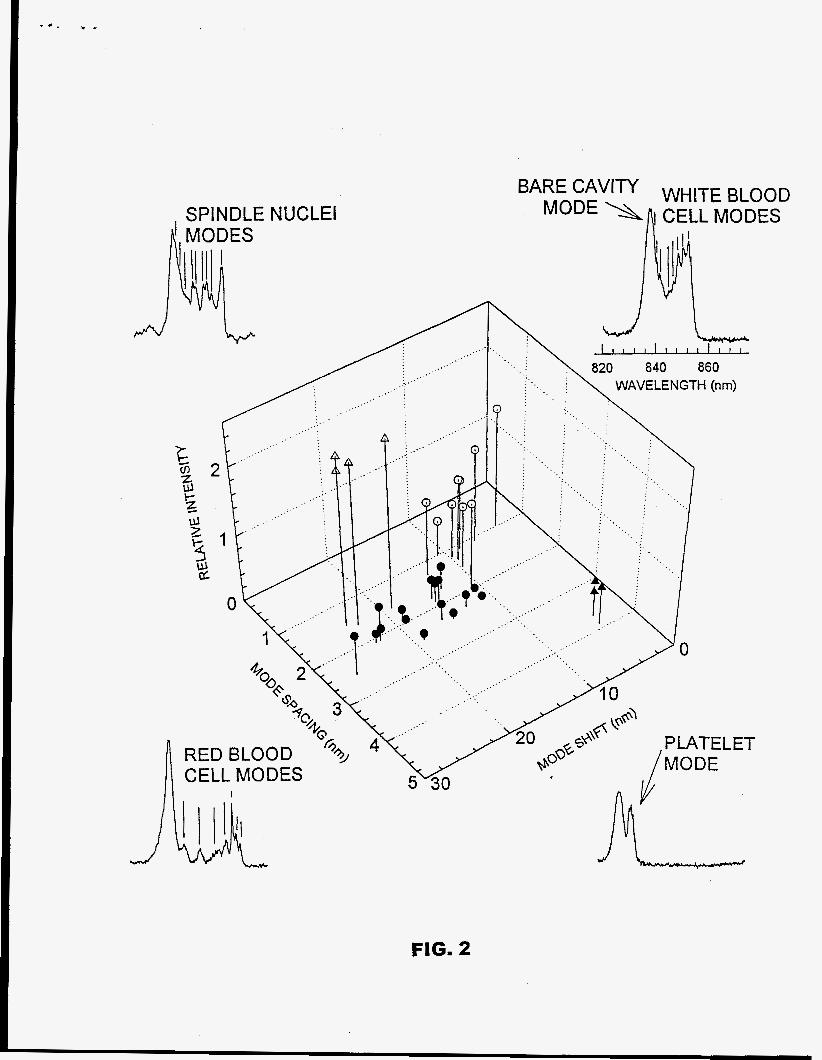
Gourley et al. SemiconductorMicrolasers withMicrofluidics 2 Fig. 2 shows spectra for 4 different types of cells, including red and white blood cells,
platelets, and placental tumor cells. The transverse modes are evident as the smaller peaks to the
right of the large peak (Fabry-Perot mode) in each spectrum. The mode spacing, mode shift, and
intensity relative to the longitudinal mode are plotted in the 3-dimensional cluster plot. This plot
shows that the cell types can be identified solely on the basis of the spectral emission from the
microcavity.
Fig. 3 shows how the transverse mode spacings can be used to caliper the cell dimensions.
The average mode spacings (open points) are plotted against cell diameter d for red and white
blood cells and yeast cells. These data are well described by a simple 2-dimensional mode theory
(solid line labeled B/d2 ) because the celIs lie flat in the cavity. On the other hand, polystyrene
sphere mode spacings (solid points) are better described by a three dimensional theory (solid line
labeled A/d ), because they are rigid spheres. Thus, the emission spectra can reveal reveal cell
size and 3-dimensional shape.
Finally, we will report current investigations of different methods for pumping fluids
through the microcavity space using mechanical or electromotive forces3 These forces can be
used to drive molecules, cells, or particulates through an analysis region in the cavity.
References
1, Conference on Microfabrication Technology for Biomedical Applications, San Jose, CA
October 24-25, 1996, Cambridge Healthtech Institute, Newton Upper Falls, MA (1996).
2. P. L. Gourley, NafztreMedicine 2, 942-944 (1996).
3. D. J. Harrison, K. Fluri, K. Seiler, Z. Fan, C. S. Effenhauser, A. Man, Science 261,895
(1 993).

. . v -
Gourley et al. SemiconductorMicrolasers WithMicrofluidics 3
Figure Captions
Fig. 1 a. Laser scanning method for detecting light signals from the microcavity laser (BL). GM-
galvo-mirrors, LD-laser diode, PD- photodiode, BS- beam splitter.
lb. Method for detecting flow of cells through a microcavity laser formed between a vertical
cavity surface-emitting laser wafer and a glass dielectric mirror.
Fig. 2. Cluster plot of normal blood cells (red, white, and platelets) and cancer cells (spindle cells
from a placental cancer) showing spectral method for differentiating cell types. Representative
spectra for each cell type are displayed in the comers,
Fig. 3. Average transverse mode spacings as a finction of cell measured cell diameter for cells
and polystyrene spheres. The lines labelled B/d2 and A/d are theoretical computations for 2- and
3-dimensional analyses, respectively.
LASER SCANNING CYTOMETER FOR CELL, DNA, OR SINGLE MOLECULE DETECTION
L4
U
LD
FLOW OF CELLS
+ K
FLOW CYTOMETRY ON A CHIP
PD
GLASS OPTICS
SEMICONDUCTOR WAFER
, SPINDLE NUCLEI BARE cAv'p/ WHITE BLOOD
CELL MODES
PLATELET
L FIG. 2

100
n
S E W
1 0
W n
1
I I I 1 I I I I I I I I I I l i I
1
spheres 0 red blood cells v white blood cells
yeast cells
I O
C E LL D IAM ETE R (micro meters)
FIG. 3
100