f human impact. copyright © 2008 pearson education, inc., publishing as pearson benjamin cummings...
TRANSCRIPT

Human Impact

Copyright © 2008 Pearson Education, Inc., publishing as Pearson Benjamin Cummings
Ch. 53.5 Population Change and Population Density
• In density-independent populations, birth rate and death rate do not change with population density
• In density-dependent populations, birth rates fall and death rates rise with population density

Copyright © 2008 Pearson Education, Inc., publishing as Pearson Benjamin Cummings
Density-Dependent Population Regulation
• Density-dependent birth and death rates are an example of negative feedback that regulates population growth
• They are affected by many factors, such as competition for resources, territoriality, disease, predation, toxic wastes, and intrinsic factors

Copyright © 2008 Pearson Education, Inc., publishing as Pearson Benjamin Cummings
Competition for Resources
• In crowded populations, increasing population density intensifies competition for resources and results in a lower birth rate

Copyright © 2008 Pearson Education, Inc., publishing as Pearson Benjamin Cummings
Fig. 53-22
8000B.C.E.
3000B.C.E.
1000B.C.E.
0 2000C.E.
0
1
2
3
4
5
6
The Plague
Hu
man
po
pu
lati
on
(b
illio
ns)
7
Concept 53.6: The human population is no longer growing exponentially but is still increasing rapidly
• No population can grow indefinitely, and humans are no exception
– The human population increased relatively slowly until about 1650 and then began to grow exponentially

Fig. 53-23
2005
Projecteddata
An
nu
al p
erc
ent
incr
ease
Year1950 1975 2000 2025 2050
2.2
2.0
1.8
1.6
1.4
1.2
1.0
0.8
0.6
0.4
0.2
0
Though the global population is still growing, the rate of growth began to slow during the 1960s

Copyright © 2008 Pearson Education, Inc., publishing as Pearson Benjamin Cummings
Regional Patterns of Population Change
• To maintain population stability, a regional human population can exist in one of two configurations:
– Zero population growth = High birth rate – High death rate
– Zero population growth =Low birth rate – Low death rate
• The demographic transition is the move from the first state toward the second state
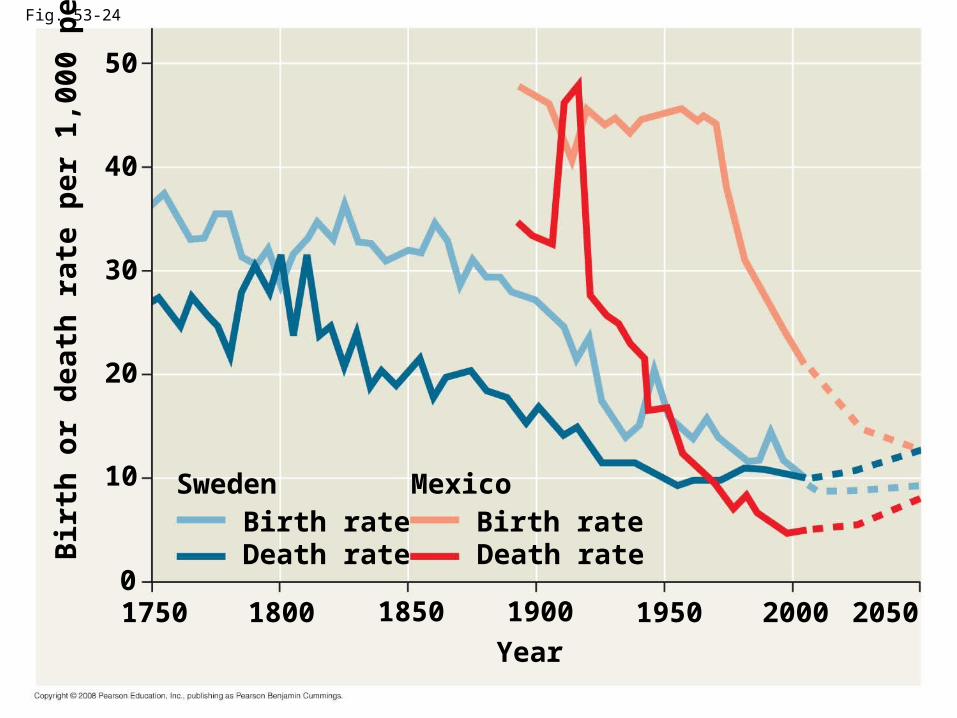
Fig. 53-24
1750 1800 1900 1950 2000 2050
Year
1850
Sweden MexicoBirth rate Birth rate
Death rateDeath rate0
10
20
30
40
50B
irth
or
dea
th r
ate
per
1,0
00 p
eop
le

Copyright © 2008 Pearson Education, Inc., publishing as Pearson Benjamin Cummings
• The demographic transition is associated with an increase in the quality of health care and improved access to education, especially for women
• Most of the current global population growth is concentrated in developing countries

Copyright © 2008 Pearson Education, Inc., publishing as Pearson Benjamin Cummings
Age Structure
• One important demographic factor in present and future growth trends is a country’s age structure
• Age structure is the relative number of individuals at each age

Fig. 53-25
Rapid growthAfghanistan
Male Female Age AgeMale Female
Slow growthUnited States
Male Female
No growthItaly
85+80–8475–7970–74
60–6465–69
55–5950–5445–4940–4435–3930–3425–2920–2415–19
0–45–9
10–14
85+80–8475–7970–74
60–6465–69
55–5950–5445–4940–4435–3930–3425–2920–2415–19
0–45–9
10–14
10 10 8 866 4 422 0Percent of population Percent of population Percent of population
66 4 422 08 8 66 4 422 08 8

Copyright © 2008 Pearson Education, Inc., publishing as Pearson Benjamin Cummings
• Age structure diagrams can predict a population’s growth trends
• They can illuminate social conditions and help us plan for the future

Copyright © 2008 Pearson Education, Inc., publishing as Pearson Benjamin Cummings
Global Carrying Capacity
• How many humans can the biosphere support?
– The carrying capacity of Earth for humans is uncertain
– The average estimate is 10–15 billion

Copyright © 2008 Pearson Education, Inc., publishing as Pearson Benjamin Cummings
Ch. 55.5: Human Impact on chemical cycles
• Humans release many toxic chemicals, including synthetics previously unknown to nature
• In some cases, harmful substances persist for long periods in an ecosystem
• One reason toxins are harmful is that they become more concentrated in successive trophic levels
• Biological magnification concentrates toxins at higher trophic levels, where biomass is lower
Copyright © 2008 Pearson Education, Inc., publishing as Pearson Benjamin Cummings
• Many pesticides such as DDT are subject to biological magnification in ecosystems
• In the 1960s Rachel Carson brought attention to the biomagnification of DDT in birds in her book Silent Spring

Copyright © 2008 Pearson Education, Inc., publishing as Pearson Benjamin Cummings
Fig. 55-20
Lake trout4.83 ppm
Con
cen
trat
ion
of
PC
Bs
Herringgull eggs124 ppm
Smelt1.04 ppm
Phytoplankton0.025 ppm
Zooplankton0.123 ppm

Copyright © 2008 Pearson Education, Inc., publishing as Pearson Benjamin Cummings
Greenhouse Gases and Global Warming
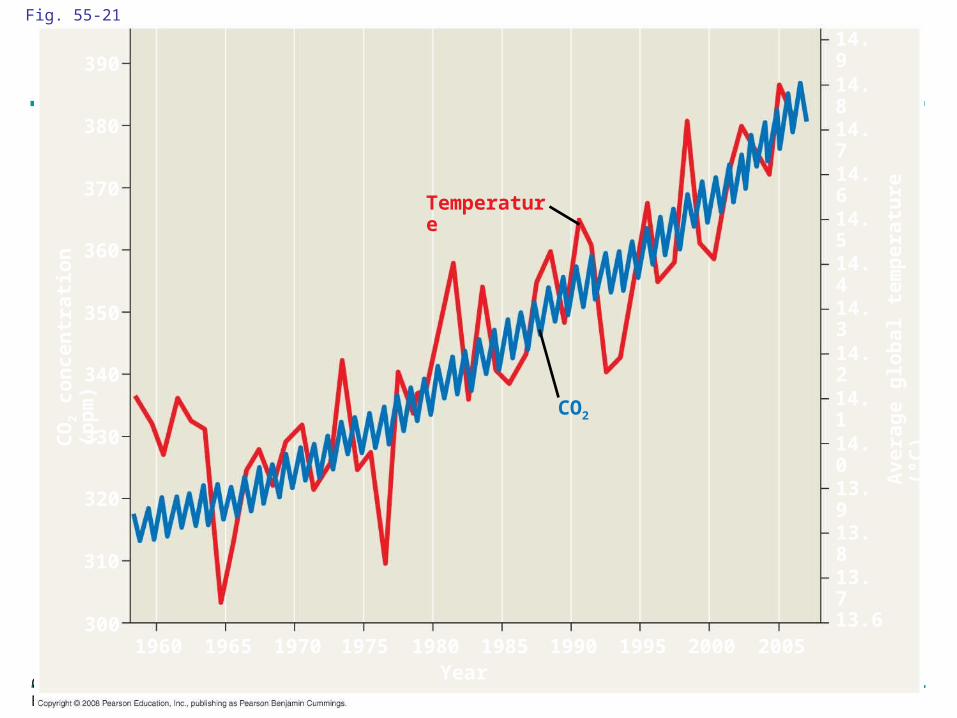
• One pressing problem caused by human activities is the rising level of atmospheric carbon dioxide
• Due to the burning of fossil fuels and other human activities, the concentration of atmospheric CO2 has been steadily increasing
Copyright © 2008 Pearson Education, Inc., publishing as Pearson Benjamin Cummings
Fig. 55-21
CO2
CO
2 con
cen
trat
ion
(p
pm
)
Temperature
1960300
Ave
rage
glo
bal
tem
per
atu
re (
ºC)
1965 1970 1975 1980Year
1985 1990 1995 2000 200513.6
13.7
13.8
13.9
14.0
14.1
14.2
14.3
14.4
14.5
14.6
14.7
14.8
14.9
310
320
330
340
350
360
370
380
390

Copyright © 2008 Pearson Education, Inc., publishing as Pearson Benjamin Cummings
The Greenhouse Effect and Climate
• CO2, water vapor, and other greenhouse gases reflect infrared radiation back toward Earth; this is the greenhouse effect
• This effect is important for keeping Earth’s surface at a habitable temperature
• Increased levels of atmospheric CO2 are magnifying the greenhouse effect, which could cause global warming and climatic change

Copyright © 2008 Pearson Education, Inc., publishing as Pearson Benjamin Cummings
• Increasing concentration of atmospheric CO2 is linked to increasing global temperature
• Northern coniferous forests and tundra show the strongest effects of global warming
• A warming trend would also affect the geographic distribution of precipitation

Copyright © 2008 Pearson Education, Inc., publishing as Pearson Benjamin Cummings
• Global warming can be slowed by reducing energy needs and converting to renewable sources of energy
• Stabilizing CO2 emissions will require an international effort
Copyright © 2008 Pearson Education, Inc., publishing as Pearson Benjamin Cummings
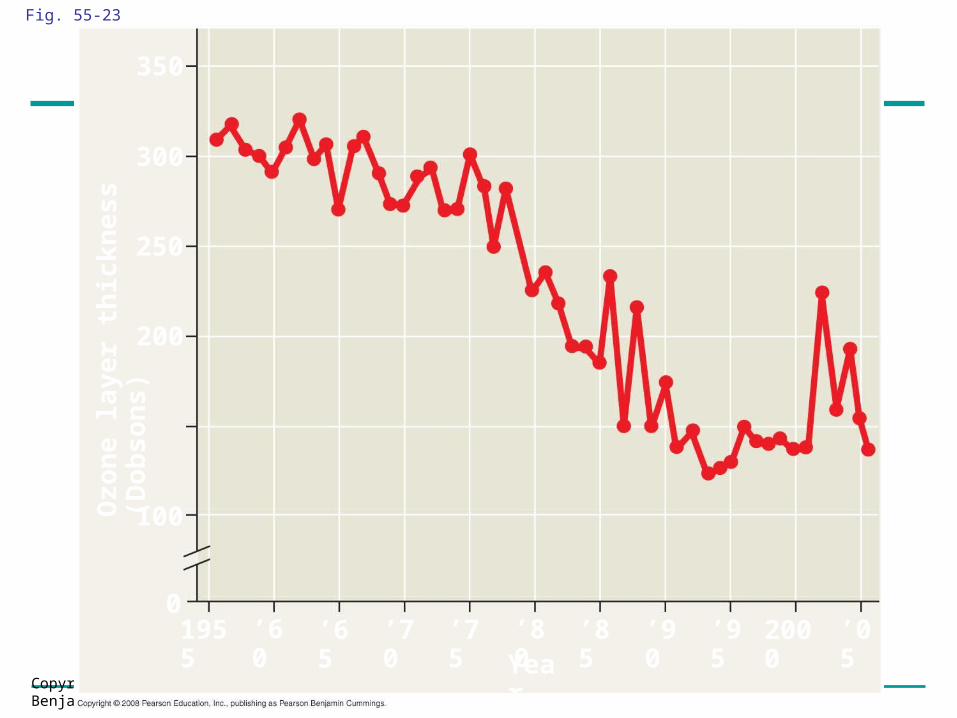
Depletion of Atmospheric Ozone
• Life on Earth is protected from damaging effects of UV radiation by a protective layer of ozone molecules in the atmosphere
• Satellite studies suggest that the ozone layer has been gradually thinning since 1975
Copyright © 2008 Pearson Education, Inc., publishing as Pearson Benjamin Cummings
Ozo
ne
laye
r th
ick
nes
s (D
obso
ns)
Fig. 55-23
Year’052000’95’90’85’80’75’70’65’601955
0
100
250
200
300
350

Copyright © 2008 Pearson Education, Inc., publishing as Pearson Benjamin Cummings
• Destruction of atmospheric ozone probably results from chlorine-releasing pollutants such as CFCs produced by human activity
Fig. 55-24
O2
Sunlight
Cl2O2
Chlorine
Chlorine atom
O3
O2
ClO
ClO

Copyright © 2008 Pearson Education, Inc., publishing as Pearson Benjamin Cummings
(a) September 1979 (b) September 2006
• Scientists first described an “ozone hole” over Antarctica in 1985; it has increased in size as ozone depletion has increased

Copyright © 2008 Pearson Education, Inc., publishing as Pearson Benjamin Cummings
• Ozone depletion causes DNA damage in plants and poorer phytoplankton growth
• An international agreement signed in 1987 has resulted in a decrease in ozone depletion

Ch. 56 Biodiversity crisis
Extinction ~ natural phenomenon, however, rate is of concern…..
50% loss of species when 90% of habitat is lost

Major Threats to Biodiversity Habitat destruction ~ single
greatest threat; species designation as extinct, endangered, vulnerable, rare; 93% of coral reefs
Competition by exotic (non-native) species ~ cause of species designation as extinct, endangered, vulnerable, rare; travel
Overexploitation ~ commercial harvest or sport fishing; illegal trade

Biodiversity: Human welfare
25% of all medical prescriptions
Genetic variability Aesthetic and ethical
reasons Species survival

Conservation biology focus Preservationism: setting
aside select areas as natural and underdeveloped
Evolutionary / ecological view: natural systems result from millions of years of evolution and ecosystem processes are necessary to maintain the biosphere

Geographic distribution of biodiversity
Energy availability ~ solar radiation
Habitat heterogeneity ~ environmental patchiness
Niche specialization ~ narrow resource range specialization
Population interactions ~ complex population interactions

Population & species level conservation
Biodiversity hot spot: small area with an exceptional concentration of species
Endemic species: species found nowhere else
Endangered species: organism “in danger of extinction”
Threatened species: likely to become endangered in the foreseeable future

Human Impact Biological magnification:
trophic process in which retained substances become more concentrated at higher levels
Ozone depletion: effect of chlorofluorocarbons (CFC’s) released into the atmosphere
Rainforest destruction Cause: Overpopulation?

Air Pollution Major contributions:
– CO2, CFCs, etc. Smog
– Thermal inversion traps pollution
Acid Rain Ozone Thinning
– CFCs convert O3 into O2 by reconfiguration of bonds
– Leads to increased incidence of ultraviolet radiation

Waste Management Density-
dependent factor that limits space available for other purposes
Green revolution- can we improve already existing agricultural lands rather than create more?

Deforestation Effects of
deforestation:– Reduced
productivity– Increased erosion
due to lessening of root structures
– Sediment build up
– Increase in CO2

Most water on earth is unusable (salt content)
Desalination- conversion of salt water into freshwater (energetically costly)
Agriculture accounts for massive water use worldwide
Water pollution Legislative measures may
influence water use
Water considerations

Sixty-six percent of a human being is water. Seventy-five percent of the human brain is water. Seventy-five percent of a living tree is water. You could survive about a month without food, but only 5 to 7 days
without water. On the average, each American uses about 160 gallons of water a day
at a cost of 27 cents. Bottled water may cost up to 1000 times more than municipal may not
be as safe. Two-thirds of the water used in an average home is used in the
bathroom. Typically 4 to 6 gallons of water are used for every toilet flush. On the average, a person uses 2 gallons of water to brush his or her
teeth each day. A 10-minute shower uses about 55 gallons of water. A leaking faucet can waste up to 100 gallons of water a day.
Water Facts
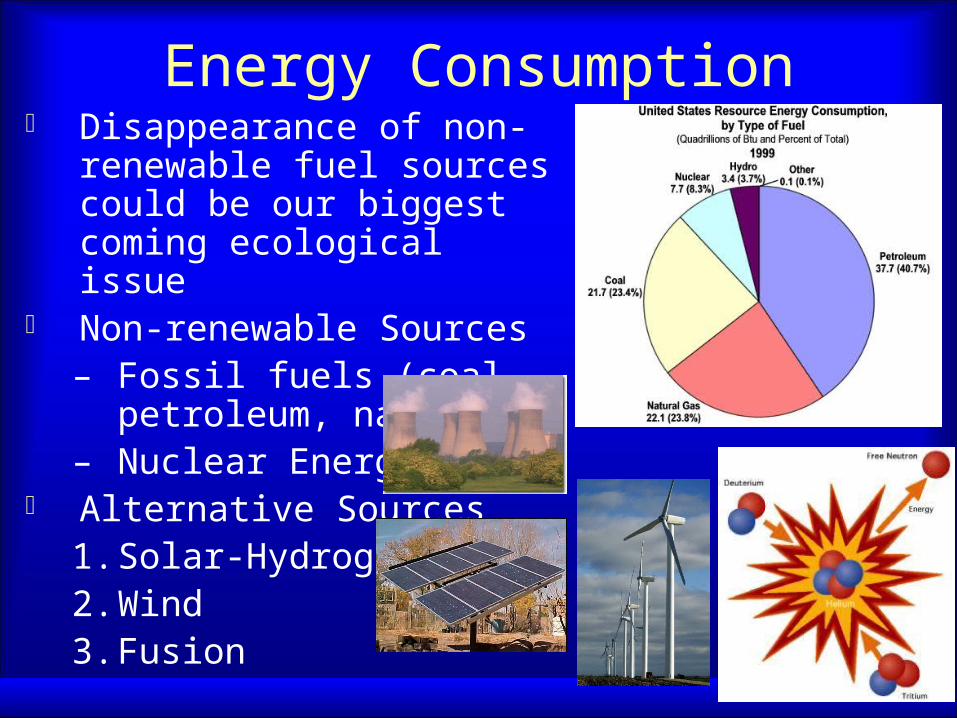
Energy Consumption Disappearance of non-
renewable fuel sources could be our biggest coming ecological issue
Non-renewable Sources– Fossil fuels (coal, petroleum,
nat. gas)– Nuclear Energy
Alternative Sources1. Solar-Hydrogen2. Wind3. Fusion