f. mazzonna, p. salari short term effects of public smoking bans on
TRANSCRIPT
IdEP Economic Papers
2014 / 09
F. Mazzonna, P. Salari
Short term effects of public smoking bans on health
Short term effects of public smoking bans on health∗
Fabrizio MazzonnaUniversita della Svizzera Italiana (USI) and MEA†
Paola SalariUniversita della Svizzera Italiana (USI)
September 15, 2014
Abstract
This paper evaluates the causal negative effect of environmental tobacco exposure on healthby exploiting the time and geographical variation in public-place smoking bans implemented inSwitzerland between 2007 and 2011. Using monthly data from the universe of Swiss hospitalsbetween 2004 and 2012, we show that the incidence of acute myocardial infarction hospital-izations decreases by about 10-12% immediately after the law implementation. We also findevidence of heterogeneity by age and sex and across income and education groups. In particu-lar, the policy affected mainly men aged 50+ and the regions characterized by a lower level ofincome and education.
Keywords: .
JEL codes: C23, H75, H77, I14, I18.
∗Corresponding author: Fabrizio Mazzonna, Universita della Svizzera Italiana, via G. Buffi 13, 6904 Lugano,Switzerland ([email protected]). We thank Giovanni Pedrazzini, Raphael Parchet, Patrick Gagliardini,Andrea Ichino, Osea Giuntella and seminar participants at Universita della Svizzera Italiana for useful comments.We are grateful to the Swiss Federal Office of Statistics (Health and Social Affairs Division) for providing us the data.†Munich Center for the Economics of Ageing at Max Planck Institute for Social law and Social Policy.

1 Introduction
The negative effects of smoking—both primary and second hand—are well known and subject of
many studies. In a recent review study, Cawley and Ruhm (2011) show that smoking is the most
important modifiable risk factor related to both mortality and disability and the most damaging
health behavior in high-income countries. A recent report by the American Hearth Association
(2014) estimates a total cost associated with smoking of $193 billion per year, 50% due to direct
medical costs and 50% due to productivity costs. Smoke also contributes to health inequality since
smoking prevalence and environmental tobacco smoke (ETS) exposure are higher among people
from low socio-economic status (SES) (e.g. Cutler and Lleras-Muney 2010). The public awareness
about the large negative effects of smoking induced several governments all over the world to enact
a series of measures to reduce tobacco consumption and ETS exposure. Among them, smoking
ban in public places is one of the most important public health intervention implemented in many
developed countries in the last decades. However, several concerns have been raised—in particular
among economists (e.g. Adda and Cornaglia 2010)—about the real health benefits deriving from
this public health intervention.
This paper investigates the short term effect of public smoking bans on the incidence of acute
myocardial infarction (AMI), which represents the main cause of death in almost all OECD countries
(OECD 2013). In particular, exploiting the time and geographical variation in the introduction
of smoking ban in public places in Switzerland, we show that the incidence of AMI decreases on
average by about 10-12% immediately after the law implementation with large heterogeneity across
population sub-groups. Moreover, using this quasi-natural experiment, we provide evidence of a
causal association between ETS and AMI.
Previous economic studies mainly analyze the effect of smoking ban on smoking behavior, while
they are limited in the ability of studying the effects of smoking bans on objective health outcomes.
This might be explained by the fact that the negative effects of smoking on most of the associated
diseases may generally require long times of observations.
For instance, the effect of smoking on lung cancer may be detected only in the long run. A
change in smoking behavior —such as the individual decision to quit smoking— is, by contrast,
easier to measure. Therefore, it represents an outcome to assess the effect of the anti-smoking
policy in the short run. However, the evidence from these studies is quite mixed. In the US, Evans
et al. (1999) show that smoking ban on workplaces reduced smoking prevalence by 5%. On the
other hand, Adda and Cornaglia (2010) report evidence of displacement of ETS from public (bars
and restaurants) to private places and no effect on smoking prevalence. In Canada, Carpenter et al.
1

(2011) find that these policies had no effect on smoking prevalence, but induced large reduction in
public-places ETS exposure without any private displacement. The introduction of smoking bans
in public places had limited or no effects on smoking prevalence also in Germany (Anger et al.
2011) and UK (Jones et al. 2013), while there is evidence of a reduction in smoking prevalence
and consumption in Italy (Buonanno and Ranzani 2013). Given the well-know negative association
between smoking and body weight (e.g. Cowley et al. 2004), some studies evaluate the effect of this
policy also on other health behaviors, showing some evidence of weight gains and increasing alcohol
consumption after the introduction of the smoking ban in Italy and in the US (Liu et al. 2009 and
Pieroni et al. 2013). All in all, the risk of negative spillovers on other behaviors, together with
the evidence of displacement from public to private places, might explain the previously mentioned
concerns about the health benefits of this policy.
We contribute to the literature by focusing on AMI hospitalizations, which allow us to objec-
tively measure the short-run effects of smoking bans on an objective metric of health. A wide strand
of the literature argues that smoking is the most important avoidable cause of coronary diseases
(Glantz et al. 1991). In particular, several studies show that it is associated with a greater risk of
AMI, especially among men (Teo et al. 2006). From a medical point of view, exposure to smoke is
associated with an endothelium-dependent dilatation, which may lead to an early arterial damage,
as well as with a tendency towards an acute enhanced platelet aggregation (Celermajer et al. 1996;
Sargent et al. 2004). Both factors occur within 30 minutes after exposure to smoke and are both
risk factors for AMI. A reduction in the number of AMIs is thus quantifiable immediately after the
introduction of the smoking ban, being it evident starting from the initial days after the reduction
of smoking exposure (Richiardi et al. 2009; Argacha et al., 2008). This means that we can evaluate
the short-term effect of this policy.
We are fully aware of the previous epidemiological literature investigating the effect of smoking
bans on cardiovascular diseases. For instance, in a meta-analysis of the existing literature, Mey-
ers et al. (2009) argue that after smoking ban’s implementation, AMI risk decreases by 17% overall,
with a bigger effect among younger individuals and non-smokers. However, there are fundamental
concerns regarding the identification assumptions behind the estimation strategies implemented
in these studies. Most of them are based on a simple pre and post comparison in a single city
or country (e.g. Di Valentino et al. 2011 on the Swiss canton Ticino) without accounting for all
potential confounders, such as preexisting trends or the effect of contemporaneous policies. To this
end, Shetty et al. (2011) find that the relationship between smoking bans and AMI in the US is
sensitive to the choice of the city and specification. For instance, using data about US-Medicare
enrollees aged 66+ for the years 1999–2008, Barr et al. (2012) show that the negative effect of
2
smoking bans on AMI hospital admissions disappears as they account for non-linear adjustment
for secular trend and random effects at the county level. Finally, some of these studies evaluate
the effect of smoking bans in very small cities and this may lead to problems of external validity of
their results (e.g. Sargent et al. 2004).
In our estimation strategy we address all these concerns. In particular, we exploit the Swiss
quasi–natural experiment to assess empirically whether there is a causal effect of the smoking ban
on AMIs. Switzerland is a perfect environment to study, since the 26 Swiss cantons implemented
the public smoking ban at different points in time, making it possible to exploit both time and
geographical variation. We use monthly data on the universe of Swiss hospitals admissions observed
from 2004 to 2012, broken down by age and sex. This allows us to evaluate the heterogeneity of
our results. In particular, the reduction in AMI hospitalization has been larger in absolute terms
for men aged 50–65 and 66+, while we find some effects only on women 66+, the only subgroup
among women at risk of AMI. It is worth noting that in relative terms (compared with the mean
incidence of the disease in the population) the larger effect is found among men under 66 (both
under 50 and 50–65). These subgroups should attend bars and restaurant more often than the
older subgroup (men 66+), and so they were more affected by the public smoking ban.
Moreover, exploiting the residential information on the hospitalized patients, we can conduct
our analysis both at cantonal and regional level. For the regional level we use of the so-called Spatial
Mobility regions, 106 smaller geographical units that allows us to evaluate the heterogeneity of our
results across areas with different level of income and education, holding constant the confounding
effect of different institutional settings at cantonal level. In particular, we find that the effect of the
policy on AMIs has been stronger in low income and low educated areas. This might be due to the
fact that in low SES areas there is a larger incidence of smokers who are affected by the smoking
restrictions in public places.
We evaluate the robustness of our results to alternative model specifications. In our estimation
strategy we account for many factors that might confound our results, such as area (canton or
region) and time fixed effects, as well as area specific time trends. We also control for local
unemployment rate to take into account the well-know pro-cyclical behavior of smoking and AMIs
(Rhum 2005 and 2007) and to take into account the effect of the last financial and economic crisis.
We indirectly test our main identification assumption by checking whether the policy also af-
fected the incidence of lung, prostate and breast cancer which are known not to have been affected
by the policy, at least in the short run. We also show that the reduction was larger during the
winter period, when people are more likely to seat inside public places. Moreover, we implement a
“placebo” test (by using one year lag and lead values for the treatment) to assess concerns about
3

the potential endogeneity of the policy (Carpenter et al. 2011) and to rule out the possibility of
other confounders or external shocks driving our results.
Our results are particularly relevant from a health policy perspective. First they shed a light on
the doubts raised by previous literature on the effectiveness of this policy. We report evidence of
large positive benefits on health already in the short-term, by showing a reduction in AMI incidence,
the most important cause of death related to ETS together with lung cancer. Second, our results
suggest potential benefits also on health inequality, since we show that the ban had stronger effects
in areas characterized by lower SES (low income and education).
The next section describes how and when the smoking bans were implemented in the Swiss
cantons. Section 3 presents the dataset and some descriptive evidence. Section 4 explains the
choice of the model and discusses some empirical issues. Section 5 shows and compares our main
results and introduces some robustness checks. Finally, section 6 concludes.
2 Swiss institutional setting
Smoking bans in Switzerland were implemented only after a long series of anti-smoking initiatives
undertaken some years before and mostly defined at federal level. In 2001 the Swiss Federal Council
adopted the National Tobacco Control Program, aimed at sensitizing people towards the bad effects
of smoke and at changing smoking behavior. The Program devoted economic resources for anti-
smoking campaigns and other measures and was meant to last until 2005, but it was extended
until 2008 and subsequently until 2016 (under the new name of National Tobacco Program). To
guarantee the necessary economic resources for anti-tobacco initiatives, in 2004 the Federation set
up also the Tobacco Control Fund, financing it through a tax of 2.6 centimes on each cigarette
packet sold. It supported measures aimed to assist people who wanted to give up smoking and to
protect non-smokers against second-hand smoke. It was in this setting that in April 2007 canton
Ticino decided to implement a smoking ban in all public places (i.e. bars, restaurants and clubs),
with the aim of contrasting smoke and protecting the population against second-hand smoke. Ticino
was the first canton opting for such a policy. Canton Grisons followed Ticino one year later.
In May 2010 a federal law regarding the implementation of the smoking ban came into force
(it was enacted already in October 2008): smoking in bars and restaurants was prohibited in each
canton. The federal law was less restrictive than the one approved in canton Ticino. It allowed
restaurants to have some rooms for smokers, and even the service may be guaranteed in some
cases. However, cantons were free to set the federal law only as a lower bound and to choose more
restrictive regulations. Anticipating the implementation of the federal law, all the other cantons
adapted and introduced the public smoking ban during 2009 and 2010. The last canton to introduce
4

the ban was Appenzell O.Rh. at the beginning of 2011.
Table 1 shows for each canton (first column) when the smoking ban in public places started to be
in force (second column) and the strictness of the law that they chose to adopt (third column). The
majority of cantons decided for a more severe regulation, meaning that they chose not to dedicate
special rooms for smokers. It is worth remarking that there seems to be a sort of “linguistic”
trend in the timing of smoking bans implementation: the Italian speaking cantons were the first
cantons to implement this policy, followed by most of the French speaking cantons and lately, by
the German speaking cantons. It is likely that the choice of a canton whether to implement the
smoking ban was also affected by the choice of neighbor territories, both Swiss and non-Swiss.
3 Data
We use data from the “Swiss Hospital Statistics” (HOST), provided by the Swiss Federal Statistical
Office. It is a wide dataset collecting information on each patient for the universe of the Swiss
hospitals from 1999 to 2013; after 1998, it became compulsory for each hospital to participate
at this statistics. HOST includes basic demographic information (age, sex and residence) for each
patient, and information on the main diagnosis, as well as secondary diagnoses. For our analysis we
use data from 2004 to 2012, due to the lack of some hospitals data for the years before 2004. Since
the dataset is based on individual data, we are able to explore the heterogeneity across different
classes of population by carrying out separated estimates for different groups of patients (according
to age and sex). Concerning patients geographical residence, Switzerland was split in more than
700 geographical regions called “Medstat regions”: each of them counting from 3.500 to 10.000
inhabitants and including territories similar from a socio-economic and geographical point of view.
In 2008 the Swiss Federal Statistical Office implemented a major redefinition of the Medstat regions,
changing substantially the agglomeration of municipalities that form each region. The rationale
behind this redefinition was to have more homogeneous and comparable areas across the country.
Unfortunately, for the aim of our research, this change does not allow us to analyze the impact
of the smoking ban policy at this geographical level because the same areas are not comparable
before and after the redefinition. For this reason, we consider two other geographical levels for our
analysis: the 26 cantons and the so-called Spatial Mobility (SM) regions, 106 geographical units
that are smaller than cantons but larger than the Medstat regions.1
1Knowing the zip codes grouped in each Medstat and in each SM region, we are able to group the Medstat regionsinto the larger SM regions. Nevertheless, in some cases the Medstat regions cannot be uniquely assigned to one SMregion. In these cases we split the number of AMIs of the Medstat region and we assign it to the SM regions to whichthe Medstat region belongs. We use as a weight the number of zip codes of the Medstat that belong also to the SMregion divided by the total number of zip codes that compose that Medstat.
5

Carrying out the analysis at cantonal level is an advantage because cantons coincide with the
political area of the introduction of the smoking bans. On the other hand, focusing on the SM
regions (hereafter regions) allows us to exploit the heterogeneity of the effect across income and
education levels (see also Section 4). To be able to exploit these potential sources of heterogeneity,
we added to our dataset some socio-demographic information: population, income, education and
unemployment rate. Data on population for cantons and municipalities is provided by the Swiss
Federal Statistical Office. We aggregate data of municipalities to obtain data at regional level.
However, the population breakdown by sex and age is available only for cantons, while for munic-
ipalities this information is provided only in the 2000 census. To obtain a proxy of the regional
population by age and sex for the years 2004–2012, we multiply the value of the regional population
of the year 2000 (from the municipal census) for the rate of variation of the population of the canton
to which the region belongs. We do this for each age and sex category.
Monthly data is available only for unemployment rates, while for income and education we have
data only for few years. We extract data on unemployed from the website of the State Secretariat
for Economic Affairs (sector of job market statistics) for the years 2004–2012. Data is taken from
the official registers of unemployed. It is monthly updated and available both at cantonal and
regional level.
Data on education is available in the Statistical Atlas of Switzerland for the year 2000. For
each region we compute the share of people with only compulsory primary education, the share of
people with a degree of second level (high school) and the share of people with a degree of third
level (college). Finally, we use data on income from the Swiss Federal Tax Administration website
for the year 2000–2010.2
3.1 Descriptive statistics and graphical evidence
Table 2 shows in the first two columns the monthly average and standard deviation of AMI hospital
admissions for the whole population by area and and by sex in the years 2004–2012. In the third
column we report the corresponding incidence per 100’000 inhabitants by dividing the number of
AMI cases in each canton for the corresponding population. Similarly, the last column reports
the incidence based on regions. Consistent with the medical literature, two thirds of the AMI
hospital admissions are among men, in particular among those in the age class 50–65 and 66+,
while for women the incidence of AMIs is almost only among women aged 66+. There is evidence
of substantial variability in the number of AMI hospital admissions not only across cantons but
2We cannot insert the income in our estimation as a time varying variable because up to now the last availableyear is 2010. For this reason we use a mean of the median income in each region in the period 2004–2010.
6

also over time. We observe an increasing trend in AMI hospital admissions over the years under
investigation: this may depend on better measures of prevention, on better access to health care and
on changes in the definition of the diagnosis, especially after a recent reclassification of some angina
patients into AMI cases (Insam et al., 2013). We crosschecked our dataset with data from the AMIs
Plus – the National Registry of AMI in Switzerland – and we confirmed the consistency of HOST
data and the presence of the increasing trend. There is also evidence of seasonality with a larger
incidence of AMI during the holiday season. This descriptive inspection suggests that taking such
spatial and time heterogeneity into account in our estimation strategy is crucial. HOST collects
about 90% of the total estimated number of AMI cases: the remaining 10% are people who die
from AMI before arriving to the hospital (Meyer et al., 2007 perform this estimation for the year
2004). This small percentage is expected to further decrease over time, due to the easier access
to hospitals in many areas. Cantonal and regional values present some small differences, due to
the statistical approximation of our computations. Cantonal values tend to underestimate the big
areas. Notice that the mean incidence of AMI hospitalizations is slightly larger at regional level
than at cantonal level. This difference arises because the cantonal mean gives the same value to
all cantons, regardless of the population’s size. By contrast, the mean incidence at regional level is
closer to the true national value.
In Figures 1 and 2, we show first evidence of a discontinuity in the number of AMI hospital
admissions at national level in correspondence of the smoking ban implementation for men but not
for women. Since each canton implemented the policy at different points in time, we aggregate AMI
cases across different cantons based on the distance in months from the policy implementation, as
in a sort of Regression Discontinuity Design (RDD). More specifically, in Figure 1 we show the raw
data, while in Figure 2 we report the aggregate residuals from a regression in which we control
for year and canton fixed effects. This second figure is meant to take into account the time and
geographical heterogeneity described before. The vertical line represents the “month zero, namely
the month during which each canton introduced the ban. Purely for descriptive purposes, the fitted
lines are based on a quadratic fit on the two years before and after the implementation of the policy,
while the shaded areas correspond to the 95% confidence interval.
For men, Figure 1 already shows evidence of a discontinuity in AMI cases after the introduction
of the smoking ban, although we are not controlling for temporal trends and cantonal differences.
This discontinuity is confirmed in Figure 2, where we take into account these potential confounding
factors. In particular, the residuals are slightly above zero in the two years before the disconti-
nuity, while they rapidly decrease towards –40 in the months immediately after the smoking ban
implementation. For women, instead, we do not have evidence of any discontinuity at the cut-off
7
date.
Unfortunately, we are not able to show similar evidence for cantons since the number of AMI
cases each month is too small to show graphical evidence of a significant discontinuity. In the
next section, we investigate the effect of smoking bans on AMI hospitalizations trying to take into
account all the potential factors that might confound the effect of the policy. It is worth reminding
that, since Figure 2 nets out canton and time fixed effects, we are already controlling for the most
important confounding factors in the relationship under investigation.
4 Empirical strategy
The empirical strategy exploits the geographical and time variation in the implementation of the
smoking ban. In the analysis that follows, the outcome of interest is represented by the AMI
incidence rate, AMIkt (as reported in column 3 of Table 2), that is obtained dividing the absolute
number of patients hospitalized for AMI in area k (it can be either canton or region) and at time
t by the corresponding population of the area k at time t. We prefer this variable to the absolute
number of AMI cases because it allows us to control for the different dimension (and population
structure) of our Swiss regions. Moreover, it nets outs the effect of differential population trends
across regions.3 More specifically, we estimate the following equation:
AMIkt = β0k + β1SBkt + β2Xkt + δt + f(k, t) + εkt (1)
where SBkt is a dummy equal to one if the smoking ban was enacted in area k at time t; the
coefficient β1 measures the effect of the policy. Our specification also includes area, β0k, and
time, δt, fixed effects and, as additional robustness check, area specific time trends, f(k, t). More
specifically, we model the function f(k, t) as a linear function (i.e. multiplying the geographical
dummies for a linear time trend). Finally, Xkt includes monthly data on unemployment rate. Ruhm
(2005 and 2007) show that both smoking and AMI discharges are pro-cyclical, so we might expect
a negative correlation between unemployment and AMIs.
Time is measured in months (108 months starting from January 2004 to December 2012). As
already mentioned in Section 3, the geographical unit under investigation, the area k, can be either
the canton or the region. Since the policy is implemented at cantonal level it is natural to consider
the canton as the reference geographical unit. However, we believe that it is still worth to focus
the analysis on a smaller geographical area for two main reasons. First, it allows to analyze the
heterogeneity in the effect of interest across educational and income levels, holding constant the
3The other advantage of using the incidence rate is that we can rely on linear regression models and avoid theissue of estimating count data models.
8

confounding effect of institutional differences at cantonal level. In other words, the analysis at
the level of regions exploits the geographical variation within cantons in the level of education
and income. Second, the increase in the number of observations allows us to increase the power
of our estimation strategy and to reduce the relative weight of smaller cantons. As discussed in
Section 3.1, the analysis at cantonal level put the same weights to cantons of different dimensions.4
Given the panel nature of the dataset, the baseline estimation method for this model is the
within estimator (fixed effects), which allows to remove all time-invariant confounders at area level.
Our estimates are separated by sex and age group (below age 50, age 50–65 and age 66+) to take
into account the large differences in the incidence of AMIs across these population subgroups. We
also implement separated estimates according to the severity of the policy implemented by the
different cantons (severe vs. mild policy, see Section 2 for further details).
4.1 Identification issues
As discussed throughout the paper, the identification of the effect of the smoking ban on AMIs
comes from the time and geographical variation in the implementation of the policy across cantons.
Notice that different from a standard “diff-in-diff” strategy, we do not need the classic common trend
assumption, since the policy has been implemented in all cantons but at different points in time.
Therefore, it becomes crucial that there are no other policy changes or cantonal shocks coinciding
with the introduction of the smoking ban and affecting the number of AMIs. The specification
proposed in equation (1) should be sufficiently flexible to account for the potential confounding
factors at geographical level since it also includes area specific time trends. Our specification
also includes local unemployment rates to address the concern that the policy implementation is
somewhat contemporaneous with the last financial and economic crisis. However, this is unlikely
since the policy implementation has a very large temporal variation that does not coincide with
the timing of the crisis (2008–2009).
More generally, we believe that it is very unlikely to have any confounding factors correlated
with the policy implementation in each canton and able to affect the number of AMIs at the same
time. Unfortunately, we cannot test it directly, but we implement a battery of robustness checks
that supports our identification assumption. First, we implement a sort of “unconfoundedness
test” in which we test whether the policy has an effect also on the incidence of lung, prostate
and breast cancer, that should not be affected by the policy, at least in the short run. Second,
as in Carpenter et al. (2011), we implement a placebo test in which we assess concerns about
4As robustness check we implemented our estimates using weights based on population size. The results we foundare slightly larger than those reported in the main text and so very close to the effect estimated using the regions.
9

the potential endogeneity of the policy by controlling for one year–lead of the smoking ban. Such
a test is implemented to verify whether we are confounding the effect of the smoking ban law
with other unobservable trends that vary across cantons and in particular whether “large shocks
to outcomes systematically precede rather than follow” smoking ban laws.5 More generally, we test
for the presence of jumps in the AMI hospitalizations distribution one year lag and lead the real
implementation of the policy in each canton. Another robustness check we implement is to check
whether the effect of public smoking ban is larger during the winter season. The intuition is that
during these months people that go to pubs and restaurants are more often inside public places
because of the adverse weather conditions, while during the other seasons people should stay more
often outside drinking and eating. So if we are not confounding the effect of the ban with that of
other confounding factors we should observe a larger reduction in AMIs during the winter season.
Even tough all these tests support our identification strategy, some concerns may still arise
regarding the estimation of the standard errors, since in panel data errors are often correlated both
across time and regions. In this case it might not be sufficient to cluster standard errors only at
the statistical area level (as suggested by Bertrand et al. 2004). It is indeed very likely that the
number of AMI cases is correlated also spatially across cantons. The decision of one canton to
introduce a smoking ban may have an influence also on the choice of a neighbor canton. In our
case, it is quite evident that the timing in the implementation of the policy is somewhat affected
by some geo-cultural factors. In particular, Ticino was the first canton to implement the policy in
2007 (probably affected by the Italian smoking ban implemented since 2003), followed by Grisons
(always at the border with Italy and with a quite large Italian community). Then, the policy has
been implemented since mid 2009 in most of the French cantons, while most of the German cantons
implemented the policy only starting from late 2010. This geo-cultural factor in the timing of the
policy implementation should not affect the estimated effect of the smoking bans since we control
for both canton fixed and canton specific trends. However, such spatial correlation might affect the
standard errors of our estimates. To account for this second potential source of correlation we use
a two-way clustering strategy implemented by Cameron et al. (2011). As robustness check, we also
use the OLS fixed effects estimator with panel-corrected standard errors (PCSE) based on the work
of Beck and Katz (1995). It estimates the parameters by OLS and estimates the standard errors
and the variance-covariance matrix assuming that the disturbances are by default heteroskedastic
and contemporaneously correlated across panels. We also assumed that errors are first-order auto
correlated and that the coefficient of the AR(1) process is specific to each panel.
5Carpenter et al. (2011) page 49.
10
5 Results
In this section we report the results from our estimation of the effect of the smoking ban on the
incidence of AMI hospitalizations using the identification strategy presented in Section 4. More-
over, in Section 5.1 we present the results of a number of robustness checks already discussed in
Section 4.1.
We start showing in Table 3 the estimates of the effect of the public smoking ban on the
incidence of AMI hospitalizations on total population and by sex. Each column represents a different
specification. Specifically, Model A includes area and time fixed effects; Model B adds monthly data
on area specific unemployment rates; as a further robustness check, Model C includes area specific
linear time trends. Estimates are implemented at cantonal (first set of rows) and regional level
(second set of rows). Consistent with the graphical evidence in Figures 1 and 2 (that aggregate
data at national level), the table shows robust evidence of a reduction in the incidence of AMI
mainly for men. For women, instead, we have evidence of a small and slightly significant effect only
in the regional estimates. This result should not be surprising given the very low incidence of AMI
among the total women population (see Table 2).
The estimated reduction in the incidence of AMI is robust across all specifications. The esti-
mated effect only slightly decreases in size (but not significantly) when we include area specific time
trends. This reduction should be due to the effect of imposing the same linear trend before and
after the reform in each area (for this reason from now on we will use Model B as reference). Most
importantly, estimates are larger in size—although not significantly— at the regional level. In the
total population, it corresponds to a monthly reduction of roughly one AMI case every 100’000
inhabitants (so a reduction of about 1’000 cases per year in Switzerland). Looking at the mean
incidence reported in Table 2, the estimated coefficients correspond to roughly 8–9% reduction in
the incidence of AMI according to the cantonal estimates and 10–12% reduction for the regions.
This difference is not surprising since, as aforementioned, cantonal and regional estimates weight
the cantons differently. In particular, the cantonal estimates give the same weight to small and
big cantons, while in the regional estimates bigger cantons get more weight since they are split in
more regions. If the effect is homogeneous across the population the two estimates should converge.
However, since most of the smaller regions implemented only a mild regulation against smoking in
public places (see Table 1), we might expect a smaller effect on these cantons. This is confirmed
by the results provided in Table 6, where we show larger effects in cantons that implemented the
more severe regulation, and by a further robustness check in which we use population weights for
11

the canton estimates.6 For this reason, in the analysis that follows we only show results for the
regions (estimates at cantonal level are always very similar).
Having assessed the impact of the public smoking ban on the total population, we investigate
the heterogeneity of our results across age (Table 4), income and education (Table 5) subgroups.
Table 4 shows the results for three different age groups, under 50, 50–65 and 66+. In absolute
terms, larger effects are estimated in population subgroups more at risk of AMI, namely men in
the age group 50–65 and both man and women 66+. More specifically, for men aged 50–65 and
66+ we observe a reduction in the incidence of about 5 cases every 100’000 inhabitants per month.
Notice that for women, the effect in the age group more at risk of AMI—women aged 66+—is now
large and significant.
In relative terms, the story is quite different since for men the effect is larger for the subgroup
under 50 (20% reduction with respect to the mean incidence) and 50–65 (17%) . The difference
between absolute and relative terms is due to the difference in the risk of AMI across subgroups
but also to the different likelihood of each subgroup to attend bars and restaurants. We argue that
younger people (under 66) are more likely to go to bars and restaurants and so more exposed to
ETS before of the policy implementation.
The next step is to investigate whether the public smoking ban had an heterogeneous effect
across income and education groups. We argue that this analysis is particularly relevant from a
policy perspective since it concerns the potential impact of the policy on health inequality. Indeed, a
differential impact of the policy across socio-economic group would exacerbate (in the case of a larger
reduction among richer and high educated) or reduce the level of health inequality in the incidence
of AMI. Ideally, one should use individual data for this kind of analysis, but the hospital register
provides us only geographical information on patients’ residence. For this reason, we implement
the analysis at the smallest possible level of aggregation, the region. As explained in Section 4,
this level of aggregation allows us to exploit the within canton variation in the level of income and
education, and then control for institutional confounders at cantonal level. In particular, using
data on the average median income between 2004 and 2010, we split the regions in two groups high
vs. low income. We do the same for education using 2000 census data on education attainment.
Table 5 clearly shows evidence of heterogeneity across both dimensions, but in particular across
income groups. It indicates that the effect of the ban affected mainly low income and low education
regions. In these regions, the estimated reduction in AMI incidence is almost twice the average
effect estimated in Table 3, while the reduction in the richest and more educated regions is in most
6The results, available upon request, are larger than those reported in Table 3, and very close to the regionalestimates.
12

cases small and not statistically significant.
Finally, we test whether the effect of the public smoking ban has been larger in cantons that
implemented the more severe regulation, as described in Section 2. We test this by including in the
regression two dummies that capture the effect of the two different regulations, mild and severe.
Table 6 shows the results by age. The table clearly indicates that the public smoking ban had
a significant impact on AMI only in regions where a more severe regulation was implemented.
As previously discussed, mild regulation has been implemented mainly in smaller cantons, also
charachterized by the absence of metropolitan areas. On the other hand, we might also expect that
the public smoking ban had larger effects in metropolitan areas charachterized by a large number
of bars and restaurants. Therefore, we avoid speculating on the results reported in Table 6, saying
that mild regulation are not effective in reducing the incidence of AMI hospitalizations.
5.1 Robustness checks
In this section we implement a set of robustness checks as described in Section 4.1. The first set of
robustness checks are aimed to test the identification strategy of this paper. First we implement
what we call an “unconfoundedness test”, in which we test whether the policy affected a set of health
outcomes, namely the incidence of lung, prostate and breast cancer, that should not be affected by
the policy at least in the short run. The lung cancer affects both men and women, while the other
prostate and breast cancer are sex specific. Even though the lung cancer is affected by ETS, we
should not be able to observe effects in the short term. This test is meant to verify whether we
are confounding the effect of the policy with some other unobservable trend or confounder factor.
The test reported in Table 7 shows no effect of the public smoking ban on the incidence of all these
health outcomes.
Second, we implement a sort of placebo tests to verify that there are no other jumps in the
AMI distribution before or after the real implementation of the policy. As argued by Carpenter et
al. (2011) this test is particularly suitable to test the endogeneity of the public policy because it
allows to control for one–year lead of the smoking ban. Table 8 shows the results of this test. The
table clearly shows that there is no evidence of any significant discontinuity in the distribution of
the AMI hospitalizations before or after the real implementation.
Another robustness check that indirectly tests our identification strategy is to verify weather
the reduction in AMI hospitalizations is larger during the winter season, when people stay more
often inside the public place because of the adverse weather conditions. We show the results in
Table A.1, where we report the average effect at the baseline (from April to October), and the
interaction with the winter season (from November to March). As expected, the reduction in
13

AMIs during the winter period is almost twice the reduction we observe during the rest of the year
(compare the size of the two coefficients). Again, the results support our identification strategy.
The last robustness check concerns the estimations of the standard errors. As already discussed,
to take into account the two potential sources of correlation, within (over time) and between
regions, we use a two-way clustering strategy. As robustness check we use an OLS fixed effects
estimator with panel–corrected standard errors (PCSE). It estimates the variance-covariance matrix
assuming that the disturbances are by default heteroskedastic and contemporaneously correlated
across panels, and it allows errors to be autocorrelated (first order auto-correlation specific to each
panel). Since this model estimates the full variance-covariance matrix and so a very large number
of time parameters (107), we avoid to include a full set of time fixed effects. We substitute them
with year and month fixed effects (18 parameters).
Table A.2 shows that results from PCSE are very similar to those reported in the main text.
6 Conclusion
In this paper we assess the causal effect of the introduction of public smoking bans in Switzerland
on AMI hospitalizations. We show that this anti-smoking policy implemented in Switzerland were
effective in reducing the cases of AMI. Our results are robust to different model specifications and
the large battery of tests implemented in this paper never casts doubt on our identification strategy.
On average, the introduction of public smoking bans leads to a reduction of about 10-12% of
AMI hospitalization. However, we found large heterogeneity in the effect of interest across sex
and age groups. In absolute terms, we found evidence of larger reductions in AMI hospitalizations
among men 50+, the subgroup of the population with the largest incidence of AMI. Among women,
we found evidence of a significant reduction in AMI hospitalizations only in the age group 66+,
being them the only women subgroup really at risk of AMI. In relative terms, the largest reduction
(roughly –20%) was observed among men under 66, the subgroup of the population—among those
at risk of AMI—that more often should go to bars and restaurant.
We also exploit the spatial heterogeneity in the effect of public smoking bans by focusing our
analysis on very small regions (spatial mobility regions), which allows us to hold constant the
confounding effect of institutional factors at cantonal level. Such analysis shows that the policy
was more effective in poorer and less educated regions and in regions that implement a more severe
regulation.
Our analysis is of particular relevance from a policy perspective for at least two important
reasons. First, from a public health perspective, our paper shows that improving the quality of air
in public places through smoking bans has a positive impact on population health. Additionally,
14

our results demonstrate that the impact of the public smoking ban is even more effective in the
areas with low income and low education. In these areas the AMIs’ reduction is almost twice as
large as the average effect. Assuming a positive correlation between health, income and education,
the health improvement should be larger in areas with a poorer level of health. This suggests that
such a public health intervention might be also able to reduce inequalities in health.
Secondly, this policy leads to a significant reduction of health related costs. In the USA, the
American Hearth Association (2014) estimates for 2010 a total cost of 204.4 billions dollars due
to hearth diseases. Even in Switzerland, the second country in the world for life expectancy at
birth (OECD 2013), AMI is the leading cause of death and it represents a huge economic burden.
For instance, Wieser et al. (2012) estimate that in 2008 the total direct costs of acute coronary
syndrome (of which AMIs represent more than 80% of the costs) were more than 1 billion Swiss
Francs. To this large cost we should add 500 millions of indirect costs due to production losses.
Therefore a reduction of 10–12% of AMI hospitalizations means saving at least 150 millions per
year.
Finally, we address one final consideration. Even though we are able to evaluate the reduction
in AMI hospitalizations due to this important public policy, we are not able to assess to what extent
this reduction was due to a reduction of ETS exposure among smokers and non-smokers (through
a reduction in second hand smoke exposure). Considering the previously cited studies on the effect
of public smoking bans on smoking behavior, it is reasonably to believe that this reduction mainly
comes from reduction in ETS exposure among non smokers. We will carry out further research to
disentangle between these two effects by using individual survey data and administrative data on
cigarette consumption.
15

References
Adda, J. and Cornaglia, F. (2010) “The effect of bans and taxes on passive smoking”, American EconomicJournal: Applied Economics, 2: 1–32.
American Heart Association (2014) “Heart Disease and Stroke Statistics—2014 Update”. Circulation, 129:28–292.
Anger, S., Kvasnicka, M. and Siedler, T. (2011) “One last puff? Public smoking bans and smoking behav-ior”, Journal of health economics, 30: 591–601.
Argacha, J. F., Adamopoulos, D., Gujic, M., Fontaine, D., Amyai, N., Berkenboom, G. and van de Borne, P.(2008) “Acute effects of passive smoking on peripheral vascular function”, Hypertension, 51: 1506–11.
Barr, C. D., Diez, D. M., Wang, Y., Dominici, F. and Samet, J. M. (2012) “Comprehensive smoking bansand acute myocardial infarction among Medicare enrollees in 387 US counties: 1999–2008”, AmericanJournal of Epidemiology, 176: 642–8.
Beck, N. and Katz, J. N. (1995) “What to do (and not to do) with Time-Series Cross-Section Data”, TheAmerican Political Science Review, 89: 634–47.
Bertrand, M., Duflo, E. and Mullainathan, S. (2004) “How Much Should We Trust Differences-in-DifferencesEstimates?”, The Quarterly Journal of Economics, 119: 249–75.
Buonanno, P. and Ranzani, M. (2013) “Thank you for not smoking: Evidence from the Italian smokingban”, Health Policy, 109: 192–9.
Cameron C., Gelbach J., Miller D. (2011) “Robust Inference with Multi-way Clustering”. Journal ofBusiness and Economic Statistics, 29(2): 238–249.
Carpenter, C., Postolek, S. and Warman, C. (2011) “Public-Place Smoking Laws and Exposure to Envi-ronmental Tobacco Smoke (ETS)”, American Economic Journal: Economic Policy, 3: 35–61.
Cawley, J., Markowitz, S. and Tauras, J. (2004) “Lighting up and slimming down: the effects of body weightand cigarette prices on adolescent smoking initiation”, Journal of health economics, 23: 293–311.
Cowley J. and Ruhm C. (2011) “The economics of Health Behaviours”. In Pauly M.V., McGuire T.G., andBarros P.P. HandBook of Health Economics, 2: 95–199.
Celermajer, D. S., Adams, M. R., Clarkson, P., Robinson, J., McCredie, R., Donald, A. and Deanfield, J.E. (1996) “Passive smoking and impaired endothelium-dependent arterial dilatation in healthy youngadults”, New England Journal of Medicine, 334: 150–5.
Cutler, D. M. and Lleras-Muney, A. (2010) “Understanding differences in health behaviors by education”,Journal of health economics, 29: 1–28.
Di Valentino, M., Muzzarelli, S., Rigoli, A., Limoni, C., Pedrazzini, G., Barazzoni, F. and Gallino, A. F.(2011) “Reduced hospitalization for st-elevation myocardial infarction after introduction of smokingban in public places in canton Ticino, southern Switzerland”, Journal of the American College ofCardiology, 57 (14).
Evans, W. N., Farrelly, M. C. and Montgomery, E. (1999) “Do Workplace Smoking Bans Reduce Smoking?”,American Economic Review, 89: 728–47.
Glantz, S. A. and Parmley, W. W. (1991) “Passive smoking and heart disease. Epidemiology, physiology,and biochemistry”, Circulation, 83: 1–12.
16

Insam, C., Paccaud, F. and Marques-Vidal, P. (2013) “Trends in hospital discharges, management andin-hospital mortality from acute myocardial infarction in Switzerland between 1998 and 2008”, BMCpublic health, 13: 270.
Jones, A. M., Laporte, A., Rice, N. and Zucchelli, E. (2013) “Do public smoking bans have an impact onactive smoking? Evidence from the UK”, Health Economics.
Law, M. R., Morris, J. K. and Wald, N. J. (1997) “Environmental tobacco smoke exposure and ischaemicheart disease: an evaluation of the evidence”, BMJ (Clinical research ed.), 315: 973–80.
Meyer, K., Simmet, A. and Junker, C. (2007) “Acute myocardial infarction and associated deaths inSwitzerland an approach to estimating incidence”, Kardiovaskulre Medizin, 10: 279–84.
Meyers, D. G., Neuberger, J. S. and He, J. (2009) “Cardiovascular effect of bans on smoking in publicplaces”, Journal of the American College of Cardiology, 54: 1249–55.
OECD (2013), Health at a Glance 2013: OECD Indicators, OECD Publishing.http://dx.doi.org/10.1787/health glance-2013-en
Pieroni, L., Chiavarini, M., Minelli, L. and Salmasi, L. (2013) “The role of anti-smoking legislation oncigarette and alcohol consumption habits in Italy”, Health policy, 111: 116–26.
Richiardi, L., Vizzini, L., Merletti, F. and Barone-Adesi, F. (2009) “Cardiovascular benefits of smokingregulations: The effect of decreased exposure to passive smoking”, Preventive medicine, 48: 167–72.
Ruhm, C. J. (2007) “A Healthy Economy Can Break Your Heart”, Demography, 44: 829–48.
Ruhm, C. J. (2005) “Healthy living in hard times”, Journal of health economics, 24: 341–63.
Sargent, R. P., Shepard, R. M. and Glantz, S. A. (2004) “Reduced incidence of admissions for myocardialinfarction associated with public smoking ban: before and after study”, BMJ (Clinical research ed.),328: 977–80.
Shetty, K. D., DeLeire, T., White, C. and Bhattacharya, J. (2011) “Changes in U.S. hospitalization andmortality rates following smoking bans”, Journal of Policy Analysis and Management, 30: 6–28.
Teo, K. K., Ounpuu, S., Hawken, S., Pandey, M., Valentin, V., Hunt, D., Diaz, R., Rashed, W., Free-man, R. and Jiang, L. (2006) “Tobacco use and risk of myocardial infarction in 52 countries in theINTERHEART study: a case-control study”, The Lancet, 368: 647–58.
Wieser S., Ruthemann I., De Boni S., et al. (2012) “Cost of acute coronary syndrome in Swizterland”.Swiss Med Wkly; 142:w13655.
Windham, G. C., Hopkins, B., Fenster, L. and Swan, S. H. (2000) “Prenatal active or passive tobaccosmoke exposure and the risk of preterm delivery or low birth weight”, Epidemiology, 11: 427–33.
17

Table 1: Implementation of smoking bans (SB) in the Swiss cantons
Canton SB implemented in More severe regulation
AG 05.2010AI 05.2010AR 01.2011 XBE 07.2009 XBL 05.2010 XBS 04.2010 XFR 01.2010 XGE 11.2009 XGL 05.2010GR 03.2008 XJU 05.2010LU 05.2010NE 04.2009 XNW 05.2010OW 05.2010SG 07.2010 XSH 05.2010SO 01.2009 XSZ 05.2010TG 05.2010TI 04.2007 XUR 09.2009 XVD 09.2009 XVS 07.2009 XZG 03.2010ZH 05.2010 X
18
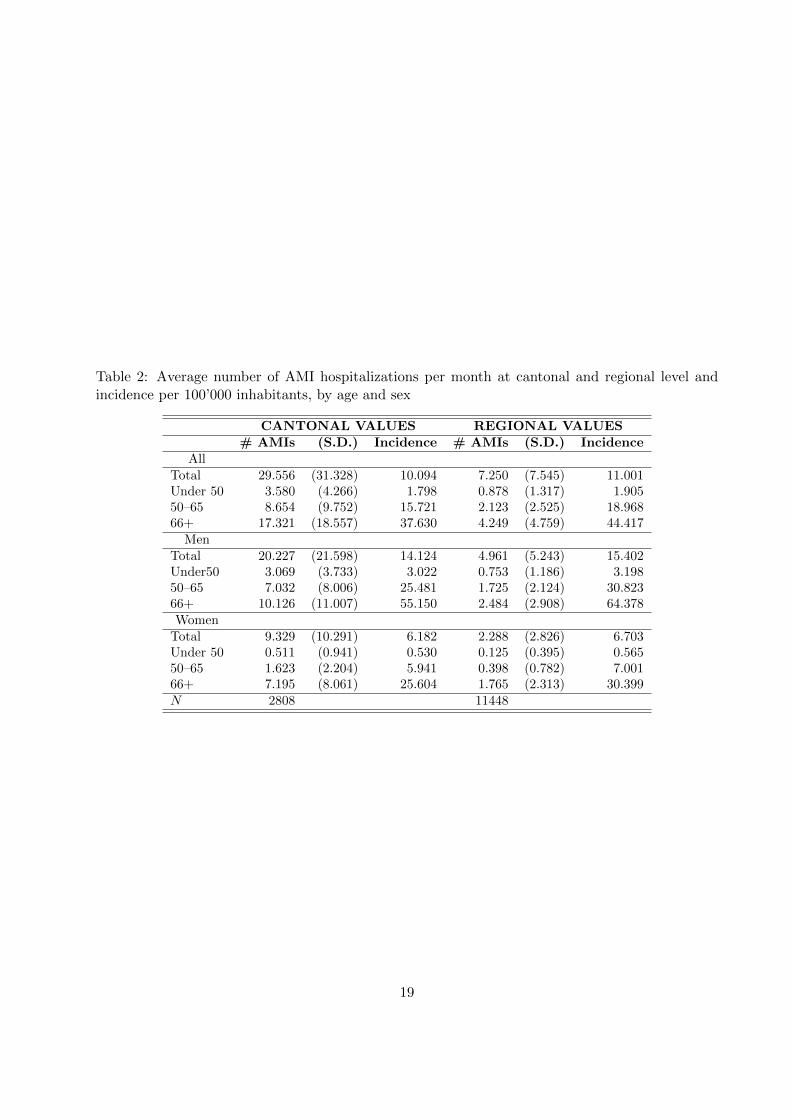
Table 2: Average number of AMI hospitalizations per month at cantonal and regional level andincidence per 100’000 inhabitants, by age and sex
CANTONAL VALUES REGIONAL VALUES# AMIs (S.D.) Incidence # AMIs (S.D.) Incidence
AllTotal 29.556 (31.328) 10.094 7.250 (7.545) 11.001Under 50 3.580 (4.266) 1.798 0.878 (1.317) 1.90550–65 8.654 (9.752) 15.721 2.123 (2.525) 18.96866+ 17.321 (18.557) 37.630 4.249 (4.759) 44.417
MenTotal 20.227 (21.598) 14.124 4.961 (5.243) 15.402Under50 3.069 (3.733) 3.022 0.753 (1.186) 3.19850–65 7.032 (8.006) 25.481 1.725 (2.124) 30.82366+ 10.126 (11.007) 55.150 2.484 (2.908) 64.378Women
Total 9.329 (10.291) 6.182 2.288 (2.826) 6.703Under 50 0.511 (0.941) 0.530 0.125 (0.395) 0.56550–65 1.623 (2.204) 5.941 0.398 (0.782) 7.00166+ 7.195 (8.061) 25.604 1.765 (2.313) 30.399N 2808 11448
19
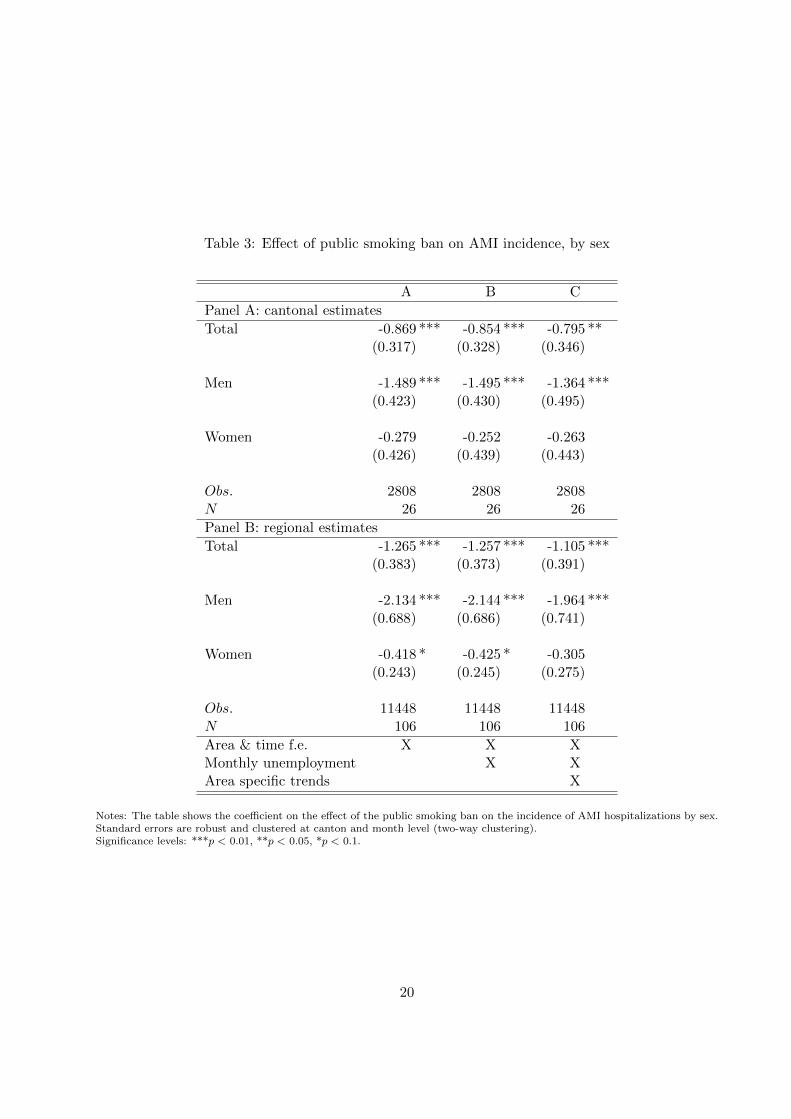
Table 3: Effect of public smoking ban on AMI incidence, by sex
A B C
Panel A: cantonal estimates
Total -0.869 *** -0.854 *** -0.795 **(0.317) (0.328) (0.346)
Men -1.489 *** -1.495 *** -1.364 ***(0.423) (0.430) (0.495)
Women -0.279 -0.252 -0.263(0.426) (0.439) (0.443)
Obs. 2808 2808 2808N 26 26 26
Panel B: regional estimates
Total -1.265 *** -1.257 *** -1.105 ***(0.383) (0.373) (0.391)
Men -2.134 *** -2.144 *** -1.964 ***(0.688) (0.686) (0.741)
Women -0.418 * -0.425 * -0.305(0.243) (0.245) (0.275)
Obs. 11448 11448 11448N 106 106 106
Area & time f.e. X X XMonthly unemployment X XArea specific trends X
Notes: The table shows the coefficient on the effect of the public smoking ban on the incidence of AMI hospitalizations by sex.Standard errors are robust and clustered at canton and month level (two-way clustering).Significance levels: ***p < 0.01, **p < 0.05, *p < 0.1.
20
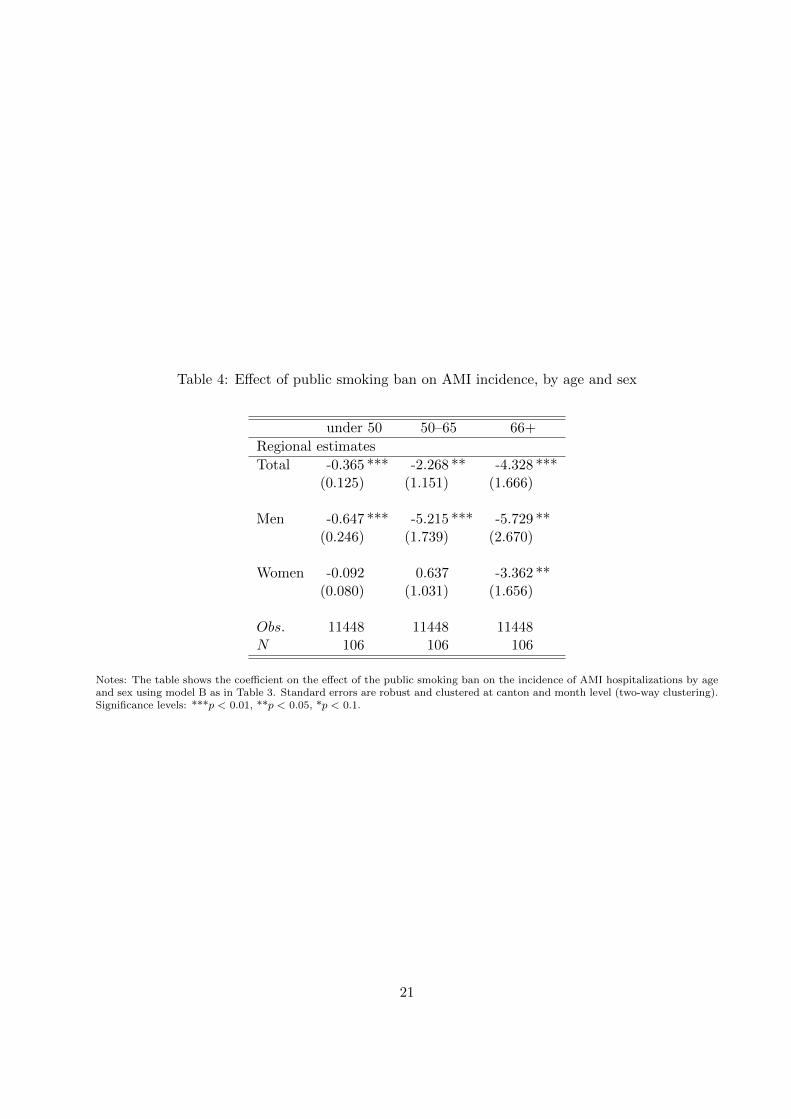
Table 4: Effect of public smoking ban on AMI incidence, by age and sex
under 50 50–65 66+
Regional estimates
Total -0.365 *** -2.268 ** -4.328 ***(0.125) (1.151) (1.666)
Men -0.647 *** -5.215 *** -5.729 **(0.246) (1.739) (2.670)
Women -0.092 0.637 -3.362 **(0.080) (1.031) (1.656)
Obs. 11448 11448 11448N 106 106 106
Notes: The table shows the coefficient on the effect of the public smoking ban on the incidence of AMI hospitalizations by ageand sex using model B as in Table 3. Standard errors are robust and clustered at canton and month level (two-way clustering).Significance levels: ***p < 0.01, **p < 0.05, *p < 0.1.
21

Table 5: Heterogeneity by income and education
Low Income High Income Low Educ High Educ
Regional estimates
Total -1.947 *** -0.388 -1.541 *** -0.974 **(0.523) (0.552) (0.454) (0.376)
Men -3.112 *** -1.079 -2.991 *** -0.905 **(0.983) (0.951) (0.971) (0.323)
Women -0.830 *** 0.267 -0.142 -1.074(0.267) (0.329) (0.534) (0.646)
Obs. 5724 5724 5724 5724N 53 53 53 53
Notes: The table shows the coefficient on the effect of public smoking ban on the incidence of AMI hospitalizations byeducation and income groups using model B as in Table 3. Standard errors are robust and clustered at canton and monthlevel (two-way clustering).Significance levels: ***p < 0.01, **p < 0.05, *p < 0.1.
Table 6: Strictness of the law: mild vs. severe law
Total Men Women
Regional estimates
Mild -0.248 -0.505 -0.096(0.582) (0.974) (0.545)
Severe -1.415 *** -2.408 *** -0.478 **(0.366) (0.629) (0.226)
Obs. 11448 11448 11448N 106 106 106
Notes: The table shows the coefficient on the effect of the public smoking ban on the incidence of AMI hospitalizations usingtwo dummies for the ban (severe and mild implementation) using model B as in Table 3. Standard errors are robust andclustered at canton and month level (two-way clustering).Significance levels: ***p < 0.01, **p < 0.05, *p < 0.1.
22

Table 7: Unconfoundness test: effect of the ban on the incidence of lung, prostate and breast cancer
Lung cancer prostate cancer breast cancer
MS region estimates
Smoking Ban -0.002 -0.001 -.028(.005) (.020) (.052)
Obs. 11448 11448 11448N 106 106 106
Notes: The table shows the coefficient on the effect of the smoking ban using model B as in Table 3. Standard errors arerobust and clustered at canton and monthly level (two-way clustering).Significance levels: ***p < 0.01, **p < 0.05, *p < 0.1.
Table 8: Placebo test
Total Men Women
Regional estimates
1 year lag -.127 .051 -.310(.531) (.945) (.381)
Smoking Ban -1.160 ** -2.034 ** -.308(.484) (.899) (.315)
1 year lead .601 .740 .447(.663) (.877) (.522)
Obs. 11448 11448 11448N 106 106 106
Notes: The table shows the coefficient on the effect of the smoking ban using model B as in Table 3 and controlling for theeffect of two placebo reforms one year before and after the real implementation. Standard errors are robust and clustered atcanton and month level (two-way clustering).Significance levels: ***p < 0.01, **p < 0.05, *p < 0.1.
23
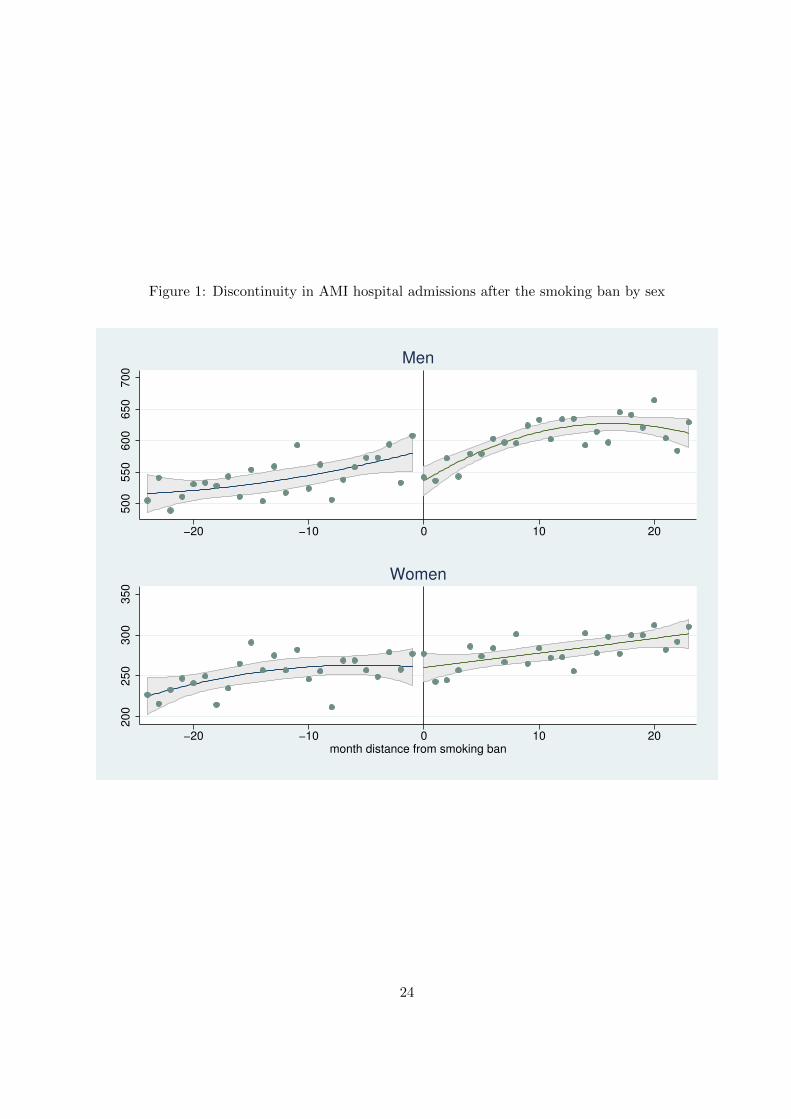
Figure 1: Discontinuity in AMI hospital admissions after the smoking ban by sex
500
550
600
650
700
−20 −10 0 10 20
Men
200
250
300
350
−20 −10 0 10 20month distance from smoking ban
Women
24
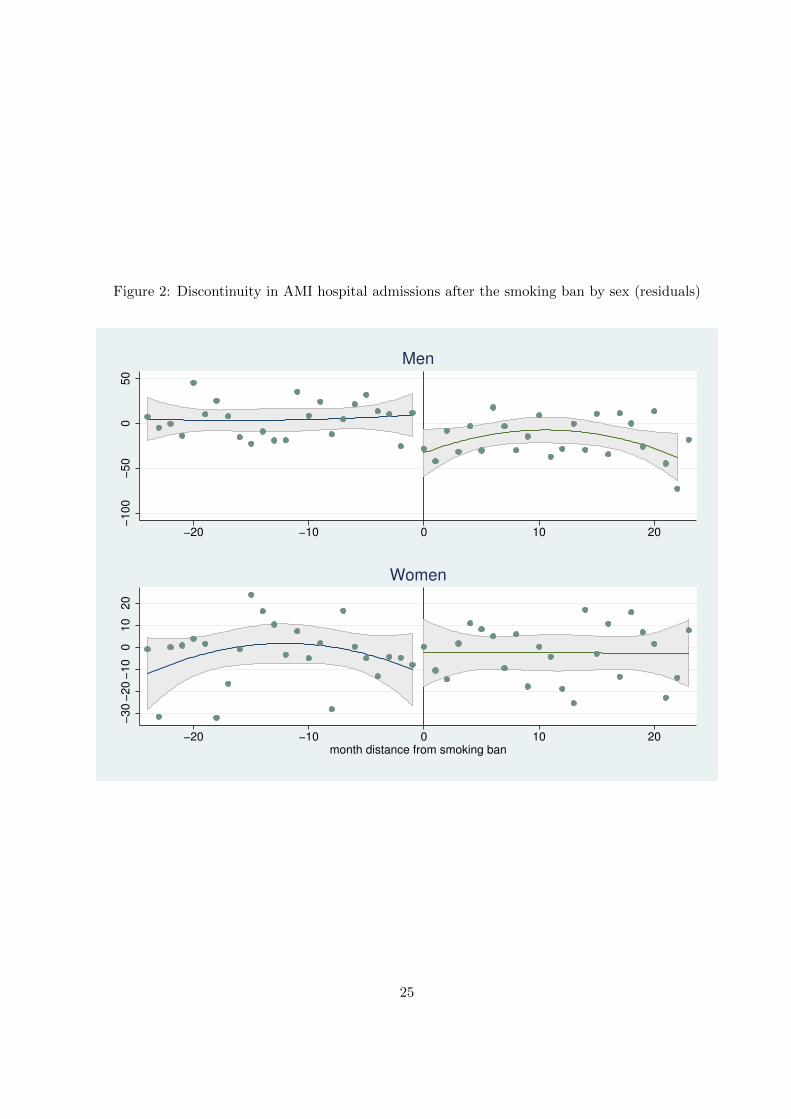
Figure 2: Discontinuity in AMI hospital admissions after the smoking ban by sex (residuals)
−100
−50
050
−20 −10 0 10 20
Men
−30
−20
−10
010
20
−20 −10 0 10 20month distance from smoking ban
Women
25

A Appendix
Table A.1: Seasonal heterogeneity
Total Men Women
Regional estimates
Smoking ban -.926 *** -1.577 ** -.353(.304) (.580) (.258)
Smoking ban*winter -.782 -1.337 ** -.169(.508) (.558) (.748)
Obs. 11448 11448 11448N 106 106 106
Notes: The table shows the coefficient on the effect of the smoking ban using model B as in Table 3 plus an interaction termfor the winter season (November to March). Standard errors are robust and clustered at canton and month level (two-wayclustering).Significance levels: ***p < 0.01, **p < 0.05, *p < 0.1.
Table A.2: Panel corrected standard errors estimates
Total Men Women
Regional estimates
Smoking ban -1.155 *** -1.721 ** -.599(.383) (.615) (.368)
Obs. 11448 11448 11448N 106 106 106
Notes: The table shows the coefficient on the effect of the smoking ban controlling for time and month fixed effects andmonthly unemployment rate. The effect is estimated using panel corrected standard errors assuming first orderautocorrelation, AR(1). Significance levels: ***p < 0.01, **p < 0.05, *p < 0.1.
26