f monitoring 2010-2011 a d indigenous … 18 echidna tracks (tachyglossus aculeatus) december 2010...
TRANSCRIPT

FIELD MONITORING 2010-2011 ANGAS DOWNS INDIGENOUS PROTECTED AREA
A report of field monitoring undertaken in 2010-2011
Compiled by
Jennifer Smits and George Wilson
Australian Wildlife Services
2011

CONTENTS
List of Figures ...................................................................................................................................... 4
List of Tables ....................................................................................................................................... 5
Summary ................................................................................................................................................. 6
1. Introduction .................................................................................................................................... 7
1.1 Climate .................................................................................................................................... 7
1.2 Vegetation ............................................................................................................................... 7
1.3 Angas Downs IPA Plan of Management .................................................................................. 8
2. Methods .......................................................................................................................................... 8
2.1 Reptile and small mammal surveys ........................................................................................ 8
2.2 Bird surveys ........................................................................................................................... 12
2.3 Aerial survey.......................................................................................................................... 12
2.4 Cybertracker .......................................................................................................................... 13
2.5 Track based monitoring ........................................................................................................ 15
2.6 Photo points .......................................................................................................................... 15
2.7 Landscape function analysis (LFA) ........................................................................................ 18
2.8 Mapping of cultural sites ...................................................................................................... 19
2.9 Mapping of important and rare plants ................................................................................. 19
2.10 Fire risk .................................................................................................................................. 19
3. Results ........................................................................................................................................... 19
3.1 Reptile and small mammal surveys ...................................................................................... 19
3.1.1 Reptiles and amphibians ............................................................................................... 19
3.1.2 Small mammals ............................................................................................................. 23
3.1.2 Large native mammals .................................................................................................. 25
3.1.3 Feral mammals .............................................................................................................. 25
3.2 Bird surveys ........................................................................................................................... 25
3.3 Aerial Survey ......................................................................................................................... 26
3.4 Cybertracker .......................................................................................................................... 31
3.5 Track based monitoring ........................................................................................................ 32
3.6 Photo Points .......................................................................................................................... 32
3.7 Landscape Function Analysis ................................................................................................ 33
3.7.1 Wilbia / Wilpiya ............................................................................................................. 33
3.7.2 Wurldunda .................................................................................................................... 35
3.7.3 Mulga LFA ...................................................................................................................... 37
3.7.4 Calcrete / Calcrete Sand / Gypcrete .............................................................................. 38
3.7.5 Sandy substrates ........................................................................................................... 40

3.7.6 Patch Area index ........................................................................................................... 41
3.8 Mapping of cultural sites ...................................................................................................... 43
3.9 Mapping of important and rare plants ................................................................................. 46
3.10 Fire risk and management .................................................................................................... 48
4. References .................................................................................................................................... 52
Appendix 1 Reptile and small mammal surveys site information ........................................................ 53
Appendix 2 Reptile and mammal survey results .................................................................................. 56
Appendix 3 Angas Downs plant checklist ............................................................................................. 59
Appendix 4 Angas Downs bird survey results and checklist ................................................................. 60
Appendix 5 Track-based monitoring results 2010-11 ........................................................................... 63
Appendix 6 Angas Downs photo point report ...................................................................................... 64
Appendix 7 Map of rare and important plants – scientific names ....................................................... 65

List of Figures
Figure 1 Location of Angas Downs IPA .................................................................................................... 7
Figure 2 Bucket trap design – Site Old Road dune .................................................................................. 9
Figure 3 Funnel trap design .................................................................................................................. 10
Figure 4 Paul setting funnel traps October 2010 .................................................................................. 10
Figure 5 Survey Point Locations ............................................................................................................ 11
Figure 6: Strip transect sampling from fixed-wing aircraft ................................................................... 12
Figure 7: Angas Downs Rangers using Cybertracker ............................................................................. 14
Figure 8: TDS Nomad GPS for Cybertracker use on Angas Downs........................................................ 14
Figure 9: Examples of CyberTracker screen shots ................................................................................ 14
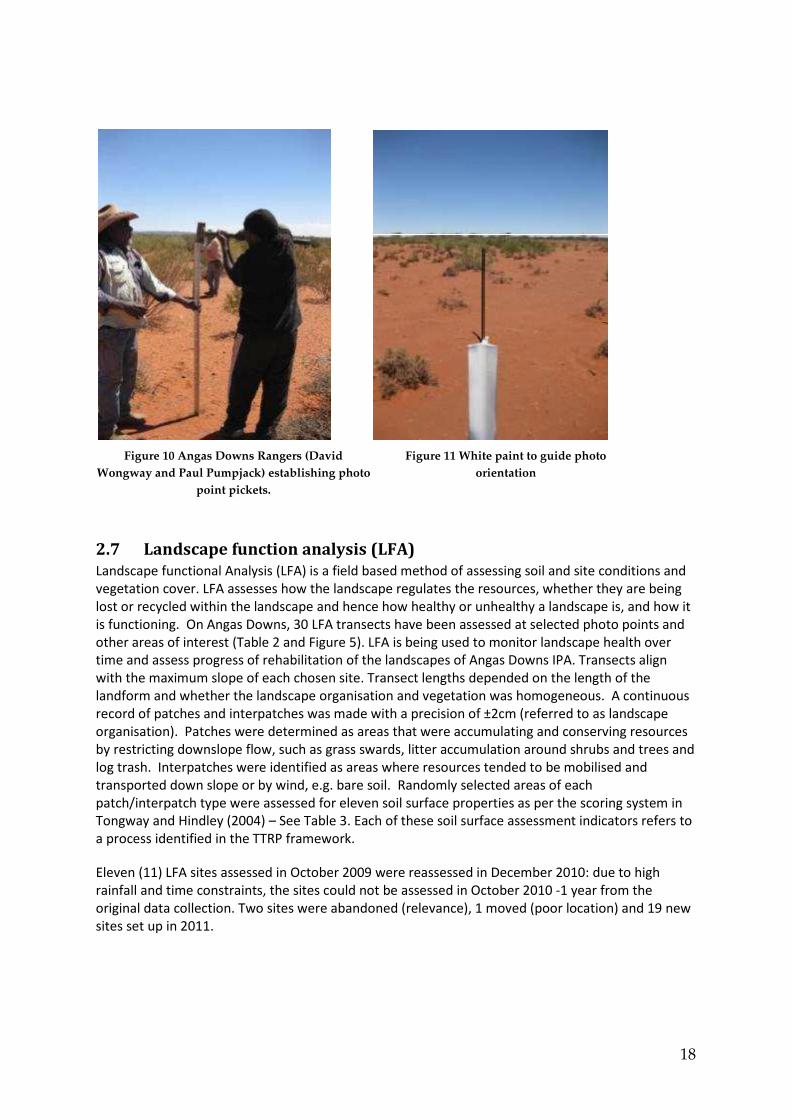
Figure 10 Angas Downs Rangers (David Wongway and Paul Pumpjack) establishing photo point
pickets. .................................................................................................................................................. 18
Figure 11 White paint to guide photo orientation ............................................................................... 18
Figure 12: Some reptile species identified during 2010-11 surveys (left to right): Nephrurus levis levis,
Nuphrurus laevissimus, Egernia inornata, Varanus eremius, Ctenotus calurus, Ramphotyphlops
endoterus, Suta punctata, Pygopus nigriceps, Simoselaps bertholdi ................................................... 20
Figure 13 Notaden nichollsi Desert Spadefoot – Juvenile, Yaua Waterhole March 2011 Photo: Smits
.............................................................................................................................................................. 22
Figure 14 Neobatrachus centralis Trilling Frog, Yaua Waterhole October 2010 Photo: Kay ................ 22
Figure 15 Limnodynastes ornatus Ornate Burrowing Frog, Yaua Waterhole October 2010 Photo: Kay
.............................................................................................................................................................. 23
Figure 16 Kultarr (Antechinomys laniger) (with young) & Spinifex Hopping Mice (Notomys alexis) ... 24
Figure 17 Lesser Hairy Footed Dunnart (Sminthopsis youngsoni) & Wongai Ningaui (Ningaui ridei) .. 24
Figure 18 Echidna tracks (Tachyglossus aculeatus) December 2010 .................................................... 24
Figure 19 Estimated populations on Angas Downs during 2010 aerial survey ..................................... 27
Figure 20 Map of red kangaroo population density Figure 21 Map of camel population density ... 28
Figure 22 Map of feral horse population density Figure 23 Map of cattle population density ........ 29
Figure 24 Total herbivore grazing pressure (horse, cattle, kangaroo, camel) dry sheep equivalent
(DSE) ...................................................................................................................................................... 30
Figure 25 Cybertracker Sightings during 2010-2011 – Camels, Horses and Kangaroo ......................... 31
Figure 26: Example of how photo points show change over-time ....................................................... 32
Figure 27 Wilpiya/Wilbia LFA results 2009 & 2010 ............................................................................... 33
Figure 28 Photo of the LFA transect undertaken within the fenced area of Wilpiya in December 2010.
Plant growth has been extremely good. ............................................................................................... 34
Figure 29 Photo of the soil surface found under buffel grass at Wilbia ............................................... 34
Figure 30 Wurldunda LFA results 2009 & 2010 .................................................................................... 35
Figure 31 Mulga LFA results 2009 & 2010 ............................................................................................ 38
Figure 32 Grasslands/low shrublands over calcrete/gypcrete/sandy calcrete LFA results 2009 & 2010
.............................................................................................................................................................. 39
Figure 33 Calcrete LFA results December 2010 .................................................................................... 39
Figure 34 Other LFA sites set up December 2010 ................................................................................. 40
Figure 35 Sandy substrates LFA results 2009 & 2010 ........................................................................... 41
Figure 36 Sandy substrates LFA results December 2010 ...................................................................... 41
Figure 37 Patch area index for sites assessed in 2009 and 2010 .......................................................... 42
Figure 38 Ongoing mapping of Angas Downs Cultural and historic sites ............................................. 45
Figure 39 Rare and important plants on Angas Downs ........................................................................ 47
Figure 40 24 Month Cumulative Rainfall Curtin Springs 1998-2011 .................................................... 49
Figure 41 Before and after burning occurred at the junction of Luritja Road and Puna Kura Kura
Track, December 2010. (A) October 2010 (B) January 2011 (C) April 2011 showing post fire growth
(Landsat Band Composit using Bands 7,4,2). ........................................................................................ 50
Figure 42 Senior Ranger David Wongway lighting small patch burn at the junction of Luritja Road and
Puna Kura Kura Track, December 2010 ................................................................................................ 51
Figure 43 Cool burns protect fire senitive mulga, increases landscape patchiness and reduces fuel
loads. ..................................................................................................................................................... 51
List of Tables
Table 1 Locations of tracking plots ....................................................................................................... 15
Table 2 Photo Points Angas Downs....................................................................................................... 16
Table 3 Eleven soil surface properties assessed for each patch/interpatch type in the Landscape
Function Analysis method (Tongway and Hindley 2004) ...................................................................... 19
Table 4 Reptiles and Amphibians observed on Angas Downs IPA 2010-11 .......................................... 21
Table 5 Number of bird species observed during surveys in March 2011............................................ 26
Table 6 Aerial survey statistics ............................................................................................................. 27
Summary
Angas Downs Indigenous Protected Area (IPA) is a biologically and culturally rich a pastoral lease in
the Northern Territory, south west of Alice Springs and within the Finke Bioregion. It is important to
the Anangu people from the Pitjantjatjara/Yankunytjatjara language groups. This report summarises
field monitoring undertaken during 2010-2011 in accordance with the Angas Downs IPA Plan of
Management.
The objective of the Angas Downs IPA Plan of Management is to manage land and wildlife resources
in order to maintain Anangu culture, to conserve biodiversity and to enable sustainable production
in support of human communities and economic development.
A key requirement of the Plan is to monitor landscape and ecosystem health and wildlife
populations with a view to increasing species important to Anangu such as Malu (red kangaroo) and
Kalaya (emu). Important to this is the involvement and leadership of Anangu in land management
and monitoring, integrating traditional knowledge and science.
Monitoring and fieldwork with Angas Downs’ Anangu Rangers commenced in July 2009. This report
details work undertaken from July 2010 up until June 2011. The following indicators were assessed:
• Bird, reptile and small mammal surveys
• Aerial surveys for large mammals - kangaroo, emu, camel, horse, wild cattle
• Ground survey species presence / absence using Cybertracker
• Photo point to record vegetation change over time
• Track-based monitoring – species presence / absence on sandy substrates
• Landscape Function Analysis (LFA) – a landscape health assessment tool
• Mapping of cultural sites
• Mapping of important and rare plants
• Fire risk assessment.
In 2011, monitoring showed an improvement in most indicators. This is due to the recovery from
drought in central Australia during 2010-2011. The average rainfall for the region is approximately
240mm — in 2009 <80mm fell; in 2010 540mm fell.
Future monitoring will indicate whether these improvements will persist as a result of Ranger
activities such as feral animal management and fencing.
1. Introduction
The Angas Downs Indigenous Protected Area (IPA) is an Indigenous owned 320,500 hectare pastoral
lease, 135 km east from Uluru-Kata Tjuta National Park and 40km from Mt Ebenezer Roadhouse on
the Lasseter Highway (Figure 1). It was declared and formally recognized as an Indigenous Protected
Area on 10 June 2009.
The community owned Imanpa Development Association holds the lease for Angas Downs and
operates the property through its company Lisanote Pty Ltd. The Lisanote Board is elected from the
Imanpa community by the community to represent their interests. Residents of Imanpa include
Matutjara descendants (the original occupiers of Angas Downs region), Yankunytjatjara and
Pitjantjatjara people.
1.1 Climate
Angas Downs IPA is in the arid region of central Australia with an average annual rainfall of
approximately 240-250mm. Between 2007-2010, the region was experiencing drought with below
average rainfall. In 2010, the drought was broken with soaking rains of 544mm (recorded at Angas
Downs Station) – more than double the average. By early May 2011, 120 mm had fallen (recorded at
Curtin Springs – BOM 2011).
1.2 Vegetation
Angas Downs has diverse landscapes and vegetation –desert oak woodlands, sand dunes and plains,
mulga, watercourse areas, limestone/calcrete and ironstone plains, rocky/hill country and areas of
spinifex grasslands.
Figure 1 Location of Angas Downs IPA

1.3 Angas Downs IPA Plan of Management
The Angas Downs IPA Plan of Management (Wilson et al 2005) outlines the natural and cultural
resource base, land management operations, sustainable development opportunities, training and
education and collaborative relationships and partnerships. The property also provides valuable
cultural resources for Aboriginal communities to carry out traditional ceremonial business.
The objective of the Angas Downs IPA Plan of Management is to: “manage land and wildlife
resources in order to maintain Anangu culture, conserve biodiversity and enable sustainable
production in support of human communities and economic development.” A key feature of this
plan is to monitor landscape and ecosystem health and wildlife populations. Through Indigenous
aspirations to sustainably use Angas Downs’ land and wildlife resources, detailed information on
plant, wildlife and landscape health are being collected.
Anangu Rangers employed under the Working on Country Program, direct and help Australian
Wildlife Services (AWS) staff in wildlife monitoring using Cybertracker, taking photographic data at
photo points and track-based monitoring. Australian Wildlife Services also trains the rangers in other
aspects of wildlife and landscape assessment techniques. The survey methods used on Angas Downs
are described in this report include:
• Reptile and small mammal surveys – funnel and pitfall traps along fence lines
• Bird surveys
• Aerial surveys – large species population estimation – kangaroo, emu, horse, cow, camel,
euro and dingo.
• Cybertracker surveys - wildlife species presence / absence
• Track Based monitoring – species presence / absence on sandy substrates
• Photo Points to assess visual change to ecosystems over time
• Landscape Function Analysis (LFA) – a landscape health assessment tool
• Mapping of cultural sites
• Mapping of important and rare plants
• Fire risk assessment.
2. Methods
2.1 Reptile and small mammal surveys
During October and December 2010 and March and June 2011, Angas Downs IPA Rangers and AWS
surveyed reptiles and small mammals across Angas Down’s landscapes. Surveys were conducted
using pitfall and funnel traps along drift fences, as well as active searches.
A permit to trap using drift lines and pitfall traps was obtained from Territory Parks and Wildlife
Service for the period Sept 2010 to Sept 2015 (Permit number 38812).
Trapping was completed at 16 sites of varying vegetation and substrate during October 2010, 4 sites
during December 2010 and 1 new site in March 2011.
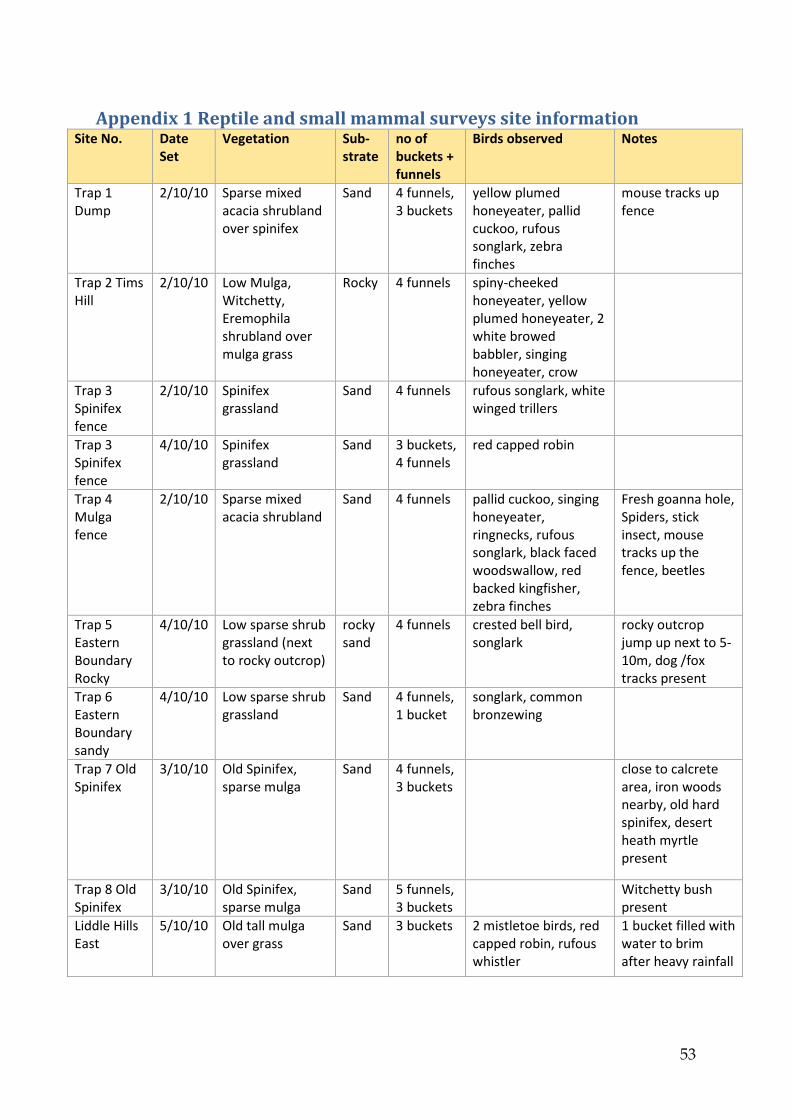
Figure 5 shows site locations for these surveys. Site information including location, vegetation, bird
species present and weather conditions is detailed in Appendix 1.
'Drift fence' barriers were erected by the rangers to direct foraging animals / reptiles towards the
traps. Pitfall traps consisted of 20 Litre PVC white buckets dug into the substrate (see Figure 2).
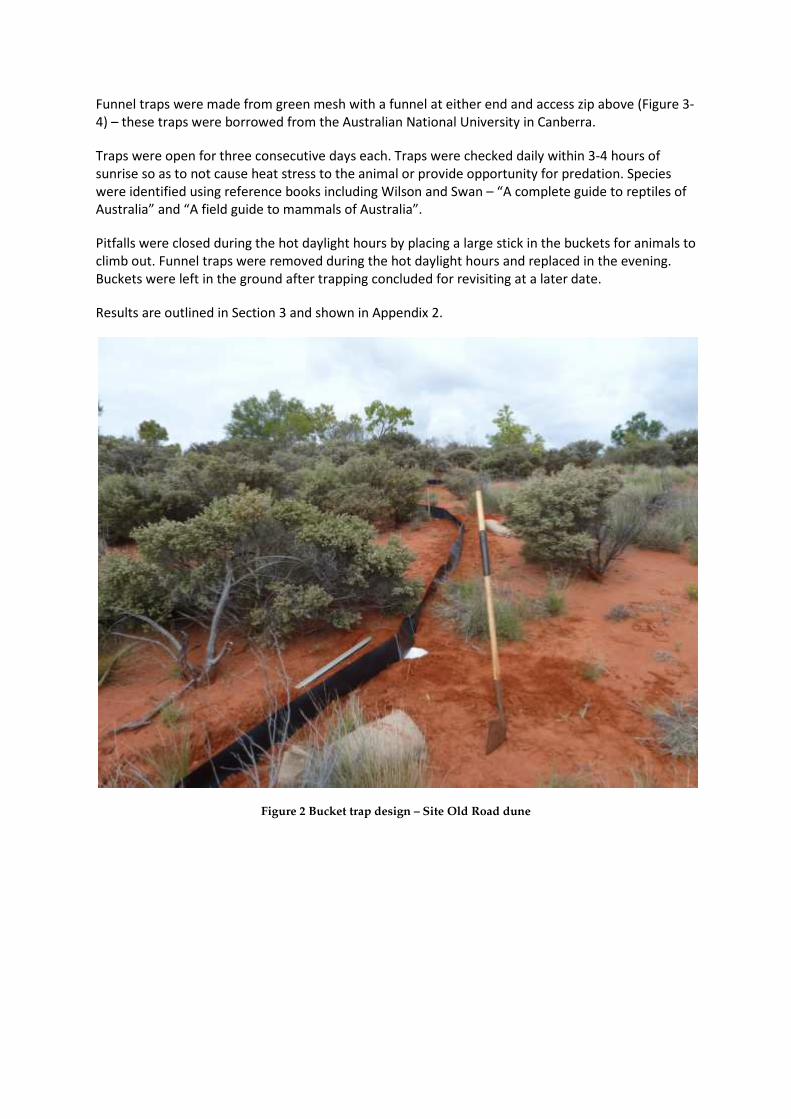
Funnel traps were made from green mesh with a funnel at either end and access zip above (Figure 3-
4) – these traps were borrowed from the Australian National University in Canberra.
Traps were open for three consecutive days each. Traps were checked daily within 3-4 hours of
sunrise so as to not cause heat stress to the animal or provide opportunity for predation. Species
were identified using reference books including Wilson and Swan – “A complete guide to reptiles of
Australia” and “A field guide to mammals of Australia”.
Pitfalls were closed during the hot daylight hours by placing a large stick in the buckets for animals to
climb out. Funnel traps were removed during the hot daylight hours and replaced in the evening.
Buckets were left in the ground after trapping concluded for revisiting at a later date.
Results are outlined in Section 3 and shown in Appendix 2.
Figure 2 Bucket trap design – Site Old Road dune

Figure 3 Funnel trap design
Figure 4 Paul setting funnel traps October 2010

11
Figure 5 Survey Point Locations
12
2.2 Bird surveys
Bird surveys were undertaken at eight sites in March 2011 (Figure 5). From an access point (track,
road etc), straight transects of approximately 200 m were walked up and back for 15 minutes. Bird
species seen and heard during the surveys were recorded. Counts were taken of observed species.
The purpose of the data collected is to represent presence / absence and indicate changes in
populations after future surveys. Opportunistic bird surveys and sightings were also undertaken year
round, including with use of the Cybertracker (see Section2.4). GPS located photos were also taken
where opportunity arisen. Results are described in Section 3.2.
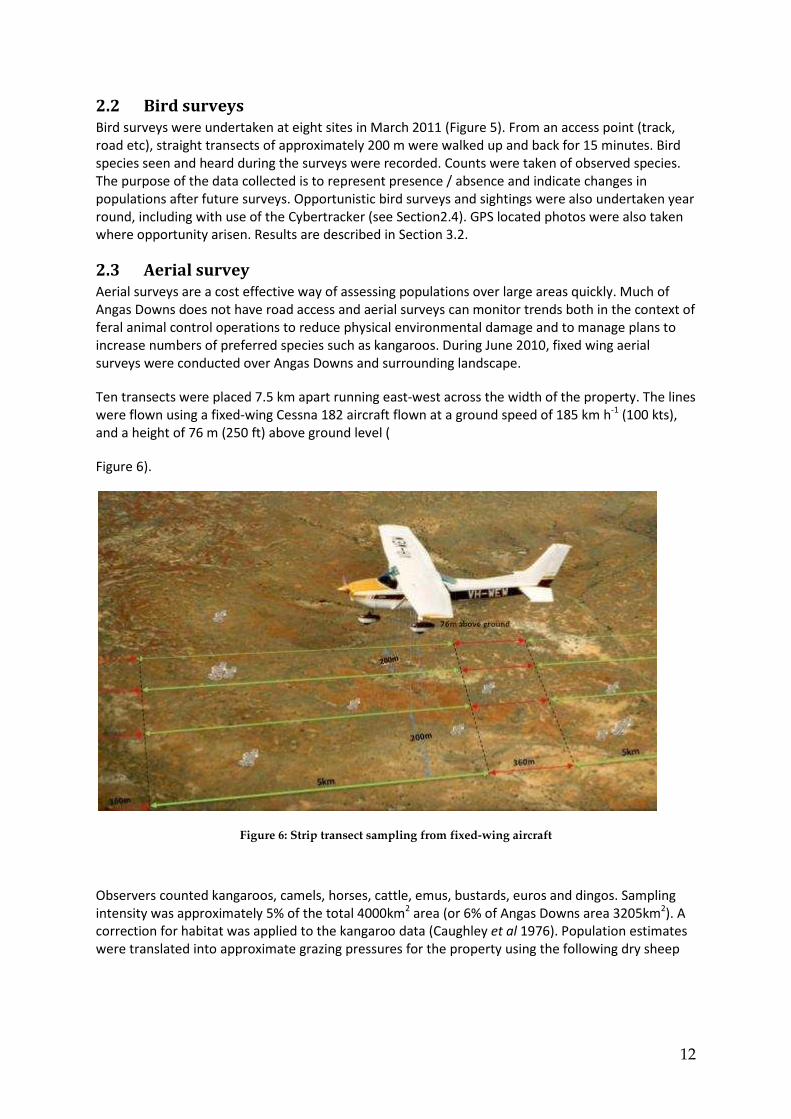
2.3 Aerial survey
Aerial surveys are a cost effective way of assessing populations over large areas quickly. Much of
Angas Downs does not have road access and aerial surveys can monitor trends both in the context of
feral animal control operations to reduce physical environmental damage and to manage plans to
increase numbers of preferred species such as kangaroos. During June 2010, fixed wing aerial
surveys were conducted over Angas Downs and surrounding landscape.
Ten transects were placed 7.5 km apart running east-west across the width of the property. The lines
were flown using a fixed-wing Cessna 182 aircraft flown at a ground speed of 185 km h-1
(100 kts),
and a height of 76 m (250 ft) above ground level (
Figure 6).
Figure 6: Strip transect sampling from fixed-wing aircraft
Observers counted kangaroos, camels, horses, cattle, emus, bustards, euros and dingos. Sampling
intensity was approximately 5% of the total 4000km2 area (or 6% of Angas Downs area 3205km
2). A
correction for habitat was applied to the kangaroo data (Caughley et al 1976). Population estimates
were translated into approximate grazing pressures for the property using the following dry sheep

13
equivalents (DSE): 12 DSE for cattle (Millear et al 2001) 10 DSE for horses (Millear et al 2001); 5.4
DSE for camels (Guerouali and Wardeh 1998) and 0.5 DSE for Kangaroo (Wilson and Edwards 20081)
For more details on the survey method and results please see the report “Angas Downs IPA Aerial
Survey June 2010” downloadable from www.awt.com.au (Australian Wildlife Services 2010a).
Results are shown in Section 3.3.
2.4 Cybertracker
CyberTracker is a software program built for field monitoring and data capture installed on hand-
held PDAs (Personal Digital Assistants), which have Global Positioning System (GPS) capability.
CyberTracker was developed to support indigenous trackers retain and develop their tracking skills,
and document findings. The program uses lists of icons and photos making it easier to use by non-
literate people. It is an efficient way to gather large quantities of geo-referenced data for field
observations. It is used widely across Indigenous Ranger groups in Australia for management of both
land and sea resources.
The aims of implementing CyberTracker Wildlife Surveys on Angas Downs IPA are to:
• involve the rangers in monitoring native and feral species on Angas Downs
• progress involvement in sustainable wildlife management
• combine Indigenous knowledge with science to monitor environmental factors.
A detailed but simple Cybertracker sequence (species lists and other data to be collected) was
developed for Angas Downs by Australian Wildlife Services. Species listed are specific to Angas
Downs to help identify quickly species observed.
CyberTracker information is collected by the Angas Downs Rangers. Surveys are either operated by
driving one of eight survey routes across the property or opportunistically. Data is collected on feral
animals and management, native fauna and kuka, birds, bushtucker plants, rare plants, weeds, fire,
road kills, hunting, fence condition and, cultural and historical sites etc (Figure 7 – Figure 9). Data is
downloaded at the Angas Downs Office. The data are then collated and uploaded to maps and
interactive layers in Google Earth.
Results of the Cybertracker surveys during 2010-2011 are shown in Section 3.4.
1 This is a very conservative number – Munn et al (2009) have estimated it closer to 0.35 DSE – Munn, A.J.,
Dawson, T.J., McLeod, S.R., Croft, D.B., Thompson, M.B. and Dickman, C.R. 2009. Field metabolic rate and
water turnover of red kangaroos and sheep in an arid rangeland: an empirically derived dry-sheep-equivalent
for kangaroos. Australian Journal of Zoology 57(1): 23–28.

14
Figure 7: Angas Downs Rangers using Cybertracker
Figure 8: TDS Nomad GPS for Cybertracker use on Angas Downs
Figure 9: Examples of CyberTracker screen shots

15
2.5 Track based monitoring
Seven tracking plots on sandy substrate areas have been set up since 2009 at locations listed in
Table 1 (also see mapped locations in Figure 5). Each is approximately 2ha (100m x 200m). Rangers
accompany AWS personnel to find and record all evidence of animal tracks, scats and other traces
within the plot area using the methodology described by Southgate and Moseby (2008). Age of the
sign and abundance are also recorded. During 2010-11 to date, four of the tracking plots were
assessed. Results are discussed in Section 3.5.
Table 1 Locations of tracking plots
Plot Name Longitude Latitude Vegetation type
Desert Oak Tracks
Plot 132.3178 -24.7371
Desert Oak (Allocasuarina decaisneana) open woodland
over spinifex (Triodia sp.) Irregular sand dunes and plains.
Boxwood Tracking
Plot 132.2098 -25.1361
Acacia kempeana (Witchetty Bush), A. aneura (Mulga)
open-shrubland over mixed grasses (Eragrostis eriopoda
(Woollybutt grass), Triodia sp. (soft and hard spinifex))
(Mallee Present). Sand plain.
Tim’s Camp North
sand plain Tracks Plot 132.2107 -25.1355
Acacia aneura (Mulga) open-shrubland over Senna sp.,
Eremophila (Fuchsia) sp. shrub layer over mixed grasses
Triodia sp., Eragrostis eriopoda, Monachather paradoxa
(Mulga grass). A. estrophiolata (Ironwood), Grevillea sp,
Santalum acuminatum (Quandong) and Aluta
maisonneuvei (dune crests) also present. Sand plain and
dune.
Fighting Tracking Plot 132.244 -25.0347
Acacia kempeana (Witchetty Bush) A. aneura (Mulga)
medium to tall open-shrubland over tussock grasses
(Monachather paradoxa, Eragrostis eriopoda) and Senna
sp. Sand Dune.
Sanctuary Tracking
Plot 132.0697 -25.1243
Acacia kempeana (Witchetty Bush), A. aneura (Mulga)
medium to tall open-shrubland with Senna Eremophila
(Fuchsia) over tussock grass (Eragrostis eriopoda).
Aluta maisonneuvei (dune crests). Mulga burnt in 2002.
Corymbia opaca (Desert Bloodwood). Sand dune and
plain.
South East Tracking
Plot (Northern) 132.315 -25.208
Acacia (Ironwood) open woodland / Mulga-Cassia (Senna)
shrubland over mixed grasses including spinifex, kerosene
grass, Woollybutt and other forbs. Sand plain and sections
of Mulga Earth.
South East Tracking
Plot (Southern) 132.317 -25.214
Mixed shrubland (Acacia, Grevillea, Dodonaea, Cassia)
over spinifex on sand dunes.
2.6 Photo points
32 photo points have been established around the property since 2009. Locations (see Figure 5)
were selected using two main criteria:
• an area of interest – for example, different fire history, different management technique
• a representation of different landform/landscape types over the property.
At each photo point, Angas Downs Rangers erect 2 steel posts 10 meters apart (see Figure 7) along a
North-South line. The two posts are for aligning the photos. The post at the end which the photo is
to be taken was painted white so photo orientation was obvious.

16
Rangers have been trained to take regular photos at these points. In 2010, a geolocated camera was
purchased to help the rangers with their survey photos. Photos points will be compared through
time to show landscape and vegetation improvement or deterioration.
These are listed in Table 2.
Table 2 Photo Points Angas Downs
Name Long Lat Type
Dist to
water
(km) Vegetation Other
Armstrong calcrete-
sand
132.10 -25.15 Photo
LFA
0.16 Sand dune/Sandplain Low
sparse shrubland (Acacia,
Maireana, Eremophila)
Inside sanctuary
Athel Pine Control 132.08 -25.21 Photo 7.28 Small drainage depression/dam Athel Pine knockdown;
outside sanctuary, south
of Lasseter Highway
Back of Wilbia -
over grassland
132.18 -25.12 Photo 0.57 Overlooking forbland and Wilbia
Soak.
Possible overgrazed area,
regeneration
Bloodwoods Sand 132.08 -25.13 Photo
LFA
3.72 Sand plain/Sand dune Acacia
and Senna sp Tall shrubland
over Woollybutt grass, mulga
grass
Proposed bore site;
Inside sanctuary
Boxwood Bore Sand 132.26 -25.16 Photo
LFA
0.08 Sandplain Tall open
Senna/Acacia sp. shrubland
(Quandong Santalum
acuminatum in distance)
Inside cattle paddock
Boxwood Calcrete 132.21 -25.14 Photo
LFA
6.61 Calcrete grassland – oat grasses
(Enneapogon sp), low
chenopods and other forbs
Within the cattle
paddock
Buffel Grass 132.36 -25.15 Photo 8.30 Buffel Grass invasion from road
corridor – sand (Cenchrus
ciliaris)
Weed management and
control of spread
Burnt Mulga Cattle 132.38 -25.07 Photo 5.50 Overlooking burnt mulga
woodland patch
To show recruitment and
growth of new mulga
overtime.
Calcrete Rabbits
Cattle Paddock
(fenced)
132.26 -25.09 Photo
LFA
6.00 Calcrete grassland– oat grasses
(Enneapogon sp)
Rabbit activity - adjacent
to areas unfenced, inside
the cattle paddock
Calcrete Rabbits
(unfenced)
132.25 -25.09 Photo
LFA
5.27 Calcrete grassland– oat grasses
(Enneapogon sp)
Rabbit activity - outside
fenced areas
Calcrete Cattle 2
(near Wallara Dam)
132.31 -25.14 Photo 5.57 Calcrete grassland– oat grasses
(Enneapogon sp)
Inside cattle paddock -
improving coverage of
the landscape
Cattle Paddock
North (both ways)
132.39 -25.06 Photo 5.29 Sparse shrubland over tussock
grasses
Show management
effects inside and outside
of the cattle fence
Cattle Spinifex 132.33 -25.09 Photo 0.16 Spinifex sand Inside cattle paddock
Centenary
Grassland
132.39 -25.07 Photo
LFA
4.20 Sparse-Open Forbland /
grassland – oat grasses
(Enneapogon sp)
Inside cattle paddock
Centenary Mulga 132.41 -25.08 Photo
LFA
2.38 Mulga tall open shrubland Inside cattle paddock
Cronks Flat 132.40 -24.99 Photo 11.58 Grassland – Digitaria sp (Cotton Outside fenced areas -

17
Name Long Lat Type
Dist to
water
(km) Vegetation Other
Grassland panic)
Curtin Springs
Boundary
131.99 -25.10 Photo
LFA
12.45 Sandplain – Sparse tussock
grassland
Camel degradation; Burnt
2002; Inside sanctuary
Desert Oaks 132.32 -24.68 Photo
LFA
7.60 Sand dune/sand plain
Allocasuarina Spinifex open
woodland
Burnt 2002; Outside
sanctuary
Eagles Nest 132.43 -25.05 Photo
LFA
4.45 Sand dune crest; tall open
shrubland with tussock grass
understorey
Inside cattle paddock
Fighting Trough
Calcrete-sand 132.25 -25.03
Photo
LFA 0.01
Sandplain Mid Open Acacia and
Maireana Shrubland
Outside sanctuary
Mulga santuary 132.10 -25.14
Photo
LFA 1.24
Mulga mature Inside sanctuary
Puna Kura Kura 132.41 -24.86 Photo 16.00
Gibber plain (rocky surface)
Tussock Grassland
Erosion in distance;
Outside sanctuary
Puna Kura Kura
Burnt 132.36 -24.88
Photo
LFA 11.60
Sand plain Spinifex low-mid
open shrubland
Acacia/Casuarina burnt, not
regenerated
Burnt 2002; Outside
sanctuary
South West Corner 131.99 -25.23 Photo 14.10
Calcrete depression Gilgai Low
open shrubland (Maireana sp).
Mitchell grass (Astrebla sp)
Camel degradation and
erosion; Inside sanctuary;
Spinifex behind fire
managt
Spinifex 131.99 -25.19
Photo
LFA 12.35
Spinifex grassland In the sanctuary area
Stoves Swamp 132.30 -25.16
Photo
LFA 3.66
Swamp, clay pan Coolibah
(Eucalyptus coolabah) low open
woodland,
Swamp; Inside cattle
paddock
Water Rock 132.24 -24.98 Photo 0.48
Clay pan/sand plain Crusted
area
Landform type; Outside
sanctuary
West Bore
Ironstone grassland 132.13 -25.00
Photo
LFA 12.90
Alluvial plain? Open
grassland/forbland
Outside sanctuary
Wilbia Dam
Calcrete 132.15 -25.16
Photo
LFA 0.80
Calcrete grassland Inside the sanctuary area,
distance to water
Wollunga Solar
Gypsum 132.25 -24.69
Photo
LFA 0.05
Calcrete/gypsum pan Low open
Acacia shrubland (Dead finish –
not alive) tussock and onion
grass
Drought affected
vegetation; Rabbit issue;
Outside sanctuary
Wilbia soak fenced 132.2 -25.12 Photo 0.00 Coolibah, ripartian vegetation Fenced soak area
Wurldunda soak
fenced 132.2 -25.12 Photo 0.00
Samphires and saltbush Fenced soak and
drainage area
18
Figure 10 Angas Downs Rangers (David
Wongway and Paul Pumpjack) establishing photo
point pickets.
Figure 11 White paint to guide photo
orientation
2.7 Landscape function analysis (LFA)
Landscape functional Analysis (LFA) is a field based method of assessing soil and site conditions and
vegetation cover. LFA assesses how the landscape regulates the resources, whether they are being
lost or recycled within the landscape and hence how healthy or unhealthy a landscape is, and how it
is functioning. On Angas Downs, 30 LFA transects have been assessed at selected photo points and
other areas of interest (Table 2 and Figure 5). LFA is being used to monitor landscape health over
time and assess progress of rehabilitation of the landscapes of Angas Downs IPA. Transects align
with the maximum slope of each chosen site. Transect lengths depended on the length of the
landform and whether the landscape organisation and vegetation was homogeneous. A continuous
record of patches and interpatches was made with a precision of ±2cm (referred to as landscape
organisation). Patches were determined as areas that were accumulating and conserving resources
by restricting downslope flow, such as grass swards, litter accumulation around shrubs and trees and
log trash. Interpatches were identified as areas where resources tended to be mobilised and
transported down slope or by wind, e.g. bare soil. Randomly selected areas of each
patch/interpatch type were assessed for eleven soil surface properties as per the scoring system in
Tongway and Hindley (2004) – See Table 3. Each of these soil surface assessment indicators refers to
a process identified in the TTRP framework.
Eleven (11) LFA sites assessed in October 2009 were reassessed in December 2010: due to high
rainfall and time constraints, the sites could not be assessed in October 2010 -1 year from the
original data collection. Two sites were abandoned (relevance), 1 moved (poor location) and 19 new
sites set up in 2011.

19
Table 3 Eleven soil surface properties assessed for each patch/interpatch type in the Landscape Function
Analysis method (Tongway and Hindley 2004)
1. Soil cover (rainsplash protection). 7. Deposited materials (sediment).
2. Perennial vegetation cover. 8. Surface roughness.
3. Litter cover, origin and decomposition. 9. Surface resistance to disturbance.
4. Crytogram cover. 10. Emerson aggregate test / slake test
(soil stability).
5. Crust brokenness. 11. Soil texture.
6. Erosion type and severity.
Field procedures are detailed by Tongway and Hindley (2004).
2.8 Mapping of cultural sites
Mapping of cultural sites occurred on Angas Downs during 2010-2011. As cultural sites are located,
Australian Wildlife Services has been recording them photographically and where possible, filming
Anangu elders telling the site’s stories. Angas Downs IPA entered a funding proposal in 2010 with
the Indigenous Heritage Program, Department of Environment, in order to properly document the
known sites and find unknown sites by an anthropologist – rock art specialist) and to record elders
not in the immediate area (ie Docker, Muti, Tempe Downs, Alice Springs).
2.9 Mapping of important and rare plants
Plant surveys were conducted property wide (but almost always close to vehicle access) during
2010-11. Structure and floristics were recorded at each photo and LFA site and interesting plants
noted opportunistically (geolocated). Preliminary surveys of the Eastern section of the Kernot Range
was also undertaken during 2010. Species identified in 2010-11 are discussed in section 3.9 and
listed in Appendix 3. Surveys did not assess plant species density, just presence/absence and plant
diversity at each site. Plant density is an indicator assessed within LFA studies (Section 2.7).
2.10 Fire risk
Fire risk for Angas Downs was determined using rainfall data from BOM and Angas Downs rainfall
records collected daily during 2010. Trial burn-offs were also mapped using Landsat TM images.
Results are shown in Section 3.10.
3. Results
3.1 Reptile and small mammal surveys
The surveys were completed between 2-9 October, 6-9 December 2010 and March 2011. 40 reptile
6 small mammal and 4 frog species were recorded, many of which had not yet been listed on Angas
Downs IPA’s species lists. Reptile, amphibian and mammals observed during the survey are listed in
Appendix 2.
3.1.1 Reptiles and amphibians
Reptiles and amphibians observed are listed in
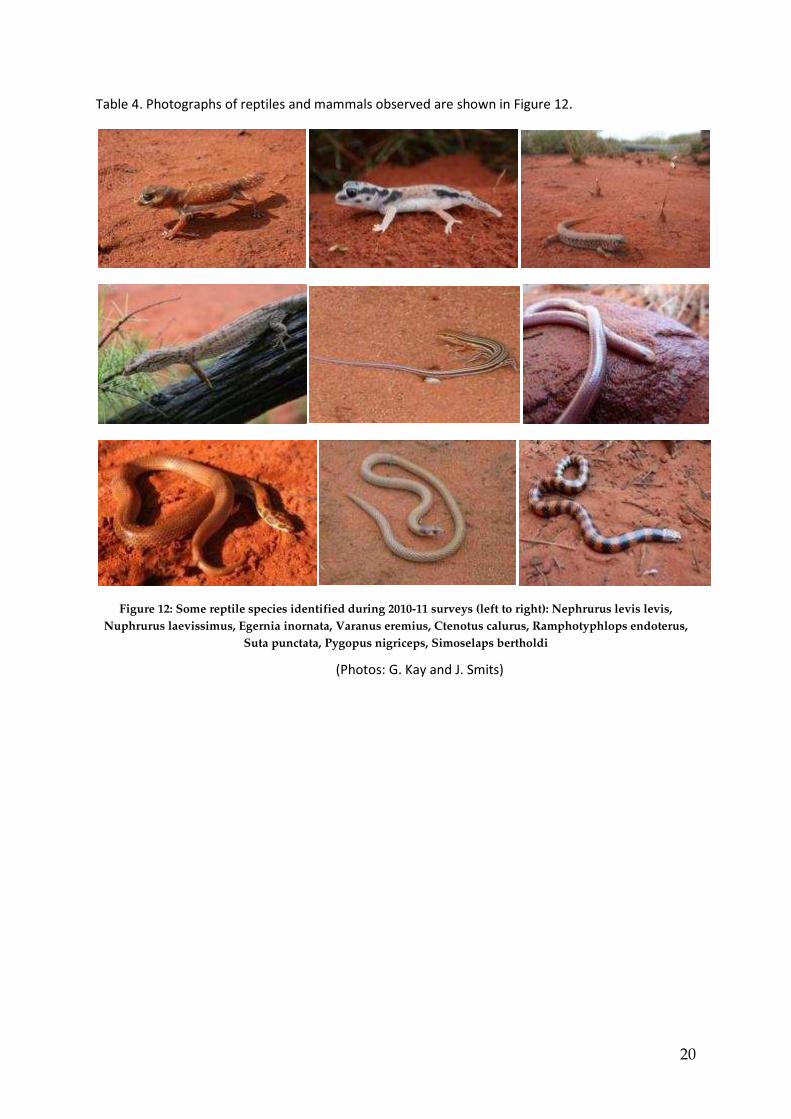
Table 4. Photographs of reptiles and mammals observed are shown in
Figure 12: Some reptile species identified during 2010
Nuphrurus laevissimus, Egernia inornata,
Suta punctata,
. Photographs of reptiles and mammals observed are shown in Figure 12.
: Some reptile species identified during 2010-11 surveys (left to right): Nephrurus levis levis,
Egernia inornata, Varanus eremius, Ctenotus calurus, Ramphotyphlops endoterus,
Suta punctata, Pygopus nigriceps, Simoselaps bertholdi
(Photos: G. Kay and J. Smits)
20
.
surveys (left to right): Nephrurus levis levis,
Ramphotyphlops endoterus,

21
Table 4 Reptiles and Amphibians observed on Angas Downs IPA 2010-11
Reptiles Reptiles
Amphibolurus longirostris
Long-nosed Dragon (Ta-Ta) Lerista bipes Two-toed Lerista
Cryptoblepharus plagiocephalus
...skink Menetia greyii Common dwarf skink
Ctenophorus isolepis Central Military Dragon Moloch horridus Thorny Devil
Ctenophorus nuchalis Central netted dragon Morethia ruficauda Fire-tailed skink
Ctenophorus reticulatus Western netted Dragon Nephrurus levis levis Smooth Knobtail Gecko
Ctenotus brooksi Nuphrurus laevissimus Pale Knob-tailed Gecko
Ctenotus calurus Blue-tailed Ctenotus Pseudechis australis King Brown Snake
Ctenotus dux Narrow-lined Ctenotus Pseudonaja nuchalis Western Brown Snake
Ctenotus helenae Clay-soil ctenotus Pseudonaja modesta Ringed Brown Snake
Ctenotus leonhardii Leonhard’s Ctenotus Pygopus nigriceps Western Hooded Scaly-
foot
Ctenotus pantherinus ocellifer
Leopard Ctenotus Ramphotyphlops
endoterus
Interior Blind Snake
Ctenotus piankai ...skink Rhynchoedura ornata Beaked Gecko
Ctenotus quattuordecimlineatus
14-lined skink Simoselaps anamolous Desert Banded Snake
Ctenotus schomburgkii Barred Wedged Snout
Ctenotus
Simoselaps bertholdi Jan's banded snake
Delma nasuta ...legless lizard Strophurus ciliaris Northern Spiny-tailed
gecko
Demansia psammophis Yellow Faced Whip Snake Suta punctata Little Spotted Snake
Diplodactylus conspicillatus
Fat-tailed gecko Tiliqua Multifasciata Centralian Blue Tounge
Egernia inornata Desert Skink Varanus eremius Pygmy Desert Monitor
Gehyra variegata Varigated Gecko Varanus gouldii Gould's Goanna
Heteronotia binoei Bynoe's gecko Varanus giganteus Perentie
Amphibians
Limnodynastes ornatus Ornate Burrowing Frog
Litoria rubella Desert Tree Frog
Neobatrachus centralis Trilling Frog
Notaden nichollsi Desert Spadefoot Toad
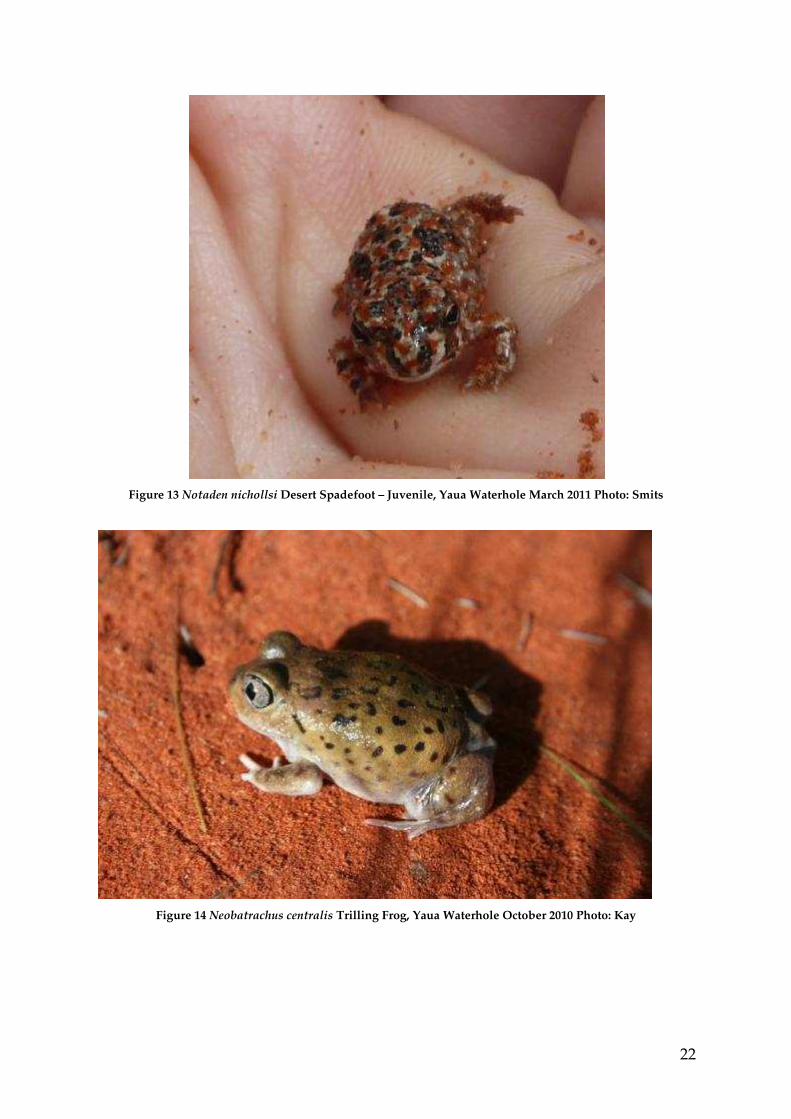
22
Figure 13 Notaden nichollsi Desert Spadefoot – Juvenile, Yaua Waterhole March 2011 Photo: Smits
Figure 14 Neobatrachus centralis Trilling Frog, Yaua Waterhole October 2010 Photo: Kay

23
Figure 15 Limnodynastes ornatus Ornate Burrowing Frog, Yaua Waterhole October 2010 Photo: Kay
3.1.2 Small mammals
The October 2010 surveys found six species of small mammals – Sandy Inland Mice (Pseudomys
hermannsburgensis), Kultarr (Antechinomys laniger) and Spinifex Hopping Mice (Notomys alexis)
(Figure 16), Wongai Ningaui (Ningaui ridei) and Lesser Hairy Footed Dunnart (Sminthopsis youngsoni)
(Figure 17) and Echidna (Figure 18). Kultarr, Mitchell’s Hopping Mouse (Notomys Mitchelli) and
Lesser Hairy-footed dunnart were also observed in June 2011. Kultarr is listed as Lower Risk-Near
Threatened in the Northern Territory and Mitchell’s Hopping Mouse (3 found) are well out of their
normal range extending from southern parts of WA and SA. House Mice/Sandy inland mouse and
Spinifex Hopping Mice were extremely common (very high densities across the property) in June
2011.

24
Figure 16 Kultarr (Antechinomys laniger) (with young) & Spinifex Hopping Mice (Notomys alexis)
Figure 17 Lesser Hairy Footed Dunnart (Sminthopsis youngsoni) & Wongai Ningaui (Ningaui ridei)
Figure 18 Echidna tracks (Tachyglossus aculeatus) December 2010
25
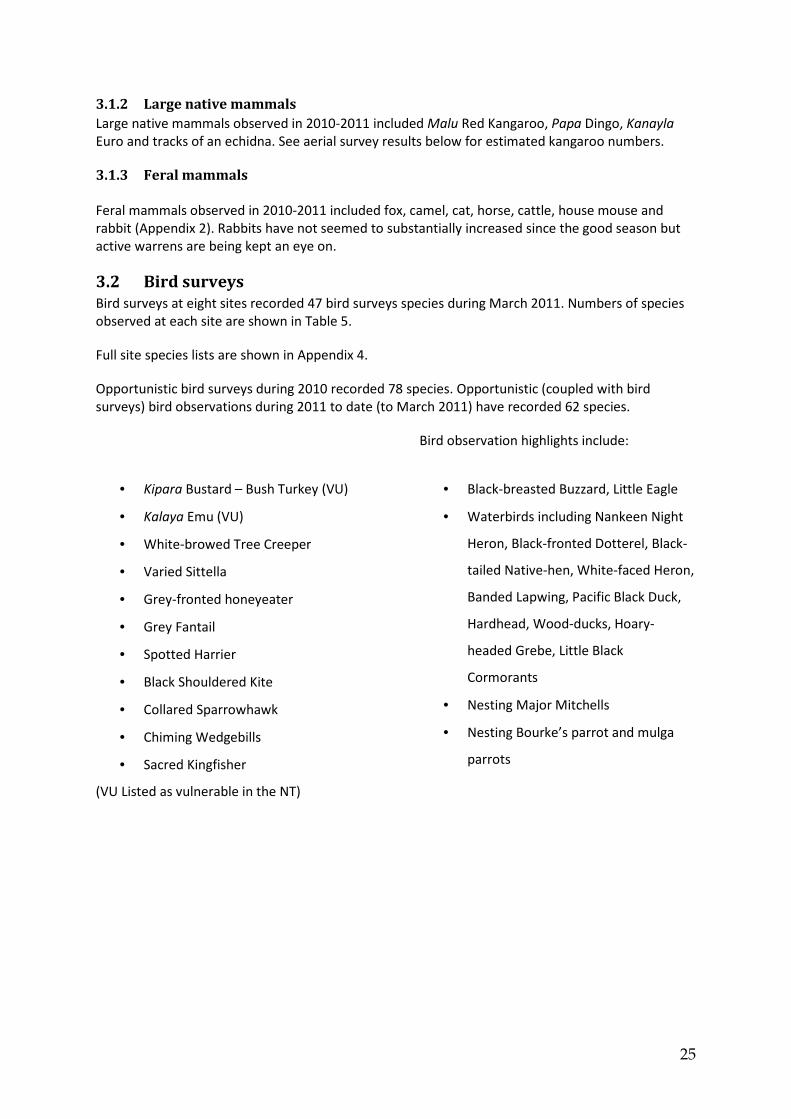
3.1.2 Large native mammals
Large native mammals observed in 2010-2011 included Malu Red Kangaroo, Papa Dingo, Kanayla
Euro and tracks of an echidna. See aerial survey results below for estimated kangaroo numbers.
3.1.3 Feral mammals
Feral mammals observed in 2010-2011 included fox, camel, cat, horse, cattle, house mouse and
rabbit (Appendix 2). Rabbits have not seemed to substantially increased since the good season but
active warrens are being kept an eye on.
3.2 Bird surveys
Bird surveys at eight sites recorded 47 bird surveys species during March 2011. Numbers of species
observed at each site are shown in Table 5.
Full site species lists are shown in Appendix 4.
Opportunistic bird surveys during 2010 recorded 78 species. Opportunistic (coupled with bird
surveys) bird observations during 2011 to date (to March 2011) have recorded 62 species.
Bird observation highlights include:
• Kipara Bustard – Bush Turkey (VU)
• Kalaya Emu (VU)
• White-browed Tree Creeper
• Varied Sittella
• Grey-fronted honeyeater
• Grey Fantail
• Spotted Harrier
• Black Shouldered Kite
• Collared Sparrowhawk
• Chiming Wedgebills
• Sacred Kingfisher
• Black-breasted Buzzard, Little Eagle
• Waterbirds including Nankeen Night
Heron, Black-fronted Dotterel, Black-
tailed Native-hen, White-faced Heron,
Banded Lapwing, Pacific Black Duck,
Hardhead, Wood-ducks, Hoary-
headed Grebe, Little Black
Cormorants
• Nesting Major Mitchells
• Nesting Bourke’s parrot and mulga
parrots
(VU Listed as vulnerable in the NT)

26
Table 5 Number of bird species observed during surveys in March 2011
Site Dead
Camel Rd
Mulga
Centenary
LFA Mulga
Tim Dump
Mulga
Puna Kura
Kura mulga
Puna Kura
Kura Mulga
recent burn
Thick
watercourse
mulga past
yellow tank
Total
species per
site
11 6 25 10 7 6
Site Open
woodland
past yellow
tank
Entry Road
to yellow
tank
Ironwoods
near Wilbia
Dam
Bird Pt 10
(Boxwood
gate)
Bird Pt 11
(Lasseter Hwy
Mulga
watercourse)
Total
species per
site
5 3 10 6 16
Birds uncommon in 2009 and common in 2010-11 included Brown and Rufous Songlarks, Red Chats,
Little-button Quail, Budgerigar, Bourke’s Parrots, Common Bronzewing, Pallid Cuckoo, Sacred
Kingfisher, Cockatiels, Richard’s Pipit. Water birds not seen on Angas Downs for many years were
present in 2010 (see lists above and Appendix 4), however few water birds were observed during
March 2011 despite surface water and full dams across the property. Rains elsewhere in the country
would have caused these birds to keep migrating off Angas Downs.
There is also anecdotal evidence that emu numbers have been increasing (pers comm. David
Wongway – Senior Anangu Ranger 2010). There were a string of sightings during 2010, including a
male with chicks on the plains near West Bore during October 2010 (see Figure 5 for location).
Rainbow Bee-eaters were not observed during 2010 in the numbers seen in 2009. During October
2009 surveys, rainbow bee-eaters were extremely common as they were migrating through the
area. There was no migration to this area by Rainbow Bee-eaters in 2010. Only 1 was seen in
October 2010. It is suggested that this change would be due to the unusual rainfall patterns across
the country.
3.3 Aerial Survey
The results and analysis of the 2010 Angas Downs IPA Aerial Survey are shown in Table 6 and Figure
19. Population density estimates for herbivores kangaroos, camels, cattle and horses are shown in
Figure 20 - Figure 22 and total grazing pressure is shown in Figure 24.
Kangaroo populations were estimated at 2900 ± 1000 for the property, camel populations were
estimated at 600 ± 350. The estimated kangaroo population is a good base for numbers to start
increasing in the landscape where pressures on the population are reduced (ie. restricted hunting
and competition from feral animals). Camel numbers were higher than expected on Angas Downs,
despite likely population dispersion due to high rainfall during 2010. Camel population management,
along with feral horses and cattle is a priority for Angas Downs’ management but is difficult while
there is a lot of water and lush vegetation in the landscape.
The aerial survey enhanced the Anangu Ranger’s knowledge of the density and distribution of
kangaroos, camels, horses and cattle. This will help them to manage landscapes where these animals
exist to either encourage populations or control them.

27
No emus (Dromaius novaehollandiae) were observed during the June 2010 surveys on Angas Downs
or surrounding land. Bustards (bush turkeys) (Ardeotis Australis) and various other species of birds
such as budgerigars (Melopsittacus undulatus), Major Mitchells (Lophochroa leadbeateri) and galahs
(Eolophus roseicapilla) were observed during the aerial surveys however, density analysis was not
conducted. No Euros (Macropus robustus) were observed but their presence in the hills on the
station has been during ground surveys. Dingos were observed from the air but not during the
surveys periods.
For more details on the aerial survey results please see the report “Angas Downs IPA Aerial Survey
June 2010” downloadable from www.awt.com.au (Australian Wildlife Services 2010a).
Table 6 Aerial survey statistics
Kangaroo
(vegetation
corrected)
Camel Horse Cattle All Cattle
Feral
Average density (km2) 0.91 0.18 0.09 0.14 0.04
Confidence Interval 95% 0.32 0.12 0.06 0.10 0.05
Range Min 0.60 0.06 0.03 0.04 0
Max 1.23 0.31 0.15 0.24 0.09
Estimated Population on Angas Downs
Average 2927 590 284 452 131
Confidence Interval 95%
1011 363 176 315 144
Range Min 1917 227 109 137 0
Max 3938 953 460 767 275
Figure 19 Estimated populations on Angas Downs during 2010 aerial survey
0
500
1000
1500
2000
2500
3000
3500
4000
4500
2010 Aerial Survey
An
ima
ls p
er
km
2 Kangaroo
Camels
Horses
Cattle
Feral Cattle
95% CI
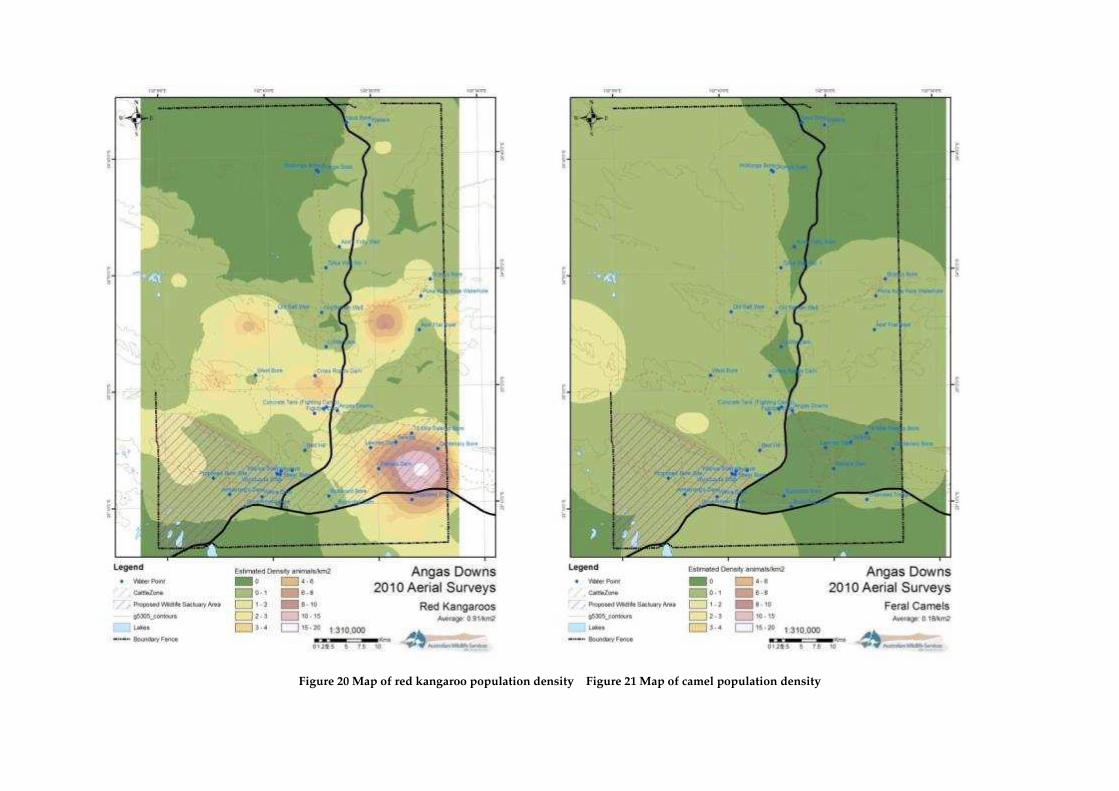
Figure 20 Map of red kangaroo population density Figure 21 Map of camel population density

Figure 22 Map of feral horse population density Figure 23 Map of cattle population density

30
Figure 24 Total herbivore grazing pressure (horse, cattle, kangaroo, camel) dry sheep equivalent (DSE)

31
3.4 Cybertracker
Cybertracker observations were collated and mapped using ArcGIS 10 (Figure 25). Data only shows
presence / absence of species, which is heavily biased to access tracks from which the surveys are
undertaken. The data shown for camels, horses and kangaroos shown in Figure 25 helps locate
where large mobs of feral animals occur and where they compete with native animals such as the
kangaroo.
Surveys were not conducted regularly enough to obtain density estimations. Much of the data was
also collected opportunistically by the rangers – the use of this data is limited to presence / absence
(which is very important in itself); however, Cybertracker has been an excellent tool to urge the
rangers to be more involved in monitoring and recording species and the environment on their land.
As they become more familiar with the software, the data will have greater accuracy and
application.
Figure 25 Cybertracker Sightings during 2010-2011 – Camels, Horses and Kangaroo
32
3.5 Track based monitoring
Four tracking plots on sandy substrate were assessed in 2010, each approximately 2ha (100m x
200m). Malu (red kangaroo) and native mice tracks (Sandy inland, Spinifex hopping mouse, Dunnarts
etc) were observed to occur at all four sites. Cats, foxes, rabbits and snakes were observed at three
of the four sites. Dingos, camels, echidnas and goanna (tinka) were observed at two the sites. Other
track observations included perentie, horse, non-descript birds and small lizards, mulga parrots,
woodswallows and budgerigars.
To date, the technique has been useful for tracking feral animals such as cats and foxes and for
helping locate sites useful for trapping (ie where Mulgara (Dasycercus cristicauda) tracks are thought
to be seen). Raw data is shown in Appendix 5.
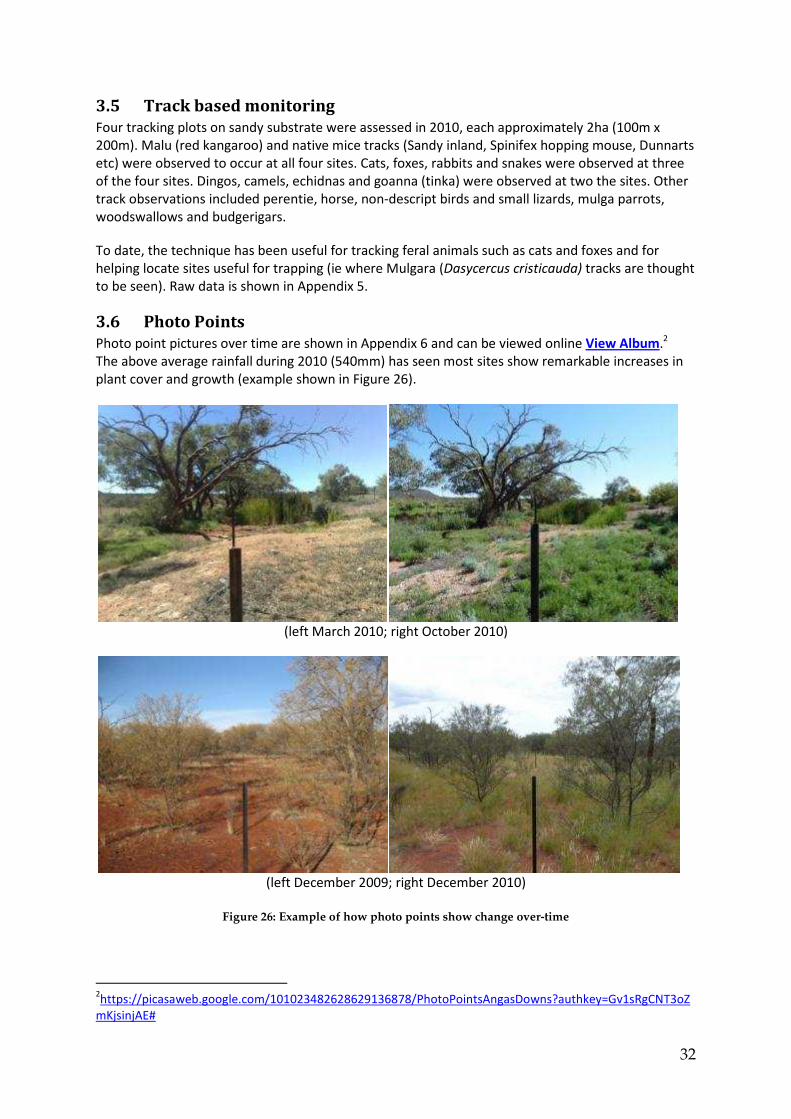
3.6 Photo Points
Photo point pictures over time are shown in Appendix 6 and can be viewed online View Album.2
The above average rainfall during 2010 (540mm) has seen most sites show remarkable increases in
plant cover and growth (example shown in Figure 26).
(left March 2010; right October 2010)
(left December 2009; right December 2010)
Figure 26: Example of how photo points show change over-time
2https://picasaweb.google.com/101023482628629136878/PhotoPointsAngasDowns?authkey=Gv1sRgCNT3oZ
mKjsinjAE#

33
3.7 Landscape Function Analysis
In the majority of instances, 2009 sites reassessed in 2010 increased all their LFA indices - stability,
infiltration, nutrient cycling - reflecting the exceptional rainfall seasons 2010 (2009 rainfall 72mm,
2010 rainfall 540mm, average 240mm). Where indices did not increase or reduced, the sites were
often located near watering points. The greatest increase was seen at Wilbia where fences have
been erected to stop feral animal access to the soaks. These are named “fenced” and “unfenced”
LFA sites.
3.7.1 Wilbia / Wilpiya
There was an increase for all indices in the feral free fenced off area at Wilbia/Wilpiya soak (Figure
27). Areas inside the fenced area that were bare in 2009 have been colonised by Acacia victoriae,
annual grasses and weed species including buffel grass (see Figure 25).
Weed species are more abundant in 2010 with buffel grass being a greater presence on the LFA
transect. Despite this, soil and stability conditions under the buffel was exceptional – greater organic
matter input and swards so dense as to not allow loss of litter and soil out of the system (Figure 26).
Mustard Weed and Couch had also thickened and spread. Considering Wilbia is a significant site on
Angas Downs, it is recommended that weeding occur as soon as possible.
Outside the boundary of the feral free fence, there has been a great increase in stability, infiltration
and nutrient cycling despite grazing access for large feral herbivores. Total patch size (area) and
number of patches increased due to an increase in perennial species, including invasion of buffel
grass. Number of patches nearly doubled from 2009 (from 7.8 to 15.1sq m). The abundance of water
and feed in the landscape would have temporarily relieved grazing pressure at this site. This would
be the case for much of the landscape. Furthermore, seed and water flowing from adjacent fenced
area supports the high increase in growth and LFA indices. Future LFA assessment at this site will be
needed to assess whether there has been a long-term increase in function. Another contributing
factor could be that evidence of a dingo/dog residing or utilising Wilbia could be deterring camels,
cattle and horses.
Figure 27 Wilpiya/Wilbia LFA results 2009 & 2010
0
10
20
30
40
50
60
70
Wilpiya Soak
Unfenced 09
Wilpiya Soak
Unfenced
(downstream)
Wilpiya Soak Fenced
09
Wilpiya Soak Fenced
Wilpiya 2009 and 2010
Stability
Infiltration
Nutrients

34
Figure 28 Photo of the LFA transect undertaken within the fenced area of Wilpiya in December 2010. Plant
growth has been extremely good.
Figure 29 Photo of the soil surface found under buffel grass at Wilbia
Litter and soil are captured and/or retained under these dense swards of Buffel at Wilbia
however, Buffel is considered an environmental weeds and could take over much of the area
– reducing biodiversity of native plants. This may impact bird life that the site currently
supports. Also buffel grass presence can increase the risk of large hot fires which may
damage the progress the site has had since fencing.
35
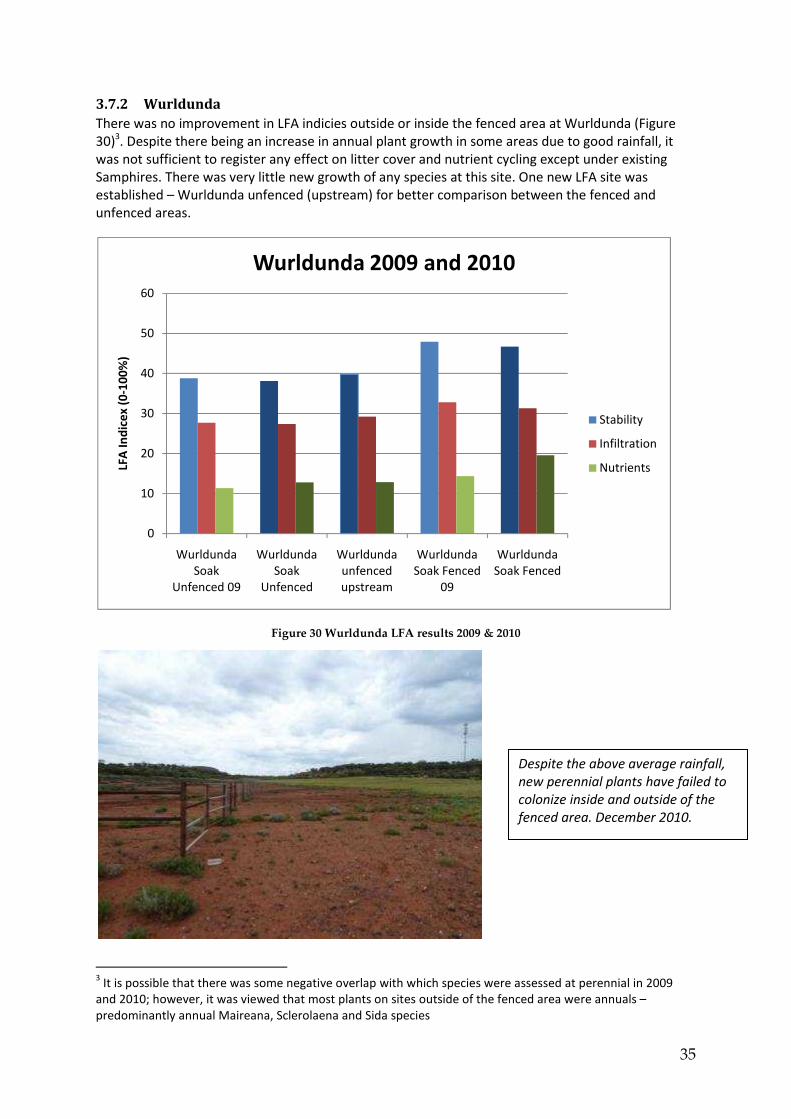
3.7.2 Wurldunda
There was no improvement in LFA indicies outside or inside the fenced area at Wurldunda (Figure
30)3. Despite there being an increase in annual plant growth in some areas due to good rainfall, it
was not sufficient to register any effect on litter cover and nutrient cycling except under existing
Samphires. There was very little new growth of any species at this site. One new LFA site was
established – Wurldunda unfenced (upstream) for better comparison between the fenced and
unfenced areas.
Figure 30 Wurldunda LFA results 2009 & 2010
3 It is possible that there was some negative overlap with which species were assessed at perennial in 2009
and 2010; however, it was viewed that most plants on sites outside of the fenced area were annuals –
predominantly annual Maireana, Sclerolaena and Sida species
0
10
20
30
40
50
60
Wurldunda
Soak
Unfenced 09
Wurldunda
Soak
Unfenced
Wurldunda
unfenced
upstream
Wurldunda
Soak Fenced
09
Wurldunda
Soak Fenced
LFA
In
dic
ex
(0
-10
0%
)
Wurldunda 2009 and 2010
Stability
Infiltration
Nutrients
Despite the above average rainfall,
new perennial plants have failed to
colonize inside and outside of the
fenced area. December 2010.

36
Outside the fenced area, increased annual plant growth has occurred but what litter is being
produced on the site is failing to be captured and retained (ie blown away) – nb not functioning.
There was a slight decrease in stability and infiltration indices inside the fenced area. The site is
actively eroding where there is no lag or plant cover.
Failure to increase in stability function both outside and inside the fenced area suggests that grazing
pressure is no longer a driving force of degradation within the fenced area, nor is water a limiting
resource. It is likely this ecosystem has gone through a significant “tip” in function – in this instance
this is likely to be the significant scalding of the earth by salt and compaction and loss of topsoil that
renders the substrate incapable of substantial growth. No new annual species were recorded
outside or inside the fenced area.
There was an increase in nutrient cycling within the Wurldunda fenced area since 2009 - attributable
to the samphires, although samphires did not seem to be actively growing or spreading on the site.
The soil under each samphire shrub was in an improved state – evidence of nutrient cycling and
stability, dark moist non-crusted soils – compared to surrounding areas which are actively eroding.
It is recommended that active rehabilitation takes place on Wurldunda Soak as it is a significant site
on Angas Downs and not improving (Couch grass invasion has also occurred toward the North of the
fenced area.)
Photo of soils found under
samphires at Wurldunda.

37
Above and Below: active erosion occurring along the LFA transect within the fenced area at
Wurldunda.
3.7.3 Mulga LFA
Only one mulga site assessed in 2009 was reassessed for LFA in 2010 Centenary Mulga (cattle
paddock) (Figure 31). There was an improvement in all indices.
Patch Area was similar between the two years, the increase in LFA indices being attributed to
increased perennial and litter cover within existing patches. It is expected that nutrient cycling lags
behind stability and infiltration increases (pers comm. D. Tongway, ANU), especially in dry hot
environments such as at Angas Downs as the breakdown and assimilation of litter is slow.
Three new sites were assessed in 2010. The highest LFA indices were obtained from the Mulga
within the sanctuary despite being close to a water source (Armstrong’s Dam). As the feral proof
fence is yet to be completed around the outside of the sanctuary, it is too early to tell whether
existing feral management has contributed to the better functioning of the landscape at this site
(opportunistic ground shooting). Feral animals (horses) and cattle were observed within 800 meters
of this site in December 2010. Feral animals also occur in the unfenced Mulga assessed and cattle
grazing occurs of the Cattle and Centenary Mulga LFA points. Further analysis and data collection in
subsequent years is essential to assess the benefit of feral management on biodiversity and
landscape health.

38
Figure 31 Mulga LFA results 2009 & 2010
3.7.4 Calcrete / Calcrete Sand / Gypcrete
Four calcrete / Calcrete Sand / Gypcrete LFA sites assessed in 2009 were re-assessed in 2010 (Figure
32). In most cases there was an increase in all three LFA indices – stability, infiltration and nutrient
cycling associated with above average rainfall and increased plant growth.
The LFA site at Armstrong’s Dam was moved from the previous 2009 site due to being too close to a
graded road. The new site was located approximately 20m away. The results are shown here as a
comparison but any differences in indices will be taken lightly in 2010.
Five new Calcrete LFA sites and two “other” similar sites were set up in 2010. Results are shown in
Figure 33-Figure 34.
0
10
20
30
40
50
60
70
Sanctuary Mulga
'10
Unfenced Mulga
'10
Cattle Paddock
Mulga '10
Centenary Mulga
'09
Centenary Mulga
'10
LFA
In
de
x (
0-1
00
%)
Mulga Stability
Infiltration
Nutrients

39
Figure 32 Grasslands/low shrublands over calcrete/gypcrete/sandy calcrete LFA results 2009 & 2010
Figure 33 Calcrete LFA results December 2010
When comparing Armstrong’s, Fighting Camp and Boxwood Bore Sand-Calcrete LFA sites (Figure 34)
all three are similar in vegetation and proximity to water. The sites outside of the cattle area appear
0
10
20
30
40
50
60
70LF
A I
nd
ex
%2009-10 grasslands/low shrubland Stability
Infiltration
Nutrients
0
10
20
30
40
50
60
Boxwood calcrete
'10
Calcrete rabbits
cattle paddock '10
Calcrete rabbits
unfenced '10
Centenary
grassland '10
Wilbia calcrete '10
Cattle Cattle Unfenced Cattle Sanctuary
LFA
In
de
x %
Calcrete 2010Stability
Infiltration
Nutrients
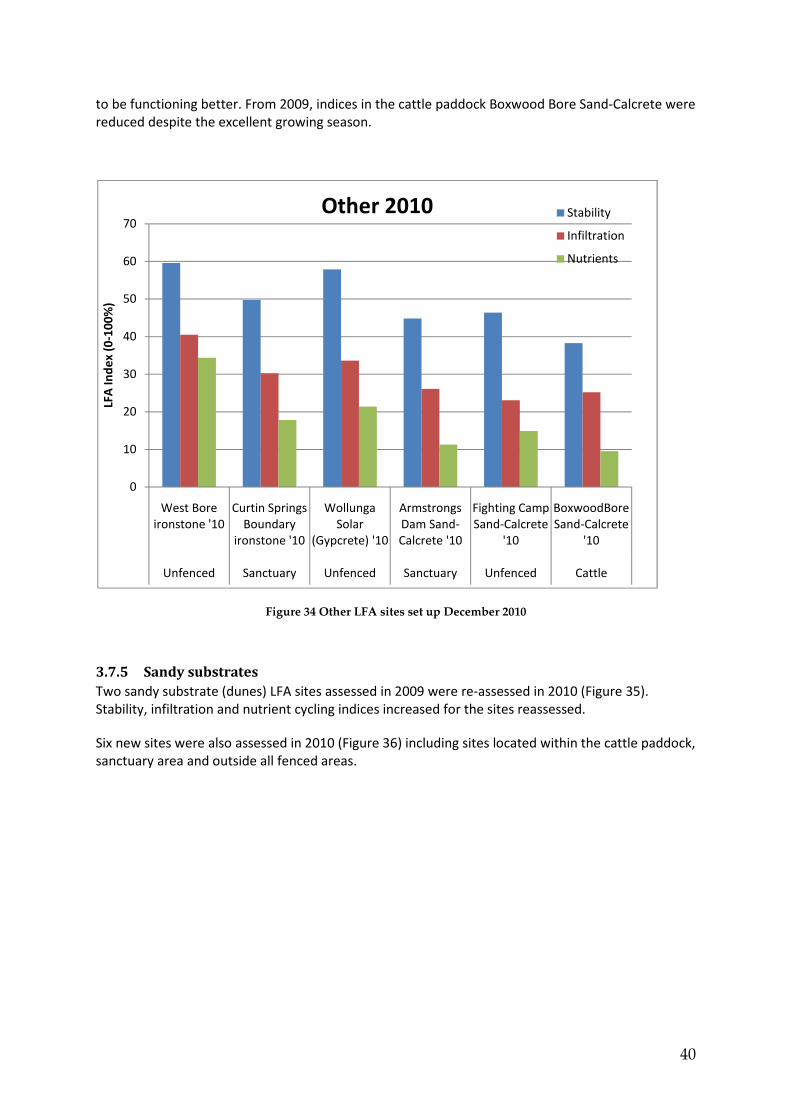
40
to be functioning better. From 2009, indices in the cattle paddock Boxwood Bore Sand-Calcrete were
reduced despite the excellent growing season.
Figure 34 Other LFA sites set up December 2010
3.7.5 Sandy substrates
Two sandy substrate (dunes) LFA sites assessed in 2009 were re-assessed in 2010 (Figure 35).
Stability, infiltration and nutrient cycling indices increased for the sites reassessed.
Six new sites were also assessed in 2010 (Figure 36) including sites located within the cattle paddock,
sanctuary area and outside all fenced areas.
0
10
20
30
40
50
60
70
West Bore
ironstone '10
Curtin Springs
Boundary
ironstone '10
Wollunga
Solar
(Gypcrete) '10
Armstrongs
Dam Sand-
Calcrete '10
Fighting Camp
Sand-Calcrete
'10
BoxwoodBore
Sand-Calcrete
'10
Unfenced Sanctuary Unfenced Sanctuary Unfenced Cattle
LFA
In
de
x (
0-1
00
%)
Other 2010 Stability
Infiltration
Nutrients

41
Figure 35 Sandy substrates LFA results 2009 & 2010
Figure 36 Sandy substrates LFA results December 2010
3.7.6 Patch Area index
0
10
20
30
40
50
60
Bloodwoods '09 Bloodwoods '10 Eagles Nest '09 Eagles Nest '10
LFA
In
de
x (
0-1
00
%)
Sand 2009 + 2010
Stability
Infiltration
Nutrients
0
10
20
30
40
50
60
Eagles Nest
'10
Boxwood
gate sand '10
Bloodwoods
'10
Spinifex CS
boundary '10
Sand dune
Unfenced'10
Desert Oaks
'10
PKK burnt
'10
Old Spinifex
'10
Cattle Cattle Sanctuary Sanctuary Unfenced Unfenced Unfenced Unfenced
LFA
In
de
x %
All Sand 2010
Stability
Infiltration
Nutrients
42
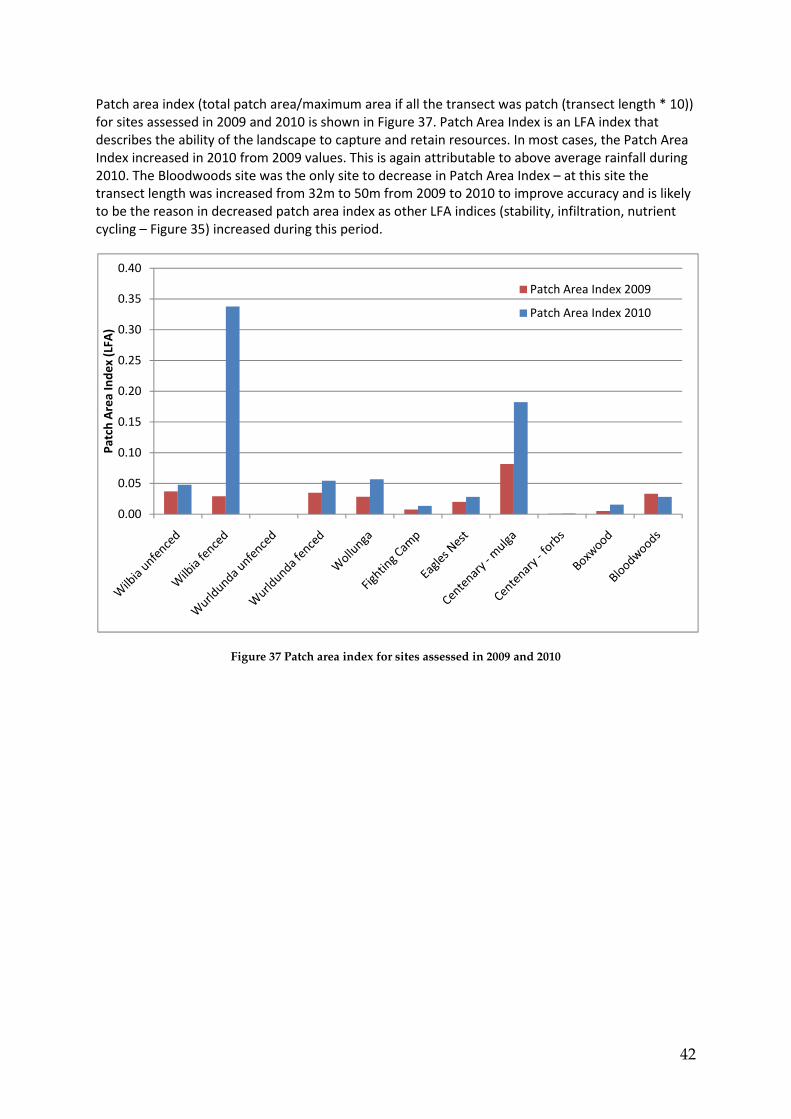
Patch area index (total patch area/maximum area if all the transect was patch (transect length * 10))
for sites assessed in 2009 and 2010 is shown in Figure 37. Patch Area Index is an LFA index that
describes the ability of the landscape to capture and retain resources. In most cases, the Patch Area
Index increased in 2010 from 2009 values. This is again attributable to above average rainfall during
2010. The Bloodwoods site was the only site to decrease in Patch Area Index – at this site the
transect length was increased from 32m to 50m from 2009 to 2010 to improve accuracy and is likely
to be the reason in decreased patch area index as other LFA indices (stability, infiltration, nutrient
cycling – Figure 35) increased during this period.
Figure 37 Patch area index for sites assessed in 2009 and 2010
0.00
0.05
0.10
0.15
0.20
0.25
0.30
0.35
0.40
Pa
tch
Are
a I
nd
ex
(LF
A)
Patch Area Index 2009
Patch Area Index 2010

43
3.8 Mapping of cultural sites
There is ongoing mapping of cultural sites on Angas Downs IPA using a combination of Ranger
Cybertracker surveys and photographic/voice/video records (Figure 38). Elders from the Imanpa
community have been recorded telling stories about the land. Photo and video files will be entered
into the Ara Irititja Anangu cultural database at Imanpa, a purpose-built computer archive that
digitally stores repatriated materials and other contemporary items. During December 2010, nine
disks of video footage and photographs were delivered to the Ara Irititja cultural database. These
will be uploaded in 2011.
Angas Downs holds places of significant Indigenous heritage important to the members of the
Imanpa community and wider Anangu. Places that hold great meaning and significance to
Indigenous people include:
• places associated with ‘Dreaming’ stories depicting the laws of the land
• places that are associated with their spirituality
• places where other cultures came into contact with Indigenous people (Angas Downs
Homestead, Old Liddle Homestead)
• places that are significant for more contemporary uses.
There are to date two registered sites, five recorded sites and restricted works areas on Angas
Downs recorded under the Northern Territory Aboriginal Sacred Sites Act 1989. The reason for
significance is not revealed under the Act. Locations are shown on Map 1. There are two sites of
Bioregional Botanical Significance on Angas Downs including the Kernot Range.
However, during routine inspections of an important site in August 2010, Puna Kura Kura (see Map
2), Anangu rangers and Australian Wildlife Services staff found previously unrecorded paintings and
engravings (unrecorded by Piranpa and unknown to the Anangu rangers).
It is likely that there are many sites that have not been located, documented or listed as Indigenous
Heritage places including important waterholes, caves, rock engraving and paintings. The
significance of these sites is unknown and will remain unknown without further research and
specialist input. A proposal to the Indigenous Heritage Program was submitted in 2011 for support
to document new and existing sites by information gathering from other communities, and
engaging an anthropologist and rock art specialists.
To locate and document these is important to the Anangu and Lisanote Board.

44
Puna Kura Kura previous unrecorded paintings
Puna Kura Kura previous unrecorded engravings
Possible “cupules” at Puna Kura Kura

45
Figure 38 Ongoing mapping of Angas Downs Cultural and historic sites
46
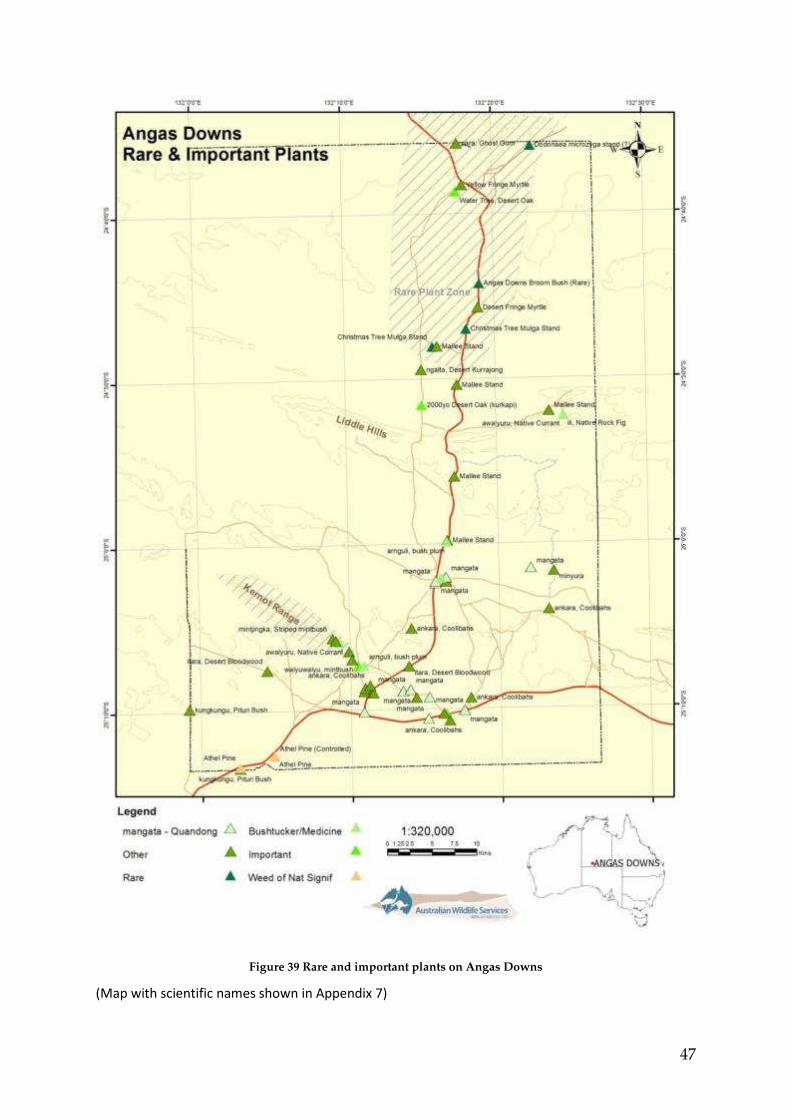
3.9 Mapping of important and rare plants
Plant surveys were conducted property wide (but almost always close to vehicle access) during
2010-11.
There is ongoing mapping of rare and important plants on Angas Downs IPA using a combination of
Ranger Cybertracker surveys (GPS) and photographic records. Important plants include Quandongs
(Santalum acuminatum), Christmas Tree Mulga (Acacia aneura var. conifera) and Angas Downs
Broom Bush (Microcorys macrediana) (shown in Figure 39).
The Angas Downs plant species list is shown in Appendix 2.
Plant species highlights include:
Scientific Pitjantjatjara Common Name
Acacia aneura var conifera Christmas Tree Mulga Stand
Acacia oswaldii wilpiya Wilpiya/water bush
Acacia minyura
Gilesia biniflora (NT) Western Tarvine
Brachychiton gregorii ngalta Desert Kurrajong
Calytrix carinata Desert Fringe Myrtle
Eremophila gibsonii, E. Gibsonii,
E. Goodwinii, E. willsii
Eremophila sp
Erythrina vespertilio ininti Bean Tree
Euphorbia tannensis subsp.
eremophila
Desert Spurge
Ficus platypoda ili Native Rock Fig
Grevillea striata iltilpa beefwood
Hibiscus sturtii var grandiflorus Sturt’s Hibiscus
Microcorys macrediana Angas Downs Broom Bush
Micromyrtus flaviflora Yellow Fringe Myrtle
Petalostylis cassioides Butterfly Bush
Prostanthera sericea walyuwalyu mintbush
Prostanthera stratifolia mintjingka Striped /striated mintbush
Psydrax latifolia awalyuru Native Currant
Santalum acuminatum (VU) mangata Quandong
Santalum lanceolatum arnguli Bush plum
Teucrium racemosum Grey Germander Zygophyllum ovatum (NT) maltantu Dwarf Twinleaf
(NT) Near Threatened (VU) Vulnerable in the Northern Territory
47
Figure 39 Rare and important plants on Angas Downs
(Map with scientific names shown in Appendix 7)

48
3.10 Fire risk and management
(This following section has acknowledgements to Grant Allan, Bushfires NT.)
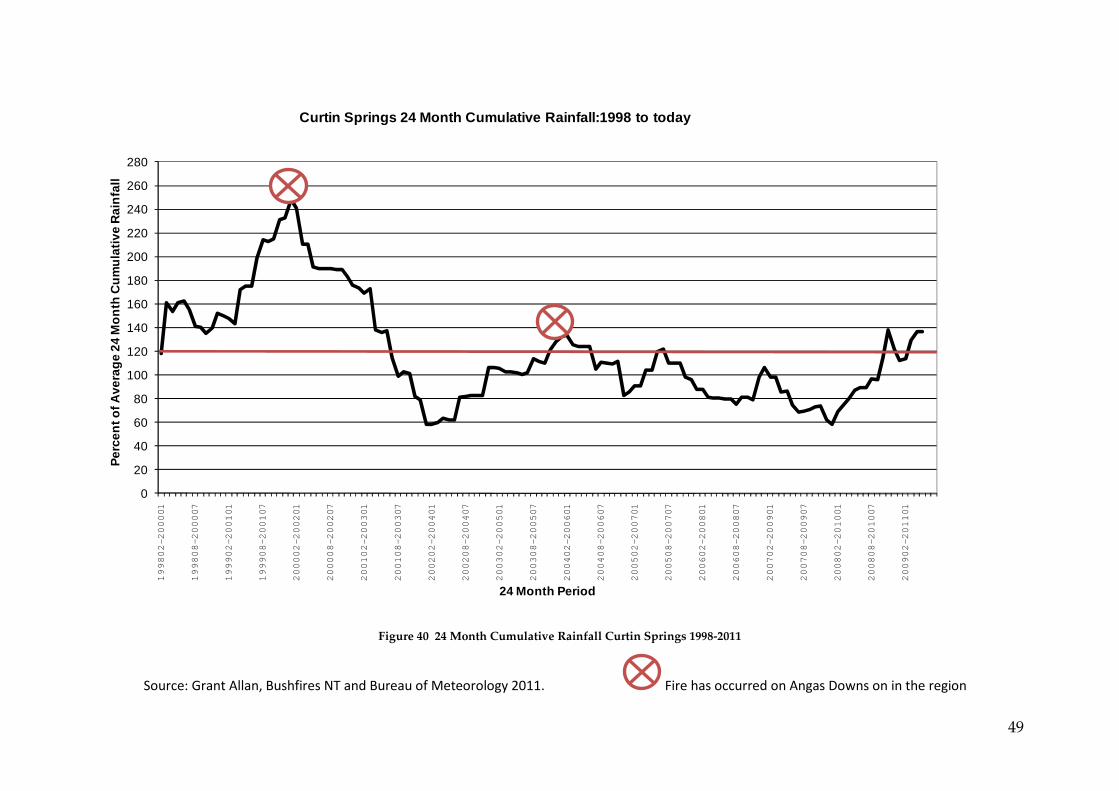
Large uncontrolled wildfires in central Australia in the past 15-25 years have occurred after heavy
rainfall. In order to predict high fire risk, rainfall fall can be assessed as a percentage of 24 months of
accumulated rainfall. Bushfire researchers suggest that if rainfall is above the 120th
percentile of
rainfall over the past two years, it is likely there is enough fuel in the landscape for widespread fires
to burn uncontrolled (this is without implementing burning strategies to reduce fuel loads and
increase landscape mosaic). Rainfall below this level is less likely to result in enough fuel for large
wildfires, however, there is still risk of large fires occurring if the conditions are right.
Rainfall descriptions are as follows: below average – less than 80% of expected rainfall received in
the preceding 2 years; average between 80-120% of expected rainfall received in the preceding 2
years and above average – greater than 120% of expected rainfall received in the preceding two
years.
As at March 2011, rainfall over Angas Downs sits at the 136th
+ percentile for 24 months of
accumulated rainfall (see Figure 40). Therefore risk of fire occurring on Angas Downs is extreme.
Visual inspections of fuel loads have confirmed Fuel States 3-4 over the majority of the country. With
the cooler winter months approaching, it is the perfect time for the Angas Downs Rangers to start
burning to reduce the risk of fire in following seasons. In December 2010, the rangers did two trial
burns. These were tracked using Landsat imagery (Figure 41-43). Despite green wet conditions, the
burn which was lit from a 700 m line, 40 ha of patchy burn occurred. The fire did not spread into the
Liddle Hills.
Another burn was lit from the Sanctuary access road near the proposed Bloodwood Bore site. The
fire did not burn a sufficient area to register on Landsat Imagery (30x30m resolution).
For more information see:
Australian Wildlife Services (2010b) Angas Downs Fire Management Plan 2010-2015 (draft). Angas
Downs Indigenous Protected Area. A report to Lisanote Pty Ltd compiled by AWS, 2010.
49
Figure 40 24 Month Cumulative Rainfall Curtin Springs 1998-2011
Source: Grant Allan, Bushfires NT and Bureau of Meteorology 2011. Fire has occurred on Angas Downs on in the region
0
20
40
60
80
100
120
140
160
180
200
220
240
260
280199802-200001
199808-200007
199902-200101
199908-200107
200002-200201
200008-200207
200102-200301
200108-200307
200202-200401
200208-200407
200302-200501
200308-200507
200402-200601
200408-200607
200502-200701
200508-200707
200602-200801
200608-200807
200702-200901
200708-200907
200802-201001
200808-201007
200902-201101
Per
cen
t of A
vera
ge
24 M
on
th C
um
ula
tive
Rai
nfa
ll
24 Month Period
Curtin Springs 24 Month Cumulative Rainfall:1998 to today

50
(A)
(B)
(C)
Figure 41 Before and after burning occurred at the junction of Luritja Road and Puna Kura Kura Track,
December 2010. (A) October 2010 (B) January 2011 (C) April 2011 showing post fire growth (Landsat Band
Composit using Bands 7,4,2).

51
Figure 42 Senior Ranger David Wongway lighting small patch burn at the junction of Luritja Road and Puna
Kura Kura Track, December 2010
Figure 43 Cool burns protect fire senitive mulga, increases landscape patchiness and reduces fuel loads.

52
4. References
Australian Wildlife Services 2010a. ANGAS DOWNS IPA AERIAL SURVEY JUNE 2010 - POPULATIONS
OF KANGAROOS, CAMELS, HORSES, CATTLE & EMUS. A report to Lisanote Pty Ltd by Australian
Wildlife Services. Canberra.
Australian Wildlife Services 2010b. Angas Downs Fire Management Plan 2010-2015 (draft). Angas
Downs Indigenous Protected Area. . A report to Lisanote Pty Ltd compiled by AWS, 2010.
Caughley, G., Sinclair, R. and Scott-Kemmis, D. 1976. Experiments in aerial survey. Journal of
Wildlife Management 40: 290-300.
Munn, A.J., Dawson, T.J., McLeod, S.R., Croft, D.B., Thompson, M.B. and Dickman, C.R. 2009. Field
metabolic rate and water turnover of red kangaroos and sheep in an arid rangeland: an empirically
derived dry-sheep-equivalent for kangaroos. Australian Journal of Zoology 57(1): 23–28.
Southgate, R. and Moseby, K. 2008. Track-based monitoring for the deserts and rangelands of
Australia. A report for the Threatened Species Network at WWF Australia Envisage Environmental
Services.
Tongway, D.J. and Hindley, N.L. 2004. Landscape Function Analysis: Procedures for monitoring and
assessing landscapes. CSIRO Sustainable Ecosytems, Canberra.
Wilson, G., Pickering, M. and Kay, G. 2005. Angas Downs Indigenous Protected Area Plan of
Management. Australian Wildlife Services. Canberra.
53
Appendix 1 Reptile and small mammal surveys site information Site No. Date
Set
Vegetation Sub-
strate
no of
buckets +
funnels
Birds observed Notes
Trap 1
Dump
2/10/10 Sparse mixed
acacia shrubland
over spinifex
Sand 4 funnels,
3 buckets
yellow plumed
honeyeater, pallid
cuckoo, rufous
songlark, zebra
finches
mouse tracks up
fence
Trap 2 Tims
Hill
2/10/10 Low Mulga,
Witchetty,
Eremophila
shrubland over
mulga grass
Rocky 4 funnels spiny-cheeked
honeyeater, yellow
plumed honeyeater, 2
white browed
babbler, singing
honeyeater, crow
Trap 3
Spinifex
fence
2/10/10 Spinifex
grassland
Sand 4 funnels rufous songlark, white
winged trillers
Trap 3
Spinifex
fence
4/10/10 Spinifex
grassland
Sand 3 buckets,
4 funnels
red capped robin
Trap 4
Mulga
fence
2/10/10 Sparse mixed
acacia shrubland
Sand 4 funnels pallid cuckoo, singing
honeyeater,
ringnecks, rufous
songlark, black faced
woodswallow, red
backed kingfisher,
zebra finches
Fresh goanna hole,
Spiders, stick
insect, mouse
tracks up the
fence, beetles
Trap 5
Eastern
Boundary
Rocky
4/10/10 Low sparse shrub
grassland (next
to rocky outcrop)
rocky
sand
4 funnels crested bell bird,
songlark
rocky outcrop
jump up next to 5-
10m, dog /fox
tracks present
Trap 6
Eastern
Boundary
sandy
4/10/10 Low sparse shrub
grassland
Sand 4 funnels,
1 bucket
songlark, common
bronzewing
Trap 7 Old
Spinifex
3/10/10 Old Spinifex,
sparse mulga
Sand 4 funnels,
3 buckets
close to calcrete
area, iron woods
nearby, old hard
spinifex, desert
heath myrtle
present
Trap 8 Old
Spinifex
3/10/10 Old Spinifex,
sparse mulga
Sand 5 funnels,
3 buckets
Witchetty bush
present
Liddle Hills
East
5/10/10 Old tall mulga
over grass
Sand 3 buckets 2 mistletoe birds, red
capped robin, rufous
whistler
1 bucket filled with
water to brim
after heavy rainfall
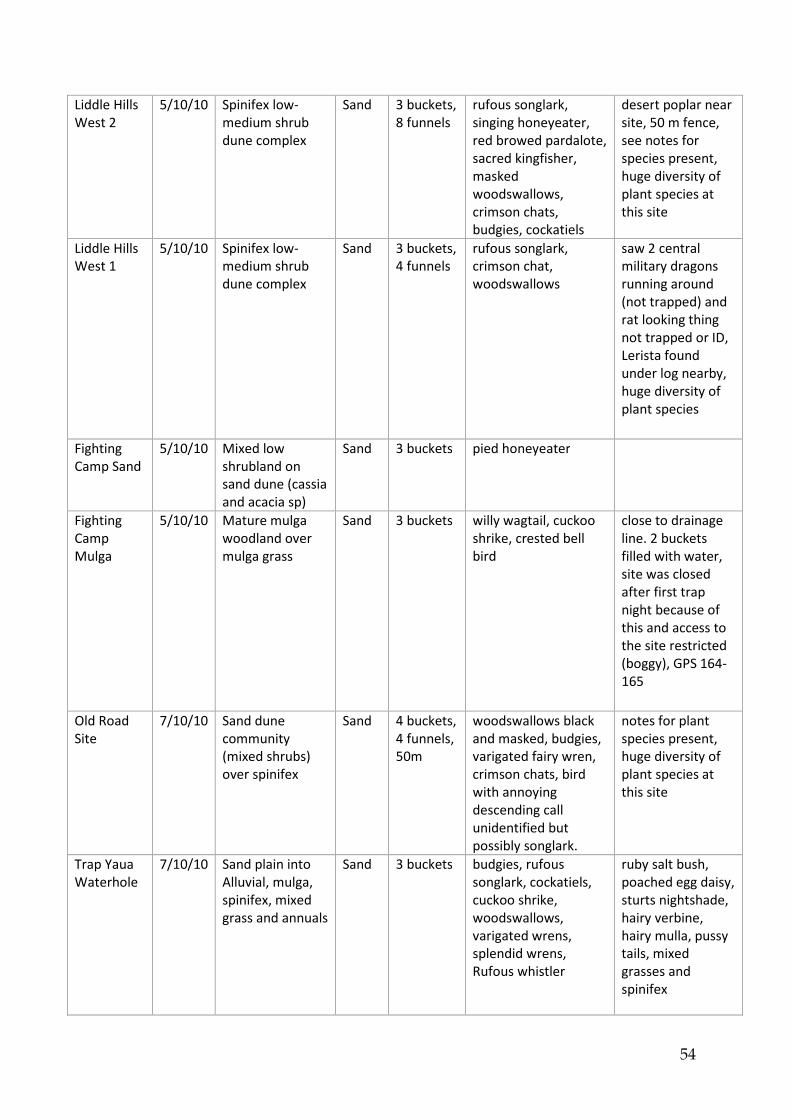
54
Liddle Hills
West 2
5/10/10 Spinifex low-
medium shrub
dune complex
Sand 3 buckets,
8 funnels
rufous songlark,
singing honeyeater,
red browed pardalote,
sacred kingfisher,
masked
woodswallows,
crimson chats,
budgies, cockatiels
desert poplar near
site, 50 m fence,
see notes for
species present,
huge diversity of
plant species at
this site
Liddle Hills
West 1
5/10/10 Spinifex low-
medium shrub
dune complex
Sand 3 buckets,
4 funnels
rufous songlark,
crimson chat,
woodswallows
saw 2 central
military dragons
running around
(not trapped) and
rat looking thing
not trapped or ID,
Lerista found
under log nearby,
huge diversity of
plant species
Fighting
Camp Sand
5/10/10 Mixed low
shrubland on
sand dune (cassia
and acacia sp)
Sand 3 buckets pied honeyeater
Fighting
Camp
Mulga
5/10/10 Mature mulga
woodland over
mulga grass
Sand 3 buckets willy wagtail, cuckoo
shrike, crested bell
bird
close to drainage
line. 2 buckets
filled with water,
site was closed
after first trap
night because of
this and access to
the site restricted
(boggy), GPS 164-
165
Old Road
Site
7/10/10 Sand dune
community
(mixed shrubs)
over spinifex
Sand 4 buckets,
4 funnels,
50m
woodswallows black
and masked, budgies,
varigated fairy wren,
crimson chats, bird
with annoying
descending call
unidentified but
possibly songlark.
notes for plant
species present,
huge diversity of
plant species at
this site
Trap Yaua
Waterhole
7/10/10 Sand plain into
Alluvial, mulga,
spinifex, mixed
grass and annuals
Sand 3 buckets budgies, rufous
songlark, cockatiels,
cuckoo shrike,
woodswallows,
varigated wrens,
splendid wrens,
Rufous whistler
ruby salt bush,
poached egg daisy,
sturts nightshade,
hairy verbine,
hairy mulla, pussy
tails, mixed
grasses and
spinifex

55
Desert Oak
Spinifex
7/10/10 Spinifex Desert
Oak Woodland
Sand 3 buckets,
6 funnels
masked
woodswallows,
beeeater, budgies
50m, felty bell
flower, honey
suckle grevillea,
waxy wattle,
broombush?
Dune back
of Tim’
camps
9/03/11 Sand dune heath
over spinifex.
Mulga also
present – sparse.
Sand 3 buckets (vicinity) see bird
survey done: hooded
robin, willy wagtail,
splendid wrens, white
winged wren, red-
capped robin, white-
browed treecreeper,
zebra finch, thornbills,
budgies, spiny
honeyeater, little
button quail, common
bronzewing, rufous
whistler, rufous
songlark, masked
woodswallow, crested
bellbird, sacred
kingfisher, singing
honeyeater, black-
faced woodswallow
(inc juv), red chats,
mulga parrots
(nesting), triller,
white-plumbed
honeyeater, white-
fronted honeyeater,
yellow rumped
thornbill, pallid
cuckoo juv, brown
falcons, 1 collared
goshawk
2 blue tailed
ctenotus nearby in
spinifex - photos
and video

56
Appendix 2 Reptile and mammal survey results
Reptiles observed 2010-11 Common name
Amphibolurus longirostris Long-nosed Dragon (Ta-Ta)
Cryptoblepharus plagiocephalus ...skink
Ctenophorus isolepis Central Military Dragon
Ctenophorus nuchalis Central netted dragon
Ctenophorus reticulatus Western netted Dragon
Ctenotus brooksi
Ctenotus calurus Blue-tailed Ctenotus
Ctenotus dux Narrow-lined Ctenotus
Ctenotus helenae Clay-soil ctenotus
Ctenotus leonhardii Leonhard’s Ctenotus
Ctenotus pantherinus ocellifer Leopard Ctenotus
Ctenotus piankai ...skink
Ctenotus quattuordecimlineatus 14-lined skink
Ctenotus schomburgkii Barred Wedged Snout Ctenotus
Delma nasuta ...legless lizard
Demansia psammophis Yellow Faced Whip Snake
Diplodactylus conspicillatus Fat-tailed gecko
Egernia inornata Desert Skink
Gehyra variegata Varigated Gecko
Heteronotia binoei Bynoe's gecko
Lerista bipes Two-toed Lerista
Menetia greyii Common dwarf skink
Moloch horridus Thorny Devil
Morethia ruficauda Fire-tailed skink
Nephrurus levis levis Smooth Knobtail Gecko
Nuphrurus laevissimus Pale Knob-tailed Gecko
Pseudechis australis King Brown Snake
Pseudonaja nuchalis Western Brown Snake
Pseudonaja modesta Ringed Brown Snake
Pygopus nigriceps Western Hooded Scaly-foot
Ramphotyphlops endoterus Interior Blind Snake
Rhynchoedura ornata Beaked Gecko
Simoselaps anamolous Desert Banded Snake
Simoselaps bertholdi Jan's banded snake
Strophurus ciliaris Northern Spiny-tailed gecko
Suta punctata Little Spotted Snake
Tiliqua multifasciata Centralian Blue Tounge
Varanus eremius Pygmy Desert Monitor
Varanus gouldii Gould's Goanna
Varanus giganteus Perentie
40 confirmed reptiles (10 other species proposed to reside on Angas Downs not
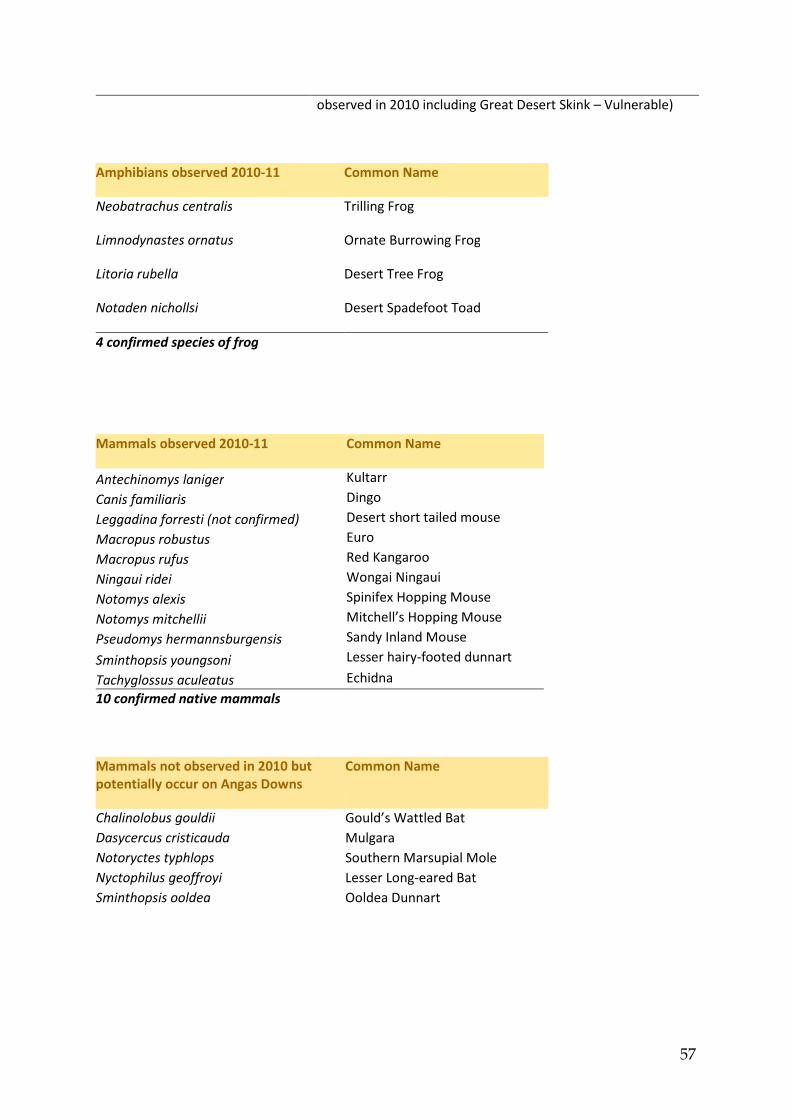
57
observed in 2010 including Great Desert Skink – Vulnerable)
Amphibians observed 2010-11 Common Name
Neobatrachus centralis Trilling Frog
Limnodynastes ornatus Ornate Burrowing Frog
Litoria rubella Desert Tree Frog
Notaden nichollsi Desert Spadefoot Toad
4 confirmed species of frog
Mammals observed 2010-11 Common Name
Antechinomys laniger Kultarr
Canis familiaris Dingo
Leggadina forresti (not confirmed) Desert short tailed mouse
Macropus robustus Euro
Macropus rufus Red Kangaroo
Ningaui ridei Wongai Ningaui
Notomys alexis Spinifex Hopping Mouse
Notomys mitchellii Mitchell’s Hopping Mouse
Pseudomys hermannsburgensis Sandy Inland Mouse
Sminthopsis youngsoni Lesser hairy-footed dunnart
Tachyglossus aculeatus Echidna
10 confirmed native mammals
Mammals not observed in 2010 but
potentially occur on Angas Downs
Common Name
Chalinolobus gouldii Gould’s Wattled Bat
Dasycercus cristicauda Mulgara
Notoryctes typhlops Southern Marsupial Mole
Nyctophilus geoffroyi Lesser Long-eared Bat
Sminthopsis ooldea Ooldea Dunnart

58
Introduced Species Common Name
Bos taurus Cattle
Camelus dromedarius Camel
Equus caballus Horse
Felis catus Cat
Mus musculus House Mouse
Oryctolagus cuniculus Rabbit
Vulpes vulpes Fox

59
Appendix 3 Angas Downs plant checklist
See attachment 1.

60
Appendix 4 Angas Downs bird survey results and checklist
ODER FAMILY COMMON NAME SPECIES
COUNT
- 2011
OBS
2010
STRUTHIONIFORMES Dromaiidae Emu Dromaius
novaehollandiae 1 yes
ANSERIFORMES Anatidae Pacific Black Duck Anas superciliosa
yes
Hardhead Aythya australis
yes
Wood Duck Chenonetta jubata
yes
Pink-eared Duck Malacorhychus
membranaceus
PODICIPEDIFORMES Podicipedidae Hoary-headed grebe Poliocephalus
poliocephalus
yes
FALCONIFORMES Accipitridae Collared Sparrowhawk Accipiter cirrhocephalus 1
Brown Goshawk Accipiter fasciatus
Wedge-tailed Eagle Aquila audax 3 yes
Black-shouldered Kite Elanus axillaris 2
Whistling Kite Haliastur sphenurus 1 yes
Black-breasted Buzzard Hamirostra
melanosternum 1 yes
Little Eagle Hieraaetus morphnoides 1 yes
Black Kite Milvus migrans 3 yes
Falconidae Spotted Harrier Circus assimilis 1
Brown Falcon Falco beridora 7 yes
Nankeen Kestrel Falco cenchroides 3 yes
Australian Hobby
(Hawk) Falco longipennis
yes
Peregrine Falcon Falco peregrinus
CHARADRIIFORMES Charadriidae Inland Dotterel Charadrius australis
Banded Lapwing Vanellus tricolor 2 yes
Black Fronted Dotterel Elseyornis melanops 1 yes
CICONIIFORMES
Ardeidae White-faced Heron
Egretta novaehollandiae
yes
Nankeen Night Heron Nycticorax caledonicus
yes
TURNICIFORMES Turnicidae Little Button-quail Turnix velox 6 yes
GRUIFORMES Otididae Australian Bustard Ardeotis australis 5 yes
Black-tailed Native-hen Gallinula ventralis
yes
CHARADRIIFORMES Burhinidae Bush Stone Curlew Burhinus grallarius
COLUMBIFORMES Columbidae Common Bronzewing Phaps chalcoptera 5 yes
Crested Pigeon Ocyphaps lophotes 23 yes
Diamond Dove Geopelia cuneata 20 yes
Peaceful Dove Geopelia placida
PSITTACIFORMES Cactuidae Major Mitchell’s
Cockatoo Cacatua leadbeateri 28 yes
Galah Cacatua roseicapilla 35 yes
Psittacidae Cockatiel Nymphicus hollandicus 20 yes
Mulga Parrot Psephotus varius 12 yes
Australian Ringneck Barnadius zonarius 10 yes
Bourke’s Parrot Neopsephotus bourkii 16 yes
Budgerigar Melopsittacus undulatus 50 yes
Night Parrots Pezoporus occidentalis
yes

61
ODER FAMILY COMMON NAME SPECIES
COUNT
- 2011
OBS
2010
Princess Parrot
CUCULIFORMES Cuculidae Pallid Cuckoo Cuculus pallidus 1 yes
Black-eared cuckoo Chrysococcyx osculans
Horsfield’s Bronze-
Cuckoo Chrysococcyx basalis
STRIGIFORMES Strigidae Southern Boobook Ninox novaeseelandiae 1 yes
Tytonidae Barn Owl Tyto alba
Aegothelidae Australian Owlet-
nightjar Aegotheles cristatus
yes
Caprimulgidae Spotted Nightjar Eurostopodus argus
Podargidae Tawny Frogmouth Podargus strigoides 1
CORACIIFORMES Halcyonidae Red-backed Kingfisher Todiramphus sanctus
yes
Sacred Kingfisher Todiramphus sanctus 1 yes
Meropidae Rainbow Bee-eater Merops ornatus
yes
PASSERIFORMES Maluridae Splendid Fairy-wren Malurus splendens 12 yes
Variegated Fairy-wren Malurus lamberti
yes
White-winged Fairy-
wren Malurus leucopterus 1
Dusky Grasswren Amytornis purnelli
Striated Grasswren Amytornis striatus
Pardalotidae Red-browed Pardalote Pardalotus rubricatus
yes
Striated Pardalote Pardalotus striatus
Neosittidae
Varied Sittella
Daphoenositta
chrysoptera 8
Climactreidae White-browed
Treecreeper Climacteris affinis 2
Acanthizidae Weebill Smicrornis brevirostris
yes
Western Gerygone Gerygone fusca 2
Inland Thornbill Acanthiza apicalis 1
Chestnut-rumped
Thornbill Acanthiza uropygialis
Yellow-rumped
Thornbill Acanthiza chrysorrhoa 4 yes
Banded Whiteface Aphelocephala
nigricincta
yes
Southern Whiteface Aphelocephalla leucopsis 5
Slatey-backed Thornbill Acanthiza robustirostis
Meliphagidae Spiny-cheeked
Honeyeater
Acanthagenys
rufogalaris 10 yes
Yellow-throated Miner Manorina flavigula 6 yes
Singing Honeyeater Lichenostomus virescens 10 yes
Grey-headed
Honeyeater
Lichenostomus
keartlandi
Grey-fronted
Honeyeater Lichenostomus plumulus
yes
White-plumed
Honeyeater
Lichenostomus
penicillatus 12 yes
Black Honeyeater Certhionyx niger

62
ODER FAMILY COMMON NAME SPECIES
COUNT
- 2011
OBS
2010
Pied Honeyeater Certhionyx variegatus
yes
White- fronted
Honeyeater Phylidonyris albifrons 2
Grey Honeyeater Conopophila whitei
Crimson chat Epthianura tricolor 24 yes
Petroicidae Jacky Winter Microeca fascinans
Hooded Robin Melanodryas cucullata 4 yes
Red-capped Robin Petroica goodenovii 10 yes
Pomatostomidae Grey-crowned Babbler Pomatostomus
temporalis
White-browed Babbler Pomatostomus
superciliosus
yes
Muscicapidae Crested Bellbird Oreoica gutturalis 11
Grey Shrike-thrush Colluricincla harmonica
Rufous Whistler Pachycephala rufiventris 21 yes
Ptilonorhyn-
chidaeb
Western Bowerbird
Chlamydera guttata
yes
Dicruridae Magpie- lark Grallina cyanoleuca 2 yes
Grey Fantail Rhipidura fuliginosa 1 yes
Willy Wagtail Rhipidura leucophrys 10 yes
Orthonychildae Chiming Wedgebill Psophodes cristatus 10 yes
Cinnamon Quail-thrush Cinclosoma
cinnamomeum
yes
Campephagidae Black-faced Cuckoo-
shrike
Coracina
novaehollandiae 1 yes
Ground Cuckoo-shrike Coracina maxima
White-winged Triller Lalage sueurii 2 yes
Artamidae White-browed
Woodswallow Artamus superciliosus
yes
Masked Woodswallow Artamus personatus 20 yes
Black-faced
Woodswallow Artamus cinereus 30 yes
Little Woodswallow Artamus minor
yes
Cracticidae Grey Butcherbird Cracticus torquatus
yes
Pied Butcherbird Cracticus nigrogularis 1 yes
Australian Magpie Gymnorhina tibicen 6 yes
Corvidae Little Crow Corvus bennetti 20 yes
Torresian Crow Corvus orru
yes
Motacillidae Richard’s Pipit Anthus novaeseelandiae 1 yes
Passeridae Zebra finch Taeniopygia guttata 1000s yes
Dicaeidae Mistletoebird Dicaeum hirundinaceum
yes
Hirundinidae White-backed Swallow Cheramoeca
leucosternus
Tree Martin Hirundo nigricans
Welcome Swallow
6 yes
Sylviidae Rufous Songlark Cincloramphus mathewsi 11 yes
Brown Songlark Cincloramphus cruralis 4 yes
Number species observed 60 77
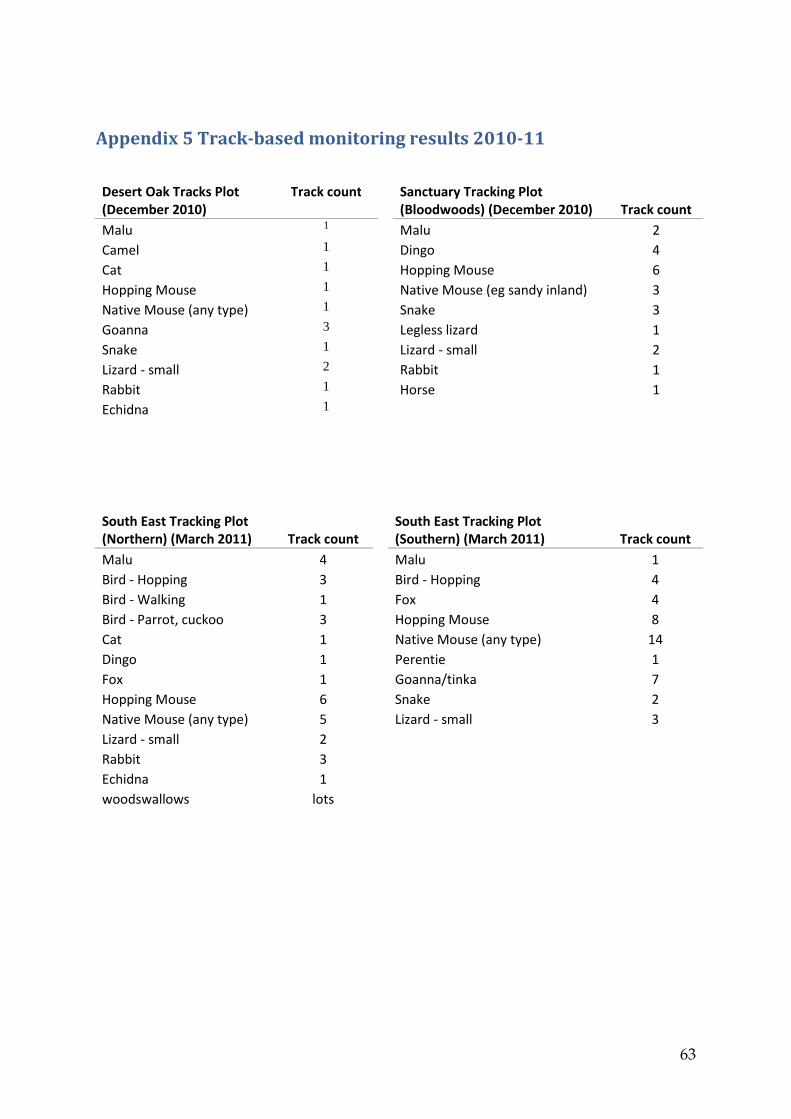
63
Appendix 5 Track-based monitoring results 2010-11
Desert Oak Tracks Plot
(December 2010)
Track count Sanctuary Tracking Plot
(Bloodwoods) (December 2010) Track count
Malu 1 Malu 2
Camel 1 Dingo 4
Cat 1 Hopping Mouse 6
Hopping Mouse 1 Native Mouse (eg sandy inland) 3
Native Mouse (any type) 1 Snake 3
Goanna 3 Legless lizard 1
Snake 1 Lizard - small 2
Lizard - small 2 Rabbit 1
Rabbit 1 Horse 1
Echidna 1
South East Tracking Plot
(Northern) (March 2011) Track count
South East Tracking Plot
(Southern) (March 2011) Track count
Malu 4 Malu 1
Bird - Hopping 3 Bird - Hopping 4
Bird - Walking 1 Fox 4
Bird - Parrot, cuckoo 3 Hopping Mouse 8
Cat 1 Native Mouse (any type) 14
Dingo 1 Perentie 1
Fox 1 Goanna/tinka 7
Hopping Mouse 6 Snake 2
Native Mouse (any type) 5 Lizard - small 3
Lizard - small 2
Rabbit 3
Echidna 1
woodswallows lots

64
Appendix 6 Angas Downs photo point report Online link Picasa web album:
https://picasaweb.google.com/101023482628629136878/AngasDownsIPAPhotoPts20092011?authk
ey=Gv1sRgCOjO67WJqPLNHg#

Appendix 7 Map of rare and important plants – scientific names (not attached)