f s r p ood ecurity esearch roject market …ageconsearch.umn.edu/bitstream/54476/2/wp_17.pdf ·...
TRANSCRIPT
FOOD SECURITY RESEARCH PROJECT MARKET ACCESS, TRADE & ENABLING
POLICIES (MATEP)PROGRAM
ZAMBIA HORTICULTURAL RAPIDAPPRAISAL: UNDERSTANDING THE
DOMESTIC VALUE CHAINS OF FRESH FRUITS AND VEGETABLES
By
Munguzwe Hichaambwa David Tschirley
WORKING PAPER No. 17 FOOD SECURITY RESEARCH PROJECT LUSAKA, ZAMBIA September 2006 (Downloadable at: http://www.aec.msu.edu/agecon/fs2/zambia/index.htm)

ACKNOWLEDGEMENTS We would like to thank Stanley Mushingwani of the Agricultural Market Information Center (AMIC) at Ministry of Agriculture and Cooperatives for research assistance; Michael T. Weber of Michigan State University Department of Agricultural Economics for helpful input throughout the process; Anthony Mwanaumo when, as Director of FSRP, he provided constant encouragement to both of us during the research; and to all the people – farmers, traders, supermarket managers, Freshpikt management, officials in City Council and Ministry of Local Government and Housing, and others who gave freely of their time and information to help us understand Zambia’s horticultural marketing system. We only hope we have done justice to the information they have given us; all errors are ours. Funding for this work came from USAID/Zambia mission through Market Access, Trade, and Enabling Policies (MATEP) Program.
Page ii
TABLE OF CONTENTS ACKNOWLEDGEMENTS.......................................................................................................ii LIST OF TABLES....................................................................................................................iv LIST OF FIGURES ...................................................................................................................v LIST OF ACRONYMS ............................................................................................................vi EXECUTIVE SUMMARY .....................................................................................................vii Section Page 1. BACKGROUND ...................................................................................................................1
1.2 Data and Methods ......................................................................................................2
1.2.1 Rural Survey..........................................................................................................2 1.2.2 Rapid Appraisal ....................................................................................................3
2. MARKETING OF FRESH PRODUCE BY SMALLHOLDER FARMERS .......................8
2.1 Geographical Distribution of Sales............................................................................8 2.2 Most Valuable Crops .................................................................................................9 2.3 Concentration of Sales .............................................................................................11
3. RAPID APPRAISAL RESULTS ........................................................................................14
3.1 Overview of Fresh Produce Wholesaling and Retailing in Lusaka and Ndola........14 3.2 Seasonality of Production and Marketing................................................................16 3.3 Large Farm Supply to Lusaka..................................................................................21 3.4 Assembly and Wholesaling......................................................................................23
3.4.1 Marketing Channels............................................................................................23 3.4.2 Fist Seller Characteristics ..................................................................................27
3.5 Retailing..................................................................................................................29 3.5.1 Overview: Main Retail Market Channels and Market Shares............................29 3.5.2 Supermarkets.......................................................................................................30 3.5.3 Types of open air retail markets .........................................................................31 3.5.4 Retail trader behavior.........................................................................................32
3.6 Consumer Behavior .................................................................................................37 3.7 Price Comparisons ...................................................................................................42
4. POLICY AND PROGRAM ISSUES ..............................................................45 ANNEX A. ESTIMATION OF FFV MARKET SHARE OF VARIOUS RETAIL
OUTLET TYPES.............................................................................................47 REFERENCES ........................................................................................................................49
Page iii
LIST OF TABLES Table Page Table 1. Attrition Rate in 2004 by Province, and Selected Characteristics during 2001 of
Entire Sample and Re-Interviewed........................................................................3 Table 2. Consumer Survey Sample Dis-aggregated by Gender ..........................................5 Table 3. Number of Interviews per FFV in the Marketeer Survey......................................6 Table 4. Number of First Sellers Interviewed by Gender....................................................6 Table 5. Relative Importance of Selected Income Shares by Province in 2004................10 Table 6. The Five Most Valuable FFV Crops Sales in Zambia and Areas Produced .......10 Table 7. Characteristics of Households by Horticultural Sales Category in 2004 ............13 Table 8. Selected Large Farms Supplying Markets in Lusaka With Fresh Produce as of
June 2006 .............................................................................................................22 Table 9. First Sellers’ Margins per Purchase/Sales Unit ...................................................29 Table 10. First Sellers’ Margins per Kg ..............................................................................29 Table 11. Basic Indicators on Retail Traders of Vegetable in Three Surveyed Markets.....33 Table 12. Reported Wastage of Vegetables by Retail Traders in Lusaka and Ndola..........33 Table 13. Procurement Locales by Retail Market in Lusaka and Ndola .............................34 Table 14. Gross Margin Analysis for Retail Traders of Main FFVs by Location,
September/October 2005 .....................................................................................35 Table 15. Economic Characteristics of Shoppers by Type of Retail Outlet ........................38 Table 16. Indicators of Shopping Habits, by Type of Retail Outlet in Which Shoppers
Were Interviewed In Lusaka and Ndola ..............................................................41
Page iv
LIST OF FIGURES Figure Page Figure 1. Percent of Smallholder Farm Households Selling FFV Crops in 2001 and 2004. 8 Figure 2. Percent Provincial Share of Total FFV Sales in 2001 and 2004 ...........................9 Figure 3. Percent of Farmers Selling FFV and Share of Total Sales by Sales Category in
2004 .....................................................................................................................12 Figure 4. Percent Farmers in the Highest Sales Category, by Province In 2004 ................12 Figure 5. Relative Share of Income from Selected Sources by Horticultural Sales Category
in 2004 .................................................................................................................13 Figure 6. Simplified Channel Map of Lusaka FFV System................................................15 Figure 7. Seasonality of Rape Supply in Lusaka and Ndola Markets (Source: First Seller
Interviews) ...........................................................................................................17 Figure 8. Seasonality of Tomato Supply in Lusaka and Ndola Markets (Source: First Seller
Interviews) ...........................................................................................................17 Figure 9. Seasonality of Cabbage Supply in Lusaka and Ndola Markets (Source: First
Seller Interviews).................................................................................................18 Figure 10. Seasonality of Dry Onion Supply in Lusaka and Ndola Markets (Source: First
Seller Interviews).................................................................................................18 Figure 11. Seasonality of Banana Supply in Lusaka and Ndola Markets (Source: First Seller
Interviews) ...........................................................................................................19 Figure 12. Seasonality of Orange Supply in Lusaka and Ndola Markets (Source: First Seller
Interviews) ...........................................................................................................19 Figure 13. Principal Geographic Origins of Fresh Produce Supply to Lusaka’s Soweto
Market and Ndola’s Main Masala Market...........................................................20 Figure 14. Frequency of Selling Through Brokers ...............................................................28 Figure 15. Comparative Analysis of Percent Retail Mark-Ups of Four Vegetables in
Markets of Lusaka and Ndola (September/October 2005) ..................................36 Figure 16. Weighted Average Gross % Mark-Ups at Retail in Three Markets Of Lusaka and
Ndola....................................................................................................................36 Figure 17. Two Key Income Indicators for Shoppers Emerging From Different Types of
Retail Outlets in Lusaka and Ndola, September/October 2006...........................39 Figure 18. Percent of Shoppers Who Most Commonly Purchase Fresh Produce in Open Air
Markets, by Type of Retail Outlet at Which They Were Interviewed in Lusaka and Ndola.............................................................................................................40
Figure 19. Average FFV Prices per Purchase Source in Lusaka ..........................................43
Page v
LIST OF ACRONYMS AMIC Agricultural Market Information Centre CBOs Community Based Organizations CSO Central Statistical Office DRC Democratic Republic of Congo EU European Union EUREPGAP Euro-Retailer Produce Working Group Good Agricultural Practices FFV Fresh Fruits and Vegetables FSRP Food Security Research Project GRZ Government of the Republic of Zambia HACCP Hazard Analysis and Critical Control LACCUN Lubulima Agricultural and Commercial Cooperative Union MACO Ministry of Agriculture and Cooperatives MATEP Market Access and Trade Enhancing Program MLGH Ministry of Local Government and Housing NGOs Non Governmental Organizations PROFIT Production, Finance and Technology Project RSA Republic of South Africa SEA Standard Enumeration Area UK United Kingdom UMDP Urban Markets Improvement Program UNIP United National Independence Party USAID United States Agency for International Development ZAMHORT Zambia Horticultural Products Limited
Page vi
EXECUTIVE SUMMARY Demand for horticultural products grows rapidly with urbanization and increased income. While worldwide demand for cereals increased by about 20% per capita since 1960, demand for fresh produce more than doubled. Yet Africa, alone among developing areas, saw per capita supply of fresh produce decline slightly over the same period. Zambia’s macroeconomic performance and the state of its infrastructure suggest that it has probably not escaped this trend. Reversing the trend will require concerted action throughout the supply chain, from farm to consumer, based on reliable information and on collaboration between the private and public sectors. The purpose of this paper is to begin generating the empirical information needed to launch a process of stakeholder consultation regarding the key challenges facing the country’s horticultural sector. The paper is based on (a) analysis of a national smallholder household survey, and (b) a rapid market appraisal in Lusaka and Ndola. Smallholder marketing of fresh produce: About 20% of smallholder farmers sold horticultural produce in 2004. Farmers in Copperbelt and Lusaka were the most likely to have sold, and these two provinces, along with Northwestern (due to new mining activity) lead in total supply to markets. Tomato, rape, and cabbage together account for about 75% of the value of sales from the smallholder sector; dry onion, okra, and eggplant each hold shares of 2%-3%. Banana predominates in fruit production, but is not among the top five overall; vegetable production value exceeds fruit by about five times. Horticultural sales are quite concentrated, with 20% of farmers – about 3% of the rural population – accounting for three-quarters of all sales. For the top 80% of sellers – 13% of the population -- horticulture is the most important source of cash income from agriculture, exceeding maize, cash crops such as cotton and tobacco, and livestock. Seasonality of Flows to Lusaka and Ndola: Seasonal patterns are broadly similar in Lusaka and Ndola, though peak supply tends to start and end one month earlier in Ndola; seasonal fluctuations in supply may also be a bit less than in Lusaka. Rape has a single peak in both cities, from May-October. Tomato, cabbage, and dry onion each show double peaks, first in April/May (January-May for onion), and again during August-October. Banana shows the least seasonal variation. Orange comes primarily from Zimbabwe and South Africa, with supply in Lusaka peaking in July-October (May-August in Ndola, when supplies from local production complement imports). Large Farms: We identified 10 large farms around Lusaka and interviewed the managers of six. Based on data from these managers, these farms supplied an annual average of 1,600 mt of tomato, 50 mt of onion, 4,400 mt of cabbage, 475 mt of orange, and 15,000 mt of Irish potato to markets during 2004 and 2005. These numbers suggest that smallholder farmers remain very important suppliers of all these products (with the exception of Irish Potato) to Lusaka. Assembly and Wholesaling: Tomato, rape, and cabbage arrive in Lusaka and Ndola through a decentralized assembly process from within 20-30 km of each city. Onions arrive from Eastern province, Malawi, and Tanzania, and oranges from Zimbabwe and RSA as well as Mkushi near Lusaka; these two products are less perishable and so can withstand longer transport distances. We estimate that at least 80% of all fresh produce reaching each city
Page vii
passes first through Soweto in Lusaka and Main Masala in Ndola. Outlying markets take smaller total quantities, and almost no large-scale transactions. More perishable items such as tomato and rape are more likely to be sold at wholesale directly by farmers; cabbage, dry onion, banana and orange all arrived at Soweto through traders. Farmers are more likely than traders to sell through brokers. While farmer opinions of brokers vary, a common complaint is the apparently frequent practice of brokers adding, in addition to a transparent commission, a price mark-up which they do not inform the farmer of and which they keep for themselves; farmers who do not know these agents well may be at higher risk of experiencing these problems. Among “first sellers” bringing produce to Soweto, gross margins range between one-third and over one-half of the price they paid in rural areas; margins appear lower for banana, at about 20% of the rural purchase price. Freshmark is the fresh produce wholesaling agent for Shoprite; it purchases its supplies from a combination of domestic farmers and traders, and traders in neighboring countries. Work with smallholder farmer groups has shown little success due to inconsistent supply. They have had more success with 20-30 independent smallholders. The company’s largest volume products, in order, are bananas, apples, and Irish potatoes. All bananas and 90% of potatoes come from local sources, the latter from commercial farmers around Lusaka, through brokers. All apples and substantial amounts of orange are imported. Freshpikt is a large processor which began operation in late 2005 and has quickly become a major buyer of tomato, dry beans, pineapple, and other products. With donor assistance and working through the Lubulima Agricultural and Commercial Cooperative Union (LACCUN), the company currently contracts about 200 smallholder farmers to grow sweet corn and beans. The company has an aggressive regional marketing plan including much of Southern and some of Eastern Africa; if successful, this would provide a vast and stable source of demand for fresh produce from Zambian farmers. Retailing: Retail marketing of fresh produce in Lusaka and Ndola is highly diversified. Consumers obtain their produce in open air markets ranging from very large wholesale/ retail centers, to smaller markets serving mostly low- and middle-income consumers, to markets serving almost exclusively high- and middle-income consumers; from small independent supermarkets and chain supermarkets; from street vendors; and from traditional shops. We estimate that open air markets carry 70-80% of all fresh produce marketed in Lusaka and Ndola, with supermarket chains and independent supermarkets each holding shares of 7% to 10%-11%, followed by street vendors with 9%, and other outlets with 2%. The dominance of open air markets is most pronounced in vegetables, where they hold an estimated share of 74% to 87%. We further estimate that vegetables have about an 80% share of all fresh produce purchases, while fruit has a 20% share. Both smaller local supermarkets and supermarket chains dominantly serve high- and medium-income consumers. Local supermarkets sell mostly tomato, onion, cabbage, and other fresh produce preferred by high income groups. Shoprite sells primarily fruits such as apples, bananas, grapes and oranges, along with tomato, cabbage, onion, Irish potato, and exotic items. The range of leafy vegetables is very limited in all supermarkets. The main wholesale markets in each city are also the largest retail markets, dominantly serving low- and middle income consumers. Most residential markets (secondary outlying
Page viii
markets in neighborhoods) also serve low- and middle income consumers, though some, such as Northmead and Woodlands in Lusaka, serve primarily a high and middle income clientele. Markets are managed either by the City Council, or by Marketeer Cooperatives, though some in the Ministry of Local Government and Housing suggest that all markets legally belong to the City Council. Disagreements between City Council and Marketeer Cooperatives over management of the markets, use of marketeer fees, and title to land have been at the center of serious disputes in recent years. We surveyed retailers in Soweto and Kaunda Square Stage 1 markets in Lusaka, and Main Masala market in Ndola. Traders in Soweto are highly specialized but much larger than traders in the other markets; Soweto traders carry an average of 1.2 FFV items, compared to over 2 and over 4 by traders in Main Masala and Kaunda Square, respectively, but they typically sell 2-4 times as much volume of any individual item. As a result, Soweto traders generate the highest weekly gross sales (median=ZKW250,100). Kaunda Square traders are the most diversified but generate the lowest weekly sales (median=ZKW90,000). Wastage at retail ranges from 3%-5% in each market, being highest for rape and tomato (4%-9%, average of about 6.5%) and lowest for dry onion and cabbage (0%-3%, average of about 1.5%). Retail mark-ups range from about 30%-80% over retailer purchase price, with lowest mark-ups for the highest volume items: cabbage, tomato, and rape. Soweto and Main Masala appear to have comparable overall mark-ups on the four vegetables, while Kaunda Square’s is much higher, driven by cabbage and dry onion. Total farm-to-consumer markups established on one day in July ranged from 65% to 92% of the price paid at farm. Because relationships can vary greatly from day to day, more reliable information on markups throughout the chain requires regular data collection, possibly through AMIC. Consumer Behavior: Shoprites in high-income neighborhoods and small supermarkets tend to be used for a wide range of food types, while those in middle-income neighborhoods are used almost exclusively for staples and perhaps for meat, eggs, and dairy. Vegetables, primarily tomato, rape, and dry onion, predominate in all open air markets; fruit purchases are also important in high-end markets, while main and residential markets are used for a broad array of food items, including staples, but not much for fruit. In Shoprites and small supermarkets, fruit and cabbage are most common in fresh produce purchases. Thirty- to sixty percent of shoppers in Shoprites indicated that they most often bought vegetables in open air markets. Shoppers in small supermarkets are the least likely to go to open air markets for their vegetables. Street vendors are important alternative sources of fresh produce for shoppers at high income Shoprites. Fresh produce prices in supermarkets are 60%-100% higher in Lusaka supermarkets than in Soweto, while in residential markets they are about 20% above levels in Soweto. Urban Markets Development Program: The European Union, in collaboration with Ministry of Local Government and Housing, is currently investing Euro 16m in the Urban Markets Development Program. The program focuses on review and revision of legislation and local market bye-laws, construction of improved physical infrastructure in selected markets of Lusaka, Ndola, and Kitwe, and associated credit, training, and outreach activities. At the core of the UMDP is a “new management model” that emphasizes much active participation of stakeholders in the management of markets and a reorientation of public officials away from a control mentality towards one of facilitating healthy commercial
Page ix

activity. The Markets Act has been widely perceived as a barrier to this more participatory and decentralized approach, and its revision has therefore received high priority. At least two problems have emerged. First, uncertainty about the specific content of the proposed revisions has lead to concern on the part of marketeer representatives that the new Act may not fully meet the needs of the trading community. Second, as of mid-August 2006, there is no prospect of new legislation – nor of fully instituting the new management model -- until the next Parliament sits in 2007. Policy and Program Issues: This appraisal generated several findings with policy relevance for Zambia’s horticultural sector. First, we have found a very low proportion of households selling horticultural produce. This pattern suggests that new demand points could enjoy substantial supply response if they linked effectively to the smallholder sector. Second, results show continued dominance of the small-scale traditional marketing system. This system has shown itself to be highly adaptable, serving a broad range of consumers with prices much lower, and quality comparable to and sometimes superior to, supermarkets. Yet these markets suffer from serious structural problems due to a lack of public investment and little if any collaboration between public officials and traders in market management. The Urban Markets Development Program represents a major and impressive effort to improve wholesale and retail markets in the country, but has run into problems as legislative reform has stalled, endangering the program. Mistrust persists between some trader representatives and public officials; with passage of the new Markets Act stalled, this may be a crucial opportunity to strengthen the partnering approach by formally reviewing the new proposed Act with stakeholders. Also, UMDP was not designed to address key issues of improved linkages between rural farmers and urban markets. These need to be addressed with improved market information and marketing extension, more actively linking farmers to market opportunities; as a major new source of demand for horticultural produce in Zambia, information on Freshpikt prices, quality standards, and purchase volumes should be integrated into any proposed horticultural marketing information system. Seventh, Zambia’s horticultural sector operates in a regional market, exporting and importing every year. Understanding and quantifying this trade will be the first step in ensuring that policies and programs are conducive to continued high rates of growth. Finally, Shoprite/Freshmark (and perhaps Spar) are in the market to stay. Where appropriate, programs to facilitate direct marketing by smallholders to these chains should be supported, but these programs should not distract from an overall focus on improving urban wholesale and retail markets and linking these more effectively to rural producers. Preliminary priorities for future research, pending stakeholder input, include: - What is the share of commercial farms in fresh produce supply to major urban markets?; - How variable are horticultural prices seasonally and over shorter periods ( months or
weeks); - What is the structure of costs and returns along the supply chain from farm to consumer?
Where can savings be gained and what investments are needed to realize these gains? - What is the volume of regional trade (imports and exports) in horticultural products, and
what steps could be taken to facilitate it, especially exports of fresh and processed items? - What is the reaction of farmers and marketeers to (a) the physical infrastructure
improvements now underway in urban markets and (b) the proposed legislative amendments not yet approved by Parliament?
Page x

1. BACKGROUND 1.1 Introduction Demand for horticultural products tends to grow very rapidly with urbanization and increased income. For example, while worldwide demand for cereals increased by about 20% per capita since 1960, per capita demand for fresh produce more than doubled (USAID, 2005). In most areas of the developing world between 1971 and 2000, annual percentage growth in the demand for horticultural products exceeded that of cereals by 2.5 to nearly eight times, depending on the region. Because horticultural produce is a high value item, and because of the diversity of fruits and vegetables demanded by consumers, such growth provides major opportunities for farmers to diversify their production base and increase their incomes. Such opportunities may be especially valuable for women, who are the primary producers and marketers of horticultural produce throughout Africa (USAID, 2005). Finally, from the farm through retailing, horticultural production employs about twice as much labor as cereals per hectare of production; small farmers, rural laborers, and the urban poor stand to gain inordinately from these employment opportunities. Yet the stark fact is that Africa is the one region of the world where per capita supply of fresh produce has fallen since 1970, by an average of 0.3% per year (USAID, 2005). This decline has been driven by falling incomes, but also by increasingly inadequate production and marketing systems that limit yield growth at the farm level and increase marketing costs throughout the supply chain. Though reliable data are lacking, the broad patterns of Zambia’s macroeconomic performance and the state of its infrastructure suggest that it has probably not escaped this trend. Reversing the trend – and realizing the dramatic growth potential that horticulture presents – will require concerted action throughout the supply chain, from farm to consumer. At the farm level, horticulture places intensive demands on knowledge, management, and labor. While smallholder farmers have a great advantage in the low cost of their labor, they would gain greatly from greater knowledge of production and post-harvest management techniques. Downstream after the farm, horticultural produce places great demands on marketing systems due to their high perishability: production and marketing need to be tightly coordinated in time, putting a premium on the flow of information and the timely availability of transport; cold chains are needed if the more perishable items are to be produced more than 50 km from their destination market; the constant flow of produce through public market places puts huge demands on this infrastructure, too often leading to congestion and unsanitary conditions; human health can be further compromised when peri-urban horticultural producers use waste water to irrigate their crops. As always, these challenges present major opportunities: if the challenges can be addressed, hundreds of thousands of farmers stand to gain from more profitable, reliable, and diversified markets, and millions of consumers will benefit from a more reliable supply of safer and more nutritious food. Addressing these issues requires reliable information, and active collaboration between the private and public sectors to make policy and programmatic decisions on the basis of this information. While much is known about the successes and failures of export horticulture in Zambia, much less is known about the performance of the domestic horticultural system. Yet we do know that this system is much larger and involves many more people than does the export system. Nearly all export vegetables are produced by medium- and large-scale farmers under outgrower schemes in limited geographical areas. For example, the defunct
Page 1

Agriflora, the largest vegetable exporter before its demise, used to contract growers only within a 50 km radius of its Lusaka operations (The IDL Group, 2002). In contrast, 21% of small- and medium-scale farmers (about 170,000 households) throughout the country sold an average of over US$100 of fresh produce in 2002, nearly all of it into the domestic market. In addition, millions of consumers in Lusaka, Ndola, and other cities and towns consume fresh produce on a daily basis; the cost, quality, safety, and reliability of supply of these items has a major influence over their real purchasing power and quality of diet. The purpose of this paper is to begin generating the empirical information needed to launch a process of stakeholder consultation regarding the key challenges facing the country’s horticultural sector. The paper is based on a rapid appraisal of the sector meant to provide a broad overview; FSRP’s hope is that stakeholder input will help identify a more focused set of applied research dealing with specific issues. The paper proceeds as follows: the rest of this chapter presents the data and methods used in the research; chapter two uses national rural household survey data to characterize horticultural marketing patterns in the smallholder sector; chapter three presents results of the rapid appraisal, focusing on large scale farmers, “first sellers” in the Soweto wholesale market of Lusaka, retail traders in Lusaka and Ndola, and shoppers from a range of retail outlets in both cities; chapter four concludes with a discussion of policy and program issues.
1.2 Data and Methods
Primary data for this report come from rural household surveys conducted during 2001 and 2004, and from several rapid appraisal surveys of market participants, conducted in Lusaka and Ndola during late 2005.
1.2.1 Rural Survey To characterize the fresh produce marketing practices of rural households, we use nationally representative data from surveys carried out in 2001 and 2004 by the Central Statistical Office (CSO) in conjunction with the Ministry of Agriculture and Cooperatives (MACO) and Michigan State University’s Food Security Research Project (for sampling procedures see Megill 2004). Of the 6,922 households in 394 standard enumeration areas (SEAs) interviewed in 2001, 5,420 (78%) were re-interviewed in May 2004. If we exclude attrition caused by enumerators not revisiting several SEAs in 2004 that were included in the 2001 survey, the re-interview rate rises to 89%. Chapoto et. al. found statistically significant differences among 2001 households that were re-interviewed in 2004, and those that were not. Specifically, they found that households that were not re-interviewed in 2004 were, in 2001, slightly younger and smaller, held and cultivated slightly less land, and had one-half to one-third as many assets as households that were successfully re-interviewed. Table 1 shows results that are most relevant to our horticultural analysis, comparing the entire 2001 sample with 2001 values for households that were re-interviewed in 2004. Despite relatively high attrition rates in all provinces, the table shows very small differences between the two samples in % selling horticultural produce, the mean value of sales among those selling, and the mean household income share from horticulture. Rankings and the magnitude of differences among provinces show very little change. Based on these patterns, and on the desire to ensure as representative a sample as possible each year, we present results in this paper from the entire 2001 and 2004 samples.
Page 2
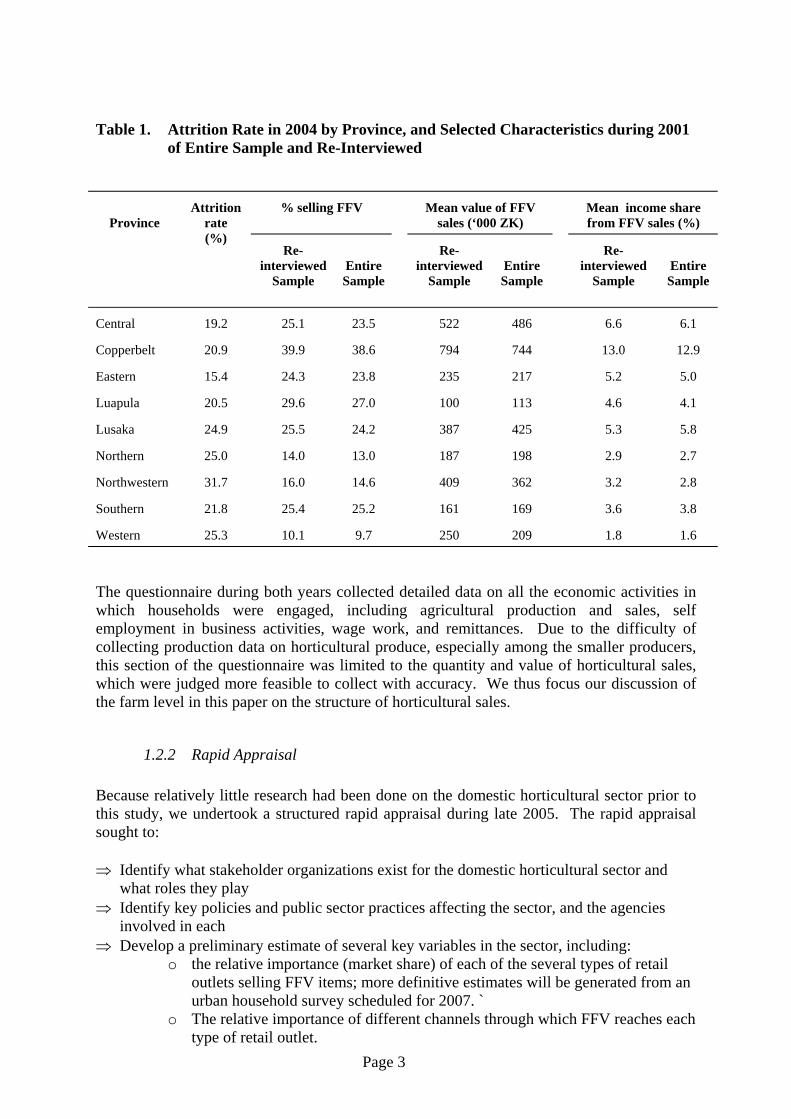
Table 1. Attrition Rate in 2004 by Province, and Selected Characteristics during 2001 of Entire Sample and Re-Interviewed
% selling FFV Mean value of FFV sales (‘000 ZK)
Mean income share from FFV sales (%)
Province
Attrition rate (%)
Re-interviewed
Sample
Entire Sample
Re-interviewed
Sample
Entire Sample
Re-interviewed
Sample
Entire Sample
Central 19.2 25.1 23.5 522 486 6.6 6.1
Copperbelt 20.9 39.9 38.6 794 744 13.0 12.9
Eastern 15.4 24.3 23.8 235 217 5.2 5.0
Luapula 20.5 29.6 27.0 100 113 4.6 4.1
Lusaka 24.9 25.5 24.2 387 425 5.3 5.8
Northern 25.0 14.0 13.0 187 198 2.9 2.7
Northwestern 31.7 16.0 14.6 409 362 3.2 2.8
Southern 21.8 25.4 25.2 161 169 3.6 3.8
Western 25.3 10.1 9.7 250 209 1.8 1.6 The questionnaire during both years collected detailed data on all the economic activities in which households were engaged, including agricultural production and sales, self employment in business activities, wage work, and remittances. Due to the difficulty of collecting production data on horticultural produce, especially among the smaller producers, this section of the questionnaire was limited to the quantity and value of horticultural sales, which were judged more feasible to collect with accuracy. We thus focus our discussion of the farm level in this paper on the structure of horticultural sales.
1.2.2 Rapid Appraisal Because relatively little research had been done on the domestic horticultural sector prior to this study, we undertook a structured rapid appraisal during late 2005. The rapid appraisal sought to: ⇒ Identify what stakeholder organizations exist for the domestic horticultural sector and
what roles they play ⇒ Identify key policies and public sector practices affecting the sector, and the agencies
involved in each ⇒ Develop a preliminary estimate of several key variables in the sector, including:
o the relative importance (market share) of each of the several types of retail outlets selling FFV items; more definitive estimates will be generated from an urban household survey scheduled for 2007. `
o The relative importance of different channels through which FFV reaches each type of retail outlet.
Page 3
o the geography of FFV production and marketing, including the role of large farms supplying horticultural produce to Lusaka and Ndola.
⇒ Qualitatively assess the cleanliness, logistical efficiency, and level of value-added in traditional wholesale and retail markets
⇒ Compare FFV prices for comparable products in supermarkets and open air markets ⇒ Within the open air market segment, develop a preliminary estimate of gross farm-
wholesale mark-ups, and wholesale-retail mark-ups for five key FFV items To achieve the above, consultations were held with various stakeholders in the horticultural marketing system and surveys were conducted with consumers and retail traders in Lusaka and Ndola, with the Freshmark manager in Lusaka, and with “first sellers1” in Soweto market of Lusaka from mid September to mid November 2005. Large farms around Lusaka were interviewed in May 2006. The stakeholder consultations involved: ⇒ Government and quasi Government institutions: the Ministry of Agriculture and
Cooperatives (MACO); the Ministry of Local Government and Housing (MLGH) and the Lusaka City Council;
⇒ Donor projects including the European Union (EU) funded Urban Markets Development Program (UMDP) within MLGH and the USAID funded Production, Finances and Improved Technologies (PROFIT) project;
⇒ Private sector traders and processors: supermarkets, the main supermarket wholesaler (Freshmark), processors (Freshpikt) and marketeers, their cooperative boards, and the Lusaka Union of Marketeer Cooperatives; and
⇒ Farmers at the markets The consumer survey was conducted in selected markets, small supermarkets and Shoprite outlets in Lusaka and Ndola targeting consumers who were leaving these outlets. Two researchers interviewed a total of 151 consumers in Lusaka at the town and Manda Hill Shoprite outlets, the residential area Shoprite outlets (Chilenje and Matero), small supermarkets (Melissa and Kalundu mini-marts) the main market (Soweto), and residential area markets (Kaunda Square Stage 1, Chilenje and Northmead). In Ndola a total of 84 consumers were covered at the city’s only Shoprite, two small supermarkets (Pantry Pride and Fisenge Supermarket), the main market (Main Masala) and two residential area markets (Chifubu and Mushili). Table 2 shows the total sample of consumers disaggregated by gender. In each outlet about 15 consumers coming out of the outlet were randomly interviewed using a structured questionnaire covering food groups purchased while in the store, specific FFV items purchased and whether they were purchased bagged or loose, processed or whole, types of outlets where their households bought FFV during the past week, ownership of selected assets, consumers’ areas of residence which were later categorized into low, middle and high income residential areas, and type of employment of the household head. In each location, the interviews were as much as possible spread through out the day to capture different types of shoppers such as the working class after working hours.
1 “First sellers are individuals bringing produce into Soweto market from rural areas for sale early in the morning. They could be farmers bringing only their own production, or rural assemblers bringing production from various farms.
Page 4

Table 2. Consumer Survey Sample Dis-aggregated by Gender
Percent Respondents by Gender District
Category of location Male Female Count
Town/Manda Hill Shoprites (2) 36.7 63.3 30 Residential area Shoprites (2) 46.7 53.3 30 Small supermarkets (2) 23.3 76.7 30 Main market (Soweto) 25.0 75.0 16 Residential area markets (3) 35.6 64.4 45
Lusaka
Total 34.3 65.7 151 Town Shoprite 53.3 46.7 15 Small supermarkets (2) 32.1 67.9 28 Main market 7.1 92.9 14 Residential area markets (2) 29.6 70.4 27
Ndola
Total 31.0 69.0 84 Grand Total 33.2 66.8 235
Because our sample purposively selected retail outlet types, and because the relative number of interviews in each was not proportional to overall population in either city (not everyone in either city had an equal probability of being selected), unweighted data would not generate accurate estimates of, say, the proportion of households purchasing fresh produce in each type of retail outlet. Because one objective of this rapid appraisal was to understand the relative importance of different marketing channels within the sector, we decided to develop and apply an ex-post weighting scheme that would allow us to generate preliminary estimates of these market shares. A more definitive estimate will await the completion of a quantitative consumer survey scheduled for 2007; this survey will be based on a statistically designed sample and will collect information on both quantities and values of consumer purchases. We used several pieces of information to generate a plausible set of weights for this survey. First, each consumer was asked the name of the neighborhood in which they lived. We then obtained from the Central Statistical Office (a) the residential category of each of these neighborhoods (high, medium, or low population density) and (b) the total population in each residential category in each city. We then allocated each neighborhood to its proper category and, as per standard weighting practice, calculated weights by residential category as follows: wgti = POPi /NINTi where i is residential category. Thus, each weight is the inverse of the number of interviews per residential category as a share of the total city population in that residential category. See Annex A for more detail on this approach. The retail marketeer survey was conducted at Soweto and Kaunda Square Stage 1 markets in Lusaka and Main Masala Market in Ndola. The survey aimed at capturing marketing related information covering the main FFV produce. For vegetables we chose rape, tomato, cabbage, and dry onion, due to these being the four most frequently sold FFV items in our 2004 rural survey, and their abundance in retail markets. Though fruit consumption in Zambia appears to be far lower than that of vegetables, we chose also to include banana and orange – the two most commonly sold fruits in the 2004 rural survey. Traders for these produce items were randomly selected in the markets targeting a total of 10 interviews per FFV produce. This meant that a single trader could have interviews for more than one produce item if they were
Page 5

trading in more than one. The total numbers of interviews covered are shown in Table 3. In some cases, it was not possible to achieve the desired number of interviews per produce due to limited number or lack of traders.
Table 3. Number of Interviews per FFV in the Marketeer Survey
Frequency (%) of Interviews per Location FFV Item
Soweto Market Kaunda Square Stage 1 Market
Main Masala Market
Count
Rape 18.0 26.3 25.6 29 Tomato 20.0 26.3 28.2 31 Cabbage 20.0 13.2 23.1 24 Dry onion 20.0 26.3 23.1 29 Banana 8.0 2.6 0.0 5 Orange 14.0 5.3 0.0 9 Total Count 50 38 39 127 The retail marketeer interviews covered types of FFV and other food or non food items being sold, whether they were sold bagged or loose, and information on the last purchases including source of purchase, purchase unit and quantity, purchase price, sales unit and quantity, selling price, and purchase quantity and wastage in the past week. In addition, four samples of the sales unit were weighed in order to derive the average weight per sales unit. Part of this information was used to determine the traders’ gross margins. The “first seller” survey covered farmers or traders from outside Lusaka arriving in the early morning at the wholesale areas of Soweto market. About five sellers for each of the six main FFV produce items were interviewed at Soweto market to determine quantities being sold, unit of sales, origin of produce, frequency of sales at the market, and frequency of selling through a broker including the seller’s price and broker’s fee. The number of first sellers interviewed is shown in Table 4.
Table 4. Number of First Sellers Interviewed by Gender
Percent Sellers by Gender Item
Male Female
Count Rape 50.0 50.0 6 Tomato 42.9 57.1 7 Cabbage 100.0 0.0 5 Dry onion 83.3 16.7 6 Banana 33.3 66.7 3 Orange 50.0 50.0 4 Total Percent 61.3 38.7 31 Total Count 19 12 31 In addition, five first sellers and/or brokers were interviewed using a checklist to determine the seasonality of supply of these main FFV produce to the market at Soweto and also at Main Masala in Ndola. For each produce item, respondents were asked to score from 0 (denoting no supply) to 3 (denoting highest supply) the supply of produce to the markets for
Page 6
each month of the year while giving indications of the source of supply for any particular period. The scores from the five interviews for each produce item were averaged to derive the overall monthly qualitative supply assessment. We identified 10 large farms around Lusaka supplying the city with fresh produce, and interviewed managers of six of these: Evergreen, Faro, CJ, Lilayi, Ellensdale, and Buya Bamba.
Page 7
2. MARKETING OF FRESH PRODUCE BY SMALLHOLDER FARMERS
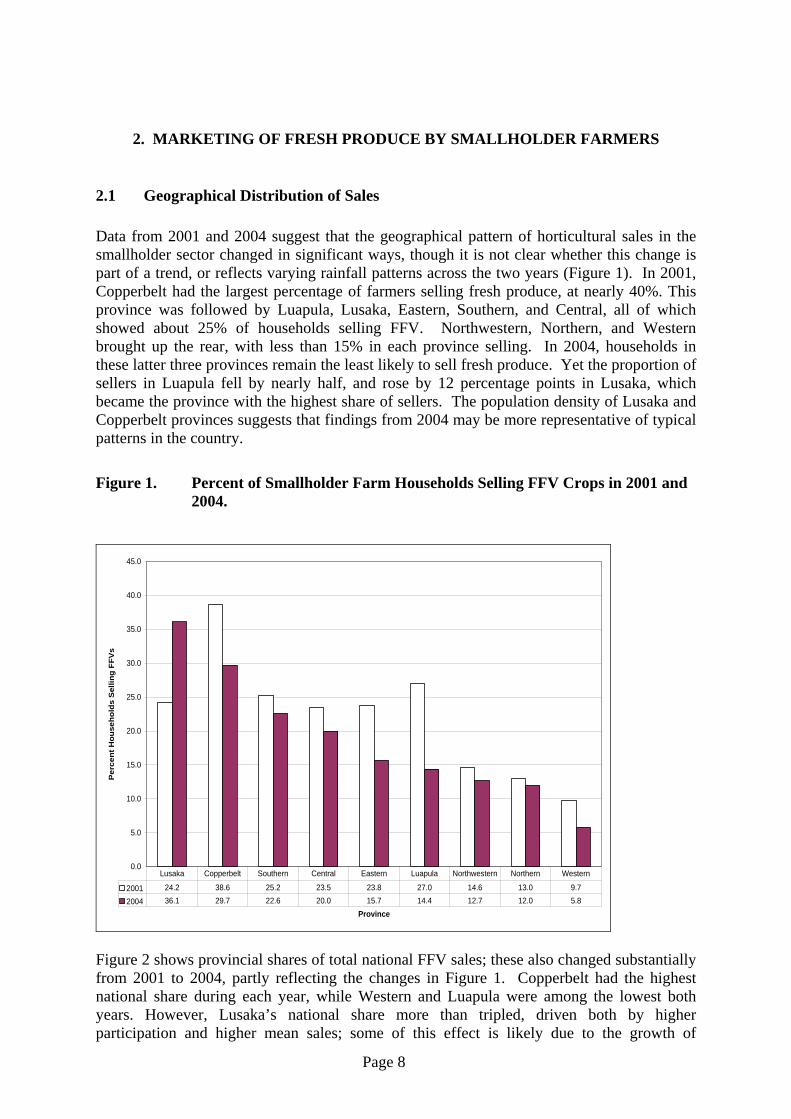
2.1 Geographical Distribution of Sales Data from 2001 and 2004 suggest that the geographical pattern of horticultural sales in the smallholder sector changed in significant ways, though it is not clear whether this change is part of a trend, or reflects varying rainfall patterns across the two years (Figure 1). In 2001, Copperbelt had the largest percentage of farmers selling fresh produce, at nearly 40%. This province was followed by Luapula, Lusaka, Eastern, Southern, and Central, all of which showed about 25% of households selling FFV. Northwestern, Northern, and Western brought up the rear, with less than 15% in each province selling. In 2004, households in these latter three provinces remain the least likely to sell fresh produce. Yet the proportion of sellers in Luapula fell by nearly half, and rose by 12 percentage points in Lusaka, which became the province with the highest share of sellers. The population density of Lusaka and Copperbelt provinces suggests that findings from 2004 may be more representative of typical patterns in the country.
Figure 1. Percent of Smallholder Farm Households Selling FFV Crops in 2001 and 2004.
0.0
5.0
10.0
15.0
20.0
25.0
30.0
35.0
40.0
45.0
Province
Per
cent
Hou
seho
lds
Sel
ling
FFV
s
2001 24.2 38.6 25.2 23.5 23.8 27.0 14.6 13.0 9.7
2004 36.1 29.7 22.6 20.0 15.7 14.4 12.7 12.0 5.8
Lusaka Copperbelt Southern Central Eastern Luapula Northwestern Northern Western
Figure 2 shows provincial shares of total national FFV sales; these also changed substantially from 2001 to 2004, partly reflecting the changes in Figure 1. Copperbelt had the highest national share during each year, while Western and Luapula were among the lowest both years. However, Lusaka’s national share more than tripled, driven both by higher participation and higher mean sales; some of this effect is likely due to the growth of
Page 8

Agriflora in and around Lusaka during this period2. Northwestern’s share more than doubled, driven primarily by increased production and price as a response to increased demand stimulated by the new mining activities in the area.
Figure 2. Percent Provincial Share of Total FFV Sales in 2001 and 2004
0.0
5.0
10.0
15.0
20.0
25.0
30.0
Province
% P
rovi
ncia
l Sha
re o
f Nat
iona
l FFV
s Sa
les
2001 26.3 6.8 4.6 16.9 20.2 8.3 7.7 3.7 5.6
2004 20.7 16.2 15.3 12.3 11.4 9.6 7.3 3.9 3.3
Copperbelt Northwestern Lusaka Eastern Central Southern Northern Western Luapula
During the same period, the market shares of Eastern and Central provinces declined. This decline can be ascribed to reduced availability of water for both rain-fed and irrigated production resulting from recurrent droughts in the past few years. Nationally, 3.5% of total rural household income – and about 18% of cash income from agriculture -- in 2004 came from sales of fresh produce (Table 5). Shares were much higher in the most urbanized provinces: 12% of total income and over 40% of agricultural cash income in Copperbelt, and 9% of total income and nearly 50% of agricultural cash income in Lusaka. These two provinces also showed the highest mean and median per capita incomes in the country. In all other provinces, income from horticultural sales was either the lowest or second-lowest of all income shares.
2.2 Most Valuable Crops The two surveys show a very consistent picture in terms of the five most valuable FFV crops in sales (Table 6): tomato, rape, cabbage, egg plant and onion/okra accounted for 84% and 82% of the total national value of sales of FFV crops in 2001 and 2004 respectively. For each of these FFV crops, the top three selling provinces account for more than 55% of each crop’s total national sales. In 2004, for example, the top three selling provinces for tomato were
2 Agriflora went defunct in 2005.
Page 9
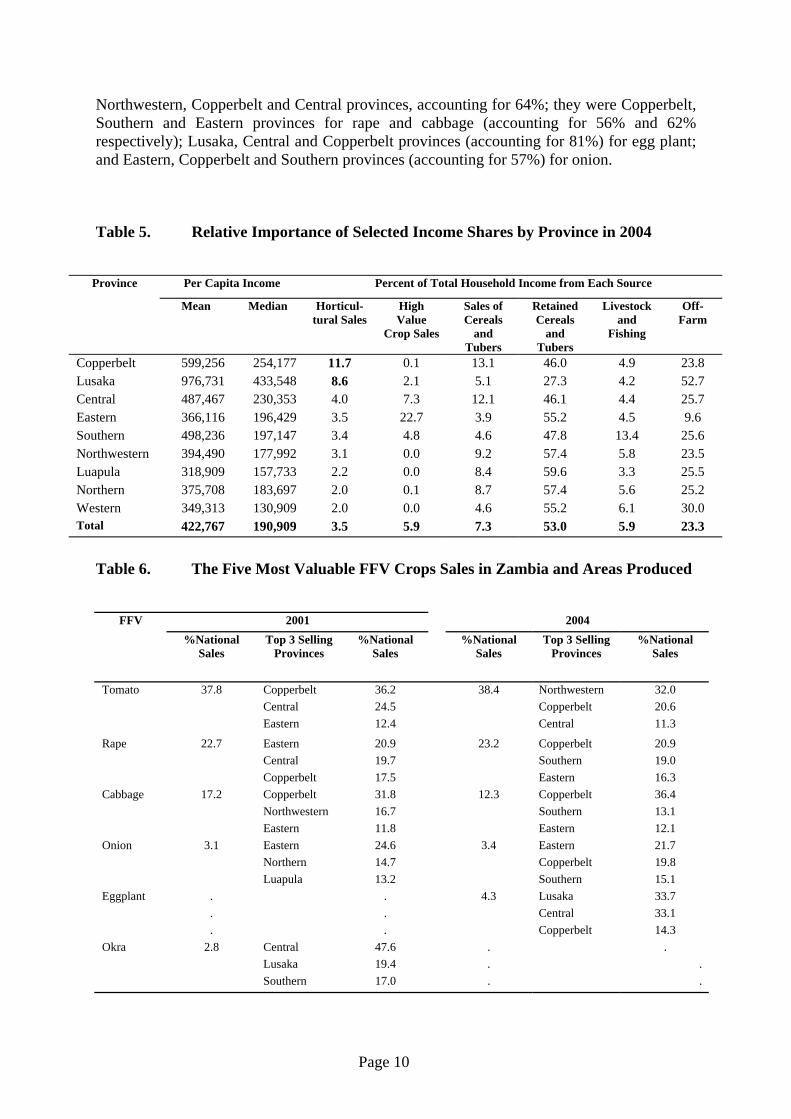
Northwestern, Copperbelt and Central provinces, accounting for 64%; they were Copperbelt, Southern and Eastern provinces for rape and cabbage (accounting for 56% and 62% respectively); Lusaka, Central and Copperbelt provinces (accounting for 81%) for egg plant; and Eastern, Copperbelt and Southern provinces (accounting for 57%) for onion.
Table 5. Relative Importance of Selected Income Shares by Province in 2004
Per Capita Income Percent of Total Household Income from Each Source Province
Mean Median Horticul-tural Sales
High Value
Crop Sales
Sales of Cereals
and Tubers
Retained Cereals
and Tubers
Livestock and
Fishing
Off-Farm
Copperbelt 599,256 254,177 11.7 0.1 13.1 46.0 4.9 23.8 Lusaka 976,731 433,548 8.6 2.1 5.1 27.3 4.2 52.7 Central 487,467 230,353 4.0 7.3 12.1 46.1 4.4 25.7 Eastern 366,116 196,429 3.5 22.7 3.9 55.2 4.5 9.6 Southern 498,236 197,147 3.4 4.8 4.6 47.8 13.4 25.6 Northwestern 394,490 177,992 3.1 0.0 9.2 57.4 5.8 23.5 Luapula 318,909 157,733 2.2 0.0 8.4 59.6 3.3 25.5 Northern 375,708 183,697 2.0 0.1 8.7 57.4 5.6 25.2 Western 349,313 130,909 2.0 0.0 4.6 55.2 6.1 30.0 Total 422,767 190,909 3.5 5.9 7.3 53.0 5.9 23.3
Table 6. The Five Most Valuable FFV Crops Sales in Zambia and Areas Produced
2001 2004 FFV
%National Sales
Top 3 Selling Provinces
%National Sales
%National Sales
Top 3 Selling Provinces
%National Sales
Tomato 37.8 Copperbelt 36.2 38.4 Northwestern 32.0 Central 24.5 Copperbelt 20.6 Eastern 12.4 Central 11.3
Rape 22.7 Eastern 20.9 23.2 Copperbelt 20.9 Central 19.7 Southern 19.0 Copperbelt 17.5 Eastern 16.3 Cabbage 17.2 Copperbelt 31.8 12.3 Copperbelt 36.4 Northwestern 16.7 Southern 13.1 Eastern 11.8 Eastern 12.1 Onion 3.1 Eastern 24.6 3.4 Eastern 21.7 Northern 14.7 Copperbelt 19.8 Luapula 13.2 Southern 15.1 Eggplant . . 4.3 Lusaka 33.7 . . Central 33.1 . . Copperbelt 14.3 Okra 2.8 Central 47.6 . . Lusaka 19.4 . . Southern 17.0 . .
Page 10

Copperbelt Province was among the top three selling provinces for all these crops in 2004 and was among the top three in three of the five most valuable crops (tomato, rape, cabbage) in 2001. This performance could be attributed to favorable conditions in terms of soil types, availability of rain and irrigation water, and proximity to markets. The performances of the other provinces in the respective two years were as follows: ⇒ Eastern Province was among the top thee in four of the crops in 2001 (tomato, rape,
cabbage, onion) and three crops in 2004 (rape, cabbage, onion); ⇒ Central Province was among the top provinces in three of the crops in 2001 (tomato, rape,
okra) and two crops in 2004 (tomato, egg plant); ⇒ Southern Province was among the top three in only one of the crops in 2001 (okra) and
three crops in 2004 (rape, cabbage, onion); and ⇒ Lusaka and Northwestern provinces were among the top three in only one crop in both
2001 (okra and cabbage, respectively) and 2004 (okra and tomato, respectively).
2.3 Concentration of Sales To examine the concentration of horticultural sales across households, we broke all households into six mutually exclusive groups: those that did not sell any FFV, and five groups of equal size (quintiles), arrayed from least to most sales. Because both survey years show very similar patterns, we present results in Figures 3 and 4 only for 2004. On average, only about a fifth or less of the households in Zambia sell FFVs (21% in 2001 and 16% in 2004). The figure shows that these sales are highly concentrated, with only 3% to 4% of the households accounting for about 75% of the total value of horticultural sales. Nationally, most of the large sellers (those in the highest sales category) were located in Copperbelt, Eastern and Central provinces, which together accounted for nearly 60% of the largest selling group during both survey years (Figure 4). This result is driven not just by the likelihood of a farmer being a large FFV seller, but also by the populations in these provinces. A different question regards the likelihood that a farmer within any given province will be in the highest FFV sales category. Viewed this way, Copperbelt was still on top, with 16% of all farmers lying in the highest category. As expected, however, Lusaka now moves up, with 9% of all farmers in this highest category, followed by Central Province with 8%. All other provinces, which are more distant from major urban centers, had 3% or fewer of their farmers in the highest FFV sales category/. Table 7 and Figure 5 examine characteristics of farmers by FFV sales category. Two broad findings stand out. First, household indicators of economic wellbeing increase with FFV sales: mean and median per capita incomes, education of the household head, and cropped area all steadily rise through the FFV sales categories, and the share of female headed households steadily falls. This conforms with the assertion by Weinberger and Lumpkin (2005) that farmers involved in horticultural production usually earn much higher farm incomes compared to cereal producers. The mean value of agricultural assets shows a less stable progression, likely due to the partial nature of the list of assets on which data were collected. Second, the group of largest sellers could be classified as highly specialized in horticulture, earning nearly 50% of total household income – and over 60% of cash income -- from the sale of fresh produce. As a point of comparison, this same group in rural Kenya earns on average only 25% of total household income from such sales. For the top 80% of horticultural sellers – 13% of the population -- horticulture is the single most important source of cash income from agriculture, exceeding maize, cash crops such as cotton and tobacco, and livestock. The final insight from these figures is perhaps the most noteworthy:
Page 11

only 16% of all smallholder households reported sales of any fresh produce. This compares to 70% in Kenya and 25% in Mozambique. This very low figure suggests the possibility that new demand points – if well linked to rural areas with information and reliable purchases – could generate an impressive supply response. Because the CSO data we used does not indicate whether a household produced fruits or vegetables without selling, this analysis is necessarily incomplete, but remains suggestive.
Figure 3. Percent of Farmers Selling FFV and Share of Total Sales by Sales Category in 2004
0.0
10.0
20.0
30.0
40.0
50.0
60.0
70.0
80.0
90.0
Percent Farmers/Sales
Sales Category
%Farmers 83.8 3.4 3.2 3.1 3.2 3.3
%Sales 0.0 0.9 2.7 6.1 15.3 75.1
0 No sales 1 Lowest sales 2 3 4 5 Highest sales
Figure 4. Percent Farmers in the Highest Sales Category, by Province In 2004
0.0
5.0
10.0
15.0
20.0
25.0
Percent Farmers in Highest Sales Category
Province
Series1 22.9 18.0 16.4 10.7 8.8 8.4 8.1 4.0 2.7
Copperbelt Eastern Central Lusaka Northwestern Northern Southern Western Luapula
Page 12

Table 7. Characteristics of Households by Horticultural Sales Category in 2004
Sales Category % of all
farmers Mean
Income per
Capita
Median Income
per Capita
% Mean share of income from agric.
% Mean share of income
from FFV sales
% female headed
Mean Years of
Education of HH Head
Mean Cropped
Area (Ha)
Mean Value of Agric. Assets
0 No sales 83.8 415,225 201,965 76.6 0.0 25.7 4.8 1.27 114,276
1 Lowest Sales 3.4 344,657 212,008 79.6 3.1 19.4 5.9 1.44 201,502
2 3.2 469,455 281,203 76.0 8.4 12.8 6.2 1.42 143,456
3 3.2 537,903 329,946 77.8 16.2 11.8 6.3 1.63 182,439
4 3.2 808,594 389,547 77.6 24.9 8.5 6.6 1.59 334,420
5 Highest Sales 3.3 1,464,767 645,723 83.3 46.9 8.4 7.1 2.20 279,618
Figure 5. Relative Share of Income from Selected Sources by Horticultural Sales Category in 2004
0
10
20
30
40
50
60
Income Source
Perc
ent o
f Tot
al H
ouse
hold
Inco
me
per H
ortic
ultr
al S
ales
Cat
egor
y
0 No Sales 0 6 7.3 56.1 5.9 23.6
1 Lowest Sales 3.6 5.7 9.4 51.1 8.6 21.6
2 9.8 4.5 7.3 46 6.8 25.7
3 18.1 8.3 7.6 37 5.7 23.3
4 27.3 5.6 6.7 31.3 6.2 23.1
5 Highest Sales 50.2 3.4 7.3 19.2 2.8 17.2
Horticultural Sales High Value Crop Sales
Sales of Cereals and Tubers
Retained Cereals and Tubers
Livestock and Fishing Off-Farm
Page 13

3. RAPID APPRAISAL RESULTS Using the results of the horticultural stakeholder consultations and interviews with large farms, first sellers, retail traders, and urban consumers, we first present in this chapter an overview of the fresh produce marketing system serving Lusaka and Ndola. We then present specific results on the seasonality of production and marketing, the marketing behavior of large farmers around Lusaka, assembly and wholesaling processes, and the retail trade, including information from interviews of retail traders and consumers. We end the section by comparing prices of selected fresh produce in different types of retail outlets.
3.1 Overview of Fresh Produce Wholesaling and Retailing in Lusaka and Ndola Figure 6 shows a channel map for horticultural produce flowing into Lusaka; a map for Ndola would look similar. The map distinguishes between “small”, “medium”, and “large” flows of produce and, where possible, indicates the primary items flowing through each channel. Our qualitative classification of the size of each flow was based on information from all our sources: large farms, first sellers in wholesale markets, retail traders, and consumers. Boxes in the map, indicating major market segments, are drawn only to approximate size at farm and wholesale levels, because we don’t at this time have data that would allow us to quantify their importance; at retail, we do have preliminary estimates of the market shares of different types of outlets, and we indicate those in the figure. Several key features are worth noting, each of which we will treat in more detail in the sections that follow. First, while the smallholder sector undoubtedly dominates national production and also marketing into smaller urban areas, large farms located close to Lusaka and Ndola play a major role in supplying both markets. Second, smallholder farmers face more intermediation than do large farmers to reach these markets. Smallholders sell nearly all their cabbage, onion, banana, and orange to rural traders (“assemblers”) who go farm-to-farm purchasing product and then take it to the city; smallholders frequently bring their tomato and rape to Lusaka themselves, but are most likely to have to sell through brokers (who charge a commission), not directly to wholesalers. This intermediation serves a function, but also extracts a cost from these small farmers. Third, much of the volume coming into both cities is grown within a radius of 20-30 km of the cities; this is especially true for rape and tomato, while more transportable items like onions, cabbage, and bananas come from both nearby and more distant production zones. Significant volumes of onions and oranges reach wholesale markets from neighboring countries, while Freshmark imports apples, oranges, and perhaps other items. Fourth, very large open air wholesale markets in each city are the hubs around which the marketing system operates; traditional retailers source nearly all their produce from these markets, and larger operations such as Freshmark also rely on it for some of their supply. Finally, open air retail markets dominate retail trade in fresh produce, especially of vegetables. More definitive estimates of the retail market shares of various types of outlets will be available in 2007, on the basis of a statistically designed sample survey in Lusaka and other urban areas.
Page 14

Figure 6. Simplified Channel Map of Lusaka FFV System
Production
Assembly
W holesale
Retail
Wholesale Markets(Primarily Soweto in Lusaka, with some activity
in outlying markets; Main Masala market in Ndola)
Open Air Markets (70%-82%)Chain Supers
(7%-10%)
StreetVendor
9%)
FRSHMRK
PROC‘RS
NeighboringCountries
Small Farms Large Farms
Small Flow Medium Flow Large Flow
Onions, oranges
Rape, tomato
Cabbage, onion
Banana, Irish. pot.
Apples, oranges.
Tomato
NeighboringCountries
Various
SmallSupers
(7%-11%)
Other2%
Pineapple, tomato
Pineapple
Tomato
Tomato, Pineapple
Brokers
Assemblers
Cbg, onion,Banana,Orange
Page 15
3.2 Seasonality of Production and Marketing The seasonality of production and marketing of the six main FFV items was determined using information obtained from qualitative interviews with first sellers and brokers in Lusaka’s Soweto and Ndola’s Main Masala markets. The respondents were for each produce asked to score from 0 to 3 (0 denoting no supply, 3 highest supply) the supply of produce to the markets for each month of the year; they were also asked to give indications of the main sources of supply for each particular period. The scores from the five interviews for each produce item were averaged to derive the overall monthly qualitative supply assessment. These are presented in Figures 7-12, while information on the geographic origin of crops is shown in Figure 13. Rape shows one long peak season in each city, during the dry season from May to October in Lusaka and from April to September in Ndola. These findings explain the very little trading in rape that was witnessed in Ndola at the time of the survey at the end of October 2005. Rape in Lusaka is mostly supplied to markets by smallholder farmers from within 20-30 km of the city: Kafue, Chongwe, Chisamba, Mumbwa and Chibombo all year round. Similarly, in Ndola, rape is supplied by smallholder farmers in rural areas surrounding Ndola especially in areas towards the south and south east to Kapiri Mposhi and Mkushi respectively. Tomato shows two seasonal peaks in Lusaka, during April and May and again from August to October, with very little supply in the rainy season from November to March and also during the height of the dry season in June and July. The pattern is similar in Ndola except that the peaks are March/April and August/September. The difference in supply over the months in Ndola appears to be less sharp than in Lusaka. During the first peak of April/May, tomato in Lusaka is mostly supplied from areas very near the city; as availability declines, supplies arrive from the Chibombo/Chisamba area during the dry season. These areas produce little tomato in the rainy season (November to March) and hence the produce has to be sourced from further away in Mkushi during this period. Ndola markets are predominantly supplied with Mkushi tomato all year round. However, in the dry season, some tomato from Kabwe and Chibombo is supplied to these markets as well. The seasonality of cabbage supply in Lusaka is broadly comparable to that of tomato. The Lusaka market shows two pronounced seasonal peaks, with the highest from August to October, and a lower peak in April/May. In Ndola, the double peak is much less pronounced, with relatively high supplies from April through September, and lowest supplies in January/February. Lusaka is mostly supplied by commercial farmers around the city and from Chisamba all year round. Some of the notable suppliers are Lilayi Farms (mostly from March to October), C J Farm (all year round) and Vashe Farm (mostly from April to November). In Ndola, the main sources of supply are Mkushi, Kapiri Mposhi and Chibombo and some surrounding areas. Dry onion, like tomato and cabbage, shows a pronounced double peak in Lusaka, and substantially less seasonal variation in Ndola. Supply to Lusaka markets is high from January to May dropping in June/July and then picking up from August to October before declining again from November to its lowest level in December. In Ndola, supply increases
Page 16
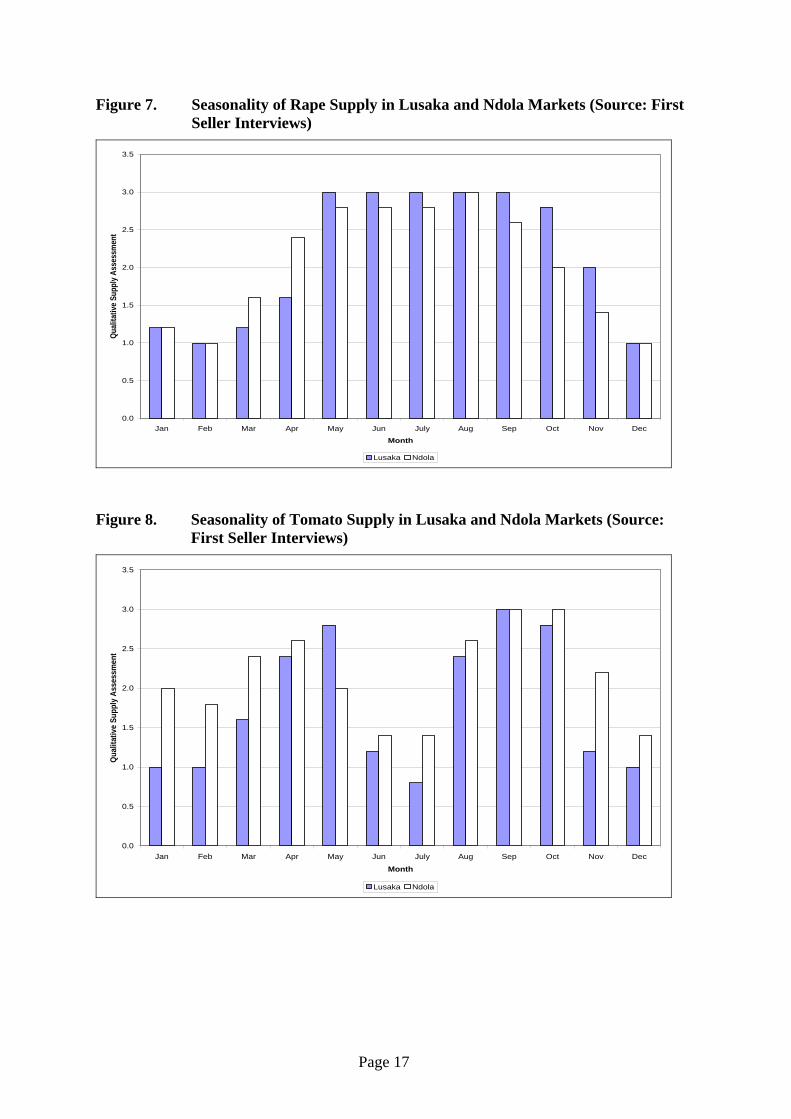
Figure 7. Seasonality of Rape Supply in Lusaka and Ndola Markets (Source: First Seller Interviews)
0.0
0.5
1.0
1.5
2.0
2.5
3.0
3.5
Jan Feb Mar Apr May Jun July Aug Sep Oct Nov Dec
Month
Quali
tativ
e Sup
ply A
sses
smen
t
Lusaka Ndola
Figure 8. Seasonality of Tomato Supply in Lusaka and Ndola Markets (Source: First Seller Interviews)
0.0
0.5
1.0
1.5
2.0
2.5
3.0
3.5
Jan Feb Mar Apr May Jun July Aug Sep Oct Nov Dec
Month
Qual
itativ
e Su
pply
Ass
essm
ent
Lusaka Ndola
Page 17

Figure 9. Seasonality of Cabbage Supply in Lusaka and Ndola Markets (Source: First Seller Interviews)
0.0
0.5
1.0
1.5
2.0
2.5
3.0
3.5
Jan Feb Mar Apr May Jun July Aug Sep Oct Nov Dec
Month
Quali
tativ
e Sup
ply A
sses
smen
t
Lusaka Ndola
Figure 10. Seasonality of Dry Onion Supply in Lusaka and Ndola Markets (Source: First Seller Interviews)
0.0
0.5
1.0
1.5
2.0
2.5
3.0
3.5
Jan Feb Mar Apr May Jun July Aug Sep Oct Nov Dec
Month
Qua
litat
ive
Supp
ly A
sses
smen
t
Lusaka Ndola
Page 18
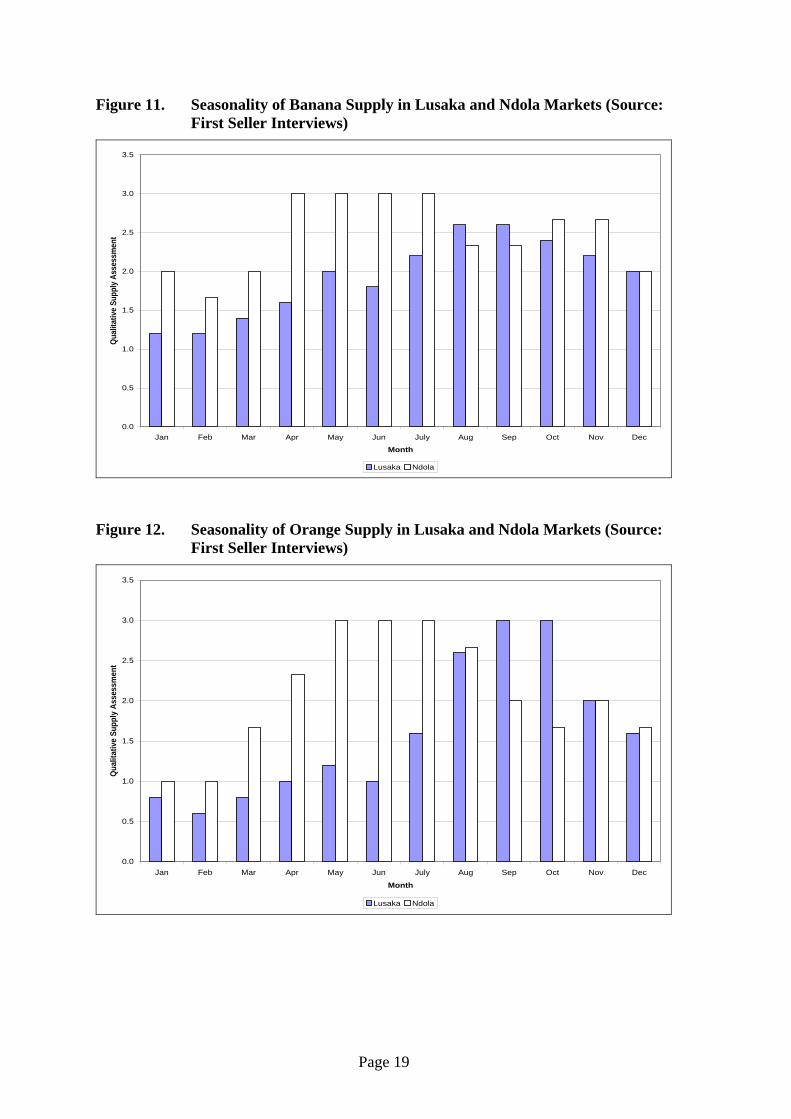
Figure 11. Seasonality of Banana Supply in Lusaka and Ndola Markets (Source: First Seller Interviews)
0.0
0.5
1.0
1.5
2.0
2.5
3.0
3.5
Jan Feb Mar Apr May Jun July Aug Sep Oct Nov Dec
Month
Qual
itativ
e Su
pply
Ass
essm
ent
Lusaka Ndola
Figure 12. Seasonality of Orange Supply in Lusaka and Ndola Markets (Source: First Seller Interviews)
0.0
0.5
1.0
1.5
2.0
2.5
3.0
3.5
Jan Feb Mar Apr May Jun July Aug Sep Oct Nov Dec
Month
Qual
itativ
e Su
pply
Ass
essm
ent
Lusaka Ndola
Page 19
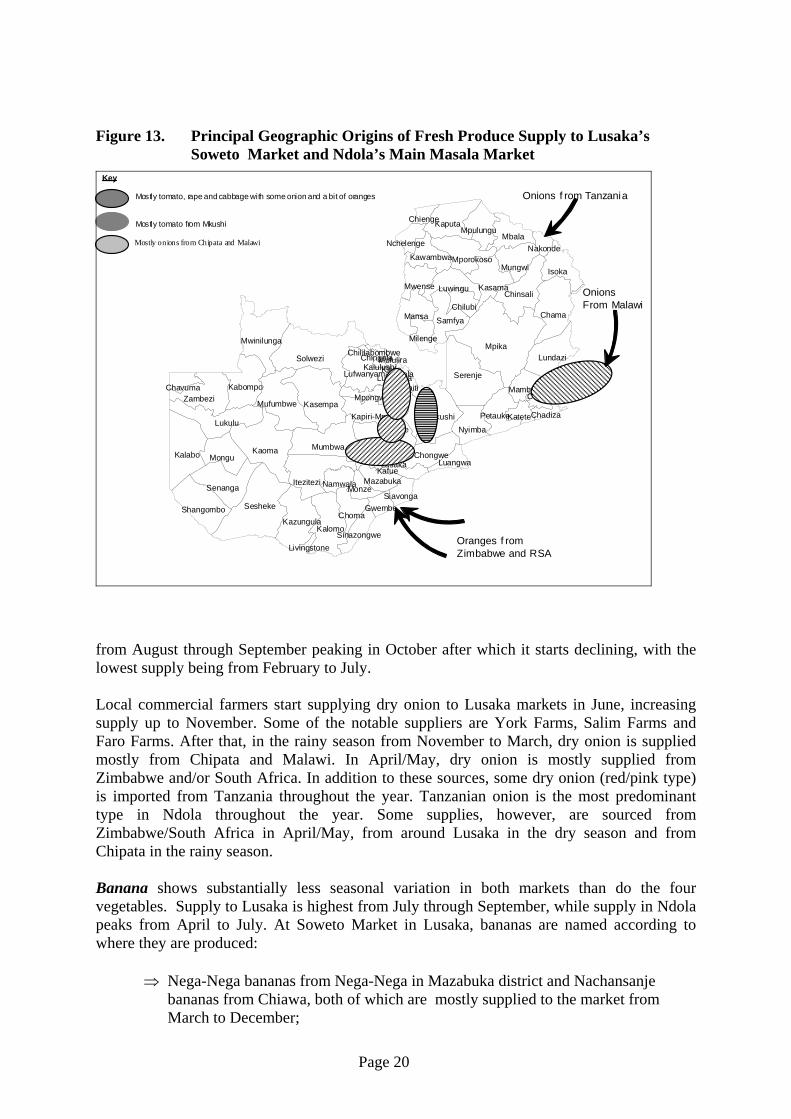
Figure 13. Principal Geographic Origins of Fresh Produce Supply to Lusaka’s Soweto Market and Ndola’s Main Masala Market
KaputaMpulungu
Chienge
MbalaNchelenge Nakonde
KawambwaMporokosoIsokaMungwi
KasamaChinsali
Mwense Luwingu
ChamaChilubi
Mansa Samfya
MwinilungaMpika
Milenge
Solwezi Lundazi
Serenje
ChililabombweChingola
Lufwanyama
Mufulira
Kabompo
KalulushiKitweNdola
KasempaMufumbwe
LuanshyaMambweMasaiti
ZambeziChavuma
Chipata
Mkushi
Mpongwe
Petauke LukuluKateteChadiza
Nyimba
KaomaKalaboMumbwa
Mongu ChongweLuangwa
KafueItezitezi
Lusaka
SenangaMazabuka
Sesheke
NamwalaMonze
ShangomboSiavonga
KazungulaChoma
Gwembe
KalomoSinazongwe
Livingstone
Kapiri-MposhiKabwe
Chibombo
Key
Mostly tomato, rape and cabbage with some onion and a bit of oranges
Mostly tomato from Mkushi
Mostly onions from Chipata and Malawi
Oranges f rom Zimbabwe and RSA
Onions From Malawi
Onions f rom Tanzania
from August through September peaking in October after which it starts declining, with the lowest supply being from February to July. Local commercial farmers start supplying dry onion to Lusaka markets in June, increasing supply up to November. Some of the notable suppliers are York Farms, Salim Farms and Faro Farms. After that, in the rainy season from November to March, dry onion is supplied mostly from Chipata and Malawi. In April/May, dry onion is mostly supplied from Zimbabwe and/or South Africa. In addition to these sources, some dry onion (red/pink type) is imported from Tanzania throughout the year. Tanzanian onion is the most predominant type in Ndola throughout the year. Some supplies, however, are sourced from Zimbabwe/South Africa in April/May, from around Lusaka in the dry season and from Chipata in the rainy season. Banana shows substantially less seasonal variation in both markets than do the four vegetables. Supply to Lusaka is highest from July through September, while supply in Ndola peaks from April to July. At Soweto Market in Lusaka, bananas are named according to where they are produced:
⇒ Nega-Nega bananas from Nega-Nega in Mazabuka district and Nachansanje bananas from Chiawa, both of which are mostly supplied to the market from March to December;
Page 20

⇒ Mununshi bananas from Mununshi Banana Scheme (a large plantation) in Luapula Province and Jerican bananas, each supplied to markets primarily from July to December.
Other supplies of bananas are from Mkushi and Sikongo. There are generally more sources of banana during the months from July to December in the Lusaka markets and this explains the high level of supply during these months. In Ndola, the main sources of banana are Mkushi and Fwankumba area in Luanshya district with some being imported from Tanzania. Orange is almost entirely imported from Zimbabwe/South Africa mainly from July to October when supply peaks in Lusaka markets. There are also local suppliers from Mkushi and areas surrounding Lusaka. The peak supply period in Ndola is from May to August, coinciding with the supply of orange from local growers. Otherwise the source of most of the orange in Ndola is Zimbabwe/South Africa.
3.3 Large Farm Supply to Lusaka We identified 10 large farms situated near Lusaka and interviewed managers of six. Farms interviewed around Lusaka are listed in Table 8, along with their location, areas of horticultural crops cultivated and volumes produced in 2004 and 2005, and main market destinations. Evergreen Farm and Faro farm both supply tomato and onion to the Lusaka market, selling all their produce in Soweto. Evergreen is a relatively large corporate farm with several agricultural activities beyond horticulture, while Faro is individually owned. Both farm managers indicate that Soweto is flooded with tomato from Mkushi during certain periods of the year. Neither farm exports fresh produce, due in part to the strong kwacha. Evergreen Farm cited disease problems in 2005 for the sharp reduction in tomato production and marketing. CJ Farms is a relatively new farm run by immigrants from China. Situated about 10 km west of the city, the farm produces only cabbages under irrigation, indicating that reduced borehole yield reduces their yield in the dry season. They plan to drill more and deeper bore holes to overcome this problem. Lilayi is a large corporate farm located about 10 km south of the city that grows wheat and perhaps other crops in addition to cabbage. Both CJ and Lilayi market all their cabbage in Soweto market. Ellensdale produces oranges about 20-30 km north of the city. They indicate that imports from Zimbabwe have competed heavily with their production since the early 1990s; the kwacha appreciation since late 2005 has aggravated this challenge for Ellensdale.
Page 21
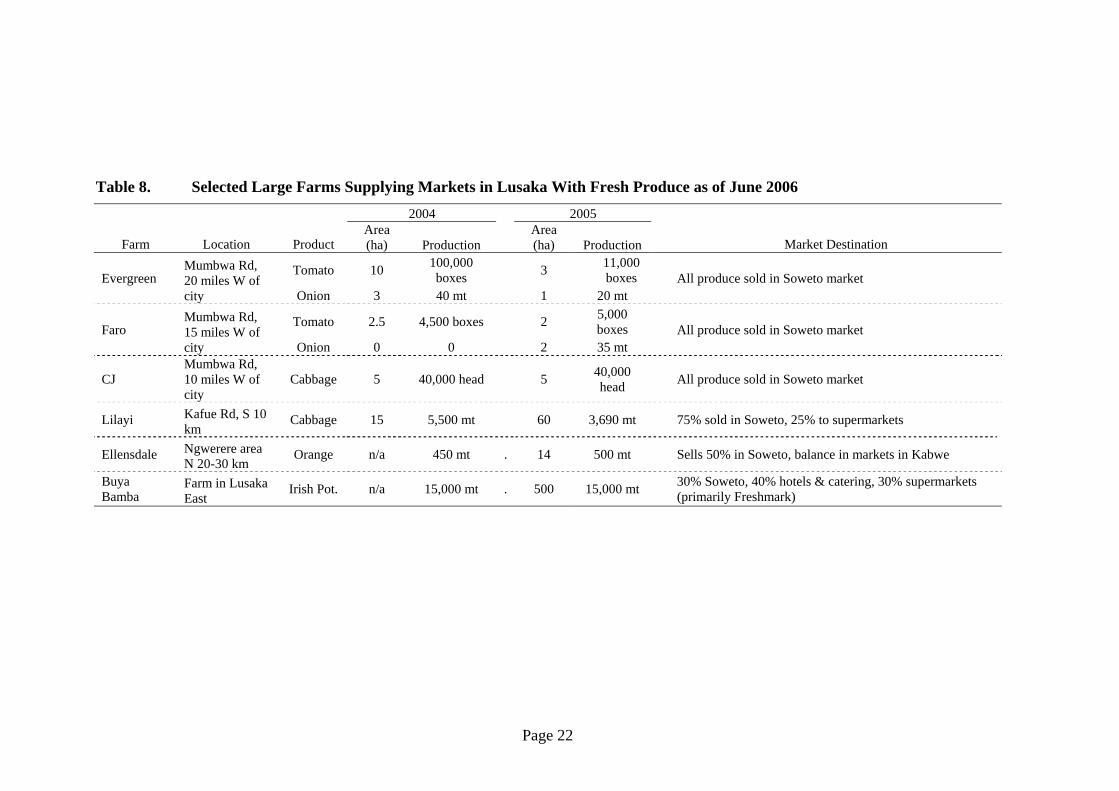
Table 8. Selected Large Farms Supplying Markets in Lusaka With Fresh Produce as of June 2006 2004 2005
Farm Location Product Area (ha) Production
Area (ha) Production Market Destination
Tomato 10 100,000 boxes 3 11,000
boxes Evergreen Mumbwa Rd, 20 miles W of city Onion 3 40 mt 1 20 mt
All produce sold in Soweto market
Tomato 2.5 4,500 boxes 2 5,000 boxes Faro
Mumbwa Rd, 15 miles W of city Onion 0 0 2 35 mt
All produce sold in Soweto market
CJ Mumbwa Rd, 10 miles W of city
Cabbage 5 40,000 head 5 40,000 head
All produce sold in Soweto market
Lilayi Kafue Rd, S 10 km
Cabbage 15 5,500 mt 60 3,690 mt
75% sold in Soweto, 25% to supermarkets
Ellensdale Ngwerere area N 20-30 km
Orange n/a 450 mt . 14 500 mt
Sells 50% in Soweto, balance in markets in Kabwe
Buya Bamba
Farm in Lusaka East
Irish Pot. n/a 15,000 mt . 500 15,000 mt
30% Soweto, 40% hotels & catering, 30% supermarkets (primarily Freshmark)
Page 22

Buya Bamba is a large farm east of the city that produced 500 ha of Irish potation 2005. They add value to their potatoes by washing and bagging on the farm, then follow an up-market and diversified marketing strategy, selling about 30% into Soweto, 40% to hotels and catering services, and 30% to supermarkets; the latter goes primarily to Freshmark (supplier to Shoprite), and secondarily to small supermarkets. Buya Bamba indicates that imported potato compete heavily for its market.
3.4 Assembly and Wholesaling
3.4.1 Marketing Channels The previous section showed that most fresh produce supplying Lusaka and Ndola is produced within a radius of 20-30 km of the cities. Exceptions to this general pattern are the less perishable fresh produce items, such as onions from Eastern province, Malawi, and Tanzania, and oranges from Zimbabwe and RSA. Very poor transport infrastructure also contributes to the geographically concentrated nature of fresh produce production for market, since it increases the time and physical damage the produce must endure before reaching market. All these factors combine to create a decentralized rural assembly system in Zambia. Rather than passing through major rural assembly markets, farmers either transport their produce directly to wholesale markets or, more commonly, they sell to traders traveling assembly routes; these traders then travel directly to their urban destination market once they have filled their (typically small) truck. Produce reaches Lusaka and Ndola through four main channels:
• From farmers or traders within Zambia or in neighboring countries to Soweto market in Lusaka and Main Masala market in Ndola. In each city, this channel carries at least 80% of all fresh produce;
• From domestic farmers or traders to Freshmark, the wholesale marketing agent for
Shoprite supermarkets;
• From traders in neighboring countries to Freshmark;
• From farmers or traders to Freshpikt, a modern horticultural processing facility in Lusaka; and
The next paragraphs discuss each of these channels. Fresh produce wholesaling in Lusaka and Ndola is highly concentrated in Soweto market and Main Masala market, respectively. Both markets feature very tightly packed rudimentary structures for trading, very little paving of access roads or walkways, and narrow access roads which often require that trucks turn around and go out the way they came once they have unloaded. Garbage and refuse collection is intermittent. As a result, the markets are extremely dusty in the dry season, muddy and “fragrant” in the wet season, and congested and chaotic during both seasons. In marked contrast is City Market next to Soweto, which is
Page 23
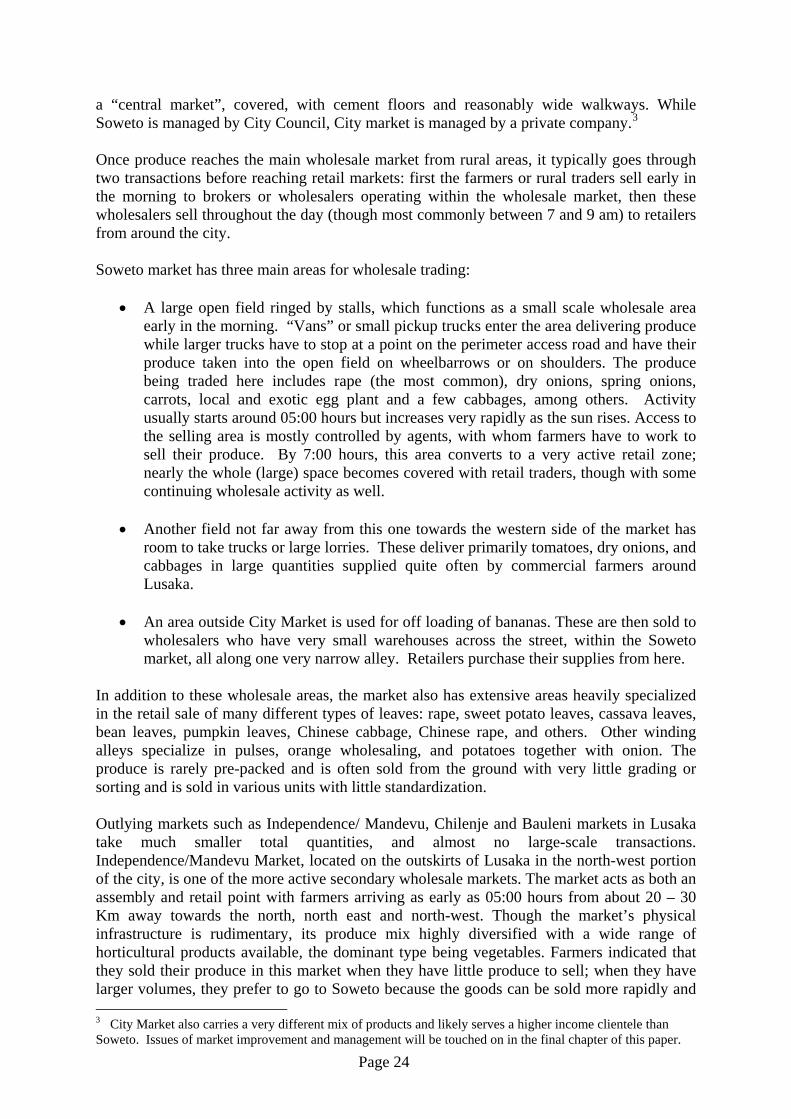
a “central market”, covered, with cement floors and reasonably wide walkways. While Soweto is managed by City Council, City market is managed by a private company.3
Once produce reaches the main wholesale market from rural areas, it typically goes through two transactions before reaching retail markets: first the farmers or rural traders sell early in the morning to brokers or wholesalers operating within the wholesale market, then these wholesalers sell throughout the day (though most commonly between 7 and 9 am) to retailers from around the city. Soweto market has three main areas for wholesale trading:
• A large open field ringed by stalls, which functions as a small scale wholesale area early in the morning. “Vans” or small pickup trucks enter the area delivering produce while larger trucks have to stop at a point on the perimeter access road and have their produce taken into the open field on wheelbarrows or on shoulders. The produce being traded here includes rape (the most common), dry onions, spring onions, carrots, local and exotic egg plant and a few cabbages, among others. Activity usually starts around 05:00 hours but increases very rapidly as the sun rises. Access to the selling area is mostly controlled by agents, with whom farmers have to work to sell their produce. By 7:00 hours, this area converts to a very active retail zone; nearly the whole (large) space becomes covered with retail traders, though with some continuing wholesale activity as well.
• Another field not far away from this one towards the western side of the market has
room to take trucks or large lorries. These deliver primarily tomatoes, dry onions, and cabbages in large quantities supplied quite often by commercial farmers around Lusaka.
• An area outside City Market is used for off loading of bananas. These are then sold to
wholesalers who have very small warehouses across the street, within the Soweto market, all along one very narrow alley. Retailers purchase their supplies from here.
In addition to these wholesale areas, the market also has extensive areas heavily specialized in the retail sale of many different types of leaves: rape, sweet potato leaves, cassava leaves, bean leaves, pumpkin leaves, Chinese cabbage, Chinese rape, and others. Other winding alleys specialize in pulses, orange wholesaling, and potatoes together with onion. The produce is rarely pre-packed and is often sold from the ground with very little grading or sorting and is sold in various units with little standardization. Outlying markets such as Independence/ Mandevu, Chilenje and Bauleni markets in Lusaka take much smaller total quantities, and almost no large-scale transactions. Independence/Mandevu Market, located on the outskirts of Lusaka in the north-west portion of the city, is one of the more active secondary wholesale markets. The market acts as both an assembly and retail point with farmers arriving as early as 05:00 hours from about 20 – 30 Km away towards the north, north east and north-west. Though the market’s physical infrastructure is rudimentary, its produce mix highly diversified with a wide range of horticultural products available, the dominant type being vegetables. Farmers indicated that they sold their produce in this market when they have little produce to sell; when they have larger volumes, they prefer to go to Soweto because the goods can be sold more rapidly and 3 City Market also carries a very different mix of products and likely serves a higher income clientele than Soweto. Issues of market improvement and management will be touched on in the final chapter of this paper.
Page 24

at higher prices. Even in Independence/ Mandevu, farmers usually sell through brokers. Nearly all traders at Independence/Mandevu Market were found to be female. Traders in these outlying markets appear more likely than those in Soweto to travel to farmers to seek produce. They start with the nearest areas, typically within 10 km of the market, and expand their reach to perhaps 50 km as produce finishes in the nearby areas. If buying from smallholder farmers, they typically team up and hire a “van” (small pickup truck); commercial farmers will sometimes provide them with transport when they buy in sufficient bulk. The main imported produce flowing into wholesale markets is dry onion from Tanzania and Malawi (it also comes from Chipata), and orange from Zimbabwe and South Africa. Quite a lot of wholesaling of oranges from Zimbabwe takes place in City Market, right next to Soweto. Freshmark is the main corporate wholesaler of FFVs and supplies primarily the Shoprite chain of stores. The main distribution center is in Lusaka, with a smaller depot in Kitwe to handle produce from the north. Though the company policy is to stick to their preferred suppliers, they do buy from brokers, who operate both in the open market and with farmers they know; pineapples from Solwezi all come from brokers, who buy from small farmers. According to Freshmark management, work with smallholder farmer groups has shown little success due to inconsistent supply. However, at the time of the study, the company worked with about 20-30 independent smallholders, half of whom had been supplying the company with fresh vegetables for several years. The company does not guarantee prices but sets up a weekly delivery calendar, specifying what quantity of what product they will buy during all 52 weeks of the year. These same farmers will also sell into Soweto Market or, if they have insufficient produce from their own production to meet the delivery quota, will buy in Soweto for delivery to Freshmark. The company does not object to this practice as long as the farmer delivers the quantities needed with acceptable quality. Freshmark visually inspects arriving produce for quality, focusing mostly on length or weight or color ranges for individual items. Watermelons, oranges, and perhaps some others are periodically tested for sugar content. Beyond assuring freshness, food safety has not yet become an explicit focus for Freshmark buyers. The company indicated that there has been a marked increase in sales during the past two years, due to Zimbabweans coming over the border in the south to buy, and in Solwezi due to the re-opening of the mines. The most sold products, in order, are bananas, apples, and potatoes. Bananas are all purchased from local sources (Chirundu, Kapiri Mposhi, and Kitwe), and 90% of the potatoes are locally sourced, mostly from commercial farmers around Lusaka, through brokers. All apples and substantial amounts of orange are imported. In addition to the above channels, some producers/traders directly supply institutional customers such as restaurants, hotels, supermarkets, government institutions like schools, hospitals, colleges, etc, corporate wholesalers such as Freshmark, and sometimes households. Freshpikt is the only large-scale processor of horticultural produce in the country. The company purchased a very modern but run-down plant from Zamhort, a defunct parastatal company, in 2001, and spent the past four years rehabilitating it. At full capacity, the plant could process up to 80 metric tons of tomatoes per day and 800 metric tons of beans per year;
Page 25

these quantities would present an enormous potential new market for Zambian horticultural producers. The company began processing tomatoes in June 2006, and is now processing 30 metric tons per day for tomato paste and canned tomatoes. While most production is of a special canning variety that comes from its own farm (HTX14 and Ercole Philadephia), the company has signed contracts with some smallholders to produce the same variety; it also sources traditional varieties (which have lower solids content and whose use therefore needs to be limited) from other contracted growers, from walk-in sellers at its plant, and direct from the market. With the assistance of the MATEP and PROFIT projects (funded by USAID), the company is running a smallholder out-grower scheme, initially targeting smallholders that previously worked with the defunct Agriflora. These work through the Lubulima Agricultural and Commercial Cooperative Union (LACCUN) which has 6 member cooperative unions within the outskirts of Lusaka. The programme currently has about 200 members contracted by Freshpikt to grow sweet corn and beans (teebus) under irrigation. About 20 ha of beans and 11 ha of sweet corn have been planted this irrigation season. Freshpikt arranges financing for inputs through the Agri-Business Forum (which directly pays input suppliers), and assists with viability appraisal and technical backstopping of the clients. A number of smallholder farmers have started going into contract farming for special tomato varieties. The scheme started operations in and around Lusaka but the company plans to explore potential in Mumbwa, Chongwe, Petauke in Eastern province (for oranges), and Mwinilunga (for pineapple). Baked beans come from the company’s contracted smallholders and also from independent smallholders around Mbala in Northern Province. Pineapples come entirely from smallholder production around Solwezi and are used for canned pineapple and juice concentrate. Plans for the future include canned guavas, guava concentrate, and mango concentrate; processing of the latter depends on new processing equipment which the company does not yet have. Mango supply would come from the huge volume produced around Lusaka, much of which currently rots. The stringy varieties most commonly found in Zambia give more consistent juice quality than the softer varieties, which are strongly preferred for eating. The key quality issue for tomatoes is solids content: they require 4% in most of what they buy. Tomatoes sold in Soweto reportedly have about 2% solids, which is too low for canning, though a small amount of these varieties can be mixed with the proper variety without affecting quality of the final product. For pineapple, the main quality issues are proper transport, to avoid crushing, and the timing of cutting - this has to be done at the right time for the pineapples to be acceptable to Freshpikt. The company has an aggressive regional marketing plan; Zambia is an important but small part of their target market. The company has existing relationships with distributors in South Africa, and much interest and contacts from Zimbabwe. The DRC, Angola, Tanzania, and Malawi are also targets. If the company is successful in exporting to these markets, it would provide a vast and relatively stable source of demand for fresh produce from Zambian farmers. Export to the European Union and U.S. first requires Hazard Analysis and Critical Control Point, or HACCP certification. The company is currently considering setting-up a tomato wholesaling operation at its processing plant. Managers indicate that they could consistently supply five metric tons per day to the fresh market.
Page 26

3.4.2 Fist Seller Characteristics We interviewed 31 first sellers, 12 female and 19 male, of rape, tomato, cabbage, dry onion, banana and orange. At the time of the survey (November/December, 2005), rape at Soweto came entirely from Lusaka province, from the districts of Lusaka (67%), Kafue, and Chongwe (17% each). About 40% of the tomato was sourced from Mkushi of Central province, followed by Lusaka and Chongwe of Lusaka province, and Chibombo of Central. All cabbage first sellers sourced the produce from Lusaka district, while those selling dry onion, banana and orange sourced their produce from Chipata, Chirundu (Southern Province), and Harare, Zimbabwe respectively. As noted earlier in the report, the source of supply will vary over the course of the year, so these figures should not be taken as representative of year-round patterns; Figure 13 used various sources of information to show the main supply areas to the city. The survey provides some evidence that farmers are more likely to bring more perishable items such as tomato and rape to the wholesale market for sale; all the sellers of cabbage, dry onion, banana and orange were traders who had purchased the produce from farmers in rural areas (acting as “assemblers”), while four out of the six rape sellers, and three out of seven tomato sellers, were farmers selling only their own production. Though sample numbers are small, these patterns are consistent with expectations, since less perishable items can withstand more transactions without losing quality before reaching their destination market; these items also tend to come from longer distances, making it less likely that farmers will do their own marketing at wholesale. About two-thirds of first sellers operated in the market between once and several times per week. The role of agents or brokers in wholesale markets is a contentious issue in many countries.4 In Soweto, the use of brokers by first sellers appears to depend on the type of FFV being traded, and on whether the individual was a farmer selling his own produce, or a trader with more experience in the market. Tomato, rape and cabbage sellers predominantly sold through brokers while those selling dry onion, banana and orange did not (see Figure 14). Of the seven farmers selling only their own produce, five sold through brokers; among the 23 traders who were selling only produce that they had purchased, only eight sold through brokers. Farmers have mixed opinions of brokers. One farmer selling at Independence/Mandevu Market in Lusaka intimated that he was forced to sell through brokers via threats of stealing his products if he tried to sell on his own. On the other hand, a group of FFV farmers involved in a micro-irrigation project encountered in Lwiimba area of Chongwe district, who regularly supply Soweto market and, to a lesser extent Bauleni and Chilenje markets, were of the opinion that these brokers did provide some level of service. Though they charged about 10% commission on sales, mutual relationships with them develop over time and ones’ produce rarely got stolen when entrusted to such agents. The group reiterated that, in spite of this, incidents of the agents adding price mark ups which they took for themselves without the farmers’ knowledge, in addition to the commission, are reportedly common, and that farmers who do not know these agents well are at higher risk of experiencing these problems.
4 See Tschirley and Ayieko (2006) for a discussion of the issue in Kenya.
Page 27
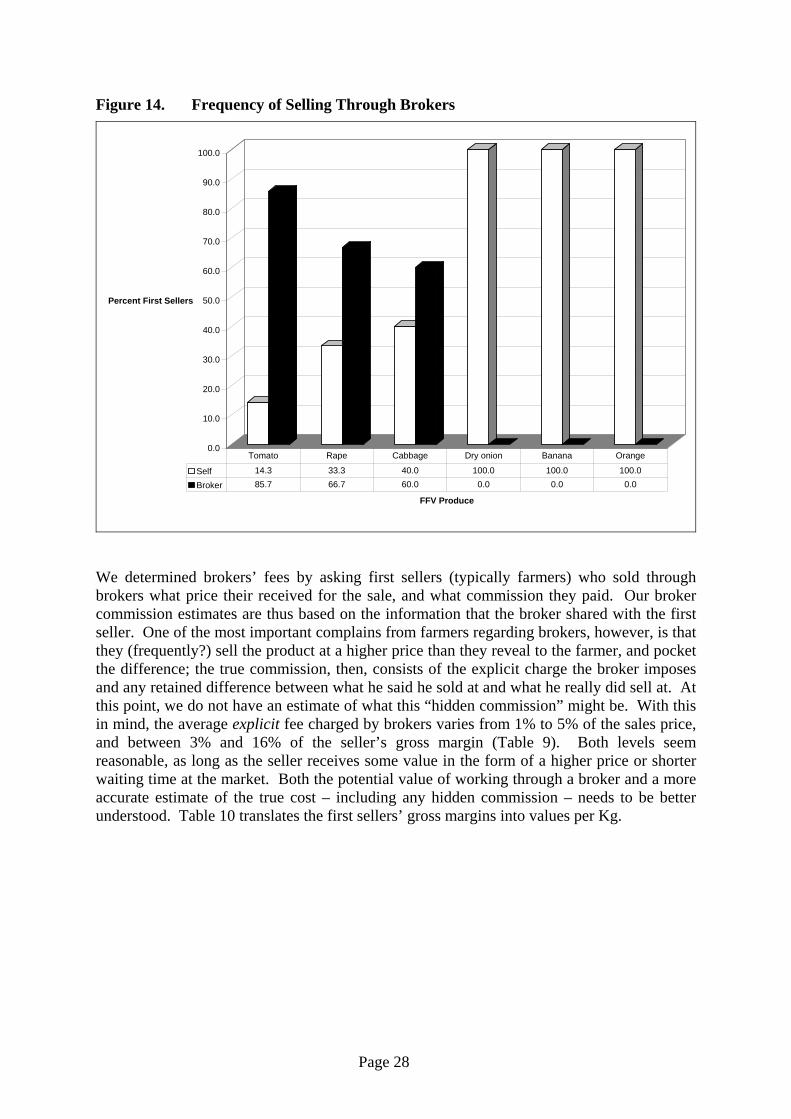
Figure 14. Frequency of Selling Through Brokers
0.0
10.0
20.0
30.0
40.0
50.0
60.0
70.0
80.0
90.0
100.0
Percent First Sellers
FFV Produce
Self 14.3 33.3 40.0 100.0 100.0 100.0
Broker 85.7 66.7 60.0 0.0 0.0 0.0
Tomato Rape Cabbage Dry onion Banana Orange
We determined brokers’ fees by asking first sellers (typically farmers) who sold through brokers what price their received for the sale, and what commission they paid. Our broker commission estimates are thus based on the information that the broker shared with the first seller. One of the most important complains from farmers regarding brokers, however, is that they (frequently?) sell the product at a higher price than they reveal to the farmer, and pocket the difference; the true commission, then, consists of the explicit charge the broker imposes and any retained difference between what he said he sold at and what he really did sell at. At this point, we do not have an estimate of what this “hidden commission” might be. With this in mind, the average explicit fee charged by brokers varies from 1% to 5% of the sales price, and between 3% and 16% of the seller’s gross margin (Table 9). Both levels seem reasonable, as long as the seller receives some value in the form of a higher price or shorter waiting time at the market. Both the potential value of working through a broker and a more accurate estimate of the true cost – including any hidden commission – needs to be better understood. Table 10 translates the first sellers’ gross margins into values per Kg.
Page 28
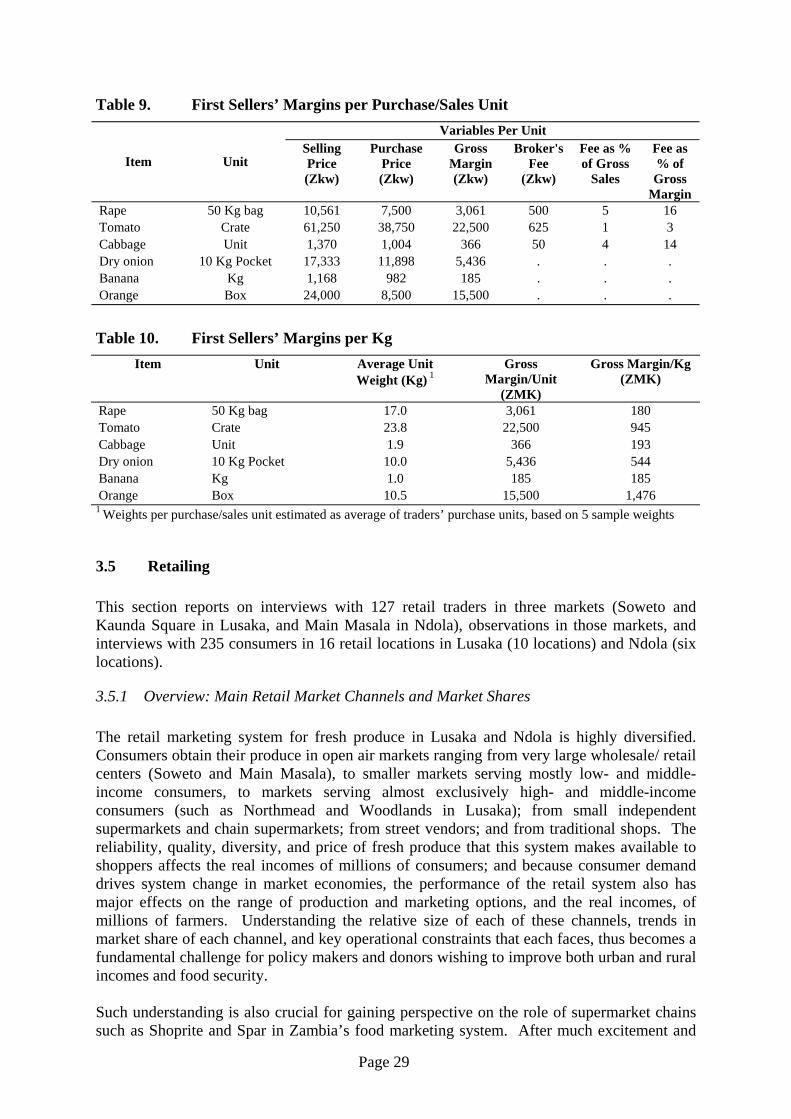
Table 9. First Sellers’ Margins per Purchase/Sales Unit Variables Per Unit
Item Unit Selling Price (Zkw)
Purchase Price (Zkw)
Gross Margin (Zkw)
Broker's Fee
(Zkw)
Fee as % of Gross
Sales
Fee as % of Gross
Margin Rape 50 Kg bag 10,561 7,500 3,061 500 5 16 Tomato Crate 61,250 38,750 22,500 625 1 3 Cabbage Unit 1,370 1,004 366 50 4 14 Dry onion 10 Kg Pocket 17,333 11,898 5,436 . . . Banana Kg 1,168 982 185 . . . Orange Box 24,000 8,500 15,500 . . .
Table 10. First Sellers’ Margins per Kg Item Unit Average Unit
Weight (Kg) 1Gross
Margin/Unit (ZMK)
Gross Margin/Kg (ZMK)
Rape 50 Kg bag 17.0 3,061 180 Tomato Crate 23.8 22,500 945 Cabbage Unit 1.9 366 193 Dry onion 10 Kg Pocket 10.0 5,436 544 Banana Kg 1.0 185 185 Orange Box 10.5 15,500 1,476
1 Weights per purchase/sales unit estimated as average of traders’ purchase units, based on 5 sample weights
3.5 Retailing This section reports on interviews with 127 retail traders in three markets (Soweto and Kaunda Square in Lusaka, and Main Masala in Ndola), observations in those markets, and interviews with 235 consumers in 16 retail locations in Lusaka (10 locations) and Ndola (six locations).
3.5.1 Overview: Main Retail Market Channels and Market Shares The retail marketing system for fresh produce in Lusaka and Ndola is highly diversified. Consumers obtain their produce in open air markets ranging from very large wholesale/ retail centers (Soweto and Main Masala), to smaller markets serving mostly low- and middle-income consumers, to markets serving almost exclusively high- and middle-income consumers (such as Northmead and Woodlands in Lusaka); from small independent supermarkets and chain supermarkets; from street vendors; and from traditional shops. The reliability, quality, diversity, and price of fresh produce that this system makes available to shoppers affects the real incomes of millions of consumers; and because consumer demand drives system change in market economies, the performance of the retail system also has major effects on the range of production and marketing options, and the real incomes, of millions of farmers. Understanding the relative size of each of these channels, trends in market share of each channel, and key operational constraints that each faces, thus becomes a fundamental challenge for policy makers and donors wishing to improve both urban and rural incomes and food security. Such understanding is also crucial for gaining perspective on the role of supermarket chains such as Shoprite and Spar in Zambia’s food marketing system. After much excitement and
Page 29
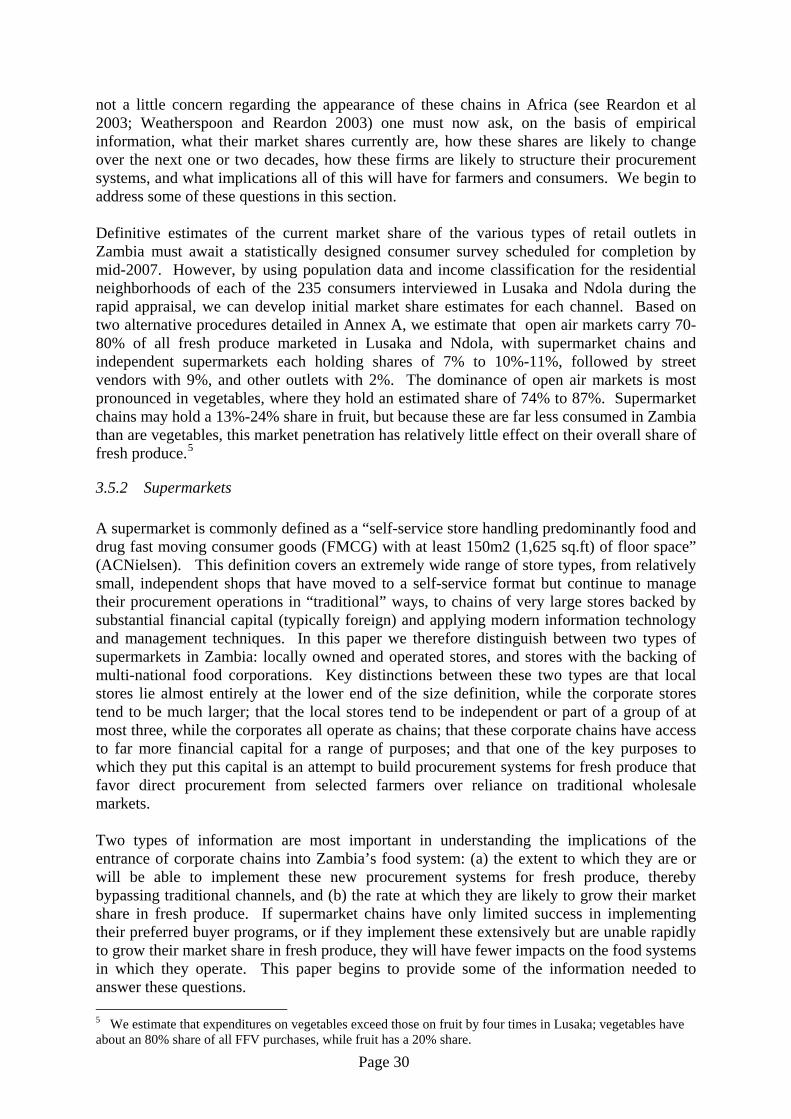
not a little concern regarding the appearance of these chains in Africa (see Reardon et al 2003; Weatherspoon and Reardon 2003) one must now ask, on the basis of empirical information, what their market shares currently are, how these shares are likely to change over the next one or two decades, how these firms are likely to structure their procurement systems, and what implications all of this will have for farmers and consumers. We begin to address some of these questions in this section. Definitive estimates of the current market share of the various types of retail outlets in Zambia must await a statistically designed consumer survey scheduled for completion by mid-2007. However, by using population data and income classification for the residential neighborhoods of each of the 235 consumers interviewed in Lusaka and Ndola during the rapid appraisal, we can develop initial market share estimates for each channel. Based on two alternative procedures detailed in Annex A, we estimate that open air markets carry 70-80% of all fresh produce marketed in Lusaka and Ndola, with supermarket chains and independent supermarkets each holding shares of 7% to 10%-11%, followed by street vendors with 9%, and other outlets with 2%. The dominance of open air markets is most pronounced in vegetables, where they hold an estimated share of 74% to 87%. Supermarket chains may hold a 13%-24% share in fruit, but because these are far less consumed in Zambia than are vegetables, this market penetration has relatively little effect on their overall share of fresh produce.5
3.5.2 Supermarkets A supermarket is commonly defined as a “self-service store handling predominantly food and drug fast moving consumer goods (FMCG) with at least 150m2 (1,625 sq.ft) of floor space” (ACNielsen). This definition covers an extremely wide range of store types, from relatively small, independent shops that have moved to a self-service format but continue to manage their procurement operations in “traditional” ways, to chains of very large stores backed by substantial financial capital (typically foreign) and applying modern information technology and management techniques. In this paper we therefore distinguish between two types of supermarkets in Zambia: locally owned and operated stores, and stores with the backing of multi-national food corporations. Key distinctions between these two types are that local stores lie almost entirely at the lower end of the size definition, while the corporate stores tend to be much larger; that the local stores tend to be independent or part of a group of at most three, while the corporates all operate as chains; that these corporate chains have access to far more financial capital for a range of purposes; and that one of the key purposes to which they put this capital is an attempt to build procurement systems for fresh produce that favor direct procurement from selected farmers over reliance on traditional wholesale markets. Two types of information are most important in understanding the implications of the entrance of corporate chains into Zambia’s food system: (a) the extent to which they are or will be able to implement these new procurement systems for fresh produce, thereby bypassing traditional channels, and (b) the rate at which they are likely to grow their market share in fresh produce. If supermarket chains have only limited success in implementing their preferred buyer programs, or if they implement these extensively but are unable rapidly to grow their market share in fresh produce, they will have fewer impacts on the food systems in which they operate. This paper begins to provide some of the information needed to answer these questions. 5 We estimate that expenditures on vegetables exceed those on fruit by four times in Lusaka; vegetables have about an 80% share of all FFV purchases, while fruit has a 20% share.
Page 30
Local supermarkets sell mostly tomato, onion, cabbage, and FFVs preferred by high income groups, such as cauliflower, broccoli, spinach, carrots, exotic egg plants, tangerines and apples. The traditional, higher volume items are typically procured in wholesale markets, while some of the specialty items come from direct arrangements with farmers. There are a number of small local supermarkets in the central business district of Ndola but in Lusaka they tend to be concentrated in high income residential areas. In each city, they are mostly patronized by residents of high income areas. Quite often, the produce is pre-packed and refrigerated with prices quoted per kg. Leafy vegetables in these outlets do not store very well even when refrigerated as they easily wilt; demand for these products is therefore low in these stores. Melissa supermarket has three outlets, but most others consist of single stores. The largest corporate supermarket chain in Zambia is Shoprite Checkers. This company has a total of 18 outlets across the country, the first of which was opened on Cairo Road, Lusaka in October 1995 and the last being at Manda Hill Shopping Centre in October 1999. One of these 18 is a wholesale outlet on Kafue Road in Lusaka. Shoprite outlets sell a variety of FFVs but mainly fruits such as apples, bananas, grapes and oranges. The main vegetables sold are tomato, cabbage, onion and Irish potatoes, plus many exotic items preferred by high income groups. As in the local supermarkets, the range of leafy vegetables is very limited as compared to that found in markets. In fact, during visits in September 2005, no leafy vegetables were found in the two Shoprite outlets located in middle-income residential areas of Lusaka (Matero and Chilenje), and the produce manager in Chilenje confirmed that the store had quit carrying them due to their inability to compete on price and quality with open air markets.
3.5.3 Types of open air retail markets Open air retail market places can be distinguished based on various measures of size (number of traders, total volume or value transacted), by the relative importance of different types or levels of transactions (wholesale or retail), and by the type of clientele they primarily serve (high/middle income, or low/middle income). Both Lusaka and Ndola have one dominant market – often called the main market -- and many associated markets -- often referred to as residential area markets. We have already noted that in each city, the vast majority of wholesale transactions take place in the main market, and retail volume is also substantially larger in the main market than in any other single market. At retail level, the main markets dominantly serve low/middle income consumers. Among the residential markets, wholesale transactions are much smaller and intermittent, where they exist. Most of these also serve low/middle income consumers, though some, such as Northmead and Woodlands in Lusaka, serve primarily a high and middle income clientele. An additional important characteristic of markets in Zambia is who manages them. In practice, markets can be managed either by the City Council, or by Marketeer Cooperatives, though some in the Ministry of Local Government and Housing suggest that all markets legally belong to the City Council. Disagreements between City Council and Marketeer Cooperatives (including the Lusaka Association of Marketeer Cooperatives) over management of the markets, use of marketeer fees, and title to land have been at the center of serious disputes in recent years.
Page 31
Most of the Lusaka City Council markets such as Matero and Chilenje were council taverns used for selling opaque beer. After the collapse of these taverns, and in response to the then United National Independence Party (UNIP) Government’s call for formation of co-operatives as part of its ‘Humanism’ philosophy, community members formed marketeer cooperatives (actually called Humanism Cooperatives at the time) and built stalls in these taverns from which to sell their fresh produce and other products. These are the markets which were taken over by the city council as the structures legally belonged to the council. In these markets, both the City Council through its Market Advisory Committees, and the marketeers through their cooperatives, participate in market management. Marketeers pay daily levies to the City Council as well as contributions to their respective cooperatives. Apart from these City Council markets, other markets were developed by community members who put up the infrastructure (of varying permanence) and formed cooperatives to run the markets. These markets are now considered “cooperative markets” which mostly do not pay levies to the city council. Monies collected are used for the benefit of the members. The Lusaka Union of Marketeer Co-operatives, the umbrella body of these markets in Lusaka, welcomes Government’s recent decision to introduce market management boards as long as its membership is not sidelined in the process. An additional concern of marketeers regards title to the land on which the market operates, as in many cases the cooperatives do not have title and traders are therefore subject to risk of eventual ejection. The EU-funded Urban Markets Development Program (UMDP) is a major effort to improve urban marketing in Zambia by improving physical infrastructure and promoting a new market management model. See section 3.7 for more detail on this program.
3.5.4 Retail trader behavior The retail trader survey targeted 10 traders each of tomato, rape, dry onion, cabbage, banana, and orange in both Soweto and Kaunda Square Stage 1 markets in Lusaka, and 10 traders each of the four vegetables in Main Masala market in Ndola. Banana and orange were included in Lusaka not because their volume was thought to be comparable to that of the vegetables, but to include two of the more important fruits in the survey. In the end, very few traders of banana and orange were found in Lusaka, so these two items were dropped from the survey in Ndola. All fresh produce items that a trader sold were enumerated, and each trader was allowed to “count” towards any of the six focus items that he or she sold; as a result, maximum trader interviews, in the event that every trader carried only the one product of interest, were 60 each in Soweto and Kaunda Square, and 40 in Main Masala. Other than our items of interest, the most commonly sold FFV items were pumpkin leaves and okra, and green leafy vegetables (pumpkin leaves and others) were the most common type of item sold, accounting for five out of the seven non-focus items in Soweto, 23/55 in Kaunda Square, and 9/15 in Main Masala. Table 11 shows numbers of trader interviews, along with basic indicators for each market. Two patterns emerge. First, traders in Soweto stand out for being highly specialized but much larger than their counterparts in the other markets; Soweto traders carry an average of only 1.2 FFV items, about one-half and one-quarter the number carried by traders in Main Masala and Kaunda Square, respectively, but they typically sell 2-4 times as much volume of any individual item, which results in their generating the highest weekly gross sales among all markets. Kaunda Square traders are the most diversified and also generate the lowest
Page 32
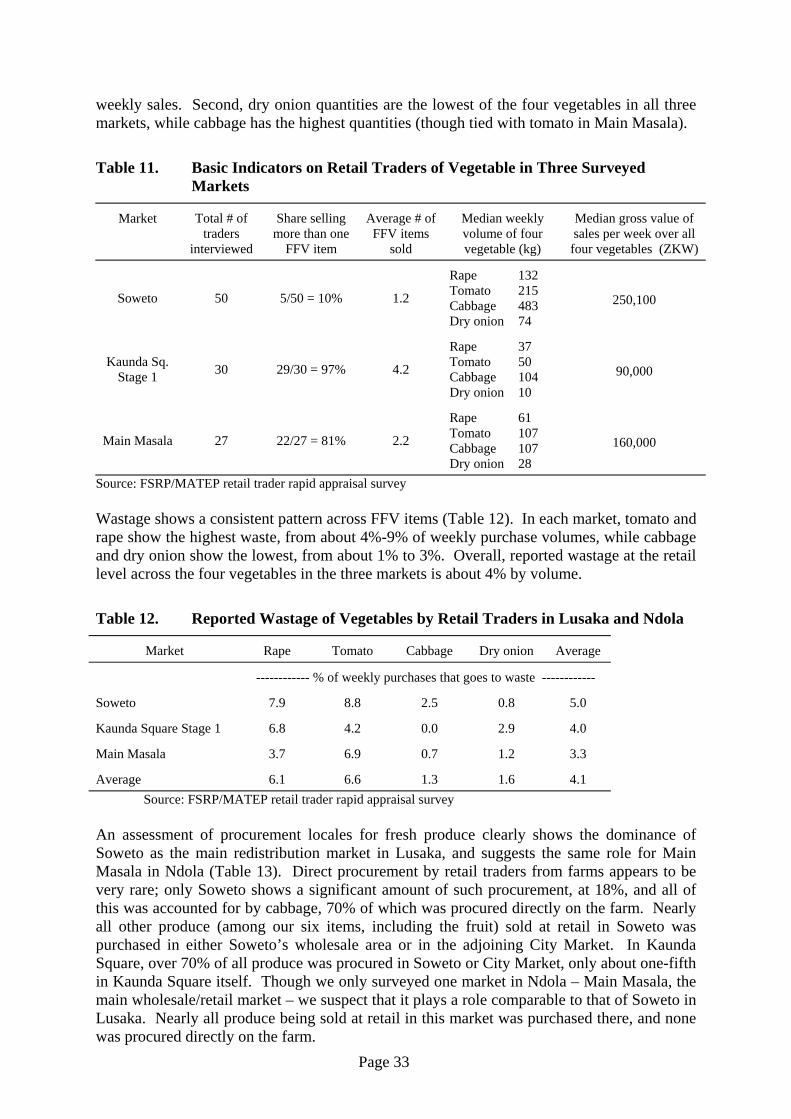
weekly sales. Second, dry onion quantities are the lowest of the four vegetables in all three markets, while cabbage has the highest quantities (though tied with tomato in Main Masala).
Table 11. Basic Indicators on Retail Traders of Vegetable in Three Surveyed Markets
Market Total # of traders
interviewed
Share selling more than one
FFV item
Average # of FFV items
sold
Median weekly volume of four vegetable (kg)
Median gross value of sales per week over all four vegetables (ZKW)
Soweto 50 5/50 = 10% 1.2
Rape 132 Tomato 215 Cabbage 483 Dry onion 74
250,100
Kaunda Sq. Stage 1 30 29/30 = 97% 4.2
Rape 37 Tomato 50 Cabbage 104 Dry onion 10
90,000
Main Masala 27 22/27 = 81% 2.2
Rape 61 Tomato 107 Cabbage 107 Dry onion 28
160,000
Source: FSRP/MATEP retail trader rapid appraisal survey Wastage shows a consistent pattern across FFV items (Table 12). In each market, tomato and rape show the highest waste, from about 4%-9% of weekly purchase volumes, while cabbage and dry onion show the lowest, from about 1% to 3%. Overall, reported wastage at the retail level across the four vegetables in the three markets is about 4% by volume.
Table 12. Reported Wastage of Vegetables by Retail Traders in Lusaka and Ndola
Market Rape Tomato Cabbage Dry onion Average
------------ % of weekly purchases that goes to waste ------------
Soweto 7.9 8.8 2.5 0.8 5.0
Kaunda Square Stage 1 6.8 4.2 0.0 2.9 4.0
Main Masala 3.7 6.9 0.7 1.2 3.3
Average 6.1 6.6 1.3 1.6 4.1 Source: FSRP/MATEP retail trader rapid appraisal survey
An assessment of procurement locales for fresh produce clearly shows the dominance of Soweto as the main redistribution market in Lusaka, and suggests the same role for Main Masala in Ndola (Table 13). Direct procurement by retail traders from farms appears to be very rare; only Soweto shows a significant amount of such procurement, at 18%, and all of this was accounted for by cabbage, 70% of which was procured directly on the farm. Nearly all other produce (among our six items, including the fruit) sold at retail in Soweto was purchased in either Soweto’s wholesale area or in the adjoining City Market. In Kaunda Square, over 70% of all produce was procured in Soweto or City Market, only about one-fifth in Kaunda Square itself. Though we only surveyed one market in Ndola – Main Masala, the main wholesale/retail market – we suspect that it plays a role comparable to that of Soweto in Lusaka. Nearly all produce being sold at retail in this market was purchased there, and none was procured directly on the farm.
Page 33
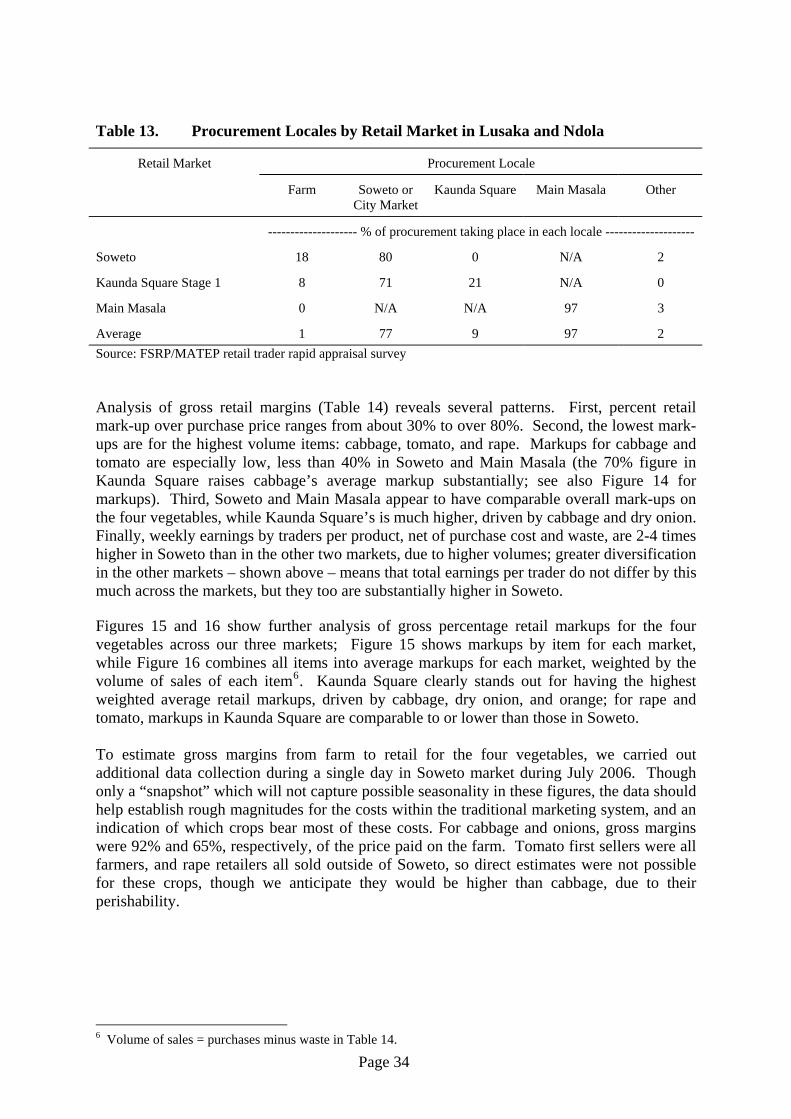
Table 13. Procurement Locales by Retail Market in Lusaka and Ndola
Procurement Locale Retail Market
Farm Soweto or City Market
Kaunda Square Main Masala Other
-------------------- % of procurement taking place in each locale --------------------
Soweto 18 80 0 N/A 2
Kaunda Square Stage 1 8 71 21 N/A 0
Main Masala 0 N/A N/A 97 3
Average 1 77 9 97 2 Source: FSRP/MATEP retail trader rapid appraisal survey Analysis of gross retail margins (Table 14) reveals several patterns. First, percent retail mark-up over purchase price ranges from about 30% to over 80%. Second, the lowest mark-ups are for the highest volume items: cabbage, tomato, and rape. Markups for cabbage and tomato are especially low, less than 40% in Soweto and Main Masala (the 70% figure in Kaunda Square raises cabbage’s average markup substantially; see also Figure 14 for markups). Third, Soweto and Main Masala appear to have comparable overall mark-ups on the four vegetables, while Kaunda Square’s is much higher, driven by cabbage and dry onion. Finally, weekly earnings by traders per product, net of purchase cost and waste, are 2-4 times higher in Soweto than in the other two markets, due to higher volumes; greater diversification in the other markets – shown above – means that total earnings per trader do not differ by this much across the markets, but they too are substantially higher in Soweto. Figures 15 and 16 show further analysis of gross percentage retail markups for the four vegetables across our three markets; Figure 15 shows markups by item for each market, while Figure 16 combines all items into average markups for each market, weighted by the volume of sales of each item6. Kaunda Square clearly stands out for having the highest weighted average retail markups, driven by cabbage, dry onion, and orange; for rape and tomato, markups in Kaunda Square are comparable to or lower than those in Soweto. To estimate gross margins from farm to retail for the four vegetables, we carried out additional data collection during a single day in Soweto market during July 2006. Though only a “snapshot” which will not capture possible seasonality in these figures, the data should help establish rough magnitudes for the costs within the traditional marketing system, and an indication of which crops bear most of these costs. For cabbage and onions, gross margins were 92% and 65%, respectively, of the price paid on the farm. Tomato first sellers were all farmers, and rape retailers all sold outside of Soweto, so direct estimates were not possible for these crops, though we anticipate they would be higher than cabbage, due to their perishability.
6 Volume of sales = purchases minus waste in Table 14.
Page 34

Table 14. Gross Margin Analysis for Retail Traders of Main FFVs by Location, September/October 2005 Mean Price (ZMK/Kg) 1 Margin Mean Quantity
Transacted per Week (Kg)Mean Total Values (ZMK)/Week FFV Item Location
Purchase Sales Gross Margin
Share of Purchase
Price Purchases Waste Purchases Sales Waste Gross Earnings2
Soweto Market 865 1,356 491 0.55 169 14 141,556 204,833 16,056 63,278 Kaunda Square 1,144 1,680 536 0.54 40 2 40,650 62,100 3,550 21,450 Main Masala 1,150 1,509 359 0.31 74 4 81,900 98,880 5,220 16,980
Rape
Total 1,053 1,515 462 0.47 94 7 88,035 121,938 8,275 33,903 Soweto Market 1,523 2,074 551 0.38 252 20 369,100 466,850 41,100 97,750 Kaunda Square 2,094 2,976 881 0.42 69 2 135,000 193,600 6,200 58,600 Main Masala 1,495 1,970 475 0.33 168 10 229,318 304,818 19,182 75,500
Tomato
Total 1,704 2,340 636 0.38 163 11 244,473 321,756 22,161 77,283 Soweto Market 466 608 141 0.37 2,699 44 1,244,490 1,627,433 43,100 244,667 Kaunda Square 433 737 304 0.72 117 0 49,800 87,000 0 37,200 Main Masala 1,529 1,927 398 0.34 148 1 146,444 200,167 1,389 53,722
Cabbage
Total 809 1,091 281 0.48 988 15 480,245 638,200 14,830 111,863 Soweto Market 1,422 1,922 500 0.45 144 1 181,900 245,050 2,100 63,150 Kaunda Square 1,636 2,933 1,297 0.84 14 0 23,750 40,180 560 16,430 Main Masala 1,506 2,357 851 0.58 50 0 77,714 128,179 0 50,464
Dry onion
Total 1,521 2,404 883 0.62 69 0 94,455 137,803 887 43,348 Soweto Market 1,132 1,510 378 0.34 514 12 548,333 684,083 16,583 135,750 Kaunda Square 1,384 2,152 767 0.68 24 0 32,000 51,000 0 19,000 Orange
Total 1,258 1,831 573 0.51 269 6 290,167 367,542 8,292 77,375 Soweto Market ----- ----- ----- 0.44 816 20 --- --- --- 117,211 Kaunda Square ----- ----- ----- 0.63 60 1 --- --- --- 33,420
Simple Averages
(excluding orange) Main Masala ----- ----- ----- 0.39 110 4 --- --- --- 49,167 1 Note that, because prices were not collected on the same day in each market, and because fresh produce prices can vary greatly from day to day, these data should not be used to make direct price comparisons across markets; 2 Net of purchase cost and waste; transport, bagging, and other incidental costs have not been removed.
Page 35

Figure 15. Comparative Analysis of Percent Retail Mark-Ups of Four Vegetables in Markets of Lusaka and Ndola (September/October 2005)
0
0.1
0.2
0.3
0.4
0.5
0.6
0.7
0.8
0.9
rape tomato cabbage dry onion orange
% R
etail
Mar
k-up
Soweto
Main Masala
Kaunda Square
Figure 16. Weighted Average Gross % Mark-Ups at Retail in Three Markets Of Lusaka and Ndola
0
10
20
30
40
50
60
Soweto Kaunda Sq. Main Masala
Market
% R
etai
l Mar
kup
Page 36

3.6 Consumer Behavior In this section we use our consumer survey data to examine two questions: (1) what are the economic characteristics of consumer frequenting different types of retail outlets?, and (2) what are the shopping habits of consumer in each type of outlet? To examine these questions we first classified our retail outlets into five categories, based on the type of neighborhood in which they are located, and the physical characteristics of the outlet: Open air markets: Soweto, Chilenje, and Kaunda Square in Lusaka, and Main
Masala in Ndola. These are typically large open air markets frequented by low- to middle-income consumers.
High end open air markets: Northmead market in Lusaka. Located in a high income neighborhood. Woodlands is a similar market in Lusaka, but was not surveyed.
High Income Shoprites: Manda Hill and Cairo Road in Lusaka, and Ndola Shoprite in Ndola. All located in medium- to high income neighborhoods
Medium Income Shoprites: Matero and Chilenje Shoprites in Lusaka. Also referred to as “residential area shoprites”. Located in middle income neighborhoods.
Small supermarkets: Small format supermarkets located predominantly in high income neighborhoods in both cities. Melissa and Kalundu Supermarkets in Lusaka, Pantry Pride and Fisenje Supermarkets in Ndola.
Our survey covered each type of retail outlet in Lusaka, while in Ndola we covered only Open Air Markets, High Income Shoprites, and Small Supermarkets. Our economic indicators relate to the type of neighborhood the consumer lives in, their family’s ownership of key assets, and the employment status of the shopper or household head (Table 15). We used CSO’s categories of high density, medium density, and low density neighborhoods as a proxy for low income, middle income, and high income, respectively. For assets, we look at the share of households that own each of three assets: a car, a refrigerator, and a color TV. The neighborhood and asset variables correlate very highly, as can be seen in Figure 17. The table and figure show clearly that the high income Shoprites, including the only Shoprite in Ndola, and especially the small supermarkets all cater to a high income clientele. Between two-thirds and 100% of all shoppers interviewed in these locales resided in high income neighborhoods, and at least half owned all three of our key assets. The small supermarkets in Lusaka cater most dominantly to high income consumers. Northmead market in Lusaka caters to a clientele very similar to that of the supermarkets. This high income orientation of Northmead is reflected in a smaller and more accessible layout of the market, much cleaner conditions, larger and more diverse retailer displays of fresh produce, and a much higher rate of bagging of produce (36% compared to under 10% in all other markets).
Page 37
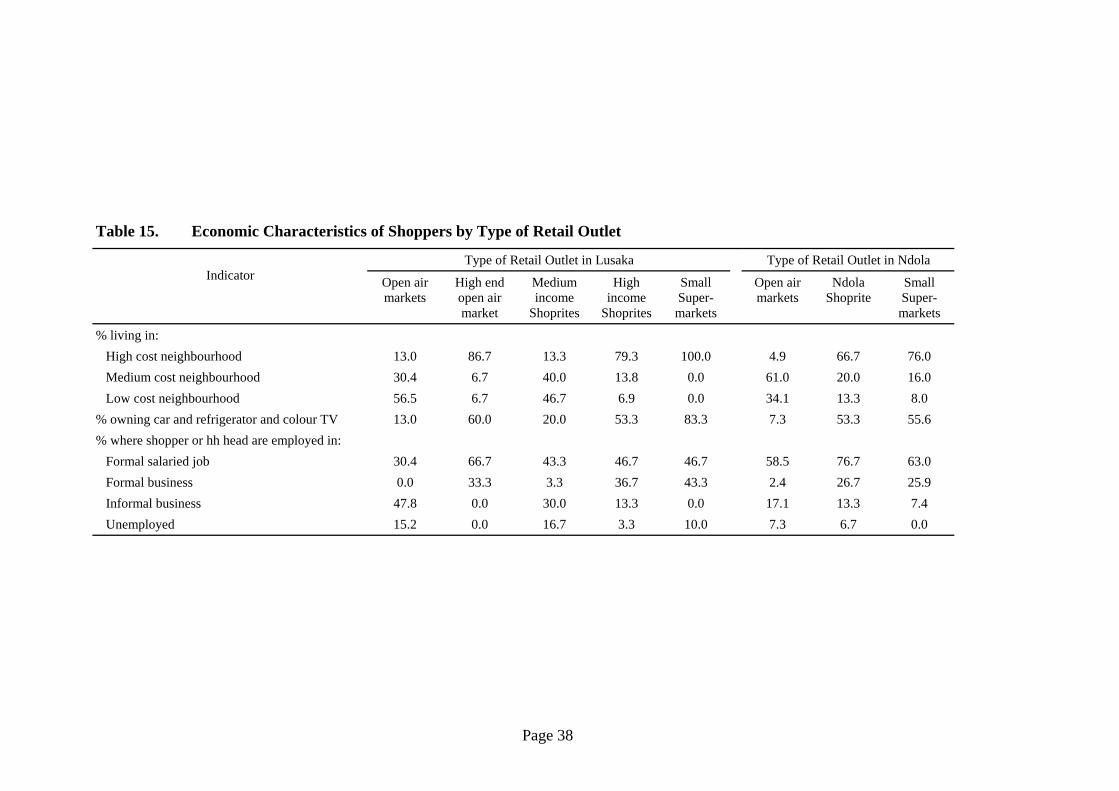
Table 15. Economic Characteristics of Shoppers by Type of Retail Outlet
Type of Retail Outlet in Lusaka Type of Retail Outlet in Ndola Indicator Open air
markets High end open air market
Medium income
Shoprites
High income
Shoprites
Small Super-markets
Open air markets
Ndola Shoprite
Small Super-markets
% living in: High cost neighbourhood 13.0 86.7 13.3 79.3 100.0 4.9 66.7 76.0 Medium cost neighbourhood 30.4 6.7 40.0 13.8 0.0 61.0 20.0 16.0 Low cost neighbourhood 56.5 6.7 46.7 6.9 0.0 34.1 13.3 8.0 % owning car and refrigerator and colour TV 13.0 60.0 20.0 53.3 83.3 7.3 53.3 55.6 % where shopper or hh head are employed in: Formal salaried job 30.4 66.7 43.3 46.7 46.7 58.5 76.7 63.0 Formal business 0.0 33.3 3.3 36.7 43.3 2.4 26.7 25.9 Informal business 47.8 0.0 30.0 13.3 0.0 17.1 13.3 7.4 Unemployed 15.2 0.0 16.7 3.3 10.0 7.3 6.7 0.0
Page 38

Page 39
Figure 17. Two Key Income Indicators for Shoppers Emerging From Different Types of Retail Outlets in Lusaka and Ndola, September/October 2006
0
20
40
60
80
100
120Op
en a
irm
arke
ts
High
end
open
air
mar
ket
Med
inco
me
Shop
rites
High
inco
me
Shop
rites
Smal
lSu
per-
mar
kets
Open
air
mar
kets
Ndol
aSh
oprit
e
Smal
lSu
per-
mar
kets
Type of Retail Outlet in Lusaka Type of Retail Outlet in Ndola
Perc
ent
% living in high cost neighborhood
% owning car + refrig + color tv
On the other end of the consumer spectrum, shoppers in open air markets are the least likely to live in a high income neighborhood, the most likely to live in a low income neighborhood, the least likely to own all three of our assets, and the least likely to have someone employed in a formal salaried job or operating a formal business. Compared to these shoppers, those in the medium income shoprites in Lusaka (Chilenje and Matero) are slightly less likely to come from a low income neighborhood (47% compared to 57%), slightly more likely to own all three assets (20% to 13%), and substantially more likely to have someone employed in a formal salaried job or running a formal business (47% to 30%). We now turn to the shopping behavior of clients in each type of retail outlet (Table 16 and Figure 18). Several patterns emerge. First, high-income Shoprites and small supermarkets tend to be used for a wide range of food types; while staples and meat, eggs, and dairy predominate, shoppers typically also buy beverages and fruit, and sometimes vegetables and non-food items. Second, middle-income Shoprites are used very differently; consumers in these stores use them almost exclusively for staples and perhaps for meat, eggs, and dairy. Third, shoppers use residential and main open air markets (all except high end markets) primarily for vegetables, with tomato, rape, and dry onion predominating. However, consumers in Ndola generally purchase a wider array of foods in these markets; nearly three-quarters of consumers in Ndola buy staples in these markets, and about 60% buy meats, eggs, and dairy, or fruit, while less than 50% of those in Lusaka purchase these items in these markets. Fourth, Northmead market, our one high end open air market, is highly specialized in fresh produce, especially vegetables; very few consumers purchased any item other than fresh produce in that market. Fifth, the type of fresh produce purchased varies across types of outlets. In all open air markets (including Northmead), tomato, rape, and dry onion predominate, in that order. In Shoprites and small supermarkets, fruit and cabbage are more

Page 40
common (recall that no consumers from the middle income Shoprite purchased fresh produce there). Sixth, vegetables are heavily purchased in open air markets; 80% to 90% of consumers in such markets indicated that they most commonly bought vegetables there, 60% of shoppers in middle income Shoprites indicated the same, and 30% to 40% of those in other Shoprites also indicated that they most often bought vegetables in open air markets. Shoppers in small supermarkets are the least likely to go to open air markets for their vegetables. The pattern across types of outlets is similar for fruit, though consistently lower percentages rely primarily on open air markets for these items than for vegetables. Finally, street vendors appear as important alternative sources of fresh produce for shoppers at high income Shoprites in Lusaka, suggesting that these vendors have been successful in penetrating the high end of the fresh produce market.
Figure 18. Percent of Shoppers Who Most Commonly Purchase Fresh Produce in Open Air Markets, by Type of Retail Outlet at Which They Were Interviewed in Lusaka and Ndola
0102030405060708090
100
Ope
n air
mar
kets
High
end
open
air
mar
ket
Med
iuminc
ome
Shop
rites
High
incom
eSh
oprit
esSm
allSu
per-
mar
kets
Ope
n air
mar
kets
Small
Supe
r-m
arke
ts
Ndola
Shop
rite
Lusaka Ndola
Perc
ent
% most commonly buyingfruit in open air market
% most commonly buyingvegetables in open air market
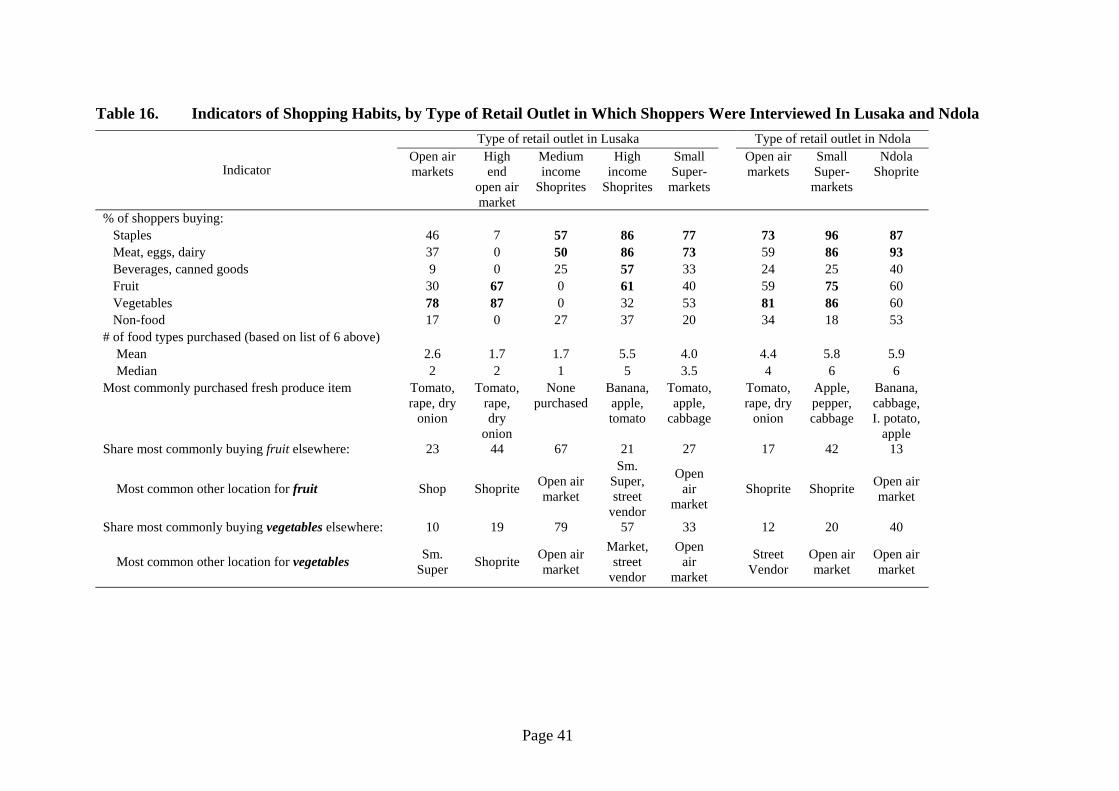
Table 16. Indicators of Shopping Habits, by Type of Retail Outlet in Which Shoppers Were Interviewed In Lusaka and Ndola Type of retail outlet in Lusaka Type of retail outlet in Ndola
Indicator Open air markets
High end
open air market
Medium income
Shoprites
High income
Shoprites
Small Super-markets
Open air markets
Small Super-markets
Ndola Shoprite
% of shoppers buying: Staples 46 7 57 86 77 73 96 87 Meat, eggs, dairy 37 0 50 86 73 59 86 93 Beverages, canned goods 9 0 25 57 33 24 25 40 Fruit 30 67 0 61 40 59 75 60 Vegetables 78 87 0 32 53 81 86 60 Non-food 17 0 27 37 20 34 18 53 # of food types purchased (based on list of 6 above) Mean 2.6 1.7 1.7 5.5 4.0 4.4 5.8 5.9 Median 2 2 1 5 3.5 4 6 6 Most commonly purchased fresh produce item Tomato,
rape, dry onion
Tomato, rape, dry
onion
None purchased
Banana, apple, tomato
Tomato, apple,
cabbage
Tomato, rape, dry
onion
Apple, pepper, cabbage
Banana, cabbage, I. potato,
apple Share most commonly buying fruit elsewhere: 23 44 67 21 27 17 42 13
Most common other location for fruit Shop Shoprite Open air market
Sm. Super, street
vendor
Open air
market
Shoprite Shoprite Open air market
Share most commonly buying vegetables elsewhere: 10 19 79 57 33 12 20 40
Most common other location for vegetables Sm. Super Shoprite Open air
market
Market, street
vendor
Open air
market
Street
Vendor Open air market
Open air market
Page 41

Overall, our findings regarding consumer behavior are quite similar to those in previous research (Neven et al, 2006; Ayieko et al, 2005)). More than a decade after Shoprite first entered the Zambian market, the so-called “traditional” marketing system retains a dominant position in fresh produce retailing. By our estimates, open air markets control 70% to 82% of this market, with street vendors holding another 9%. Traditional sector shares for vegetables, the most commonly consumed type of fresh produce, are higher by about 10 percentage points. Shoprite has done an effective job generating new markets for fruit items that previously were little consumed (especially apples), and enjoys significant market shares overall in fruit, but has found it increasingly difficult to compete with open air markets on the more widely consumed vegetables. A key theme is that the “traditional” sector is highly adaptable; various types of open air markets serve nearly all types of consumers, as do street vendors.
3.7 Price Comparisons Determination of prices of the 6 main FFV items (rape, tomato, dry onion, cabbage, banana and orange) in markets and supermarkets for comparison was achieved through the analysis of trader survey data for markets and getting the average price from 3 outlets for supermarkets. The supermarkets used were Melissa Mini Mart-Northmead, Solitex Marketing-Woodlands and CFS Shop-Chilenje in Lusaka, and Fisenge supermarket, Pantry Pride and Lyashi Delicatessen in Ndola. The prices for some of the FFV produce in some of these outlets were quoted per Kg but others were quoted per other measures such as a bunch, a packet or a unit. In this case, 4 samples were weighed in order to determine the average price for that item per Kg. Analysis of the data in Lusaka showed that the prices for all the FFV studied were highest in small supermarkets followed by residential area markets and were least in main markets (Figure 19). The situation was similar in Ndola. While the average price of rape was ZMK 1,800 in supermarkets, it was only ZMK 1,509 at Main Masala Market. That of tomato was ZMK 2,672 compared to ZMK 1,855; cabbage ZMK 1,700 compared to ZMK 1,334; and dry onion ZMK 3,500 compared to ZMK 2,028. These price differentials between supermarkets and open air markets are comparable to those found in other countries (Tschirley and Ayieko, 2005), and help explain the dominance of the traditional sector in fresh produce retailing – especially but not exclusively among lower- and middle income consumers. Low income consumers buy their FFV from the main markets when they find themselves there for one reason or another, and otherwise buy from residential area markets. Higher income consumers will typically buy a wide range of foods, including fresh produce, in supermarkets, but also frequent high end open air markets and street vendors.
Page 42
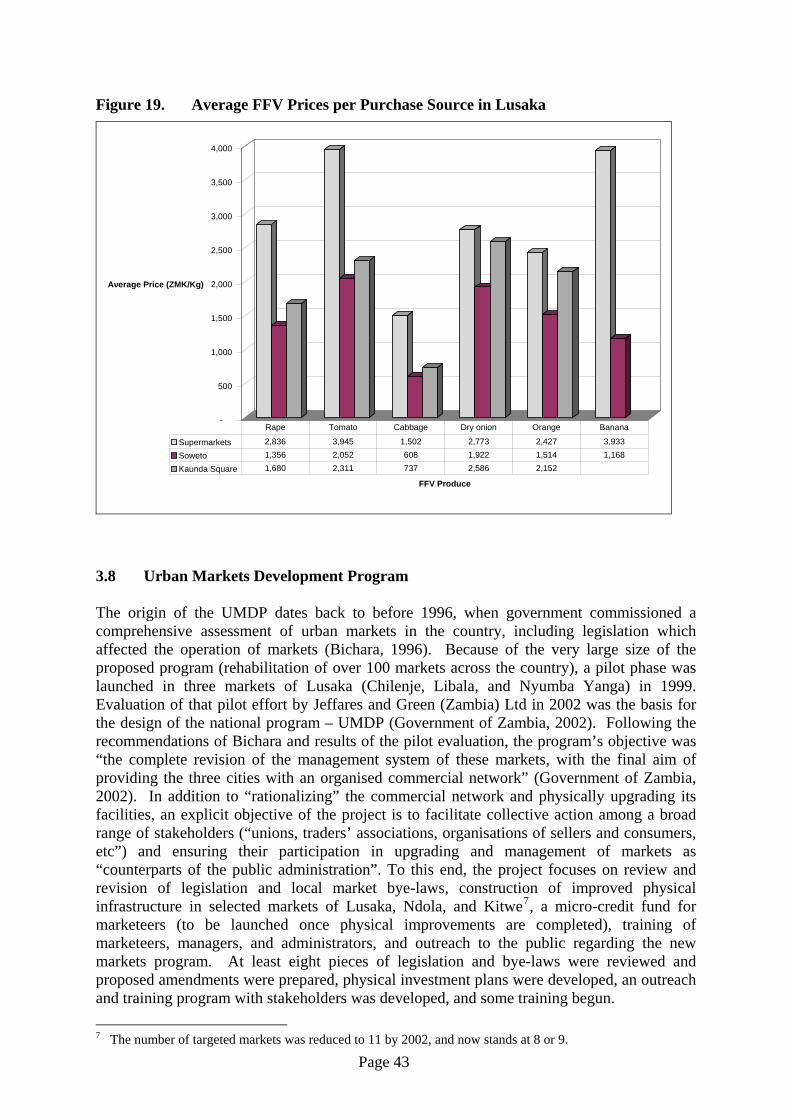
Figure 19. Average FFV Prices per Purchase Source in Lusaka
-
500
1,000
1,500
2,000
2,500
3,000
3,500
4,000
Average Price (ZMK/Kg)
FFV Produce
Supermarkets 2,836 3,945 1,502 2,773 2,427 3,933
Soweto 1,356 2,052 608 1,922 1,514 1,168
Kaunda Square 1,680 2,311 737 2,586 2,152
Rape Tomato Cabbage Dry onion Orange Banana
3.8 Urban Markets Development Program The origin of the UMDP dates back to before 1996, when government commissioned a comprehensive assessment of urban markets in the country, including legislation which affected the operation of markets (Bichara, 1996). Because of the very large size of the proposed program (rehabilitation of over 100 markets across the country), a pilot phase was launched in three markets of Lusaka (Chilenje, Libala, and Nyumba Yanga) in 1999. Evaluation of that pilot effort by Jeffares and Green (Zambia) Ltd in 2002 was the basis for the design of the national program – UMDP (Government of Zambia, 2002). Following the recommendations of Bichara and results of the pilot evaluation, the program’s objective was “the complete revision of the management system of these markets, with the final aim of providing the three cities with an organised commercial network” (Government of Zambia, 2002). In addition to “rationalizing” the commercial network and physically upgrading its facilities, an explicit objective of the project is to facilitate collective action among a broad range of stakeholders (“unions, traders’ associations, organisations of sellers and consumers, etc”) and ensuring their participation in upgrading and management of markets as “counterparts of the public administration”. To this end, the project focuses on review and revision of legislation and local market bye-laws, construction of improved physical infrastructure in selected markets of Lusaka, Ndola, and Kitwe7, a micro-credit fund for marketeers (to be launched once physical improvements are completed), training of marketeers, managers, and administrators, and outreach to the public regarding the new markets program. At least eight pieces of legislation and bye-laws were reviewed and proposed amendments were prepared, physical investment plans were developed, an outreach and training program with stakeholders was developed, and some training begun. 7 The number of targeted markets was reduced to 11 by 2002, and now stands at 8 or 9.
Page 43

At the core of the UMDP is a “new management model” that emphasizes much more active participation of stakeholders (primarily traders but also communities) in the management of markets (through Market Management Boards), and a reorientation of public officials away from a control mentality towards one of facilitating healthy commercial activity. The Markets Act has been widely perceived as a barrier to this more participatory and decentralized approach,8 and its revision has therefore received high priority; according to City Council officials, physical upgrading of markets was initially made contingent on passage of a new Act. In this regard, at least two problems have emerged. First, despite the emphasis in the program design on consultation with stakeholders, the specific proposed revisions to the Markets Act have apparently not been made publicly available. Uncertainty about the specific content of the proposed revisions has lead to concern on the part of marketeer representatives that the new Act may not fully meet the needs of the trading community. In light of previous conflict between marketeers and public officials (see, for example, GRZ 2003, page 3), complete openness in the process of revising this key piece of legislation would seem warranted. Second, the proposed revisions to the Act were reviewed by Cabinet in June of 2006, but were not passed on to Parliament. Therefore, as of mid-August 2006, there is no prospect of new legislation – or of fully instituting the new management model -- until the next Parliament sits in 2007. Despite the lack of any new legislation, physical upgrading was allowed to begin in three markets of Lusaka (Soweto, Chelstone, and Chilenje markets) and two markets of Kitwe in April 2006, but there is some uncertainty as to whether these works will be allowed to continue.
8 One representative of a marketeer cooperative referred to the Markets Act as “the great enemy of cooperatives”.
Page 44

4. POLICY AND PROGRAM ISSUES This appraisal has generated several findings with policy relevance for Zambia’s horticultural sector. First, we have found a very low proportion of households selling horticultural produce -- 16%, compared to about 70% sell in Kenya and 25% in Mozambique. This pattern suggests the possibility that new demand points (such as Freshpikt) could enjoy quite substantial supply response from the smallholder sector if they linked effectively to them. This could be especially true of fruit, much of which likely now goes to waste for lack of markets. Second, results show continued dominance of the small-scale traditional marketing system for horticultural produce in the country. This system has shown itself to be highly adaptable, serving the mass of poor consumers through markets such as Soweto, slightly higher income consumers through residential markets such as Chilenje and Matero, and high income consumers through small residential markets such as Northmead. Street vendors sourcing produce through this system also serve a broad range of consumers. Prices in open air markets are substantially lower than in supermarkets, while visual quality appears comparable on most products and clearly superior for green leafy vegetables. Third, these markets nevertheless suffer from serious structural problems that limit their ability to continue meeting expanding consumer demand. Due to a lack of public investment and little if any collaboration between public officials and traders in market management, many markets have become chaotic, congested, and frequently unsanitary. Product wastage is high, earnings for traders are low, and coordination with farmers is poor, leading to frequent gluts and shortages. Fourth, the Urban Markets Development Program represents a major and impressive effort to improve wholesale and retail markets in the country. It appropriately emphasizes a new management model based on partnering between public and private sectors, and has identified major revisions to the Markets Act as the sine qua non for effective change. However, UMDP has run into problems as legislative reform has stalled, endangering the entire program. In addition, despite a heavy emphasis and some progress on stakeholder consultation, mistrust persists between some trader representatives and public officials; the fact that traders have not had access to the specific proposed changes to the Markets Act may be contributing to this continuing lack of trust. With passage of the new Markets Act stalled, this may be a crucial opportunity to strengthen the partnering approach by formally reviewing the new proposed Act with stakeholders. Sixth, though quite well conceived as far as it goes, UMDP was not designed to address key issues of improved linkages between rural farmers and urban markets. These need to be addressed with improved market information and marketing extension, more actively linking farmers to wholesale markets and other market opportunities such as Freshpikt and Freshmark. Such efforts are especially important in light of the finding that larger commercial farms are major suppliers to fresh produce markets in Lusaka and Ndola; unless special efforts are made to assist smallholder farmers to improve their marketing strategies, these larger farmers may be the principal beneficiaries of the improvement in wholesale and retail market places under UMDP.
Page 45

Seventh, if successful in its aggressive regional marketing plan, Freshpikt will be a major new source of demand for horticultural produce in Zambia. Efforts already underway to link smallholder farmers to this market should be supported, and Freshpikt prices, quality standards, and purchase volumes should be integrated into any horticultural marketing information system that is developed. Eighth, Zambia’s horticultural sector operates in a regional market. Onions arrive through informal channels from Malawi, Tanzania and South Africa, oranges informally from Zimbabwe and through formal channels from South Africa, apples and other fruit through formal channels from South Africa; Freshpikt is targeting primarily regional markets, while Freshmark sources regionally and locally; it is known that Zambia exports horticultural produce informally to DRC, though we were unable to investigate that trade in this study. Understanding and quantifying this trade will be the first step in ensuring that policies and programs are conducive to continued high rates of growth. Finally, Shoprite/Freshmark (and perhaps Spar) are in the market to stay. For farmers able to meet their delivery schedules and basic quality specifications, these firms represent a very attractive market due primarily to their reliability. The improvements in traditional markets currently underway will facilitate the activities of these supermarket chains while simultaneously ensuring that traditional retail markets will be able to compete with them. Where appropriate, programs to facilitate direct marketing by smallholders to these chains should be supported, but these programs should not distract from an overall focus on improving urban wholesale and retail markets and linking these more effectively to rural producers. Continuing improvements in Zambia’s horticultural marketing system require up-to-date empirical information injected into a decision making process driven by active and broad stakeholder consultation. Specific applied research needs should be defined by a stakeholder group, but might include the following: - What is the share of large commercial farms in fresh produce supply to major urban
markets, and is this share rising or falling? This information is fundamental to designing a marketing extension program that improves the ability of all farmers – including smallholders – provide a more reliable supply of higher quality produce to consumers.
- How variable are prices of key horticultural products, both seasonally and over shorter periods (e.g., within months)? This, too, is fundamental information for designing marketing extension programs to improve reliability of supply.
- What is the structure of costs and returns along the supply chain from farm to consumer? Where can savings be gained and what investments are needed to realize these gains?
- What is the reaction of farmers and marketeers to (a) the physical infrastructure improvements now underway in urban markets and (b) the proposed legislative amendments not yet approved by Parliament. How will these investments affect the type of trader, type of produce, and type of consumer that uses each market? What will be the spillover effects in terms of trader movement to other existing markets, creation of new markets, or increase in street vending?
Page 46
ANNEX A. ESTIMATION OF FFV MARKET SHARE OF VARIOUS RETAIL OUTLET TYPES
Our rapid appraisal consumer survey interviewed consumers as they were leaving various types of retail outlets. The survey collected two types of information on fresh produce purchases: 1) a listing of all fresh produce items purchased that day in that outlet, and 2) questions about the type of retail outlet where they most often purchased “vegetables” and “fruit”. The most frequented outlet could be the type the consumer was currently shopping in, or another type. We faced two challenges in using these data to estimate fresh produce market shares for different types of retail outlets. First, because the survey did not collect data on purchase quantities or values, we had to develop some means of using the data it did collect – unambiguous indications (yes/no) of which items were purchased – to generate share estimates. Second, because the survey purposively selected retail outlet types, and because the relative number of interviews in each was not related to overall population in either city (not everyone in either city had an equal probability of being selected), we had to develop a means of weighting the data. To deal with the first challenge, we assigned a value of 1.0 to each item which was purchased. A more quantitative consumer survey scheduled for 2007 will collect information on both quantities and values, allowing a more refined calculation. We used several pieces of information to deal with the weighting issue. First, each consumer was asked the name of the neighbourhood in which they lived. We then obtained from the Central Statistical Office (a) the residential category of each of these neighbourhoods (high, medium, or low population density) and (b) the total population in each residential category in each city. As per standard weighting practice, we then calculated weights by residential category as follows: wgti = POPi /NINTi where i is residential category. Thus, each weight is the inverse of the number of interviews per residential category as a share of the total city population in that residential category. The resulting weights were: Low population density 1,312 Medium population density 2,331 High population density 12,833 As previously noted, the survey collected two types of information on fresh produce purchases – those the consumer had just made at the selected retail outlet (by individual item), and where they “most often” purchase “fruit” and “vegetables”. We used both types of information to estimate the share of each type of retail outlet in the overall fresh produce market for each city. Note:
1. The second set of information did not allow us to estimate the size of vegetable purchases compared to fruit purchases. The first approach did allow this estimation (about 80% vegetables and 20% fruit in Lusaka), and we used those results to adjust results in the second approach.
Page 47

2. Because our interviews occurred only outside open air markets, shoprites, and independent supermarkets, we were able to calculate shares in the first approach only for those types of outlets; street vendors, shops, and other outlets were excluded. In the second approach, consumers could indicate a wider range of outlet types, including street vendors and shops; the second approach therefore gives a greater breakdown of shares by outlet type.
Each approach resulted in similar estimates. The first approach (based on individual produce items) gave somewhat higher market share estimates for open air markets, and lower estimates for supermarket chains and independent supermarkets. We use each result in the report, reporting ranges on market shares.
Page 48

REFERENCES Ayieko M W, David Tschirley, and Mary Mathenge (2005). “Fresh Fruit and Vegetable Consumption Patterns and Supply Chain Systems in Urban Kenya: Implications for Policy and Investment Priorities”. Working Paper #12, Tegemeo Institute of Agricultural Policy and Development, Egerton University. Nairobi. Bichara, Studio (1996). Chapoto, Anthony and T.S. Jayne, 2005. “Characteristics of Individuals Afflicted By Aids-Related Mortality in Zambia”. Working Paper 14. Lusaka, Zambia: Food Security Research Project. (http://www.aec.msu.edu/agecon/fs2/zambia/index.htm) DAI, 2005. Market Access and Trade Enhancing Policies (MATEP) Program: Technical Proposal Submitted to the United Agency for International Development in Response to MOBIS RFQ No. 65086. Davis, R. (Jr), 2005. How Can The Poor Benefit From The Growing Markets For High Value Agricultural Products? Enterprise, Trade and Finance Group, Kent. UK. Dijkstra, T. 1997. Horticultural Marketing Channels in Kenya. Dorward, A., N. Poole, J. Morrison, J. Kydd and I. Urey 2. 2002. Critical Linkages: Livelihoods, Markets and Institutions. Imperial College at Wye, Wye, Ashford, Kent, TN25 5AH. Paper presented at the Seminar on ‘Supporting Institutions, Evolving Livelihoods’, Bradford Centre for International Development, University of Bradford 29th-30th May 2002 Government of Zambia (2002). “Evaluation of a Pilot Project and Formulation of an Urban Markets Project In Zambia: Final Report, Volume 1”. Economic Affairs Division, National Authorising Officer of the European Development Fund. Government of Zambia (2003). “Report of the Markets Task Force to be Presented to the Hon. Minister of Local Government and Housing”. Ministry of Local Government and Housing. 17 July 2003, Lusaka. Megill, D.J. 2004. Recommendations on Sample Design for Post Harvest Surveys in Zambia Based on the 2000 Census. Neven, David, Thomas Reardon, Jonathan Chege, and Honglin Wang (2006). “Supermarkets and Consumers in Africa: The case of Nairobi, Kenya”. International Food and Agribusiness Marketing, 18 (3). Poole, N. D., A. W. Seini, et al. (2000). Ghana Country Report - Overcoming informational constraints: improving horticultural marketing and technical information flows to smallholders. DFID Crop Post-Harvest Program Project R7151. Wye, Kent, Wye College.
Reardon T., C.P. Timmer, C.B. Barrett, and J. Berdegué (2003). “The Rise of Supermarkets in Africa, Asia, and Latin America”. American Journal of Agricultural Economics, Vol. 85, Number 5, pp. 1140-1146.
Page 49
The IDL Group (2002). “An Assessment of Trends in the Zambian Agriculture Sector”. A report prepared for British DfID. Tschirely, D., K. M. Muendo and M. T. Weber, 2004. Improving Kenya’s Domestic Horticultural Production and marketing System: Current Competitiveness, Forces of change, and Challenges for the future. Volume II: Horticultural Marketing USAID (2005). Global Horticultural Assessment. `
Weatherspoon, D. and T. Reardon (2003). “The Rise of Supermarkets in Africa: Implications for Agrifood Systems and the Rural Poor”. Development Policy Review. Vol. 21 Issue 3, pp. 333-355.
Weignberger, K. and T. A. Lumpkin, 2005. Horticulture for Poverty Alleviation – The unfunded Revolution. Shanhua, Taiwan: AVRDC – The World Vegetable Centre, AVRDC Publication No. 05-613, Working Paper No. 15. 20pp.
Page 50