f u l l -ti m e mb a - mba.cuhk.edu.hk
TRANSCRIPT

Full-time MBAClass of 2020
Employment Report
CC
LL
AA
SS
SS
PP
RR
OO
FF
II
LL
EE
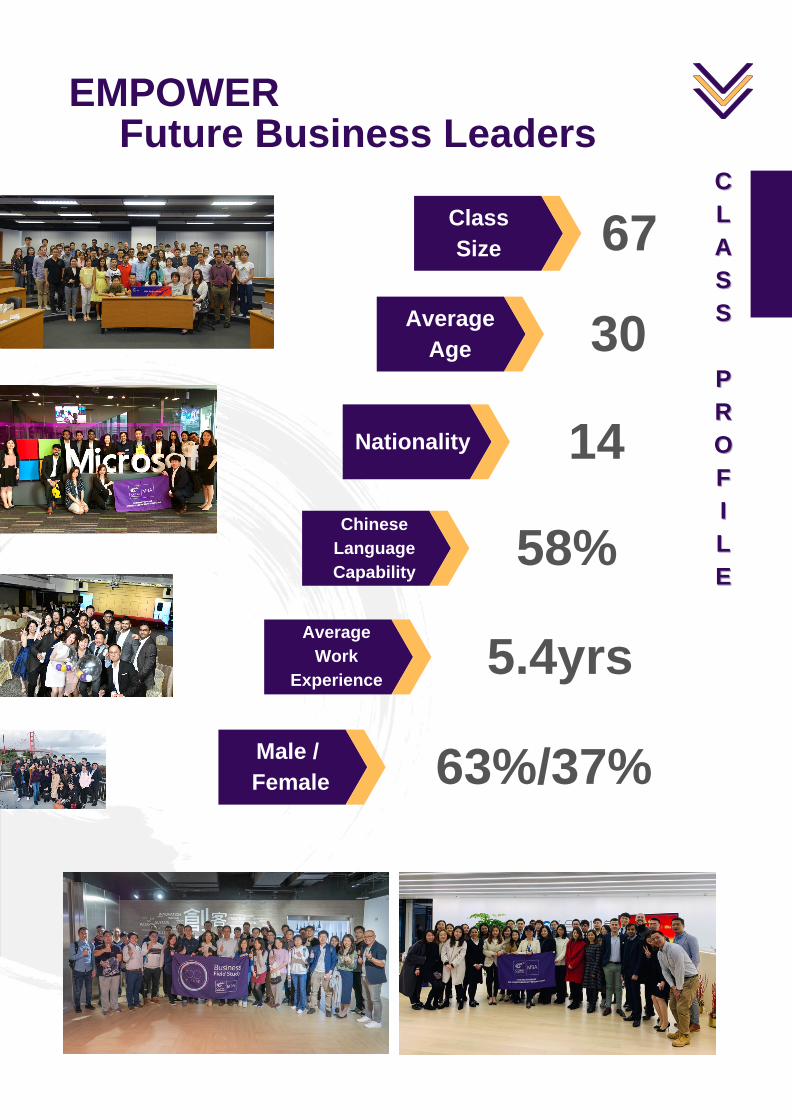
Male / Female
58%
5.4yrs
63%/37%
ClassSize 67
AverageAge 30
Nationality 14
ChineseLanguageCapability
AverageWork
Experience
EMPOWERFuture Business Leaders
male /
female
EE
MM
PP
LL
OO
YY
MM
EE
NN
TT
SS
TT
AA
TT
UU
SS
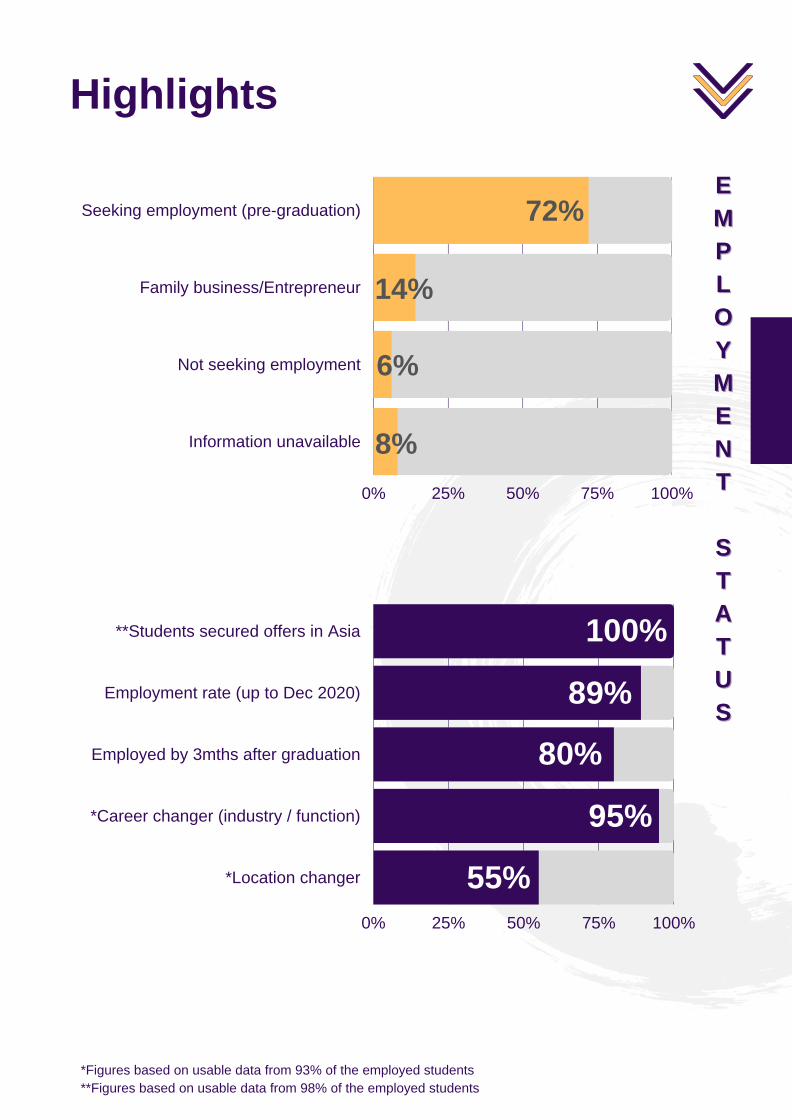
0% 25% 50% 75% 100%
Seeking employment (pre-graduation)
Family business/Entrepreneur
Not seeking employment
Information unavailable
Highlights
72%
14%
6%
8%
0% 25% 50% 75% 100%
**Students secured offers in Asia
Employment rate (up to Dec 2020)
Employed by 3mths after graduation
*Career changer (industry / function)
*Location changer
100%
89%
80%
95%
55%
*Figures based on usable data from 93% of the employed students**Figures based on usable data from 98% of the employed students

EE
MM
PP
LL
OO
YY
MM
EE
NN
TT
SS
TT
AA
TT
UU
SS
Financial Services
39%
Others
26%
Consulting
24%
Technology
11%
Others
24%
Consulting
21%
Finance/Accounting
18%
Marketing/Sales
18%
General Management
11%
Operations/Logistics
8%
Industry Distribution
Function Distribution
(include Healthcare, Real Estate, Retail and
Transportation & Logistics Services)
Figures of the above two diagrams are based on usable data from 93% of the employed students
(include Human Resources and Information Technology)

EE
MM
PP
LL
OO
YY
MM
EE
NN
TT
SS
TT
AA
TT
UU
SS
Increase in
0% 50% 100% 150% 200%
Consulting
Financial services
Technology
Others
73%
93%Commercial banking
169%Insurance
Investment Banking 148%
125%Others
47%
20%
Annual Compensation (mean)
(include Healthcare, Real Estate, and Transportation & Logistics Services)
Figures of the above diagram are based on usable data from 66% of the employed students

EE
MM
PP
LL
OO
YY
MM
EE
NN
TT
SS
TT
AA
TT
UU
SS
Jobs by Location
Figures of the above diagram are based on usable data from 93% of the employed students#Asian countries include Indonesia, Japan, Korea and Singapore
China
Hong Kong
33%
28%
#Other Asian Countries/Regions21.5%
India
17.5%

RR
EE
CC
RR
UU
II
TT
II
NN
GG
PP
AA
RR
TT
NN
EE
RR
SS
2015 - 2020 (Partial List)
