f2 career destination report 2015
TRANSCRIPT
Page 1 of 13
F2 Career Destination Report 2015
Report contents
Introduction ...................................................................................................................... 2
Method ......................................................................................................................... 2
Responses ....................................................................................................................... 2
Career intentions at the start of F1 ............................................................................... 3
Career destinations of successful F2 doctors ............................................................... 4
Changes to career intentions during the course of the Foundation Programme .......... 6
Applications to UK specialty training (including ACF, FTSTA; excluding LAT) ............. 6
Appointment to general practice (GP) and core psychiatry training (CPT) ................... 7
Post-foundation employment outside of the UK ........................................................... 7
Royal College exams taken during the F2 year ............................................................ 8
Intention to work less than full-time .............................................................................. 8
Discussion ....................................................................................................................... 9
National F2 Career Destination Survey 2015
Page 2 of 13
Introduction 1. This is the sixth national F2 Career Destination Report using data collated from a UK-wide
survey of outgoing F2 doctors. It describes the career destinations of F2 doctors who completed their foundation training in August 2015. These doctors typically graduated from medical schools in 2013.
2. Like the previous reports, this paper provides details about:
next career destinations
doctors who intend to work less than full-time
doctors who undertook medical royal college exams during F2
the proportion of doctors progressing into psychiatry and general practice (GP) specialty training
specialty training and service posts being taken outside the UK
the percentage of doctors leaving the UK and those intending to return within five years.
3. Throughout the report, references to specialty training include general practice (GP) training.
Method
4. As in previous years, all foundation doctors who were due to complete their foundation
training in August 2015 were expected to participate in the survey. By agreement of Foundation School Directors (FSD), only doctors who completed the survey were issued with their F2 sign-off document (the Foundation Achievement of Competence Document) released.
5. Foundation schools gathered the data between May and September 2015. Foundation schools used a number of methods to gather the data including use of the UKFPO on-line or paper-based surveys, or embedding the national questions into local/existing surveys.
6. Doctors who did not complete F2 foundation training in August 2015 (343) and military F2s were not required to participate in the survey. The UK Foundation Programme Annual Report 2015 provides more information about the reasons for doctors not being signed off (not all reasons are due to unsatisfactory progress).
7. The survey response rate is calculated using the number of survey responses compared with the reported number of doctors successfully signed off. Any incomplete or duplicate responses were also omitted from the analysis.
8. Data contained within this report are based on foundation doctors’ self-reported career intentions or declared appointments. We have not compared career intention with the final actual appointment/next career destination for individual doctors. However, we have agreed that respondents can choose to provide their unique General Medical Council (GMC) reference number on the understanding that their data will be shared with the GMC to inform the longitudinal study.
Responses
9. All 25 UK foundation schools provided F2 career destination data. 10. 7,533 doctors successfully completed their foundation training in August 2015. 7,299 of
these doctors (96.9%) provided some data about their next career destination. However, a small proportion of responses did not provide all the requested information and are not included in the F2 career destination analysis.
11. This report is based the on the 7,168 respondents, who answered all core questions (i.e. 98.2% of doctors who provided at least some data and 95.2% of doctors successfully completing the Foundation Programme in August 2015). This group comprised 6,697 doctors completing the Foundation Programme and 471 completing the Academic Foundation Programme.

National F2 Career Destination Survey 2015
Page 3 of 13
Career intentions at the start of F1
12. This section includes responses from 7,127 doctors. Doctors who did not complete an F1
year (i.e. they started their foundation training at F2 level, undertaking a one-year programme) did not respond to the questions in this section of the survey.
13. At the beginning of F1 training 4,347 (61.0%) intended to progress immediately to UK specialty training, this compares to 65.8% reported in 2014 and 66.0% in 2013. Table 1 – Intended career destination of doctors at the start of F1
Intended career destination at start of F1 No. %
To immediately progress into ST (in UK) 4,347 61.0%
Service post in UK 185 2.6%
Further academic study 84 1.2%
Other (in UK) 18 0.3%
To immediately progress into ST (OUTSIDE UK) 61 0.9%
Service post OUTSIDE UK 640 9.0%
Other (outside the UK) 20 0.3%
Military posting 8 0.1%
Career break 464 6.5%
Undecided at the time or no response 1,300 18.2%
Total 7,127 100.0%
14. Of the 4,347 doctors intending to immediately continue into specialty training in the UK,
94.7% provided data about their first choice specialty training programme at that time, with 5.3% reporting that they were undecided at the start of their foundation training. Results are given in Table 2.
15. General practice (GP) and core medical training (CMT) accounted for almost half (44.6%) of the intended specialty training programmes. This is similar to the 45.0% reported in 2014 although there has been a small decrease over the two years since 2013 (47.1%). Table 2 – Intended UK specialty training programme at start of F1
Intended ST programme in the UK at start of F1 No %
Acute Care Common Stem (ACCS) 307 7.1%
Anaesthesia 225 5.2%
Broad-based Training 19 0.4%
Clinical Radiology 70 1.6%
Community Sexual and Reproductive Health 12 0.3%
Core Medical Training 946 21.8%
Core Psychiatry Training 140 3.2%
Core Surgical Training 630 14.5%
General Practice 991 22.8%
Histopathology 17 0.4%
Medical Microbiology 4 0.1%
Neurosurgery 56 1.3%
Obstetrics & Gynaecology 241 5.5%
Ophthalmology 99 2.3%
Paediatrics 349 8.0%
Public Health 10 0.2%
Undecided at the time 230 5.3%
No response 1 0.0%
Total 4,347 100.0%
16. Of the 4,116 doctors who provided details of their intended specialty training programme at the start of F1, only one did not indicate if their intended specialty training programme changed during their foundation training.

National F2 Career Destination Survey 2015
Page 4 of 13
17. 63.8% advised that their specialty training programme choice did not change during their foundation training. This is fairly consistent with the 68.5% and 65.5% who reported their choice of specialty training programme did not change in 2014 and 2013 respectively. Details are given in Table 3.
Table 3 – Change of specialty training programme choice during foundation training
Did ST programme choice change during FP? No %
No: still first choice specialty 2,774 63.8%
Yes: didn't like original choice 317 7.3%
Yes: preferred a different specialty 1,024 23.6%
No response 232 5.3%
Total 4,347 100.0%
Career destinations of successful F2 doctors
18. Table 4 provides details of the career destinations for 7,168 respondents.
Table 4 – F2 career destinations
Destinations for F2 doctors Standard
Foundation Programme
Academic Foundation Programme
All F2 doctors
Specialty training in UK - run-through training programme 24.5% 16.6% 24.0%
Specialty training in UK - core training programme 25.1% 39.3% 26.0%
Specialty training in UK - academic programme 0.5% 12.3% 1.3%
Specialty training in UK - FTSTA 0.1% 0.0% 0.1%
Specialty training in UK - deferred for higher degree 0.0% 0.2% 0.0%
Specialty training in UK - deferred for statutory reasons 0.5% 0.6% 0.5%
Sub-total for specialty training in UK 50.8% 69.0% 52.0%
Locum appointment for training (LAT) in UK 0.6% 0.0% 0.5%
Service appointment in UK 9.4% 5.9% 9.2%
Other appointment in UK (e.g. anatomy demonstrator, further study) 5.4% 7.9% 5.5%
Still seeking employment as a doctor in the UK 9.0% 2.5% 8.6%
Specialty training outside UK 0.4% 0.2% 0.4%
Other appointment outside UK 6.2% 4.7% 6.1%
Still seeking employment as a doctor outside the UK 4.5% 1.3% 4.3%
Not practising medicine - taking a career break 13.5% 7.9% 13.1%
Not practising medicine - permanently left profession 0.3% 0.6% 0.3%
Total signed off, known destinations 100.0% 100.0% 100.0%
19. Of the 7,168 respondents, 67.2% had secured a clinical or related appointment in the UK.
8.6% were still seeking employment as a doctor in the UK. 20. 52.0% reported that they were progressing directly into specialty training in the UK. This
compares to 58.5% in 2014, 64.4% in 2013, 67.0% in 2012 and 71.3% in 2011. 21. Of the 3,725 doctors appointed to a UK specialty training post, 2,149 (57.7%) are female,
1,555 (41.7%) are male and the remaining 21 (0.6%) did not specify. These percentages are almost identical to 2014 (57.5%, 41.8% and 0.7%).
22. Following the trend of 2014, 2013, 2012 and 2011, those successfully completing academic foundation programmes were more likely to secure a specialty training appointment, and in particular were more likely to progress to post-foundation academic training.
National F2 Career Destination Survey 2015
Page 5 of 13
23. Appendix A sets out career destinations by individual foundation school and Appendix B provides career destinations by graduating medical school.
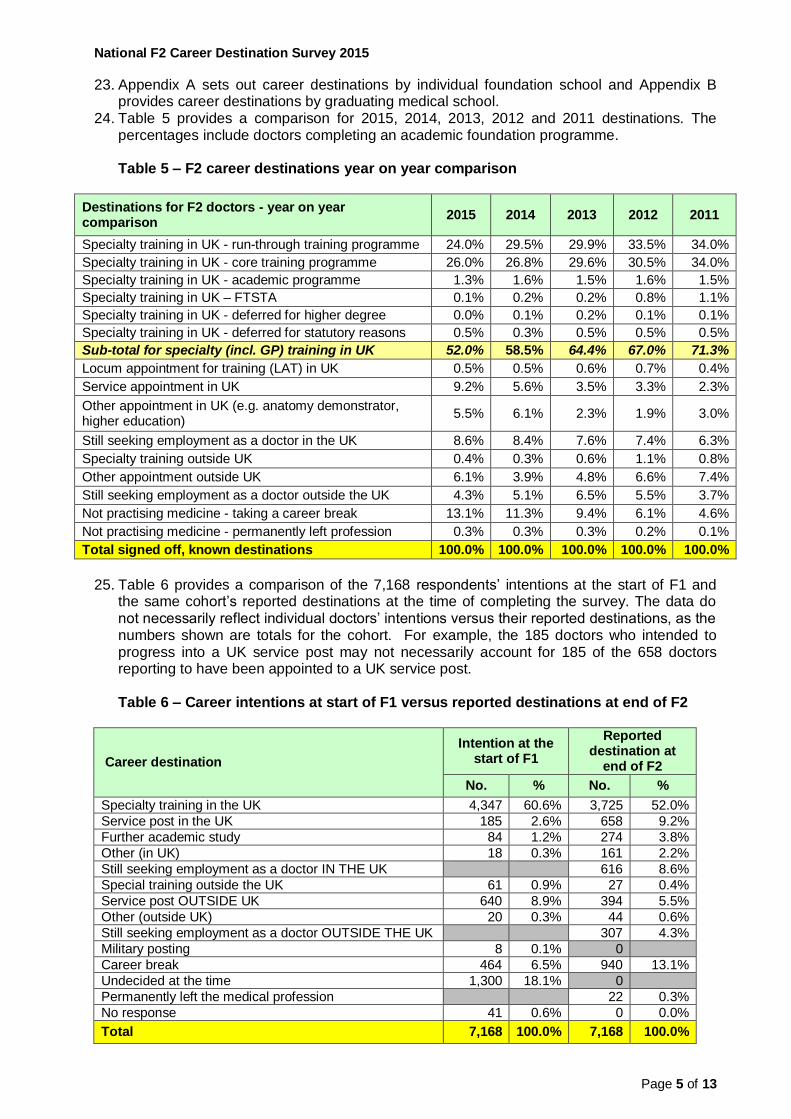
24. Table 5 provides a comparison for 2015, 2014, 2013, 2012 and 2011 destinations. The percentages include doctors completing an academic foundation programme.
Table 5 – F2 career destinations year on year comparison
Destinations for F2 doctors - year on year comparison
2015 2014 2013 2012 2011
Specialty training in UK - run-through training programme 24.0% 29.5% 29.9% 33.5% 34.0%
Specialty training in UK - core training programme 26.0% 26.8% 29.6% 30.5% 34.0%
Specialty training in UK - academic programme 1.3% 1.6% 1.5% 1.6% 1.5%
Specialty training in UK – FTSTA 0.1% 0.2% 0.2% 0.8% 1.1%
Specialty training in UK - deferred for higher degree 0.0% 0.1% 0.2% 0.1% 0.1%
Specialty training in UK - deferred for statutory reasons 0.5% 0.3% 0.5% 0.5% 0.5%
Sub-total for specialty (incl. GP) training in UK 52.0% 58.5% 64.4% 67.0% 71.3%
Locum appointment for training (LAT) in UK 0.5% 0.5% 0.6% 0.7% 0.4%
Service appointment in UK 9.2% 5.6% 3.5% 3.3% 2.3%
Other appointment in UK (e.g. anatomy demonstrator, higher education)
5.5% 6.1% 2.3% 1.9% 3.0%
Still seeking employment as a doctor in the UK 8.6% 8.4% 7.6% 7.4% 6.3%
Specialty training outside UK 0.4% 0.3% 0.6% 1.1% 0.8%
Other appointment outside UK 6.1% 3.9% 4.8% 6.6% 7.4%
Still seeking employment as a doctor outside the UK 4.3% 5.1% 6.5% 5.5% 3.7%
Not practising medicine - taking a career break 13.1% 11.3% 9.4% 6.1% 4.6%
Not practising medicine - permanently left profession 0.3% 0.3% 0.3% 0.2% 0.1%
Total signed off, known destinations 100.0% 100.0% 100.0% 100.0% 100.0%
25. Table 6 provides a comparison of the 7,168 respondents’ intentions at the start of F1 and the same cohort’s reported destinations at the time of completing the survey. The data do not necessarily reflect individual doctors’ intentions versus their reported destinations, as the numbers shown are totals for the cohort. For example, the 185 doctors who intended to progress into a UK service post may not necessarily account for 185 of the 658 doctors reporting to have been appointed to a UK service post. Table 6 – Career intentions at start of F1 versus reported destinations at end of F2
Career destination
Intention at the start of F1
Reported destination at
end of F2
No. % No. %
Specialty training in the UK 4,347 60.6% 3,725 52.0%
Service post in the UK 185 2.6% 658 9.2%
Further academic study 84 1.2% 274 3.8%
Other (in UK) 18 0.3% 161 2.2%
Still seeking employment as a doctor IN THE UK 616 8.6%
Special training outside the UK 61 0.9% 27 0.4%
Service post OUTSIDE UK 640 8.9% 394 5.5%
Other (outside UK) 20 0.3% 44 0.6%
Still seeking employment as a doctor OUTSIDE THE UK 307 4.3%
Military posting 8 0.1% 0
Career break 464 6.5% 940 13.1%
Undecided at the time 1,300 18.1% 0
Permanently left the medical profession 22 0.3%
No response 41 0.6% 0 0.0%
Total 7,168 100.0% 7,168 100.0%
National F2 Career Destination Survey 2015
Page 6 of 13
Changes to career intentions during the course of the Foundation Programme
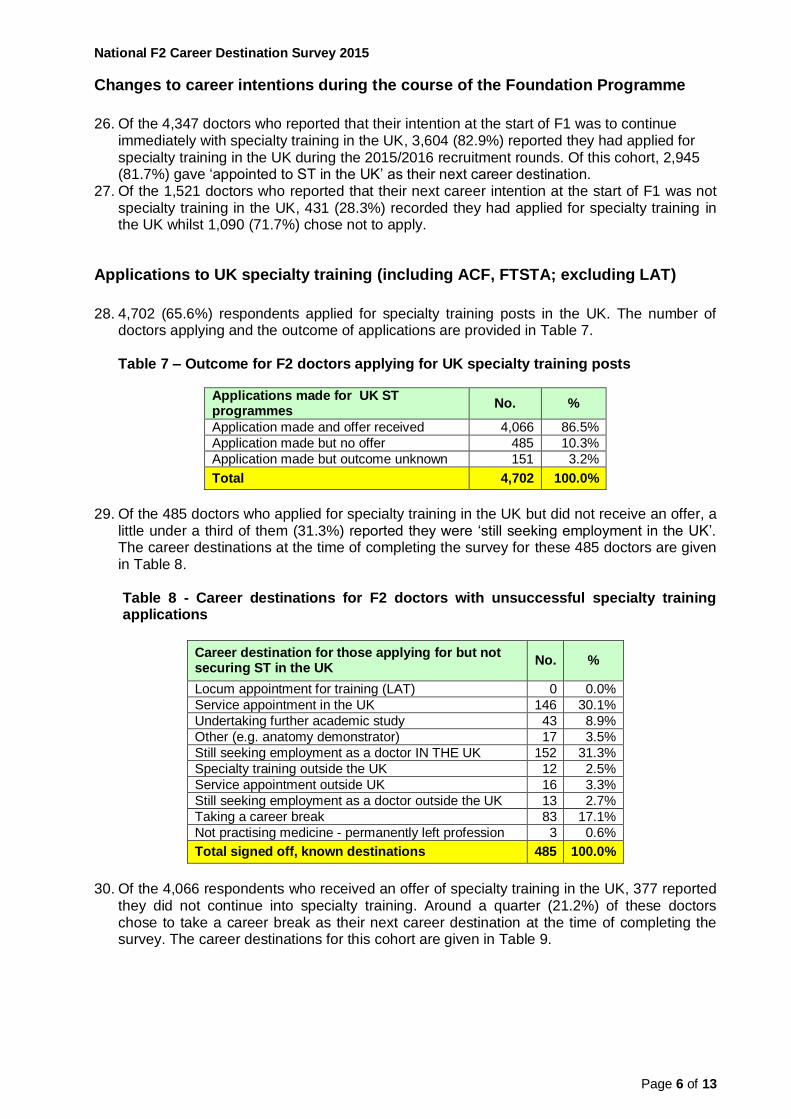
26. Of the 4,347 doctors who reported that their intention at the start of F1 was to continue
immediately with specialty training in the UK, 3,604 (82.9%) reported they had applied for specialty training in the UK during the 2015/2016 recruitment rounds. Of this cohort, 2,945 (81.7%) gave ‘appointed to ST in the UK’ as their next career destination.
27. Of the 1,521 doctors who reported that their next career intention at the start of F1 was not specialty training in the UK, 431 (28.3%) recorded they had applied for specialty training in the UK whilst 1,090 (71.7%) chose not to apply.
Applications to UK specialty training (including ACF, FTSTA; excluding LAT)
28. 4,702 (65.6%) respondents applied for specialty training posts in the UK. The number of doctors applying and the outcome of applications are provided in Table 7.
Table 7 – Outcome for F2 doctors applying for UK specialty training posts
Applications made for UK ST programmes
No. %
Application made and offer received 4,066 86.5%
Application made but no offer 485 10.3%
Application made but outcome unknown 151 3.2%
Total 4,702 100.0%
29. Of the 485 doctors who applied for specialty training in the UK but did not receive an offer, a little under a third of them (31.3%) reported they were ‘still seeking employment in the UK’. The career destinations at the time of completing the survey for these 485 doctors are given in Table 8. Table 8 - Career destinations for F2 doctors with unsuccessful specialty training applications
Career destination for those applying for but not securing ST in the UK
No. %
Locum appointment for training (LAT) 0 0.0%
Service appointment in the UK 146 30.1%
Undertaking further academic study 43 8.9%
Other (e.g. anatomy demonstrator) 17 3.5%
Still seeking employment as a doctor IN THE UK 152 31.3%
Specialty training outside the UK 12 2.5%
Service appointment outside UK 16 3.3%
Still seeking employment as a doctor outside the UK 13 2.7%
Taking a career break 83 17.1%
Not practising medicine - permanently left profession 3 0.6%
Total signed off, known destinations 485 100.0%
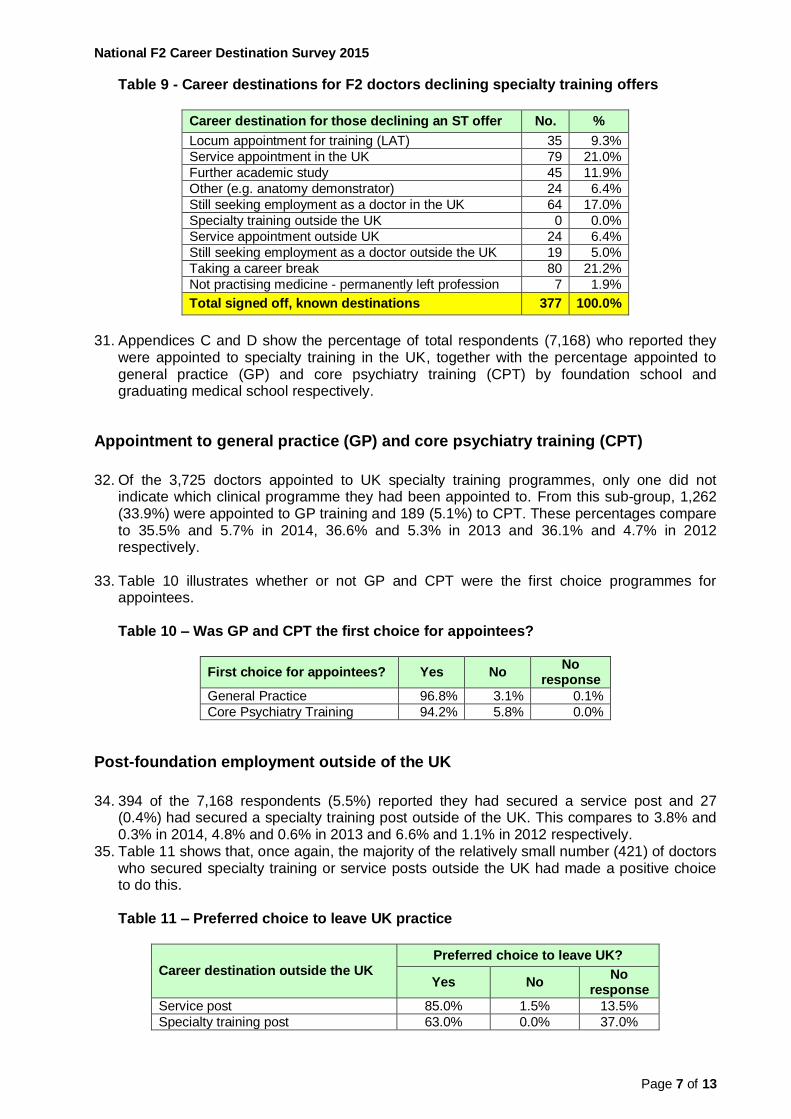
30. Of the 4,066 respondents who received an offer of specialty training in the UK, 377 reported
they did not continue into specialty training. Around a quarter (21.2%) of these doctors chose to take a career break as their next career destination at the time of completing the survey. The career destinations for this cohort are given in Table 9.
National F2 Career Destination Survey 2015
Page 7 of 13
Table 9 - Career destinations for F2 doctors declining specialty training offers
Career destination for those declining an ST offer No. %
Locum appointment for training (LAT) 35 9.3%
Service appointment in the UK 79 21.0%
Further academic study 45 11.9%
Other (e.g. anatomy demonstrator) 24 6.4%
Still seeking employment as a doctor in the UK 64 17.0%
Specialty training outside the UK 0 0.0%
Service appointment outside UK 24 6.4%
Still seeking employment as a doctor outside the UK 19 5.0%
Taking a career break 80 21.2%
Not practising medicine - permanently left profession 7 1.9%
Total signed off, known destinations 377 100.0%
31. Appendices C and D show the percentage of total respondents (7,168) who reported they
were appointed to specialty training in the UK, together with the percentage appointed to general practice (GP) and core psychiatry training (CPT) by foundation school and graduating medical school respectively.
Appointment to general practice (GP) and core psychiatry training (CPT)
32. Of the 3,725 doctors appointed to UK specialty training programmes, only one did not indicate which clinical programme they had been appointed to. From this sub-group, 1,262 (33.9%) were appointed to GP training and 189 (5.1%) to CPT. These percentages compare to 35.5% and 5.7% in 2014, 36.6% and 5.3% in 2013 and 36.1% and 4.7% in 2012 respectively.
33. Table 10 illustrates whether or not GP and CPT were the first choice programmes for
appointees. Table 10 – Was GP and CPT the first choice for appointees?
First choice for appointees? Yes No No
response
General Practice 96.8% 3.1% 0.1%
Core Psychiatry Training 94.2% 5.8% 0.0%
Post-foundation employment outside of the UK
34. 394 of the 7,168 respondents (5.5%) reported they had secured a service post and 27
(0.4%) had secured a specialty training post outside of the UK. This compares to 3.8% and 0.3% in 2014, 4.8% and 0.6% in 2013 and 6.6% and 1.1% in 2012 respectively.
35. Table 11 shows that, once again, the majority of the relatively small number (421) of doctors who secured specialty training or service posts outside the UK had made a positive choice to do this.
Table 11 – Preferred choice to leave UK practice
Career destination outside the UK Preferred choice to leave UK?
Yes No No
response
Service post 85.0% 1.5% 13.5%
Specialty training post 63.0% 0.0% 37.0%

National F2 Career Destination Survey 2015
Page 8 of 13
36. Table 12 provides details of doctors appointed to service and specialty training posts outside the UK and whether they intend to return to UK practice within the next five years. The results show that the majority of doctors appointed to service posts intend to return to UK practice. Due to the small number of doctors appointed to specialty training outside of the UK and low response rate to this question, caution should be exercised when interpreting the data.
Table 12 – Intention to return to UK
Career destination outside the UK
Intend to return to UK practice within five years
Yes No Unsure No
response
Service post 66.2% 1.8% 18.5% 13.5%
Specialty training post 14.8% 14.8% 33.3% 37.0%
Royal College exams taken during the F2 year
37. 2,556 (35.7%) respondents reported they took at least one of the following medical royal college exams:
Royal College of Physicians (MRCP Part 1)
Royal College of Surgeons (MRCS Part A)
Royal College of Paediatrics and Child Heath (MRCPCH 1)
Royal College of Obstetrics and Gynaecology (MRCOG Part 1).
38. Table 13 sets out the number of doctors who undertook each exam and the respective success rate. The MRCP Part 1 was the most common examination. Table 13 - Number of doctors who sat each exam
Royal college exam MRCP Part 1
MRCS Part A
MRCOG Part 1
MRCPCH Part 1
Pass 1,143 429 48 138
Fail 330 240 28 38
Awaiting result 98 14 2 48
Total 1,571 683 78 224
Intention to work less than full-time
39. 7,162 (99.9%) respondents provided details of whether or not they intend to work less than full-time (LTFT) during the next stage of their medical training/career. 1,044 (14.6%) of these doctors stated they intend to work LTFT, of which 448 (42.9%) are male, 587 (56.2%) are female and 9 (0.9%) preferred not to specify. These percentages compare to 37.5% male, 61.2% female and 1.3% preferred not to specify in 2014.
National F2 Career Destination Survey 2015
Page 9 of 13
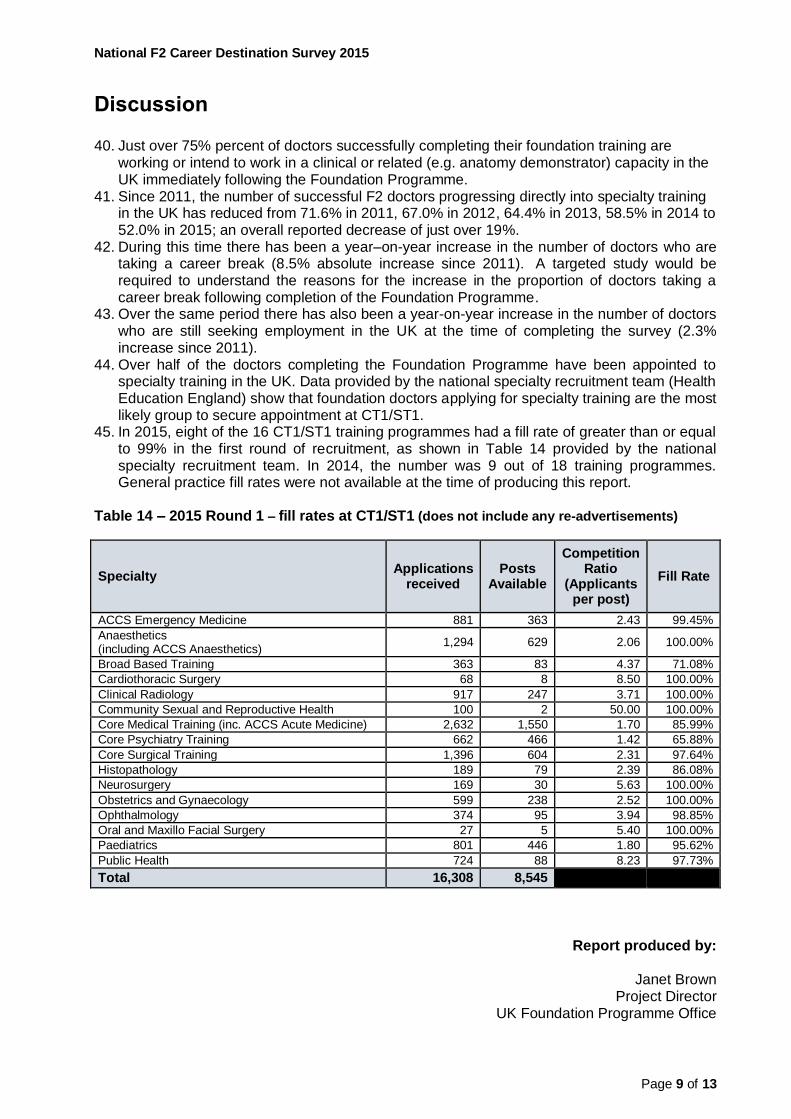
Discussion 40. Just over 75% percent of doctors successfully completing their foundation training are
working or intend to work in a clinical or related (e.g. anatomy demonstrator) capacity in the UK immediately following the Foundation Programme.
41. Since 2011, the number of successful F2 doctors progressing directly into specialty training in the UK has reduced from 71.6% in 2011, 67.0% in 2012, 64.4% in 2013, 58.5% in 2014 to 52.0% in 2015; an overall reported decrease of just over 19%.
42. During this time there has been a year–on-year increase in the number of doctors who are taking a career break (8.5% absolute increase since 2011). A targeted study would be required to understand the reasons for the increase in the proportion of doctors taking a career break following completion of the Foundation Programme.
43. Over the same period there has also been a year-on-year increase in the number of doctors who are still seeking employment in the UK at the time of completing the survey (2.3% increase since 2011).
44. Over half of the doctors completing the Foundation Programme have been appointed to specialty training in the UK. Data provided by the national specialty recruitment team (Health Education England) show that foundation doctors applying for specialty training are the most likely group to secure appointment at CT1/ST1.
45. In 2015, eight of the 16 CT1/ST1 training programmes had a fill rate of greater than or equal to 99% in the first round of recruitment, as shown in Table 14 provided by the national specialty recruitment team. In 2014, the number was 9 out of 18 training programmes. General practice fill rates were not available at the time of producing this report.
Table 14 – 2015 Round 1 – fill rates at CT1/ST1 (does not include any re-advertisements)
Specialty Applications
received Posts
Available
Competition Ratio
(Applicants per post)
Fill Rate
ACCS Emergency Medicine 881 363 2.43 99.45%
Anaesthetics (including ACCS Anaesthetics)
1,294 629 2.06 100.00%
Broad Based Training 363 83 4.37 71.08%
Cardiothoracic Surgery 68 8 8.50 100.00%
Clinical Radiology 917 247 3.71 100.00%
Community Sexual and Reproductive Health 100 2 50.00 100.00%
Core Medical Training (inc. ACCS Acute Medicine) 2,632 1,550 1.70 85.99%
Core Psychiatry Training 662 466 1.42 65.88%
Core Surgical Training 1,396 604 2.31 97.64%
Histopathology 189 79 2.39 86.08%
Neurosurgery 169 30 5.63 100.00%
Obstetrics and Gynaecology 599 238 2.52 100.00%
Ophthalmology 374 95 3.94 98.85%
Oral and Maxillo Facial Surgery 27 5 5.40 100.00%
Paediatrics 801 446 1.80 95.62%
Public Health 724 88 8.23 97.73%
Total 16,308 8,545
Report produced by:
Janet Brown
Project Director UK Foundation Programme Office
National F2 Career Destination Survey 2015
Page 10 of 13
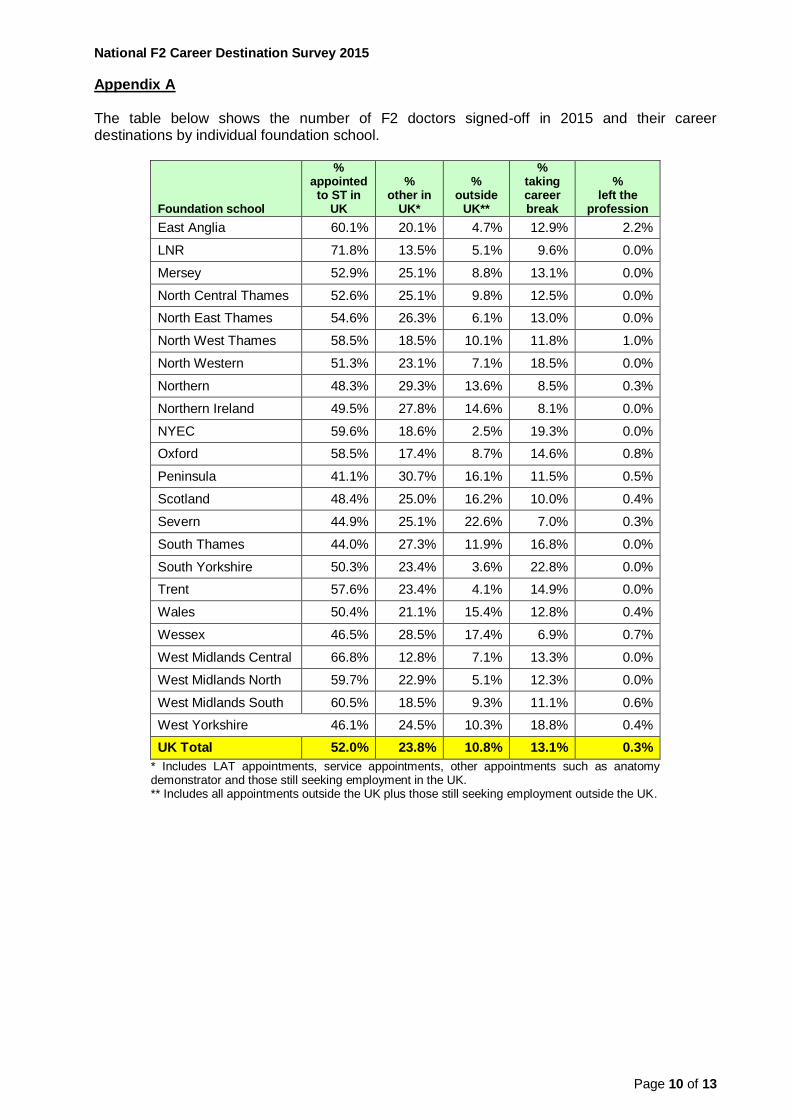
Appendix A The table below shows the number of F2 doctors signed-off in 2015 and their career destinations by individual foundation school.
Foundation school
% appointed to ST in
UK
% other in
UK*
% outside
UK**
% taking career break
% left the
profession
East Anglia 60.1% 20.1% 4.7% 12.9% 2.2%
LNR 71.8% 13.5% 5.1% 9.6% 0.0%
Mersey 52.9% 25.1% 8.8% 13.1% 0.0%
North Central Thames 52.6% 25.1% 9.8% 12.5% 0.0%
North East Thames 54.6% 26.3% 6.1% 13.0% 0.0%
North West Thames 58.5% 18.5% 10.1% 11.8% 1.0%
North Western 51.3% 23.1% 7.1% 18.5% 0.0%
Northern 48.3% 29.3% 13.6% 8.5% 0.3%
Northern Ireland 49.5% 27.8% 14.6% 8.1% 0.0%
NYEC 59.6% 18.6% 2.5% 19.3% 0.0%
Oxford 58.5% 17.4% 8.7% 14.6% 0.8%
Peninsula 41.1% 30.7% 16.1% 11.5% 0.5%
Scotland 48.4% 25.0% 16.2% 10.0% 0.4%
Severn 44.9% 25.1% 22.6% 7.0% 0.3%
South Thames 44.0% 27.3% 11.9% 16.8% 0.0%
South Yorkshire 50.3% 23.4% 3.6% 22.8% 0.0%
Trent 57.6% 23.4% 4.1% 14.9% 0.0%
Wales 50.4% 21.1% 15.4% 12.8% 0.4%
Wessex 46.5% 28.5% 17.4% 6.9% 0.7%
West Midlands Central 66.8% 12.8% 7.1% 13.3% 0.0%
West Midlands North 59.7% 22.9% 5.1% 12.3% 0.0%
West Midlands South 60.5% 18.5% 9.3% 11.1% 0.6%
West Yorkshire 46.1% 24.5% 10.3% 18.8% 0.4%
UK Total 52.0% 23.8% 10.8% 13.1% 0.3%
* Includes LAT appointments, service appointments, other appointments such as anatomy demonstrator and those still seeking employment in the UK. ** Includes all appointments outside the UK plus those still seeking employment outside the UK.

National F2 Career Destination Survey 2015
Page 11 of 13
Appendix B
The table below shows the career destinations for F2s completing their foundation training in 2015 by graduating medical school.
Medical school
% appointed to ST in
UK
% other in UK*
% outside
UK**
% taking career break
% left the
profession
Aberdeen (University of), School of Medicine 52.7% 24.6% 10.8% 11.4% 0.6% Barts and The London School of Medicine and Dentistry, Queen Mary, University of London
58.1% 24.5% 5.3% 11.3% 0.8%
Birmingham (University of), School of Medicine 60.1% 16.8% 11.2% 11.7% 0.3%
Brighton and Sussex Medical School 46.9% 27.2% 12.2% 12.9% 0.7%
Bristol (University of), Faculty of Medicine 41.0% 21.7% 22.6% 13.7% 0.9%
Cambridge (University of), School of Clinical Medicine 70.1% 19.7% 4.4% 5.1% 0.7%
Cardiff University, School of Medicine 42.7% 25.8% 17.2% 13.9% 0.3% Dundee (University of), Faculty of Medicine, Dentistry and
Nursing 57.3% 26.6% 7.7% 7.7% 0.7%
Edinburgh (The University of), College of Medicine and Veterinary Medicine
44.8% 24.3% 19.6% 10.9% 0.4%
Glasgow (University of), Faculty of Medicine 47.9% 24.6% 19.6% 7.5% 0.4%
Hull York Medical School 56.2% 18.2% 9.5% 16.1% 0.0%
Imperial College School of Medicine, London 54.3% 24.0% 8.9% 12.6% 0.3% Keele University, School of Medicine 59.8% 22.1% 6.6% 11.5% 0.0% King's College London School of Medicine (at Guy's, King's College and St Thomas' Hospital)
49.2% 27.8% 8.2% 13.9% 0.8%
Lancaster School of Health and Medicine 60.0% 25.0% 0.0% 15.0% 0.0%
Leeds (University of), School of Medicine 50.2% 24.9% 12.2% 12.7% 0.0%
Leicester (University of), Leicester Medical School 65.1% 12.7% 8.0% 14.2% 0.0% Liverpool (University of), Faculty of Health and Life Sciences 49.8% 21.8% 8.4% 20.0% 0.0% Manchester (University of), Faculty of Medical and Human Sciences
51.4% 19.3% 10.4% 18.8% 0.0%
Newcastle (University of), Newcastle Biomedicine, The
Medical School 43.9% 29.3% 16.5% 10.3% 0.0%
Norwich Medical School, University of East Anglia 59.4% 20.3% 4.7% 15.6% 0.0% Nottingham (The University of), Faculty of Medicine and Health Sciences
54.5% 25.7% 8.2% 11.2% 0.4%
Oxford (University of), Medical Sciences Division 60.3% 15.6% 14.2% 9.9% 0.0%
Peninsula College of Medicine and Dentistry 44.8% 29.0% 13.7% 12.6% 0.0% Queen's University Belfast, Faculty of Medicine and Health Sciences
47.7% 28.1% 15.6% 8.5% 0.0%
Sheffield (The University of), School of Medicine 50.2% 17.8% 9.4% 22.1% 0.5%
Southampton (University of), School of Medicine 41.0% 25.7% 13.3% 20.0% 0.0%
St George's, University of London 54.9% 26.3% 6.0% 12.0% 0.8%
University College London, University College Medical School 45.8% 27.5% 7.2% 19.2% 0.3%
Warwick (University of), Warwick Medical School 67.5% 18.2% 8.4% 5.8% 0.0%
UK Total 51.8% 23.4% 11.2% 13.3% 0.3%
Other EEA (non UK) country 53.6% 31.9% 3.6% 10.2% 0.6%
Other non-EEA/non-UK country 56.4% 32.5% 1.8% 9.2% 0.0%
Non-UK Total 55.0% 32.2% 2.7% 9.7% 0.3%
Missing or invalid med school*** 71.4% 14.3% 14.3% 0.0% 0.0%
Overall Total 52.0% 23.8% 10.8% 13.1% 0.3%
* Includes LAT appointments, service appointments, other appointments such as anatomy demonstrator and those still seeking employment in the UK. ** Includes all appointments outside the UK plus those still seeking employment outside the UK. *** Includes any medical schools with less than 5 respondents (e.g. Swansea).
National F2 Career Destination Survey 2015
Page 12 of 13
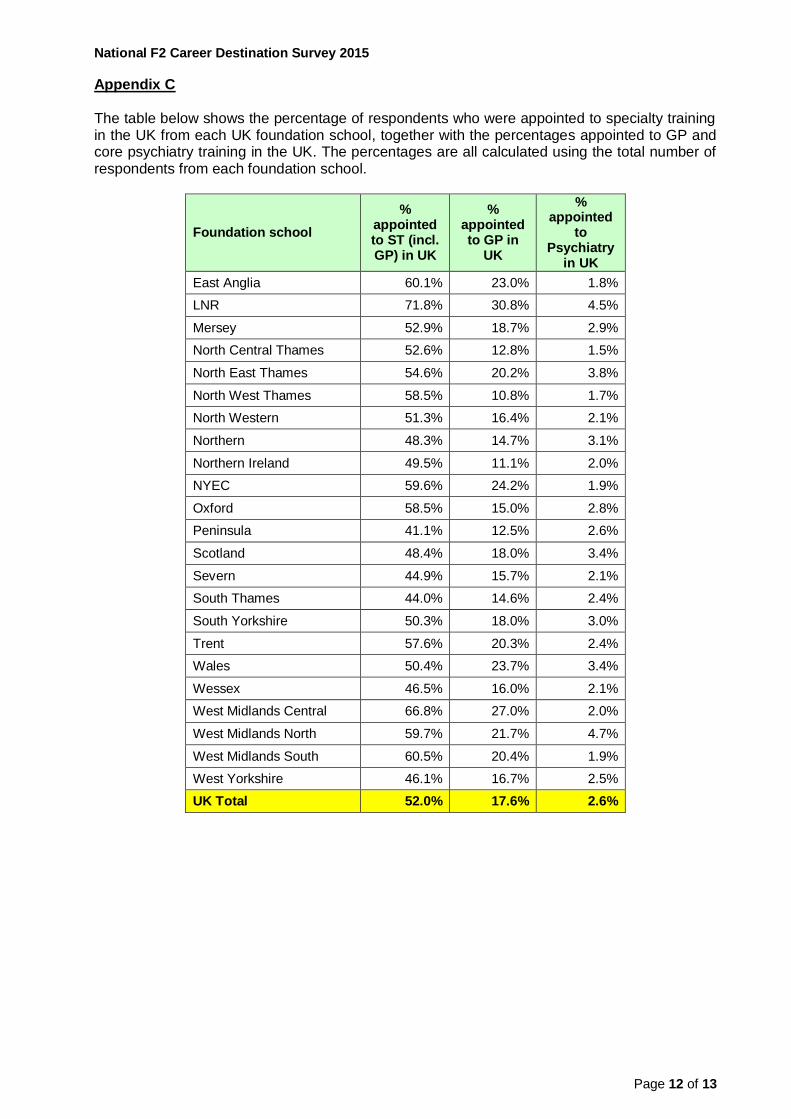
Appendix C
The table below shows the percentage of respondents who were appointed to specialty training in the UK from each UK foundation school, together with the percentages appointed to GP and core psychiatry training in the UK. The percentages are all calculated using the total number of respondents from each foundation school.
Foundation school
% appointed to ST (incl. GP) in UK
% appointed to GP in
UK
% appointed
to Psychiatry
in UK
East Anglia 60.1% 23.0% 1.8%
LNR 71.8% 30.8% 4.5%
Mersey 52.9% 18.7% 2.9%
North Central Thames 52.6% 12.8% 1.5%
North East Thames 54.6% 20.2% 3.8%
North West Thames 58.5% 10.8% 1.7%
North Western 51.3% 16.4% 2.1%
Northern 48.3% 14.7% 3.1%
Northern Ireland 49.5% 11.1% 2.0%
NYEC 59.6% 24.2% 1.9%
Oxford 58.5% 15.0% 2.8%
Peninsula 41.1% 12.5% 2.6%
Scotland 48.4% 18.0% 3.4%
Severn 44.9% 15.7% 2.1%
South Thames 44.0% 14.6% 2.4%
South Yorkshire 50.3% 18.0% 3.0%
Trent 57.6% 20.3% 2.4%
Wales 50.4% 23.7% 3.4%
Wessex 46.5% 16.0% 2.1%
West Midlands Central 66.8% 27.0% 2.0%
West Midlands North 59.7% 21.7% 4.7%
West Midlands South 60.5% 20.4% 1.9%
West Yorkshire 46.1% 16.7% 2.5%
UK Total 52.0% 17.6% 2.6%
National F2 Career Destination Survey 2015
Page 13 of 13
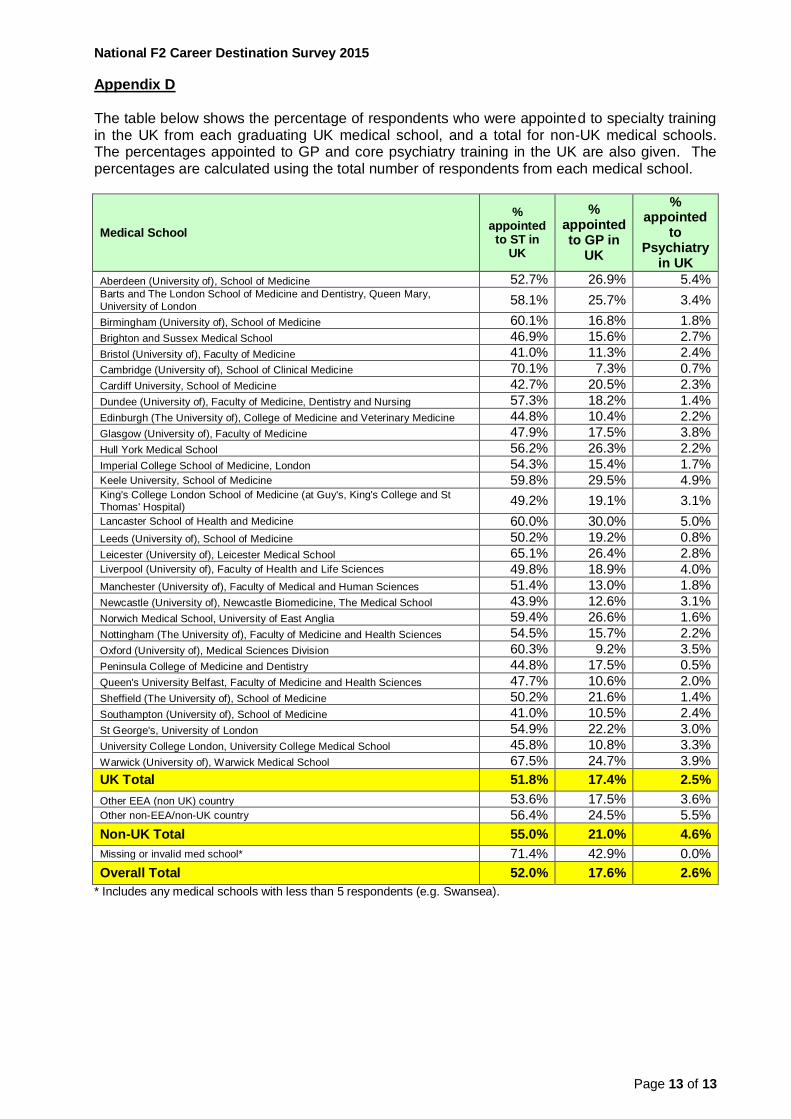
Appendix D
The table below shows the percentage of respondents who were appointed to specialty training in the UK from each graduating UK medical school, and a total for non-UK medical schools. The percentages appointed to GP and core psychiatry training in the UK are also given. The percentages are calculated using the total number of respondents from each medical school.
Medical School
% appointed to ST in
UK
% appointed to GP in
UK
% appointed
to Psychiatry
in UK
Aberdeen (University of), School of Medicine 52.7% 26.9% 5.4% Barts and The London School of Medicine and Dentistry, Queen Mary,
University of London 58.1% 25.7% 3.4%
Birmingham (University of), School of Medicine 60.1% 16.8% 1.8%
Brighton and Sussex Medical School 46.9% 15.6% 2.7%
Bristol (University of), Faculty of Medicine 41.0% 11.3% 2.4%
Cambridge (University of), School of Clinical Medicine 70.1% 7.3% 0.7%
Cardiff University, School of Medicine 42.7% 20.5% 2.3%
Dundee (University of), Faculty of Medicine, Dentistry and Nursing 57.3% 18.2% 1.4%
Edinburgh (The University of), College of Medicine and Veterinary Medicine 44.8% 10.4% 2.2%
Glasgow (University of), Faculty of Medicine 47.9% 17.5% 3.8%
Hull York Medical School 56.2% 26.3% 2.2%
Imperial College School of Medicine, London 54.3% 15.4% 1.7% Keele University, School of Medicine 59.8% 29.5% 4.9% King's College London School of Medicine (at Guy's, King's College and St Thomas' Hospital)
49.2% 19.1% 3.1%
Lancaster School of Health and Medicine 60.0% 30.0% 5.0%
Leeds (University of), School of Medicine 50.2% 19.2% 0.8%
Leicester (University of), Leicester Medical School 65.1% 26.4% 2.8% Liverpool (University of), Faculty of Health and Life Sciences 49.8% 18.9% 4.0%
Manchester (University of), Faculty of Medical and Human Sciences 51.4% 13.0% 1.8%
Newcastle (University of), Newcastle Biomedicine, The Medical School 43.9% 12.6% 3.1%
Norwich Medical School, University of East Anglia 59.4% 26.6% 1.6%
Nottingham (The University of), Faculty of Medicine and Health Sciences 54.5% 15.7% 2.2%
Oxford (University of), Medical Sciences Division 60.3% 9.2% 3.5%
Peninsula College of Medicine and Dentistry 44.8% 17.5% 0.5%
Queen's University Belfast, Faculty of Medicine and Health Sciences 47.7% 10.6% 2.0%
Sheffield (The University of), School of Medicine 50.2% 21.6% 1.4%
Southampton (University of), School of Medicine 41.0% 10.5% 2.4%
St George's, University of London 54.9% 22.2% 3.0%
University College London, University College Medical School 45.8% 10.8% 3.3%
Warwick (University of), Warwick Medical School 67.5% 24.7% 3.9%
UK Total 51.8% 17.4% 2.5%
Other EEA (non UK) country 53.6% 17.5% 3.6% Other non-EEA/non-UK country 56.4% 24.5% 5.5%
Non-UK Total 55.0% 21.0% 4.6%
Missing or invalid med school* 71.4% 42.9% 0.0%
Overall Total 52.0% 17.6% 2.6%
* Includes any medical schools with less than 5 respondents (e.g. Swansea).