fab q3/9m’17 financial results - personal banking€¦ · fab q3/9m’17 financial results ......
TRANSCRIPT
FAB Q3/9M’17 Financial Results Management Discussion & Analysis
Pro forma Financial Statements
Management Discussion & Analysis Report
for the nine-month period ended 30 September 2017
Please note that FAB pro forma consolidated financials at 30 September 2017 serve as the main basis of reference for our Management Discussion & Analysis Report (MDA) and Investor Relations presentation.
FAB’s reviewed consolidated interim financial statements at 30 September 2017 are prepared on the basis that the FGB/NBAD merger was declared effective on 1st April 2017 with FGB being the accounting acquirer as per IFRS 3. Therefore, these financials reflect the consolidation of NBAD since 1st April 2017 only, while prior period comparative financial information relates to FGB.
For further information, please refer to the Business Combination note of the reviewed consolidated interim financial statements.
Page 2 of 11
Abu Dhabi, 25th October 2017
Management Discussion and Analysis Report
Resilient performance with nine-month Group Net Profit achieved at AED 8.09 Billion
Third quarter Group Net Profit up 2% to AED 2.61 Billion
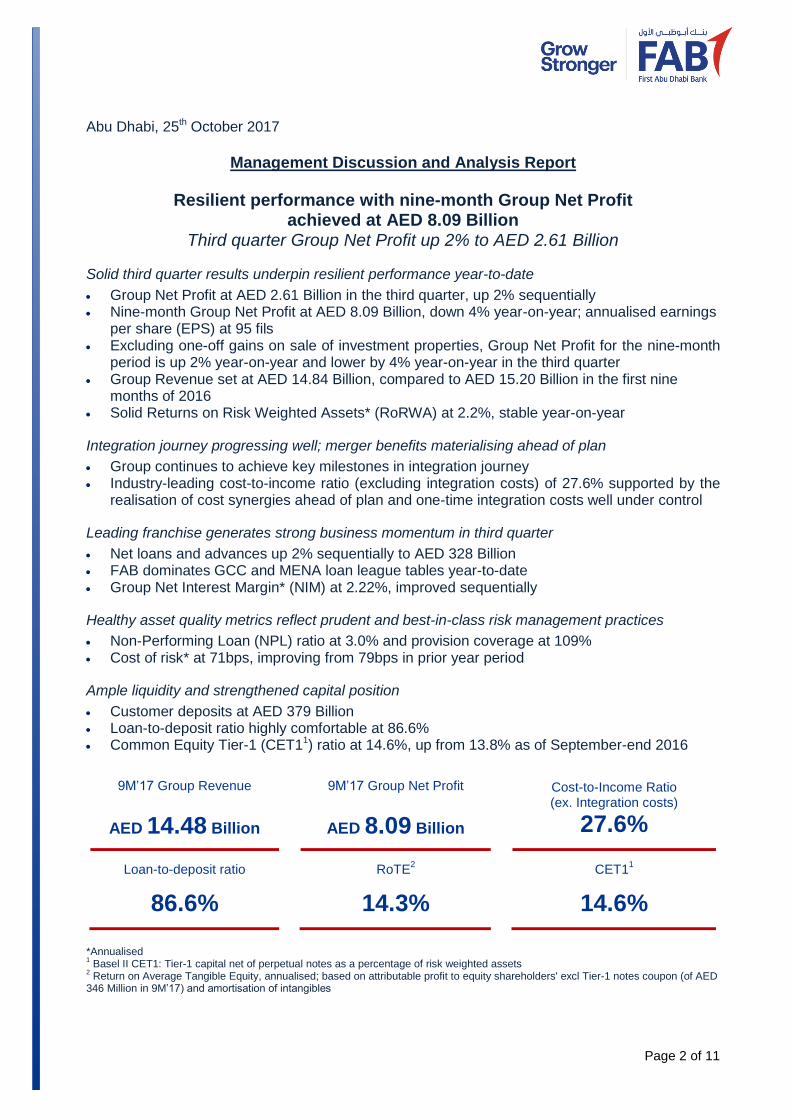
Solid third quarter results underpin resilient performance year-to-date
Group Net Profit at AED 2.61 Billion in the third quarter, up 2% sequentially Nine-month Group Net Profit at AED 8.09 Billion, down 4% year-on-year; annualised earnings
per share (EPS) at 95 fils Excluding one-off gains on sale of investment properties, Group Net Profit for the nine-month
period is up 2% year-on-year and lower by 4% year-on-year in the third quarter Group Revenue set at AED 14.84 Billion, compared to AED 15.20 Billion in the first nine
months of 2016 Solid Returns on Risk Weighted Assets* (RoRWA) at 2.2%, stable year-on-year
Integration journey progressing well; merger benefits materialising ahead of plan
Group continues to achieve key milestones in integration journey Industry-leading cost-to-income ratio (excluding integration costs) of 27.6% supported by the
realisation of cost synergies ahead of plan and one-time integration costs well under control
Leading franchise generates strong business momentum in third quarter
Net loans and advances up 2% sequentially to AED 328 Billion FAB dominates GCC and MENA loan league tables year-to-date Group Net Interest Margin* (NIM) at 2.22%, improved sequentially
Healthy asset quality metrics reflect prudent and best-in-class risk management practices
Non-Performing Loan (NPL) ratio at 3.0% and provision coverage at 109% Cost of risk* at 71bps, improving from 79bps in prior year period
Ample liquidity and strengthened capital position
Customer deposits at AED 379 Billion Loan-to-deposit ratio highly comfortable at 86.6% Common Equity Tier-1 (CET11) ratio at 14.6%, up from 13.8% as of September-end 2016
9M’17 Group Revenue
AED 14.48 Billion
9M’17 Group Net Profit
AED 8.09 Billion
Cost-to-Income Ratio (ex. Integration costs)
27.6%
Loan-to-deposit ratio
86.6%
RoTE2
14.3%
CET11
14.6%
*Annualised 1 Basel II CET1: Tier-1 capital net of perpetual notes as a percentage of risk weighted assets
2 Return on Average Tangible Equity, annualised; based on attributable profit to equity shareholders' excl Tier-1 notes coupon (of AED
346 Million in 9M’17) and amortisation of intangibles
Page 3 of 11
First Abu Dhabi Bank (FAB), the UAE’s largest bank and one of the world’s largest and
safest financial institutions, has reported consolidated pro forma financial results for the
nine-month period ended September 2017, delivering a resilient performance.
Nine-month 2017 Group Net Profit was achieved at AED 8.09 Billion, down 4% year-on-
year, or up 2% when excluding one-off gains on sale of investment properties.
In the third quarter of 2017, Group Net Profit was up 2% sequentially on the back of a
notable improvement in cost of risk, and disciplined cost control coupled with the
realisation of merger synergies ahead of plan. Compared to the third quarter of 2016,
Group Net Profit was down 18%, or only 4% lower when excluding one-off gains on sale
of investment properties.
As of September-end 2017, the Group enjoys ample liquidity with a loans-to-deposits
ratio at 86.6%. In addition, capital position notably strengthened with CET1 reaching
14.6%, up from 13.8% last year. While total assets grew 2% year-on-year, balance sheet
optimisation has led to a 3% reduction in risk weighted assets. As a result, the Group
generated solid risk-adjusted returns with RoRWA at 2.2%, stable year-on-year.
Abdulhamid Saeed, Group Chief Executive Officer of
FAB, said: “FAB’s performance in the first nine months
of 2017 demonstrates the Group’s resilience as it
continues to achieve integration milestones and deliver
solid results against an operating backdrop that is
improving, yet remains challenging. As we approach the
end of 2017, I am very pleased with the excellent
progress we have made in our integration journey. As
we align our products and services, and further drive
innovation and the right digital solutions across all areas
of the business, we continue to place our clients first and
work towards enhancing long-term customer experience
across all business groups.”
“In a strong testament to our leading position as a financial services provider in the UAE
and the broader region, and despite a subdued loan market, FAB is dominating the GCC
and MENA loan league tables’ year-to-date with a 14.3% and 12.7% market share
respectively. In addition, FAB was recognised by Global Finance as the safest bank in the
UAE and the Middle East, and also the 4th safest bank in emerging markets, the 17th
amongst commercial banks and the 31st amongst all banks, worldwide.”
He added: “As we continue to build strong foundations to support the long term
sustainable growth of our franchise, we are on track to meet our targets for the current
Page 4 of 11
year and our strong capital buffers provide us with ample room to deliver top returns for
our shareholders.”
Integration and other updates
The Bank’s overall integration strategy is to leverage on the key strengths from legacy
banks in order to create value for FAB customers, employees, shareholders and
communities. Since the merger was completed earlier this year in April, the Group has
made significant progress in the integration journey. This included the finalisation of the
Bank’s organisational structure, operating model, and the harmonisation of Group policies
and our risk framework. The optimisation of branches and centralisation of back office
activities are also underway, to enhance efficiency and productivity across the business.
The launch of FAB’s new brand identity was quickly followed by the full re-brand of a
number of branches and customer touchpoints both locally and internationally, with the
optimisation of the Bank’s global locations set to continue. Full network and channel re-
brand across all critical customer touch-points is expected to be completed by the end of
the current year. Good progress has also been made towards IT system integration,
which is on track. From a financial standpoint, merger benefits are materialising quickly
and ahead of plan, and one-time integration costs are well under control.
In parallel to the integration project, FAB is focused on driving further innovation across
all areas of the business to significantly grow its product and service range. The Bank
recently appointed a Group Chief Customer Experience and Digital Officer to look after
the enterprise-wide alignment of FAB’s digital services and enhance long-term customer
experience.
Page 5 of 11
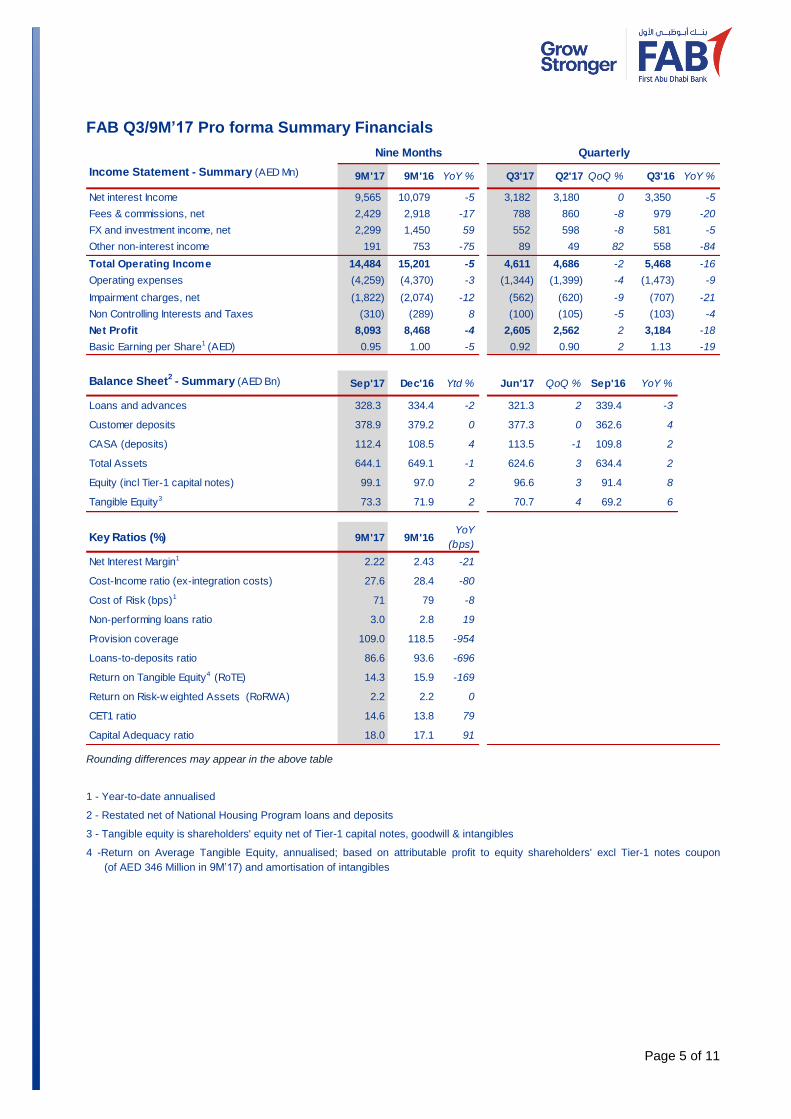
FAB Q3/9M’17 Pro forma Summary Financials
Rounding differences may appear in the above table
1 - Year-to-date annualised
2 - Restated net of National Housing Program loans and deposits
3 - Tangible equity is shareholders' equity net of Tier-1 capital notes, goodwill & intangibles
4 -Return on Average Tangible Equity, annualised; based on attributable profit to equity shareholders' excl Tier-1 notes coupon
(of AED 346 Million in 9M’17) and amortisation of intangibles
Income Statement - Summary (AED Mn) 9M'17 9M'16 YoY % Q3'17 Q2'17 QoQ % Q3'16 YoY %
Net interest Income 9,565 10,079 -5 3,182 3,180 0 3,350 -5
Fees & commissions, net 2,429 2,918 -17 788 860 -8 979 -20
FX and investment income, net 2,299 1,450 59 552 598 -8 581 -5
Other non-interest income 191 753 -75 89 49 82 558 -84
Total Operating Income 14,484 15,201 -5 4,611 4,686 -2 5,468 -16
Operating expenses (4,259) (4,370) -3 (1,344) (1,399) -4 (1,473) -9
Impairment charges, net (1,822) (2,074) -12 (562) (620) -9 (707) -21
Non Controlling Interests and Taxes (310) (289) 8 (100) (105) -5 (103) -4
Net Profit 8,093 8,468 -4 2,605 2,562 2 3,184 -18
Basic Earning per Share1 (AED) 0.95 1.00 -5 0.92 0.90 2 1.13 -19
Balance Sheet2 - Summary (AED Bn) Sep'17 Dec'16 Ytd % Jun'17 QoQ % Sep'16 YoY %
Loans and advances 328.3 334.4 -2 321.3 2 339.4 -3
Customer deposits 378.9 379.2 0 377.3 0 362.6 4
CASA (deposits) 112.4 108.5 4 113.5 -1 109.8 2
Total Assets 644.1 649.1 -1 624.6 3 634.4 2
Equity (incl Tier-1 capital notes) 99.1 97.0 2 96.6 3 91.4 8
Tangible Equity3 73.3 71.9 2 70.7 4 69.2 6
Key Ratios (%) 9M'17 9M'16YoY
(bps)
Net Interest Margin1 2.22 2.43 -21
Cost-Income ratio (ex-integration costs) 27.6 28.4 -80
Cost of Risk (bps)1 71 79 -8
Non-performing loans ratio 3.0 2.8 19
Provision coverage 109.0 118.5 -954
Loans-to-deposits ratio 86.6 93.6 -696
Return on Tangible Equity4 (RoTE) 14.3 15.9 -169
Return on Risk-w eighted Assets (RoRWA) 2.2 2.2 0
CET1 ratio 14.6 13.8 79
Capital Adequacy ratio 18.0 17.1 91
Nine Months Quarterly
Page 6 of 11
Financial Review
Operating income
Group Revenue for the nine-month period ended September 2017 (9M’17) was recorded
at AED 14.48 Billion, compared to AED 15.20 Billion during the same period last year. By
business segment, the Corporate & Investment Banking (CIB) Group generated 49% of
Group revenue, followed by the Personal Banking Group (PBG) with 35%. Head Office
and Subsidiaries contributed 10% and 6 % to total operating income respectively.
Net Interest Income (including Islamic Financing Income) stood at AED 9.56 Billion,
down 5% year-on-year. This decrease primarily stemmed from margin compression due
to portfolio optimisation towards higher risk-adjusted earning assets. Sequentially, net
interest income was flat in Q3’17, as rate hike benefit was largely offset by margin
compression.
Group Net Interest Margin improved by 9bps sequentially driven by asset repricing
whilst funding costs are tightly managed as synergies are realised. The drop in
deployment of excess liquidity also benefited Group NIM. Customer NIMs continue to
display positive trends supported by corporate loan repricing, as well as funding cost
optimisation.
Fees and commissions for 9M’17 were down 17%, reflecting lower market loan and
trade activity compared to 2016. During Q3’17, fees and commissions reduced by 8%
sequentially primarily on the back of lower volumes. In light of a healthy pipeline, fees and
commissions are expected to recover in the fourth quarter.
FX and investment income jumped 59% in 9M’17 supported by AFS investment gains in
the first quarter. In Q3’17, FX and investment income was down 8%, reflecting subdued
risk appetite in the markets compared to the previous quarter, translating to lower market
sales. This was partially offset by higher trading gains.
The reduction in “Other non-interest income” year-on-year was primarily due to the
non-recurrence of one-off gains on sale of investment properties.
G&A expenses were 3% lower to AED 4.26 Billion. Excluding one-time integration costs,
operating expenses were down 7% compared to the prior year period reflecting
successful realisation of cost efficiencies related to the merger, coupled with disciplined
cost control. In the third quarter, operating expenses (excluding one-time integration
costs) were 3% lower sequentially. As a result, FAB continues to display an industry-
leading cost-to-income ratio (excluding integration costs) of 27.6%, improving from 28.4%
the same period last year.
Page 7 of 11
Credit quality
The Group presents healthy asset quality metrics as of September-end 2017 reflecting
prudent and best-in-class risk management practices.
Impairment charges for 9M’17 were lower by 12% year-on-year, driven by higher
recoveries and lower collective impairment charges thanks to balance sheet optimisation.
As a result, annualised cost of risk improved by 8bps year-on-year to 71bps, at the lower
end of management guidance for the current year. Impairment charges for Q3’17 were
also lower by 20% and by 9%, compared to Q3’16 and Q2’17 respectively.
Non-performing loans reduced by AED 264 Million in Q3’17. This, combined with higher
loan balances, translated to an NPL ratio sequentially improving from 3.2% to 3.0%.
Group provision coverage is also solid with total provisions of AED 11.2 Billion
representing 109% of non-performing loans. Collective provisions represent 1.67% of
Credit RWAs, well above the required regulatory requirement of 1.5%.
Balance sheet trends
Leveraging on a leading customer franchise and a robust balance sheet, FAB was able to
generate solid risk-adjusted returns in the first nine months of 2017. RoRWA stood at
2.2%, stable year-on-year, reflecting successful balance sheet optimisation with RWAs
reducing 3% while total assets grew by 2%.
Lending momentum was strong during the last quarter with loans and advances (net)
growing 2% to AED 328 Billion. This increase was primarily driven by selective trade
finance lending offering attractive risk-adjusted returns. Year-to-date, net loans were
reduced by 2% as new origination was offset by balance sheet optimisation and corporate
repayments.
Customer deposits were stable year-to-date at AED 379 Billion reflecting a continued
focus on funding optimisation. Current Account and Saving Account (CASA) deposits
grew 4% to AED 112 Billion, highlighting the Bank’s strong deposit franchise supported
by best-in-class products including a leading cash management solution.
The Group enjoys ample liquidity with loans-to-deposits ratio at 86.6%, positioning the
Bank well to seize future growth opportunities. In addition, Liquidity Coverage Ratio (LCR)
remained well above the glide path as defined by Basel III norms.
Page 8 of 11
The Group’s leading market positioning and superior credit ratings are strong competitive
advantages facilitating access to various sources of funds from multiple geographies, at a
competitive pricing.
Shareholders’ equity & capital
Shareholders’ equity grew by 2% year-to-date to AED 99.1 Billion as of September-end
2017, led by retained earnings. This includes AED 10.8 Billion of Tier-1 capital notes and
tangible equity of AED 73.3 Billion.
The Group enjoys strengthened capital position with a CET-1 ratio at 14.6%, up from
13.8% when compared to the prior year period, and a total capital adequacy ratio at
18.0%. This places the Bank well to comply with regulatory capital requirements even
when considering the additional capital surcharge of 1.5% owing to its D-SIB status
ahead of full Basel-III implementation in UAE by 2019. At 14.3%, return on tangible
equity is in line with management guidance for the current year.
Accounting Standard IFRS 3 requires the Bank to complete a “Purchase Price Allocation”
exercise which will determine the goodwill arising from the merger. This exercise is in
progress and will be completed within the deadline prescribed in the Accounting
Standard, i.e. by 31 March 2018.
Business performance
Corporate & Investment Banking (CIB) Group
FAB’s industry-leading CIB franchise delivered a resilient performance in the first nine
months of 2017, with a 4% growth in net profit. While revenues were down 2% primarily
due to lower market loan and trade volumes compared to the prior period, risk-adjusted
returns have improved across the business thanks to a continued focus on balance sheet
optimisation. Furthermore, disciplined cost management and realisation of synergies
translated to a 11% reduction in operating expenses year-on-year.
Despite a subdued loan market, FAB dominated both GCC and MENA league tables
year-to-date, with 14.3% and 12.7% market shares respectively, double the market share
of the nearest peer.
FAB’s Cash Management business recorded strong growth year-to-date, translating to
increases in CASA balances. The Islamic business in CIB also continued to perform well
with double digit growth over last year.
Global Markets’ overall performance continues to reflect resilience and strength in driving
top line revenues across our customer franchise, liquidity position and investments
portfolio performance. While year-to-date revenues have improved, quarterly
Page 9 of 11
performance was impacted by prolonged lower oil prices, the uncertain global geopolitical
environment and subdued risk appetite in the markets.
CIB won numerous awards in 2017, reflecting the franchise’s market leading position:
“Best Trade Finance Bank in MENA” at the GTR Leaders in Trade 2016 awards
highlighting excellence in trade, commodity, supply chain and export finance
markets
“Best Bank for Financing in the Middle East” and “Best Investment Bank in the
United Arab Emirates” at the 2017 Euromoney Middle East Awards
“Best FX Provider in UAE”, “Best Overall Bank for Cash Management” and “Best
Bank for Liquidity Management in MENA” at Global Finance magazine’s 2017
Transaction Processing Awards
“Most Innovative Investment Bank” for the MENA region at The Banker’s
prestigious 2017 Investment Banking Awards.
Personal Banking Group (PBG)
FAB’s range of products and services in Personal Banking was significantly enhanced
post-merger offering new opportunities both in terms of innovation and cross-sell, and
leading to increased productivity across the business.
PBG delivered a resilient performance in a challenging operating environment marked by
a slowdown in retail spending. Revenues were 8% lower year-on-year, primarily driven by
lower net interest income reflecting tighter margins, and continued balance sheet
optimisation. However, the mortgage portfolio grew 8% during the period, reflecting
PBG’s focus on optimising the asset mix by channeling liquidity towards higher risk-
adjusted earning assets.
Consolidation of the business post-merger and related cost savings led to a notable 12%
reduction in operating expenses. On the liability side, retail CASA balances continued to
grow, supporting the lower cost of deposits and helping to offset the impact of competition
on product yields.
During the period, the Private Banking and Wealth Management business recorded high
levels of subscriptions in FAB Asset Management Funds. The team continued to maintain
a strong focus on strategic initiatives, people, product and services and training to ensure
enhanced customer experience.
In line with their focus on enhancing the product offering and value proposition, the
Business Banking Team launched Mortgage Backed Business Finance and revised the
proposition for Liabilities, Bancassurance and Key Man Insurance. Within Auto Lending, a
Page 10 of 11
partnership with Porsche Financial Service was launched in order to boost business flow
from prestigious vehicle brands.
FAB’s strong PBG franchise was recognised through the “Best Fixed Income of the Year”
and “UAE Asset Manager of the Year” titles by Mena Fund Manager Performance Awards
2017.
Subsidiaries
FAB enjoys a highly diversified business model supported by complementary offerings
provided across real estate management, Islamic banking, brokerage, and credit cards
through its subsidiaries.
Over the first nine months of 2017, revenues for Subsidiaries were AED 921 Million
compared to AED 1,468 Million for the same period last year. This decrease is mainly due
to the non-recurrence of property-related gains.
So far, FAB fully integrated its real estate and property management businesses.
Integration of the Islamic Finance subsidiaries is underway.
In recognition of leading franchises in brokerage and consumer finance, the Banker
Middle East named NBAD Securities “Best Brokerage Company” for the second year in a
row, and Dubai First “Best Consumer Finance Company” for the third consecutive year at
their 2017 Industry Awards ceremony earlier this year.
International
The international business remains a key competitive advantage and differentiator for
FAB as a significant contributor to liquidity and risk diversification. 9M’17 revenues stood
at AED 1.83 Billion, contributing 13% to the Group’s total revenues.
International loans and deposits represent 20% and 27% of total Group loans and
deposits respectively as of September-end 2017.
Page 11 of 11
About First Abu Dhabi Bank (FAB)
FAB, the UAE’s largest bank and one of the world’s largest and safest financial
institutions, offers an extensive range of tailor-made solutions, and products and services,
to provide a customised experience. Through its strategic offerings, it looks to meet the
banking needs of customers across the world via its market-leading Corporate and
Investment Banking and Personal Banking franchises.
Headquartered in Abu Dhabi in Khalifa Business Park, the bank’s international network
spans over 19 countries outside the UAE, providing the global relationships, expertise
and financial strength to support local, regional and international businesses seeking to
do business at home and abroad.
In line with its commitment to put customers first, to Grow Stronger, FAB will continually
invest in people and technology to create the most customer-friendly banking experience,
and will support the growth ambitions of its stakeholders across countries in which the
bank operates.
To empower its customers and clients to Grow Stronger, FAB initiated a powerful
movement, which goes beyond banking. The Grow Stronger movement represents the
bank’s promise to support its stakeholders’ goals and growth ambitions, providing ideas,
tools and expertise to help them become stronger, today and in the future.
Based on pro forma financial information as at September-end 2017, FAB had total
assets of AED 644 Billion (USD 175 Billion). FAB is rated Aa3/AA-/AA- by Moody’s, S&P
and Fitch respectively, the strongest combined ratings of any bank in the MENA region.
The Bank has been ranked by Global Finance as the safest bank in the UAE and the
Middle East, 4th in emerging markets, 17th amongst commercial banks worldwide, and
31st in the world amongst all banks.Through a strong, diversified balance sheet, leading
efficiency and a solid corporate governance structure in place, FAB is set to drive growth
forward.
For further information, visit: www.bankfortheuae.com
For investor-related queries, please contact FAB Investor Relations team on
or download FAB Investor Relations app on iOS or Android
Pro forma Condensed Consolidated Interim Financial Information
September 30, 2017
PRO FORMA CONDENSED CONSOLIDATED INTERIM FINANCIAL INFORMATION
The following pro forma condensed consolidated financial information (“Pro forma financial information”) illustrates the effects on the statement of financial position and financial performance of the combination (Merger) between National Bank of Abu Dhabi and its subsidiaries (together referred to as “NBAD”) and First Gulf Bank and its subsidiaries (together referred to as “FGB”). The Pro forma financial information consists of the Unaudited Pro Forma Condensed Consolidated Statement of Financial Position of NBAD and FGB (together referred to as “the Group”) as at 30 September 2017, and its Unaudited Pro forma Condensed Consolidated interim statement of Profit or Loss for the period then ended. These statements are prepared as if the Merger has taken place as at 1 Jan 2016. The purpose of the Pro forma financial information is to show the material effects that the Merger of NBAD and FGB would have had on the historical consolidated statement of financial position if the Group had already existed in the structure created by the Merger as at 30 September 2017 and on the historical consolidated statement of profit or loss for the financial period ended 30 September 2017. They are not representative of the financial situation and performance that could have been observed if the indicated business combination had been undertaken at an earlier date. The presentation of the Pro forma financial information of the Group is based on certain pro forma assumptions and has been prepared for illustrative purposes only and, because of its nature, the pro forma consolidated statement of financial position and financial performance addresses a hypothetical situation and, therefore, does not represent and may not give a true picture of the financial position and financial performance of the Group. Furthermore, the Pro forma financial information is only meaningful in conjunction with the historical consolidated financial statements of NBAD and FGB as at and for the financial year ended 31 December 2016. The Pro forma financial information have been compiled based on the accounting policies adopted by the Group for the preparation of 30 September 2017 financial information. Any impact due to change in the accounting policy and adjustment have been reflected in prior comparative periods. The Pro forma financial information does not take into consideration the effects of expected synergies or costs incurred to achieve these synergies as a result of the Merger. The Pro forma financial information gives no indication of the results and future financial situation of the activities of the Group.
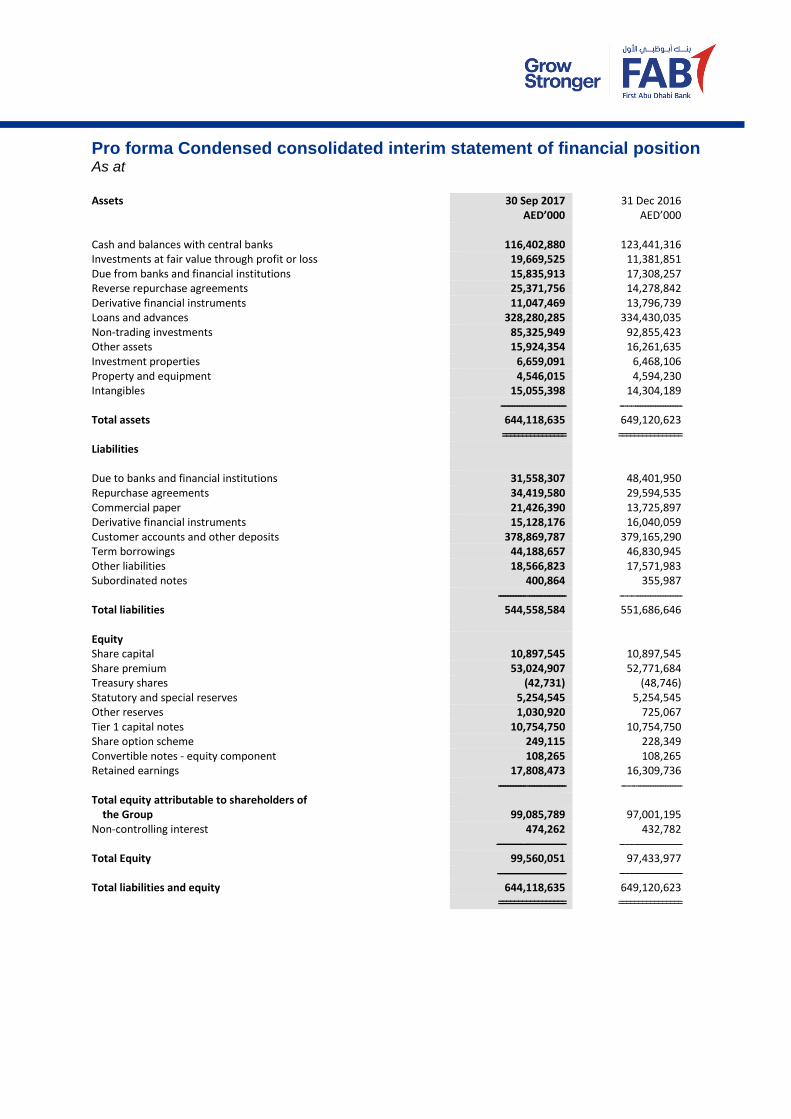
Pro forma Condensed consolidated interim statement of financial position As at
Assets 30 Sep 2017
AED’000 31 Dec 2016
AED’000 Cash and balances with central banks 116,402,880 123,441,316 Investments at fair value through profit or loss 19,669,525 11,381,851 Due from banks and financial institutions 15,835,913 17,308,257 Reverse repurchase agreements 25,371,756 14,278,842 Derivative financial instruments 11,047,469 13,796,739 Loans and advances 328,280,285 334,430,035 Non-trading investments 85,325,949 92,855,423 Other assets 15,924,354 16,261,635 Investment properties 6,659,091 6,468,106 Property and equipment 4,546,015 4,594,230 Intangibles 15,055,398 14,304,189 --------------------------------------- --- -- -- ----------------------------- Total assets 644,118,635 649,120,623 ================ ================ Liabilities Due to banks and financial institutions 31,558,307 48,401,950 Repurchase agreements 34,419,580 29,594,535 Commercial paper 21,426,390 13,725,897 Derivative financial instruments 15,128,176 16,040,059 Customer accounts and other deposits 378,869,787 379,165,290 Term borrowings 44,188,657 46,830,945 Other liabilities 18,566,823 17,571,983 Subordinated notes 400,864 355,987 ----------------- ----------------------- --- -- --- ---------------------------- Total liabilities 544,558,584 551,686,646 Equity Share capital 10,897,545 10,897,545 Share premium 53,024,907 52,771,684 Treasury shares (42,731) (48,746) Statutory and special reserves 5,254,545 5,254,545 Other reserves 1,030,920 725,067 Tier 1 capital notes 10,754,750 10,754,750 Share option scheme 249,115 228,349 Convertible notes - equity component 108,265 108,265 Retained earnings 17,808,473 16,309,736 ----------------- ----------------------- --- -- --- --------------------------- Total equity attributable to shareholders of the Group 99,085,789 97,001,195 Non-controlling interest 474,262 432,782 ---------------- ------------------------- --- -- --- ---------------------------- Total Equity 99,560,051 97,433,977 ----------------------------------------- --- -- --- ---------------------------- Total liabilities and equity 644,118,635 649,120,623 ================= ================
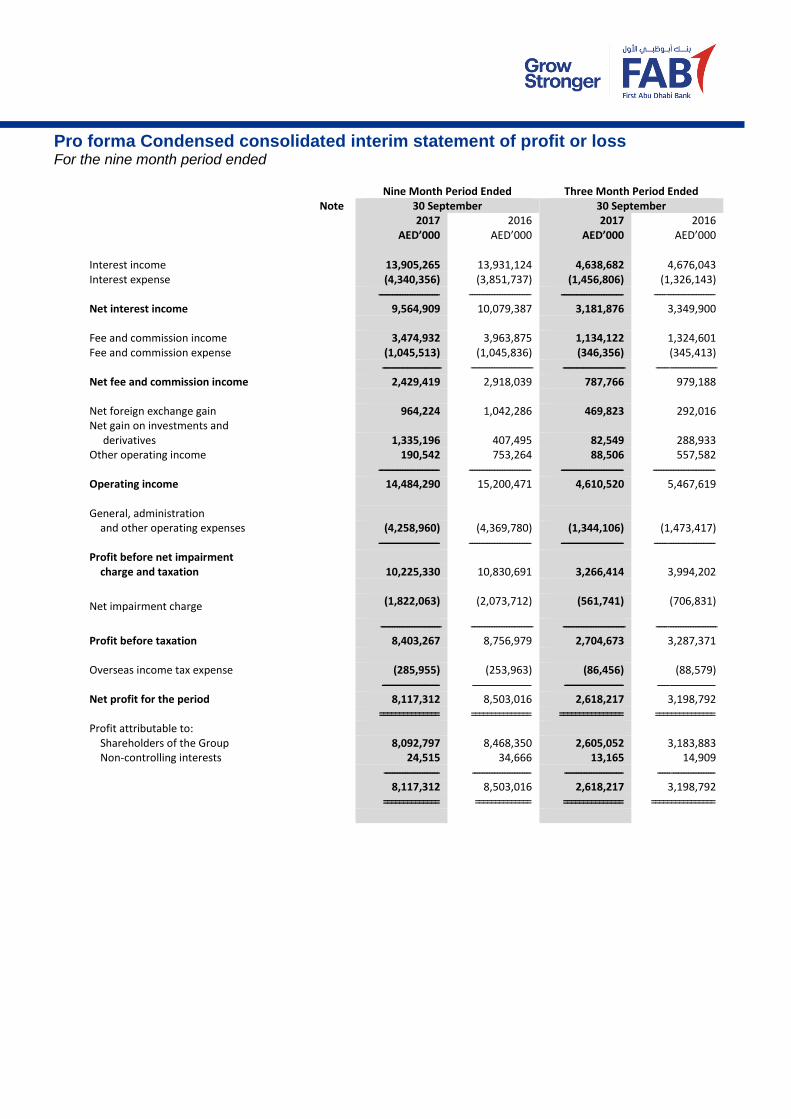
Pro forma Condensed consolidated interim statement of profit or loss For the nine month period ended
Nine Month Period Ended Three Month Period Ended Note 30 September 30 September
2017
AED’000 2016
AED’000 2017
AED’000 2016
AED’000
Interest income 13,905,265 13,931,124 4,638,682 4,676,043 Interest expense (4,340,356) (3,851,737) (1,456,806) (1,326,143)
------------------------------------ ------------------------------------- ------------------------------------- ------- ----------------------------- Net interest income 9,564,909 10,079,387 3,181,876 3,349,900 Fee and commission income 3,474,932 3,963,875 1,134,122 1,324,601 Fee and commission expense (1,045,513) (1,045,836) (346,356) (345,413) ----------------------------------- ------------------------------------- ------------------------------------- -------- ---------------------------- Net fee and commission income 2,429,419 2,918,039 787,766 979,188 Net foreign exchange gain 964,224 1,042,286 469,823 292,016 Net gain on investments and derivatives 1,335,196 407,495 82,549 288,933 Other operating income 190,542 753,264 88,506 557,582 ------------------------------------ ------------------------------------- ------------------------------------- ------------------------------------- Operating income 14,484,290 15,200,471 4,610,520 5,467,619 General, administration and other operating expenses (4,258,960) (4,369,780) (1,344,106) (1,473,417) ------------------------------------ ------------------------------------- ------------------------------------- -------- ---------------------------- Profit before net impairment charge and taxation 10,225,330 10,830,691 3,266,414 3,994,202
Net impairment charge (1,822,063) (2,073,712) (561,741) (706,831)
------------------------------------ ------------------------------------- ------------------------------------- ------- ----------------------------- Profit before taxation 8,403,267 8,756,979 2,704,673 3,287,371 Overseas income tax expense (285,955) (253,963) (86,456) (88,579) ---------------------------------- ----------------------------------- ----------------------------------- ------- --------------------------- Net profit for the period 8,117,312 8,503,016 2,618,217 3,198,792 =============== =============== ================ =============== Profit attributable to: Shareholders of the Group 8,092,797 8,468,350 2,605,052 3,183,883 Non-controlling interests 24,515 34,666 13,165 14,909 --------------------------------- ----------------------------------- ----------------------------------- -------- -------------------------- 8,117,312 8,503,016 2,618,217 3,198,792 ============== ============== =============== ================
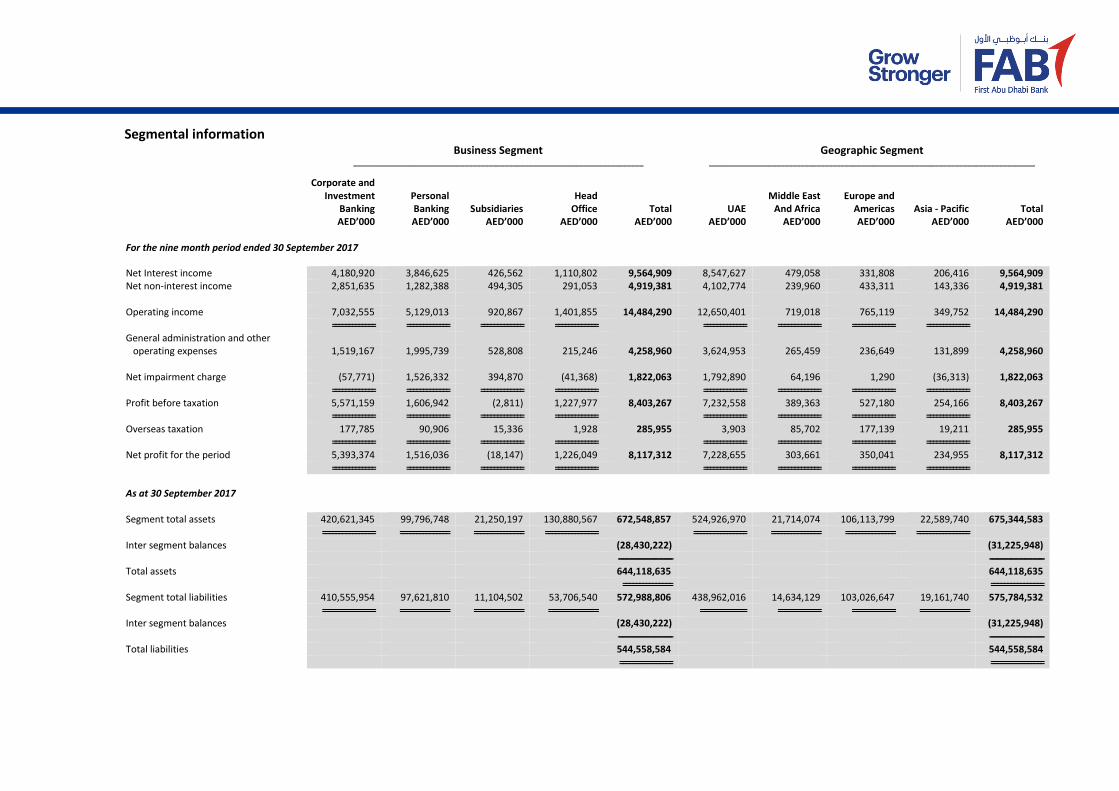
Segmental information Business Segment Geographic Segment _________________________________________________________________________ __________________________________________________________________________________
Corporate and Investment Personal Head Middle East Europe and Banking Banking Subsidiaries Office Total UAE And Africa Americas Asia - Pacific Total AED’000 AED’000 AED’000 AED’000 AED’000 AED’000 AED’000 AED’000 AED’000 AED’000 For the nine month period ended 30 September 2017
Net Interest income 4,180,920 3,846,625 426,562 1,110,802 9,564,909 8,547,627 479,058 331,808 206,416 9,564,909 Net non-interest income 2,851,635 1,282,388 494,305 291,053 4,919,381 4,102,774 239,960 433,311 143,336 4,919,381 Operating income 7,032,555 5,129,013 920,867 1,401,855 14,484,290 12,650,401 719,018 765,119 349,752 14,484,290 ============= ============= ============= ============= ============= ============= ============= ============= General administration and other operating expenses 1,519,167 1,995,739 528,808 215,246 4,258,960 3,624,953 265,459 236,649 131,899 4,258,960 Net impairment charge (57,771) 1,526,332 394,870 (41,368) 1,822,063 1,792,890 64,196 1,290 (36,313) 1,822,063 ============= ============= ============= ============= ============= ============= ============= ============= Profit before taxation 5,571,159 1,606,942 (2,811) 1,227,977 8,403,267 7,232,558 389,363 527,180 254,166 8,403,267 ============= ============= ============= ============= ============= ============= ============= ============= Overseas taxation 177,785 90,906 15,336 1,928 285,955 3,903 85,702 177,139 19,211 285,955 ============= ============= ============= ============= ============= ============= ============= ============= Net profit for the period 5,393,374 1,516,036 (18,147) 1,226,049 8,117,312 7,228,655 303,661 350,041 234,955 8,117,312 ============= ============= ============= ============= ============= ============= ============= =============
As at 30 September 2017 Segment total assets 420,621,345 99,796,748 21,250,197 130,880,567 672,548,857 524,926,970 21,714,074 106,113,799 22,589,740 675,344,583 ================ =============== =============== ================ ================ =============== =============== ================ Inter segment balances (28,430,222) (31,225,948) ------------------------------------------- ------------------------------------------- Total assets 644,118,635 644,118,635
=============== ================ Segment total liabilities 410,555,954 97,621,810 11,104,502 53,706,540 572,988,806 438,962,016 14,634,129 103,026,647 19,161,740 575,784,532 ================ =============== =============== =============== ============== ============= ============= =============== Inter segment balances (28,430,222) (31,225,948) ------------------------------------------- ------------------------------------------- Total liabilities 544,558,584 544,558,584 ================ ================
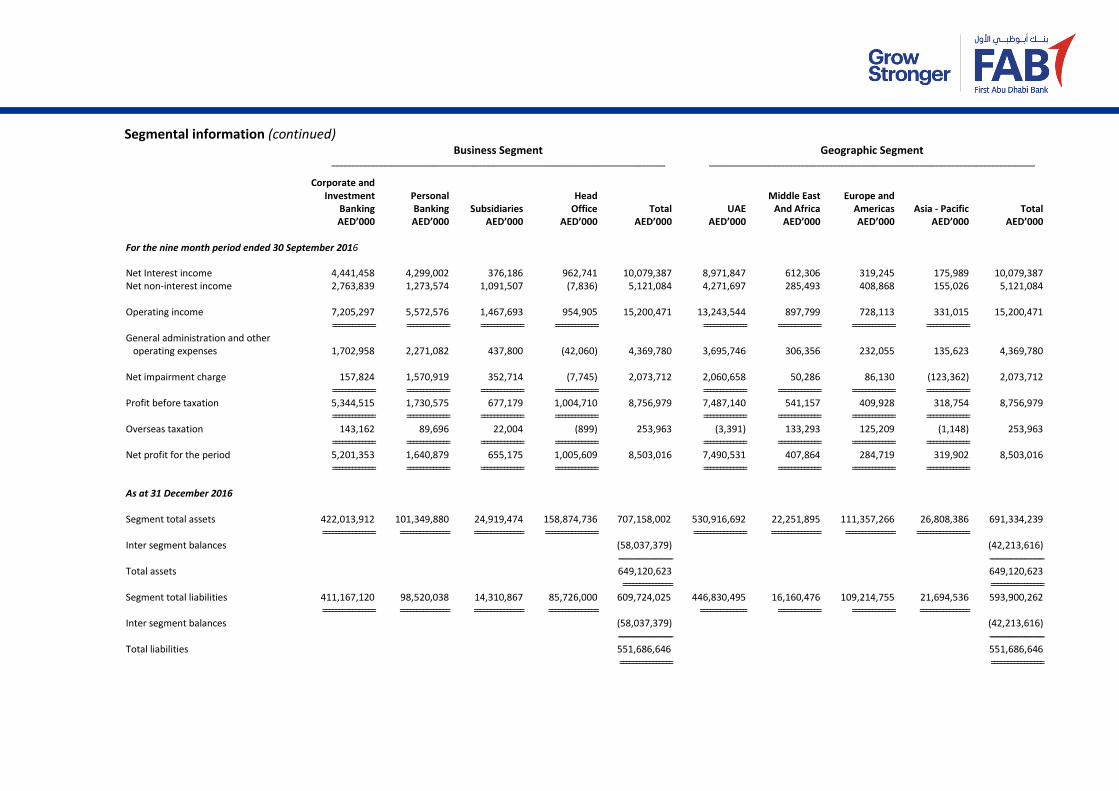
Segmental information (continued)
Business Segment Geographic Segment ____________________________________________________________________________________ __________________________________________________________________________________
Corporate and Investment Personal Head Middle East Europe and Banking Banking Subsidiaries Office Total UAE And Africa Americas Asia - Pacific Total AED’000 AED’000 AED’000 AED’000 AED’000 AED’000 AED’000 AED’000 AED’000 AED’000 For the nine month period ended 30 September 2016
Net Interest income 4,441,458 4,299,002 376,186 962,741 10,079,387 8,971,847 612,306 319,245 175,989 10,079,387 Net non-interest income 2,763,839 1,273,574 1,091,507 (7,836) 5,121,084 4,271,697 285,493 408,868 155,026 5,121,084 Operating income 7,205,297 5,572,576 1,467,693 954,905 15,200,471 13,243,544 897,799 728,113 331,015 15,200,471 ============= ============= ============= ============= ============= ============= ============= ============= General administration and other operating expenses 1,702,958 2,271,082 437,800 (42,060) 4,369,780 3,695,746 306,356 232,055 135,623 4,369,780 Net impairment charge 157,824 1,570,919 352,714 (7,745) 2,073,712 2,060,658 50,286 86,130 (123,362) 2,073,712 ============= ============= ============= ============= ============= ============= ============= ============= Profit before taxation 5,344,515 1,730,575 677,179 1,004,710 8,756,979 7,487,140 541,157 409,928 318,754 8,756,979 ============= ============= ============= ============= ============= ============= ============= ============= Overseas taxation 143,162 89,696 22,004 (899) 253,963 (3,391) 133,293 125,209 (1,148) 253,963 ============= ============= ============= ============= ============= ============= ============= ============= Net profit for the period 5,201,353 1,640,879 655,175 1,005,609 8,503,016 7,490,531 407,864 284,719 319,902 8,503,016 ============= ============= ============= ============= ============= ============= ============= =============
As at 31 December 2016 Segment total assets 422,013,912 101,349,880 24,919,474 158,874,736 707,158,002 530,916,692 22,251,895 111,357,266 26,808,386 691,334,239 ================ =============== =============== ================ ================ =============== =============== ================ Inter segment balances (58,037,379) (42,213,616) ------------------------------------------- ------------------------------------------- Total assets 649,120,623 649,120,623
=============== ================ Segment total liabilities 411,167,120 98,520,038 14,310,867 85,726,000 609,724,025 446,830,495 16,160,476 109,214,755 21,694,536 593,900,262 ================ =============== =============== =============== ============== ============= ============= =============== Inter segment balances (58,037,379) (42,213,616) ------------------------------------------- ------------------------------------------- Total liabilities 551,686,646 551,686,646 ================ ================