fabric quality optimization by using desirability function ... · fabric quality optimization by...
TRANSCRIPT

Fabric Quality Optimization by Using Desirability Function and
Neural Networks
Hajer Souid
Textile Research Unit of ISET of Ksar-Hellal, B.P 68, Avenue Hadj Ali SOUA, 5070
Ksar Hellal, Tunisia
E-mail: [email protected]
Amel Babay
Textile Research Unit of ISET of Ksar-Hellal, B.P 68, Avenue Hadj Ali SOUA, 5070
Ksar Hellal, Tunisia
E-mail: [email protected]
Mehdi Sahnoun
Textile Research Unit of ISET of Ksar-Hellal, B.P 68, Avenue Hadj Ali SOUA, 5070
Ksar Hellal, Tunisia
E-mail: [email protected]
Abstract
The present paper presents a new method to
estimate objective reflection of Denim fabric
quality by using desirability function and neural
networks. The global fabric quality was defined
through one index belonging to the closed interval
[0, 1]. For this reason, we have created a first
algorithm that is modified when the definition of
fabric quality is changed. This prediction would
allow fabric producer to estimate customer’s
quality satisfaction level. The present approach
has conferred a good evaluation and prediction of
the all-encompassing denim fabric quality. In the
second stage of the study, we developed a model to
predict global fabric quality from fiber, yarn,
weaving parameters and finishing characteristics
by using neural networks. The neural network
model is accomplished by using a second
algorithm based on back-propagation concept.
The results have shown that the neuronal networks
could predict global fabric quality of the untrained
fabrics with better precision.
Keywords: Fabric; quality; desirability
function; optimization, yarn, neural networks
1. Introduction
Fabric quality has been in consideration for
many years. Seeking for it needs a satisfaction of
several properties at the same time [1]. It is now
an accepted principle that „satisfying the
customer‟ in all respects is in practice the
meaning of quality [2]. Many theoretical and
experimental investigations [3; 4; 5; 6; 7; 8] over
many decades have been focused on fabric
quality and performance but combining many
properties into one objective notion still reveal
hard to define. In this survey, our objective is to
quantify the overall quality of denim fabric by an
amalgam of eight fabric parameters which include
warp and weft breaking strength, warp and weft
tear strength, warp and weft elongations,
stiffness, and weight. Our implementation relies
on the formulation of desirability functions.
The present approach is an important useful
method. It represents a statistical tool that
translates product quality from a set of multiple
subjective concepts into one single objective
notion. The concept of desirability was first
introduced by Harrington in 1965 [9] and was
developed by Derringer and Suich [10]. The
method finds operating conditions that
simultaneously provide the "most desirable" value
of each fabric response.
This study places customer exigency as the
main goal to reach. In our work, in conjunction
with desirability approach, we have exploited the
tools furnished with neural networks to improve
fabric quality modeling. Neural networks
constitute learning systems for modeling and
optimization that have been increasingly applied
to textile problems during the last 30 years [11]. It
Hajer souid et al ,Int.J.Computer Technology & Applications,Vol 3 (1), 356-364
IJCTA | JAN-FEB 2012 Available [email protected]
356
ISSN:2229-6093

is well known that, neural nets are useful tools for
functional prediction and system modeling where
the physical processes are not understood or are
highly complex. This is generally the case of
fabric quality definition and estimation. Hence,
by combining these tools, we have tried to
evaluate the overall quality of fabrics. A large
data base and a model to predict global fabric
quality from fiber, yarn, weaving parameters and
finishing characteristics were then developed.
2. Materials and methods
An experimental data base of 1180 denim
fabric samples has been elaborated in a Tunisian
integrated factory specialized in producing
finished denim fabric.
Table 1: Summary of statistics for fabric properties
Manufacturing process includes all stages
from yarn to finished fabric. The studied fabric is
100% cotton twill. The characteristics of studied
fabrics and their corresponding test methods are
shown in Table 1. Each sample of the database is
tested 20 times for each property. The difference
between the minimum and maximum value of
each response refers to the variety of fabrics
produced in the factory where we accomplished
the work. The experimental set-up related to yarn
characteristics and resulting fibre-to-yarn
database used for this optimization were
evaluated according to international standards
using Uster tensiorapid 3 and Uster tester 3.
The warp yarn is a ring spun yarn and the weft
yarn is whether an Open-End or a Ring spun yarn.
The data base includes the following yarns types
(Table 2).
Table 2: Fabric yarns types
Warp Weft
Yarn counts
(Nm)
12.5 RS* and 15 RS
10 OE**; 12.5 OE ; 15 OE ; 17 OE; 20 RS;
* RS: Ring Spun yarn; ** OE: Open-End Spun
yarn
The warp and weft properties are respectively
described in Table 3 and Table 4.
Table 3: Warp yarn properties
Yarn property Symbol Instrument Mean Standard deviation
Minimum value
Maximum value
Tenacity (cN/ Tex) RKM Uster tensiorapid 3 17,76 0,21 15,92 18,14
Tenacity evenness (%)
CVRKM Uster tensiorapid 3 6,85 3,17 4,54 7,96
Breaking elongation
(%) E% Uster tensiorapid 3 7,87 0,11 7,28 8,24
Breaking work
(Joule) TR Uster tensiorapid 3 2,83 0,85 1,27 6,58
Regularity (%) U% Uster tester 3 13,23 1,24 10,89 17,33
Number of Thick
places THIK Uster tester 3 350,85 7,24 123,65 463,53
Number of Thin places
THIN Uster tester 3 2,17 1,49 0,54 11,27
Fabric property Test method Mean value
Standard deviation
Minimum value
Maximum value
Warp Breaking strength (kg)
ASTM D5034-90 95,60 7,69 42 128
Weft Breaking
strength (kg) ASTM D5034-90 66,08 8,11 36 94
Warp elongation (%) ASTM D5034-90 44,23 5,28 24,50 63
Weft elongation (%) ASTM D5034-90 29,24 3,50 21 74
Stiffness (kg) ASTM D4032-94 1,38 0,80 0,10 5,80
Warp Tear strength
(10-3
Kg) ASTM D1424-96 7261 8,37 2000 9734
Weft Tear strength (10
-3Kg )
ASTM D1424-96 5775 7,92 3232 8934
Weight (10-3
Kg /m2) LS&C° Method21 416 10 260 480
Hajer souid et al ,Int.J.Computer Technology & Applications,Vol 3 (1), 356-364
IJCTA | JAN-FEB 2012 Available [email protected]
357
ISSN:2229-6093

Number of Neps BOUT Uster tester 3 21,12 3,60 16,01 44,66
Hairiness PILO Uster tester 3 9,14 0,16 7,65 9,33
Twist (turns/m) TWIST Twistmeter 486 13,79 478 624
Table 4: Weft yarn properties
Yarn property Symbol Instrument Mean Standard
deviation
Minimum
value
Maximum
value
Tenacity (cN/ Tex) RKM Uster tensiorapid 3 15,26 1,91 13,17 19,46
Tenacity evenness
(%) CVRKM Uster tensiorapid 3 8,22 2,06 4,61 12,00
Breaking elongation
(%) E% Uster tensiorapid 3 7,96 0,59 7,26 9,40
Breaking work (Joule)
TR Uster tensiorapid 3 2,30 0,67 1,56 5,20
Regularity (%) U% Uster tester 3 12,16 1,48 9,84 15,37
Number of Thick places
THIK Uster tester 3 59 13,26 23,75 195,49
Number of Thin
places THIN Uster tester 3 3,52 3,66 0,17 15,67
Number of Neps BOUT Uster tester 3 12,85 8,31 0,75 57,67
Hairiness PILO Uster tester 3 7,30 0,73 6,69 9,10
Twist (turns/m) Twist Twistmeter 518 8,99 417 624
To optimize yarn and fabric qualities with
desirability approach, we have followed these
steps:
First, we defined an individual desirability
function for each yarn and fabric responses. We
used Derringer and Suich (1980) individual
desirability function (id ) using the provided
goals and boundaries for each response. The
goal of each response can be one of the three
following choices:
1/ Targeting a response: In this case, the
individual desirability function is assigned as
follow:
iLSTiYoriLITiYif
iiYif
iLSTiYiif
q
iLSTi
iLSTiY
iiYiLITif
p
iLITi
iLITiY
id
0
1
(1)
Where:
iY = predicted value of ith
response
i = target value for ith response
iLIT = lowest acceptable value for ith response
iLST = highest acceptable value for ith response
With p and q determining how important it is
to fit the target value. The exponents of
desirability function of ith response are two
requirement levels to make less or more
importance to the response when it is lower or
higher than the target. In fact, the customer can
be more rigorous when the response is lower
than the target. The shape of the desirability
function between the lower limit (respectively
upper limit) and the target is determined by the
choice of weight.
For 1 qp , the desirability function
increases linearly towards target i (Figure 1);
for p < 1, q < 1, the function is convex, and for
p > 1, q > 1, the function is concave.
Figure 1: Function of desirability to reach a
target value.
In this study, we took 1p and 1q which
means that we have the same requirement if it is
under or upper the target.
2/ Minimizing a response: For this case, the
corresponding individual desirability is as
defined in Equation 2.
p>1 q>1
p<1 q<1
1
0
id
iY iLIT
iLST
ietT arg
p=1 q=1
Hajer souid et al ,Int.J.Computer Technology & Applications,Vol 3 (1), 356-364
IJCTA | JAN-FEB 2012 Available [email protected]
358
ISSN:2229-6093
iLSTiYif
iiYiLITif
p
iLITi
iLITiY
iLITiYif
id
1
0
iLSTiYif
iLSTiYiif
q
iLSTi
iLSTiY
iLITiYif
id
0
1
(2)
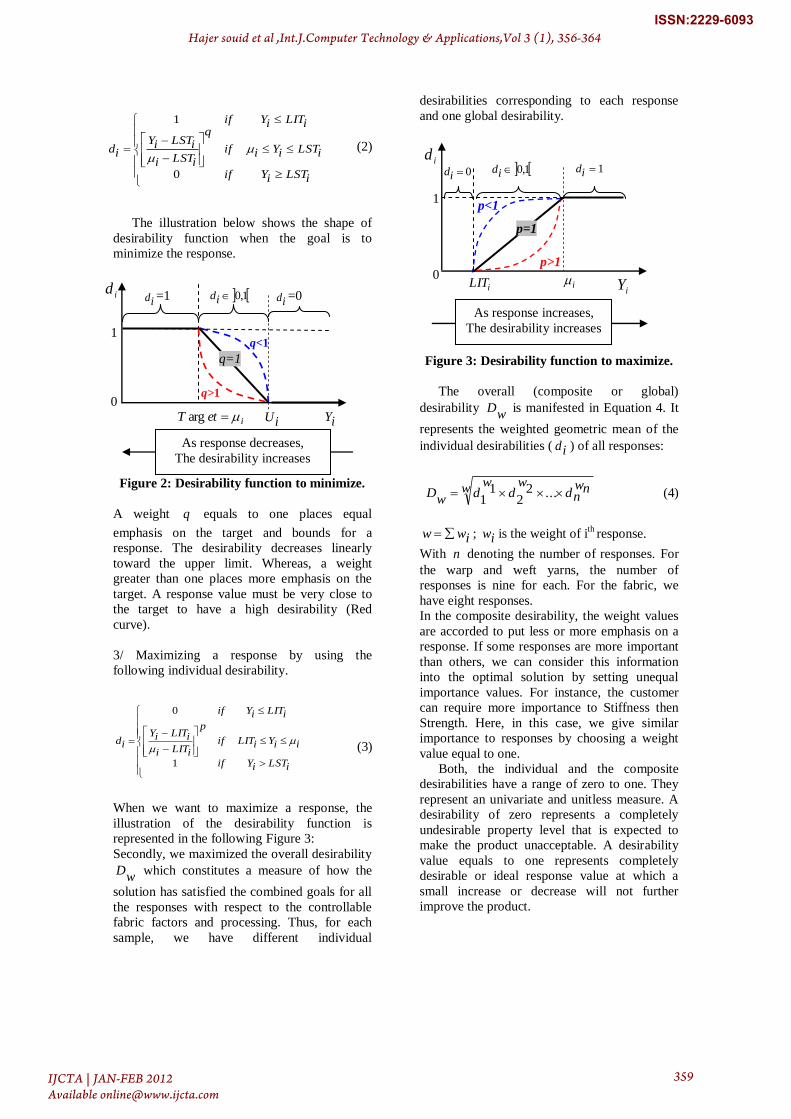
The illustration below shows the shape of
desirability function when the goal is to
minimize the response.
Figure 2: Desirability function to minimize.
A weight q equals to one places equal
emphasis on the target and bounds for a
response. The desirability decreases linearly
toward the upper limit. Whereas, a weight
greater than one places more emphasis on the
target. A response value must be very close to
the target to have a high desirability (Red
curve).
3/ Maximizing a response by using the
following individual desirability.
(3)
When we want to maximize a response, the
illustration of the desirability function is
represented in the following Figure 3:
Secondly, we maximized the overall desirability
wD which constitutes a measure of how the
solution has satisfied the combined goals for all
the responses with respect to the controllable
fabric factors and processing. Thus, for each
sample, we have different individual
desirabilities corresponding to each response
and one global desirability.
Figure 3: Desirability function to maximize.
The overall (composite or global)
desirability w
D is manifested in Equation 4. It
represents the weighted geometric mean of the
individual desirabilities ( id ) of all responses:
w nwnd
wd
wd
wD ...2
21
1 (4)
iww ; iw is the weight of ith
response.
With n denoting the number of responses. For
the warp and weft yarns, the number of
responses is nine for each. For the fabric, we
have eight responses.
In the composite desirability, the weight values
are accorded to put less or more emphasis on a
response. If some responses are more important
than others, we can consider this information
into the optimal solution by setting unequal
importance values. For instance, the customer
can require more importance to Stiffness then
Strength. Here, in this case, we give similar
importance to responses by choosing a weight
value equal to one.
Both, the individual and the composite
desirabilities have a range of zero to one. They
represent an univariate and unitless measure. A
desirability of zero represents a completely
undesirable property level that is expected to
make the product unacceptable. A desirability
value equals to one represents completely
desirable or ideal response value at which a
small increase or decrease will not further
improve the product.
iU iY
q>1
ietT arg
q<1 1
0
id
As response decreases,
The desirability increases
id =1 id =0 1,0id
q=1
p>1
id
1
0 iLIT iY i
p<1
p=1
As response increases,
The desirability increases
0id 1,0id 1id
Hajer souid et al ,Int.J.Computer Technology & Applications,Vol 3 (1), 356-364
IJCTA | JAN-FEB 2012 Available [email protected]
359
ISSN:2229-6093

Table 5: Warp yarn responses optimization
Table 6: Weft yarn responses optimization
Responses Symbol Objectives Lower limit Target Upper limit
Tenacity (cN/ Tex) RKM Maximize 13,17 15,26 -
Tenacity evenness (%) CVRKM Minimize - 8,22 12,00
Breaking work (Joule) TR Maximize 1,56 2,30 -
Hairiness (cm of fibers/ cm of yarn) PILO Minimize - 7,30 9,10
Breaking elongation (%) E% Minimize - 7,96 9,40
Regularity (%) U% Maximize 9,84 13,16 -
Number of Thick places THIK Minimize - 59 195,49
Number of Thin places THIN Minimize - 3,52 15,67
Number of Neps BOUT Minimize - 12,85 57,67
3. Results and discussion
3.1. Optimizing warp and weft yarns
qualities with desirability approach
The Optimization of the global desirability
D was carried out by using Excel combined
with visual basic software. We set the weft and
warp yarns quality definition respectively in
Table 5 and Table 6.
The factors settings that maximize the yarn
and fabric quality can be obviously modified
according to customer demands. As mentioned
in Equation 2 and Equation 3, when we want to
minimize or maximize a response, we don‟t
need to mention in the algorithm initialization,
the lower limit and the upper limit respectively.
This is represented in Tables 5, 6 and 7 by „-„.
For all yarn samples of the data base, we have
calculated warp and weft individual
desirabilities, corresponding to the responses
objectives mentioned in Tables 5 and 6.
3.2. Optimizing fabric quality with
desirability approach In order to optimize fabric responses, first
we have to mention the objective of each fabric
response and the corresponding ranges.
Generally, the desired objectives of each
response of the fabric depend on customers
necessities.
Also, there is no norm that specifies the
general optimal objectives to reach for a fabric.
In this paper, we have defined fabric quality as
described in Table 7. The algorithm made can
be flexible for other customer objectives and
boundaries.
The steps followed during the program
developing to determine weft and warp yarns
and fabric qualities are described as follow:
- Initialization of warp, weft and fabric weights
( p , q , iw )
- Initialization of warp, weft and fabric
responses:
Targets
Upper limits
Lower limits
- Calculating warp, weft and fabric responses
individual desirabilities
- Calculating warp, weft and fabric global
quality
Responses Symbol Objective Lower limit Target Upper limit
Tenacity (cN/ Tex) RKM Maximize 15,92 17,76 -
Tenacity evenness (%) CVRKM Minimize - 6,85 7,96
Breaking work (Joule) TR Maximize 1,27 2,83 -
Hairiness (cm of fibers/ cm of yarn) PILO Minimize - 9,14 9,33
Breaking elongation (%) E% Minimize - 7,87 8,24
Regularity (%) U% Maximize 10,89 13,23 -
Number of Thick places THIK Minimize - 350,85 463,53
Number of Thin places THIN Minimize - 2,17 11,27
Number of Neps BOUT Minimize - 21,12 44,66
Hajer souid et al ,Int.J.Computer Technology & Applications,Vol 3 (1), 356-364
IJCTA | JAN-FEB 2012 Available [email protected]
360
ISSN:2229-6093

Table 7: Response optimization of the fabric
Fabric properties Objectives Lower limit Target Upper limit
Warp Breaking strength (kg) Maximize 42 95,60 -
Weft Breaking strength (kg) Maximize 36 66,08 -
Warp elongation (%) Minimize - 44,23 63
Weft elongation (%) Minimize - 29,24 74
Stiffness (kg) Target 0,10 1,38 5,80
Warp Tear strength (10-3
kg) Maximize 2000 7261 -
Weft Tear strength (10-3
kg) Maximize 3232 5775 -
Weight (10-3
kg /m2) Minimize - 416 480
The fabric quality definition previously
mentioned in Table 7 implicated 1180 different
global desirabilities values. The best fabric
global quality has reached 0,95. The
corresponding individual desirability and
predicted value of each response of the fabric
are shown in Table 8.
Table 8: Fabric global desirability
Fabric Response Predicted
Responses
Individual
desirability
Warp Breaking
strength (kg) 89 0,88
Weft Breaking strength (kg)
58
0,73
Warp elongation (%) 44,40 0,99
Weft elongation (%) 29,80 0,99
Stiffness (kg) 1,30 0,94
Warp Tear strength
(10-3
kg) 7104 0,97
Weft tear strength
(10-3
kg) 5184 0,77
Weight ((10-3
kg)/m2) 395 1,00
The overall fabric quality is of 0.95.
According to Harrington standards [9], the
global desirability belongs to the interval [0.8,
1]. According to this scale, the result is
considered to be acceptable and excellent. It
represents an unusual quality or performance
well beyond anything commercially available
[9].
3.3. Prevision of Denim fabric global
quality with Neural Networks In order to predict fabric overall quality
through warp and weft qualities, we applied the
neural networks approach. This tool uses the
optional test data when training for a better
performance of the model [12]. We developed
for this goal a muti-layer perceptron neural
network of one hidden layer. The developed
algorithm is based on the back-propagation
system. The network should have one output
neuron since there is one target to reach. The
output parameter expresses fabric global quality
by D value which includes the physical
parameters described in Table 1.
For the database inputs, we used different
spinning production parameters, which are
related to yarn, ends and picks counts and
finishing (Table 9). All the input variables are
continuous except the finishing. The different
levels of this discreet variable are introduced in
the model as follows:
1= Mercerization
2= Mercerizing then the application of acrylic
resin
3= Pigments dyeing applied by using foaming
process including Gaston system
Table 9: Input and output parameters of the
neural network model
Inputs Symbol Output
Finishing Finishing
Fabric global
quality
D
Yarn properties
Warp
yarn global
quality
GD Warp
Weft yarn
global quality
GD Weft
Warp
yarn
count
Nm warp
Weft yarn count
Nm weft
Construction
parameter
Ends
count Cpte Ch f
Picks
count Cpte Tr f
As the input vector is composed of seven
parameters, the network is set up with an input
layer of seven nodes. The activation function of
the hidden layer is the tangent sigmoid transfer
function. The output is calculated according to
Equation 5:
Hajer souid et al ,Int.J.Computer Technology & Applications,Vol 3 (1), 356-364
IJCTA | JAN-FEB 2012 Available [email protected]
361
ISSN:2229-6093

1)2exp(1
2)(
xxG (5)
The transfer function of the output layer is
the log sigmoid function. The neural network is
trained by adjusting the connections (weights)
between the nodes by using the Newton
function which has the advantage to provide
faster optimization. We calculated the sum of
the squared differences between the target and
actual output values on the output global
desirability which constitutes error. A value of
error close to zero indicates a better fit. Two
error values were then considered:
trainRMSE : The mean square root error
generated by the training data in Equation 6
[12].
21
1
2),((
N
Nwixgiy
trainRMSE (6)
N : Number which represents 80% of database.
iy : Yarn quality index calculated from the
training database corresponding to the input ix .
),( wixg : Yarn quality index calculated by the
neural network corresponding to the input ix for
a weight value w .
),( wixgiy : The individual error
testRMSE : The mean square root error
generated by the test data in Equation 7:
21
1
2),((
P
Pwixgiy
testRMSE (7)
P : Number of test data places = 236 = 20% of
input-output data pairs were used as the test set.
The second parameter conferring the
reliability of the model is the correlation
coefficient ( R value), obtained by calculating
the regression coefficient of the measured
values with estimated values. When the model
is reliable, this coefficient has to be close to one.
In the experiment, we have selected 80% of
the data base for training and the rest for testing.
The repartition of the ideal proportion between
the test/train examples is until now unknown,
but the proportion of 20/80 is generally
considered as the most convenient [12].
0,00
0,01
0,02
0,03
0,04
0,05
0,06
3 4 5 6 7 8 9
Number of neurons in the hidden layer
RM
SE
trai
n
0,00
0,05
0,10
0,15
0,20
3 4 5 6 7 8 9
Number of neurons in the hidden layer
RM
SE
test
Figure 4: Time series plot of trainRMSE (a),
testRMSE (b) versus the number of hidden
nodes.
0,00
0,20
0,40
0,60
0,80
1,00
3 4 5 6 7 8 9
Number of neurons in the hidden layer
R%
Figure 5: Time series plot of correlation
coefficient R against the number of hidden
nodes.
We have tried the back-propagation neural
net with one hidden layer and different hidden
nodes and epochs. We remarked that out of
seven neurons in the hidden layer, the difference
between training and test error(s) increases
which risks having an overfitting (Figure 5).
Besides, the correlation coefficient is the highest
for seven neurons in the hidden layer. Having a
correlation coefficient near to 1 with small and
comparable errors test and train, contributes to a
good performance of the network. Hence, the
appropriate number of hidden layer inducing the
best performance of the neural network is of
seven.
(a)
(b)
Hajer souid et al ,Int.J.Computer Technology & Applications,Vol 3 (1), 356-364
IJCTA | JAN-FEB 2012 Available [email protected]
362
ISSN:2229-6093

Figure 6: Learning curve of the artificial
neural network model.
As shown in the learning curve in Figure 6,
the right number of epochs reached is 300. The
scattering diagram of the model, represented in
Figure 7, illustrates the network outputs (A)
plotted versus the targets (T) as open circles.
The perfect fit is indicated by the dashed line.
The perfect fit line corresponds to an output
equals to targets (A=T) which constitutes the
bisector. Therefore, for this line, the slope
would be 1, and intercept the axes in zero. The
scattering around the bisector gives an idea of
the quality of the modeling. The prediction is
perfect when all points are aligned on this line.
Here, the fit seems to be good since most places
are aligned on the bisector.
The linear fit calculated by the model has
contributed to the following Equation 8:
0375.005.1 TA (8)
The Equation 9 is represented in the Figure 8
by the solid line. It constitutes the best fit line
generated by the model. As shown, the best fit
line (solid line) is very close to the perfect fit
line (dashed line).
Figure 7: Relationship between actual and
predicted values of the fabric quality index.
4. Conclusion The purpose of this study was to develop a
composite quality index which will closely
depict the perception of the suitable denim
fabric quality as preferred by consumers. As
fabric quality is a multi-criteria phenomenon
that requires the satisfaction of several
properties at the same time, we used a new
adaptive method permitting the combination of
all properties (or quality criteria) in order to
reach optimal denim fabric global quality. The
definition of the overall denim quality can be set
according to production quality criterions
depending on customer requirements. Our
computation has also enabled to find the global
yarn properties and fabric properties that have
lead to reach the highest global desirability. The
global fabric definition can be set according to
each customer requirements by varying the
target, the weight and the tolerance interval of
each property. Other important fabric
parameters related to fabric handle and aspect
can also be included to give more reliable
significance to quality concept.
Our study has demonstrated that the
applications of desirability functions with neural
network can be good tools for assessing more
rigorous fabric quality. The present methods
have been studied for Denim fabric and for
some fabric properties, but it can be generalized
for non Denim fabric while including other
customer requirements simultaneously.
5. References [1] Winchester S.C., “Total Quality Management in
Textiles”, Journal of Textile Institute, 85, No. 4, 445-459; 1994
[2] Roach A.R., “Meeting Customer Needs for
Textiles and Clothing”, Journal of Textile Institute,
85, No. 4, 485-495; 1994 [3] Realff M. L., Boyce M.C. and Backer S., „‟A
micromechanical model of the tensile behavior of
woven fabric‟‟. Textile Research Journal, vol. 67,
445–459; 1997 [4] Fun J., Hunter L., “An artificial neural network
model for predicting the properties of worsted
fabrics”, Textile Research Journal, 68 (10): 763-771;
1998
[5] Taibi E. H., Hammouche A., Kifani A., “Model of
the tensile stress strain behaviour of fabrics”, Textile
Research Journal, 71 (7) 582-586; 2001
[6] Sun F., Seyam A.M., Gupta B. S., “A generalized model for predicting Load- extension properties of
woven fabrics”, Textile Research Journal, 67 (12):
866-874; 1997
[7] Borzone P., Carosio S., and Durante A. “Detecting fabric defects with a neural network using
two kind of optical patterns”, Textile Research
Journal, 72(6), 545-550; 2002
Hajer souid et al ,Int.J.Computer Technology & Applications,Vol 3 (1), 356-364
IJCTA | JAN-FEB 2012 Available [email protected]
363
ISSN:2229-6093

[8] Fan J., Newton E., et Au R. “Predicting garment
drape with a fussy neural network”, Textile Research
Journal July 2001; 71(7), 605-608; 2001
[9] Harrington EC.,”The desirability function”, Industrial Quality Control; (April):494–498. 1965
[10] Derringer GC, Suich R. “Simultaneous
optimization of several response variables”, Journal
of Quality Technology; 12(4):214–219; 1980 [11] Sette S. and Van Langenhove L. “An overview
of soft computing”, Department of textiles, Ghent
University, 9052 Zwijnaarde, Belgium In textiles 94
part 1 Journal of Textile Institute 2003. [12] Dreyfus G., Martinez M., Samuelides M., M.B.
Gordan, F. Badran, S. Thiria, L. Hérault,. Réseaux de
Neurones: Méthodologie et Application, Editions
Eyrolles, Paris, vol. 1, pp. 4–52; 2002
Hajer souid et al ,Int.J.Computer Technology & Applications,Vol 3 (1), 356-364
IJCTA | JAN-FEB 2012 Available [email protected]
364
ISSN:2229-6093