facebook, inc. -...
TRANSCRIPT

UNITED STATES
SECURITIES AND EXCHANGE COMMISSIONWashington, D.C. 20549
__________________________FORM 10-K
__________________________(Mark One)x ANNUAL REPORT PURSUANT TO SECTION 13 OR 15(d) OF THE SECURITIES EXCHANGE ACT OF 1934
For the fiscal year ended December 31, 2017or
¨ TRANSITION REPORT PURSUANT TO SECTION 13 OR 15(d) OF THE SECURITIES EXCHANGE ACT OF 1934For the transition period from to
Commission File Number: 001-35551__________________________
FACEBOOK, INC.(Exact name of registrant as specified in its charter)
__________________________
Delaware 20-1665019(State or other jurisdiction of incorporation or organization) (I.R.S. Employer Identification Number)
1601 Willow Road, Menlo Park, California 94025(Address of principal executive offices and Zip Code)
(650) 543-4800(Registrant's telephone number, including area code)
__________________________Securities registered pursuant to Section 12(b) of the Act:
Class A Common Stock, $0.000006 par value The Nasdaq Stock Market LLC(Title of each class) (Name of each exchange on which registered)
Securities registered pursuant to Section 12(g) of the Act:None
(Title of class)Indicate by check mark if the registrant is a well-known seasoned issuer, as defined in Rule 405 of the Securities Act. Yes x No ¨Indicate by check mark if the registrant is not required to file reports pursuant to Section 13 or Section 15(d) of the Act. Yes ¨ No xIndicate by check mark whether the registrant (1) has filed all reports required to be filed by Section 13 or 15(d) of the Securities Exchange Act of 1934 (Exchange Act) duringthe preceding 12 months (or for such shorter period that the registrant was required to file such reports), and (2) has been subject to such filing requirements for the past90 days. Yes x No ¨Indicate by check mark whether the registrant has submitted electronically and posted on its corporate Website, if any, every Interactive Data File required to be submitted andposted pursuant to Rule 405 of Regulation S-T (§ 232.405 of this chapter) during the preceding 12 months (or for such shorter period that the registrant was required to submitand post such files). Yes x No ¨Indicate by check mark if disclosure of delinquent filers pursuant to Item 405 of Regulation S-K (§ 229.405 of this chapter) is not contained herein, and will not be contained, tothe best of registrant's knowledge, in definitive proxy or information statements incorporated by reference in Part III of this Form 10-K or any amendment to this Form 10-K. ¨Indicate by check mark whether the registrant is a large accelerated filer, an accelerated filer, a non-accelerated filer, a smaller reporting company, or an emerging growthcompany. See definition of "large accelerated filer," "accelerated filer," "smaller reporting company," and "emerging growth company" in Rule 12b-2 of the Exchange Act.(Check one):
Large accelerated filer x Accelerated filer¨
Non-accelerated filer ¨ (Do not check if a smaller reporting company) Smaller reporting company ¨
Emerging growth company¨
If an emerging growth company, indicate by check mark if the registrant has elected not to use the extended transition period for complying with any new or revised financialaccounting standards provided pursuant to Section 13(a) of the Exchange Act. ¨Indicate by check mark whether the registrant is a shell company (as defined in Rule 12b-2 of the Exchange Act). Yes ¨ No xThe aggregate market value of the voting and non-voting stock held by non-affiliates of the registrant as of June 30, 2017 , the last business day of the registrant's most recentlycompleted second fiscal quarter, was $372 billion based upon the closing price reported for such date on the Nasdaq Global Select Market.On January 29, 2018 , the registrant had 2,395,921,635 shares of Class A common stock and 509,079,123 shares of Class B common stock outstanding.
DOCUMENTS INCORPORATED BY REFERENCEPortions of the registrant's Proxy Statement for the 2018 Annual Meeting of Stockholders are incorporated herein by reference in Part III of this Annual Report on Form 10-K tothe extent stated herein. Such proxy statement will be filed with the Securities and Exchange Commission within 120 days of the registrant's fiscal year ended December 31,2017 .

FACEBOOK, INC.FORM 10-K
TABLE OF CONTENTS
Note About Forward-Looking Statements 3Limitations of Key Metrics and Other Data 4 PART I Item 1. Business 5
Item 1A. Risk Factors 8
Item 1B. Unresolved Staff Comments 29
Item 2. Properties 29
Item 3. Legal Proceedings 29
Item 4. Mine Safety Disclosures 29
PART II
Item 5. Market for Registrant's Common Equity, Related Stockholder Matters and Issuer Purchases of Equity Securities 30
Item 6. Selected Financial Data 32
Item 7. Management's Discussion and Analysis of Financial Condition and Results of Operations 34
Item 7A. Quantitative and Qualitative Disclosures About Market Risk 54
Item 8. Financial Statements and Supplementary Data 55
Item 9. Changes in and Disagreements with Accountants on Accounting and Financial Disclosure 83
Item 9A. Controls and Procedures 83
Item 9B. Other Information 83
PART III
Item 10. Directors, Executive Officers and Corporate Governance 84
Item 11. Executive Compensation 84
Item 12. Security Ownership of Certain Beneficial Owners and Management and Related Stockholder Matters 84
Item 13. Certain Relationships and Related Transactions, and Director Independence 84
Item 14. Principal Accounting Fees and Services 84
PART IV
Item 15. Exhibits, Financial Statement Schedules 85
Signatures

2
NOTE ABOUT FORWARD-LOOKING STATEMENTS
This Annual Report on Form 10-K contains forward-looking statements within the meaning of the Private Securities Litigation Reform Act of 1995. Allstatements contained in this Annual Report on Form 10-K other than statements of historical fact, including statements regarding our future results of operationsand financial position, our business strategy and plans, and our objectives for future operations, are forward-looking statements. The words "believe," "may,""will," "estimate," "continue," "anticipate," "intend," "expect," and similar expressions are intended to identify forward-looking statements. We have based theseforward-looking statements largely on our current expectations and projections about future events and trends that we believe may affect our financial condition,results of operations, business strategy, short-term and long-term business operations and objectives, and financial needs. These forward-looking statements aresubject to a number of risks, uncertainties and assumptions, including those described in Part I, Item 1A, "Risk Factors" in this Annual Report on Form 10-K.Moreover, we operate in a very competitive and rapidly changing environment. New risks emerge from time to time. It is not possible for our management topredict all risks, nor can we assess the impact of all factors on our business or the extent to which any factor, or combination of factors, may cause actual results todiffer materially from those contained in any forward-looking statements we may make. In light of these risks, uncertainties and assumptions, the future events andtrends discussed in this Annual Report on Form 10-K may not occur and actual results could differ materially and adversely from those anticipated or implied inthe forward-looking statements.
We undertake no obligation to revise or publicly release the results of any revision to these forward-looking statements, except as required by law. Giventhese risks and uncertainties, readers are cautioned not to place undue reliance on such forward-looking statements.
Unless expressly indicated or the context requires otherwise, the terms "Facebook," "company," "we," "us," and "our" in this document refer to Facebook,Inc., a Delaware corporation, and, where appropriate, its wholly owned subsidiaries. The term "Facebook" may also refer to our products, regardless of the mannerin which they are accessed. For references to accessing Facebook on the "web" or via a "website," such terms refer to accessing Facebook on personal computers.For references to accessing Facebook on "mobile," such term refers to accessing Facebook via a mobile application or via a mobile-optimized version of ourwebsite such as m.facebook.com, whether on a mobile phone or tablet.
3

LIMITATIONS OF KEY METRICS AND OTHER DATA
The numbers for our key metrics, which include our daily active users (DAUs), monthly active users (MAUs), and average revenue per user (ARPU), arecalculated using internal company data based on the activity of user accounts. While these numbers are based on what we believe to be reasonable estimates of ouruser base for the applicable period of measurement, there are inherent challenges in measuring usage of our products across large online and mobile populationsaround the world. In addition, we are continually seeking to improve our estimates of our user base, and such estimates may change due to improvements orchanges in our methodology.
We regularly evaluate these metrics to estimate the number of "duplicate" and "false" accounts among our MAUs. A duplicate account is one that a usermaintains in addition to his or her principal account. We divide "false" accounts into two categories: (1) user-misclassified accounts, where users have createdpersonal profiles for a business, organization, or non-human entity such as a pet (such entities are permitted on Facebook using a Page rather than a personal profileunder our terms of service); and (2) undesirable accounts, which represent user profiles that we determine are intended to be used for purposes that violate ourterms of service, such as spamming. The estimates of duplicate and false accounts are based on an internal review of a limited sample of accounts, and we applysignificant judgment in making this determination. For example, to identify duplicate accounts we use data signals such as similar IP addresses or user names, andto identify false accounts we look for names that appear to be fake or other behavior that appears inauthentic to the reviewers. Our estimates may change as ourmethodologies evolve, including through the application of new data signals or technologies, which may allow us to identify previously undetected duplicate orfalse accounts and may improve our ability to evaluate a broader population of our users. As such, our estimation of duplicate or false accounts may not accuratelyrepresent the actual number of such accounts. In particular, duplicate accounts are very difficult to measure at our scale, and it is possible that the actual number ofduplicate accounts may vary significantly from our estimates.
In the fourth quarter of 2017, we estimate that duplicate accounts may have represented approximately 10% of our worldwide MAUs. We believe thepercentage of duplicate accounts is meaningfully higher in developing markets such as India, Indonesia, and the Philippines, as compared to more developedmarkets. In the fourth quarter of 2017, we estimate that false accounts may have represented approximately 3-4% of our worldwide MAUs. Our estimation of falseaccounts can vary as a result of episodic spikes in the creation of such accounts, which we have seen originate more frequently in specific countries such asIndonesia, Turkey, and Vietnam. From time to time, we may make product changes or take other actions to reduce the number of duplicate or false accounts amongour users, which may also reduce our DAU and MAU estimates in a particular period.
Our data limitations may affect our understanding of certain details of our business. For example, while user-provided data indicates a decline in usageamong younger users, this age data is unreliable because a disproportionate number of our younger users register with an inaccurate age. Accordingly, ourunderstanding of usage by age group may not be complete.
In addition, our data regarding the geographic location of our users is estimated based on a number of factors, such as the user's IP address and self-disclosed location. These factors may not always accurately reflect the user's actual location. For example, a user may appear to be accessing Facebook from thelocation of the proxy server that the user connects to rather than from the user's actual location. The methodologies used to measure user metrics may also besusceptible to algorithm or other technical errors. Our estimates for revenue by user location and revenue by user device are also affected by these factors.
We regularly review our processes for calculating these metrics, and from time to time we may discover inaccuracies in our metrics or make adjustments toimprove their accuracy, including adjustments that may result in the recalculation of our historical metrics. We believe that any such inaccuracies or adjustmentsare immaterial unless otherwise stated. We intend to disclose our estimates of the number of duplicate and false accounts among our MAUs on an annual basis. Inaddition, our DAU and MAU estimates will differ from estimates published by third parties due to differences in methodology.
The numbers of DAUs and MAUs discussed in this Annual Report on Form 10-K, as well as ARPU, do not include Instagram, WhatsApp, or Oculus usersunless they would otherwise qualify as such users, respectively, based on their other activities on Facebook. In addition, other user engagement metrics includedherein do not include Instagram, WhatsApp, or Oculus unless otherwise specifically stated.
4

PART I
Item 1. Business
Overview
Our mission is to give people the power to build community and bring the world closer together.
Our top priority is to build useful and engaging products that enable people to connect and share with friends and family through mobile devices, personalcomputers, and other surfaces. We also help people discover and learn about what is going on in the world around them, enable people to share their opinions,ideas, photos and videos, and other activities with audiences ranging from their closest friends to the public at large, and stay connected everywhere by accessingour products, including:
• Facebook. Facebook enables people to connect, share, discover, and communicate with each other on mobile devices and personal computers. Thereare a number of different ways to engage with people on Facebook, the most important of which is News Feed which displays an algorithmically-ranked series of stories and advertisements individualized for each person.
• Instagram. Instagram is a community for sharing visual stories through photos, videos, and direct messages. Instagram is also a place for people tostay connected with the interests and communities that they care about.
• Messenger. Messenger is a messaging application that makes it easy for people to connect with other people, groups and businesses across a variety ofplatforms and devices.
• WhatsApp. WhatsApp is a fast, simple, and reliable messaging application that is used by people around the world to connect securely and privately.
• Oculus. Our Oculus virtual reality technology and content platform power products that allow people to enter a completely immersive and interactiveenvironment to train, learn, play games, consume content, and connect with others.
We generate substantially all of our revenue from selling advertising placements to marketers. Our ads enable marketers to reach people based on a varietyof factors including age, gender, location, interests, and behaviors. Marketers purchase ads that can appear in multiple places including on Facebook, Instagram,Messenger, and third-party applications and websites.
We are also investing in a number of longer-term initiatives, such as connectivity efforts, artificial intelligence research, and augmented and virtual reality,to develop technologies that we believe will help us better serve our communities and pursue our mission to give people the power to build community and bringthe world closer together.
Competition
Our business is characterized by innovation, rapid change, and disruptive technologies. We compete with companies that sell advertising, as well as withcompanies that provide social, media, and communication products and services that are designed to engage users on mobile devices and online. We facesignificant competition in every aspect of our business, including from companies that facilitate communication and the sharing of content and information,companies that enable marketers to display advertising, companies that distribute video and other forms of media content, and companies that provide developmentplatforms for applications developers. We compete to attract, engage, and retain people who use our products, to attract and retain marketers, and to attract andretain developers to build compelling mobile and web applications that integrate with our products.
We also compete with the following:
• Companies that offer products across broad platforms that replicate capabilities we provide. For example, Google has integrated social functionalityinto a number of its products, including search, video, and Android.
• Companies that develop applications, particularly mobile applications, that provide social or other communications functionality, such as messaging,photo- and video-sharing, and micro-blogging.
• Companies that provide regional social networks that have strong positions in particular countries.
• Traditional, online, and mobile businesses that provide media for marketers to reach their audiences and/or develop tools and systems for managingand optimizing advertising campaigns.
• Companies that develop and deliver virtual reality products and services.
5

As we introduce or acquire new products, as our existing products evolve, or as other companies introduce new products and services, we may becomesubject to additional competition.
Technology
Our product development philosophy is centered on continuous innovation in creating and improving products that are social by design, which means thatour products are designed to place people and their social interactions at the core of the product experience. As our user base grows, and the level of engagementfrom the people who use our products continues to increase, including with video, our computing needs continue to expand. We make significant investments intechnology both to improve our existing products and services and to develop new ones, as well as for our marketers and developers. We are also investing inprotecting the security and integrity of our platform by investing in both people and technology to strengthen our systems against abuse.
Our technology investments included research and development expenses of $7.75 billion , $5.92 billion and $4.82 billion in 2017, 2016 and 2015,respectively. For information about our research and development expenses, see Part II, Item 7, "Management's Discussion and Analysis of Financial Conditionand Results of Operations—Results of Operations—Research and development" of this Annual Report on Form 10-K.
Sales and Operations
The majority of our marketers use our self-service ad platform to launch and manage their advertising campaigns. We also have a global sales force that isfocused on attracting and retaining advertisers and providing support to them throughout the stages of the marketing cycle from pre-purchase decision-making toreal-time optimizations to post-campaign analytics. We work directly with these advertisers, through traditional advertising agencies, and with an ecosystem ofspecialized agencies and partners. We currently operate six support offices and more than 40 sales offices around the globe. We also invest in and rely on self-service tools to provide direct customer support to our users and partners.
Marketing
To date, our communities have grown organically with people inviting their friends to connect with them, supported by internal efforts to stimulateawareness and interest. In addition, we have invested and will continue to invest in marketing our products and services to build our brand, grow our user base, andincrease engagement around the world. We leverage the utility of our products and our social distribution channels as our most effective marketing tools.
Intellectual Property
To establish and protect our proprietary rights, we rely on a combination of patents, trademarks, copyrights, trade secrets, including know-how, licenseagreements, confidentiality procedures, non-disclosure agreements with third parties, employee disclosure and invention assignment agreements, and othercontractual rights. In addition, to further protect our proprietary rights, from time to time we have purchased patents and patent applications from third parties. Wedo not believe that our proprietary technology is dependent on any single patent or copyright or groups of related patents or copyrights. We believe the duration ofour patents is adequate relative to the expected lives of our products.
Government Regulation
We are subject to a number of U.S. federal and state and foreign laws and regulations that affect companies conducting business on the Internet. Many ofthese laws and regulations are still evolving and being tested in courts, and could be interpreted in ways that could harm our business. These may involve userprivacy, data protection and personal information, rights of publicity, content, intellectual property, advertising, marketing, distribution, data security, dataretention and deletion, electronic contracts and other communications, competition, protection of minors, consumer protection, telecommunications, productliability, taxation, economic or other trade prohibitions or sanctions, securities law compliance, and online payment services. In particular, we are subject tofederal, state, and foreign laws regarding privacy and protection of people's data. Foreign data protection, privacy, content, competition, and other laws andregulations can be more restrictive than those in the United States. U.S. federal and state and foreign laws and regulations, which in some cases can be enforced byprivate parties in addition to government entities, are constantly evolving and can be subject to significant change. As a result, the application, interpretation, andenforcement of these laws and regulations are often uncertain, particularly in the new and rapidly evolving industry in which we operate, and may be interpretedand applied inconsistently from country to country and inconsistently with our current policies and practices.
Proposed or new legislation and regulations could also significantly affect our business. There currently are a number of proposals pending before federal,state, and foreign legislative and regulatory bodies. In addition, the new European General Data Protection Regulation (GDPR) will take effect in May 2018 andwill apply to all of our products and services that provide service in Europe. The GDPR will include operational requirements for companies that receive or processpersonal data of residents of the European Union that are different than those currently in place in the European Union, and will include significant penalties fornon-
6

compliance. Similarly, there are a number of legislative proposals in the United States, at both the federal and state level, that could impose new obligations inareas affecting our business, such as liability for copyright infringement by third parties. In addition, some countries are considering or have passed legislationimplementing data protection requirements or requiring local storage and processing of data or similar requirements that could increase the cost and complexity ofdelivering our services.
We are currently, and may in the future be, subject to regulatory orders or consent decrees. Violation of existing or future regulatory orders or consentdecrees could subject us to substantial monetary fines and other penalties that could negatively affect our financial condition and results of operations.
Various laws and regulations in the United States and abroad, such as the U.S. Bank Secrecy Act, the Dodd-Frank Act, the USA PATRIOT Act, and theCredit CARD Act, impose certain anti-money laundering requirements on companies that are financial institutions or that provide financial products and services.Under these laws and regulations, financial institutions are broadly defined to include money services businesses such as money transmitters, check cashers, andsellers or issuers of stored value or prepaid access products. Requirements imposed on financial institutions under these laws include customer identification andverification programs, record retention policies and procedures, and transaction reporting. To increase flexibility in how our online payments infrastructure(Payments) may evolve and to mitigate regulatory uncertainty, we have received certain money transmitter licenses in the United States and an Electronic Money(E-Money) license that allows us to conduct certain regulated payment activities in the participating member countries of the European Economic Area, which willgenerally require us to demonstrate compliance with many domestic and foreign laws relating to money transmission, gift cards and other prepaid accessinstruments, electronic funds transfers, anti-money laundering, charitable fundraising, counter-terrorist financing, gambling, banking and lending, financial privacyand data security, and import and export restrictions.
Employees
As of December 31, 2017 , we had 25,105 employees.
Corporate Information
We were incorporated in Delaware in July 2004. We completed our initial public offering in May 2012 and our Class A common stock is listed on TheNasdaq Global Select Market under the symbol "FB." Our principal executive offices are located at 1601 Willow Road, Menlo Park, California 94025, and ourtelephone number is (650) 543-4800.
Facebook, the Facebook logo, FB, the Like button, Instagram, Oculus, WhatsApp, and our other registered or common law trademarks, service marks, ortrade names appearing in this Annual Report on Form 10-K are the property of Facebook, Inc. or its affiliates. Other trademarks, service marks, or trade namesappearing in this Annual Report on Form 10-K are the property of their respective owners.
Information about Segment and Geographic Revenue
Information about segment and geographic revenue is set forth in Notes 1 and 13 of our Notes to Consolidated Financial Statements included in Part II, Item8, "Financial Statements and Supplementary Data" of this Annual Report on Form 10-K.
Available Information
Our website address is www.facebook.com. Our Annual Report on Form 10-K, Quarterly Reports on Form 10-Q, Current Reports on Form 8-K, andamendments to reports filed pursuant to Sections 13(a) and 15(d) of the Securities Exchange Act of 1934, as amended (Exchange Act), are filed with the U.S.Securities and Exchange Commission (SEC). We are subject to the informational requirements of the Exchange Act and file or furnish reports, proxy statements,and other information with the SEC. Such reports and other information filed by us with the SEC are available free of charge on our website at investor.fb.comwhen such reports are available on the SEC's website. We use our investor.fb.com and newsroom.fb.com websites as well as Mark Zuckerberg's Facebook Page(https://www.facebook.com/zuck) as means of disclosing material non-public information and for complying with our disclosure obligations under Regulation FD.
The public may read and copy any materials filed by Facebook with the SEC at the SEC's Public Reference Room at 100 F Street, NE, Room 1580,Washington, DC 20549. The public may obtain information on the operation of the Public Reference Room by calling the SEC at 1-800-SEC-0330. The SECmaintains an Internet site that contains reports, proxy and information statements, and other information regarding issuers that file electronically with the SEC atwww.sec.gov.
The contents of the websites referred to above are not incorporated into this filing. Further, our references to the URLs for these websites are intended to beinactive textual references only.
7

Item 1A. Risk Factors
Certain factors may have a material adverse effect on our business, financial condition, and results of operations. You should consider carefully the risks anduncertainties described below, in addition to other information contained in this Annual Report on Form 10-K, including our consolidated financial statements andrelated notes. The risks and uncertainties described below are not the only ones we face. Additional risks and uncertainties that we are unaware of, or that wecurrently believe are not material, may also become important factors that adversely affect our business. If any of the following risks actually occurs, our business,financial condition, results of operations, and future prospects could be materially and adversely affected. In that event, the trading price of our Class A commonstock could decline, and you could lose part or all of your investment.
Risks Related to Our Business and Industry
If we fail to retain existing users or add new users, or if our users decrease their level of engagement with our products, our revenue, financial results, andbusiness may be significantly harmed.
The size of our user base and our users' level of engagement are critical to our success. Our financial performance has been and will continue to besignificantly determined by our success in adding, retaining, and engaging active users of our products, particularly for Facebook and Instagram. We anticipate thatour active user growth rate will continue to decline over time as the size of our active user base increases, and it is possible that the size of our active user base mayfluctuate or decline in one or more markets, particularly in markets where we have achieved higher penetration rates. For example, in the fourth quarter of 2017,we experienced a slight decline on a quarter-over-quarter basis in the number of daily active users on Facebook in the United States & Canada region. If people donot perceive our products to be useful, reliable, and trustworthy, we may not be able to attract or retain users or otherwise maintain or increase the frequency andduration of their engagement. A number of other social networking companies that achieved early popularity have since seen their active user bases or levels ofengagement decline, in some cases precipitously. There is no guarantee that we will not experience a similar erosion of our active user base or engagement levels.Our user engagement patterns have changed over time, and user engagement can be difficult to measure, particularly as we introduce new and different productsand services. Any number of factors could potentially negatively affect user retention, growth, and engagement, including if:
• users increasingly engage with other competitive products or services;
• we fail to introduce new features, products or services that users find engaging or if we introduce new products or services, or make changes toexisting products and services, that are not favorably received;
• users feel that their experience is diminished as a result of the decisions we make with respect to the frequency, prominence, format, size, and qualityof ads that we display;
• users have difficulty installing, updating, or otherwise accessing our products on mobile devices as a result of actions by us or third parties that werely on to distribute our products and deliver our services;
• user behavior on any of our products changes, including decreases in the quality and frequency of content shared on our products and services;
• we are unable to continue to develop products for mobile devices that users find engaging, that work with a variety of mobile operating systems andnetworks, and that achieve a high level of market acceptance;
• there are decreases in user sentiment about the quality or usefulness of our products or concerns related to privacy and sharing, safety, security, orother factors;
• we are unable to manage and prioritize information to ensure users are presented with content that is appropriate, interesting, useful, and relevant tothem;
• we are unable to obtain or attract engaging third-party content;
• users adopt new technologies where our products may be displaced in favor of other products or services, or may not be featured or otherwiseavailable;
• there are adverse changes in our products that are mandated by legislation, regulatory authorities, or litigation;
• there is decreased engagement or acceptance of product features on our service, or decreased acceptance of our terms of service, as part of changesthat may be implemented in connection with the General Data Protection Regulation (GDPR) in Europe;
• technical or other problems prevent us from delivering our products in a rapid and reliable manner or otherwise affect
8

the user experience, such as security breaches or failure to prevent or limit spam or similar content;
• we adopt terms, policies, or procedures related to areas such as sharing, content, user data, or advertising that are perceived negatively by our users orthe general public;
• we elect to focus our product decisions on longer-term initiatives that do not prioritize near-term user growth and engagement, or if initiativesdesigned to attract and retain users and engagement are unsuccessful or discontinued, whether as a result of actions by us, third parties, or otherwise;
• we fail to provide adequate customer service to users, marketers, developers, or other partners;
• we, developers whose products are integrated with our products, or other partners and companies in our industry are the subject of adverse mediareports or other negative publicity; or
• our current or future products, such as our development tools and application programming interfaces that enable developers to build, grow, andmonetize mobile and web applications, reduce user activity on our products by making it easier for our users to interact and share on third-partymobile and web applications.
If we are unable to maintain or increase our user base and user engagement, our revenue and financial results may be adversely affected. Any decrease inuser retention, growth, or engagement could render our products less attractive to users, marketers, and developers, which is likely to have a material and adverseimpact on our revenue, business, financial condition, and results of operations. If our active user growth rate continues to slow, we will become increasinglydependent on our ability to maintain or increase levels of user engagement and monetization in order to drive revenue growth.
We generate substantially all of our revenue from advertising. The loss of marketers, or reduction in spending by marketers, could seriously harm ourbusiness.
Substantially all of our revenue is currently generated from third parties advertising on Facebook and Instagram. For 2017, 2016, and 2015, advertisingaccounted for 98% , 97% and 95% , respectively, of our revenue. As is common in the industry, our marketers do not have long-term advertising commitmentswith us. Many of our marketers spend only a relatively small portion of their overall advertising budget with us. Marketers will not continue to do business with us,or they will reduce the budgets they are willing to commit to us, if we do not deliver ads in an effective manner, or if they do not believe that their investment inadvertising with us will generate a competitive return relative to other alternatives. In addition, our advertising revenue growth has become increasingly dependentupon increased pricing of our ads. If we are unable to provide marketers with a suitable return on investment, the pricing of our ads may not increase, or maydecline, in which case our revenue and financial results may be harmed.
Our advertising revenue could also be adversely affected by a number of other factors, including:
• decreases in user engagement, including time spent on our products;
• our inability to continue to increase user access to and engagement with our mobile products;
• product changes or inventory management decisions we may make that change the size, format, frequency, or relative prominence of ads displayedon our products or of other unpaid content shared by marketers on our products;
• our inability to maintain or increase marketer demand, the pricing of our ads, or both;
• our inability to maintain or increase the quantity or quality of ads shown to users, including as a result of technical infrastructure constraints;
• reductions of advertising by marketers due to our efforts to implement advertising policies that protect the security and integrity of our platform;
• changes to third-party policies that limit our ability to deliver or target advertising on mobile devices;
• the availability, accuracy, and utility of analytics and measurement solutions offered by us or third parties that demonstrate the value of our ads tomarketers, or our ability to further improve such tools;
• loss of advertising market share to our competitors, including if prices for purchasing ads increase or if competitors offer lower priced or moreintegrated products;
• adverse government actions or legal developments relating to advertising, including legislative and regulatory developments and developments inlitigation;
9

• decisions by marketers to reduce their advertising as a result of adverse media reports or other negative publicity involving us, our advertisingmetrics or tools, content on our products, developers with mobile and web applications that are integrated with our products, or other companies inour industry;
• reductions of advertising by marketers due to objectionable content published on our products by third parties;
• the effectiveness of our ad targeting or degree to which users opt out of certain types of ad targeting, including as a result of product changes andcontrols that may be implemented in connection with the GDPR or other regulation or regulatory action;
• the degree to which users cease or reduce the number of times they engage with our ads;
• changes in the way advertising on mobile devices or on personal computers is measured or priced; and
• the impact of macroeconomic conditions, whether in the advertising industry in general, or among specific types of marketers or within particulargeographies.
The occurrence of any of these or other factors could result in a reduction in demand for our ads, which may reduce the prices we receive for our ads, orcause marketers to stop advertising with us altogether, either of which would negatively affect our revenue and financial results.
Our user growth, engagement, and monetization on mobile devices depend upon effective operation with mobile operating systems, networks, and standardsthat we do not control.
The substantial majority of our revenue is generated from advertising on mobile devices. There is no guarantee that popular mobile devices will continue tofeature Facebook or our other products, or that mobile device users will continue to use our products rather than competing products. We are dependent on theinteroperability of Facebook and our other products with popular mobile operating systems, networks, and standards that we do not control, such as the Androidand iOS operating systems. Any changes, bugs, or technical issues in such systems, or changes in our relationships with mobile operating system partners, handsetmanufacturers, or mobile carriers, or in their terms of service or policies that degrade our products' functionality, reduce or eliminate our ability to distribute ourproducts, give preferential treatment to competitive products, limit our ability to deliver, target, or measure the effectiveness of ads, or charge fees related to thedistribution of our products or our delivery of ads could adversely affect the usage of Facebook or our other products and monetization on mobile devices.Additionally, in order to deliver high quality mobile products, it is important that our products work well with a range of mobile technologies, systems, networks,and standards that we do not control, and that we have good relationships with handset manufacturers and mobile carriers. We may not be successful inmaintaining or developing relationships with key participants in the mobile ecosystem or in developing products that operate effectively with these technologies,systems, networks, or standards. In the event that it is more difficult for our users to access and use Facebook or our other products on their mobile devices, or ifour users choose not to access or use Facebook or our other products on their mobile devices or use mobile products that do not offer access to Facebook or ourother products, our user growth and user engagement could be harmed. From time to time, we may also take actions regarding the distribution of our products orthe operation of our business based on what we believe to be in our long-term best interests. Such actions may adversely affect our users and our relationships withthe operators of mobile operating systems, handset manufacturers, mobile carriers, or other business partners, and there is no assurance that these actions will resultin the anticipated long-term benefits. In the event that our users are adversely affected by these actions or if our relationships with such third parties deteriorate, ouruser growth, engagement, and monetization could be adversely affected and our business could be harmed.
Our business is highly competitive. Competition presents an ongoing threat to the success of our business.
We compete with companies that sell advertising, as well as with companies that provide social, media, and communication products and services that aredesigned to engage users on mobile devices and online. We face significant competition in every aspect of our business, including from companies that facilitatecommunication and the sharing of content and information, companies that enable marketers to display advertising, companies that distribute video and otherforms of media content, and companies that provide development platforms for applications developers. We compete with companies that offer products acrossbroad platforms that replicate capabilities we provide. For example, Google has integrated social functionality into a number of its products, including search,video, and Android. We also compete with companies that develop applications, particularly mobile applications, that provide social or other communicationsfunctionality, such as messaging, photo- and video-sharing, and micro-blogging, as well as companies that provide regional social networks that have strongpositions in particular countries. In addition, we face competition from traditional, online, and mobile businesses that provide media for marketers to reach theiraudiences and/or develop tools and systems for managing and optimizing advertising campaigns. We also compete with companies that develop and deliver virtualreality products and services.
Some of our current and potential competitors may have significantly greater resources or stronger competitive positions in
10

certain product segments, geographic regions, or user demographics than we do. These factors may allow our competitors to respond more effectively than us tonew or emerging technologies and changes in market conditions. We believe that some users, particularly younger users, are aware of and actively engaging withother products and services similar to, or as a substitute for, Facebook products and services, and we believe that some users have reduced their use of andengagement with our products and services in favor of these other products and services. In the event that users increasingly engage with other products andservices, we may experience a decline in use and engagement in key user demographics or more broadly, in which case our business would likely be harmed.
Our competitors may develop products, features, or services that are similar to ours or that achieve greater acceptance, may undertake more far-reaching andsuccessful product development efforts or marketing campaigns, or may adopt more aggressive pricing policies. In addition, developers whose mobile and webapplications are integrated with Facebook or our other products may use information shared by our users through our products in order to develop products orfeatures that compete with us. Some competitors may gain a competitive advantage against us in areas where we operate, including: by integrating competingplatforms, applications, or features into products they control such as mobile device operating systems, search engines, or web browsers; by making acquisitions;by limiting our ability to deliver, target, or measure the effectiveness of ads; by imposing fees or other charges related to our delivery of ads; by making access toour products more difficult; or by making it more difficult to communicate with our users. As a result, our competitors may acquire and engage users or generateadvertising or other revenue at the expense of our own efforts, which may negatively affect our business and financial results. In addition, from time to time, wemay take actions in response to competitive threats, but we cannot assure you that these actions will be successful or that they will not negatively affect ourbusiness and financial results.
We believe that our ability to compete effectively depends upon many factors both within and beyond our control, including:
• the popularity, usefulness, ease of use, performance, and reliability of our products compared to our competitors' products;
• the size and composition of our user base;
• the engagement of users with our products and competing products;
• the timing and market acceptance of products, including developments and enhancements to our or our competitors' products;
• our ability to distribute our products to new and existing users;
• our ability to monetize our products;
• the frequency, size, format, quality, and relative prominence of the ads displayed by us or our competitors;
• customer service and support efforts;
• marketing and selling efforts, including our ability to measure the effectiveness of our ads and to provide marketers with a compelling return on theirinvestments;
• our ability to establish and maintain developers' interest in building mobile and web applications that integrate with Facebook and our other products;
• our ability to establish and maintain publisher interest in integrating their content with Facebook and our other products;
• changes mandated by legislation, regulatory authorities, or litigation, some of which may have a disproportionate effect on us;
• acquisitions or consolidation within our industry, which may result in more formidable competitors;
• our ability to attract, retain, and motivate talented employees, particularly software engineers, designers, and product managers;
• our ability to cost-effectively manage and grow our operations; and
• our reputation and brand strength relative to those of our competitors.
If we are not able to compete effectively, our user base and level of user engagement may decrease, we may become less attractive to developers andmarketers, and our revenue and results of operations may be materially and adversely affected.
11

Action by governments to restrict access to Facebook or our other products in their countries could substantially harm our business and financial results.
It is possible that governments of one or more countries may seek to censor content available on Facebook or our other products in their country, restrictaccess to our products from their country entirely, or impose other restrictions that may affect the accessibility of our products in their country for an extendedperiod of time or indefinitely. For example, user access to Facebook and certain of our other products has been or is currently restricted in whole or in part inChina, Iran, and North Korea. In addition, government authorities in other countries may seek to restrict user access to our products if they consider us to be inviolation of their laws or a threat to public safety or for other reasons, and certain of our products have been restricted by governments in other countries from timeto time. It is also possible that government authorities could take action to restrict our ability to sell advertising. In the event that content shown on Facebook or ourother products is subject to censorship, access to our products is restricted, in whole or in part, in one or more countries, or other restrictions are imposed on ourproducts, or our competitors are able to successfully penetrate new geographic markets or capture a greater share of existing geographic markets that we cannotaccess or where we face other restrictions, our ability to retain or increase our user base, user engagement, or the level of advertising by marketers may beadversely affected, we may not be able to maintain or grow our revenue as anticipated, and our financial results could be adversely affected.
Our new products and changes to existing products could fail to attract or retain users or generate revenue and profits.
Our ability to retain, increase, and engage our user base and to increase our revenue depends heavily on our ability to continue to evolve our existingproducts and to create successful new products, both independently and in conjunction with developers or other third parties. We may introduce significant changesto our existing products or acquire or introduce new and unproven products, including using technologies with which we have little or no prior development oroperating experience. For example, in March 2016, we shipped our first virtual reality hardware product, the Oculus Rift. In addition, we have announced plans todevelop augmented reality technology and products. We do not have significant experience with consumer hardware products or virtual or augmented realitytechnology, which may adversely affect our ability to successfully develop and market these products and technologies, and we will incur increased costs inconnection with the development and marketing of such products and technologies. We have also invested, and expect to continue to invest, significant resourcesin growing our WhatsApp and Messenger products. We have historically monetized messaging in only a very limited fashion, and we may not be successful in ourefforts to generate meaningful revenue from messaging over the long term. If these or other new or enhanced products fail to engage users, marketers, ordevelopers, or if we are unsuccessful in our monetization efforts, we may fail to attract or retain users or to generate sufficient revenue, operating margin, or othervalue to justify our investments, and our business may be adversely affected.
We make product and investment decisions that may not prioritize short-term financial results and may not produce the long-term benefits that we expect.
We frequently make product and investment decisions that may not prioritize short-term financial results if we believe that the decisions are consistent withour mission and benefit the aggregate user experience and will thereby improve our financial performance over the long term. For example, from time to time wemay change the size, frequency, or relative prominence of ads in order to improve ad quality and overall user experience. Similarly, we recently announcedchanges to our News Feed ranking algorithm to help our users have more meaningful social interactions, and we expect that these changes will have the effect ofreducing time spent and some measures of user engagement with Facebook, which could adversely affect our financial results. From time to time, we have alsomade, and expect to continue to make, other changes to our products which may adversely affect the distribution of content of publishers, marketers, anddevelopers, and could reduce their incentive to invest in their efforts on Facebook. We also may introduce new features or other changes to existing products, orintroduce new stand-alone products, that attract users away from properties, formats, or use cases where we have more proven means of monetization. Forexample, the Stories format is becoming increasingly popular for sharing content across our products, and we do not currently monetize Stories at the same rate asNews Feed. In addition, we plan to continue focusing on growing users and engagement on Instagram, Messenger, and WhatsApp, and we may also introduceother stand-alone applications in the future. These efforts may reduce engagement with the core Facebook application, where we have the most proven means ofmonetization and which serves as the platform for many of our new user experiences. These decisions may adversely affect our business and results of operationsand may not produce the long-term benefits that we expect.
12

If we are not able to maintain and enhance our brands, or if events occur that damage our reputation and brands, our ability to expand our base of users,marketers, and developers may be impaired, and our business and financial results may be harmed.
We believe that our brands have significantly contributed to the success of our business. We also believe that maintaining and enhancing our brands iscritical to expanding our base of users, marketers, and developers. Many of our new users are referred by existing users. Maintaining and enhancing our brands willdepend largely on our ability to continue to provide useful, reliable, trustworthy, and innovative products, which we may not do successfully. We may introducenew products or terms of service or policies that users do not like, which may negatively affect our brands. Additionally, the actions of our developers oradvertisers may affect our brands if users do not have a positive experience using third-party mobile and web applications integrated with our products orinteracting with parties that advertise through our products. We will also continue to experience media, legislative, or regulatory scrutiny of our decisions regardinguser privacy, content, advertising, and other issues, which may adversely affect our reputation and brands. For example, we previously announced our discovery ofcertain ads and other content previously displayed on our products that may be relevant to government investigations relating to Russian interference in the 2016U.S. presidential election. We also may fail to respond expeditiously to the sharing of objectionable content on our services or objectionable practices byadvertisers, or to otherwise address user concerns, which could erode confidence in our brands. Our brands may also be negatively affected by the actions of usersthat are deemed to be hostile or inappropriate to other users, by the actions of users acting under false or inauthentic identities, by the use of our products orservices to disseminate information that is deemed to be misleading (or intended to manipulate opinions), by perceived or actual efforts by governments to obtainaccess to user information for security-related purposes or to censor certain content on our platform, or by the use of our products or services for illicit,objectionable, or illegal ends. Maintaining and enhancing our brands may require us to make substantial investments and these investments may not be successful.Certain of our past actions have eroded confidence in our brands, and if we fail to successfully promote and maintain our brands or if we incur excessive expensesin this effort, our business and financial results may be adversely affected.
Security breaches and improper access to or disclosure of our data or user data, or other hacking and phishing attacks on our systems, could harm ourreputation and adversely affect our business.
Our industry is prone to cyber-attacks by third parties seeking unauthorized access to our data or users’ data or to disrupt our ability to provide service. Anyfailure to prevent or mitigate security breaches and improper access to or disclosure of our data or user data, including personal information, content or paymentinformation from users, could result in the loss or misuse of such data, which could harm our business and reputation and diminish our competitive position. Inaddition, computer malware, viruses, social engineering (predominantly spear phishing attacks), and general hacking have become more prevalent in our industry,have occurred on our systems in the past, and will occur on our systems in the future. We also regularly encounter attempts to create false or undesirable useraccounts, purchase ads, or take other actions on our platform for purposes such as spamming, spreading misinformation, or other objectionable ends. As a result ofour prominence, the size of our user base, and the types and volume of personal data on our systems, we believe that we are a particularly attractive target for suchbreaches and attacks. Such attacks may cause interruptions to the services we provide, degrade the user experience, cause users to lose confidence and trust in ourproducts, impair our internal systems, or result in financial harm to us. Our efforts to protect our company data or the information we receive may also beunsuccessful due to software bugs or other technical malfunctions; employee, contractor, or vendor error or malfeasance; government surveillance; or other threatsthat evolve. In addition, third parties may attempt to fraudulently induce employees or users to disclose information in order to gain access to our data or our users'data. Cyber-attacks continue to evolve in sophistication and volume, and inherently may be difficult to detect for long periods of time. Although we havedeveloped systems and processes that are designed to protect our data and user data, to prevent data loss, to disable undesirable accounts and activities on ourplatform, and to prevent or detect security breaches, we cannot assure you that such measures will provide absolute security, and we may incur significant costs inprotecting against or remediating cyber-attacks.
In addition, some of our developers or other partners, such as those that help us measure the effectiveness of ads, may receive or store information providedby us or by our users through mobile or web applications integrated with Facebook. We provide limited information to such third parties based on the scope ofservices provided to us. However, if these third parties or developers fail to adopt or adhere to adequate data security practices, or in the event of a breach of theirnetworks, our data or our users' data may be improperly accessed, used, or disclosed.
Affected users or government authorities could initiate legal or regulatory actions against us in connection with any security breaches or improper disclosureof data, which could cause us to incur significant expense and liability or result in orders or consent decrees forcing us to modify our business practices. Suchincidents may also result in a decline in our active user base or engagement levels. Any of these events could have a material and adverse effect on our business,reputation, or financial results.
13
Unfavorable media coverage could negatively affect our business.
We receive a high degree of media coverage around the world. Unfavorable publicity regarding, for example, our privacy practices, terms of service,product changes, product quality, litigation or regulatory activity, government surveillance, the actions of our advertisers, the actions of our developers whoseproducts are integrated with our products, the use of our products or services for illicit, objectionable, or illegal ends, the actions of our users, the quality andintegrity of content shared on our platform, or the actions of other companies that provide similar services to us, has in the past, and could in the future, adverselyaffect our reputation. Such negative publicity also could have an adverse effect on the size, engagement, and loyalty of our user base and result in decreasedrevenue, which could adversely affect our business and financial results.
Our financial results will fluctuate from quarter to quarter and are difficult to predict.
Our quarterly financial results have fluctuated in the past and will fluctuate in the future. Additionally, we have a limited operating history with the currentscale of our business, which makes it difficult to forecast our future results. As a result, you should not rely upon our past quarterly financial results as indicators offuture performance. You should take into account the risks and uncertainties frequently encountered by companies in rapidly evolving markets. Our financialresults in any given quarter can be influenced by numerous factors, many of which we are unable to predict or are outside of our control, including:
• our ability to maintain and grow our user base and user engagement;
• our ability to attract and retain marketers in a particular period;
• fluctuations in spending by our marketers due to seasonality, such as historically strong spending in the fourth quarter of each year, episodic regionalor global events, or other factors;
• the frequency, prominence, size, format, and quality of ads shown to users;
• the success of technologies designed to block the display of ads;
• the pricing of our ads and other products;
• the diversification and growth of revenue sources beyond advertising on Facebook and Instagram;
• our ability to generate revenue from Payments, or the sale of Oculus products and services or other products we may introduce in the future;
• the development and introduction of new products or services by us or our competitors;
• user behavior or product changes that may reduce traffic to features or products that we successfully monetize;
• increases in marketing, sales, and other operating expenses that we will incur to grow and expand our operations and to remain competitive;
• costs and expenses related to the development and delivery of Oculus products and services;
• our ability to maintain gross margins and operating margins;
• costs related to acquisitions, including costs associated with amortization and additional investments to develop the acquired technologies;
• charges associated with impairment of any assets on our balance sheet;
• our ability to obtain equipment, components, and labor for our data centers and other technical infrastructure in a timely and cost-effective manner;
• system failures or outages, which could prevent us from serving ads for any period of time;
• breaches of security or privacy, and the costs associated with any such breaches and remediation;
• changes in the manner in which we distribute our products or inaccessibility of our products due to third-party actions;
• fees paid to third parties for content or the distribution of our products;
• share-based compensation expense, including acquisition-related expense;
14
• adverse litigation judgments, settlements, or other litigation-related costs;
• changes in the legislative or regulatory environment, including with respect to privacy and data protection, or enforcement by government regulators,including fines, orders, or consent decrees;
• the overall tax rate for our business, which may be affected by the mix of income we earn in the U.S. and in jurisdictions with comparatively lowertax rates, the effects of share-based compensation, the effects of integrating intellectual property from acquisitions, and the effects of changes in ourbusiness;
• the impact of changes in tax law, which are recorded in the period enacted and may significantly affect the effective tax rate of that period;
• tax obligations that may arise from resolutions of tax examinations, including the examination we are currently under by the Internal RevenueService (IRS), that materially differ from the amounts we have anticipated;
• fluctuations in currency exchange rates and changes in the proportion of our revenue and expenses denominated in foreign currencies;
• fluctuations in the market values of our portfolio investments and in interest rates;
• changes in U.S. generally accepted accounting principles; and
• changes in global business or macroeconomic conditions.
We expect our rates of growth to decline in the future.
We expect that our user growth and revenue growth rates will decline over time as the size of our active user base increases, and it is possible that the size ofour active user base may fluctuate or decline in one or more markets, particularly as we achieve greater market penetration. We expect our revenue growth rate willgenerally decline over time as our revenue increases to higher levels. As our growth rates decline, investors' perceptions of our business may be adversely affectedand the trading price of our Class A common stock could decline.
Our costs are continuing to grow, which could reduce our operating margin and profitability. If our investments are not successful, our business and financialperformance could be harmed.
Operating our business is costly, and we expect our expenses to continue to increase in the future as we broaden our user base, as users increase the amountand types of content they consume and the data they share with us, for example with respect to video, as we develop and implement new products, as we continueto expand our technical infrastructure, as we continue to invest in new and unproven technologies, and as we continue to hire additional employees to support ourexpanding operations. We will continue to invest in our messaging, security, video content, and global connectivity efforts, as well as other initiatives that may nothave clear paths to monetization. In addition, we will incur increased costs in connection with the development and marketing of our Oculus products and services.Any such investments may not be successful, and any such increases in our costs may reduce our operating margin and profitability. In addition, if our investmentsare not successful, our ability to grow revenue will be harmed, which could adversely affect our business and financial performance.
Given our levels of share-based compensation, our tax rate may vary significantly depending on our stock price.
The tax effects of the accounting for share-based compensation may significantly impact our effective tax rate from period to period. In periods in which ourstock price is higher than the grant price of the share-based compensation vesting in that period, we will recognize excess tax benefits that will decrease oureffective tax rate. For example, in 2017, excess tax benefits recognized from share-based compensation decreased our provision for income taxes by $1.25 billionand our effective tax rate by six percentage points as compared to the tax rate without such benefits. In future periods in which our stock price is lower than thegrant price of the share-based compensation vesting in that period, our effective tax rate may increase. The amount and value of share-based compensation issuedrelative to our earnings in a particular period will also affect the magnitude of the impact of share-based compensation on our effective tax rate. These tax effectsare dependent on our stock price, which we do not control, and a decline in our stock price could significantly increase our effective tax rate and adversely affectour financial results.
15

Our business is subject to complex and evolving U.S. and foreign laws and regulations regarding privacy, data protection, content, competition, consumerprotection, and other matters. Many of these laws and regulations are subject to change and uncertain interpretation, and could result in claims, changes toour business practices, monetary penalties, increased cost of operations, or declines in user growth or engagement, or otherwise harm our business.
We are subject to a variety of laws and regulations in the United States and abroad that involve matters central to our business, including privacy, dataprotection and personal information, rights of publicity, content, intellectual property, advertising, marketing, distribution, data security, data retention anddeletion, electronic contracts and other communications, competition, protection of minors, consumer protection, telecommunications, product liability, taxation,economic or other trade prohibitions or sanctions, securities law compliance, and online payment services. The introduction of new products, expansion of ouractivities in certain jurisdictions, or other actions that we may take may subject us to additional laws, regulations, or other government scrutiny. In addition, foreigndata protection, privacy, content, competition, and other laws and regulations can impose different obligations or be more restrictive than those in the UnitedStates.
These U.S. federal and state and foreign laws and regulations, which in some cases can be enforced by private parties in addition to government entities, areconstantly evolving and can be subject to significant change. As a result, the application, interpretation, and enforcement of these laws and regulations are oftenuncertain, particularly in the new and rapidly evolving industry in which we operate, and may be interpreted and applied inconsistently from country to country andinconsistently with our current policies and practices. For example, regulatory or legislative actions affecting the manner in which we display content to our usersor obtain consent to various practices could adversely affect user growth and engagement. Such actions could affect the manner in which we provide our servicesor adversely affect our financial results.
We are also subject to laws and regulations that dictate whether, how, and under what circumstances we can transfer, process and/or receive certain data thatis critical to our operations, including data shared between countries or regions in which we operate and data shared among our products and services. For example,in 2016, the European Union and United States agreed to an alternative transfer framework for data transferred from the European Union to the United States,called the Privacy Shield, but this new framework is subject to an annual review that could result in changes to our obligations and also may be challenged bynational regulators or private parties. In addition, the other bases upon which Facebook relies to legitimize the transfer of such data, such as standard ModelContractual Clauses (MCCs), have been subjected to regulatory and judicial scrutiny. For example, the Irish Data Protection Commissioner has challenged thelegal grounds for transfers of user data to Facebook, Inc., and the Irish High Court has agreed to refer this challenge to the Court of Justice of the European Unionfor decision. We also face multiple inquiries, investigations, and lawsuits in Europe, India, and other jurisdictions regarding the August 2016 update toWhatsApp’s terms of service and privacy policy and its sharing of certain data with other Facebook products and services, including a lawsuit currently pendingbefore the Supreme Court of India. If one or more of the legal bases for transferring data from Europe to the United States is invalidated, if we are unable totransfer data between and among countries and regions in which we operate, or if we are prohibited from sharing data among our products and services, it couldaffect the manner in which we provide our services or adversely affect our financial results.
Proposed or new legislation and regulations could also significantly affect our business. There currently are a number of proposals pending before federal,state, and foreign legislative and regulatory bodies. In addition, the new European General Data Protection Regulation (GDPR) will take effect in May 2018 andwill apply to all of our products and services that provide service in Europe. The GDPR will include operational requirements for companies that receive or processpersonal data of residents of the European Union that are different than those currently in place in the European Union. For example, we may be required toimplement measures to change our service or limit access to our service for minors under the age of 16 for certain countries in Europe that maintain the minimumage of 16 under the GDPR. We may also be required to obtain consent and/or offer new controls to existing and new users in Europe before processing data forcertain aspects of our service. In addition, the GDPR will include significant penalties for non-compliance. Similarly, there are a number of legislative proposals inthe United States, at both the federal and state level, that could impose new obligations in areas affecting our business, such as liability for copyright infringementby third parties. In addition, some countries are considering or have passed legislation implementing data protection requirements or requiring local storage andprocessing of data or similar requirements that could increase the cost and complexity of delivering our services.
These laws and regulations, as well as any associated inquiries or investigations or any other government actions, may be costly to comply with and maydelay or impede the development of new products, result in negative publicity, increase our operating costs, require significant management time and attention, andsubject us to remedies that may harm our business, including fines or demands or orders that we modify or cease existing business practices.
16
We have been subject to regulatory and other government investigations, enforcement actions, and settlements, and we expect to continue to be subject to suchproceedings and other inquires in the future, which could cause us to incur substantial costs or require us to change our business practices in a mannermaterially adverse to our business.
From time to time, we receive formal and informal inquiries from government authorities and regulators regarding our compliance with laws andregulations, many of which are evolving and subject to interpretation. We are and expect to continue to be the subject of investigations, inquiries, data requests,actions, and audits in the United States, Europe, and around the world, particularly in the areas of privacy, data protection, law enforcement, consumer protection,and competition, as we continue to grow and expand our operations. For example, several data protection authorities in the European Union have initiated actions,investigations, or administrative orders seeking to assert jurisdiction over Facebook, Inc. and our subsidiaries and to restrict the ways in which we collect and useinformation, and other data protection authorities may do the same. Orders issued by, or inquiries or enforcement actions initiated by, government or regulatoryauthorities could cause us to incur substantial costs, expose us to unanticipated civil and criminal liability or penalties (including substantial monetary fines), orrequire us to change our business practices in a manner materially adverse to our business.
If we are unable to protect our intellectual property, the value of our brands and other intangible assets may be diminished, and our business may be adverselyaffected.
We rely and expect to continue to rely on a combination of confidentiality, assignment, and license agreements with our employees, consultants, and thirdparties with whom we have relationships, as well as trademark, copyright, patent, trade secret, and domain name protection laws, to protect our proprietary rights.In the United States and internationally, we have filed various applications for protection of certain aspects of our intellectual property, and we currently hold asignificant number of registered trademarks and issued patents in multiple jurisdictions and have acquired patents and patent applications from third parties. Thirdparties may knowingly or unknowingly infringe our proprietary rights, third parties may challenge proprietary rights held by us, and pending and future trademarkand patent applications may not be approved. In addition, effective intellectual property protection may not be available in every country in which we operate orintend to operate our business. In any or all of these cases, we may be required to expend significant time and expense in order to prevent infringement or toenforce our rights. Although we have generally taken measures to protect our proprietary rights, there can be no assurance that others will not offer products orconcepts that are substantially similar to ours and compete with our business. In addition, we regularly contribute software source code under open source licensesand have made other technology we developed available under other open licenses, and we include open source software in our products. For example, we havecontributed certain specifications and designs related to our data center equipment to the Open Compute Project Foundation, a non-profit entity that shares anddevelops such information with the technology community, under the Open Web Foundation License. As a result of our open source contributions and the use ofopen source in our products, we may license or be required to license or disclose code and/or innovations that turn out to be material to our business and may alsobe exposed to increased litigation risk. If the protection of our proprietary rights is inadequate to prevent unauthorized use or appropriation by third parties, thevalue of our brands and other intangible assets may be diminished and competitors may be able to more effectively mimic our products, services, and methods ofoperations. Any of these events could have an adverse effect on our business and financial results.
We are currently, and expect to be in the future, party to patent lawsuits and other intellectual property rights claims that are expensive and time consumingand, if resolved adversely, could have a significant impact on our business, financial condition, or results of operations.
Companies in the Internet, technology, and media industries own large numbers of patents, copyrights, trademarks, and trade secrets, and frequently enterinto litigation based on allegations of infringement, misappropriation, or other violations of intellectual property or other rights. In addition, various "non-practicing entities" that own patents and other intellectual property rights often attempt to aggressively assert their rights in order to extract value from technologycompanies. Furthermore, from time to time we may introduce or acquire new products, including in areas where we historically have not competed, which couldincrease our exposure to patent and other intellectual property claims from competitors and non-practicing entities.
From time to time, we receive notice from patent holders and other parties alleging that certain of our products and services, or user content, infringe theirintellectual property rights. We presently are involved in a number of intellectual property lawsuits, and as we face increasing competition and gain an increasinglyhigh profile, we expect the number of patent and other intellectual property claims against us to grow. Defending patent and other intellectual property litigation iscostly and can impose a significant burden on management and employees, and there can be no assurances that favorable final outcomes will be obtained in allcases. In addition, plaintiffs may seek, and we may become subject to, preliminary or provisional rulings in the course of any such litigation, including potentialpreliminary injunctions requiring us to cease some or all of our operations. We may decide to settle such lawsuits and disputes on terms that are unfavorable to us.Similarly, if any litigation to which we are a party is resolved adversely, we may be subject to an unfavorable judgment that may not be reversed upon appeal. Theterms of such a settlement or judgment may require us to cease some or all of our operations or pay substantial amounts to the other party. In addition, we mayhave to seek a license to continue practices
17

found to be in violation of a third party's rights, which may not be available on reasonable terms, or at all, and may significantly increase our operating costs andexpenses. As a result, we may also be required to develop alternative non-infringing technology or practices or discontinue the practices. The development ofalternative non-infringing technology or practices could require significant effort and expense or may not be feasible. Our business, financial condition, and resultsof operations could be adversely affected as a result of an unfavorable resolution of the disputes and litigation referred to above.
We are involved in numerous class action lawsuits and other litigation matters that are expensive and time consuming, and, if resolved adversely, could harmour business, financial condition, or results of operations.
In addition to intellectual property claims, we are also involved in numerous other lawsuits, including putative class action lawsuits, many of which claimstatutory damages and/or seek significant changes to our business operations, and we anticipate that we will continue to be a target for numerous lawsuits in thefuture. Because of the scale of our user base, the plaintiffs in class action cases filed against us typically claim enormous monetary damages even if the alleged per-user harm is small or non-existent. In addition, we may be subject to additional class action lawsuits based on employment claims, product performance or otherclaims related to the use of consumer hardware and software, as well as virtual reality technology and products, which are new and unproven. Any negativeoutcome from any such lawsuits could result in payments of substantial monetary damages or fines, or undesirable changes to our products or business practices,and accordingly our business, financial condition, or results of operations could be materially and adversely affected. Although the results of such lawsuits andclaims cannot be predicted with certainty, we do not believe that the final outcome of those matters relating to our products that we currently face will have amaterial adverse effect on our business, financial condition, or results of operations. In addition, we are currently the subject of stockholder class action suits inconnection with our initial public offering (IPO). We believe these lawsuits are without merit and are vigorously defending these lawsuits.
There can be no assurances that a favorable final outcome will be obtained in all our cases, and defending any lawsuit is costly and can impose a significantburden on management and employees. Any litigation to which we are a party may result in an onerous or unfavorable judgment that may not be reversed uponappeal or in payments of substantial monetary damages or fines, or we may decide to settle lawsuits on similarly unfavorable terms, which could adversely affectour business, financial conditions, or results of operations.
We may incur liability as a result of information retrieved from or transmitted over the Internet or published using our products or as a result of claims relatedto our products.
We have faced, currently face, and will continue to face claims relating to information that is published or made available on our products. In particular, thenature of our business exposes us to claims related to defamation, dissemination of misinformation or news hoaxes, discrimination, intellectual property rights,rights of publicity and privacy, personal injury torts, or laws regulating hate speech or other types of content. This risk is enhanced in certain jurisdictions outsidethe United States where our protection from liability for third-party actions may be unclear or where we may be less protected under local laws than we are in theUnited States. In addition, there have been various Congressional efforts to restrict the scope of the protections available to online platforms under Section 230 ofthe Communications Decency Act, and our current protections from liability for third-party content in the United States could decrease or change. We could incursignificant costs investigating and defending such claims and, if we are found liable, significant damages. We could also face fines or orders restricting or blockingour services in particular geographies as a result of content hosted on our services. For example, recently enacted legislation in Germany may impose significantfines for failure to comply with certain content removal and disclosure obligations. If any of these events occur, our business and financial results could beadversely affected.
Our CEO has control over key decision making as a result of his control of a majority of the voting power of our outstanding capital stock.
Mark Zuckerberg, our founder, Chairman, and CEO, is able to exercise voting rights with respect to a majority of the voting power of our outstandingcapital stock and therefore has the ability to control the outcome of matters submitted to our stockholders for approval, including the election of directors and anymerger, consolidation, or sale of all or substantially all of our assets. This concentrated control could delay, defer, or prevent a change of control, merger,consolidation, or sale of all or substantially all of our assets that our other stockholders support, or conversely this concentrated control could result in theconsummation of such a transaction that our other stockholders do not support. This concentrated control could also discourage a potential investor from acquiringour Class A common stock, which has limited voting power relative to the Class B common stock, and might harm the trading price of our Class A common stock.In addition, Mr. Zuckerberg has the ability to control the management and major strategic investments of our company as a result of his position as our CEO andhis ability to control the election or replacement of our directors. In the event of his death, the shares of our capital stock that Mr. Zuckerberg owns will betransferred to the persons or entities that he has designated. As a board member and officer, Mr. Zuckerberg owes a fiduciary duty to our stockholders and must actin good faith in a manner he reasonably believes to be in the best interests of our stockholders. As a stockholder, even a controlling stockholder, Mr. Zuckerberg
18

is entitled to vote his shares, and shares over which he has voting control as governed by a voting agreement, in his own interests, which may not always be in theinterests of our stockholders generally.
We plan to continue to make acquisitions, which could harm our financial condition or results of operations and may adversely affect the price of our commonstock.
As part of our business strategy, we have made and intend to continue to make acquisitions to add specialized employees and complementary companies,products, or technologies. We may not be able to find suitable acquisition candidates, and we may not be able to complete acquisitions on favorable terms, if at all.In some cases, the costs of such acquisitions may be substantial. For example, in 2014 we paid approximately $4.6 billion in cash and issued 178 million shares ofour Class A common stock in connection with our acquisition of WhatsApp, and we paid approximately $400 million in cash and issued 23 million shares of ourClass B common stock in connection with our acquisition of Oculus. We also issued a substantial number of RSUs to help retain the employees of thesecompanies. There is no assurance that we will receive a favorable return on investment for these or other acquisitions.
We may pay substantial amounts of cash or incur debt to pay for acquisitions, which could adversely affect our liquidity. The incurrence of indebtednesswould also result in increased fixed obligations and increased interest expense, and could also include covenants or other restrictions that would impede our abilityto manage our operations. We may also issue equity securities to pay for acquisitions and we regularly grant RSUs to retain the employees of acquired companies,which could increase our expenses, adversely affect our financial results, and result in dilution to our stockholders. In addition, any acquisitions we announce couldbe viewed negatively by users, marketers, developers, or investors, which may adversely affect our business or the price of our Class A common stock.
We may also discover liabilities or deficiencies associated with the companies or assets we acquire that were not identified in advance, which may result insignificant unanticipated costs. The effectiveness of our due diligence review and our ability to evaluate the results of such due diligence are dependent upon theaccuracy and completeness of statements and disclosures made or actions taken by the companies we acquire or their representatives, as well as the limited amountof time in which acquisitions are executed. In addition, we may fail to accurately forecast the financial impact of an acquisition transaction, including tax andaccounting charges. Acquisitions may also result in our recording of significant additional expenses to our results of operations and recording of substantial finite-lived intangible assets on our balance sheet upon closing. Any of these factors may adversely affect our financial condition or results of operations.
We may not be able to successfully integrate our acquisitions, and we may incur significant costs to integrate and support the companies we acquire.
The integration of acquisitions requires significant time and resources, and we may not manage these processes successfully. Our ability to successfullyintegrate complex acquisitions is unproven, particularly with respect to companies that have significant operations or that develop products where we do not haveprior experience. For example, Oculus and WhatsApp are larger and more complex than companies we have historically acquired. In particular, Oculus buildstechnology and products that are relatively new to Facebook and with which we did not have significant experience or structure in place to support prior to theacquisition. We continue to make substantial investments of resources to support these acquisitions, which will result in significant ongoing operating expenses andmay divert resources and management attention from other areas of our business. We cannot assure you that these investments will be successful. If we fail tosuccessfully integrate the companies we acquire, we may not realize the benefits expected from the transaction and our business may be harmed.
If our goodwill or finite-lived intangible assets become impaired, we may be required to record a significant charge to earnings.
We review our finite-lived intangible assets for impairment when events or changes in circumstances indicate the carrying value may not be recoverable,such as a decline in stock price and market capitalization. We test goodwill for impairment at least annually. If such goodwill or finite-lived intangible assets aredeemed to be impaired, an impairment loss equal to the amount by which the carrying amount exceeds the fair value of the assets would be recognized. We may berequired to record a significant charge in our financial statements during the period in which any impairment of our goodwill or finite-lived intangible assets isdetermined, which would negatively affect our results of operations.
19

Our business is dependent on our ability to maintain and scale our technical infrastructure, and any significant disruption in our service could damage ourreputation, result in a potential loss of users and engagement, and adversely affect our financial results.
Our reputation and ability to attract, retain, and serve our users is dependent upon the reliable performance of our products and our underlying technicalinfrastructure. We have in the past experienced, and may in the future experience, interruptions in the availability or performance of our products from time totime. Our systems may not be adequately designed with the necessary reliability and redundancy to avoid performance delays or outages that could be harmful toour business. If our products are unavailable when users attempt to access them, or if they do not load as quickly as expected, users may not use our products asoften in the future, or at all, and our ability to serve ads may be disrupted. As our user base and engagement continue to grow, and the amount and types ofinformation shared on Facebook and our other products continue to grow and evolve, such as increased engagement with video, we will need an increasing amountof technical infrastructure, including network capacity and computing power, to continue to satisfy the needs of our users and advertisers. It is possible that we mayfail to continue to effectively scale and grow our technical infrastructure to accommodate these increased demands, which may adversely affect our userengagement and advertising revenue growth. In addition, our business may be subject to interruptions, delays, or failures resulting from earthquakes, adverseweather conditions, other natural disasters, power loss, terrorism, geopolitical conflict, cyber-attacks, or other catastrophic events. If such an event were to occur,users may be subject to service disruptions or outages and we may not be able to recover our technical infrastructure and user data in a timely manner to restart orprovide our services, which may adversely affect our financial results.
A substantial portion of our network infrastructure is provided by third parties. Any disruption or failure in the services we receive from these providerscould harm our ability to handle existing or increased traffic and could significantly harm our business. Any financial or other difficulties these providers face mayadversely affect our business, and we exercise little control over these providers, which increases our vulnerability to problems with the services they provide.
We could experience unforeseen difficulties in building and operating key portions of our technical infrastructure.
We have designed and built our own data centers and key portions of our technical infrastructure through which we serve our products, and we plan tocontinue to significantly expand the size of our infrastructure primarily through data centers and other projects. The infrastructure expansion we are undertaking iscomplex and involves projects in multiple locations, and unanticipated delays in the completion of these projects, including due to any shortage of labor necessaryin building portions of such projects, or availability of components, may lead to increased project costs, operational inefficiencies, or interruptions in the deliveryor degradation of the quality of our products. In addition, there may be issues related to this infrastructure that are not identified during the testing phases of designand implementation, which may only become evident after we have started to fully utilize the underlying equipment, that could further degrade the user experienceor increase our costs.
Our products and internal systems rely on software that is highly technical, and if it contains undetected errors or vulnerabilities, our business could beadversely affected.
Our products and internal systems rely on software, including software developed or maintained internally and/or by third parties, that is highly technicaland complex. In addition, our products and internal systems depend on the ability of such software to store, retrieve, process, and manage immense amounts ofdata. The software on which we rely has contained, and will in the future contain, undetected errors, bugs, or vulnerabilities. Some errors may only be discoveredafter the code has been released for external or internal use. Errors, vulnerabilities, or other design defects within the software on which we rely have in the past,and may in the future, result in a negative experience for users and marketers who use our products, delay product introductions or enhancements, result intargeting, measurement, or billing errors, compromise our ability to protect the data of our users and/or our intellectual property or lead to reductions in our abilityto provide some or all of our services. In addition, any errors, bugs, vulnerabilities, or defects discovered in the software on which we rely, and any associateddegradations or interruptions of service, could result in damage to our reputation, loss of users, loss of revenue, or liability for damages, any of which couldadversely affect our business and financial results.
Technologies have been developed that can block the display of our ads, which could adversely affect our financial results.
Technologies have been developed, and will likely continue to be developed, that can block the display of our ads or block our ad measurement tools,particularly for advertising displayed on personal computers. We generate substantially all of our revenue from advertising, including revenue resulting from thedisplay of ads on personal computers. Revenue generated from the display of ads on personal computers has been impacted by these technologies from time totime. As a result, these technologies have had an adverse effect on our financial results and, if such technologies continue to proliferate, in particular with respect tomobile platforms, our future financial results may be harmed.
Real or perceived inaccuracies in our user and other metrics may harm our reputation and negatively affect our business.
The numbers for our key metrics, which include our DAUs, MAUs, and average revenue per user (ARPU), are calculated using
20

internal company data based on the activity of user accounts. While these numbers are based on what we believe to be reasonable estimates of our user base for theapplicable period of measurement, there are inherent challenges in measuring usage of our products across large online and mobile populations around the world.In addition, we are continually seeking to improve our estimates of our user base, and such estimates may change due to improvements or changes in ourmethodology.
We regularly evaluate these metrics to estimate the number of "duplicate" and "false" accounts among our MAUs. A duplicate account is one that a usermaintains in addition to his or her principal account. We divide "false" accounts into two categories: (1) user-misclassified accounts, where users have createdpersonal profiles for a business, organization, or non-human entity such as a pet (such entities are permitted on Facebook using a Page rather than a personal profileunder our terms of service); and (2) undesirable accounts, which represent user profiles that we determine are intended to be used for purposes that violate ourterms of service, such as spamming. The estimates of duplicate and false accounts are based on an internal review of a limited sample of accounts, and we applysignificant judgment in making this determination. For example, to identify duplicate accounts we use data signals such as similar IP addresses or user names, andto identify false accounts we look for names that appear to be fake or other behavior that appears inauthentic to the reviewers. Our estimates may change as ourmethodologies evolve, including through the application of new data signals or technologies, which may allow us to identify previously undetected duplicate orfalse accounts and may improve our ability to evaluate a broader population of our users. As such, our estimation of duplicate or false accounts may not accuratelyrepresent the actual number of such accounts. In particular, duplicate accounts are very difficult to measure at our scale, and it is possible that the actual number ofduplicate accounts may vary significantly from our estimates.
In the fourth quarter of 2017, we estimate that duplicate accounts may have represented approximately 10% of our worldwide MAUs. We believe thepercentage of duplicate accounts is meaningfully higher in developing markets such as India, Indonesia, and the Philippines, as compared to more developedmarkets. In the fourth quarter of 2017, we estimate that false accounts may have represented approximately 3-4% of our worldwide MAUs. Our estimation of falseaccounts can vary as a result of episodic spikes in the creation of such accounts, which we have seen originate more frequently in specific countries such asIndonesia, Turkey, and Vietnam. From time to time, we may make product changes or take other actions to reduce the number of duplicate or false accounts amongour users, which may also reduce our DAU and MAU estimates in a particular period.
Our data limitations may affect our understanding of certain details of our business. For example, while user-provided data indicates a decline in usageamong younger users, this age data is unreliable because a disproportionate number of our younger users register with an inaccurate age. Accordingly, ourunderstanding of usage by age group may not be complete.
In addition, our data regarding the geographic location of our users is estimated based on a number of factors, such as the user's IP address and self-disclosed location. These factors may not always accurately reflect the user's actual location. For example, a user may appear to be accessing Facebook from thelocation of the proxy server that the user connects to rather than from the user's actual location. The methodologies used to measure user metrics may also besusceptible to algorithm or other technical errors. Our estimates for revenue by user location and revenue by user device are also affected by these factors. Weregularly review our processes for calculating these metrics, and from time to time we may discover inaccuracies in our metrics or make adjustments to improvetheir accuracy, including adjustments that may result in the recalculation of our historical metrics. We believe that any such inaccuracies or adjustments areimmaterial unless otherwise stated. We intend to disclose our estimates of the number of duplicate and false accounts among our MAUs on an annual basis. Inaddition, our DAU and MAU estimates will differ from estimates published by third parties due to differences in methodology.
In addition, from time to time we provide, or rely on, certain other metrics, including those relating to the reach and effectiveness of our ads. All of ourmetrics are subject to software bugs, inconsistencies in our systems, and human error. If marketers, developers, or investors do not perceive our metrics to beaccurate, or if we discover material inaccuracies in our metrics, we may be subject to liability, our reputation may be harmed, and marketers and developers may beless willing to allocate their budgets or resources to Facebook, which could negatively affect our business and financial results.
21

We cannot assure you that we will effectively manage our growth.
Our employee headcount and the scope and complexity of our business have increased significantly, with the number of employees increasing to 25,105 asof December 31, 2017 from 17,048 as of December 31, 2016, and we expect such headcount growth to continue for the foreseeable future. The growth andexpansion of our business and products create significant challenges for our management, operational, and financial resources, including managing multiplerelationships with users, marketers, developers, and other third parties. As our operations and the number of our third-party relationships continue to grow, ourinformation technology systems or our internal controls and procedures may not be adequate to support such growth. In addition, some members of ourmanagement do not have significant experience managing a large global business operation, so our management may not be able to manage such growtheffectively. To effectively manage our growth, we must continue to improve our operational, financial, and management processes and systems and to effectivelyexpand, train, and manage our employee base. As our organization continues to grow, and we are required to implement more complex organizational managementstructures, we may find it increasingly difficult to maintain the benefits of our corporate culture, including our ability to quickly develop and launch new andinnovative products. This could negatively affect our business performance.
The loss of one or more of our key personnel, or our failure to attract and retain other highly qualified personnel in the future, could harm our business.
We currently depend on the continued services and performance of our key personnel, including Mark Zuckerberg and Sheryl K. Sandberg. Although wehave entered into employment agreements with Mr. Zuckerberg and Ms. Sandberg, the agreements have no specific duration and constitute at-will employment. Inaddition, many of our key technologies and systems are custom-made for our business by our personnel. The loss of key personnel, including members ofmanagement as well as key engineering, product development, marketing, and sales personnel, could disrupt our operations and have an adverse effect on ourbusiness.
As we continue to grow, we cannot guarantee we will continue to attract and retain the personnel we need to maintain our competitive position. Inparticular, we intend to continue to hire a significant number of technical personnel in the foreseeable future, and we expect to continue to face significantcompetition from other companies in hiring such personnel, particularly in the San Francisco Bay Area, where our headquarters are located and where the cost ofliving is high. As we continue to mature, the incentives to attract, retain, and motivate employees provided by our equity awards or by future arrangements may notbe as effective as in the past, and if we issue significant equity to attract additional employees or to retain our existing employees, we would incur substantialadditional share-based compensation expense and the ownership of our existing stockholders would be further diluted. Our ability to attract, retain, and motivateemployees may also be adversely affected by stock price volatility. Additionally, we have a number of current employees whose equity ownership in our companyhas provided them a substantial amount of personal wealth, which could affect their decisions about whether or not to continue to work for us. As a result of thesefactors, it may be difficult for us to continue to retain and motivate our employees. If we do not succeed in attracting, hiring, and integrating excellent personnel, orretaining and motivating existing personnel, we may be unable to grow effectively.
We may not be able to continue to successfully grow usage of and engagement with mobile and web applications that integrate with Facebook and our otherproducts.
We have made and are continuing to make investments to enable developers to build, grow, and monetize mobile and web applications that integrate withFacebook and our other products. Such existing and prospective developers may not be successful in building, growing, or monetizing mobile and/or webapplications that create and maintain user engagement. Additionally, developers may choose to build on other platforms, including mobile platforms controlled bythird parties, rather than building products that integrate with Facebook and our other products. We are continuously seeking to balance the distribution objectivesof our developers with our desire to provide an optimal user experience, and we may not be successful in achieving a balance that continues to attract and retainsuch developers. For example, from time to time, we have taken actions to reduce the volume of communications from these developers to users on Facebook andour other products with the objective of enhancing the user experience, and such actions have reduced distribution from, user engagement with, and ourmonetization opportunities from, mobile and web applications integrated with our products. In some instances, these actions, as well as other actions to enforce ourpolicies applicable to developers, have adversely affected our relationships with such developers. If we are not successful in our efforts to continue to grow thenumber of developers that choose to build products that integrate with Facebook and our other products or if we are unable to continue to build and maintain goodrelations with such developers, our user growth and user engagement and our financial results may be adversely affected.
22

We currently generate substantially all of our Payments revenue from developers that use Facebook on personal computers, and we expect that our Paymentsrevenue will continue to decline as usage of Facebook on personal computers continues to decline.
We currently generate substantially all of our Payments revenue from developers that use Facebook on personal computers. Specifically, applications builtby developers of social games are currently responsible for substantially all of our revenue derived from Payments, and the majority of the revenue from theseapplications has historically been generated by a limited number of the most popular games. We have experienced and expect to see the continued decline in usageof Facebook on personal computers, which we expect will result in a continuing decline in Payments revenue. In addition, only a relatively small percentage of ourusers have transacted with Facebook Payments. If the Facebook-integrated applications fail to grow or maintain their users and engagement, whether as a result ofthe continued decline in the usage of Facebook on personal computers or otherwise, if developers do not continue to introduce new applications that attract usersand create engagement on Facebook, or if Facebook-integrated applications outside of social games do not gain popularity and generate significant revenue for us,our financial performance could be adversely affected.
Payment transactions may subject us to additional regulatory requirements and other risks that could be costly and difficult to comply with or that could harmour business.
Our users can purchase virtual and digital goods from developers that offer applications using our Payments infrastructure on the Facebook website. Inaddition, certain of our users can use our Payments infrastructure, including on Messenger, for other activities, such as sending money to other users and makingdonations to certain charitable organizations. We are subject to a variety of laws and regulations in the United States, Europe, and elsewhere, including thosegoverning anti-money laundering and counter-terrorist financing, money transmission, gift cards and other prepaid access instruments, electronic funds transfer,charitable fundraising, and import and export restrictions. Depending on how our Payments product evolves, we may also be subject to other laws and regulationsincluding those governing gambling, banking, and lending. In some jurisdictions, the application or interpretation of these laws and regulations is not clear. Toincrease flexibility in how our use of Payments may evolve and to mitigate regulatory uncertainty, we have received certain money transmitter licenses in theUnited States and an Electronic Money (E-Money) license that allows us to conduct certain regulated payment activities in the participating member countries ofthe European Economic Area, which will generally require us to demonstrate compliance with many domestic and foreign laws in these areas. Our efforts tocomply with these laws and regulations could be costly and result in diversion of management time and effort and may still not guarantee compliance. In the eventthat we are found to be in violation of any such legal or regulatory requirements, we may be subject to monetary fines or other penalties such as a cease and desistorder, or we may be required to make product changes, any of which could have an adverse effect on our business and financial results.
In addition, we may be subject to a variety of additional risks as a result of Payments transactions, including:
• increased costs and diversion of management time and effort and other resources to deal with bad transactions or customer disputes;
• potential fraudulent or otherwise illegal activity by users, developers, employees, or third parties;
• restrictions on the investment of consumer funds used to transact Payments; and
• additional disclosure and reporting requirements.
We have significant international operations and plan to continue expanding our operations abroad where we have more limited operating experience, andthis may subject us to increased business and economic risks that could affect our financial results.
We have significant international operations and plan to continue the international expansion of our business operations and the translation of our products.We currently make Facebook available in more than 100 different languages, and we have offices or data centers in more than 30 different countries. We may enternew international markets where we have limited or no experience in marketing, selling, and deploying our products. Our products are generally available globallythrough the web and on mobile, but some or all of our products or functionality may not be available in certain markets due to legal and regulatory complexities.For example, Facebook and certain of our other products are not generally available in China. We also outsource certain operational functions to third-partyvendors globally. If we fail to deploy, manage, or oversee our international operations successfully, our business may suffer. In addition, we are subject to a varietyof risks inherent in doing business internationally, including:
• political, social, or economic instability;
• risks related to legal, regulatory, and other government scrutiny applicable to U.S. companies with sales and operations in foreign jurisdictions,including with respect to privacy, tax, law enforcement, content, trade compliance, intellectual property, and terrestrial infrastructure matters;
• potential damage to our brand and reputation due to compliance with local laws, including potential censorship or
23

requirements to provide user information to local authorities;
• fluctuations in currency exchange rates and compliance with currency controls;
• foreign exchange controls and tax and other regulations and orders that might prevent us from repatriating cash earned in countries outside the UnitedStates or otherwise limit our ability to move cash freely, and impede our ability to invest such cash efficiently;
• higher levels of credit risk and payment fraud;
• enhanced difficulties of integrating any foreign acquisitions;
• burdens of complying with a variety of foreign laws;
• reduced protection for intellectual property rights in some countries;
• difficulties in staffing, managing, and overseeing global operations and the increased travel, infrastructure, and legal compliance costs associatedwith multiple international locations;
• compliance with the U.S. Foreign Corrupt Practices Act, the U.K. Bribery Act, and similar laws in other jurisdictions; and
• compliance with statutory equity requirements and management of tax consequences.
If we are unable to expand internationally and manage the complexity of our global operations successfully, our financial results could be adverselyaffected.
We face design, manufacturing, and supply chain risks that, if not properly managed, could adversely impact our financial results.
We face a number of risks related to design, manufacturing, and supply chain management with respect to our Oculus products. For example, the Oculusproducts we sell may have quality issues resulting from the design or manufacture of the products, or from the software used in the products. Sometimes, theseissues may be caused by components we purchase from other manufacturers or suppliers. If the quality of our Oculus products does not meet our customers'expectations or such products are found to be defective, then our brand and financial results could be adversely affected.
We rely on third parties to manufacture our Oculus products. We may experience supply shortages or other supply chain disruptions in the future that couldresult in shipping delays and negatively impact our operations. We could be negatively affected if we are not able to engage third parties with the necessarycapabilities or capacity on reasonable terms, or if those we engage with fail to meet their obligations (whether due to financial difficulties or other reasons), ormake adverse changes in the pricing or other material terms of such arrangements with them.
We also require the suppliers and business partners of our Oculus products to comply with laws and certain company policies regarding sourcing practicesand standards on labor, health and safety, the environment, and business ethics, but we do not control them or their practices and standards. If any of them violateslaws or implements practices or standards regarded as unethical, corrupt, or non-compliant, we could experience supply chain disruptions, canceled orders, ordamage to our reputation.
In addition, the SEC’s conflict minerals rule requires disclosure by public companies of information relating to the origin, source and chain of custody ofspecified minerals, known as conflict minerals, that are necessary to the functionality or production of products manufactured or contracted to be manufactured.We may incur significant costs associated with complying with the rule, such as costs related to the determination of the origin, source and chain of custody of theminerals used in Oculus products, the adoption of conflict minerals-related governance policies, processes and controls, and possible changes to products orsources of supply as a result of such activities.
We may face inventory risk with respect to our Oculus products.
We may be exposed to inventory risks with respect to our Oculus products as a result of rapid changes in product cycles and pricing, unsafe or defectivemerchandise, changes in consumer demand and consumer spending patterns, changes in consumer tastes with respect to Oculus products, and other factors. Weendeavor to accurately predict these trends and avoid overstocking or understocking products Oculus may sell. Demand for products, however, can changesignificantly between the time inventory or components are ordered and the date of sale. In addition, when we begin selling or manufacturing a new Oculusproduct, it may be difficult to establish vendor relationships, determine appropriate product or component selection, and accurately forecast demand. Theacquisition of certain types of inventory or components may require significant lead-time and prepayment and they may not be returnable. Any one of these factorsmay adversely affect our operating results.
24
We may have exposure to greater than anticipated tax liabilities.
Our income tax obligations are based in part on our corporate operating structure and intercompany arrangements, including the manner in which weoperate our business, develop, value, manage, protect, and use our intellectual property and the valuations of our intercompany transactions. We may also besubject to additional indirect or non-income taxes. The tax laws applicable to our business, including the laws of the United States and other jurisdictions, aresubject to interpretation and certain jurisdictions are aggressively interpreting their laws in new ways in an effort to raise additional tax revenue from companiessuch as Facebook. The taxing authorities of the jurisdictions in which we operate may challenge our methodologies for valuing developed technology orintercompany arrangements, which could increase our worldwide effective tax rate and harm our financial position, results of operations, and cash flows. Forexample, in 2016, the IRS issued us a formal assessment relating to transfer pricing with our foreign subsidiaries in conjunction with the examination of the 2010tax year, and although we disagree with the IRS's position and are contesting this issue, the ultimate resolution is uncertain and, if resolved in a manner unfavorableto us, may adversely affect our financial results. We are subject to regular review and audit by U.S. federal and state, and foreign tax authorities. Tax authoritiesmay disagree with certain positions we have taken and any adverse outcome of such a review or audit could have a negative effect on our financial position, resultsof operations, and cash flows. In addition, the determination of our worldwide provision for income taxes and other tax liabilities requires significant judgment bymanagement, and there are many transactions where the ultimate tax determination is uncertain. Our provision for income taxes is also determined by the mannerin which we operate our business, and any changes to such operations or laws applicable to such operations may affect our effective tax rate. Changes inaccounting for intercompany transactions may also affect our effective tax rate. For example, with the adoption of Accounting Standards Update No. 2016-16,effective January 1, 2018, the income tax effects of an intercompany transfer will be recognized in the period in which the transfer occurs, rather than amortizedover time, which may increase the impact of such transfers on our effective tax rate in a particular period. Although we believe that our provision for income taxesis reasonable, the ultimate tax outcome may differ from the amounts recorded in our financial statements and may materially affect our financial results in theperiod or periods for which such determination is made. In addition, our future income tax rates could be adversely affected by earnings being lower thananticipated in jurisdictions that have lower statutory tax rates and higher than anticipated in jurisdictions that have higher statutory tax rates, by changes in thevaluation of our deferred tax assets and liabilities, or by changes in tax laws, regulations, or accounting principles. For example, we have previously incurred lossesin certain international subsidiaries that resulted in an effective tax rate that is significantly higher than the statutory tax rate in the United States and this couldcontinue to happen in the future.
Changes in tax laws or tax rulings could materially affect our financial position, results of operations, and cash flows.
The income and non-income tax regimes we are subject to or operate under are unsettled and may be subject to significant change. Changes in tax laws ortax rulings, or changes in interpretations of existing laws, could materially affect our financial position, results of operations, and cash flows. For example, changesto U.S. tax laws enacted in December 2017 had a significant impact on our tax obligations and effective tax rate for the fourth quarter of 2017. In addition, manycountries in Europe, as well as a number of other countries and organizations, have recently proposed or recommended changes to existing tax laws or haveenacted new laws that could significantly increase our tax obligations in many countries where we do business or require us to change the manner in which weoperate our business. The Organization for Economic Cooperation and Development has been working on a Base Erosion and Profit Shifting Project, and issued in2015, and is expected to continue to issue, guidelines and proposals that may change various aspects of the existing framework under which our tax obligations aredetermined in many of the countries in which we do business. The European Commission has conducted investigations in multiple countries focusing on whetherlocal country tax rulings or tax legislation provides preferential tax treatment that violates European Union state aid rules and concluded that certain countries,including Ireland, have provided illegal state aid in certain cases. These investigations may result in changes to the tax treatment of our foreign operations. Due tothe large and expanding scale of our international business activities, many of these types of changes to the taxation of our activities could increase our worldwideeffective tax rate and harm our financial position, results of operations, and cash flows.
Uncertainties in the interpretation and application of the 2017 Tax Cuts and Jobs Act could materially affect our tax obligations and effective tax rate.
The 2017 Tax Cuts and Jobs Act (the Tax Act) was enacted on December 22, 2017, and significantly affected U.S. tax law by changing how the U.S.imposes income tax on multinational corporations. The U.S. Department of Treasury has broad authority to issue regulations and interpretative guidance that maysignificantly impact how we will apply the law and impact our results of operations in the period issued.
25

The Tax Act requires complex computations not previously provided in U.S. tax law. As such, the application of accounting guidance for such items iscurrently uncertain. Further, compliance with the Tax Act and the accounting for such provisions require accumulation of information not previously required orregularly produced. As a result, we have provided a provisional estimate on the effect of the Tax Act in our financial statements. As additional regulatory guidanceis issued by the applicable taxing authorities, as accounting treatment is clarified, as we perform additional analysis on the application of the law, and as we refineestimates in calculating the effect, our final analysis, which will be recorded in the period completed, may be different from our current provisional amounts, whichcould materially affect our tax obligations and effective tax rate.
We cannot guarantee that our share repurchase program will be fully consummated or that it will enhance long-term stockholder value. Share repurchasescould also increase the volatility of the trading price of our stock and could diminish our cash reserves.
In November 2016, our board of directors authorized a share repurchase program of up to $6.0 billion of our Class A common stock that commenced in2017 and does not have an expiration date. Although our board of directors has authorized this share repurchase program, the program does not obligate us torepurchase any specific dollar amount or to acquire any specific number of shares. We cannot guarantee that the program will be fully consummated or that it willenhance long-term stockholder value. The program could affect the trading price of our stock and increase volatility, and any announcement of a termination of thisprogram may result in a decrease in the trading price of our stock. In addition, this program could diminish our cash reserves.
Risks Related to Ownership of Our Class A Common Stock
The trading price of our Class A common stock has been and will likely continue to be volatile.
The trading price of our Class A common stock has been, and is likely to continue to be, volatile. Since shares of our Class A common stock were sold inour IPO in May 2012 at a price of $38.00 per share, our stock price has ranged from $17.55 to $184.25 through December 31, 2017. In addition to the factorsdiscussed in this Annual Report on Form 10-K, the trading price of our Class A common stock may fluctuate significantly in response to numerous factors, manyof which are beyond our control, including:
• actual or anticipated fluctuations in our revenue and other operating results;
• the financial projections we may provide to the public, any changes in these projections or our failure to meet these projections;
• actions of securities analysts who initiate or maintain coverage of us, changes in financial estimates by any securities analysts who follow ourcompany, or our failure to meet these estimates or the expectations of investors;
• additional shares of our stock being sold into the market by us, our existing stockholders, or in connection with acquisitions, or the anticipation ofsuch sales;
• investor sentiment with respect to our competitors, our business partners, and our industry in general;
• announcements by us or our competitors of significant products or features, technical innovations, acquisitions, strategic partnerships, joint ventures,or capital commitments;
• announcements by us or estimates by third parties of actual or anticipated changes in the size of our user base, the level of user engagement, or theeffectiveness of our ad products;
• changes in operating performance and stock market valuations of technology companies in our industry, including our developers and competitors;
• price and volume fluctuations in the overall stock market, including as a result of trends in the economy as a whole;
• the inclusion, exclusion, or deletion of our stock from any trading indices, such as the S&P 500 Index;
• media coverage of our business and financial performance;
• lawsuits threatened or filed against us;
• developments in anticipated or new legislation and pending lawsuits or regulatory actions, including interim or final rulings by tax, judicial, orregulatory bodies;
• trading activity in our share repurchase program; and
• other events or factors, including those resulting from war or incidents of terrorism, or responses to these events.
26

In addition, the stock markets have experienced extreme price and volume fluctuations that have affected and continue to affect the market prices of equitysecurities of many technology companies. Stock prices of many technology companies have fluctuated in a manner unrelated or disproportionate to the operatingperformance of those companies. We are currently subject to securities litigation in connection with our IPO. We may experience more such litigation followingfuture periods of volatility. Any securities litigation could subject us to substantial costs, divert resources and the attention of management from our business, andadversely affect our business.
We do not intend to pay cash dividends for the foreseeable future.
We have never declared or paid cash dividends on our capital stock. We currently intend to retain any future earnings to finance the operation and expansionof our business, and we do not expect to declare or pay any cash dividends in the foreseeable future. As a result, you may only receive a return on your investmentin our Class A common stock if the trading price of your shares increases.
The dual class structure of our common stock and a voting agreement between certain stockholders have the effect of concentrating voting control with ourCEO and certain other holders of our Class B common stock; this will limit or preclude your ability to influence corporate matters.
Our Class B common stock has ten votes per share and our Class A common stock has one vote per share. Stockholders who hold shares of Class Bcommon stock, including certain of our executive officers, employees, and directors and their affiliates, together hold a substantial majority of the voting power ofour outstanding capital stock. Because of the ten-to-one voting ratio between our Class B and Class A common stock, the holders of our Class B common stockcollectively control a majority of the combined voting power of our common stock and therefore are able to control all matters submitted to our stockholders forapproval so long as the shares of Class B common stock represent at least 9.1% of all outstanding shares of our Class A and Class B common stock. Thisconcentrated control will limit or preclude your ability to influence corporate matters for the foreseeable future.
Transfers by holders of Class B common stock will generally result in those shares converting to Class A common stock, subject to limited exceptions, suchas certain transfers effected for estate planning or charitable purposes. The conversion of Class B common stock to Class A common stock will have the effect,over time, of increasing the relative voting power of those holders of Class B common stock who retain their shares in the long term. If, for example,Mr. Zuckerberg retains a significant portion of his holdings of Class B common stock for an extended period of time, he could, in the future, continue to control amajority of the combined voting power of our outstanding capital stock.
Our status as a "controlled company" could make our Class A common stock less attractive to some investors or otherwise harm our stock price.
Because we qualify as a "controlled company" under the corporate governance rules for Nasdaq-listed companies, we are not required to have a majority ofour board of directors be independent, nor are we required to have a compensation committee or an independent nominating function. In light of our status as acontrolled company, our board of directors determined not to have a separate and independent nominating function and chose to have the full board of directors bedirectly responsible for nominating members of our board, and in the future we could elect not to have a majority of our board of directors be independent or not tohave a compensation committee. Accordingly, should the interests of our controlling stockholder differ from those of other stockholders, the other stockholdersmay not have the same protections afforded to stockholders of companies that are subject to all of the corporate governance rules for Nasdaq-listed companies. Ourstatus as a controlled company could make our Class A common stock less attractive to some investors or otherwise harm our stock price.
Delaware law and provisions in our restated certificate of incorporation and bylaws could make a merger, tender offer, or proxy contest difficult, therebydepressing the trading price of our Class A common stock.
Our status as a Delaware corporation and the anti-takeover provisions of the Delaware General Corporation Law may discourage, delay, or prevent a changein control by prohibiting us from engaging in a business combination with an interested stockholder for a period of three years after the person becomes aninterested stockholder, even if a change of control would be beneficial to our existing stockholders. In addition, our current restated certificate of incorporation andbylaws contain provisions that may make the acquisition of our company more difficult, including the following:
• until the first date on which the outstanding shares of our Class B common stock represent less than 35% of the combined voting power of ourcommon stock, any transaction that would result in a change in control of our company requires the approval of a majority of our outstanding Class Bcommon stock voting as a separate class;
• we currently have a dual class common stock structure, which provides Mr. Zuckerberg with the ability to control the outcome of matters requiringstockholder approval, even if he owns significantly less than a majority of the shares of our outstanding Class A and Class B common stock;
27

• when the outstanding shares of our Class B common stock represent less than a majority of the combined voting power of common stock, certainamendments to our restated certificate of incorporation or bylaws will require the approval of two-thirds of the combined vote of our then-outstanding shares of Class A and Class B common stock;
• when the outstanding shares of our Class B common stock represent less than a majority of the combined voting power of our common stock,vacancies on our board of directors will be able to be filled only by our board of directors and not by stockholders;
• when the outstanding shares of our Class B common stock represent less than a majority of the combined voting power of our common stock, ourboard of directors will be classified into three classes of directors with staggered three-year terms and directors will only be able to be removed fromoffice for cause;
• when the outstanding shares of our Class B common stock represent less than a majority of the combined voting power of our common stock, ourstockholders will only be able to take action at a meeting of stockholders and not by written consent;
• only our chairman, our chief executive officer, our president, or a majority of our board of directors are authorized to call a special meeting ofstockholders;
• advance notice procedures apply for stockholders to nominate candidates for election as directors or to bring matters before an annual meeting ofstockholders;
• our restated certificate of incorporation authorizes undesignated preferred stock, the terms of which may be established, and shares of which may beissued, without stockholder approval; and
• certain litigation against us can only be brought in Delaware.
28

Item 1B. Unresolved Staff Comments
None.
Item 2. Properties
Our corporate headquarters are located in Menlo Park, California. As of December 31, 2017 , we owned and leased approximately three million square feetof office buildings for our corporate headquarters, and 130 acres of land to be developed to accommodate anticipated future growth.
In addition, we leased offices around the world totaling approximately five million square feet. We also own and lease data centers throughout the UnitedStates and in various locations internationally.
Further, we entered into agreements to lease office buildings that are under construction. As a result of our involvement during these construction periods,we are considered for accounting purposes to be the owner of the construction projects. As such, we have excluded the square footage from the total leased spaceand owned properties, disclosed above.
We believe that our facilities are adequate for our current needs.
Item 3. Legal Proceedings
Beginning on May 22, 2012, multiple putative class actions, derivative actions, and individual actions were filed in state and federal courts in the UnitedStates and in other jurisdictions against us, our directors, and/or certain of our officers alleging violation of securities laws or breach of fiduciary duties inconnection with our initial public offering (IPO) and seeking unspecified damages. We believe these lawsuits are without merit, and we intend to continue tovigorously defend them. The vast majority of the cases in the United States, along with multiple cases filed against The NASDAQ OMX Group, Inc. and TheNasdaq Stock Market LLC (collectively referred to herein as NASDAQ) alleging technical and other trading-related errors by NASDAQ in connection with ourIPO, were ordered centralized for coordinated or consolidated pre-trial proceedings in the U.S. District Court for the Southern District of New York. In a series ofrulings in 2013 and 2014, the court denied our motion to dismiss the consolidated securities class action and granted our motions to dismiss the derivative actionsagainst our directors and certain of our officers. On July 24, 2015, the court of appeals affirmed the dismissal of the derivative actions. On December 11, 2015, thecourt granted plaintiffs' motion for class certification in the consolidated securities action. On April 14, 2017, we filed a motion for summary judgment. Trial isscheduled to begin on February 26, 2018.
In addition, from time to time, we are subject to litigation and other proceedings involving law enforcement and other regulatory agencies, including inparticular in Brazil and Europe, in order to ascertain the precise scope of our legal obligations to comply with the requests of those agencies, including ourobligation to disclose user information in particular circumstances. A number of such instances have resulted in the assessment of fines and penalties against us.We believe we have multiple legal grounds to satisfy these requests or prevail against associated fines and penalties, and we intend to vigorously defend such finesand penalties.
We are also involved in other legal proceedings, claims, and regulatory, tax or government inquiries and investigations arising from the ordinary course ofour business, and we may in the future be subject to additional lawsuits and disputes.
Item 4. Mine Safety Disclosures
Not applicable.
29

PART II
Item 5. Market for Registrant's Common Equity, Related Stockholder Matters and Issuer Purchases of Equity Securities.
Market Information for Common Stock
Our Class A common stock has been listed on the Nasdaq Global Select Market under the symbol "FB" since May 18, 2012. Prior to that time, there was nopublic market for our stock. The following table sets forth for the indicated periods the high and low intra-day sales prices per share for our Class A common stockon the Nasdaq Global Select Market.
2017 2016
High Low High Low
First Quarter $ 142.95 $ 115.51 $ 117.59 $ 89.37Second Quarter $ 156.50 $ 138.81 $ 121.08 $ 106.31Third Quarter $ 175.49 $ 147.80 $ 131.98 $ 112.97Fourth Quarter $ 184.25 $ 168.29 $ 133.50 $ 113.55
Our Class B common stock is not listed nor traded on any stock exchange.
Holders of Record
As of December 31, 2017 , there were 3,967 stockholders of record of our Class A common stock, and the closing price of our Class A common stock was$176.46 per share as reported on the Nasdaq Global Select Market. Because many of our shares of Class A common stock are held by brokers and other institutionson behalf of stockholders, we are unable to estimate the total number of stockholders represented by these record holders. As of December 31, 2017 , there were 52stockholders of record of our Class B common stock.
Dividend Policy
We have never declared or paid any cash dividend on our common stock. We intend to retain any future earnings and do not expect to pay cash dividends inthe foreseeable future.
Purchases of Equity Securities by the Issuer and Affiliated Purchasers
The following table summarizes the share repurchase activity for the three months ended December 31, 2017 :
Total Number of Shares
Purchased (1) Average Price Paid Per
Share (2)
Total Number of SharesPurchased as Part ofPublicly Announced
Programs (1)
Approximate Dollar Value ofShares that May Yet Be
Purchased Under the Plans orPrograms
(in thousands) (in thousands) (in millions)
October 1 – 31, 2017 1,008 $ 172.19 1,008 $ 4,788November 1 – 30, 2017 — $ — — $ 4,788December 1 – 31, 2017 4,832 $ 177.64 4,832 $ 3,930
5,840 5,840
(1) In November 2016, our board of directors authorized a share repurchase program of up to $6.0 billion of our Class A common stock, which commenced in January 2017 and does not havean expiration date. The timing and actual number of shares repurchased depend on a variety of factors, including price, general business and market conditions, and other investmentopportunities, and shares may be repurchased through open market purchases or privately negotiated transactions, including through the use of trading plans intended to qualify under Rule10b5-1 under the Exchange Act.
(2) Average price paid per share includes costs associated with the repurchases.
Recent Sale of Unregistered Securities and Use of Proceeds
Recent Sale of Unregistered Securities
None.
30

Stock Performance Graph
This performance graph shall not be deemed "soliciting material" or to be "filed" with the SEC for purposes of Section 18 of the Exchange Act, or otherwisesubject to the liabilities under that Section, and shall not be deemed to be incorporated by reference into any filing of Facebook, Inc. under the Securities Act of1933, as amended, or the Exchange Act.
The following graph shows a comparison from May 18, 2012 (the date our Class A common stock commenced trading on the Nasdaq Global Select Market)through December 31, 2017 of the cumulative total return for our Class A common stock, the Standard & Poor's 500 Stock Index (S&P 500 Index) and the NasdaqComposite Index (Nasdaq Composite). The graph assumes that $100 was invested at the market close on May 18, 2012 in the Class A common stock of Facebook,Inc., the S&P 500 Index and the Nasdaq Composite and data for the S&P 500 Index and the Nasdaq Composite assumes reinvestments of gross dividends. Thestock price performance of the following graph is not necessarily indicative of future stock price performance.
31

Item 6. Selected Financial Data.
You should read the following selected consolidated financial data in conjunction with Part II, Item 7, "Management's Discussion and Analysis of FinancialCondition and Results of Operations," and our consolidated financial statements and the related notes included in Part II, Item 8, "Financial Statements andSupplementary Data" of this Annual Report on Form 10-K.
The consolidated statements of income data for each of the years ended December 31, 2017 , 2016 , and 2015 and the consolidated balance sheets data as ofDecember 31, 2017 and 2016 are derived from our audited consolidated financial statements included in Part II, Item 8, "Financial Statements and SupplementaryData" of this Annual Report on Form 10-K. The consolidated statements of income data for the years ended December 31, 2014 and 2013 and the consolidatedbalance sheets data as of December 31, 2015 , 2014 , and 2013 are derived from our audited consolidated financial statements, except as otherwise noted, that arenot included in this Annual Report on Form 10-K. Our historical results are not necessarily indicative of our results in any future period.
Year Ended December 31,
2017 2016 2015 2014 2013 (in millions, except per share data)Consolidated Statements of Income Data: Revenue $ 40,653 $ 27,638 $ 17,928 $ 12,466 $ 7,872Total costs and expenses (1) 20,450 15,211 11,703 7,472 5,068Income from operations 20,203 12,427 6,225 4,994 2,804Income before provision for income taxes 20,594 12,518 6,194 4,910 2,754Net income 15,934 10,217 3,688 2,940 1,500Net income attributable to Class A and Class B commonstockholders 15,920 10,188 3,669 2,925 1,491Earnings per share attributable to Class A and Class Bcommon stockholders:
Basic $ 5.49 $ 3.56 $ 1.31 $ 1.12 $ 0.62Diluted $ 5.39 $ 3.49 $ 1.29 $ 1.10 $ 0.60
(1) Total costs and expenses include $3.72 billion , $3.22 billion , $2.97 billion , $1.84 billion, and $906 million of share-based compensation for the years ended December 31, 2017 , 2016 ,2015 , 2014 , and 2013 , respectively.
As of December 31,
2017 2016 2015 2014 2013 (in millions)Consolidated Balance Sheets Data: Cash, cash equivalents, and marketable securities $ 41,711 $ 29,449 $ 18,434 $ 11,199 $ 11,449Working capital 44,803 31,526 19,727 11,966 11,801Property and equipment, net 13,721 8,591 5,687 3,967 2,882Total assets 84,524 64,961 49,407 39,966 17,858Capital lease obligations — — 114 233 476Total liabilities 10,177 5,767 5,189 3,870 2,388Additional paid-in capital 40,584 38,227 34,886 30,225 12,297Total stockholders' equity 74,347 59,194 44,218 36,096 15,470
32
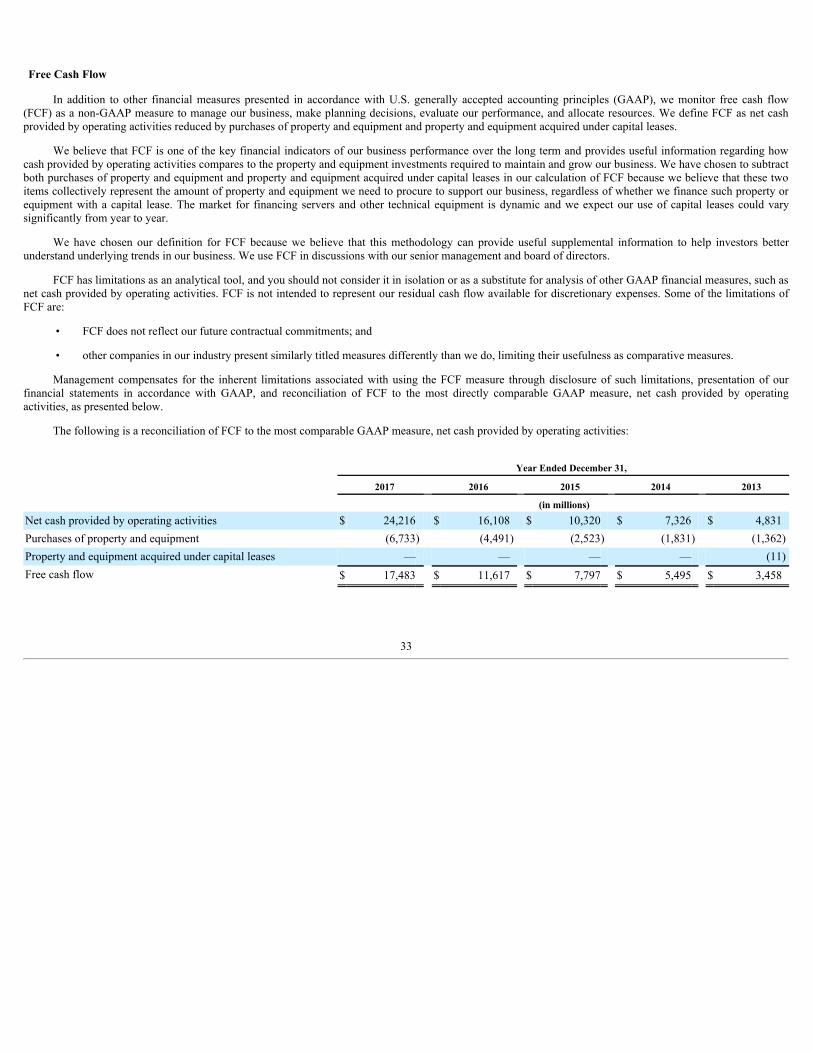
Free Cash Flow
In addition to other financial measures presented in accordance with U.S. generally accepted accounting principles (GAAP), we monitor free cash flow(FCF) as a non-GAAP measure to manage our business, make planning decisions, evaluate our performance, and allocate resources. We define FCF as net cashprovided by operating activities reduced by purchases of property and equipment and property and equipment acquired under capital leases.
We believe that FCF is one of the key financial indicators of our business performance over the long term and provides useful information regarding howcash provided by operating activities compares to the property and equipment investments required to maintain and grow our business. We have chosen to subtractboth purchases of property and equipment and property and equipment acquired under capital leases in our calculation of FCF because we believe that these twoitems collectively represent the amount of property and equipment we need to procure to support our business, regardless of whether we finance such property orequipment with a capital lease. The market for financing servers and other technical equipment is dynamic and we expect our use of capital leases could varysignificantly from year to year.
We have chosen our definition for FCF because we believe that this methodology can provide useful supplemental information to help investors betterunderstand underlying trends in our business. We use FCF in discussions with our senior management and board of directors.
FCF has limitations as an analytical tool, and you should not consider it in isolation or as a substitute for analysis of other GAAP financial measures, such asnet cash provided by operating activities. FCF is not intended to represent our residual cash flow available for discretionary expenses. Some of the limitations ofFCF are:
• FCF does not reflect our future contractual commitments; and
• other companies in our industry present similarly titled measures differently than we do, limiting their usefulness as comparative measures.
Management compensates for the inherent limitations associated with using the FCF measure through disclosure of such limitations, presentation of ourfinancial statements in accordance with GAAP, and reconciliation of FCF to the most directly comparable GAAP measure, net cash provided by operatingactivities, as presented below.
The following is a reconciliation of FCF to the most comparable GAAP measure, net cash provided by operating activities:
Year Ended December 31,
2017 2016 2015 2014 2013 (in millions)Net cash provided by operating activities $ 24,216 $ 16,108 $ 10,320 $ 7,326 $ 4,831Purchases of property and equipment (6,733) (4,491) (2,523) (1,831) (1,362)Property and equipment acquired under capital leases — — — — (11)Free cash flow $ 17,483 $ 11,617 $ 7,797 $ 5,495 $ 3,458
33
Item 7. Management's Discussion and Analysis of Financial Condition and Results of Operations
You should read the following discussion of our financial condition and results of operations in conjunction with our consolidated financial statements and therelated notes included in Part II, Item 8, "Financial Statements and Supplementary Data" of this Annual Report on Form 10-K. In addition to our historicalconsolidated financial information, the following discussion contains forward-looking statements that reflect our plans, estimates, and beliefs. Our actual resultscould differ materially from those discussed in the forward-looking statements. Factors that could cause or contribute to these differences include those discussedbelow and elsewhere in this Annual Report on Form 10-K, particularly in Part I, Item 1A, "Risk Factors." For a discussion of limitations in the measurement ofcertain of our user metrics, see the section entitled "Limitations of Key Metrics and Other Data" in this Annual Report on Form 10-K.
Certain revenue information in the section entitled " — Revenue — Foreign Exchange Impact on Revenue" is presented on a constant currency basis. Thisinformation is a non-GAAP financial measure. To calculate revenue on a constant currency basis, we translated revenue for the full year 2017 using 2016 monthlyexchange rates for our settlement currencies other than the U.S. dollar. This non-GAAP financial measure is not intended to be considered in isolation or as asubstitute for, or superior to, financial information prepared and presented in accordance with GAAP. This measure may be different from non-GAAP financialmeasures used by other companies, limiting its usefulness for comparison purposes. Moreover, presentation of revenue on a constant currency basis is providedfor year-over-year comparison purposes, and investors should be cautioned that the effect of changing foreign currency exchange rates has an actual effect on ouroperating results. We believe this non-GAAP financial measure provides investors with useful supplemental information about the financial performance of ourbusiness, enables comparison of financial results between periods where certain items may vary independent of business performance, and allows for greatertransparency with respect to key metrics used by management in operating our business.
Executive Overview of Full Year 2017 Results
Our key user metrics and financial results for 2017 are as follows:
User growth:• Daily active users (DAUs) were 1.40 billion on average for December 2017 , an increase of 14% year-over-year.• Monthly active users (MAUs) were 2.13 billion as of December 31, 2017 , an increase of 14% year-over-year.
Financial results:• Revenue was $40.65 billion , up 47% year-over-year, and ad revenue was $39.94 billion , up 49% year-over-year.• Total costs and expenses were $20.45 billion .• Income from operations was $20.20 billion .• Net income was $15.93 billion with diluted earnings per share of $5.39 .• Capital expenditures were $6.73 billion .• Effective tax rate was 23% .• Cash and cash equivalents, and marketable securities were $41.71 billion as of December 31, 2017 .• Headcount was 25,105 as of December 31, 2017 .
In 2017 , we continued to focus on our three main revenue growth priorities: (i) helping businesses expand their use of our mobile products, (ii) developinginnovative ad products that help businesses get the most of their ad campaigns, and (iii) making our ads more relevant and effective through our targetingcapabilities and outcome-based measurement.
We continued to invest, based on our roadmap, in: (i) our most developed ecosystem, the Facebook app and platform as well as video, (ii) driving growthand building ecosystems around our products and features that already have significant user bases, such as Instagram, Messenger, and WhatsApp, and (iii) long-term technology initiatives, such as connectivity, artificial intelligence, and augmented and virtual reality, that we believe will further our mission to give peoplethe power to build community and bring the world closer together. We intend to continue to invest based on this roadmap and we anticipate that additionalinvestments in the following areas will drive significant year-over-year expense growth in 2018: (i) increased investments in security, video content, and our long-term technology initiatives, and (ii) scaling our headcount and expanding our data center capacity and office facilities to support our growth.
34

Trends in Our User Metrics
The numbers for our key metrics, our DAUs, MAUs, and average revenue per user (ARPU), do not include Instagram, WhatsApp, or Oculus users unlessthey would otherwise qualify as such users, respectively, based on their other activities on Facebook. In addition, other user engagement metrics do not includeInstagram, WhatsApp, or Oculus unless otherwise specifically stated.
Trends in the number of users affect our revenue and financial results by influencing the number of ads we are able to show, the value of our ads tomarketers, the volume of Payments transactions, as well as our expenses and capital expenditures. Substantially all of our daily and monthly active users (asdefined below) access Facebook on mobile devices.
• Daily Active Users (DAUs). We define a daily active user as a registered Facebook user who logged in and visited Facebook through our website or amobile device, or used our Messenger application (and is also a registered Facebook user), on a given day. We view DAUs, and DAUs as a percentage ofMAUs, as measures of user engagement.
Note: For purposes of reporting DAUs, MAUs, and ARPU by geographic region, Europe includes all users in Russia and Turkey and Rest of World includes all users in Africa, LatinAmerica, and the Middle East.
35

Worldwide DAUs increased 14% to 1.40 billion on average during December 2017 from 1.23 billion during December 2016 . Users in India, Indonesia,and Brazil represented key sources of growth in DAUs during December 2017, relative to the same period in 2016.
• Monthly Active Users (MAUs). We define a monthly active user as a registered Facebook user who logged in and visited Facebook through our websiteor a mobile device, or used our Messenger application (and is also a registered Facebook user), in the last 30 days as of the date of measurement. MAUsare a measure of the size of our global active user community.
As of December 31, 2017 , we had 2.13 billion MAUs, an increase of 14% from December 31, 2016 . Users in India, Indonesia, and Vietnam representedkey sources of growth in 2017 , relative to the same period in 2016.
36
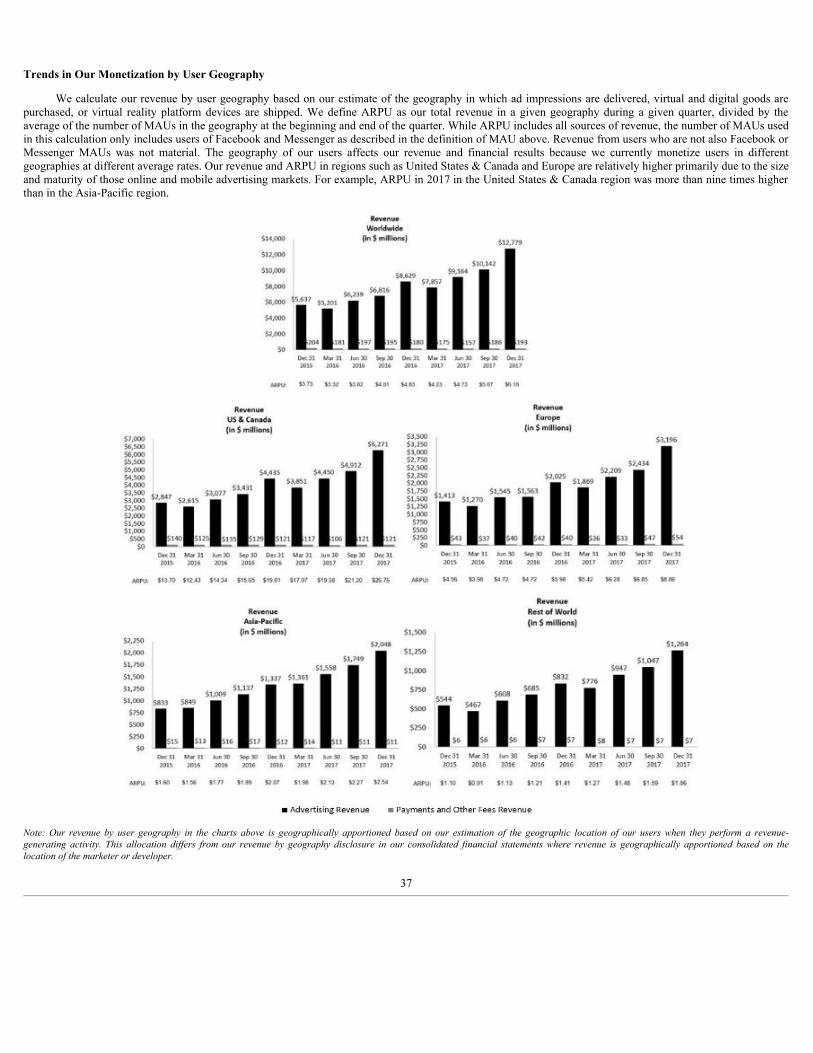
Trends in Our Monetization by User Geography
We calculate our revenue by user geography based on our estimate of the geography in which ad impressions are delivered, virtual and digital goods arepurchased, or virtual reality platform devices are shipped. We define ARPU as our total revenue in a given geography during a given quarter, divided by theaverage of the number of MAUs in the geography at the beginning and end of the quarter. While ARPU includes all sources of revenue, the number of MAUs usedin this calculation only includes users of Facebook and Messenger as described in the definition of MAU above. Revenue from users who are not also Facebook orMessenger MAUs was not material. The geography of our users affects our revenue and financial results because we currently monetize users in differentgeographies at different average rates. Our revenue and ARPU in regions such as United States & Canada and Europe are relatively higher primarily due to the sizeand maturity of those online and mobile advertising markets. For example, ARPU in 2017 in the United States & Canada region was more than nine times higherthan in the Asia-Pacific region.
Note: Our revenue by user geography in the charts above is geographically apportioned based on our estimation of the geographic location of our users when they perform a revenue-generating activity. This allocation differs from our revenue by geography disclosure in our consolidated financial statements where revenue is geographically apportioned based on thelocation of the marketer or developer.
37

For 2017 , worldwide ARPU was $20.21 , an increase of 26% from 2016 . Over this period, ARPU increased by 41% in Europe, 36% in United States &Canada, 33% in Rest of World, and 22% in Asia-Pacific. In addition, user growth was more rapid in geographies with relatively lower ARPU, such as Asia-Pacificand Rest of World. We expect that user growth in the future will be primarily concentrated in those regions where ARPU is relatively lower, such that worldwideARPU may continue to increase at a slower rate relative to ARPU in any geographic region, or potentially decrease even if ARPU increases in each geographicregion.
38

Critical Accounting Policies and Estimates
Our consolidated financial statements are prepared in accordance with U.S. generally accepted accounting principles (GAAP). The preparation of theseconsolidated financial statements requires us to make estimates and assumptions that affect the reported amounts of assets, liabilities, revenue, costs and expenses,and related disclosures. We evaluate our estimates and assumptions on an ongoing basis. Our estimates are based on historical experience and various otherassumptions that we believe to be reasonable under the circumstances. Our actual results could differ from these estimates under different assumptions orconditions.
An accounting policy is deemed to be critical if it requires an accounting estimate to be made based on assumptions about matters that are highly uncertainat the time the estimate is made, if different estimates reasonably could have been used, or if changes in the estimate that are reasonably possible could materiallyimpact the financial statements. We believe that the assumptions and estimates associated with income taxes, loss contingencies, and business combinations andvaluation of goodwill and other acquired intangible assets have the greatest potential impact on our consolidated financial statements. Therefore, we consider theseto be our critical accounting policies and estimates. For further information on all of our significant accounting policies, see Note 1 — Summary of SignificantAccounting Policies in the accompanying notes to consolidated financial statements included in Part II, Item 8, "Financial Statements and Supplementary Data" ofthis Annual Report on Form 10-K.
Income Taxes
We are subject to income taxes in the United States and numerous foreign jurisdictions. Significant judgment is required in determining our provision forincome taxes and income tax assets and liabilities, including evaluating uncertainties in the application of accounting principles and complex tax laws.
We record a provision for income taxes for the anticipated tax consequences of the reported results of operations using the asset and liability method. Underthis method, we recognize deferred income tax assets and liabilities for the expected future tax consequences of temporary differences between the financialreporting and tax bases of assets and liabilities, as well as for loss and tax credit carryforwards. Deferred tax assets and liabilities are measured using the tax ratesthat are expected to apply to taxable income for the years in which those tax assets and liabilities are expected to be realized or settled. We recognize the deferredincome tax effects of a change in tax rates in the period of the enactment. We record a valuation allowance to reduce our deferred tax assets to the net amount thatwe believe is more likely than not to be realized.
We recognize tax benefits from uncertain tax positions only if we believe that it is more likely than not that the tax position will be sustained on examinationby the taxing authorities based on the technical merits of the position. These uncertain tax positions include our estimates for transfer pricing that have beendeveloped based upon analyses of appropriate arms-length prices. Similarly, our estimates related to uncertain tax positions concerning research tax credits arebased on an assessment of whether our available documentation corroborating the nature of our activities supporting the tax credits will be sufficient. Although webelieve that we have adequately reserved for our uncertain tax positions (including net interest and penalties), we can provide no assurance that the final taxoutcome of these matters will not be materially different. We make adjustments to these reserves in accordance with the income tax accounting guidance whenfacts and circumstances change, such as the closing of a tax audit or the refinement of an estimate. To the extent that the final tax outcome of these matters isdifferent from the amounts recorded, such differences will affect the provision for income taxes in the period in which such determination is made, and could havea material impact on our financial condition and operating results.
On December 22, 2017, the 2017 Tax Cuts and Jobs Act (the Tax Act) was enacted into law and the new legislation contains several key tax provisions thataffected us, including a one-time mandatory transition tax on accumulated foreign earnings and a reduction of the corporate income tax rate to 21% effectiveJanuary 1, 2018, among others. We are required to recognize the effect of the tax law changes in the period of enactment, such as determining the transition tax,remeasuring our U.S. deferred tax assets and liabilities as well as reassessing the net realizability of our deferred tax assets and liabilities. In December 2017, theSEC staff issued Staff Accounting Bulletin No. 118, Income Tax Accounting Implications of the Tax Cuts and Jobs Act (SAB 118), which allows us to recordprovisional amounts during a measurement period not to extend beyond one year of the enactment date. Since the Tax Act was passed late in the fourth quarter of2017, and ongoing guidance and accounting interpretation are expected over the next 12 months, we consider the accounting of the transition tax, deferred tax re-measurements, and other items to be incomplete due to the forthcoming guidance and our ongoing analysis of final year-end data and tax positions. We expect tocomplete our analysis within the measurement period in accordance with SAB 118.
Loss Contingencies
We are involved in legal proceedings, claims, and regulatory, tax or government inquiries and investigations that arise in the ordinary course of business.Certain of these matters include speculative claims for substantial or indeterminate amounts of damages. We record a liability when we believe that it is bothprobable that a loss has been incurred and the amount can be reasonably estimated. If we determine that a loss is reasonably possible and the loss or range of losscan be estimated, we disclose the possible loss in the accompanying notes to the consolidated financial statements.
39

We review the developments in our contingencies that could affect the amount of the provisions that have been previously recorded, and the matters andrelated reasonably possible losses disclosed. We make adjustments to our provisions and changes to our disclosures accordingly to reflect the impact ofnegotiations, settlements, rulings, advice of legal counsel, and updated information. Significant judgment is required to determine both the probability and theestimated amount of loss.
The outcome of litigation is inherently uncertain. Therefore, if one or more of these matters were resolved against us for amounts in excess of management'sexpectations, our results of operations and financial condition, including in a particular reporting period in which any such outcome becomes probable andestimable, could be materially adversely affected. See Note 9 — Commitments and Contingencies and Note 12 — Income Taxes of the accompanying notes to ourconsolidated financial statements included in Part II, Item 8, "Financial Statements and Supplementary Data" and Part I, Item 3, "Legal Proceedings" of thisAnnual Report on Form 10-K for additional information regarding these contingencies.
Business Combinations and Valuation of Goodwill and Other Acquired Intangible Assets
We allocate the fair value of purchase consideration to the tangible assets acquired, liabilities assumed, and intangible assets acquired based on theirestimated fair values. The excess of the fair value of purchase consideration over the fair values of these identifiable assets and liabilities is recorded as goodwill.Such valuations require management to make significant estimates and assumptions, especially with respect to intangible assets. Significant estimates in valuingcertain intangible assets include, but are not limited to, future expected cash flows from acquired users, acquired technology, and trade names from a marketparticipant perspective, useful lives, and discount rates. Management’s estimates of fair value are based upon assumptions believed to be reasonable, but which areinherently uncertain and unpredictable and, as a result, actual results may differ from estimates. During the measurement period, which is not to exceed one yearfrom the acquisition date, we may record adjustments to the assets acquired and liabilities assumed, with the corresponding offset to goodwill. Upon the conclusionof the measurement period, any subsequent adjustments are recorded to earnings.
We review goodwill for impairment at least annually or more frequently if events or changes in circumstances would more likely than not reduce the fairvalue of our single reporting unit below its carrying value. As of December 31, 2017 , no impairment of goodwill has been identified.
Acquired finite-lived intangible assets are amortized over their estimated useful lives. We evaluate the recoverability of our intangible assets for possibleimpairment whenever events or circumstances indicate that the carrying amount of such assets may not be recoverable. The evaluation is performed at the lowestlevel for which identifiable cash flows are largely independent of the cash flows of other assets and liabilities. Recoverability of these assets is measured by acomparison of the carrying amounts to the future undiscounted cash flows the assets are expected to generate. If such review indicates that the carrying amount ofproperty and equipment and intangible assets is not recoverable, the carrying amount of such assets is reduced to fair value. We have not recorded any significantimpairment charges during the years presented.
In addition to the recoverability assessment, we routinely review the remaining estimated useful lives of our finite-lived intangible assets. If we reduce theestimated useful life assumption for any asset, the remaining unamortized balance would be amortized over the revised estimated useful life.
40

Components of Results of Operations
Revenue
Advertising. We generate substantially all of our revenue from advertising. Our advertising revenue is generated by displaying ad products on Facebook,Instagram, Messenger, and third-party affiliated websites or mobile applications. Marketers pay for ad products either directly or through their relationships withadvertising agencies, based on the number of impressions delivered or the number of actions, such as clicks, taken by users. We recognize revenue from the displayof impression-based ads in the contracted period in which the impressions are delivered. Impressions are considered delivered when an ad is displayed to a user.We recognize revenue from the delivery of action-based ads in the period in which a user takes the action the marketer contracted for. The number of ads we showis subject to methodological changes as we continue to evolve our ads business and the structure of our ads products. We calculate price per ad as total ad revenuedivided by the number of ads delivered, representing the effective price paid per impression by a marketer regardless of their desired objective such as impressionor action. For advertising revenue arrangements where we are not the primary obligor, we recognize revenue on a net basis.
Payments and other fees. Payments revenue is comprised of the net fee we receive from developers using our Payments infrastructure. Our other feesrevenue, which has not been significant in recent periods, consists primarily of revenue from the delivery of virtual reality platform devices, and various othersources.
Cost of Revenue and Operating Expenses
Cost of revenue. Our cost of revenue consists primarily of expenses associated with the delivery and distribution of our products. These include expensesrelated to the operation of our data centers, such as facility and server equipment depreciation, salaries, benefits, and share-based compensation for employees onour operations teams, and energy and bandwidth costs. Cost of revenue also includes costs associated with partner arrangements, including content acquisitioncosts, credit card and other transaction fees related to processing customer transactions, cost of virtual reality platform device inventory sold, and amortization ofintangible assets.
Research and development. Research and development expenses consist primarily of share-based compensation, salaries, and benefits for employees onour engineering and technical teams who are responsible for building new products as well as improving existing products. We expense all of our research anddevelopment costs as they are incurred.
Marketing and sales. Our marketing and sales expenses consist of salaries, share-based compensation, and benefits for our employees engaged in sales,sales support, marketing, business development, and customer service functions. Our marketing and sales expenses also include marketing and promotionalexpenditures, professional services such as content reviewers, as well as amortization of intangible assets.
General and administrative. The majority of our general and administrative expenses consist of salaries, benefits, and share-based compensation forcertain of our executives as well as our legal, finance, human resources, corporate communications and policy, and other administrative employees. In addition,general and administrative expenses include legal-related costs and professional services.
41

Results of Operations
The following tables set forth our consolidated statements of income data:
Year Ended December 31,
2017 2016 2015 (in millions)Consolidated Statements of Income Data: Revenue $ 40,653 $ 27,638 $ 17,928Costs and expenses:
Cost of revenue 5,454 3,789 2,867Research and development 7,754 5,919 4,816Marketing and sales 4,725 3,772 2,725General and administrative 2,517 1,731 1,295
Total costs and expenses 20,450 15,211 11,703Income from operations 20,203 12,427 6,225Interest and other income (expense), net 391 91 (31)Income before provision for income taxes 20,594 12,518 6,194Provision for income taxes 4,660 2,301 2,506
Net income $ 15,934 $ 10,217 $ 3,688
Share-based compensation expense included in costs and expenses:
Year Ended December 31,
2017 2016 2015 (in millions)Cost of revenue $ 178 $ 113 $ 81Research and development 2,820 2,494 2,350Marketing and sales 436 368 320General and administrative 289 243 218
Total share-based compensation expense $ 3,723 $ 3,218 $ 2,969
The following tables set forth our consolidated statements of income data (as a percentage of revenue):
Year Ended December 31,
2017 2016 2015
Consolidated Statements of Income Data: Revenue 100 % 100 % 100 %Costs and expenses:
Cost of revenue 13 14 16Research and development 19 21 27Marketing and sales 12 14 15General and administrative 6 6 7
Total costs and expenses 50 55 65Income from operations 50 45 35Interest and other income (expense), net 1 — —Income before provision for income taxes 51 45 35Provision for income taxes 11 8 14
Net income 39 % 37 % 21 %
42

Share-based compensation expense included in costs and expenses (as a percentage of revenue):
Year Ended December 31,
2017 2016 2015
Cost of revenue —% —% —%Research and development 7 9 13Marketing and sales 1 1 2General and administrative 1 1 1
Total share-based compensation expense 9% 12% 17%
Revenue
Year Ended December 31, 2017 vs 2016
% Change 2016 vs 2015 %
Change
2017 2016 2015
(in millions) Advertising $ 39,942 $ 26,885 $ 17,079 49 % 57 %Payments and other fees 711 753 849 (6)% (11)%
Total revenue $ 40,653 $ 27,638 $ 17,928 47 % 54 %
2017 Compared to 2016 . Revenue in 2017 increased $13.02 billion , or 47% , compared to 2016 . The increase was mostly due to an increase in advertisingrevenue, partially offset by the continuing decline in Payments revenue.
The most important factor driving advertising revenue growth was an increase in revenue from ads on mobile devices. For 2017 , we estimate that mobileadvertising revenue represented approximately 88% of total advertising revenue, as compared with approximately 83% in 2016 . Factors that influenced ouradvertising revenue growth in 2017 included (i) an increase in average price per ad, (ii) an increase in users and their engagement, and (iii) an increase in thenumber and frequency of ads displayed on mobile devices. We anticipate that advertising revenue growth will continue to be driven primarily by price rather thanincreases in the number and frequency of ads displayed.
In 2017 compared to 2016 , the average price per ad increased by 29%, as compared with approximately 5% in 2016, and the number of ads deliveredincreased by 15%, as compared with approximately 50% in 2016. The increase in average price per ad was driven by an increase in demand for our ad inventory;factors contributing to this include an increase in spend from existing marketers and an increase in the number of marketers actively advertising on our platform aswell as the quality, relevance, and performance of those ads. The increase in the ads delivered was driven by an increase in users and their engagement and anincrease in the number and frequency of ads displayed on News Feed, partially offset by increasing user engagement with video content and other product changes.
Advertising spending is traditionally seasonally strong in the fourth quarter of each year. We believe that this seasonality in advertising spending affects ourquarterly results, which generally reflect significant growth in advertising revenue between the third and fourth quarters and a decline in advertising spendingbetween the fourth and subsequent first quarters. For instance, our advertising revenue increased 26%, 27%, and 31% between the third and fourth quarters of 2017, 2016 , and 2015 , respectively, while advertising revenue for both the first quarters of 2017 and 2016 declined 9% and 8% compared to the fourth quarters of2016 and 2015 , respectively.
Payments and other fees revenue in 2017 decreased $42 million , or 6% , compared to 2016 . The decline in Payments and other fees revenue was primarilydue to decreased Payments revenue from games played on personal computers, partially offset by the revenue from the delivery of virtual reality platform devices.We anticipate Payments revenue will continue to decline, and such decline will be offset by increases in revenue from various other sources.
2016 Compared to 2015 . Revenue in 2016 increased $9.71 billion, or 54%, compared to 2015. The increase was mostly due to an increase in advertisingrevenue.
The most important factor driving advertising revenue growth was an increase in revenue from ads in News Feed. For 2016, we estimate that mobileadvertising revenue represented approximately 83% of total advertising revenue, as compared with approximately 77% in 2015. Factors that influenced ouradvertising revenue growth in 2016 included (i) an increase in demand for our ad inventory, in part driven by an increase in the number of marketers activelyadvertising on Facebook, (ii) an increase in user growth and engagement, and (iii) an increase in the number and frequency of ads displayed in News Feed, as wellas the quality,
43
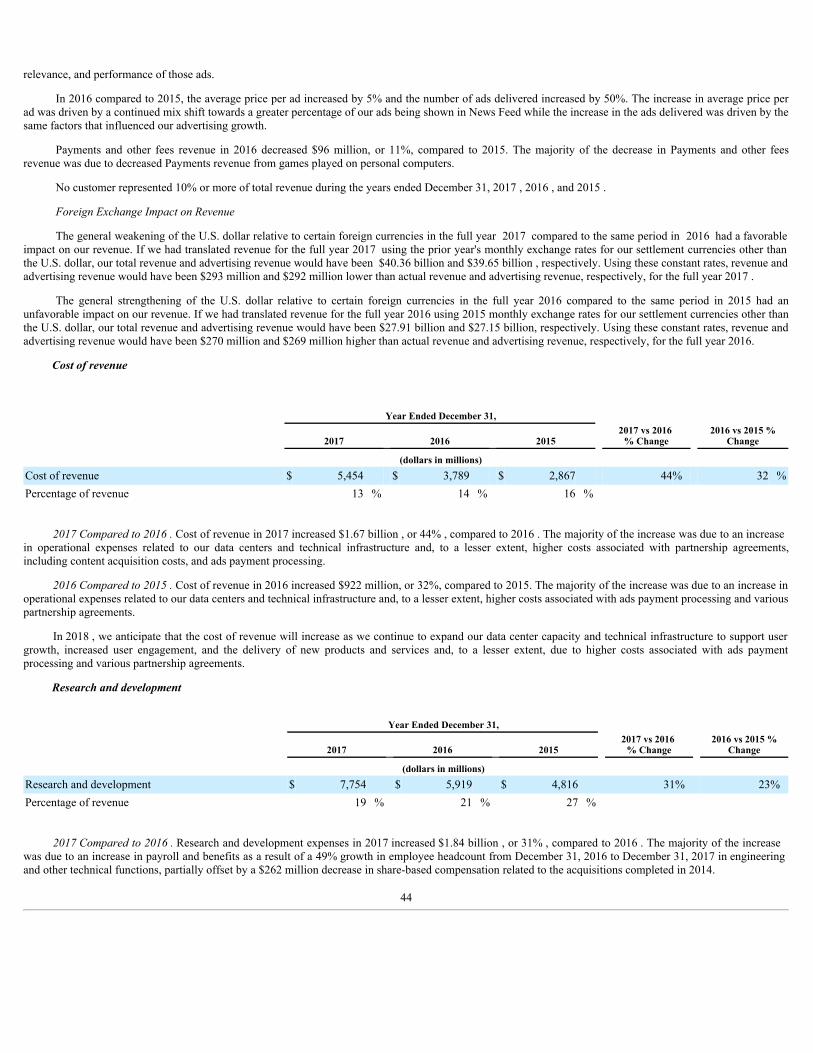
relevance, and performance of those ads.
In 2016 compared to 2015, the average price per ad increased by 5% and the number of ads delivered increased by 50%. The increase in average price perad was driven by a continued mix shift towards a greater percentage of our ads being shown in News Feed while the increase in the ads delivered was driven by thesame factors that influenced our advertising growth.
Payments and other fees revenue in 2016 decreased $96 million, or 11%, compared to 2015. The majority of the decrease in Payments and other feesrevenue was due to decreased Payments revenue from games played on personal computers.
No customer represented 10% or more of total revenue during the years ended December 31, 2017 , 2016 , and 2015 .
Foreign Exchange Impact on Revenue
The general weakening of the U.S. dollar relative to certain foreign currencies in the full year 2017 compared to the same period in 2016 had a favorableimpact on our revenue. If we had translated revenue for the full year 2017 using the prior year's monthly exchange rates for our settlement currencies other thanthe U.S. dollar, our total revenue and advertising revenue would have been $40.36 billion and $39.65 billion , respectively. Using these constant rates, revenue andadvertising revenue would have been $293 million and $292 million lower than actual revenue and advertising revenue, respectively, for the full year 2017 .
The general strengthening of the U.S. dollar relative to certain foreign currencies in the full year 2016 compared to the same period in 2015 had anunfavorable impact on our revenue. If we had translated revenue for the full year 2016 using 2015 monthly exchange rates for our settlement currencies other thanthe U.S. dollar, our total revenue and advertising revenue would have been $27.91 billion and $27.15 billion, respectively. Using these constant rates, revenue andadvertising revenue would have been $270 million and $269 million higher than actual revenue and advertising revenue, respectively, for the full year 2016.
Cost of revenue
Year Ended December 31,
2017 2016 2015 2017 vs 2016
% Change 2016 vs 2015 %
Change
(dollars in millions) Cost of revenue $ 5,454 $ 3,789 $ 2,867 44% 32 %Percentage of revenue 13 % 14 % 16 %
2017 Compared to 2016 . Cost of revenue in 2017 increased $1.67 billion , or 44% , compared to 2016 . The majority of the increase was due to an increasein operational expenses related to our data centers and technical infrastructure and, to a lesser extent, higher costs associated with partnership agreements,including content acquisition costs, and ads payment processing.
2016 Compared to 2015 . Cost of revenue in 2016 increased $922 million, or 32%, compared to 2015. The majority of the increase was due to an increase inoperational expenses related to our data centers and technical infrastructure and, to a lesser extent, higher costs associated with ads payment processing and variouspartnership agreements.
In 2018 , we anticipate that the cost of revenue will increase as we continue to expand our data center capacity and technical infrastructure to support usergrowth, increased user engagement, and the delivery of new products and services and, to a lesser extent, due to higher costs associated with ads paymentprocessing and various partnership agreements.
Research and development
Year Ended December 31,
2017 2016 2015 2017 vs 2016
% Change 2016 vs 2015 %
Change
(dollars in millions) Research and development $ 7,754 $ 5,919 $ 4,816 31% 23%Percentage of revenue 19 % 21 % 27 %
2017 Compared to 2016 . Research and development expenses in 2017 increased $1.84 billion , or 31% , compared to 2016 . The majority of the increasewas due to an increase in payroll and benefits as a result of a 49% growth in employee headcount from December 31, 2016 to December 31, 2017 in engineeringand other technical functions, partially offset by a $262 million decrease in share-based compensation related to the acquisitions completed in 2014.
44

2016 Compared to 2015 . Research and development expenses in 2016 increased $1.10 billion, or 23%, compared to 2015. The majority of the increase wasdue to an increase in payroll and benefits as a result of a 34% growth in employee headcount from December 31, 2015 to December 31, 2016 in engineering andother technical functions. Additionally, our equipment and related expenses in 2016 to support our research and development efforts increased $170 millioncompared to 2015.
In 2018 , we plan to continue to hire software engineers and other technical employees, and to increase our investment to support our research anddevelopment initiatives.
Marketing and sales
Year Ended December 31,
2017 2016 2015 2017 vs 2016
% Change 2016 vs 2015 %
Change
(dollars in millions) Marketing and sales $ 4,725 $ 3,772 $ 2,725 25% 38 %Percentage of revenue 12 % 14 % 15 %
2017 Compared to 2016 . Marketing and sales expenses in 2017 increased $953 million , or 25% , compared to 2016 . The majority of the increase was dueto increases in payroll and benefits expenses as a result of a 35% increase in employee headcount from December 31, 2016 to December 31, 2017 in our marketingand sales functions, and increases in our consulting and other professional service fees. Additionally, our marketing expenses increased $196 million in 2017,compared to 2016.
2016 Compared to 2015 . Marketing and sales expenses in 2016 increased $1.05 billion, or 38%, compared to 2015. The majority of the increase was due topayroll and benefits expenses as a result of a 28% increase in employee headcount from December 31, 2015 to December 31, 2016 in our marketing and salesfunctions, and increases in our consulting and other professional service fees. Additionally, our marketing expenses increased $344 million in 2016, compared to2015.
In 2018 , we plan to continue the hiring of marketing and sales employees to support our marketing, sales, and partnership efforts and to increase ourinvestment in security efforts through the hiring of employees and content reviewers.
General and administrative
Year Ended December 31,
2017 2016 2015 2017 vs 2016
% Change 2016 vs 2015 %
Change
(dollars in millions) General and administrative $ 2,517 $ 1,731 $ 1,295 45% 34%Percentage of revenue 6 % 6 % 7 %
2017 Compared to 2016 . General and administrative expenses in 2017 increased $786 million , or 45% , compared to 2016 . The majority of the increasewas due to an increase in payroll and benefits expenses as a result of a 58% increase in employee headcount from December 31, 2016 to December 31, 2017 ingeneral and administrative functions, and to a lesser extent, higher legal-related costs.
2016 Compared to 2015 . General and administrative expenses in 2016 increased $436 million, or 34%, compared to 2015. The majority of the increase wasdue to an increase in payroll and benefits expenses as a result of a 43% increase in employee headcount from December 31, 2015 to December 31, 2016 in generaland administrative functions, and to a lesser extent, higher professional services and legal fees.
In 2018 , we plan to continue to increase general and administrative expenses to support overall company growth.
45
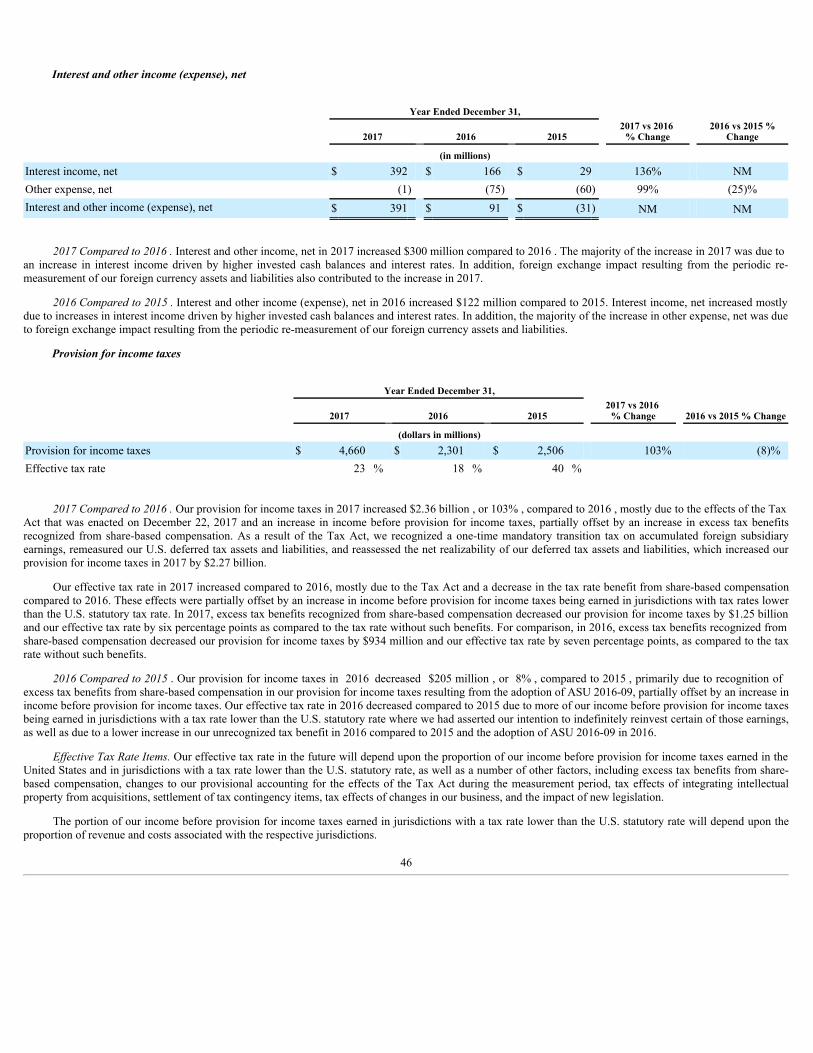
Interest and other income (expense), net
Year Ended December 31,
2017 2016 2015 2017 vs 2016
% Change 2016 vs 2015 %
Change
(in millions) Interest income, net $ 392 $ 166 $ 29 136% NMOther expense, net (1) (75) (60) 99% (25)%Interest and other income (expense), net $ 391 $ 91 $ (31) NM NM
2017 Compared to 2016 . Interest and other income, net in 2017 increased $300 million compared to 2016 . The majority of the increase in 2017 was due toan increase in interest income driven by higher invested cash balances and interest rates. In addition, foreign exchange impact resulting from the periodic re-measurement of our foreign currency assets and liabilities also contributed to the increase in 2017.
2016 Compared to 2015 . Interest and other income (expense), net in 2016 increased $122 million compared to 2015. Interest income, net increased mostlydue to increases in interest income driven by higher invested cash balances and interest rates. In addition, the majority of the increase in other expense, net was dueto foreign exchange impact resulting from the periodic re-measurement of our foreign currency assets and liabilities.
Provision for income taxes
Year Ended December 31,
2017 2016 2015 2017 vs 2016
% Change 2016 vs 2015 % Change
(dollars in millions) Provision for income taxes $ 4,660 $ 2,301 $ 2,506 103% (8)%Effective tax rate 23 % 18 % 40 %
2017 Compared to 2016 . Our provision for income taxes in 2017 increased $2.36 billion , or 103% , compared to 2016 , mostly due to the effects of the TaxAct that was enacted on December 22, 2017 and an increase in income before provision for income taxes, partially offset by an increase in excess tax benefitsrecognized from share-based compensation. As a result of the Tax Act, we recognized a one-time mandatory transition tax on accumulated foreign subsidiaryearnings, remeasured our U.S. deferred tax assets and liabilities, and reassessed the net realizability of our deferred tax assets and liabilities, which increased ourprovision for income taxes in 2017 by $2.27 billion.
Our effective tax rate in 2017 increased compared to 2016, mostly due to the Tax Act and a decrease in the tax rate benefit from share-based compensationcompared to 2016. These effects were partially offset by an increase in income before provision for income taxes being earned in jurisdictions with tax rates lowerthan the U.S. statutory tax rate. In 2017, excess tax benefits recognized from share-based compensation decreased our provision for income taxes by $1.25 billionand our effective tax rate by six percentage points as compared to the tax rate without such benefits. For comparison, in 2016, excess tax benefits recognized fromshare-based compensation decreased our provision for income taxes by $934 million and our effective tax rate by seven percentage points, as compared to the taxrate without such benefits.
2016 Compared to 2015 . Our provision for income taxes in 2016 decreased $205 million , or 8% , compared to 2015 , primarily due to recognition ofexcess tax benefits from share-based compensation in our provision for income taxes resulting from the adoption of ASU 2016-09, partially offset by an increase inincome before provision for income taxes. Our effective tax rate in 2016 decreased compared to 2015 due to more of our income before provision for income taxesbeing earned in jurisdictions with a tax rate lower than the U.S. statutory rate where we had asserted our intention to indefinitely reinvest certain of those earnings,as well as due to a lower increase in our unrecognized tax benefit in 2016 compared to 2015 and the adoption of ASU 2016-09 in 2016.
Effective Tax Rate Items. Our effective tax rate in the future will depend upon the proportion of our income before provision for income taxes earned in theUnited States and in jurisdictions with a tax rate lower than the U.S. statutory rate, as well as a number of other factors, including excess tax benefits from share-based compensation, changes to our provisional accounting for the effects of the Tax Act during the measurement period, tax effects of integrating intellectualproperty from acquisitions, settlement of tax contingency items, tax effects of changes in our business, and the impact of new legislation.
The portion of our income before provision for income taxes earned in jurisdictions with a tax rate lower than the U.S. statutory rate will depend upon theproportion of revenue and costs associated with the respective jurisdictions.
46

Integrating intellectual property from acquisitions into our business generally involves intercompany transactions that have the impact of increasing ourprovision for income taxes. Consequently, our provision for income taxes and our effective tax rate may initially increase in the period of an acquisition andintegration. The magnitude of this impact will depend upon the specific type, size, and taxing jurisdictions of the intellectual property as well as the relativecontribution to income in subsequent periods.
The accounting for share-based compensation will increase or decrease our effective tax rate based upon the difference between our share-basedcompensation expense and the deductions taken on our tax return which depends upon the stock price at the time of employee award vesting.
Absent unanticipated events and unexpected effects of the Tax Act, we anticipate our effective tax rate in 2018 will be lower than it was in 2017. Our 2017effective tax rate was significantly affected by the Tax Act. In addition, since we recognize excess tax benefits on a discrete basis, we anticipate that our effectivetax rate will vary from quarter to quarter depending on our stock price in each period. If our stock price remains constant to the January 31, 2018 price, weanticipate that our effective tax rate will be lower in the first quarter of 2018 and increase in the remaining quarters throughout the year.
Unrecognized Tax Benefits. As of December 31, 2017, we had net unrecognized tax benefits of $2.75 billion which were accrued as other liabilities. Theseunrecognized tax benefits were predominantly accrued for uncertainties related to transfer pricing with our foreign subsidiaries, which includes licensing ofintellectual property, providing services and other transactions, as well as for uncertainties with our research tax credits. The ultimate settlement of the liabilitieswill depend upon resolution of tax audits, litigation, or events that would otherwise change the assessment of such items. Based upon the status of litigationdescribed below and the current status of tax audits in various jurisdictions, we do not anticipate a significant impact to such amounts within the next 12 months.
In July 2016, we received a Statutory Notice of Deficiency (Notice) from the IRS related to transfer pricing with our foreign subsidiaries in conjunction withthe examination of the 2010 tax year. While the Notice applies only to the 2010 tax year, the IRS states that it will also apply its position for tax years subsequentto 2010, which, if the IRS prevails in its position, could result in an additional federal tax liability of an estimated aggregate amount of approximately $3.0 billionto $5.0 billion in excess of the amounts in our originally filed U.S. return, plus interest and any penalties asserted. We do not agree with the position of the IRS andhave filed a petition in the United States Tax Court challenging the Notice. We have previously accrued an estimated unrecognized tax benefit consistent with theguidance in ASC 740 that is lower than the potential additional federal tax liability of $3.0 billion to $5.0 billion in excess of the amounts in our originally filedU.S. return, plus interest and penalties. If the IRS prevails in the assessment of additional tax due based on its position, the assessed tax, interest and penalties, ifany, could have a material adverse impact on our financial position, results of operations, and cash flows. As of December 31, 2017, we have not resolved thismatter and proceedings continue in the United States Tax Court. We believe that adequate amounts have been reserved for any adjustments that may ultimatelyresult from these examinations.
We expect to continue to accrue unrecognized tax benefits for certain recurring tax positions and anticipate that the amount for future quarters accrued willbe similar to amounts accrued in 2017. Absent unanticipated events, we do not expect our unrecognized tax benefits will have a significant impact on our effectivetax rate in 2018.
47

Quarterly Results of Operations Data
The following tables set forth our unaudited quarterly consolidated statements of income data in dollars and as a percentage of total revenue for each of theeight quarters in the period ended December 31, 2017 . We have prepared the quarterly consolidated statements of income data on a basis consistent with theaudited consolidated financial statements included in Part II, Item 8, "Financial Statements and Supplementary Data" in this Annual Report on Form 10-K. In theopinion of management, the financial information reflects all adjustments, consisting only of normal recurring adjustments, which we consider necessary for a fairpresentation of this data. This information should be read in conjunction with the audited consolidated financial statements and related notes included in Part II,Item 8, "Financial Statements and Supplementary Data" in this Annual Report on Form 10-K. The results of historical periods are not necessarily indicative of theresults of operations for any future period.
Three Months Ended
Dec 31,
2017 Sep 30,
2017 Jun 30,
2017 Mar 31,
2017 Dec 31,
2016 Sep 30,
2016 Jun 30,
2016 Mar 31,
2016 (in millions)Consolidated Statements of Income Data: Revenue:
Advertising $ 12,779 $ 10,142 $ 9,164 $ 7,857 $ 8,629 $ 6,816 $ 6,239 $ 5,201Payments and other fees 193 186 157 175 180 195 197 181
Total revenue 12,972 10,328 9,321 8,032 8,809 7,011 6,436 5,382Costs and expenses:
Cost of revenue 1,611 1,448 1,237 1,159 1,047 987 917 838Research and development 1,949 2,052 1,919 1,834 1,563 1,542 1,471 1,343Marketing and sales 1,374 1,170 1,124 1,057 1,118 926 901 826General and administrative 686 536 640 655 515 439 413 365
Total costs and expenses 5,620 5,206 4,920 4,705 4,243 3,894 3,702 3,372Income from operations 7,352 5,122 4,401 3,327 4,566 3,117 2,734 2,010Interest and other income (expense), net 110 114 87 81 (33) 47 20 56Income before provision for income taxes 7,462 5,236 4,488 3,408 4,533 3,164 2,754 2,066Provision for income taxes 3,194 529 594 344 965 537 471 328Net income $ 4,268 $ 4,707 $ 3,894 $ 3,064 $ 3,568 $ 2,627 $ 2,283 $ 1,738Less: Net income attributable to participating
securities 2 3 4 5 7 7 7 6Net income attributable to Class A and Class B
common stockholders $ 4,266 $ 4,704 $ 3,890 $ 3,059 $ 3,561 $ 2,620 $ 2,276 $ 1,732Earnings per share attributable to Class A and Class
B common stockholders: Basic $ 1.47 $ 1.62 $ 1.34 $ 1.06 $ 1.24 $ 0.91 $ 0.80 $ 0.61
Diluted $ 1.44 $ 1.59 $ 1.32 $ 1.04 $ 1.21 $ 0.90 $ 0.78 $ 0.60
Share-based compensation expense included in costs and expenses:
Three Months Ended
Dec 31,
2017 Sep 30,
2017 Jun 30,
2017 Mar 31,
2017 Dec 31,
2016 Sep 30,
2016 Jun 30,
2016 Mar 31,
2016 (in millions)Cost of revenue $ 50 $ 47 $ 47 $ 34 $ 32 $ 30 $ 29 $ 22Research and development 587 776 787 670 641 636 631 586Marketing and sales 106 114 120 96 96 95 95 82General and administrative 71 73 78 67 62 63 62 56
Total share-based compensation expense $ 814 $ 1,010 $ 1,032 $ 867 $ 831 $ 824 $ 817 $ 746
48

Three Months Ended
Dec 31,
2017 Sep 30,
2017 Jun 30,
2017 Mar 31,
2017 Dec 31,
2016 Sep 30,
2016 Jun 30,
2016 Mar 31,
2016 (as a percentage of total revenue)
Consolidated Statements of IncomeData:
Revenue:
Advertising 99 % 98 % 98 % 98 % 98 % 97 % 97 % 97 %Payments and other fees 1 2 2 2 2 3 3 3
Total revenue 100 % 100 % 100 % 100 % 100 % 100 % 100 % 100 %Costs and expenses:
Cost of revenue 12 14 13 14 12 14 14 16Research and development 15 20 21 23 18 22 23 25Marketing and sales 11 11 12 13 13 13 14 15General and administrative 5 5 7 8 6 6 6 7
Total costs and expenses 43 50 53 59 48 56 58 63Income from operations 57 50 47 41 52 44 42 37Interest and other income (expense),
net 1 1 1 1 — 1 — 1Income before provision for income
taxes 58 51 48 42 51 45 43 38Provision for income taxes 25 5 6 4 11 8 7 6
Net income 33 % 46 % 42 % 38 % 41 % 37 % 35 % 32 %Less: Net income attributable to
participating securities — — — — — — — —Net income attributable to Class A and
Class B common stockholders 33% 46% 42% 38% 40% 37% 35% 32%
Share-based compensation expense included in costs and expenses:
Three Months Ended
Dec 31,
2017 Sep 30,
2017 Jun 30,
2017 Mar 31,
2017 Dec 31,
2016 Sep 30,
2016 Jun 30,
2016 Mar 31,
2016 (as a percentage of total revenue)Cost of revenue —% —% 1% —% —% —% —% —%Research and development 5 8 8 8 7 9 10 11Marketing and sales 1 1 1 1 1 1 1 2General and administrative 1 1 1 1 1 1 1 1
Total share-based compensation expense 6% 10% 11% 11% 9% 12% 13% 14%
49

Liquidity and Capital Resources
Year Ended December 31,
2017 2016 2015 (in millions)Consolidated Statements of Cash Flows Data: Net cash provided by operating activities $ 24,216 $ 16,108 $ 10,320Net cash used in investing activities (20,038) (11,739) (9,434)Net cash used in financing activities (5,235) (310) (139)Purchases of property and equipment (6,733) (4,491) (2,523)Depreciation and amortization 3,025 2,342 1,945Share-based compensation 3,723 3,218 2,960
Our principal sources of liquidity are our cash and cash equivalents, marketable securities, and cash generated from operations. Cash and cash equivalents,and marketable securities consist primarily of cash on deposit with banks, investments in money market funds, and investments in U.S. government securities, U.S.government agency securities, and corporate debt securities. Cash and cash equivalents, and marketable securities were $41.71 billion as of December 31, 2017 ,an increase of $12.26 billion from December 31, 2016 , mostly due to $24.22 billion of cash generated from operations, partially offset by $6.73 billion forpurchases of property and equipment, $3.25 billion of taxes paid related to net share settlement of equity awards, and $1.98 billion for repurchases of our Class Acommon stock.
Cash paid for income taxes (net of refunds) was $2.12 billion for the year ended December 31, 2017 . We recorded a provisional tax liability of $2.9 billionrelating to the one-time mandatory transition tax on our accumulated foreign earnings which we intend to pay over an eight-year payment schedule as prescribedby the Tax Act.
In May 2016, we entered into a $2.0 billion senior unsecured revolving credit facility, and any amounts outstanding under the facility will be due andpayable on May 20, 2021. As of December 31, 2017 , no amounts had been drawn down and we were in compliance with the covenants under this credit facility.
In November 2016, our board of directors authorized a $6.0 billion share repurchase program of our Class A common stock that commenced in 2017 anddoes not have an expiration date. The timing and actual number of shares repurchased depend on a variety of factors, including price, general business and marketconditions, and other investment opportunities, and shares may be repurchased through open market purchases or privately negotiated transactions, includingthrough the use of trading plans intended to qualify under Rule 10b5-1 under the Securities Exchange Act of 1934, as amended. During 2017, we repurchased andsubsequently retired approximately 13 million shares of our Class A common stock for an aggregate amount of approximately $2.07 billion .
In January 2017, we began funding withholding taxes due on employee equity awards by net share settlement, rather than our previous approach ofrequiring employees to sell shares of our common stock to cover taxes upon vesting of such awards. In 2017, we paid $3.25 billion of taxes related to the net sharesettlement of equity awards.
As of December 31, 2017 , $15.89 billion of the $41.71 billion in cash and cash equivalents and marketable securities was held by our foreign subsidiaries.The Tax Act imposes a mandatory transition tax on accumulated foreign earnings and eliminates U.S. taxes on foreign subsidiary distributions. As a result,earnings in foreign jurisdictions are available for distribution to the U.S. without incremental U.S. taxes.
We currently anticipate that our available funds, credit facility, and cash flow from operations will be sufficient to meet our operational cash needs for theforeseeable future.
Cash Provided by Operating Activities
Cash flow from operating activities during 2017 mostly consisted of net income, adjusted for certain non-cash items, such as share-based compensationexpense of $3.72 billion and total depreciation and amortization of $3.03 billion . The increase in cash flow from operating activities during 2017 compared to2016 , was mostly due to an increase in net income, adjusted for certain non-cash items, such as depreciation and amortization and share-based compensationexpense. Due to the enactment of the Tax Act in 2017, we recorded a provisional tax liability of $2.9 billion relating to the one-time mandatory transition tax onour accumulated foreign earnings,which also contributed to the increase in 2017 compared to 2016.
50

Cash flow from operating activities during 2016 mostly consisted of net income, adjusted for certain non-cash items, such as share-based compensationexpense of $3.22 billion and total depreciation and amortization of $2.34 billion. The increase in cash flow from operating activities during 2016 compared to2015, was mostly due to an increase in net income, including the impact of ASU 2016-09 adoption, as adjusted for depreciation and amortization, deferred incometaxes, and share-based compensation expense.
Cash flow from operating activities during 2015 mostly consisted of net income, adjusted for certain non-cash items, such as share-based compensationexpense of $2.96 billion, total depreciation and amortization of $1.95 billion, and tax benefit from share-based award activity of $1.72 billion , which had beenreclassified from financing activity as a result of ASU 2016-09 adoption. The increase in cash flow from operating activities during 2015 compared to 2014, wasprimarily due to an increase in net income, as adjusted for share-based compensation expense, and higher income tax payable as of December 31, 2015 comparedto 2014.
Cash Used in Investing Activities
Cash used in investing activities during 2017 mostly resulted from $13.25 billion for net purchases of marketable securities and $6.73 billion for capitalexpenditures as we continued to invest in servers, data centers, office buildings, and network infrastructure. The increase in cash used in investing activities during2017 compared to 2016 was due to increases in net purchases of marketable securities and capital expenditures.
Cash used in investing activities during 2016 mostly resulted from $7.19 billion for net purchases of marketable securities and $4.49 billion for capitalexpenditures as we continued to invest in data centers, servers, office buildings, and network infrastructure. The increase in cash used in investing activities during2016 compared to 2015 was mostly due to increases in capital expenditures and net purchases of marketable securities.
Cash used in investing activities during 2015 primarily resulted from $6.70 billion for net purchases of marketable securities and $2.52 billion for capitalexpenditures as we continued to invest in servers, data centers, network infrastructure, and office buildings. The increase in cash used in investing activities during2015 compared to 2014 was mainly due to increases in net purchases of marketable securities, partially offset by a decrease in acquisitions of businesses andpurchases of intangible assets.
We anticipate making capital expenditures in 2018 of approximately $14.0 billion to $15.0 billion.
Cash Used in Financing Activities
Cash used in financing activities during 2017 mostly consisted of $3.25 billion of taxes paid related to net share settlement of equity awards, and $1.98billion paid for repurchases of our Class A common stock. The increase in cash used in financing activities during 2017 compared to 2016 was mostly due to taxespaid related to net share settlement of equity awards and repurchases of our Class A common stock that commenced in 2017 .
Cash used in financing activities during 2016 mostly consisted of principal payments on capital lease and other financing obligations. The increase in cashused in financing activities was due to full repayment of our capital lease and other financing obligations in 2016.
Cash used in financing activities during 2015 primarily consisted of principal payments on capital lease obligations. The decrease in cash used in financingactivities was primarily due to lower principal payments related to our capital lease transactions.
Off-Balance Sheet Arrangements
We did not have any off-balance sheet arrangements as of December 31, 2017 .
51

Contractual Obligations
Our principal commitments consist of obligations under operating leases for offices, land, facilities, colocations, and data centers, as well as contractualcommitments related to network infrastructure and data center operations. The following table summarizes our commitments to settle contractual obligations incash as of December 31, 2017 (in millions):
Payment Due by Period
Total Less than
1 Year 1-3
Years 3-5
Years More than
5 Years
Operating lease obligations $ 4,644 $ 409 $ 934 $ 878 $ 2,423Financing obligation - building in progress - leasedfacility (1) 195 — 16 30 149Other contractual commitments (2) 2,953 1,830 346 100 677
Total contractual obligations $ 7,792 $ 2,239 $ 1,296 $ 1,008 $ 3,249(1) Financing obligation - building in progress - leased facility represents our commitments to lease certain office buildings that are currently under construction. As of December 31, 2017 ,
$72 million of the total obligation was recorded as a liability and is included in other liabilities on our consolidated balance sheets. See Note 9 of the accompanying notes to ourconsolidated financial statements for additional information related to this financing obligation.
(2) Other contractual commitments primarily relate to network infrastructure and our data center operations.
As part of the normal course of the business, we may enter into multi-year agreements to purchase certain network components that do not specify a fixed orminimum price commitment or to purchase renewable energy that do not specify a fixed or minimum volume commitment. These agreements are generally enteredinto in order to secure either volume or price. Using projected market prices or expected volume consumption, the total estimated spend is approximately $4.0billion. The ultimate spend under these agreements may vary and will be based on prevailing market prices or actual volume purchased.
In addition, our other liabilities include $2.75 billion related to uncertain tax positions as of December 31, 2017 . Due to uncertainties in the timing of thecompletion of tax audits, the timing of the resolution of these positions is uncertain and we are unable to make a reasonably reliable estimate of the timing ofpayments in individual years beyond 12 months. As a result, this amount is not included in the above contractual obligations table.
Contingencies
We are involved in legal proceedings, claims, and regulatory, tax or government inquiries and investigations. We record a provision for a liability when webelieve that it is both probable that a liability has been incurred, and that the amount can be reasonably estimated. If we determine that a loss is reasonably possibleand the loss or range of loss can be estimated, we disclose the possible loss in the accompanying notes to the consolidated financial statements. Significantjudgment is required to determine both probability and the estimated amount of loss. Such matters are inherently unpredictable and subject to significantuncertainties, some of which are beyond our control. Should any of these estimates and assumptions change or prove to be incorrect, it could have a materialimpact on our results of operations, financial position, and cash flows.
See Note 9 — Commitments and Contingencies and Note 12 — Income Taxes of the accompanying notes to our consolidated financial statements includedin Part II, Item 8, "Financial Statements and Supplementary Data" and Part I, Item 3, "Legal Proceedings" of this Annual Report on Form 10-K for additionalinformation regarding these contingencies.
Recently Issued Accounting Pronouncements
In May 2014, the Financial Accounting Standards Board (FASB) issued Accounting Standards Update No. 2014-09, Revenue from Contracts withCustomers (Topic 606) (ASU 2014-09), which amends the existing accounting standards for revenue recognition. In August 2015, the FASB issued ASU No.2015-14, Revenue from Contracts with Customers (Topic 606): Deferral of the Effective Date , which delays the effective date of ASU 2014-09 by one year. TheFASB also agreed to allow entities to choose to adopt the standard as of the original effective date. In March 2016, the FASB issued Accounting Standards UpdateNo. 2016-08, Revenue from Contracts with Customers (Topic 606): Principal versus Agent Considerations (Reporting Revenue Gross versus Net) (ASU 2016-08)which clarifies the implementation guidance on principal versus agent considerations. The guidance includes indicators to assist an entity in determining whether itcontrols a specified good or service before it is transferred to the customers. The new standard further requires new disclosures about contracts with customers,including the significant judgments the company has made when applying the guidance. We will adopt the new standard effective January 1, 2018, using themodified retrospective transition method. We finalized our analysis and the adoption of this guidance will not have a material impact on our consolidated financialstatements and our internal controls over financial reporting.
In February 2016, the FASB issued Accounting Standards Update No. 2016-02, Leases (Topic 842) (ASU 2016-02), which generally requires companies torecognize operating and financing lease liabilities and corresponding right-of-use assets on the balance sheet. This
52

guidance will be effective for us in the first quarter of 2019 on a modified retrospective basis and early adoption is permitted. We will adopt the new standardeffective January 1, 2019. We have selected a lease accounting system and we are in the process of implementing such system as well as evaluating the use of theoptional practical expedients. While we continue to evaluate the effect of adopting this guidance on our consolidated financial statements and related disclosures,we expect our operating leases, as disclosed in Note 9 — Commitments and Contingencies in the accompanying notes to the consolidated financial statementsincluded in Part II, Item 8, "Financial Statements and Supplementary Data" of this Annual Report on Form 10-K, will be subject to the new standard. We willrecognize right-of-use assets and operating lease liabilities on our consolidated balance sheets upon adoption, which will increase our total assets and liabilities.
In October 2016, the FASB issued Accounting Standards Update No. 2016-16, Income Taxes (Topic 740): Intra-Entity Transfers Other than Inventory(ASU 2016-16), which requires companies to recognize the income-tax consequences of an intra-entity transfer of an asset other than inventory when the transferoccurs, rather than when the asset has been sold to an outside party. We will adopt the new standard effective January 1, 2018, using the modified retrospectivetransition approach through a cumulative-effect adjustment to retained earnings as of the effective date. A cumulative-effect adjustment will capture the write-offof income tax consequences deferred from past intra-entity transfers involving assets other than inventory, new deferred tax assets, and other liabilities for amountsnot currently recognized under U.S. GAAP. Based on transactions up to December 31, 2017, we do not expect the adoption of this guidance to have a materialimpact on our consolidated financial statements.
In November 2016, the FASB issued Accounting Standards Update No. 2016-18, Statement of Cash Flows (Topic 230): Restricted Cash (ASU 2016-18),which requires companies to include amounts generally described as restricted cash and restricted cash equivalents in cash and cash equivalents when reconcilingbeginning-of-period and end-of-period total amounts shown on the statement of cash flows. We will adopt the new standard effective January 1, 2018, using theretrospective transition approach for all periods presented. We do not expect the adoption of this guidance to have a material impact on our consolidated financialstatements.
In January 2017, the FASB issued Accounting Standards Update No. 2017-01, Business Combinations (Topic 805): Clarifying the Definition of a Business (ASU 2017-01), which revises the definition of a business and provides new guidance in evaluating when a set of transferred assets and activities is a business. Wewill adopt the new standard effective January 1, 2018, on a prospective basis and do not expect the standard to have a material impact on our consolidated financialstatements.
In January 2017, the FASB issued Accounting Standards Update No. 2017-04, Intangibles - Goodwill and Other (Topic 350): Simplifying the Test forGoodwill Impairment (ASU 2017-04), which eliminates step two from the goodwill impairment test. Under ASU 2017-04, an entity should recognize animpairment charge for the amount by which the carrying amount of a reporting unit exceeds its fair value up to the amount of goodwill allocated to that reportingunit. This guidance will be effective for us in the first quarter of 2020 on a prospective basis, and early adoption is permitted. We do not expect the standard tohave a material impact on our consolidated financial statements.
53

Item 7A. Quantitative and Qualitative Disclosures About Market Risk
We are exposed to market risks, including changes to foreign currency exchange rates, interest rates, and inflation.
Foreign Currency Exchange Risk
We have foreign currency risks related to our revenue and operating expenses denominated in currencies other than the U.S. dollar, primarily the Euro. Ingeneral, we are a net receiver of currencies other than the U.S. dollar. Accordingly, changes in exchange rates, and in particular a strengthening of the U.S. dollar,have in the past, and may in the future, negatively affect our revenue and other operating results as expressed in U.S. dollars.
We have experienced and will continue to experience fluctuations in our net income as a result of transaction gains or losses related to revaluing certaincurrent asset and current liability balances that are denominated in currencies other than the functional currency of the entities in which they are recorded. At thistime we have not entered into, but in the future we may enter into, derivatives or other financial instruments in an attempt to hedge our foreign currency exchangerisk. It is difficult to predict the effect hedging activities would have on our results of operations. We recognized foreign currency losses of $6 million , $76 million, and $66 million in 2017 , 2016 , and 2015 , respectively.
Interest Rate Sensitivity
Our exposure to changes in interest rates relates primarily to interest earned and market value on our cash and cash equivalents, and marketable securities.
Our cash and cash equivalents and marketable securities consist of cash, certificates of deposit, time deposits, money market funds, U.S. governmentsecurities, U.S. government agency securities, and corporate debt securities . Our investment policy and strategy are focused on preservation of capital andsupporting our liquidity requirements. Changes in U.S. interest rates affect the interest earned on our cash and cash equivalents and marketable securities, and themarket value of those securities. A hypothetical 100 basis point increase in interest rates would have resulted in a decrease of $611 million and $403 million in themarket value of our available-for-sale debt securities as of December 31, 2017 and December 31, 2016 , respectively. Any realized gains or losses resulting fromsuch interest rate changes would only occur if we sold the investments prior to maturity.
54

Item 8. Financial Statements and Supplementary Data
FACEBOOK, INC.
INDEX TO CONSOLIDATED FINANCIAL STATEMENTS
Reports of Independent Registered Public Accounting Firm 56 Consolidated Financial Statements: Consolidated Balance Sheets 58 Consolidated Statements of Income 59 Consolidated Statements of Comprehensive Income 60 Consolidated Statements of Stockholders' Equity 61 Consolidated Statements of Cash Flows 62 Notes to Consolidated Financial Statements 64
The supplementary financial information required by this Item 8, is included in Part II, Item 7 under the caption "Quarterly Results of Operations Data," which isincorporated herein by reference.
Report of Independent Registered Public Accounting Firm
To the Stockholders and Board of Directors of Facebook, Inc.
Opinion on the Financial Statements
We have audited the accompanying consolidated balance sheets of Facebook, Inc. (the Company) as of December 31, 2017 and 2016 , and the related consolidatedstatements of income, comprehensive income, stockholders' equity and cash flows for each of the three years in the period ended December 31, 2017 , and therelated notes (collectively referred to as the "financial statements"). In our opinion, the financial statements present fairly, in all material respects, the consolidatedfinancial position of the Company at December 31, 2017 and 2016 , and the consolidated results of its operations and its cash flows for each of the three years inthe period ended December 31, 2017 , in conformity with U.S. generally accepted accounting principles.
We also have audited, in accordance with the standards of the Public Company Accounting Oversight Board (United States) (PCAOB), the Company's internalcontrol over financial reporting as of December 31, 2017 , based on criteria established in Internal Control – Integrated Framework issued by the Committee ofSponsoring Organizations of the Treadway Commission (2013 framework) and our report dated February 1, 2018 expressed an unqualified opinion thereon.
Basis for Opinion
These financial statements are the responsibility of the Company's management. Our responsibility is to express an opinion on the Company’s financial statementsbased on our audits. We are a public accounting firm registered with the PCAOB and are required to be independent with respect to the Company in accordancewith the U.S. federal securities laws and the applicable rules and regulations of the Securities and Exchange Commission and the PCAOB.
We conducted our audits in accordance with the standards of the PCAOB. Those standards require that we plan and perform the audit to obtain reasonableassurance about whether the financial statements are free of material misstatement, whether due to error or fraud. Our audits included performing procedures toassess the risks of material misstatement of the financial statements, whether due to error or fraud, and performing procedures that respond to those risks. Suchprocedures included examining, on a test basis, evidence regarding the amounts and disclosures in the financial statements. Our audits also included evaluating theaccounting principles used and significant estimates made by management, as well as evaluating the overall presentation of the financial statements. We believethat our audits provide a reasonable basis for our opinion.
/s/ Ernst & Young LLP
We have served as the Company’s auditor since 2007.San Francisco, CaliforniaFebruary 1, 2018
56

Report of Independent Registered Public Accounting Firm
To the Stockholders and Board of Directors of Facebook, Inc.
Opinion on Internal Control over Financial Reporting
We have audited Facebook, Inc.’s internal control over financial reporting as of December 31, 2017 , based on criteria established in Internal Control – IntegratedFramework issued by the Committee of Sponsoring Organizations of the Treadway Commission (2013 framework) (the COSO criteria). In our opinion, Facebook,Inc. (the Company) maintained, in all material respects, effective internal control over financial reporting as of December 31, 2017 , based on the COSO criteria.
We also have audited, in accordance with the standards of the Public Company Accounting Oversight Board (United States), the consolidated balance sheets ofFacebook, Inc. as of December 31, 2017 and 2016 , and the related consolidated statements of income, comprehensive income, stockholders' equity and cash flowsfor each of the three years in the period ended December 31, 2017 of the Company and our report dated February 1, 2018 expressed an unqualified opinionthereon.
Basis for Opinion
The Company’s management is responsible for maintaining effective internal control over financial reporting and for its assessment of the effectiveness of internalcontrol over financial reporting included in the accompanying Management’s Report on Internal Control over Financial Reporting. Our responsibility is to expressan opinion on the Company’s internal control over financial reporting based on our audit. We are a public accounting firm registered with the PCAOB and arerequired to be independent with respect to the Company in accordance with the U.S. federal securities laws and the applicable rules and regulations of theSecurities and Exchange Commission and the PCAOB.
We conducted our audit in accordance with the standards of the PCAOB. Those standards require that we plan and perform the audit to obtain reasonable assuranceabout whether effective internal control over financial reporting was maintained in all material respects.
Our audit included obtaining an understanding of internal control over financial reporting, assessing the risk that a material weakness exists, testing and evaluatingthe design and operating effectiveness of internal control based on the assessed risk, and performing such other procedures as we considered necessary in thecircumstances. We believe that our audit provides a reasonable basis for our opinion.
Definition and Limitations of Internal Control Over Financial Reporting
A company’s internal control over financial reporting is a process designed to provide reasonable assurance regarding the reliability of financial reporting and thepreparation of financial statements for external purposes in accordance with generally accepted accounting principles. A company’s internal control over financialreporting includes those policies and procedures that (1) pertain to the maintenance of records that, in reasonable detail, accurately and fairly reflect thetransactions and dispositions of the assets of the company; (2) provide reasonable assurance that transactions are recorded as necessary to permit preparation offinancial statements in accordance with generally accepted accounting principles, and that receipts and expenditures of the company are being made only inaccordance with authorizations of management and directors of the company; and (3) provide reasonable assurance regarding prevention or timely detection ofunauthorized acquisition, use, or disposition of the company’s assets that could have a material effect on the financial statements.
Because of its inherent limitations, internal control over financial reporting may not prevent or detect misstatements. Also, projections of any evaluation ofeffectiveness to future periods are subject to the risk that controls may become inadequate because of changes in conditions, or that the degree of compliance withthe policies or procedures may deteriorate.
/s/ Ernst & Young LLP
San Francisco, CaliforniaFebruary 1, 2018
57

FACEBOOK, INC.CONSOLIDATED BALANCE SHEETS
(In millions, except for number of shares and par value)
December 31,
2017 2016Assets
Current assets:
Cash and cash equivalents $ 8,079 $ 8,903Marketable securities 33,632 20,546Accounts receivable, net of allowances of $189 and $94 as of December 31, 2017 and 2016, respectively 5,832 3,993Prepaid expenses and other current assets 1,020 959
Total current assets 48,563 34,401Property and equipment, net 13,721 8,591Intangible assets, net 1,884 2,535Goodwill 18,221 18,122Other assets 2,135 1,312
Total assets $ 84,524 $ 64,961
Liabilities and stockholders' equity
Current liabilities:
Accounts payable $ 380 $ 302Partners payable 390 280Accrued expenses and other current liabilities 2,892 2,203Deferred revenue and deposits 98 90
Total current liabilities 3,760 2,875Other liabilities 6,417 2,892
Total liabilities 10,177 5,767Commitments and contingencies Stockholders' equity:
Common stock, $0.000006 par value; 5,000 million Class A shares authorized, 2,397 million and 2,354 million sharesissued and outstanding, as of December 31, 2017 and December 31, 2016, respectively; 4,141 million Class B sharesauthorized, 509 million and 538 million shares issued and outstanding, as of December 31, 2017 and December 31,2016, respectively. — —Additional paid-in capital 40,584 38,227Accumulated other comprehensive loss (227) (703)Retained earnings 33,990 21,670
Total stockholders' equity 74,347 59,194
Total liabilities and stockholders' equity $ 84,524 $ 64,961
See Accompanying Notes to Consolidated Financial Statements.
58

FACEBOOK, INC.CONSOLIDATED STATEMENTS OF INCOME
(In millions, except per share amounts)
Year Ended December 31,
2017 2016 2015
Revenue $ 40,653 $ 27,638 $ 17,928Costs and expenses:
Cost of revenue 5,454 3,789 2,867Research and development 7,754 5,919 4,816Marketing and sales 4,725 3,772 2,725General and administrative 2,517 1,731 1,295
Total costs and expenses 20,450 15,211 11,703Income from operations 20,203 12,427 6,225Interest and other income (expense), net 391 91 (31)Income before provision for income taxes 20,594 12,518 6,194Provision for income taxes 4,660 2,301 2,506Net income $ 15,934 $ 10,217 $ 3,688Less: Net income attributable to participating securities 14 29 19
Net income attributable to Class A and Class B common stockholders $ 15,920 $ 10,188 $ 3,669Earnings per share attributable to Class A and Class B common stockholders:
Basic $ 5.49 $ 3.56 $ 1.31
Diluted $ 5.39 $ 3.49 $ 1.29Weighted average shares used to compute earnings per share attributable to Class A andClass B common stockholders:
Basic 2,901 2,863 2,803
Diluted 2,956 2,925 2,853Share-based compensation expense included in costs and expenses:
Cost of revenue $ 178 $ 113 $ 81Research and development 2,820 2,494 2,350Marketing and sales 436 368 320General and administrative 289 243 218
Total share-based compensation expense $ 3,723 $ 3,218 $ 2,969
See Accompanying Notes to Consolidated Financial Statements.
59

FACEBOOK, INC.CONSOLIDATED STATEMENTS OF COMPREHENSIVE INCOME
(In millions)
Year Ended December 31,
2017 2016 2015
Net income $ 15,934 $ 10,217 $ 3,688Other comprehensive income (loss):
Change in foreign currency translation adjustment, net of tax 566 (152) (202)Change in unrealized gain/loss on available-for-sale investments and other, net of tax (90) (96) (25)
Comprehensive income $ 16,410 $ 9,969 $ 3,461
See Accompanying Notes to Consolidated Financial Statements.
60
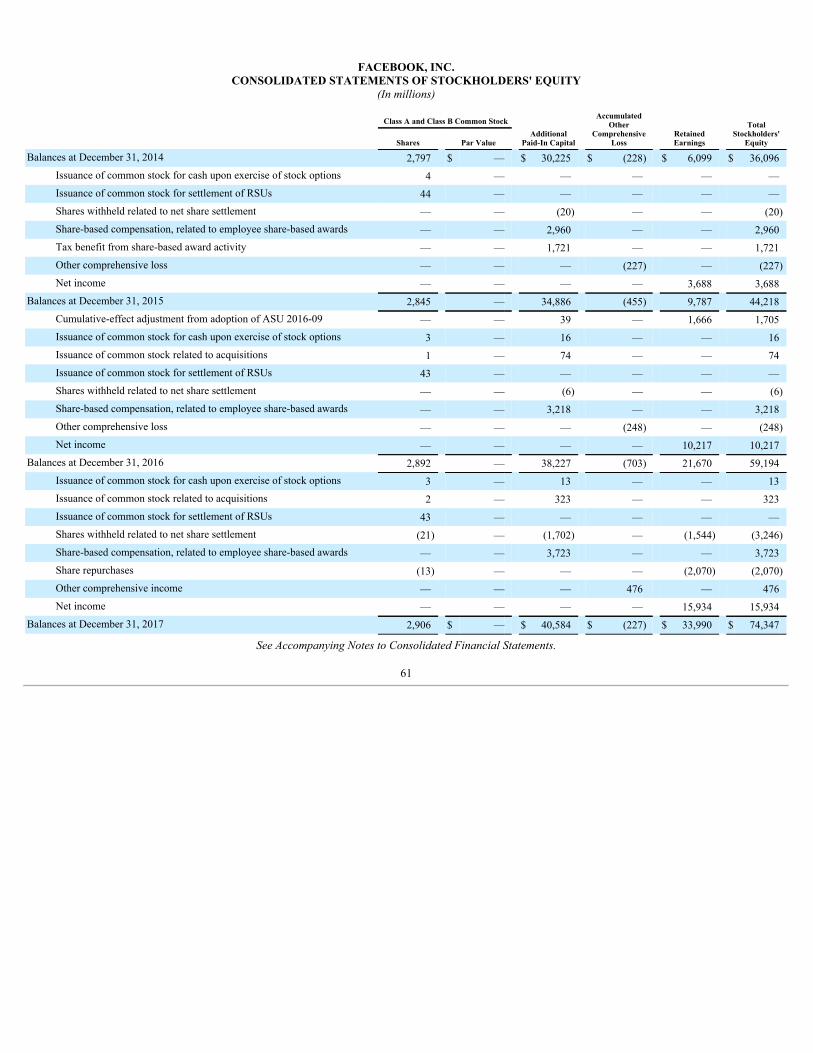
FACEBOOK, INC.CONSOLIDATED STATEMENTS OF STOCKHOLDERS' EQUITY
(In millions)
Class A and Class B Common Stock Additional
Paid-In Capital
AccumulatedOther
ComprehensiveLoss Retained
Earnings Total
Stockholders'Equity Shares Par Value
Balances at December 31, 2014 2,797 $ — $ 30,225 $ (228) $ 6,099 $ 36,096Issuance of common stock for cash upon exercise of stock options 4 — — — — —Issuance of common stock for settlement of RSUs 44 — — — — —Shares withheld related to net share settlement — — (20) — — (20)Share-based compensation, related to employee share-based awards — — 2,960 — — 2,960Tax benefit from share-based award activity — — 1,721 — — 1,721Other comprehensive loss — — — (227) — (227)Net income — — — — 3,688 3,688
Balances at December 31, 2015 2,845 — 34,886 (455) 9,787 44,218Cumulative-effect adjustment from adoption of ASU 2016-09 — — 39 — 1,666 1,705Issuance of common stock for cash upon exercise of stock options 3 — 16 — — 16Issuance of common stock related to acquisitions 1 — 74 — — 74Issuance of common stock for settlement of RSUs 43 — — — — —Shares withheld related to net share settlement — — (6) — — (6)Share-based compensation, related to employee share-based awards — — 3,218 — — 3,218Other comprehensive loss — — — (248) — (248)Net income — — — — 10,217 10,217
Balances at December 31, 2016 2,892 — 38,227 (703) 21,670 59,194Issuance of common stock for cash upon exercise of stock options 3 — 13 — — 13Issuance of common stock related to acquisitions 2 — 323 — — 323Issuance of common stock for settlement of RSUs 43 — — — — —Shares withheld related to net share settlement (21) — (1,702) — (1,544) (3,246)Share-based compensation, related to employee share-based awards — — 3,723 — — 3,723Share repurchases (13) — — — (2,070) (2,070)Other comprehensive income — — — 476 — 476Net income — — — — 15,934 15,934
Balances at December 31, 2017 2,906 $ — $ 40,584 $ (227) $ 33,990 $ 74,347
See Accompanying Notes to Consolidated Financial Statements.
61

FACEBOOK, INC.CONSOLIDATED STATEMENTS OF CASH FLOWS
(In millions)
Year Ended December 31,
2017 2016 2015Cash flows from operating activities
Net income $ 15,934 $ 10,217 $ 3,688Adjustments to reconcile net income to net cash provided by operating activities:
Depreciation and amortization 3,025 2,342 1,945Share-based compensation 3,723 3,218 2,960Deferred income taxes (377) (457) (795)Tax benefit from share-based award activity — — 1,721Other 24 30 17
Changes in assets and liabilities: Accounts receivable (1,609) (1,489) (973)Prepaid expenses and other current assets (192) (159) (144)Other assets 154 14 (3)Accounts payable 43 14 18Partners payable 95 67 17Accrued expenses and other current liabilities 309 1,014 513Deferred revenue and deposits 4 35 (9)Other liabilities 3,083 1,262 1,365
Net cash provided by operating activities 24,216 16,108 10,320Cash flows from investing activities
Purchases of property and equipment (6,733) (4,491) (2,523)Purchases of marketable securities (25,682) (22,341) (15,938)Sales of marketable securities 9,444 13,894 6,928Maturities of marketable securities 2,988 1,261 2,310Acquisitions of businesses, net of cash acquired, and purchases of intangible assets (122) (123) (313)Change in restricted cash and deposits 67 61 102Net cash used in investing activities (20,038) (11,739) (9,434)
Cash flows from financing activities Taxes paid related to net share settlement of equity awards (3,246) (6) (20)Principal payments on capital lease and other financing obligations — (312) (119)Repurchases of Class A common stock (1,976) — —Other financing activities, net (13) 8 —Net cash used in financing activities (5,235) (310) (139)
Effect of exchange rate changes on cash and cash equivalents 233 (63) (155)Net (decrease) increase in cash and cash equivalents (824) 3,996 592Cash and cash equivalents at beginning of period 8,903 4,907 4,315
Cash and cash equivalents at end of period $ 8,079 $ 8,903 $ 4,907
See Accompanying Notes to Consolidated Financial Statements.
62

FACEBOOK, INC.CONSOLIDATED STATEMENTS OF CASH FLOWS
(In millions)
Year Ended December 31,
2017 2016 2015Supplemental cash flow data
Cash paid during the period for: Interest $ — $ 11 $ 10Income taxes, net $ 2,117 $ 1,210 $ 270
Non-cash investing and financing activities: Net change in accounts payable, accrued expenses and other current liabilities, and otherliabilities related to property and equipment additions $ 363 $ 272 $ 88Promissory note payable issued in connection with an acquisition $ — $ — $ 198Settlement of acquisition-related contingent consideration liability $ 102 $ 33 $ —Change in unsettled repurchases of Class A common stock $ 94 $ — $ —
See Accompanying Notes to Consolidated Financial Statements.
63

FACEBOOK, INC.NOTES TO CONSOLIDATED FINANCIAL STATEMENTS
Note 1. Summary of Significant Accounting Policies
Organization and Description of Business
Facebook was incorporated in Delaware in July 2004. Our mission is to give people the power to build community and bring the world closer together. Wegenerate substantially all of our revenue from advertising.
Basis of Presentation
We prepared the consolidated financial statements in accordance with U.S. generally accepted accounting principles (GAAP). The consolidated financialstatements include the accounts of Facebook, Inc. and its wholly owned subsidiaries. All intercompany balances and transactions have been eliminated.
Use of Estimates
Conformity with GAAP requires the use of estimates and judgments that affect the reported amounts in the consolidated financial statements andaccompanying notes. These estimates form the basis for judgments we make about the carrying values of our assets and liabilities, which are not readily apparentfrom other sources. We base our estimates and judgments on historical information and on various other assumptions that we believe are reasonable under thecircumstances. GAAP requires us to make estimates and judgments in several areas, including, but not limited to, those related to revenue recognition,collectability of accounts receivable, commitments and contingencies, fair value of financial instruments, fair value of acquired intangible assets and goodwill,useful lives of intangible assets and property and equipment, leases, and income taxes. These estimates are based on management's knowledge about current eventsand expectations about actions we may undertake in the future. Actual results could differ materially from those estimates.
Revenue Recognition
We recognize revenue once all of the following criteria have been met:
• persuasive evidence of an arrangement exists;
• delivery of our obligations to our customer has occurred;
• the price is fixed or determinable; and
• collectability of the related receivable is reasonably assured.
Revenue for the years ended December 31, 2017 , 2016 , and 2015 consists of the following (in millions):
Year Ended December 31,
2017 2016 2015
Advertising $ 39,942 $ 26,885 $ 17,079Payments and other fees 711 753 849
Total revenue $ 40,653 $ 27,638 $ 17,928
Advertising
Advertising revenue is generated by displaying ad products on Facebook, Instagram, Messenger, and third-party affiliated websites or mobile applications.The arrangements are evidenced by either online acceptance of terms and conditions or contracts that stipulate the types of advertising to be delivered, the timingand the pricing. Marketers pay for ad products either directly or through their relationships with advertising agencies, based on the number of impressionsdelivered or the number of actions, such as clicks, taken by our users.
We recognize revenue from the display of impression-based ads in the contracted period in which the impressions are delivered. Impressions are considereddelivered when an ad is displayed to users. We recognize revenue from the delivery of action-based ads in the period in which a user takes the action the marketercontracted for. For advertising revenue arrangements where we are not the primary obligor, we recognize revenue on a net basis.
Payments and Other Fees
Payments revenue is comprised of the net fee we receive from developers using our Payments infrastructure.
64

Other fees revenue, which was not material for all periods presented in our financial statements, consists primarily of revenue from the delivery of virtualreality platform devices and various other sources.
Revenue is recognized net of applicable sales and other taxes.
Cost of Revenue
Our cost of revenue consists primarily of expenses associated with the delivery and distribution of our products. These include expenses related to theoperation of our data centers, such as facility and server equipment depreciation, salaries, benefits, and share-based compensation for employees on our operationsteams, and energy and bandwidth costs. Cost of revenue also includes costs associated with partner arrangements, including content acquisition costs, credit cardand other transaction fees related to processing customer transactions, cost of virtual reality platform device inventory sold, and amortization of intangible assets.
Content acquisition costs
We license and pay to produce content in order to increase engagement on the platform. For licensed content, we capitalize the fee per title and record acorresponding liability at the gross amount of the liability when the license period begins, the cost of the title is known and the title is accepted and available forviewing. The amounts capitalized are limited to estimated net realizable value or fair value on a per title basis. The portion available for viewing within one year isrecognized as prepaid expenses and other current assets and the remaining portion as other assets on the consolidated balance sheets. For original programming, wecapitalize costs associated with the production, including development costs and direct costs, if those amounts are recoverable. Capitalized original programmingcosts are included in other assets on the consolidated balance sheets. Capitalized costs are amortized in cost of revenue on the consolidated statements of incomebased on historical and estimated viewing patterns.
Capitalized content costs are reviewed when an event or change in circumstances indicates a change in the expected usefulness of the content or that the fairvalue may be less than amortized cost. If such changes are identified, capitalized content assets will be stated at the lower of unamortized cost, net realizable valueor fair value. In addition, unamortized costs for assets that have been, or are expected to be, abandoned are written off.
Capitalized content acquisition costs have not been material to date.
Income Taxes
We record provision for income taxes for the anticipated tax consequences of the reported results of operations using the asset and liability method. Underthis method, we recognize deferred income tax assets and liabilities for the expected future consequences of temporary differences between the financial reportingand tax bases of assets and liabilities, as well as for loss and tax credit carryforwards. Deferred tax assets and liabilities are measured using the tax rates that areexpected to apply to taxable income for the years in which those tax assets and liabilities are expected to be realized or settled. We recognize the deferred incometax effects of a change in tax rates in the period of the enactment.
We record a valuation allowance to reduce our deferred tax assets to the net amount that we believe is more likely than not to be realized. We consider allavailable evidence, both positive and negative, including historical levels of income, expectations and risks associated with estimates of future taxable income andongoing tax planning strategies in assessing the need for a valuation allowance.
We recognize tax benefits from uncertain tax positions only if we believe that it is more likely than not that the tax position will be sustained on examinationby the taxing authorities based on the technical merits of the position. These uncertain tax positions include our estimates for transfer pricing that have beendeveloped based upon analyses of appropriate arms-length prices. Similarly, our estimates related to uncertain tax positions concerning research tax credits arebased on an assessment of whether our available documentation corroborating the nature of our activities supporting the tax credits will be sufficient. Although webelieve that we have adequately reserved for our uncertain tax positions (including net interest and penalties), we can provide no assurance that the final taxoutcome of these matters will not be materially different. We make adjustments to these reserves when facts and circumstances change, such as the closing of a taxaudit or the refinement of an estimate. To the extent that the final tax outcome of these matters is different from the amounts recorded, such differences will affectthe provision for income taxes in the period in which such determination is made and could have a material impact on our financial position, results of operations,and cash flows.
On December 22, 2017, the 2017 Tax Cuts and Jobs Act (the Tax Act) was enacted into law and the new legislation contains several key tax provisions thataffected us, including a one-time mandatory transition tax on accumulated foreign earnings and a reduction of the corporate income tax rate to 21% effectiveJanuary 1, 2018, among others. We are required to recognize the effect of the tax law changes in the period of enactment, such as determining the transition tax, re-measuring our U.S. deferred tax assets and liabilities as well as reassessing the net realizability of our deferred tax assets and liabilities. In December 2017, theSEC staff issued Staff Accounting Bulletin No. 118, Income Tax Accounting Implications of the Tax Cuts and Jobs Act (SAB 118), which allows us to recordprovisional amounts during a measurement period not to extend beyond one year of the enactment date. Since the Tax Act was passed late in the
65

fourth quarter of 2017, and ongoing guidance and accounting interpretation is expected over the next 12 months, we consider the accounting of the transition tax,deferred tax re-measurements, and other items to be incomplete due to the forthcoming guidance and our ongoing analysis of final year-end data and tax positions.We expect to complete our analysis within the measurement period in accordance with SAB 118. See Note 12 in these notes to the consolidated financialstatements for additional information.
Advertising Expense
Advertising costs are expensed when incurred and are included in marketing and sales expenses in the accompanying consolidated statements of income.We incurred advertising expenses of $324 million , $310 million , and $281 million for the years ended December 31, 2017 , 2016 , and 2015 , respectively.
Cash and Cash Equivalents, and Marketable Securities
Cash and cash equivalents primarily consist of cash on deposit with banks and investments in money market funds with maturities of 90 days or less fromthe date of purchase.
We hold investments in marketable securities, consisting of U.S. government securities, U.S. government agency securities, and corporate debt securities .We classify our marketable securities as available-for-sale investments in our current assets because they represent investments of cash available for currentoperations. Our available-for-sale investments are carried at estimated fair value with any unrealized gains and losses, net of taxes, included in accumulated othercomprehensive (loss) income in stockholders' equity. Unrealized losses are charged against interest and other income (expense), net when a decline in fair value isdetermined to be other-than-temporary. We have not recorded any such impairment charge in the periods presented. We determine realized gains or losses on saleof marketable securities on a specific identification method, and record such gains or losses as interest and other income (expense), net.
We classify certain restricted cash balances within prepaid expenses and other current assets and other assets on the accompanying consolidated balancesheets based upon the term of the remaining restrictions.
Fair Value of Financial Instruments
We apply fair value accounting for all financial assets and liabilities and non-financial assets and liabilities that are recognized or disclosed at fair value inthe financial statements on a recurring basis. We define fair value as the price that would be received from selling an asset or paid to transfer a liability in anorderly transaction between market participants at the measurement date. When determining the fair value measurements for assets and liabilities, which arerequired to be recorded at fair value, we consider the principal or most advantageous market in which we would transact and the market-based risk measurementsor assumptions that market participants would use in pricing the asset or liability, such as risks inherent in valuation techniques, transfer restrictions and credit risk.Fair value is estimated by applying the following hierarchy, which prioritizes the inputs used to measure fair value into three levels and bases the categorizationwithin the hierarchy upon the lowest level of input that is available and significant to the fair value measurement:
Level 1 -Quoted prices in active markets for identical assets or liabilities.
Level 2 -Observable inputs other than quoted prices in active markets for identical assets and liabilities, quoted prices for identical or similar assets orliabilities in inactive markets, or other inputs that are observable or can be corroborated by observable market data for substantially the full term of the assets orliabilities.
Level 3 -Inputs that are generally unobservable and typically reflect management's estimate of assumptions that market participants would use in pricing theasset or liability.
Our valuation techniques used to measure the fair value of money market funds and marketable debt securities were derived from quoted market prices oralternative pricing sources and models utilizing market observable inputs.
Our valuation technique used to measure the fair value of our contingent consideration liability as of December 31, 2016 was derived from the fair value ofour common stock on such date. We settled this contingent consideration liability in July 2017.
Accounts Receivable and Allowances
Accounts receivable are recorded and carried at the original invoiced amount less an allowance for any potential uncollectible amounts. We make estimatesfor the allowance for doubtful accounts and allowance for unbilled receivables based upon our assessment of various factors, including historical experience, theage of the accounts receivable balances, credit quality of our customers, current economic conditions, and other factors that may affect our ability to collect fromcustomers.
66

Property and Equipment
Property and equipment, which includes amounts recorded under capital leases, are stated at cost less accumulated depreciation. Depreciation is computedusing the straight-line method over the estimated useful lives of the assets or the remaining lease term, whichever is shorter.
The estimated useful lives of property and equipment are described below:
Property and Equipment Useful Life
Network equipment Three to 20 yearsBuildings Three to 30 yearsComputer software, office equipment and other Two to five yearsLeased equipment and leasehold improvements Lesser of estimated useful life or remaining lease term
Land and assets held within construction in progress are not depreciated. Construction in progress is related to the construction or development of propertyand equipment that have not yet been placed in service for their intended use.
The cost of maintenance and repairs is expensed as incurred. When assets are retired or otherwise disposed of, the cost and related accumulated depreciationare removed from their respective accounts, and any gain or loss on such sale or disposal is reflected in income from operations.
Lease Obligations
We enter into lease arrangements for office space, land, facilities, data centers, and equipment under non-cancelable capital and operating leases. Certain ofthe operating lease agreements contain rent holidays, rent escalation provisions, and purchase options. Rent holidays and rent escalation provisions are consideredin determining the straight-line rent expense to be recorded over the lease term. The lease term begins on the date of initial possession of the leased property forpurposes of recognizing lease expense on a straight-line basis over the term of the lease. We do not assume renewals in our determination of the lease term unlessthe renewals are deemed to be reasonably assured at lease inception.
We record assets and liabilities for the estimated construction costs incurred by third parties under build-to-suit lease arrangements to the extent that we areinvolved in the construction of structural improvements or bear construction risk prior to commencement of a lease.
Loss Contingencies
We are involved in legal proceedings, claims, and regulatory, tax or government inquiries and investigations that arise in the ordinary course of business.Certain of these matters include speculative claims for substantial or indeterminate amounts of damages. We record a liability when we believe that it is bothprobable that a loss has been incurred and the amount can be reasonably estimated. If we determine that a loss is reasonably possible and the loss or range of losscan be estimated, we disclose the possible loss in the notes to the consolidated financial statements.
We review the developments in our contingencies that could affect the amount of the provisions that has been previously recorded, and the matters andrelated possible losses disclosed. We make adjustments to our provisions and changes to our disclosures accordingly to reflect the impact of negotiations,settlements, rulings, advice of legal counsel, and updated information. Significant judgment is required to determine both the probability and the estimated amount.
Business Combinations
We allocate the fair value of purchase consideration to the tangible assets acquired, liabilities assumed and intangible assets acquired based on theirestimated fair values. The excess of the fair value of purchase consideration over the fair values of these identifiable assets and liabilities is recorded as goodwill.Such valuations require management to make significant estimates and assumptions, especially with respect to intangible assets. Significant estimates in valuingcertain intangible assets include, but are not limited to, future expected cash flows from acquired users, acquired technology, and trade names from a marketparticipant perspective, useful lives and discount rates. Management’s estimates of fair value are based upon assumptions believed to be reasonable, but which areinherently uncertain and unpredictable and, as a result, actual results may differ from estimates. During the measurement period, which is not to exceed one yearfrom the acquisition date, we may record adjustments to the assets acquired and liabilities assumed, with the corresponding offset to goodwill. Upon the conclusionof the measurement period, any subsequent adjustments are recorded to earnings.
67

Long-Lived Assets, Including Goodwill and Other Acquired Intangible Assets
We evaluate the recoverability of property and equipment and finite-lived intangible assets for possible impairment whenever events or circumstancesindicate that the carrying amount of such assets may not be recoverable. The evaluation is performed at the lowest level for which identifiable cash flows arelargely independent of the cash flows of other assets and liabilities. Recoverability of these assets is measured by a comparison of the carrying amounts to thefuture undiscounted cash flows the assets are expected to generate. If such review indicates that the carrying amount of property and equipment and intangibleassets is not recoverable, the carrying amount of such assets is reduced to fair value. We have not recorded any significant impairment charges during the yearspresented.
We review goodwill for impairment at least annually or more frequently if events or changes in circumstances would more likely than not reduce the fairvalue of our single reporting unit below its carrying value. As of December 31, 2017 , no impairment of goodwill has been identified.
Acquired finite-lived intangible assets are amortized on a straight-line basis over the estimated useful lives of the assets. We routinely review the remainingestimated useful lives of property and equipment and finite-lived intangible assets. If we reduce the estimated useful life assumption for any asset, the remainingunamortized balance is amortized or depreciated over the revised estimated useful life.
Deferred Revenue and Deposits
Deferred revenue consists of billings and payments from marketers in advance of revenue recognition. Deposits relate to unused balances held on behalf ofour users. Once this balance is utilized by a user, approximately 70% of this amount would then be payable to the developer and the balance would be recognizedas revenue.
Deferred revenue and deposits consists of the following (in millions):
December 31,
2017 2016
Deferred revenue $ 68 $ 62Deposits 30 28
Total deferred revenue and deposits $ 98 $ 90
Foreign Currency
Generally the functional currency of our international subsidiaries is the local currency. We translate the financial statements of these subsidiaries to U.S.dollars using month-end rates of exchange for assets and liabilities, and average rates of exchange for revenue, costs, and expenses. Translation gains and losses arerecorded in accumulated other comprehensive (loss) income as a component of stockholders' equity. As of December 31, 2017 and 2016 , we had a cumulativetranslation loss, net of tax of $16 million and $582 million , respectively. Net losses resulting from foreign exchange transactions were $6 million , $76 million ,and $66 million for the years ended December 31, 2017 , 2016 , and 2015 , respectively. These losses were recorded as interest and other income (expense), net inour consolidated statements of income.
Credit Risk and Concentration
Our financial instruments that are potentially subject to concentrations of credit risk consist primarily of cash, cash equivalents, restricted cash, marketablesecurities, and accounts receivable. The majority of cash equivalents consists of short-term money market funds, which are managed by reputable financialinstitutions. Marketable securities consist of investments in U.S. government securities, U.S. government agency securities, and corporate debt securities . Ourinvestment policy limits investment instruments to U.S. government securities, U.S. government agency securities, and corporate debt securities with the mainobjective of preserving capital and maintaining liquidity.
Accounts receivable are typically unsecured and are derived from revenue earned from customers across different industries and countries. We generated44% , 46% , and 47% of our revenue for the years ended December 31, 2017 , 2016 , and 2015 , respectively, from marketers and developers based in the UnitedStates, with the majority of revenue outside of the United States coming from customers located in western Europe, China, Canada, Australia, and Brazil.
We perform ongoing credit evaluations of our customers, and generally do not require collateral. We maintain an allowance for estimated credit losses.During the years ended December 31, 2017 , 2016 , and 2015 , our bad debt expenses were $48 million , $66 million , and $44 million , respectively. In the eventthat accounts receivable collection cycles deteriorate, our operating results and financial position could be adversely affected.
68

No customer represented 10% or more of total revenue during the years ended December 31, 2017 , 2016 , and 2015 .
Segments
Our chief operating decision-maker is our Chief Executive Officer who makes resource allocation decisions and assesses performance based on financialinformation presented on a consolidated basis. There are no segment managers who are held accountable by the chief operating decision-maker, or anyone else, foroperations, operating results, and planning for levels or components below the consolidated unit level. Accordingly, we have determined that we have a singlereportable segment and operating segment structure.
Recent Accounting Pronouncements Not Yet Adopted
In May 2014, the Financial Accounting Standards Board (FASB) issued Accounting Standards Update No. 2014-09, Revenue from Contracts withCustomers (Topic 606) (ASU 2014-09), which amends the existing accounting standards for revenue recognition. In August 2015, the FASB issued ASU No.2015-14, Revenue from Contracts with Customers (Topic 606): Deferral of the Effective Date , which delays the effective date of ASU 2014-09 by one year. TheFASB also agreed to allow entities to choose to adopt the standard as of the original effective date. In March 2016, the FASB issued Accounting Standards UpdateNo. 2016-08, Revenue from Contracts with Customers (Topic 606): Principal versus Agent Considerations (Reporting Revenue Gross versus Net) (ASU 2016-08)which clarifies the implementation guidance on principal versus agent considerations. The guidance includes indicators to assist an entity in determining whether itcontrols a specified good or service before it is transferred to the customers. The new standard further requires new disclosures about contracts with customers,including the significant judgments the company has made when applying the guidance. We will adopt the new standard effective January 1, 2018, using themodified retrospective transition method. We finalized our analysis and the adoption of this guidance will not have a material impact on our consolidated financialstatements and our internal controls over financial reporting.
In February 2016, the FASB issued Accounting Standards Update No. 2016-02, Leases (Topic 842) (ASU 2016-02), which generally requires companies torecognize operating and financing lease liabilities and corresponding right-of-use assets on the balance sheet. This guidance will be effective for us in the firstquarter of 2019 on a modified retrospective basis and early adoption is permitted. We will adopt the new standard effective January 1, 2019. We have selected alease accounting system and we are in the process of implementing such system as well as evaluating the use of the optional practical expedients. While wecontinue to evaluate the effect of adopting this guidance on our consolidated financial statements and related disclosures, we expect our operating leases, asdisclosed in Note 9 — Commitments and Contingencies, will be subject to the new standard. We will recognize right-of-use assets and operating lease liabilities onour consolidated balance sheets upon adoption, which will increase our total assets and liabilities.
In October 2016, the FASB issued Accounting Standards Update No. 2016-16, Income Taxes (Topic 740): Intra-Entity Transfers Other than Inventory(ASU 2016-16), which requires companies to recognize the income-tax consequences of an intra-entity transfer of an asset other than inventory when the transferoccurs, rather than when the asset has been sold to an outside party. We will adopt the new standard effective January 1, 2018, using the modified retrospectivetransition approach through a cumulative-effect adjustment to retained earnings as of the effective date. A cumulative-effect adjustment will capture the write-offof income tax consequences deferred from past intra-entity transfers involving assets other than inventory, new deferred tax assets, and other liabilities for amountsnot currently recognized under U.S. GAAP. Based on transactions up to December 31, 2017, we do not expect the adoption of this guidance to have a materialimpact on our consolidated financial statements.
In November 2016, the FASB issued Accounting Standards Update No. 2016-18, Statement of Cash Flows (Topic 230): Restricted Cash (ASU 2016-18),which requires companies to include amounts generally described as restricted cash and restricted cash equivalents in cash and cash equivalents when reconcilingbeginning-of-period and end-of-period total amounts shown on the statement of cash flows. We will adopt the new standard effective January 1, 2018, using theretrospective transition approach for all periods presented. We do not expect the adoption of this guidance to have a material impact on our consolidated financialstatements.
In January 2017, the FASB issued Accounting Standards Update No. 2017-01, Business Combinations (Topic 805): Clarifying the Definition of a Business (ASU 2017-01), which revises the definition of a business and provides new guidance in evaluating when a set of transferred assets and activities is a business. Wewill adopt the new standard effective January 1, 2018, on a prospective basis and do not expect the standard to have a material impact on our consolidated financialstatements.
In January 2017, the FASB issued Accounting Standards Update No. 2017-04, Intangibles - Goodwill and Other (Topic 350): Simplifying the Test forGoodwill Impairment (ASU 2017-04), which eliminates step two from the goodwill impairment test. Under ASU 2017-04, an entity should recognize animpairment charge for the amount by which the carrying amount of a reporting unit exceeds its fair value up to the amount of goodwill allocated to that reportingunit. This guidance will be effective for us in the first quarter of 2020 on a prospective basis, and early adoption is permitted. We do not expect the standard tohave a material impact on our consolidated financial statements.
Note 2. Earnings per Share
We compute earnings per share (EPS) of Class A and Class B common stock using the two-class method required for participating
69

securities. We consider restricted stock awards to be participating securities because holders of such shares have non-forfeitable dividend rights in the event of ourdeclaration of a dividend for common shares.
Undistributed earnings allocated to participating securities are subtracted from net income in determining net income attributable to common stockholders.Basic EPS is computed by dividing net income attributable to common stockholders by the weighted-average number of shares of our Class A and Class Bcommon stock outstanding, adjusted for outstanding shares that are subject to repurchase.
For the calculation of diluted EPS, net income attributable to common stockholders for basic EPS is adjusted by the effect of dilutive securities, such asawards under our equity compensation plans and inducement awards under separate non-plan restricted stock unit (RSU) award agreements. In addition, thecomputation of the diluted EPS of Class A common stock assumes the conversion of our Class B common stock to Class A common stock, while the diluted EPSof Class B common stock does not assume the conversion of those shares to Class A common stock. Diluted EPS attributable to common stockholders is computedby dividing the resulting net income attributable to common stockholders by the weighted-average number of fully diluted common shares outstanding.
RSUs with anti-dilutive effect were excluded from the EPS calculation and they were not material for the years ended December 31, 2017 , 2016 , and 2015, respectively.
Basic and diluted EPS are the same for each class of common stock because they are entitled to the same liquidation and dividend rights.
70

The numerators and denominators of the basic and diluted EPS computations for our common stock are calculated as follows (in millions, except per shareamounts):
Year Ended December 31,
2017 2016 2015
ClassA
ClassB
ClassA
ClassB
ClassA
ClassB
Basic EPS: Numerator
Net income $ 13,034 $ 2,900 $ 8,270 $ 1,947 $ 2,959 $ 729Less: Net income attributable to participating securities 12 2 24 5 15 4
Net income attributable to common stockholders $ 13,022 $ 2,898 $ 8,246 $ 1,942 $ 2,944 $ 725
Denominator Weighted average shares outstanding 2,375 528 2,323 548 2,259 559Less: Shares subject to repurchase 2 — 6 2 10 5
Number of shares used for basic EPS computation 2,373 528 2,317 546 2,249 554
Basic EPS $ 5.49 $ 5.49 $ 3.56 $ 3.56 $ 1.31 $ 1.31
Diluted EPS: Numerator
Net income attributable to common stockholders $ 13,022 $ 2,898 $ 8,246 $ 1,942 $ 2,944 $ 725Reallocation of net income attributable to participating securities 14 — 29 — 19 —Reallocation of net income as a result of conversion of Class B to Class Acommon stock 2,898 — 1,942 — 725 —Reallocation of net income to Class B common stock — (13) — 14 — 15
Net income attributable to common stockholders for diluted EPS $ 15,934 $ 2,885 $ 10,217 $ 1,956 $ 3,688 $ 740
Denominator Number of shares used for basic EPS computation 2,373 528 2,317 546 2,249 554Conversion of Class B to Class A common stock 528 — 546 — 554 —Weighted average effect of dilutive securities:
Employee stock options 4 4 6 6 8 8RSUs 49 3 49 5 37 9Shares subject to repurchase and other 2 — 7 3 5 2
Number of shares used for diluted EPS computation 2,956 535 2,925 560 2,853 573
Diluted EPS $ 5.39 $ 5.39 $ 3.49 $ 3.49 $ 1.29 $ 1.29
71

Note 3. Cash and Cash Equivalents, and Marketable Securities
The following table sets forth the cash and cash equivalents, and marketable securities (in millions):
December 31,
2017 2016
Cash and cash equivalents: Cash $ 2,212 $ 1,364Money market funds 5,268 5,409U.S. government securities 66 1,463U.S. government agency securities 25 667Certificate of deposits and time deposits 440 —Corporate debt securities 68 —
Total cash and cash equivalents 8,079 8,903Marketable securities:
U.S. government securities 12,766 7,130U.S. government agency securities 10,944 7,411Corporate debt securities 9,922 6,005
Total marketable securities 33,632 20,546
Total cash and cash equivalents, and marketable securities $ 41,711 $ 29,449
The gross unrealized gains or losses on our marketable securities as of December 31, 2017 and 2016 were not significant. In addition, the gross unrealizedloss that had been in a continuous loss position for 12 months or longer was not significant as of December 31, 2017 and 2016 . As of December 31, 2017 , weconsidered the decreases in market value on our marketable securities to be temporary in nature and did not consider any of our investments to be other-than-temporarily impaired.
The following table classifies our marketable securities by contractual maturities (in millions):
December 31,
2017 2016
Due in one year $ 7,976 $ 4,966Due in one to five years 25,656 15,580
Total $ 33,632 $ 20,546
72

Note 4. Fair Value Measurement
The following table summarizes, for assets or liabilities measured at fair value, the respective fair value and the classification by level of input within thefair value hierarchy (in millions):
Fair Value Measurement at Reporting Date Using
Description December 31, 2017
Quoted Prices in ActiveMarkets for Identical
Assets(Level 1)
Significant OtherObservable Inputs
(Level 2) Significant Unobservable
Inputs(Level 3)
Cash equivalents:
Money market funds $ 5,268 $ 5,268 $ — $ —U.S. government securities 66 66 — —U.S. government agency securities 25 25 — —Certificate of deposits and time deposits 440 — 440 —Corporate debt securities 68 — 68 —
Marketable securities: U.S. government securities 12,766 12,766 — —U.S. government agency securities 10,944 10,944 — —Corporate debt securities 9,922 — 9,922 —
Total cash equivalents and marketable securities $ 39,499 $ 29,069 $ 10,430 $ —
Fair Value Measurement at Reporting Date Using
Description December 31, 2016
Quoted Prices in ActiveMarkets for Identical
Assets(Level 1)
Significant OtherObservable Inputs
(Level 2) Significant Unobservable
Inputs(Level 3
Cash equivalents:
Money market funds $ 5,409 $ 5,409 $ — $ —U.S. government securities 1,463 1,463 — —U.S. government agency securities 667 667 — —
Marketable securities: U.S. government securities 7,130 7,130 — —U.S. government agency securities 7,411 7,411 — —Corporate debt securities 6,005 — 6,005 —
Total cash equivalents and marketable securities $ 28,085 $ 22,080 $ 6,005 $ —
Accrued expenses and other current liabilities: Contingent consideration liability $ 242 $ — 242 $ —
We classify our cash equivalents and marketable securities within Level 1 or Level 2 because we use quoted market prices or alternative pricing sources andmodels utilizing market observable inputs to determine their fair value. In July 2017, we settled our Level 2 contingent consideration liability that was outstandingas of December 31, 2016.
73

Note 5. Property and Equipment
Property and equipment consists of the following (in millions):
December 31,
2017 2016
Land $ 798 $ 696Buildings 4,909 3,109Leasehold improvements 959 531Network equipment 7,998 5,179Computer software, office equipment and other 681 398Construction in progress 2,992 1,890Total 18,337 11,803Less: Accumulated depreciation (4,616) (3,212)
Property and equipment, net $ 13,721 $ 8,591
Depreciation expense on property and equipment was $2.33 billion , $1.59 billion , and $1.22 billion during 2017 , 2016 , and 2015 , respectively.
Property and equipment as of December 31, 2017 and 2016 includes $533 million and $283 million , respectively, acquired under capital lease agreements,of which a substantial majority, is included in network equipment. Accumulated depreciation of property and equipment acquired under these capital leases was$101 million and $30 million at December 31, 2017 and 2016 , respectively.
Construction in progress includes costs mostly related to construction of data centers, office buildings, and network equipment infrastructure to support ourdata centers around the world. The construction of office buildings includes leased office spaces for which we are considered to be the owner for accountingpurposes. See Note 9 in these notes to the consolidated financial statements for additional information. No interest was capitalized during the years endedDecember 31, 2017 , 2016 and 2015 .
Note 6. Goodwill and Intangible Assets
During the year ended December 31, 2017 , we completed several business acquisitions that were not material to our consolidated financial statements,either individually or in the aggregate. Accordingly, pro forma historical results of operations related to these business acquisitions during the year endedDecember 31, 2017 have not been presented. We have included the financial results of these business acquisitions in our consolidated financial statements fromtheir respective dates of acquisition.
Goodwill generated from all business acquisitions completed during the year ended December 31, 2017 was primarily attributable to expected synergiesfrom future growth and potential monetization opportunities. The amount of goodwill generated during this period that was deductible for tax purposes was notmaterial.
The changes in the carrying amount of goodwill for the years ended December 31, 2017 and 2016 are as follows (in millions):
Balance as of December 31, 2015 $ 18,026Goodwill acquired 95Effect of currency translation adjustment 1Balance as of December 31, 2016 $ 18,122Goodwill acquired 90Effect of currency translation adjustment 9
Balance as of December 31, 2017 $ 18,221
74

Intangible assets consist of the following (in millions):
December 31, 2017 December 31, 2016
Weighted-Average
RemainingUseful Lives (in
years)
GrossCarryingAmount
AccumulatedAmortization
Net CarryingAmount
Gross CarryingAmount
AccumulatedAmortization
Net CarryingAmount
Acquired users 3.8 $ 2,056 $ (971) $ 1,085 $ 2,056 $ (678) $ 1,378Acquired technology 1.8 972 (711) 261 931 (518) 413Acquired patents 5.7 785 (499) 286 785 (420) 365Trade names 2.2 629 (406) 223 629 (293) 336Other 2.7 162 (133) 29 162 (119) 43
Total intangible assets 3.6 $ 4,604 $ (2,720) $ 1,884 $ 4,563 $ (2,028) $ 2,535
Amortization expense of intangible assets for the years ended December 31, 2017 , 2016 , and 2015 was $692 million , $751 million , and $730 million ,respectively.
As of December 31, 2017 , expected amortization expense for the unamortized acquired intangible assets for the next five years and thereafter is as follows(in millions):
2018 $ 6332019 5402020 3652021 2652022 29Thereafter 52
Total $ 1,884
Note 7. Liabilities
The components of accrued expenses and other current liabilities are as follows (in millions):
December 31,
2017 2016
Accrued compensation and benefits $ 776 $ 636Accrued property and equipment 685 331Accrued taxes payable 230 155Contingent consideration liability — 242Other current liabilities 1,201 839
Accrued expenses and other current liabilities $ 2,892 $ 2,203
The components of other liabilities are as follows (in millions):
December 31,
2017 2016
Income tax payable $ 5,372 $ 2,431Other liabilities 1,045 461
Other liabilities $ 6,417 $ 2,892
75

Note 8. Long-term Debt
In May 2016, we entered into a $2.0 billion senior unsecured revolving credit facility, and any amounts outstanding under this facility will be due andpayable on May 20, 2021. As of December 31, 2017 , no amounts had been drawn down and we were in compliance with the covenants under the facility.
Note 9. Commitments and Contingencies
Commitments
Leases
We have entered into various non-cancelable operating lease agreements for certain of our offices, land, facilities, colocations, and data centers with originallease periods expiring between 2018 and 2038 . We are committed to pay a portion of the related actual operating expenses under certain of these lease agreements.Certain of these arrangements have free rent periods or escalating rent payment provisions, and we recognize rent expense under such arrangements on a straight-line basis.
The following is a schedule, by years, of the future minimum lease payments required under non-cancelable operating leases as of December 31, 2017 (inmillions):
Operating Leases Financing obligation, building in
progress - leased facilities (1)
2018 $ 409 $ —2019 464 22020 470 142021 448 152022 430 15Thereafter 2,423 149
Total minimum lease payments $ 4,644 $ 195
(1) We entered into agreements to lease office buildings that are under construction. As a result of our involvement during these construction periods, we are considered for accountingpurposes to be the owner of the construction projects. Financing obligation, building in progress - leased facilities represent the total expected financing and lease obligations associatedwith these leases and will be settled through monthly lease payments to the landlords when we occupy the office spaces upon completion. This amount includes $72 million that is includedin property and equipment, net and other liabilities on our consolidated balance sheets as of December 31, 2017 .
Operating lease expense was $363 million , $269 million , and $196 million for the years ended December 31, 2017 , 2016 and 2015 , respectively. We fullyrepaid all our capital lease obligations during 2016.
Other contractual commitments
We also have $2.95 billion of non-cancelable contractual commitments as of December 31, 2017 , primarily related to network infrastructure and our datacenter operations. These commitments are primarily due within five years .
Contingencies
Legal Matters
Beginning on May 22, 2012, multiple putative class actions, derivative actions, and individual actions were filed in state and federal courts in the UnitedStates and in other jurisdictions against us, our directors, and/or certain of our officers alleging violation of securities laws or breach of fiduciary duties inconnection with our initial public offering (IPO) and seeking unspecified damages. We believe these lawsuits are without merit, and we intend to continue tovigorously defend them. The vast majority of the cases in the United States, along with multiple cases filed against The NASDAQ OMX Group, Inc. and TheNasdaq Stock Market LLC (collectively referred to herein as NASDAQ) alleging technical and other trading-related errors by NASDAQ in connection with ourIPO, were ordered centralized for coordinated or consolidated pre-trial proceedings in the U.S. District Court for the Southern District of New York. In a series ofrulings in 2013 and 2014, the court denied our motion to dismiss the consolidated securities class action and granted our motions to dismiss the derivative actionsagainst our directors and certain of our officers. On July 24, 2015, the court of appeals affirmed the dismissal of the derivative actions. On December 11, 2015, thecourt granted plaintiffs' motion for class certification in the consolidated securities action. On April 14, 2017, we filed a motion for summary judgment. Trial isscheduled to begin on February 26, 2018.
In addition, from time to time, we are subject to litigation and other proceedings involving law enforcement and other regulatory agencies, including inparticular in Brazil and Europe, in order to ascertain the precise scope of our legal obligations to comply with
76

the requests of those agencies, including our obligation to disclose user information in particular circumstances. A number of such instances have resulted in theassessment of fines and penalties against us. We believe we have multiple legal grounds to satisfy these requests or prevail against associated fines and penalties,and we intend to vigorously defend such fines and penalties. Although we believe that it is reasonably possible that we may incur a loss in some of these cases, weare currently unable to estimate the amount of such losses.
We are also party to various other legal proceedings, claims, and regulatory, tax or government inquiries and investigations that arise in the ordinary courseof business. With respect to these matters, we evaluate the developments on a regular basis and accrue a liability when we believe a loss is probable and the amountcan be reasonably estimated.
We believe that the amount or any estimable range of reasonably possible or probable loss will not, either individually or in the aggregate, have a materialadverse effect on our business, consolidated financial position, results of operations, or cash flows. However, the outcome of these matters is inherently uncertain.Therefore, if one or more of these matters were resolved against us for amounts in excess of management's expectations, our results of operations and financialcondition, including in a particular reporting period in which any such outcome becomes probable and estimable, could be materially adversely affected.
For information regarding income tax contingencies, see Note 12 — Income Taxes.
Indemnifications
In the normal course of business, to facilitate transactions of services and products, we have agreed to indemnify certain parties with respect to certainmatters. We have agreed to hold certain parties harmless against losses arising from a breach of representations or covenants, or out of intellectual propertyinfringement or other claims made by third parties. These agreements may limit the time within which an indemnification claim can be made and the amount of theclaim. In addition, we have entered into indemnification agreements with our officers, directors, and certain employees, and our certificate of incorporation andbylaws contain similar indemnification obligations.
It is not possible to determine the maximum potential amount under these indemnification agreements due to the limited history of prior indemnificationclaims and the unique facts and circumstances involved in each particular agreement. Historically, payments made by us under these agreements have not had amaterial impact on our consolidated financial position, results of operations or cash flows. In our opinion, as of December 31, 2017 , there was not at least areasonable possibility we had incurred a material loss with respect to indemnification of such parties. We have not recorded any liability for costs related toindemnification through December 31, 2017 .
Note 10. Stockholders' Equity
Common Stock
Our certificate of incorporation authorizes the issuance of Class A common stock and Class B common stock. As of December 31, 2017 , we are authorizedto issue 5,000 million shares of Class A common stock and 4,141 million shares of Class B common stock, each with a par value of $0.000006 per share. Holdersof our Class A common stock and Class B common stock are entitled to dividends when, as and if, declared by our board of directors, subject to the rights of theholders of all classes of stock outstanding having priority rights to dividends. As of December 31, 2017 , we have not declared any dividends and our credit facilitycontains restrictions on our ability to pay dividends. The holder of each share of Class A common stock is entitled to one vote, while the holder of each share ofClass B common stock is entitled to ten votes. Shares of our Class B common stock are convertible into an equivalent number of shares of our Class A commonstock and generally convert into shares of our Class A common stock upon transfer. Class A common stock and Class B common stock are referred to as commonstock throughout the notes to these financial statements, unless otherwise noted.
As of December 31, 2017 , there were 2,397 million shares and 509 million shares of Class A common stock and Class B common stock, respectively,issued and outstanding.
Abandonment of the Reclassification
In September 2017, our board of directors decided to abandon the proposal to create a new class of non-voting capital stock (Class C capital stock) and theintention to issue a dividend of two shares of Class C capital stock for each outstanding share of Class A and Class B common stock (the Reclassification). As aresult, we will not proceed with the filing of our amended and restated certificate of incorporation which was approved by our stockholders on June 20, 2016.
77

Share Repurchase Program
In November 2016, our board of directors authorized a $6.0 billion share repurchase program of our Class A common stock, which commenced in 2017 anddoes not have an expiration date. The timing and actual number of shares repurchased depend on a variety of factors, including price, general business and marketconditions, and other investment opportunities, and shares may be repurchased through open market purchases or privately negotiated transactions, includingthrough the use of trading plans intended to qualify under Rule 10b5-1 under the Securities Exchange Act of 1934, as amended. During the year endedDecember 31, 2017 , we repurchased and subsequently retired approximately 13 million shares of our Class A common stock for an aggregate amount ofapproximately $2.07 billion .
Share-based Compensation Plans
We maintain two share-based employee compensation plans: the 2012 Equity Incentive Plan, which was amended in June 2016 (2012 Plan), and the 2005Stock Plan (collectively, Stock Plans). Our 2012 Plan serves as the successor to our 2005 Stock Plan and provides for the issuance of incentive and nonstatutorystock options, restricted stock awards, stock appreciation rights, RSUs, performance shares, and stock bonuses to qualified employees, directors and consultants.Outstanding awards under the 2005 Stock Plan continue to be subject to the terms and conditions of the 2005 Stock Plan.
We initially reserved 25 million shares of our Class A common stock for issuance under our 2012 Plan. The number of shares reserved for issuance underour 2012 Plan increases automatically on January 1 of each of the calendar years during the term of the 2012 Plan, which will continue through and including April2026 unless terminated earlier by our board of directors or a committee thereof, by a number of shares of Class A common stock equal to the lesser of (i) 2.5% ofthe total issued and outstanding shares of our Class A common stock as of the immediately preceding December 31st or (ii) a number of shares determined by ourboard of directors. Pursuant to this automatic increase provision, our board of directors elected not to increase the number of shares reserved for issuance in 2017and 2016, and approved an increase of 42 million shares reserved for issuance effective as of January 1, 2018.
In addition, shares available for grant under the 2005 Stock Plan, which were reserved but not issued, forfeited or repurchased at their original issue price, orsubject to outstanding awards under the 2005 Stock Plan as of the effective date of our IPO, were added to the reserves of the 2012 Plan and shares that arewithheld in connection with the net settlement of RSUs are also added to the reserves of the 2012 Plan.
The following table summarizes the activities of stock option awards under the Stock Plans for the year ended December 31, 2017 :
Shares Subject to Options Outstanding
Number of Shares
WeightedAverage Exercise
Price
WeightedAverage
RemainingContractual
Term Aggregate
Intrinsic Value ( 1)
(in thousands) (in years) (in millions)Balance as of December 31, 2016 5,687 $ 7.78 Stock options exercised (2,609) 5.10
Balance as of December 31, 2017 3,078 $ 10.06 2.4 $ 512
Stock options exercisable as of December 31, 2017 2,765 $ 9.50 2.3 $ 462
(1) The aggregate intrinsic value is calculated as the difference between the exercise price of the underlying stock option awards and the official closing price of our Class A common stock of$176.46 , as reported on the Nasdaq Global Select Market on December 31, 2017 .
78

There were no options granted, forfeited, or canceled for the year ended December 31, 2017 . The aggregate intrinsic value of the options exercised in theyears ended December 31, 2017 , 2016 , and 2015 was $359 million , $309 million , and $403 million , respectively. The total grant date fair value of stock optionsvested during the years ended December 31, 2017 , 2016 , and 2015 was not material.
The following table summarizes additional information regarding outstanding and exercisable options under the Stock Plans at December 31, 2017 :
Options Outstanding Options Exercisable
Exercise Price Number of Shares
Weighted AverageRemaining
Contractual Term Weighted Average
Exercise Price Number of Shares Weighted Average
Exercise Price
(in thousands) (in years) (in thousands) $1.85 27 1.0 $ 1.85 27 $ 1.85$2.95 851 1.6 2.95 851 2.95$10.39 1,000 2.6 10.39 1,000 10.39$15.00 1,200 2.8 15.00 887 15.00
3,078 2.4 $ 10.06 2,765 $ 9.50
The following table summarizes the activities for our unvested RSUs for the year ended December 31, 2017 :
Unvested RSUs (1)
Number of Shares Weighted Average Grant Date
Fair Value
(in thousands) Unvested at December 31, 2016 98,586 $ 82.99
Granted 36,741 147.28Vested (43,176) 83.74Forfeited (10,937) 91.76
Unvested at December 31, 2017 81,214 $ 110.49
(1) Unvested shares include inducement awards issued in connection with the WhatsApp acquisition in 2014 and are subject to the terms, restrictions, and conditions of separate non-plan RSUaward agreements.
The fair value as of the respective vesting dates of RSUs that vested during the years ended December 31, 2017 , 2016 , and 2015 was $6.76 billion , $4.92billion , and $4.23 billion , respectively. Starting in 2016, upon adoption of ASU 2016-09, we account for forfeitures as they occur. As of December 31, 2017 ,there was $7.72 billion of unrecognized share-based compensation expense, substantially all of which was related to RSUs. This unrecognized compensationexpense is expected to be recognized over a weighted-average period of approximately three years . Included in this unrecognized share-based compensationexpense are 9.5 million unvested shares as of December 31, 2017 , related to RSU inducement award granted to an employee in connection with the WhatsAppacquisition in 2014. This award is subject to acceleration if the recipient's employment is terminated without "cause" or if the recipient resigns for "good reason".
Note 11. Interest and other income (expense), net
The following table presents the detail of interest and other income (expense), net, for the periods presented (in millions):
Year Ended December 31,
2017 2016 2015
Interest income $ 398 $ 176 $ 52Interest expense (6) (10) (23)Foreign currency exchange losses, net (6) (76) (66)Other 5 1 6
Interest and other income (expense), net $ 391 $ 91 $ (31)
79

Note 12. Income Taxes
The components of income before provision for income taxes for the years ended December 31, 2017 , 2016 , and 2015 are as follows (in millions):
Year Ended December 31,
2017 2016 2015
Domestic $ 7,079 $ 6,368 $ 2,802Foreign 13,515 6,150 3,392
Income before provision for income taxes $ 20,594 $ 12,518 $ 6,194
The provision for income taxes consisted of the following (in millions):
Year Ended December 31,
2017 2016 2015Current:
Federal $ 4,455 $ 2,384 $ 3,012State 190 179 183Foreign 389 195 123
Total current tax expense 5,034 2,758 3,318Deferred:
Federal (296) (414) (800)State (33) (18) (17)Foreign (45) (25) 5
Total deferred tax benefit (374) (457) (812)
Provision for income taxes $ 4,660 $ 2,301 $ 2,506
A reconciliation of the U.S. federal statutory income tax rate of 35.0% to our effective tax rate is as follows (in percentages):
Year Ended December 31,
2017 2016 2015
U.S. federal statutory income tax rate 35.0 % 35.0 % 35.0 %State income taxes, net of federal benefit 0.6 1.0 2.0Research tax credits (0.9) (0.7) (1.4)Share-based compensation 0.4 1.0 2.2Excess tax benefits related to share-based compensation (1) (5.8) (7.0) —Effect of non-U.S. operations (18.6) (12.8) (0.9)Effect of U.S. tax law change (2) 11.0 — —Other 0.9 1.9 3.5
Effective tax rate 22.6 % 18.4 % 40.4 %
(1) Starting in 2016, excess tax benefits from share-based award activity are reflected as a reduction of the provision for income taxes, whereas they were previously recognized in equity.(2) Due to the Tax Act which was enacted in December 2017, provisional mandatory transition tax on accumulated foreign earnings was accrued as of December 31, 2017. In addition,
deferred taxes were derecognized for previous estimated tax liabilities that would arise upon repatriation of a portion of these earnings in the foreign jurisdictions. Our U.S. deferred taxassets and liabilities as of December 31, 2017 were re-measured from 35% to 21% .The provisional effects of the Tax Act are $2.53 billion of current income tax expense and $257 millionof deferred income tax benefit for the year ended December 31, 2017.
80

Our deferred tax assets (liabilities) are as follows (in millions):
December 31,
2017 2016
Deferred tax assets: Net operating loss carryforward $ 1,300 $ 1,252Tax credit carryforward 509 268Share-based compensation 385 684Accrued expenses and other liabilities 381 339Other 131 149
Total deferred tax assets 2,706 2,692Less: valuation allowance (438) (240)
Deferred tax assets, net of valuation allowance 2,268 2,452 Deferred tax liabilities:
Depreciation and amortization (622) (535)Purchased intangible assets (309) (706)Deferred taxes on foreign income (88) (357)
Total deferred tax liabilities (1,019) (1,598)
Net deferred tax assets $ 1,249 $ 854
The Tax Act reduces the U.S. statutory corporate tax rate from 35% to 21% for our tax years beginning in 2018, which resulted in the re-measurement of thefederal portion of our deferred tax assets as of December 31, 2017 from 35% to the new 21% tax rate. The valuation allowance was approximately $438 millionand $240 million as of December 31, 2017 and 2016 , respectively, mostly related to state tax credits that we do not believe will ultimately be realized.
As of December 31, 2017 , the U.S. federal and state net operating loss carryforwards were $5.36 billion and $2.50 billion , which will begin to expire in2033 and 2032 , respectively, if not utilized. We have federal and state tax credit carryforwards of $142 million and $1.38 billion , respectively, which will begin toexpire in 2033 and 2032 , respectively, if not utilized.
Utilization of our net operating loss and tax credit carryforwards may be subject to substantial annual limitations due to the ownership change limitationsprovided by the Internal Revenue Code and similar state provisions. Such annual limitations could result in the expiration of the net operating loss and tax creditcarryforwards before their utilization. The events that may cause ownership changes include, but are not limited to, a cumulative stock ownership change of greaterthan 50% over a three -year period.
The Tax Act imposes a mandatory transition tax on accumulated foreign earnings and eliminates US taxes on foreign subsidiary distribution. As a result,earnings in foreign jurisdictions are available for distribution to the U.S. without incremental U.S. taxes.
The following table reflects changes in the gross unrecognized tax benefits (in millions):
Year Ended December 31,
2017 2016 2015
Gross unrecognized tax benefits-beginning of period $ 3,309 $ 3,017 $ 1,682Increases related to prior year tax positions 72 32 322Decreases related to prior year tax positions (34) (36) (52)Increases related to current year tax positions 536 307 1,066Decreases related to settlements of prior year tax positions (13) (11) (1)
Gross unrecognized tax benefits-end of period $ 3,870 $ 3,309 $ 3,017
During all years presented, we recognized interest and penalties related to unrecognized tax benefits within the provision for income taxes on theconsolidated statements of income. The amount of interest and penalties accrued as of December 31, 2017 and 2016 was $154 million and $80 million ,respectively.
If the balance of gross unrecognized tax benefits of $3.87 billion as of December 31, 2017 were realized in a future period, this would result in a tax benefitof $2.67 billion within our provision of income taxes at such time.
81

We are subject to taxation in the United States and various other state and foreign jurisdictions. The material jurisdictions in which we are subject topotential examination include the United States and Ireland. We are under examination by the Internal Revenue Service (IRS) for our 2011 through 2013 tax yearsand Ireland for our 2012 through 2015 tax years. Our 2014 and subsequent years remain open to examination by the IRS. Our 2016 and subsequent years remainopen to examination in Ireland.
In July 2016, we received a Statutory Notice of Deficiency (Notice) from the IRS related to transfer pricing with our foreign subsidiaries in conjunction withthe examination of the 2010 tax year. While the Notice applies only to the 2010 tax year, the IRS states that it will also apply its position for tax years subsequentto 2010, which, if the IRS prevails in its position, could result in an additional federal tax liability of an estimated aggregate amount of approximately $3.0 billion to $5.0 billion in excess of originally filed U.S. return, plus interest and any penalties asserted. We do not agree with the position of the IRS and have filed apetition in the United States Tax Court challenging the Notice. We have previously accrued an estimated unrecognized tax benefit consistent with the guidance inASC 740 that is lower than the potential additional federal tax liability of $3.0 billion to $5.0 billion in excess of the originally filed U.S. return, plus interest andpenalties. If the IRS prevails in the assessment of additional tax due based on its position, the assessed tax, interest and penalties, if any, could have a materialadverse impact on our financial position, results of operations, and cash flows. As of December 31, 2017 , we have not resolved this matter and proceedingscontinue in the United States Tax Court. We believe that adequate amounts have been reserved for any adjustments that may ultimately result from theseexaminations.
We believe that adequate amounts have been reserved for any adjustments to the provision for income taxes or other tax items that may ultimately resultfrom these examinations. Although the timing of the resolution, settlement, and closure of any audits is highly uncertain, it is reasonably possible that the balanceof gross unrecognized tax benefits could significantly change in the next 12 months. Given the number of years remaining that are subject to examination, we areunable to estimate the full range of possible adjustments to the balance of gross unrecognized tax benefits. However, we do not anticipate a significant impact tosuch amounts within the next 12 months.
Note 13. Geographical Information
Revenue by geography is based on the billing address of the marketer or developer. The following tables set forth revenue and property and equipment, netby geographic area (in millions):
Year Ended December 31,
2017 2016 2015Revenue:
United States $ 17,734 $ 12,579 $ 8,513Rest of the world (1) 22,919 15,059 9,415
Total revenue $ 40,653 $ 27,638 $ 17,928
(1) No individual country, other than disclosed above, exceeded 10% of our total revenue for any period presented.
December 31,
2017 2016Property and equipment, net:
United States $ 10,406 $ 6,793Rest of the world (1) 3,315 1,798
Total property and equipment, net $ 13,721 $ 8,591
(1) No individual country, other than disclosed above, exceeded 10% of our total property and equipment, net for any period presented.
82

Item 9. Changes in and Disagreements with Accountants on Accounting and Financial Disclosure
None.
Item 9A. Controls and Procedures
Evaluation of Disclosure Controls and Procedures
Our management, with the participation of our chief executive officer (CEO) and chief financial officer (CFO), has evaluated the effectiveness of ourdisclosure controls and procedures (as defined in Rules 13a- 15(e) and 15d- 15(e) under the Securities Exchange Act of 1934, as amended (Exchange Act)), as ofthe end of the period covered by this Annual Report on Form 10-K. Based on such evaluation, our CEO and CFO have concluded that as of December 31, 2017 ,our disclosure controls and procedures are designed at a reasonable assurance level and are effective to provide reasonable assurance that information we arerequired to disclose in reports that we file or submit under the Exchange Act is recorded, processed, summarized, and reported within the time periods specified inthe rules and forms of the Securities and Exchange Commission (SEC), and that such information is accumulated and communicated to our management, includingour CEO and CFO, as appropriate, to allow timely decisions regarding required disclosure.
Management's Report on Internal Control over Financial Reporting
Our management is responsible for establishing and maintaining adequate internal control over financial reporting (as defined in Rule 13a-15(f) under theExchange Act). Management conducted an assessment of the effectiveness of our internal control over financial reporting based on the criteria set forth in InternalControl - Integrated Framework issued by the Committee of Sponsoring Organizations of the Treadway Commission (2013 framework). Based on the assessment,management has concluded that its internal control over financial reporting was effective as of December 31, 2017 to provide reasonable assurance regarding thereliability of financial reporting and the preparation of financial statements in accordance with U.S. GAAP. Our independent registered public accounting firm,Ernst & Young LLP, has issued an audit report with respect to our internal control over financial reporting, which appears in Part II, Item 8 of this Annual Reporton Form 10-K.
Changes in Internal Control
There were no changes in our internal control over financial reporting identified in management's evaluation pursuant to Rules 13a-15(d) or 15d-15(d) of theExchange Act during the fourth quarter of 2017 that materially affected, or are reasonably likely to materially affect, our internal control over financial reporting.
Limitations on Effectiveness of Controls and Procedures and Internal Control over Financial Reporting
In designing and evaluating the disclosure controls and procedures and internal control over financial reporting, management recognizes that any controlsand procedures, no matter how well designed and operated, can provide only reasonable assurance of achieving the desired control objectives. In addition, thedesign of disclosure controls and procedures and internal control over financial reporting must reflect the fact that there are resource constraints and thatmanagement is required to apply judgment in evaluating the benefits of possible controls and procedures relative to their costs.
Item 9B. Other Information
None.
83
PART III
Item 10. Directors, Executive Officers and Corporate Governance
The information required by this item is incorporated by reference to our Proxy Statement for the 2018 Annual Meeting of Stockholders to be filed with theSecurities and Exchange Commission (SEC) within 120 days of the fiscal year ended December 31, 2017 .
Our board of directors has adopted a Code of Conduct applicable to all officers, directors and employees, which is available on our website(investor.fb.com) under "Corporate Governance." We intend to satisfy the disclosure requirement under Item 5.05 of Form 8-K regarding amendment to, or waiverfrom, a provision of our Code of Conduct by posting such information on the website address and location specified above.
Item 11. Executive Compensation
The information required by this item is incorporated by reference to our Proxy Statement for the 2018 Annual Meeting of Stockholders to be filed with theSEC within 120 days of the fiscal year ended December 31, 2017 .
Item 12. Security Ownership of Certain Beneficial Owners and Management and Related Stockholder Matters
The information required by this item is incorporated by reference to our Proxy Statement for the 2018 Annual Meeting of Stockholders to be filed with theSEC within 120 days of the fiscal year ended December 31, 2017 .
Item 13. Certain Relationships and Related Transactions, and Director Independence
The information required by this item is incorporated by reference to our Proxy Statement for the 2018 Annual Meeting of Stockholders to be filed with theSEC within 120 days of the fiscal year ended December 31, 2017 .
Item 14. Principal Accounting Fees and Services
The information required by this item is incorporated by reference to our Proxy Statement for the 2018 Annual Meeting of Stockholders to be filed with theSEC within 120 days of the fiscal year ended December 31, 2017 .
84
PART IV
Item 15. Exhibits, Financial Statement Schedules
We have filed the following documents as part of this Form 10-K:
1. Consolidated Financial Statements:
Page No.Reports of Independent Registered Public Accounting Firm 56Consolidated Balance Sheets 58Consolidated Statements of Income 59Consolidated Statements of Comprehensive Income 60Consolidated Statements of Stockholders' Equity 61Consolidated Statements of Cash Flows 62Notes to Consolidated Financial Statements 64
2. Financial Statement Schedules
All schedules have been omitted because they are not required, not applicable, not present in amounts sufficient to require submission of the schedule, or therequired information is otherwise included.
3. Exhibits
Exhibit Incorporated by Reference Filed
HerewithNumber Exhibit Description Form File No. Exhibit Filing Date 3.1 Restated Certificate of Incorporation. 10-Q 001-35551 3.1 July 31, 2012 3.2 Amended and Restated Bylaws. 10-Q 001-35551 3.2 July 31, 2012 4.1
Form of Class A Common Stock Certificate.
S-1
333-179287
4.1
February 8,2012
4.2 Form of Class B Common Stock Certificate. S-8 333-181566 4.4 May 21, 2012 4.3
Sixth Amended and Restated Investors' Rights Agreement,dated December 27, 2010, by and among Registrant andcertain security holders of Registrant.
S-1
333-179287
4.2
February 8,2012
4.4
Amendment No. 1 to Sixth Amended and Restated Investors'Rights Agreement, dated May 1, 2012, by and amongRegistrant and certain security holders of Registrant.
S-1
333-179287
4.2A
May 3, 2012
4.5
Form of "Type 1" Holder Voting Agreement, betweenRegistrant, Mark Zuckerberg, and certain parties thereto.
S-1
333-179287
4.3
February 8,2012
10.1+
Form of Indemnification Agreement.
S-1
333-179287
10.1
February 8,2012
10.2(A)+
2005 Stock Plan, as amended.
10-K
001-35551
10.2(A)
February 1,2013
10.2(B)+
2005 Stock Plan forms of award agreements.
S-1
333-179287
10.2
February 8,2012
10.3(A)+ 2012 Equity Incentive Plan, as amended. 10-Q 001-35551 10.1 July 28, 2016 10.3(B)+ 2012 Equity Incentive Plan forms of award agreements. 10-Q 001-35551 10.2 July 31, 2012 10.3(C)+
2012 Equity Incentive Plan forms of award agreements(Additional Forms).
10-K
001-35551
10.3(C)
January 29,2015
10.3(D)+
2012 Equity Incentive Plan forms of award agreements(Additional Forms).
10-Q
001-35551
10.1
May 4, 2017
85

10.3(E)+
2012 Equity Incentive Plan forms of award agreements(Additional Forms).
10-Q
001-35551
10.1
July 27, 2017
10.4+
Form of Non-Plan Restricted Stock Unit Award Notice andAward Agreement.
S-8
333-199172
99.1
October 6,2014
10.5+ 2017 Bonus Plan. X10.6+
Amended and Restated Offer Letter, dated January 27, 2012,between Registrant and Mark Zuckerberg.
S-1
333-179287
10.6
February 8,2012
10.7+
Amended and Restated Employment Agreement, datedJanuary 27, 2012, between Registrant and Sheryl K. Sandberg.
S-1
333-179287
10.7
February 8,2012
10.8+
Amended and Restated Offer Letter, dated May 2, 2014,between Registrant and Christopher Cox.
10-K
001-35551
10.8
January 29,2015
10.9+
Amended and Restated Offer Letter, dated January 27, 2012,between Registrant and Mike Schroepfer.
S-1
333-179287
10.9
February 8,2012
10.10+
Offer Letter, dated August 25, 2014, between Registrant andDavid M. Wehner.
10-K
001-35551
10.10
January 29,2015
10.11+
Offer Letter, dated October 6, 2014, between Registrant andJan Koum.
10-Q
001-35551
10.1
October 30,2014
21.1 List of subsidiaries. X23.1 Consent of Independent Registered Public Accounting Firm. X31.1
Certification of Mark Zuckerberg, Chief Executive Officer,pursuant to Rule 13a-14(a)/15d-14(a), as adopted pursuant toSection 302 of the Sarbanes-Oxley Act of 2002.
X
31.2
Certification of David M. Wehner, Chief Financial Officer,pursuant to Rule 13a-14(a)/15d-14(a), as adopted pursuant toSection 302 of the Sarbanes-Oxley Act of 2002.
X
32.1#
Certification of Mark Zuckerberg, Chief Executive Officer,pursuant to 18 U.S.C. Section 1350, as adopted pursuant toSection 906 of the Sarbanes-Oxley Act of 2002.
X
32.2#
Certification of David M. Wehner, Chief Financial Officer,pursuant to 18 U.S.C. Section 1350, as adopted pursuant toSection 906 of the Sarbanes-Oxley Act of 2002.
X
101.INS XBRL Instance Document. X101.SCH XBRL Taxonomy Extension Schema Document. X101.CAL XBRL Taxonomy Extension Calculation Linkbase Document. X101.DEF XBRL Taxonomy Extension Definition Linkbase Document. X101.LAB XBRL Taxonomy Extension Labels Linkbase Document. X101.PRE XBRL Taxonomy Extension Presentation Linkbase Document. X
+ Indicates a management contract or compensatory plan. # This certification is deemed not filed for purposes of section 18 of the Securities Exchange Act of 1934, as amended (ExchangeAct), or otherwise subject to the liability of that section, nor shall it be deemed incorporated by reference into any filing underthe Securities Act of 1933, as amended or the Exchange Act.
86

SIGNATURES
Pursuant to the requirements of Section 13 or 15(d) of the Securities Exchange Act of 1934, the Registrant has duly caused this Annual Report on Form 10-Kto be signed on its behalf by the undersigned, thereunto duly authorized, in the City of Menlo Park, State of California, on this 1st day of February 2018.
FACEBOOK, INC. Date: February 1, 2018 /s/ David M. Wehner David M. Wehner
Chief Financial Officer
POWER OF ATTORNEY
KNOW ALL PERSONS BY THESE PRESENTS, that each person whose signature appears below constitutes and appoints David M. Wehner and David W.Kling, and each of them, as his or her true and lawful attorneys-in-fact and agents, with full power of substitution and resubstitution, for him or her and in his or hername, place and stead, in any and all capacities, to sign any and all amendments to this Annual Report on Form 10-K, and to file the same, with all exhibits thereto,and other documents in connection therewith, with the Securities and Exchange Commission, granting unto said attorneys-in-fact and agents, and each of them, fullpower and authority to do and perform each and every act and thing requisite and necessary to be done in connection therewith, as fully to all intents and purposesas he or she might or could do in person, hereby ratifying and confirming that all said attorneys-in-fact and agents, or any of them or their or his or her substitute orsubstitutes, may lawfully do or cause to be done by virtue hereof.
Pursuant to the requirements of the Securities Exchange Act of 1934, this Annual Report on Form 10-K has been signed by the following persons on behalfof the Registrant and in the capacities and on the dates indicated:
87

Signature Title Date
/s/ Mark Zuckerberg Chairman and Chief Executive Officer(Principal Executive Officer)
February 1, 2018 Mark Zuckerberg /s/ David M. Wehner Chief Financial Officer
(Principal Financial Officer) February 1, 2018
David M. Wehner / S / Susan J.S. Taylor Chief Accounting Officer
(Principal Accounting Officer) February 1, 2018
Susan J.S. Taylor /s/ Marc L. Andreessen Director February 1, 2018 Marc L. Andreessen /s/ Erskine B. Bowles Director February 1, 2018 Erskine B. Bowles /s/ Susan D. Desmond-Hellmann Director February 1, 2018 Susan D. Desmond-Hellmann /s/ Reed Hastings Director February 1, 2018 Reed Hastings /s/ Jan Koum Director February 1, 2018 Jan Koum /s/ Sheryl K. Sandberg Director February 1, 2018 Sheryl K. Sandberg /s/ Peter A. Thiel Director February 1, 2018 Peter A. Thiel
88
EXHIBIT 10.5
FACEBOOK, INC.
2017 BONUS PLAN
1. Effective Date and Term . This Bonus Plan (“ Plan ”) shall be effective as of January 1, 2017, and is effective for calendar year 2017 (“Eligibility Period ”), unless otherwise amended or terminated earlier by Facebook, Inc. (“ Facebook ” or the “ Company ”) in accordancewith Section 6 of the Plan. The Plan supersedes all prior bonus plans, except those set forth in an individual written bonus arrangement withan individual employee in which case this Plan shall not apply. Any other such bonus plan is hereby terminated.
2. Administration . The Plan shall be administered by the Compensation and Governance Committee of the Company’s Board of Directors(“ Plan Administrator ”), which shall have the discretionary authority to interpret and administer the Plan, including all terms definedherein, and to adopt rules and regulations to implement the Plan, as it deems necessary. In addition, the Plan Administrator hereby delegatesto the Company’s CFO and the VP of Human Resources (such individuals, the “ Executive Administrators ” and together with the PlanAdministrator, the “ Administrators ”) the day-to-day implementation and interpretation of the Plan, including the approval of individualpayouts under the Plan to employees other than to its “executive officers” (as determined by the Company’s Board of Directors (“ Board ”)for purposes of Section 16 under the Securities Exchange Act of 1934).
Notwithstanding the foregoing, the approval of the Plan Administrator or the Board shall be required for the approval of the Plan itself, anyearly termination and material amendments to the Plan; determination of the Company Performance Percentage (as defined below) under thePlan; approval of the aggregate payout under the Plan; and approval of individual payouts under the Plan to Facebook’s executive officers.Any action that requires the approval of the Executive Administrators must be jointly approved by both the Company’s CFO and the VP ofHuman Resources, and any action that requires the approval of the Executive Administrators may instead also be approved by the PlanAdministrator or the Board. The decisions of the Administrators are final and binding.
3. Eligibility. Participation in the Plan is limited to Full-Time regular and Part-Time regular employees of Facebook or its subsidiaries 1 whoare employed by Facebook or a subsidiary on or before December 31, 2017. Participation in the Plan is effective on the later of January 1,2017 or the day, during the Eligibility Period, the participant commences employment as a Full-Time regular or Part-Time regular employeeof Facebook or a subsidiary.
1 For purposes of this Plan, an eligible employee includes only individuals that the Company or a subsidiary treats as an employee for employment tax purposes.Interns, contingent workers, agency workers, contractors, and other workers (including any such individuals who are for any reason later re-characterized asemployees), are not eligible. Temporary, fixed term or short term employees are not eligible to participate in this Plan, unless specifically provided for in theindividual’s offer letter. In some jurisdictions outside the U.S., temporary, fixed term or short term employees may be eligible for a separate bonus program,pursuant to terms in the individual’s offer letter.
Page 1 of 4

An individual who may otherwise be a participant may be considered ineligible to participate in the Plan at any time and for any reason at theAdministrators’ discretion regardless of whether the individual remains a Full Time regular or Part-Time regular employee of the Company.An otherwise eligible individual is no longer eligible for any Plan bonus if the individual resigns his/her employment or his/her employmentis terminated for any reason any time before the bonus is paid pursuant to Section 5 below. One of the key purposes of this Plan is toencourage employee retention through and until the date(s) bonuses under this Plan are paid.
4. Determination of Eligibility and Amounts. The Administrators retain sole and absolute discretion in determining whether a participantwill be eligible for a semi-annual cash bonus that is paid based on the following formulas and definitions.
Subject to approval of the Company Performance Percentage by the Plan Administrator or the Board, the Executive Administrators willdetermine the actual bonus (if any) for each participant and have the sole and absolute discretion to determine the Individual PerformancePercentage and the amounts as described herein (provided that any determinations in respect of Facebook’s executive officers shall be madeby the Plan Administrator):
a) Non-Sales Incentive Plan Employees:
Base Eligible Earnings x Corporate Bonus Percentage x Individual Performance Percentage x Company Performance Percentage.
b) Sales Incentive Plan Employees:
Base Eligible Earnings x Corporate Bonus Percentage x (Company Performance Percentage - 100%). 2
c) Definitions:
1) “Base Eligible Earnings” means the sum of all base wages as determined by the Company and the Executive Administrators intheir sole and absolute discretion (generally including overtime, retro pay, money paid during a leave of absence by the Company or asubsidiary, personal time off (PTO) used during the period and holiday pay as applicable) that Facebook or a subsidiary paid the participantduring the semi-annual performance period generally, excluding bonuses, stock gains, commissions, relocation amounts, accrued but unusedPTO, expense reimbursements, and other benefits.
2) “ Corporate Bonus Percentage ” means the percentage of a participant’s Base Eligible Earnings as established by the ExecutiveAdministrators for a participant’s position (provided that the Corporate Bonus Percentage for executive officers shall be established by thePlan Administrator).
2 If the Company Performance Percentage is below 100%, Sales Incentive Plan Employees will not be eligible for a bonus payout under this Plan.
Page 2 of 4

3) “ Individual Performance Percentage ” is tied to the performance assessments, as determined by the Company or a subsidiary,measuring the amount of success a participant has achieved against his/her individual performance objectives for the semi-annualperformance period.
4) “ Company Performance Percentage ” means the amount of success the Company has achieved based on the Company’spriorities and other factors deemed appropriate for the applicable semi-annual performance period, as determined in the sole discretion andjudgment of the Plan Administrator or the Board.
5. Payment of Bonuses . Payment of each semi-annual cash bonus (if any) shall be made as follows:
a) For the first semi-annual performance period (January 1 through June 30, 2017): no later than September 30, 2017; and
b) For the second semi-annual performance period (July 1 through December 31, 2017): no later than March 15, 2018 for U.S.participants and no later than March 31, 2018 for non-U.S. participants.
Because retention is one of the key purposes of the Plan, a participant must be employed by the Company or a subsidiary at the time eachsemi-annual bonus is paid in order for the participant to remain eligible to receive such bonus unless local law or a written agreementbetween the participant and the Company or a subsidiary requires otherwise.
6. Modification or Termination of the Plan. The Company reserves the right to modify, suspend or terminate all or any portion of this Planat any time, provided that any early termination and material modification to the Plan shall be approved by the Plan Administrator or theBoard.
7. Benefits Unfunded . No bonus amounts to be awarded or accrued under this Plan will be funded, set aside or otherwise segregated prior topayment. Bonus amounts awarded under this Plan will at all times be an unfunded and unsecured obligation of the Company. Planparticipants will have the status of general creditors and must look solely to the general assets of the Company for the payment of bonusawards.
8. Benefits Nontransferable . No Plan participant will have the right to alienate, pledge or encumber his/her interest in this Plan, and suchinterest will not (to the extent permitted by law) be subject in any way to the claims of the participant’s creditors or to attachment, executionor other process of law.
9. No Employment Rights . No action of the Company in establishing the Plan, no action taken under the Plan by the Company or theAdministrators and no provision of the Plan itself will be construed to establish an employment relationship with any entity other than theentity that the employee signed an offer letter with nor will it be construed to grant any person the right to remain in the employ of theCompany or its subsidiaries for any period of specific duration. Rather, subject to applicable law, each employee is employed “at will,” whichmeans that either the employee or the Company or its subsidiaries may terminate the employment relationship at any time and for any reasonor no particular reason or cause.
10. Governing Law. The Plan shall be governed by, and interpreted, construed, and enforced in accordance with, the laws of the State ofCalifornia without regard to its or any other jurisdiction's conflicts of laws provisions. For purposes of any dispute that may arise directly orindirectly from this Plan, the parties hereby
Page 3 of 4

submit and consent to the exclusive jurisdiction of the State of California and agree that any such litigation shall be conducted only in thecourts of California or the federal courts for the United States for the Northern District of California and no other courts.
11. Severability . If any part or section of this Plan is declared invalid by any competent body, the remaining parts not affected by thedecision shall continue in effect.
12. Transfers, Job Changes & Rehire . Subject to the discretion of the Administrators, a participant’s semi-annual cash bonus is based uponthe participant’s total Base Eligible Earnings received by the participant within the applicable semi-annual performance period whilecontinuously employed by the Company or a subsidiary of the Company.
Employees who separate from employment with the Company or a subsidiary and are re-hired by the Company or a subsidiary within thesame semi-annual performance period may be eligible to receive a bonus for that semi-annual performance period based solely on theemployee's Base Eligible Earnings received by the participant after the date of re-hire.
13. Code section 409A of the Internal Revenue Code of 1986 . It is the Company’s intent that payments made under this Plan to U.S.participants should meet the requirements for the “short-term deferral” exception to Section 409A of the U.S. Internal Revenue Code of 1986,as amended.
Page 4 of 4

EXHIBIT 21.1 LIST OF SUBSIDIARIES
FACEBOOK, INC. Andale, Inc. (Delaware)Cassin Networks ApS (Denmark)Edge Network Services Limited (Ireland)Facebook International Operations Limited (Ireland)Facebook Ireland Holdings Unlimited (Ireland)Facebook Ireland Limited (Ireland)Facebook Operations, LLC (Delaware)Facebook Sweden Holdings AB (Sweden)FCL Tech Limited (Ireland)Global Holdings I Inc. (Delaware)Global Holdings I LLC (Delaware)Global Holdings II LLC (Delaware)Greater Kudu, LLC (Delaware)Instagram, LLC (Delaware)KUSU PTE. Ltd. (Singapore)Oculus VR, LLC (Delaware)Parse, LLC (Delaware)Pinnacle Sweden AB (Sweden)Raven Northbrook, LLC (Delaware)Runways Information Services Ltd (Ireland)Scout Development, LLC (Delaware)Siculus, Inc. (Delaware)Sidecat, LLC (DelawareVitesse, LLC (Delaware)WhatsApp Inc. (Delaware)Winner, LLC (Delaware)

EXHIBIT 23.1
Consent of Independent Registered Public Accounting Firm
We consent to the incorporation by reference in the following Registration Statements:
(1) Registration Statement (Form S-8 No. 333-186402) pertaining to the 2012 Equity Incentive Plan of Facebook, Inc.,(2) Registration Statement (Form S-8 No. 333-181566) pertaining to the 2005 Officers’ Stock Plan, 2005 Stock Plan, and 2012 Equity Incentive
Plan of Facebook, Inc., and(3) Registration Statement (Form S-8 No. 333-199172) pertaining to the Non-Plan Restricted Stock Unit Awards of Facebook, Inc.
of our reports dated February 1, 2018, with respect to the consolidated financial statements of Facebook, Inc. and the effectiveness of internal control over financialreporting of Facebook, Inc. included in this Annual Report (Form 10-K) of Facebook, Inc. for the year ended December 31, 2017.
/s/ Ernst & Young LLP
San Francisco, CaliforniaFebruary 1, 2018
EXHIBIT 31.1
CERTIFICATION OF PERIODIC REPORT UNDER SECTION 302 OFTHE SARBANES-OXLEY ACT OF 2002
I, Mark Zuckerberg, certify that:
1. I have reviewed this annual report on Form 10-K of Facebook, Inc.;
2. Based on my knowledge, this report does not contain any untrue statement of a material fact or omit to state a material fact necessary to make the statementsmade, in light of the circumstances under which such statements were made, not misleading with respect to the period covered by this report;
3. Based on my knowledge, the financial statements, and other financial information included in this report, fairly present in all material respects the financialcondition, results of operations and cash flows of the registrant as of, and for, the periods presented in this report;
4. The registrant’s other certifying officer and I are responsible for establishing and maintaining disclosure controls and procedures (as defined in Exchange ActRules 13a-15(e) and 15d-15(e)) and internal control over financial reporting (as defined in Exchange Act Rules 13a-15(f) and 15d-15(f)) for the registrant andhave:
a) Designed such disclosure controls and procedures, or caused such disclosure controls and procedures to be designed under our supervision, to ensure thatmaterial information relating to the registrant, including its consolidated subsidiaries, is made known to us by others within those entities, particularly during theperiod in which this report is being prepared;
b) Designed such internal control over financial reporting, or caused such internal control over financial reporting to be designed under our supervision, to providereasonable assurance regarding the reliability of financial reporting and the preparation of financial statements for external purposes in accordance with generallyaccepted accounting principles;
c) Evaluated the effectiveness of the registrant’s disclosure controls and procedures and presented in this report our conclusions about the effectiveness of thedisclosure controls and procedures, as of the end of the period covered by this report based on such evaluation; and
d) Disclosed in this report any change in the registrant’s internal control over financial reporting that occurred during the registrant’s most recent fiscal quarter (theregistrant’s fourth fiscal quarter in the case of an annual report) that has materially affected, or is reasonably likely to materially affect, the registrant’s internalcontrol over financial reporting; and
5. The registrant’s other certifying officer and I have disclosed, based on our most recent evaluation of internal control over financial reporting, to the registrant’sauditors and the audit committee of the registrant’s board of directors (or persons performing the equivalent functions):
a) All significant deficiencies and material weaknesses in the design or operation of internal control over financial reporting which are reasonably likely toadversely affect the registrant’s ability to record, process, summarize and report financial information; and
b) Any fraud, whether or not material, that involves management or other employees who have a significant role in the registrant’s internal control over financialreporting.
Date: February 1, 2018 /s/ MARK ZUCKERBERG Mark Zuckerberg Chairman and Chief Executive Officer (Principal Executive Officer)

EXHIBIT 31.2
CERTIFICATION OF PERIODIC REPORT UNDER SECTION 302 OFTHE SARBANES-OXLEY ACT OF 2002
I, David M. Wehner, certify that:
1. I have reviewed this annual report on Form 10-K of Facebook, Inc.;
2. Based on my knowledge, this report does not contain any untrue statement of a material fact or omit to state a material fact necessary to make the statementsmade, in light of the circumstances under which such statements were made, not misleading with respect to the period covered by this report;
3. Based on my knowledge, the financial statements, and other financial information included in this report, fairly present in all material respects the financialcondition, results of operations and cash flows of the registrant as of, and for, the periods presented in this report;
4. The registrant’s other certifying officer and I are responsible for establishing and maintaining disclosure controls and procedures (as defined in Exchange ActRules 13a-15(e) and 15d-15(e)) and internal control over financial reporting (as defined in Exchange Act Rules 13a-15(f) and 15d-15(f)) for the registrant andhave:
a) Designed such disclosure controls and procedures, or caused such disclosure controls and procedures to be designed under our supervision, to ensure thatmaterial information relating to the registrant, including its consolidated subsidiaries, is made known to us by others within those entities, particularly during theperiod in which this report is being prepared;
b) Designed such internal control over financial reporting, or caused such internal control over financial reporting to be designed under our supervision, to providereasonable assurance regarding the reliability of financial reporting and the preparation of financial statements for external purposes in accordance with generallyaccepted accounting principles;
c) Evaluated the effectiveness of the registrant’s disclosure controls and procedures and presented in this report our conclusions about the effectiveness of thedisclosure controls and procedures, as of the end of the period covered by this report based on such evaluation; and
d) Disclosed in this report any change in the registrant’s internal control over financial reporting that occurred during the registrant’s most recent fiscal quarter (theregistrant’s fourth fiscal quarter in the case of an annual report) that has materially affected, or is reasonably likely to materially affect, the registrant’s internalcontrol over financial reporting; and
5. The registrant’s other certifying officer and I have disclosed, based on our most recent evaluation of internal control over financial reporting, to the registrant’sauditors and the audit committee of the registrant’s board of directors (or persons performing the equivalent functions):
a) All significant deficiencies and material weaknesses in the design or operation of internal control over financial reporting which are reasonably likely toadversely affect the registrant’s ability to record, process, summarize and report financial information; and
b) Any fraud, whether or not material, that involves management or other employees who have a significant role in the registrant’s internal control over financialreporting.
Date: February 1, 2018 /s/ DAVID M. WEHNER David M. Wehner Chief Financial Officer (Principal Financial Officer)

EXHIBIT 32.1
CERTIFICATION PURSUANT TO18 U.S.C. SECTION 1350
AS ADOPTED PURSUANT TO SECTION 906OF THE SARBANES-OXLEY ACT OF 2002
I, Mark Zuckerberg, Chairman and Chief Executive Officer of Facebook, Inc. (Company), do hereby certify, pursuant to 18 U.S.C. Section 1350, as adoptedpursuant to Section 906 of the Sarbanes-Oxley Act of 2002, that to the best of my knowledge:
• the Annual Report on Form 10-K of the Company for the year ended December 31, 2017 (Report) fully complies with the requirements of Section 13(a) or15(d) of the Securities Exchange Act of 1934; and
• the information contained in the Report fairly presents, in all material respects, the financial condition and results of operations of the Company for theperiods presented therein.
Date: February 1, 2018 /s/ MARK ZUCKERBERG Mark Zuckerberg Chairman and Chief Executive Officer (Principal Executive Officer)

EXHIBIT 32.2
CERTIFICATION PURSUANT TO18 U.S.C. SECTION 1350
AS ADOPTED PURSUANT TO SECTION 906OF THE SARBANES-OXLEY ACT OF 2002
I, David M. Wehner, Chief Financial Officer of Facebook, Inc. (Company), do hereby certify, pursuant to 18 U.S.C. Section 1350, as adopted pursuant toSection 906 of the Sarbanes-Oxley Act of 2002, that to the best of my knowledge:
• the Annual Report on Form 10-K of the Company for the year ended December 31, 2017 (Report) fully complies with the requirements of Section 13(a) or15(d) of the Securities Exchange Act of 1934; and
• the information contained in the Report fairly presents, in all material respects, the financial condition and results of operations of the Company for theperiods presented therein.
Date: February 1, 2018 /s/ DAVID M. WEHNER David M. Wehner Chief Financial Officer (Principal Financial Officer)