facile synthesis and step by step enhancement of blue photoluminescence from ag-doped zns quantum...
TRANSCRIPT
Journal of Colloid and Interface Science 357 (2011) 379–383
Contents lists available at ScienceDirect
Journal of Colloid and Interface Science
www.elsevier .com/locate / jc is
Facile synthesis and step by step enhancement of blue photoluminescencefrom Ag-doped ZnS quantum dots
Sonal Sahai a,b, Mushahid Husain b, Virendra Shanker a, Nahar Singh a, D. Haranath a,⇑a National Physical Laboratory, Council of Scientific and Industrial Research, Dr. K.S. Krishnan Road, New Delhi 110 012, Indiab Department of Physics, Faculty of Natural Science, Jamia Millia Islamia, New Delhi 110 025, India
a r t i c l e i n f o a b s t r a c t
Article history:Received 7 December 2010Accepted 13 February 2011Available online 17 February 2011
Keywords:Zinc sulphideQuantum dotPhotoluminescenceUV photolysisHydrothermal method
0021-9797/$ - see front matter � 2011 Elsevier Inc. Adoi:10.1016/j.jcis.2011.02.030
⇑ Corresponding author. Fax: +91 11 4560 9310.E-mail address: [email protected] (D. Harana
Our results pertaining to the step by step enhancement of photoluminescence (PL) intensity fromZnS:Ag,Al quantum dots (QDs) are presented. Initially, these QDs were synthesized using a simple co-pre-cipitation technique involving a surfactant, polyvinylpyrrolidone (PVP), in de-ionised water. It wasobserved that the blue PL originated from ZnS:Ag,Al QDs was considerably weak and not suitable forany practical display application. Upon UV (365 nm) photolysis, the PL intensity augmented to �170%and attained a saturation value after �100 min of exposure. This is attributed to the photo-corrosionmechanism exerted by high-flux UV light on ZnS:Ag,Al QDs. Auxiliary enhancement of PL intensity to250% has been evidenced by subjecting the QDs to high temperatures (200 �C) and pressures (�120 bars)in a sulphur-rich atmosphere, which is due to the improvement in crystallanity of ZnS QDs. The origin ofthe bright-blue PL has been discussed. The results were supported by X-ray phase analysis, high-resolution electron microscopy and compositional evaluation.
� 2011 Elsevier Inc. All rights reserved.
1. Introduction
Over the past few years, scientists have been working exten-sively over quantum dot (QD) systems and demonstrating changesin their electrical, mechanical, optical as well as structural proper-ties from their bulk counterparts [1]. The optical properties in QDsystems is useful for various applications such as full colour displaydevices, white LEDs, photovoltaic cells, bio-imaging and othermedical related applications [2–7]. Over the decades, zinc sulphide(ZnS), a wide and direct band gap ðEg bulk ¼ 3:6 eVÞ semiconductorhaving exciton Bohr radius, RB = 2.5 nm, has been studied to mod-ify the colour of emission using dopants such as Mn2+ and isovalentimpurities or complexes [8–12]. Bhargava et al. showed for the firsttime an efficient yellowish-orange emission in ZnS:Mn2+ [12].Afterwards, there came up many reports for generating efficientand bright orange–red (�590 nm) photoluminescence (PL) fromMn2+ doped ZnS QDs [13–16], which is the most studied system.
Another QD system, which is moderately explored is Cu+ dopedZnS that gives green (�530 nm) PL. The researchers have adoptedseveral mechanisms to incorporate the Cu ion in its single valance(+1) state into the ZnS lattice so that green PL could be obtained.For example, by reducing the salts of Cu2+ to Cu+ state or by chelat-ing Cu+ ion and then incorporating it in the ZnS host lattice [17,18].There exist reports on blue PL from ZnS QD systems also, which is
ll rights reserved.
th).
mostly attributed from the surface related defect states [19–22]and/or Ag+ doping in ZnS QDs [17]. However, the brightness levelsof blue PL from ZnS QDs are weak, that limited the practical appli-cations. On the other hand, it is known that ZnS:Ag,Al in its bulkform, is an efficient phosphor [23,24]. The current research workis an attempt to achieve stable and efficient blue PL from QDs ofZnS:Ag,Al for displays that promises better resolution, brightnessand contrast.
In this paper, we report a novel method for significantly increas-ing the PL intensity of ZnS:Ag,Al QDs prepared by wet-chemicalroute. This is comprised of three consecutive processes viz. prepa-ration of ZnS QDs by co-precipitation; UV photolysis (UVP); andUVP together with a polysulphide hydrothermal (UVP + PSH) treat-ment. As of now, UVP treatment has been reported to improve thePL intensity for QDs such as CdSe, CdS, PbSe and ZnS:Mn2+ [25–29].For the first time Bhargava’s group [30,31] has attempted the pho-ton induced passivation of surface-states of ZnSMn2+ QDs usingmethacrylic acid and poly(methyl methacrylate) polymer as sur-factant. The process resulted in efficient surfactant adsorptionand improved the luminescence efficiency of Mn2+-doped ZnSnanocrystals. But such treatment on ZnS:Ag,Al QDs for betterincorporation of Ag (dopant) has not been explored so far. Hence,we report a systematic study of UVP treatment on the PL intensityof ZnS:Ag,Al QDs as a function of UV exposure on time-base. Inaddition to that, we report the development of a novel polysul-phide hydrothermal (PSH) method, which resulted in increasedyield of ZnS QDs with improved morphological, optical and

380 S. Sahai et al. / Journal of Colloid and Interface Science 357 (2011) 379–383
structural properties. Hydrothermal is known to be an efficientmethod to synthesize monodispersed nanocrystalline materials.The method is best for the synthesis of oxide nanoparticles [32–35], however, there exist reports on synthesis of sulphide nanopar-ticles also [36]. In preparation of sulphide nanoparticles, generallyZn:S molar ratio could not be maintained giving rise to the defectsrelated to sulphur vacancies and sometimes formation of oxy-sulphide phases. In the present work, it is supposed that the useof the polysulphide hydrothermal method over hydrothermalcould maintain the Zn:S molar ratio.
2. Material and methods
To enhance the PL properties, ZnS:Ag,Al QDs were preparedusing co-precipitation [12,22] method followed by UVP andUVP + PSH treatments. The detailed steps of ZnS QD preparationare illustrated in Fig. 1. The precursor chemicals such as zinc ace-tate [Zn(CH3COO)2�2H2O], silver nitrate [AgNO3], aluminium ni-trate [Al2(NO3)3�9H2O] and sodium sulphide [Na2S] were used asprocured from Sigma Aldrich without any further purification. Ina typical experiment, AgNO3 and Al2(NO3)3�9H2O were dissolvedusing de-ionised water (DIW), from Millipore. To this clear solu-tion, calculated amount of polyvinylpyrrolidone (PVP) was addedand stirred for 15 min, say solution ‘A’. Stoichiometric amount ofaluminium salt was added in order to compensate the charge con-flict between Zn2+ and Ag+ ions. Secondly, KCl and Zn(CH3CHOO)2
were dissolved in DIW; and Na2S in DIW; say solutions ‘B’ and‘C’, respectively. To start with, solutions ‘A’ and ‘B’ were mixedthoroughly at room temperature (�25 �C) for 15 min and storedup along with solution ‘C’ separately in a Julabo F-25 chilling bathmaintained at 5 ± 0.1 �C. After an hour of chilling, solution ‘C’ wasadded drop-wise to the above mixture of solutions under continu-ous stirring. Slight turbidity (white) appeared in the solution after25 min, which indicates the formation of ZnS QDs. This colloidalsolution was further divided into three parts and subjected toambient conditions, UVP and UVP + PSH treatments, respectively.For UVP, the samples were irradiated for �180 min by 125 Whigh-flux UV lamp having wavelength of 365 nm, whereas, forPSH treatment, the UV irradiated sample was cooked with a poly-sulphide solution in a high temperature–pressure autoclave for 2 h.The ratio of silver to zinc mentioned in Fig. 1 is the optimized va-lue. However, there observed a black precipitate of Ag2S formationinstead of Ag-doped ZnS, when we increase the ratio >2%.
Fig. 1. Flow-chart describing preparation of ZnS:Ag,Al QD by co-precipitation follow
For X-ray diffraction (XRD) analysis, QD agglomerates were pre-cipitated out from solution by adding sufficient amount of ethanoland aging them for one week in a dehumidifier chamber. To deter-mine the phase purity of the ZnS QDs, the crystalline data was ob-tained by X-ray diffractometer (XRD); Bruker-AXS D8 Advancesystem using Cu Ka (k � 1.54056 Å) with step size of 0.01 at0.15 steps/s. High-resolution transmission electron microscopy(HRTEM) was used to record the images of ZnS QDs with FEI (Tech-nai G2 20 S-Twin) transmission electron microscope operating at200 kV. The room-temperature photoluminescence (PL) spectrawere recorded at regular intervals of time by PerkinElmer LS-55spectrophotometer keeping the instrument settings constant forall the samples at the scan speed of 300 nm/min. Time-resolvedphotoluminescence (TRPL) spectrum was recorded using a micro-second xenon flash lamp and a nanosecond hydrogen flash lamp,respectively as the source of excitations, attached to luminescencespectrometer (Edinburgh F-900). Unfortunately, we could not ob-serve any shorter relaxation processes that are in the nano or picorange with the use of nanosecond hydrogen flash lamp.
3. Results and discussion
3.1. UV photolysis
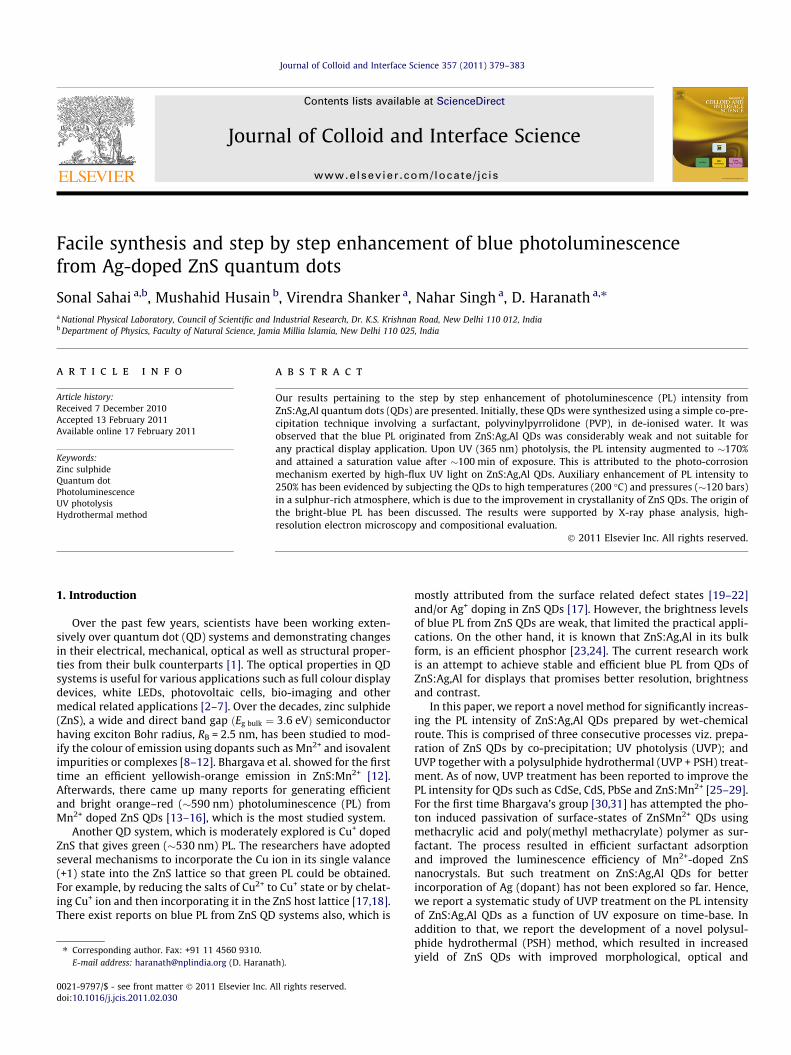
UV photolysis (UVP) is a versatile phenomenon of increasing PLintensity of QDs by the irradiation of high-flux UV light. This is animportant step to enhance the luminescence and has been ob-served in many of the QD systems such as CdS, CdSe, and PbSe[25–29]. This increase of PL has also been named as ‘‘photo-activation’’. The photo-activation of QDs was first time reportedby Cordero et al. [25] in CdSe nanoparticles. ZnS based QD systemswere less explored for increase in PL intensity by UV photolysis.However, there are few reports where increase in PL has beenobserved, when ZnS:Mn2+ nanoparticles were irradiated by UVlight [13,30]. Here, we report a detailed study on increase in PLintensity of ZnS:Ag,Al QDs by UVP mechanism using high flux(125 W) and monochromatic (365 nm) UV lamp. The effect ofUVP process on PL enhancement of ZnS:Ag,Al QDs is shown inFig. 2. It has been observed that PL intensity increases with UV irra-diation time and gets saturated after �100 min. The reason for PLenhancement in ZnS:Ag,Al samples by UVP could be understoodas the adsorption of water molecules on the surface of QDs duringthe early illumination times and photo-corrosion due to oxygen
ed by UV photolysis (UVP) and polysulphide hydrothermal (PSH) treatments.
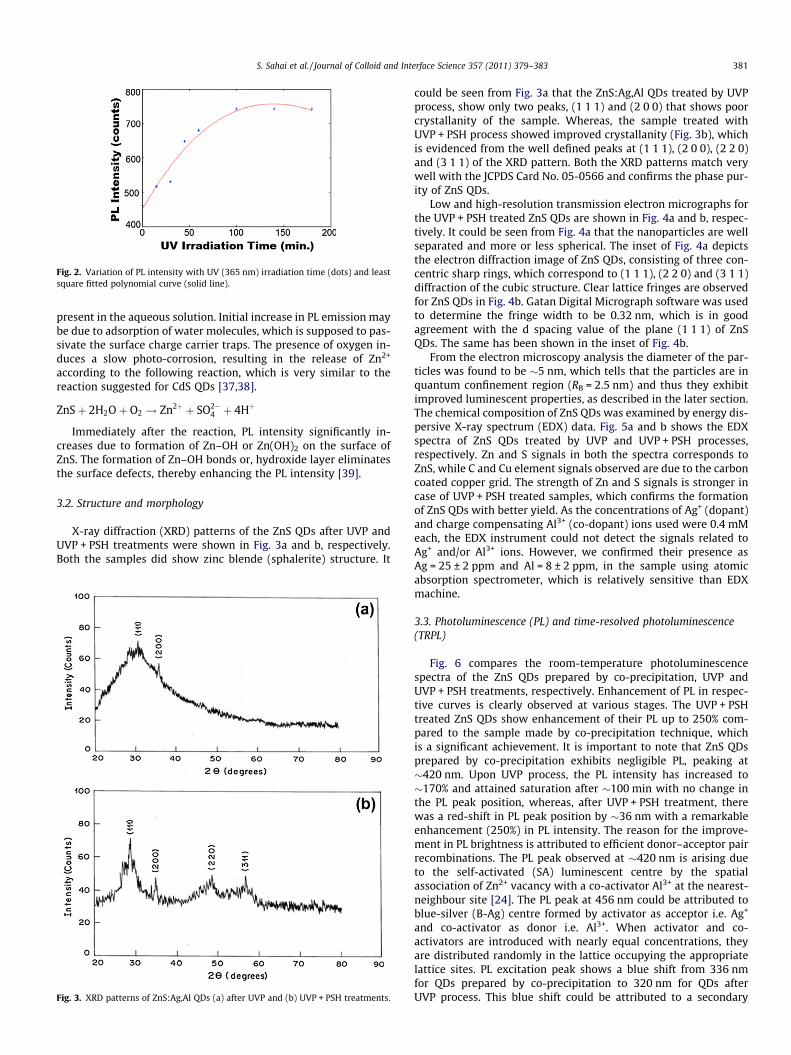
Fig. 2. Variation of PL intensity with UV (365 nm) irradiation time (dots) and leastsquare fitted polynomial curve (solid line).
S. Sahai et al. / Journal of Colloid and Interface Science 357 (2011) 379–383 381
present in the aqueous solution. Initial increase in PL emission maybe due to adsorption of water molecules, which is supposed to pas-sivate the surface charge carrier traps. The presence of oxygen in-duces a slow photo-corrosion, resulting in the release of Zn2+
according to the following reaction, which is very similar to thereaction suggested for CdS QDs [37,38].
ZnSþ 2H2Oþ O2 ! Zn2þ þ SO2�4 þ 4Hþ
Immediately after the reaction, PL intensity significantly in-creases due to formation of Zn–OH or Zn(OH)2 on the surface ofZnS. The formation of Zn–OH bonds or, hydroxide layer eliminatesthe surface defects, thereby enhancing the PL intensity [39].
3.2. Structure and morphology
X-ray diffraction (XRD) patterns of the ZnS QDs after UVP andUVP + PSH treatments were shown in Fig. 3a and b, respectively.Both the samples did show zinc blende (sphalerite) structure. It
Fig. 3. XRD patterns of ZnS:Ag,Al QDs (a) after UVP and (b) UVP + PSH treatments.
could be seen from Fig. 3a that the ZnS:Ag,Al QDs treated by UVPprocess, show only two peaks, (1 1 1) and (2 0 0) that shows poorcrystallanity of the sample. Whereas, the sample treated withUVP + PSH process showed improved crystallanity (Fig. 3b), whichis evidenced from the well defined peaks at (1 1 1), (2 0 0), (2 2 0)and (3 1 1) of the XRD pattern. Both the XRD patterns match verywell with the JCPDS Card No. 05-0566 and confirms the phase pur-ity of ZnS QDs.
Low and high-resolution transmission electron micrographs forthe UVP + PSH treated ZnS QDs are shown in Fig. 4a and b, respec-tively. It could be seen from Fig. 4a that the nanoparticles are wellseparated and more or less spherical. The inset of Fig. 4a depictsthe electron diffraction image of ZnS QDs, consisting of three con-centric sharp rings, which correspond to (1 1 1), (2 2 0) and (3 1 1)diffraction of the cubic structure. Clear lattice fringes are observedfor ZnS QDs in Fig. 4b. Gatan Digital Micrograph software was usedto determine the fringe width to be 0.32 nm, which is in goodagreement with the d spacing value of the plane (1 1 1) of ZnSQDs. The same has been shown in the inset of Fig. 4b.
From the electron microscopy analysis the diameter of the par-ticles was found to be �5 nm, which tells that the particles are inquantum confinement region (RB = 2.5 nm) and thus they exhibitimproved luminescent properties, as described in the later section.The chemical composition of ZnS QDs was examined by energy dis-persive X-ray spectrum (EDX) data. Fig. 5a and b shows the EDXspectra of ZnS QDs treated by UVP and UVP + PSH processes,respectively. Zn and S signals in both the spectra corresponds toZnS, while C and Cu element signals observed are due to the carboncoated copper grid. The strength of Zn and S signals is stronger incase of UVP + PSH treated samples, which confirms the formationof ZnS QDs with better yield. As the concentrations of Ag+ (dopant)and charge compensating Al3+ (co-dopant) ions used were 0.4 mMeach, the EDX instrument could not detect the signals related toAg+ and/or Al3+ ions. However, we confirmed their presence asAg = 25 ± 2 ppm and Al = 8 ± 2 ppm, in the sample using atomicabsorption spectrometer, which is relatively sensitive than EDXmachine.
3.3. Photoluminescence (PL) and time-resolved photoluminescence(TRPL)
Fig. 6 compares the room-temperature photoluminescencespectra of the ZnS QDs prepared by co-precipitation, UVP andUVP + PSH treatments, respectively. Enhancement of PL in respec-tive curves is clearly observed at various stages. The UVP + PSHtreated ZnS QDs show enhancement of their PL up to 250% com-pared to the sample made by co-precipitation technique, whichis a significant achievement. It is important to note that ZnS QDsprepared by co-precipitation exhibits negligible PL, peaking at�420 nm. Upon UVP process, the PL intensity has increased to�170% and attained saturation after �100 min with no change inthe PL peak position, whereas, after UVP + PSH treatment, therewas a red-shift in PL peak position by �36 nm with a remarkableenhancement (250%) in PL intensity. The reason for the improve-ment in PL brightness is attributed to efficient donor–acceptor pairrecombinations. The PL peak observed at �420 nm is arising dueto the self-activated (SA) luminescent centre by the spatialassociation of Zn2+ vacancy with a co-activator Al3+ at the nearest-neighbour site [24]. The PL peak at 456 nm could be attributed toblue-silver (B-Ag) centre formed by activator as acceptor i.e. Ag+
and co-activator as donor i.e. Al3+. When activator and co-activators are introduced with nearly equal concentrations, theyare distributed randomly in the lattice occupying the appropriatelattice sites. PL excitation peak shows a blue shift from 336 nmfor QDs prepared by co-precipitation to 320 nm for QDs afterUVP process. This blue shift could be attributed to a secondary
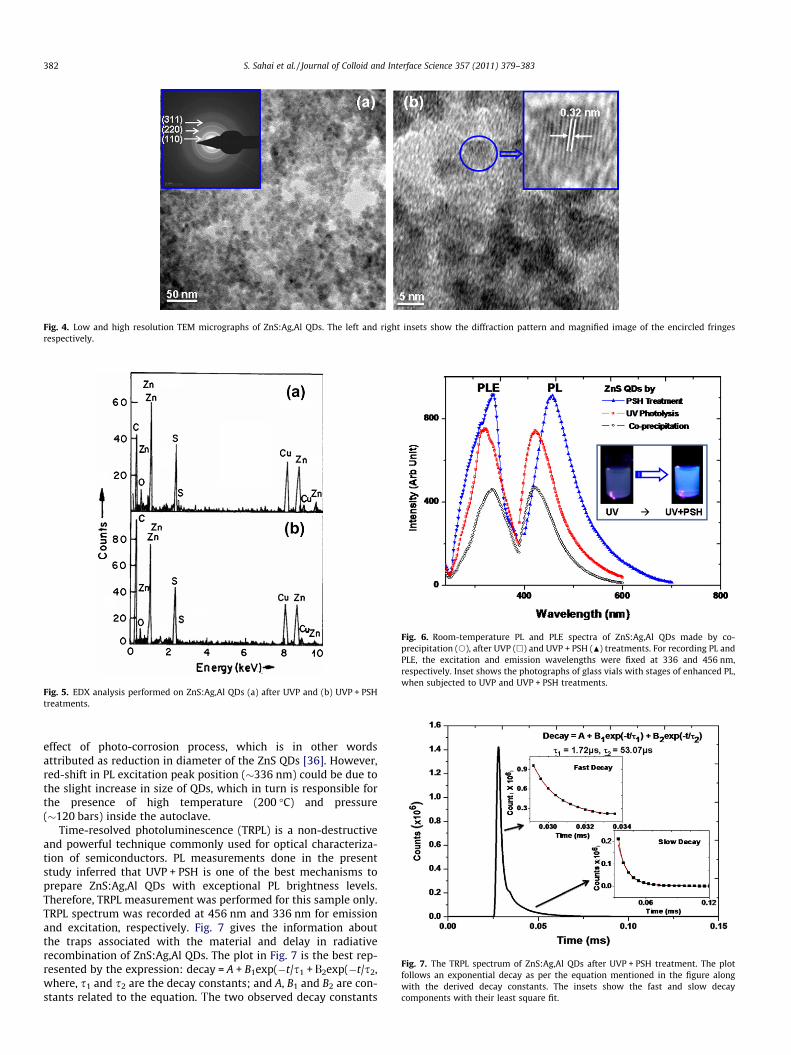
Fig. 4. Low and high resolution TEM micrographs of ZnS:Ag,Al QDs. The left and right insets show the diffraction pattern and magnified image of the encircled fringesrespectively.
Fig. 5. EDX analysis performed on ZnS:Ag,Al QDs (a) after UVP and (b) UVP + PSHtreatments.
Fig. 6. Room-temperature PL and PLE spectra of ZnS:Ag,Al QDs made by co-precipitation (s), after UVP (h) and UVP + PSH (N) treatments. For recording PL andPLE, the excitation and emission wavelengths were fixed at 336 and 456 nm,respectively. Inset shows the photographs of glass vials with stages of enhanced PL,when subjected to UVP and UVP + PSH treatments.
Fig. 7. The TRPL spectrum of ZnS:Ag,Al QDs after UVP + PSH treatment. The plotfollows an exponential decay as per the equation mentioned in the figure alongwith the derived decay constants. The insets show the fast and slow decaycomponents with their least square fit.
382 S. Sahai et al. / Journal of Colloid and Interface Science 357 (2011) 379–383
effect of photo-corrosion process, which is in other wordsattributed as reduction in diameter of the ZnS QDs [36]. However,red-shift in PL excitation peak position (�336 nm) could be due tothe slight increase in size of QDs, which in turn is responsible forthe presence of high temperature (200 �C) and pressure(�120 bars) inside the autoclave.
Time-resolved photoluminescence (TRPL) is a non-destructiveand powerful technique commonly used for optical characteriza-tion of semiconductors. PL measurements done in the presentstudy inferred that UVP + PSH is one of the best mechanisms toprepare ZnS:Ag,Al QDs with exceptional PL brightness levels.Therefore, TRPL measurement was performed for this sample only.TRPL spectrum was recorded at 456 nm and 336 nm for emissionand excitation, respectively. Fig. 7 gives the information aboutthe traps associated with the material and delay in radiativerecombination of ZnS:Ag,Al QDs. The plot in Fig. 7 is the best rep-resented by the expression: decay = A + B1exp(�t/s1 + D2exp(�t/s2,where, s1 and s2 are the decay constants; and A, B1 and B2 are con-stants related to the equation. Nhe two observed decay constants

S. Sahai et al. / Journal of Colloid and Interface Science 357 (2011) 379–383 383
are associated with fast and slow decay components having thevalue s 1.72 ls (s1 and 53.07 ls (s2 respectively. The two decaycomponents are as a result of the two distinct radiative events. First,the fast decay could be ascribed to the direct radiative transitions ofthe excitons from donor to acceptor level while the second, theslower component should be due to the radiative recombinationvia surface-trap sites. Finally, it could be concluded that the shortestradiative lifetimes (�1.7 ls) observed for UVP + PSH treatedZnS:Ag,Al QD samples are the best choice for blue component innano-based display systems, where the fast response is a prerequi-site to avoid image overlapping or ghost-image formation.
4. Conclusions
The steps involved in enhancing the blue photoluminescencefrom ZnS:Ag,Al QDs synthesized using co-precipitation techniquewas systematically investigated. The size of QDs was determinedto be �5 nm, which shows that they are in quantum confined re-gime. It was demonstrated that UV (365 nm) photolysis improvedthe PL intensity to 170% as that of co-precipitated sample; whereasUVP + PSH treatment appreciably improved it to 250%. The highestpossible PL brightness for the blue region is obtained fromUVP + PSH treated QD samples. Finally, the TRPL spectrum of thesehighly luminescent QDs was measured, and concluded that thesamples with the shortest radiative decay time (�1.7 ls) wouldbe the best choice for their use in nanophosphor based display de-vices, so that there is no lag in image transformation.
Acknowledgments
The authors (SS and DH) wish to gratefully acknowledge thehelp rendered by Prof. B.R. Mehta of IIT, Delhi, India, in gettingTEM images of the samples and the Department of Science andTechnology (DST) for the financial support to carry out the aboveresearch work.
References
[1] A.D. Yofee, Adv. Phys. 42 (2) (1993) 173.[2] X. Gao, Y. Cui, R.M. Levenson, L.W.K. Chung, S. Nie, Nat. Biotechnol. 22 (2004)
969.[3] H. Colfen, S. Mann, Angew. Chem. Int. Ed. 42 (2003) 2350.
[4] A.F. Khan, D. Haranath, R. Yadav, S. Singh, S. Chawla, V. Dutta, Appl. Phys. Lett.93 (2008) 073103.
[5] D. Haranath, S. Sahai, P. Joshi, Appl. Phys. Lett. 92 (2008) 233113.[6] S.S. Manoharan, Q. Mohammad, Phys. Status Solidi (a) 202 (6) (2005) 1124.[7] Y.-S. Fu, X.-W. Du, S.A. Kulinich, J.-S. Qiu, W.-J. Qin, R. Li, J. Sun, J. Liu, J. Am.
Chem. Soc. 129 (51) (2007) 16029.[8] William G. Becker, Allen J. Bard, J. Phys. Chem. 87 (1983) 4888–4893.[9] W.W. Anderson, S. Razi, D.J. Walsh, J. Chem. Phys. 43 (4) (1965) 1153.
[10] R. Sobolevskaya, V. Korotkov, L. Bruk, K. Sushkevei, Chalcogenide Lett. 2 (9)(2005) 93–98.
[11] Hai-yan Chen, Xiao-ling Yang, De-dong Hou, Ying-kai Liu, Optoelectron. Lett. 5(3) (2009) 209–211.
[12] R.N. Bhargava, D. Gallagher, X. Hong, A. Nurmikko, Phys. Rev. Lett. 72 (1994)416.
[13] A.A. Bol, A. Meijerink, J. Phys. Chem. B 105 (42) (2001) 10203.[14] D. Adachi, T. Hama, T. Toyama, H. Okamoto, J. Mater. Sci: Mater. Electron. 20
(2009) S130.[15] D. Adachi, S. Hasui, T. Toyama, H. Okamoto, Appl. Phys. Lett. 77 (2000) 1301.[16] H. Yang, P.H. Holloway, B.B. Ratna, J. Appl. Phys. 93 (2003) 586.[17] K. Manzoor, V. Aditya, S.R. Vadhera, N. Kumar, T.R.N. Kutty, Appl. Surf. Sci. 252
(2006) 3968.[18] W. Zhang, H.-R. Lee, Appl. Opt. 49 (14) (2010) 2560.[19] W.G. Becker, A.J. Brad, J. Phys. Chem. 87 (1983) 4888.[20] D. Denzler, M. Olschewski, K. Sattler, J. Appl. Phys. 84 (1981) 2841.[21] H. Li, W.Y. Shih, W.-H. Shih, Nanotechnology 18 (2007) 205604.[22] T. Kuzuya, Y. Tai, S. Yamamuro, K. Sumiyama, Sci. Technol. Adv. Mater. 6
(2005) 84.[23] E.F. Apple, F.E. Williams, J. Electrochem. Soc. 106 (1959) 224.[24] S. Shigeo, M.Y. William, Phosphor Handbook, first ed., CRC Press, USA, 1999.[25] S.R. Cordero, P.J. Carson, R.A. Estabrook, G.F. Strouse, S.K. Buratto, J. Phys.
Chem. B 104 (2000) 12137.[26] M. Jones, J. Nedeljkovic, R.J. Ellingson, A.J. Nozik, G. Rumbles, J. Phys. Chem. B
107 (2003) 11346.[27] Z. Zhelev, R. Jose, T. Nagase, H. Ohba, R. Bakalova, M. Ishikawa, Y. Baba, J.
Photochem. Photobiol. 75 (2004) 99.[28] L. Manna, E.C. Scher, L.-S. Li, A.P. Alivisatos, J. Am. Chem. Soc. 124 (2002) 7136.[29] N.E. Korsunska, M. Dybiec, L. Zhukov, S. Ostapenko, T. Zhukov, Semicond. Sci.
Technol. 20 (2005) 876.[30] R.N. Bhargava, D. Gallagher, T. Welker, J. Lumin. 6061 (1994) 275.[31] D. Gallagher, W.E. Héady, J.M. Racz, R.N. Bhargava, J. Mater. Res. 10 (4) (1995)
870.[32] P.K. Dutta, J.R. Gregg, Chem. Mater. 4 (1992) 843.[33] I.J. Clark, T. Takeuchi, N. Ohtori, D.C. Sinclair, J. Mater. Chem. 9 (1999) 83.[34] G. Li, R.L. Smitch, H. Inomata, J. Am. Chem. Soc. 123 (2001) 11091.[35] Y. Mao, G. Li, Y. Sun, S. Feng, J. Solid State Chem. 149 (2000) 314.[36] X.C. Li, Q. Hua, S. Dake, S. Ge, L. Wei, S. YuanGuang, Sci. China, Ser. B – Chem. 52
(12) (2009) 2134.[37] Y. Wang, Z. Tang, M.A. Correa-Duarte, I. Pastoriza-santos, M. Giersig, N.A.
Kotov, M.L. Liz-Marzan, J. Phys. Chem. B 108 (2004) 15461.[38] K. Sato, S. Kojima, S. Hattori, T. Chiba, K. Ueda-Sarson, T. Torimoto, Y.
Tachibana, S. Kuwabata, Nanotechnology 18 (2007) 465702.[39] C. Carrillo-Carrion, S. Cardenas, B.M. Simonet, M. Valcarcel, Chem. Commun.
(2009) 5214.