facilitating the participation and improvement for …
TRANSCRIPT

FACILITATING THE PARTICIPATION AND
IMPROVEMENT FOR THE
ACCESSIBILITIES FOR THOSE WHO
NEED A SOCIAL SUPPORT
Yoshihiro Kaneko Ph.D.
Institute of Economic Research
Hitotsubashi University
Tokyo, JAPAN
THE POLICY CONCERNS OF A SOCIAL POLICY
COMMON TO ASIAN NATIONS
Advance of Aging
A rise of the necessity of developing social policies related to aging society such as employment of the elderly, pension and health and nursing services
The ratification of United Nation’s Convention of the Rights of person with Disabilities in Asian countries
A rise of the necessity of promoting employment of the people with disabilities through the improvement of the barrier-free accessibility
The purpose of the joint event: Sharing of knowledge and information and promotion of international cooperation about the policies for the participation and improvement for the accessibility for those who need a social support such as disabled and elderly people of Asian nations
Copy-right IER Y-Kaneko
2

PERCENTAGE OF TOTAL POPULATION BY AGE GROUP(60+),
BOTH SEXES OF EAST ASIA AND ASEAN NATIONS (PER 100
TOTAL POPULATION)
3
Cop
y-rig
ht IE
R Y
-Ka
ne
ko
0,0
5,0
10,0
15,0
20,0
25,0
30,0
35,0
40,0
45,0
1980 1985 1990 1995 2000 2005 2010 2015 2020 2025 2030 2035 2040 2045 2050
China
Japan
Mongolia
Republic of Korea
Brunei Darussalam
Cambodia
Indonesia
Lao P.D.R.
Malaysia
Myanmar
Philippines
Singapore
Thailand
Timor-Leste
Viet Nam

PERCENTAGE OF TOTAL POPULATION BY AGE GROUP(65+),
BOTH SEXES OF EAST ASIA AND ASEAN NATIONS (PER 100
TOTAL POPULATION)
4
Cop
y-rig
ht IE
R Y
-Ka
ne
ko
0,0
5,0
10,0
15,0
20,0
25,0
30,0
35,0
40,0
1980 1985 1990 1995 2000 2005 2010 2015 2020 2025 2030 2035 2040 2045 2050
China
Japan
Mongolia
Republic of Korea
Brunei Darussalam
Cambodia
Indonesia
Lao P.D.R.
Malaysia
Myanmar
Philippines
Singapore
Thailand
Timor-Leste
Viet Nam

PERCENTAGE OF AGE GROUP(15-59) TO TOTAL
POPULATION, BOTH SEXES (PER 100 TOTAL
POPULATION)
5
Cop
y-rig
ht IE
R Y
-Ka
ne
ko
0,0
10,0
20,0
30,0
40,0
50,0
60,0
70,0
80,0
1980 1985 1990 1995 2000 2005 2010 2015 2020 2025 2030 2035 2040 2045 2050
China
Japan
Mongolia
Republic of Korea
Brunei Darussalam
Cambodia
Indonesia
Lao P.D.R.
Malaysia
Myanmar
Philippines
Singapore
Thailand
Timor-Leste
Viet Nam

6
Cop
y-rig
ht IE
R Y
-Ka
ne
ko
0,0
10,0
20,0
30,0
40,0
50,0
60,0
70,0
80,0
1980 1985 1990 1995 2000 2005 2010 2015 2020 2025 2030 2035 2040 2045 2050
China
Japan
Mongolia
Republic of Korea
Brunei Darussalam
Cambodia
Indonesia
Lao P.D.R.
Malaysia
Myanmar
Philippines
Singapore
Thailand
Timor-Leste
Viet Nam
PERCENTAGE OF AGE GROUP(15-64) TO TOTAL POPULATION,
BOTH SEXES OF EAST ASIA AND ASEAN NATIONS (PER 100
TOTAL POPULATION)

POTENTIAL SUPPORT RATIO BY AGE GROUP(15-64)(RATIO OF
POPULATION BY AGE GROUP(15-64) PER POPULATION 65+)
7
Cop
y-rig
ht IE
R Y
-Ka
ne
ko
0,0
5,0
10,0
15,0
20,0
25,0
30,0
35,0
40,0
1980 1985 1990 1995 2000 2005 2010 2015 2020 2025 2030 2035 2040 2045 2050
China
Japan
Mongolia
Republic of Korea
Brunei Darussalam
Cambodia
Indonesia
Lao P.D.R.
Malaysia
Myanmar
Philippines
Singapore
Thailand
Timor-Leste
Viet Nam

ECONOMIC GROWTH RATE (GROWTH RATE OF GDP
(RATIO FOR THE PREVIOUS YEAR))
8
Cop
y-rig
ht IE
R Y
-Ka
ne
ko
y = -0,1837x + 9,8862R² = 0,6504
y = 0,3474x + 1,9201R² = 0,9278
-10,0
-5,0
0,0
5,0
10,0
15,0
20,0
25,0
30,0
19
56
19
58
19
60
19
62
19
64
19
66
19
68
19
70
19
72
19
74
19
76
19
78
19
80
19
82
19
84
19
86
19
88
19
90
19
92
19
94
19
96
19
98
20
00
20
02
20
04
20
06
20
08
20
10
20
12
20
14
Growth rate ofGDP(ratio forthe previousyear)
Elderly ratio(65+)
Linear (Growthrate ofGDP(ratio forthe previousyear))
Linear (Elderlyratio (65+))
Linear (Elderlyratio (65+))

NUMBER OF PERSONS WITH DISABILITIES OF JAPAN
(ESTIMATE)
9
Cop
y-rig
ht IE
R Y
-Ka
ne
ko

NUMBER OF PERSONS WITH PHYSICAL DISABILITIES BY TYPE
(IN-HOME)
10
Cop
y-rig
ht IE
R Y
-Ka
ne
ko
CHANGES IN NUMBER OF PERSONS WITH PHYSICAL
DISABILITIES BY TYPE AND BY AGE GROUP (PER 1,000
POPULATION)

SOCIAL SECURITY BENEFIT, FY 1970-2013
Source: The Financial Statistics of Social Security in Japan FY 2013, National Institute of Population and Social Security, Japan
Benefit of LTC included after
the year of 2001
11
Cop
y-rig
ht IE
R Y
-Ka
ne
ko
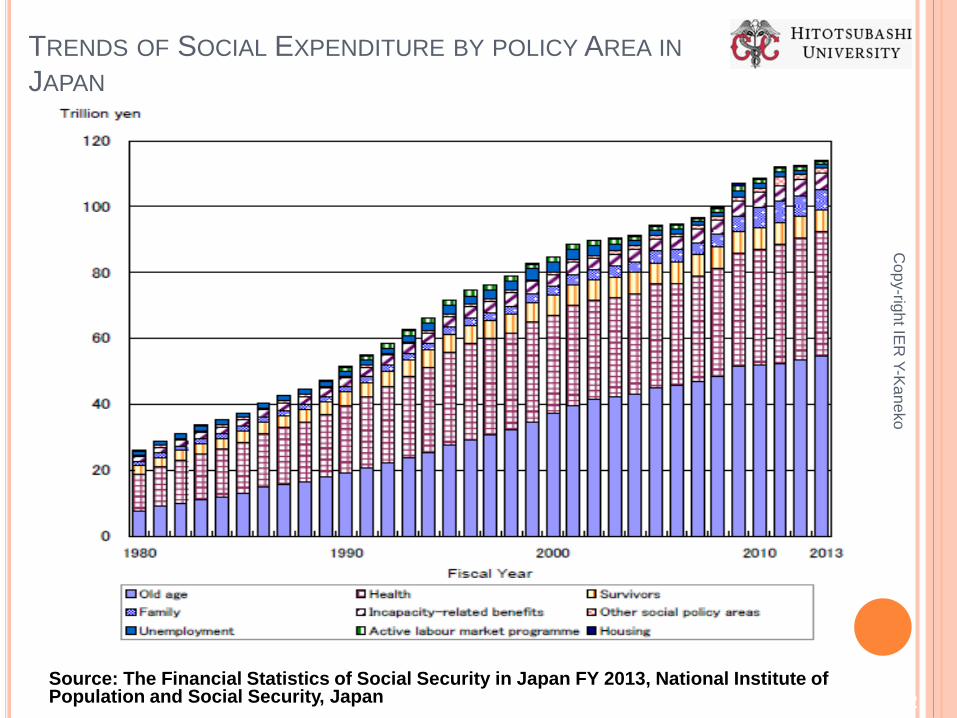
TRENDS OF SOCIAL EXPENDITURE BY POLICY AREA IN
JAPAN
Source: The Financial Statistics of Social Security in Japan FY 2013, National Institute of Population and Social Security, Japan 12
Cop
y-rig
ht IE
R Y
-Ka
ne
ko

INCREASE IN THE NUMBER OF AGED 75 AND OVER AND
MEDICAL CARE AND LONG-TERM CARE BENEFITS PER CAPITA
(ESTIMATION MADE BY MHLW)
Source: Fiscal Policy in Japan - Issue and Future Directions - , July2015, Ministry of Finance, Japan13
Cop
y-rig
ht IE
R Y
-Ka
ne
ko

PROSPECTS OF SOCIAL SECURITY BENEFITS IN JAPAN
(2012 MARCH ESTIMATION PROVIDED BY MHLW)
*
14Source: Fiscal Policy in Japan - Issue and Future Directions - , July2015, Ministry of Finance, Japan
Cop
y-rig
ht IE
R Y
-Ka
ne
ko

PENSION SYSTEM IN JAPAN
Source: Social Security in Japan 2014, National Institute of Population and Social Security Research, Ch.3, Pension
15
Cop
y-rig
ht IE
R Y
-Ka
ne
ko

CONTROL OF AN INCREASE IN PENSION BENEFITS ACCORDING
TO AGING IN JAPAN
INTRODUCTION OF MACRO-ECONOMIC SLIDE FORMULA IN 2004
PENSION REFORM
Source: Policy Information, Pension, Pension Security, Ministry of Health Labour and Welfare, Japan. http://www.mhlw.go.jp/english/wp/wp-hw6/dl/11e.pdf 16
Cop
y-rig
ht IE
R Y
-Ka
ne
ko
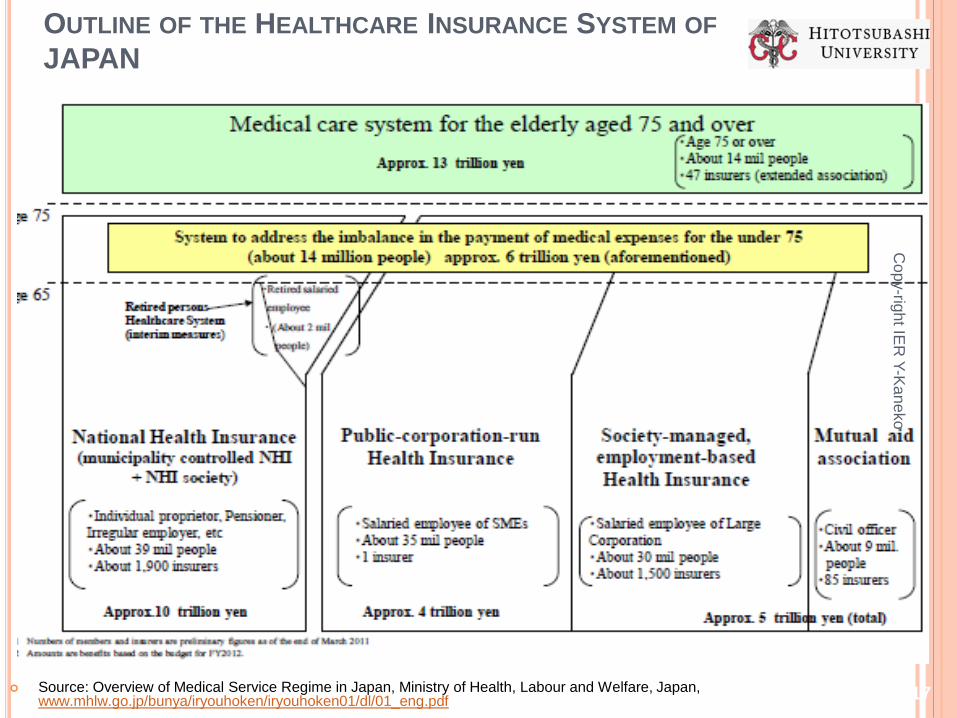
OUTLINE OF THE HEALTHCARE INSURANCE SYSTEM OF
JAPAN
Source: Overview of Medical Service Regime in Japan, Ministry of Health, Labour and Welfare, Japan, www.mhlw.go.jp/bunya/iryouhoken/iryouhoken01/dl/01_eng.pdf 17
Cop
y-rig
ht IE
R Y
-Ka
ne
ko
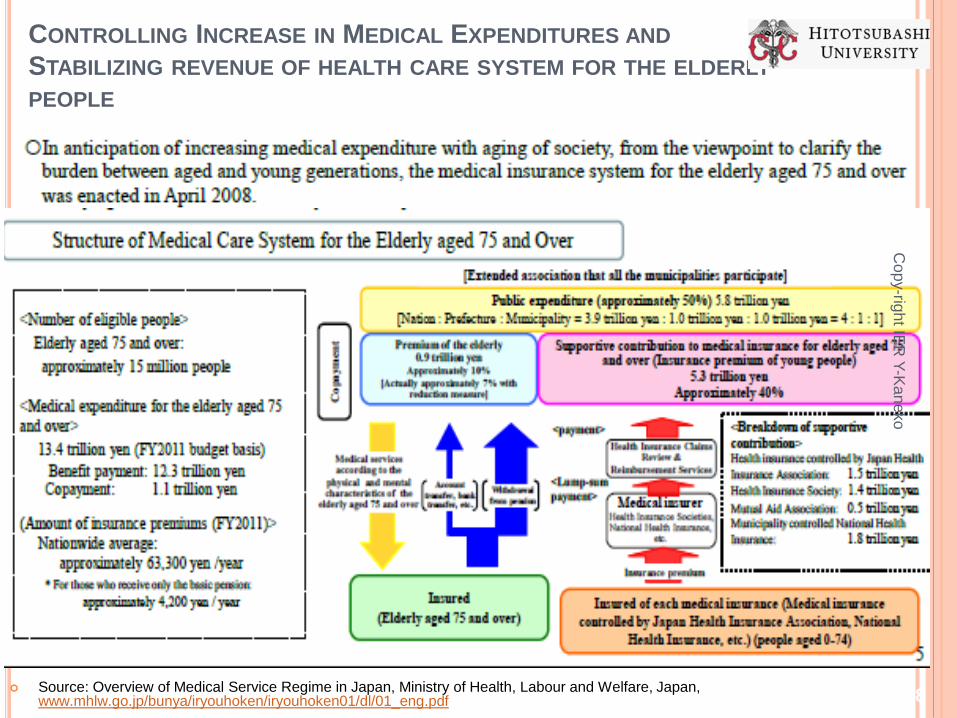
CONTROLLING INCREASE IN MEDICAL EXPENDITURES AND
STABILIZING REVENUE OF HEALTH CARE SYSTEM FOR THE ELDERLY
PEOPLE
Source: Overview of Medical Service Regime in Japan, Ministry of Health, Labour and Welfare, Japan, www.mhlw.go.jp/bunya/iryouhoken/iryouhoken01/dl/01_eng.pdf 18
Cop
y-rig
ht IE
R Y
-Ka
ne
ko

TRENDS OF MEDICAL EXPENDITURES IN JAPAN:
CONTROL OF AN INCREASE IN MEDICAL
EXPENDITURES FOR THE ELDERY PEOPLE
Source: Overview of Medical Service Regime in Japan, Ministry of Health, Labour and Welfare, Japan, www.mhlw.go.jp/bunya/iryouhoken/iryouhoken01/dl/01_eng.pdf 19
Cop
y-rig
ht IE
R Y
-Ka
ne
ko
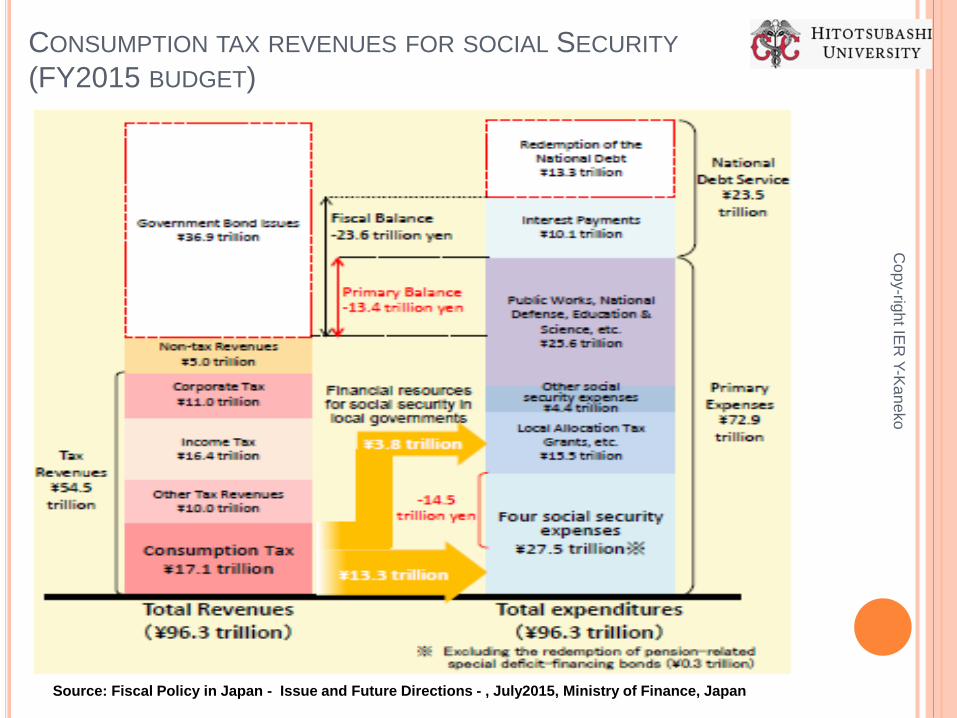
CONSUMPTION TAX REVENUES FOR SOCIAL SECURITY
(FY2015 BUDGET)
Source: Fiscal Policy in Japan - Issue and Future Directions - , July2015, Ministry of Finance, Japan 20
Cop
y-rig
ht IE
R Y
-Ka
ne
ko

TRENDS IN EXPENDITURES & REVENUES, AND THE
GOVERNMENT BOND ISSUES IN JAPAN
Source: Fiscal Policy in Japan - Issue and Future Directions - , July2015, Ministry of Finance, Japan
21
Cop
y-rig
ht IE
R Y
-Ka
ne
ko

INTERNATIONAL COMPARISON OF FISCAL BALANCE AND
GROSS DEBT
Source: Fiscal Policy in Japan - Issue and Future Directions - , July2015, Ministry of Finance, Japan 22
Cop
y-rig
ht IE
R Y
-Ka
ne
ko

THE JAPAN’S PLAN FOR DYNAMIC ENGAGEMENT OF ALL
CITIZENS
CABINET DECISION ON JUNE 2, 2016HTTP://WWW.KANTEI.GO.JP/JP/SINGI/ICHIOKUSOUKATSUYAKU/PDF/GAIYOU_E.PDF
(Summary) Toward a society participated by all citizens, whether they are women or men, the elderly or youths, people who have experienced a failure, people with disabilities and people fighting an illness, can play active roles in their respective homes, workplaces and local communities or any other places.
The Doctrine of a Mechanism of a Virtuous Cycle of Growth and Distribution
On the second stage of Abenomics, we will tackle the issue of the declining birthrate and aging population, which is at the root of the obstacles in economic growth, head on. In order to try to build a new system of our economic society where we enhance childcare supports and social security as a broader economic policy, which will lead to a more robust economy.
We will realize a society where diversity is accepted and all citizens are included, which will lead to more certain prospects for the future, a boost in consumption and the expansion of investment. We will encourage all citizens to fully show their own various talents, which will lead to improvement in the labor participation rate and creation of innovation, in order to further accelerate the economic growth.
We cannot continue "distribution" without the fruits of "growth". We will enhance the foundation of childcare and social security, utilizing achievements of Abenomics. People can be engaged in growth when they are provided supports for childcare and nursing care.
A set of the new three arrows combined altogether itself can be called as the ultimate growth strategy. 23
Cop
y-rig
ht IE
R Y
-Ka
ne
ko

(1)WORKING STYLE REFORMS
Improvement in working conditions of non‐regular workers (account for approximately 40% of the whole workers in Japan) including realization of “equal pay for equal work” should be conducted urgently. Through formulation of guidelines, we will indicate what kind of treatment gaps are unreasonable and should be corrected and in order to let them smoothly be corrected, we will submit the related bills.
• Practices of long working hours make it difficult to balance work and family life including childcare, which leads to the declining birthrate and prevention of career formation of women. We will enhance enforcement of legal regulations and as for the Labor Standards Act, we will once again consider the state of regulations contained in Article 36.
• As for promotion of employment of the elderly, it is necessary to prepare the environment for raising the retirement age and extending employment beyond the age of retirement. We will provide supports for businesses raising the retirement age to 65 and extending employment beyond the age of 65 while encouraging other businesses to do so.
24Copy-right IER Y-Kaneko
(2)IMPROVEMENT IN THE ENVIRONMENT FOR
CHILDCARE
• We raised the target for additional childcare arrangements from for 400,000 children to 500,000 children, which is to be accomplished by the end of FY2017.
• As for working conditions of childcare providers, we will newly implement a pay rise equivalent to 2% (about 6,000 yen per month) . We will additionally improve working conditions for childcare providers with skills and experiences in order to eliminate a wage gap between childcare providers and female workers across all industries, which is currently around 40,000yen , making budgetary steps be reflected in actual wages appropriately in execution processes. We will also reduce a wage gap between male workers and female workers across industries as a whole, promoting efforts based on the Act of Promotion of Women's Participation and Advancement in the Workplace and toward "equal pay for equal work". We will further improve working conditions of childcare providers as needed.
• In order to ensure and develop various childcare providers, we will make comprehensive efforts including enhancement of a scheme of a forgivable loan and improvement in productivity by utilizing ICT.
• We will prepare additional arrangements of “After‐school Kids’ Clubs” for 300,000 children by the end of FY2019. While promoting improvement in working conditions of childcare providers and reduction in labor burdens shouldered by them, we will discuss the way to bring forward preparation of additional arrangements and complete it by the end of FY2018. As for improvement in working conditions, we will make sure that related budget actions will be appropriately reflected to wages in budget‐implementing processes.
25
Cop
y-rig
ht IE
R Y
-Ka
ne
ko

(3) IMPROVEMENT IN THE ENVIRONMENT FOR
NURSING CARE
• We will accelerate preparation of additional nursing care arrangements for more than 380,000 people (expected increase in arrangements in FY2015‐FY2020). Furthermore, we raised this target to for more than 500,000 people, which is to be accomplished by early 2020s.
• As for working conditions of nursing care providers, in order to eliminate a wage gap between nursing care providers and workers in other competing industries, we will build a career development scheme from FY2017 and improve their wages by 10,000 yen per month on average.
• In order to ensure and develop various nursing care providers, we will make comprehensive efforts including enhancement of a scheme of a forgivable loan, utilization of senior human resources and improvement in productivity by utilizing nursing care robots and ICT related technologies.
26
Cop
y-rig
ht IE
R Y
-Ka
ne
ko

STRUCTURE OF FY 2015 EMPLOYMENT
MEASURES FOR THE ELDERLY
Source: The Ministry of labor and Welfare of Japan, the white paper of labor and welfare policy 2015
27
Cop
y-rig
ht IE
R Y
-Ka
ne
ko

[SUPPORT FOR ENTERPRISES] PROMOTION OF EMPLOYMENT OF THE
ELDERLY TOWARD REALIZING AN “AGELESS SOCIETY” IN WHICH
PEOPLE CAN WORK ACCORDING TO THEIR MOTIVATION AND ABILITY
TO WORK AND REGARDLESS OF AGE
28
Cop
y-rig
ht IE
R Y
-Ka
ne
ko

[REGIONAL SUPPORT FOR THE ELDERLY] EXPANDING THE PLACES
WHERE THE ELDERLY CAN WORK OR ENGAGE IN ACTIVITIES TO
SUPPORT SOCIETY
29
Cop
y-rig
ht IE
R Y
-Ka
ne
ko

30
Cop
y-rig
ht IE
R Y
-Ka
ne
ko
FY 2015 PROMOTION OF EMPLOYMENT SUPPORT FOR PERSONS
WITH DISABILITIES – OUTLINE OF MEASURES RELATED TO THE
EMPLOYMENT OF PERSONS WITH DISABILITIES –

FY 2015 PROMOTION OF EMPLOYMENT SUPPORT FOR PERSONS
WITH DISABILITIES – OUTLINE OF MEASURES RELATED TO THE
EMPLOYMENT OF PERSONS WITH DISABILITIES –
31
Cop
y-rig
ht IE
R Y
-Ka
ne
ko

AN EMPIRICAL STUDY OF THE EFFECT OF INTEGRATED
COMMUNITY BASED CARE SYSTEM OF LTCI ON MEDICAL
EXPENDITURE AND LABOR FORCE PARTICIPATION OF THE
ELDERLY HOUSEHOLD
After the introduction of Long-term care insurance, the need and demand for long-term care services provided by LTCI increased .more than the expectation. With such circumstances, the long-term care insurance was reviewed and several reforms were put in place.
The long-term care insurance system initially aimed to support the independent living of the elderly, and even if the elderly entered a state that required long-term care, it aimed to develop an environment where the elderly could receive treatment in the community with which they were familiar.
To this end, the 2005 revision in the law established community-based care services and Integrated Community Care Support Centers to ensure enhanced services and coordination at the municipality level.
It is expected that the Integrated community based care system decreases the medical expense of the household where the needing care senior citizen exists (amount of expense of the medical treatment a month) by strengthening the cooperation between the medical treatment and long-term care services.
We shall make an empirical study of the effect of Integrated community
Cop
y-rig
ht IE
R Y
-Ka
ne
ko

ESTIMATION METHOD AND DATA
We shall make a regression analysis by making use of the estimation of the difference in difference method (DID) of OLS estimation. In this estimation, we shall treat the home where there exists senior citizen receiving the certification for long-term care with a treatment group, and treat the home where there does not exist senior citizen receiving the certification for long-term care with a comparison group.
The data that we use is the National Survey of Family Income and Expenditure (Statistics Bureau, Ministry of Internal Affairs and Communication) (2004, 2009, 2014) classified by 47 prefectures and by the household structures: the home where there exists senior citizen receiving the certification for long-term care and the home where there does not exist senior citizen receiving the certification for long-term.
The number of samples used for this regression analysis is 282(=47x3x2).
The estimation method used for the regression analysis is the difference in difference method (DID) of OLS estimation.
The description of this section (the estimation method, the data and the estimation result ) is based on the presentation for the Japanese Economic Association 2016 Autumn Meeting.
33
Cop
y-rig
ht IE
R Y
-Ka
ne
ko

SPECIFICATION OF ESTIMATED EQUATION
Yijt = β0 + β1*needed_ltc + β2*d_icbcare + β3* needed_ltc* d_icbcare
+ γX + cjt + uijt
The explained variable is medical treatment expense of one month per the elderly household.
Affixing character I indicates prefectures (i=1 to 47), j =1 indicates a treatment group and j=0 indicates a comparison group, d indicates a dummy variable that takes one after the introduction of integrated community based care system (that is after the period over 2006). βs and y indicate coefficients and a vector of coefficient to be estimated respectively.
Explanatory variables that included in a vector X: n_household: number of household members, hh_age: age of household head, poprate75: the proportion of the elderly people aged 75 and over, drate_cancer: drate_diab~s: drate_cere~r: wage_f5564: wage rate of women, employment~c: the dummy variable that shows the period after the enforcement of extended employment of the aged between 60 and 64 years of age,, metropolit~a: the dummy variable for the existance of large population city in the prefecture, unemprate: unemployment rate of the prefecture, h_savings: amount of household savings
cjtand uijt indicate the error term classified by group and the error term of individual respectively. 34
Cop
y-rig
ht IE
R Y
-Ka
ne
ko

BASIC STATISTICS OF THE NATIONAL SURVEY OF FAMILY INCOME & EXPENDITURE
(STATISTICS BUREAU, MINISTRY OF INTERNAL AFFAIRS AND COMMUNICATION)
(2004, 2009, 2014)
.2381798 .4722426 .5008889 .4722426 .3131987 4.994261 954.3533 5166.314
Total 1.44078 .6666667 .5 .3333333 3.27234 59.23298 6491.695 17155.96
.2674519 0 .502681 .502681 .2777269 5.293552 811.9102 5103.777
2014 1.344681 1 .5 .5 3.145745 61.72979 6052.574 16376.57
.2007991 0 .502681 .502681 .2528832 4.478735 960.939 5019.585
2009 1.442553 1 .5 .5 3.205319 59.09149 6424.638 17469.48
.2030453 0 .502681 0 .310931 3.918557 843.1727 5335.63
2004 1.535106 0 .5 0 3.465957 56.87766 6997.872 17621.83
year n_work~g d_icbc~e needed~c intera~n n_hous~d hh_age h_income h_savi~s
.2381798 .3131987 4.994261 4387.407 2.578867 36.6461 2.169921 24.30409
Total 1.44078 3.27234 59.23298 15746.59 11.95816 297.1397 12.04894 108.7567
.2674519 .2777269 5.293552 3700.308 2.066311 36.83195 2.385281 24.49132
2014 1.344681 3.145745 61.72979 14995.09 13.87021 311.934 12.01064 104.9255
.2007991 .2528832 4.478735 4175.861 2.093272 34.41844 2.06581 24.11111
2009 1.442553 3.205319 59.09149 15875.11 12.14043 289.7426 12.06809 110.6723
.2030453 .310931 3.918557 5104.125 1.811365 34.41844 2.06581 24.11111
2004 1.535106 3.465957 56.87766 16369.56 9.86383 289.7426 12.06809 110.6723
year n_work~g n_hous~d hh_age h_medi~t popra~75 drate~er drate_~s drate~ar
.2381798 .3131987 4.994261 40.16731 711.1313 1.031278 .4722426
Total 1.44078 3.27234 59.23298 347.4391 938.7689 4.195035 .3333333
.2674519 .2777269 5.293552 37.80334 667.2063 .6243221 0
2014 1.344681 3.145745 61.72979 347.0141 893.8021 3.310638 1
.2007991 .2528832 4.478735 37.53489 711.1728 .8089864 0
2009 1.442553 3.205319 59.09149 338.2324 926.0709 4.812766 0
.2030453 .310931 3.918557 43.097 755.9761 .9597386 0
2004 1.535106 3.465957 56.87766 357.0707 996.4337 4.461702 0
year n_work~g n_hous~d hh_age wa~m5564 wa~f5564 unempr~e employ~c
• Source: the authors tablationbased on the National Survey of Family Income and Expenditure (2004, 2009, 2014)
35
Cop
y-rig
ht IE
R Y
-Ka
ne
ko

ESTIMATION RESULT OF THE EFFECT OF INTEGRATED COMMUNITY
BASED CARE SYSTEM ON MEDICAL EXPENDITURE OF THE ELDERLY
HOUSEHOLD(THE EXPLAINED VARIABLE: MEDICAL TREATMENT EXPENSE OF ONE MONTH PER THE ELDERLY HOUSEHOLD)
The dummy variable in which the home where the needing care senior citizen exists is positive, but the coefficient of the intersection of the integrated community based care system is negative and statistically significant.
Implication of the Result: Integrated community cased care system exerted the influence that decreased the medical expense a month of the home where the senior citizen receives certification of LTC service with coordination of medical care and LTC enabled to be done more efficiently compared with before the system's being introduced. legend: * p<0.05; ** p<0.01; *** p<0.001
Nr2
_cons 6380.4673 4465.0022
h_savings 0.0952
metropolit~a 215.1557 168.7025
employment~c -1.63e+03 -1.03e+03
unemprate -711.6328 -387.6384
wage_f5564 0.0963 0.0376
drate_cere~r 23.9843 27.9632
drate_diab~s -166.7747 -177.5049
drate_cancer -23.4378 -24.3133
poprate75 -98.9859 -48.8783
hh_age 221.8277 198.6574
n_household 1337.3767 1282.9102
interaction -1.83e+03* -1.75e+03***
d_icbcare 761.2355* 537.1956
needed_ltc 5800.5165 5431.2170*
Variable q1 q2
Source: the authors estimation based on the National Survey of Family Income and Expenditure (2004, 2009, 2014)
36
Cop
y-rig
ht IE
R Y
-Ka
ne
ko
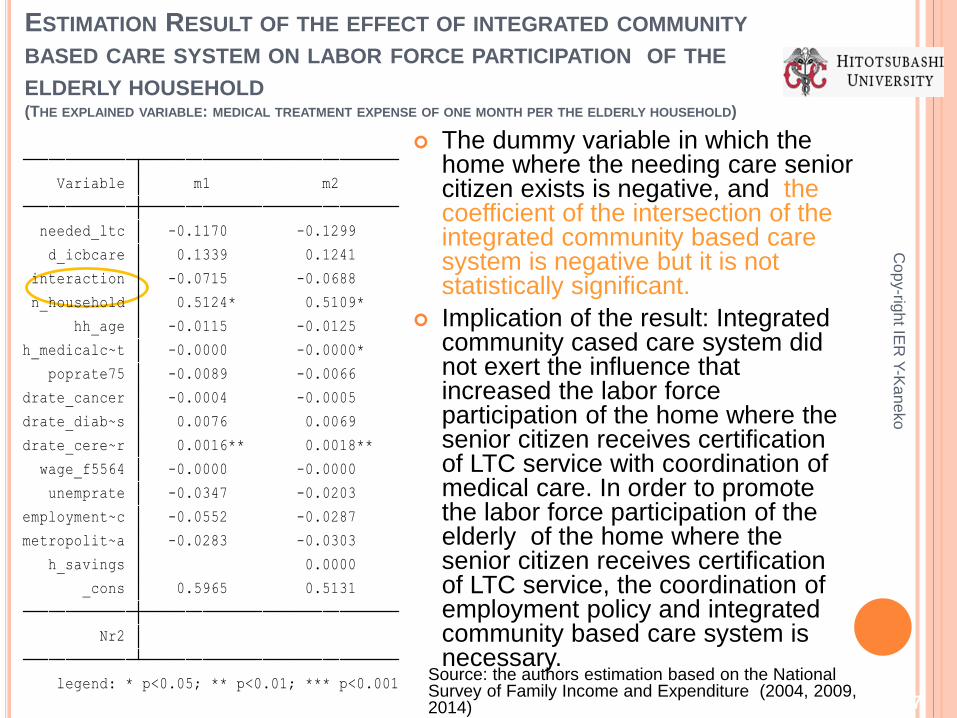
ESTIMATION RESULT OF THE EFFECT OF INTEGRATED COMMUNITY
BASED CARE SYSTEM ON LABOR FORCE PARTICIPATION OF THE
ELDERLY HOUSEHOLD(THE EXPLAINED VARIABLE: MEDICAL TREATMENT EXPENSE OF ONE MONTH PER THE ELDERLY HOUSEHOLD)
The dummy variable in which the home where the needing care senior citizen exists is negative, and the coefficient of the intersection of the integrated community based care system is negative but it is not statistically significant.
Implication of the result: Integrated community cased care system did not exert the influence that increased the labor force participation of the home where the senior citizen receives certification of LTC service with coordination of medical care. In order to promote the labor force participation of the elderly of the home where the senior citizen receives certification of LTC service, the coordination of employment policy and integrated community based care system is necessary.
Source: the authors estimation based on the National Survey of Family Income and Expenditure (2004, 2009, 2014) 37
legend: * p<0.05; ** p<0.01; *** p<0.001
Nr2
_cons 0.5965 0.5131
h_savings 0.0000
metropolit~a -0.0283 -0.0303
employment~c -0.0552 -0.0287
unemprate -0.0347 -0.0203
wage_f5564 -0.0000 -0.0000
drate_cere~r 0.0016** 0.0018**
drate_diab~s 0.0076 0.0069
drate_cancer -0.0004 -0.0005
poprate75 -0.0089 -0.0066
h_medicalc~t -0.0000 -0.0000*
hh_age -0.0115 -0.0125
n_household 0.5124* 0.5109*
interaction -0.0715 -0.0688
d_icbcare 0.1339 0.1241
needed_ltc -0.1170 -0.1299
Variable m1 m2
Cop
y-rig
ht IE
R Y
-Ka
ne
ko