facility management market in spain
TRANSCRIPT

FACILITY MANAGEMENT
MARKET IN SPAIN
Real Estate and Facility Management Department TU Wien
BACHELOR’S THESIS
Ao.Univ.Prof. Dipl.-Ing. Mag.rer.soc.oec. Dr. techn. Alexander Redlein
Univ.Ass. MMag. Michael Zobl
Vienna, July 2014 Àlex Octavio Bayón

Facility Management market in Spain
2
Information summary
Title: Facility Management market in Spain
Keywords: Facility Management, value added, mixed method research, data analysis
Student: Àlex Octavio Bayón
Student no.: 1329368
Supervisor: Ao.Univ.Prof. Dipl.-Ing. Mag.rer.soc.oec. Dr.techn. Alexander Redlein
Co-supervisor: Univ.Ass. MMag. Michael Zobl
University: Vienna University of Technology
Department: Real Estate and Facility Management Department
Motivation: Bachelor Thesis
Abstract
Facility Management (FM) is becoming nowadays an important subject for worldwide
companies. It has been already proved in some enterprises that FM has decisively
contributed to an increase of productivity and profits. The main goal of this Thesis is to
determine the value added FM provides to companies in Spain. Also important in this
study is to investigate which is the FM status quo in Spain, firstly focused on qualitative
terms and afterwards, focused on data analysis. Last but not least, the data analysis will
not only be centered on FM Spanish results, but also on comparing Spanish status quo
with other European countries. The information for this analysis has been collected by
means of a standardized survey which covers different areas of the enterprises, but all
related to FM issues. The scope of this data collection is the Top 500 companies in
Spain (ranking is sales driven), 23 of them participated in this study. The research is
based on the Mixed Method Approach and the Mixed Model Research.

Facility Management market in Spain
3
Acknowledgments
First of all, I would be very pleased to thank all those people who have taken part and
have helped me performing my graduation project.
I would like to give special thanks to Univ.Ass. MMag. Michael Zobl who has
constantly supported me in this Thesis and ao.Univ.Prof. Dipl.-Ing. Mag.rer.soc.oec.
Dr.techn. Alexander Redlein who has been my supervisor and has given me the
possibility to work on this project.
Endless thanks to all the Facility Managers who have had the willingness to answer
questionnaires, trusting in our confidentiality.
Last but not least, I would like to thank all my family and friends who have supported
me performing my Thesis since the first until the last day.
Àlex Octavio Bayón,
July 2014
Facility Management market in Spain
4
Summary
This research project has been organized as follows:
First of all, there is an introduction which enables readers to be better introduced into
the topic. This introduction includes the project background and what makes this study
interesting, different definitions Facility Management (FM) has, its history in the world
and also in Spain, which benefits FM provides, and which services FM focuses on.
Afterwards, it comes an investigation of FM in Spanish market. It focuses on the status
quo of FM in Spain and how deep it is implemented. Moreover, it includes an outlook
on the next years. At the end of this chapter, there are data of the FM volume of Spanish
market in main disciplines, such as maintenance, real estate, or cleaning.
After that, there is the explanation of the methodology performed in order to realize the
data analysis.
Following the methodology chapter, the results are displayed. By means of a well-
known spreadsheet application, called Microsoft Excel, data has been analyzed. This
analysis has led to a discussion of all these results.
At the end, some conclusions have been drawn. These conclusions have mainly focused
on answering the main goals and research questions formulated in the beginning of the
study.

Facility Management market in Spain
5
TABLE OF CONTENT
Abstract ................................................................................................................... 2
Acknowledgments ................................................................................................... 3
Summary ................................................................................................................. 4
List of figures .......................................................................................................... 7
List of Tables ........................................................................................................... 9
1. Introduction ............................................................................................... 10
1.1 Project Background................................................................................ 10
1.2 What is Facility Management? .............................................................. 10
1.3 World and Spanish FM history .............................................................. 11
1.4 Facility Management principal benefits ................................................ 13
1.5 Facility Management services ............................................................... 13
2. Facility Management in Spanish market ................................................. 15
2.1 European and Spanish FM market classification .................................. 15
2.2 State of the FM discipline in Spain ....................................................... 17
2.3 Demand-side .......................................................................................... 18
2.4 Outsourcing ........................................................................................... 19
2.5 Supply-side ............................................................................................ 20
2.6 Size of the FM market ........................................................................... 22
2.7 Public sector market .............................................................................. 22
2.8 Outlook on the next years ...................................................................... 23
3. FM volume market in main disciplines ................................................... 24
3.1 Maintenance........................................................................................... 24
3.2 Security .................................................................................................. 25
3.3 Real Estate ............................................................................................. 27
3.4 Restoration ............................................................................................. 29
3.5 Cleaning ................................................................................................. 31
4. Methodology ............................................................................................... 33

Facility Management market in Spain
6
5. Results and analysis ................................................................................... 36
5.1 FM status quo in Spain .......................................................................... 36
5.1.1 Organization .................................................................................. 36
5.1.2 Outsourcing.................................................................................... 41
5.1.3 IT support....................................................................................... 43
5.1.4 Basic data of the company ............................................................. 47
5.1.5 Sustainability and CSR .................................................................. 48
5.2 FM Spanish market compared to other European countries .................. 50
5.2.1 Organization .................................................................................. 50
5.2.2 Outsourcing.................................................................................... 53
5.2.3 IT support....................................................................................... 55
6. Conclusions ................................................................................................. 58
7. References ................................................................................................... 60
Facility Management market in Spain
7
List of figures
Figure 1: FM model ........................................................................................................... 11
Figure 2: FM implies integration of Place, Process, and People ....................................... 12
Figure 3: Most important reasons for outsourcing ............................................................ 19
Figure 4: Most important risks for outsourcing ................................................................. 19
Figure 5: Location of outsourced services per country ..................................................... 20
Figure 6: Evolution of Maintenance sector in Spain ......................................................... 24
Figure 7: Evolution of Security sector in Spain................................................................. 25
Figure 8: Future plans of security services companies ...................................................... 26
Figure 9: Risk assessment by the companies .................................................................... 26
Figure 10: Evolution of Real Estate sector in Spain .......................................................... 27
Figure 11: Most important qualities in building offices .................................................... 28
Figure 12: Tendency of the new building offices .............................................................. 28
Figure 13: Evolution of Restoration sector in Spain ......................................................... 29
Figure 14: Most valuable features of a restoration service ................................................ 30
Figure 15: Main benefits of restoration services ............................................................... 30
Figure 16: Evolution of cleaning sector in Spain .............................................................. 31
Figure 17: Proposals with potential savings in cleaning services ..................................... 32
Figure 18: Mid-term tendency of cleaning service ............................................................ 32
Figure 19: Important steps in a mixed research study ....................................................... 34
Figure 20: Portion of companies with an own FM department ......................................... 36
Figure 21: Number of employees of FM departments ...................................................... 37
Figure 22: Hierarchic level of FM department .................................................................. 37
Figure 23: Main goals FM departments have .................................................................... 38
Figure 24: Biggest problems companies have in the field of FM. .................................... 38
Figure 25: Biggest cost drivers companies have in the field of FM .................................. 39

Facility Management market in Spain
8
Figure 26: Fields/services with the biggest savings through the use of FM...................... 39
Figure 27: Fields/services with the biggest increases of productivity through the use of
FM ..................................................................................................................................... 40
Figure 28: Annual savings potential through the use of FM ............................................. 40
Figure 29: Number of external service providers retained by the companies ................... 41
Figure 30: How much do enterprises carry out their services ........................................... 41
Figure 31: Areas of outsourcing ........................................................................................ 42
Figure 32: Main reasons when choosing an external service provider.............................. 43
Figure 33: Portion of companies that use a CAFM system ............................................... 43
Figure 34: Processes that are covered with the CAFM system ......................................... 44
Figure 35: Reasons for implementing a CAFM system .................................................... 45
Figure 36: Portion of companies that use an ERP system ................................................. 45
Figure 37: Business processes covered with the ERP system ........................................... 46
Figure 38: Reasons for implementing a ERP system ........................................................ 46
Figure 39: Sectors where the interviewed companies belong to ....................................... 47
Figure 40: Number of employees of the companies .......................................................... 48
Figure 41: Importance of FM for the CSR of the company .............................................. 48
Figure 42: Portion of firms that have a CSR annual report ............................................... 49
Figure 43: Facility managers’ rating of the overall success of FM ................................... 49
Figure 44: Portion of companies with an own FM department by country and year ........ 50
Figure 45: Number of employees within the FM departments by country and year ......... 51
Figure 46: Hierarchic level of FM department in different European countries ............... 51
Figure 47: Strategies of the FM department in Spain, Austria, and Romania ................... 52
Figure 48: Biggest cost drivers of companies in the field of FM in Spain, Austria, and
Romania ............................................................................................................................. 52
Figure 49: Annual savings through the use of FM in Spain, Austria, and Romania ......... 53
Figure 50: Number of external service providers retained by companies ......................... 54

Facility Management market in Spain
9
Figure 51: Outsourcing areas in Austria, Spain, and Romania ......................................... 54
Figure 52: Portion of companies with a CAFM system in Austria, Romania, and Spain . 55
Figure 53: Reasons for implementing a CAFM system in Austria, Romania, and Spain . 56
Figure 54: Portion of enterprises with an ERP system ...................................................... 56
Figure 55: Reasons companies have for implementing an ERP system............................ 57
List of Tables
Table 1: Facility Management services ............................................................................. 14
Table 2: Evolution stages of the European FM markets (source: Henzelmann and
Teichmann, 2008; Porter, 1999; WEF, 2008) ................................................................... 16
Table 3: Classification of the European FM markets ........................................................ 17
Table 4: Top 20 FM companies of the Spanish market in 2008 (source IFMA Italia
2009) .................................................................................................................................. 21

Facility Management market in Spain
10
1. Introduction
1.1 Project background
Since 2005 the Vienna University of Technology analyzes the demand side of Facility
Management (FM) on a yearly basis in different European countries such as Austria,
Germany, Bulgaria, Romania, Turkey and the Netherlands. The goal was to determine
the value added of the use of FM and also the parameters influencing the magnitude
with the help of scientific models and methods. These projects will continue being
performed, as more detailed analyses of different countries and/or industries let
gathering more information and an expansion of the data within this research field.
This Thesis will enlarge this research field by analyzing the Spanish market of this
sector, as Spain has never been considered before.
Research questions that are tried to be answered in this study are as follows:
“What do enterprises in Spain want to accomplish with the use of FM?”
“How big is the annual saving potential through the use of FM in Spain?”
“How important is outsourcing for companies in Spain and which are the most
outsourced services?”
“How different is the performance of FM in Spain from other European countries?”
During this study all these questions will be answered as much complete as possible,
apart from other goals commented in the abstract.
1.2 What is Facility Management?
Facility Management (FM) is a discipline that has been spreading at the worldwide
companies in the last years, as it has shown interesting results to those organizations
that decided to give FM an important role in its organism. According to the European
Norm EN 15221 FM is defined as:
“Integration of processes within an organization to maintain and develop the agreed
services which support and improve the effectiveness of its primary activities” [1].

Facility Management market in Spain
11
All public or private organizations use real estate, assets, and related services to support
its principal activities; through the coordination of these assets and services using its
experience in management and introducing organizational changes. FM helps to work
dynamically and to fulfill with all requirements. Moreover, this management is
performed to optimize costs and operation not only real estate but also services. Figure
1 shows the FM model which provides a framework describing how FM supports the
primary activities of an organization. It deals with the demand and supply relationship
and presents the different levels of possible FM interaction [2] [3].
1.3 World and Spanish FM history
Before FM was born in the USA, there were two significant simultaneous events in the
early 1970’s in the USA that helped set the evolutionary course of FM:
The beginning of today’s sophisticated systems furniture, commonly
known as cubicles.
The introduction of the computer terminal into the workstation.
At that time associations comprised of ‘facility managers’ were not able to manage the
offices of the future, as they could not provide the needed information. In December
1978 Herman Miller Research Corp. hosted a conference “Facility Influence on
Productivity” in Ann Arbor, Michigan. The three founders of the National Facility
Fig. 1.
FM model [4].
Facility Management market in Spain
12
Management Association (NFMA), George Graves, Charles Hitch, and David
Armstrong, asked for the need for an organization comprised of facility professionals. A
FM association named NFMA was established in May 1980 by George Graves. In 1981
it was renamed to International Facility Management Association (IFMA).
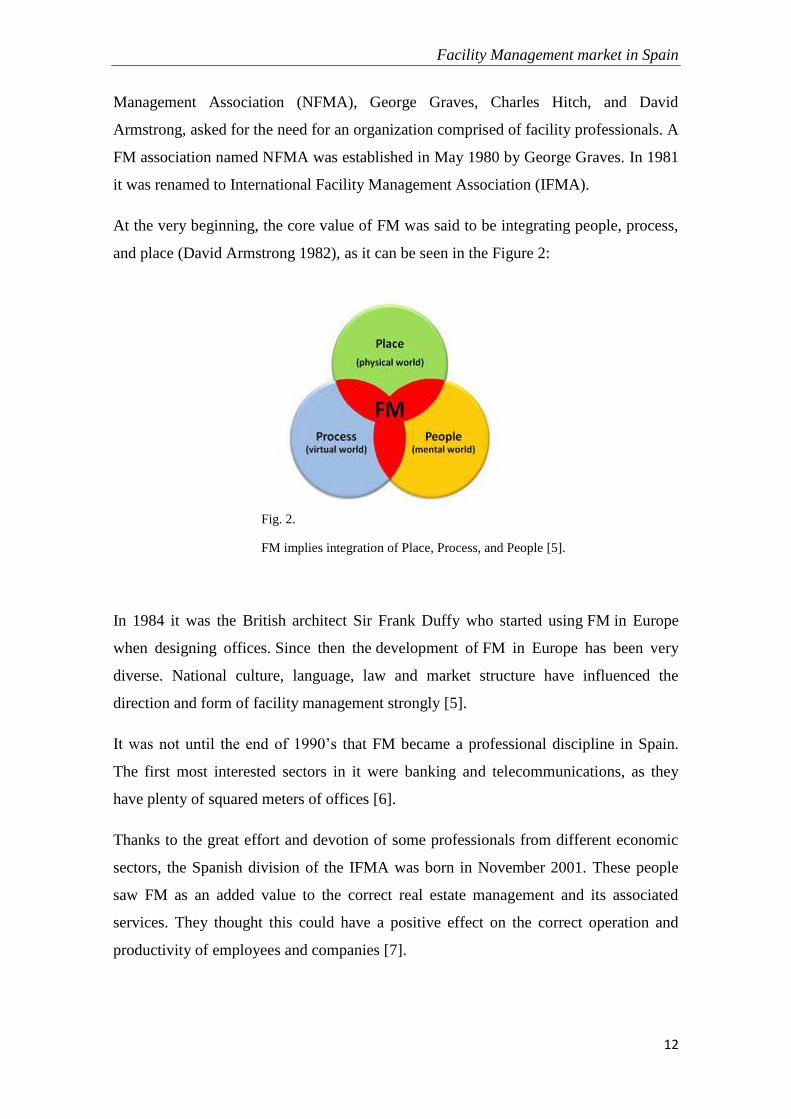
At the very beginning, the core value of FM was said to be integrating people, process,
and place (David Armstrong 1982), as it can be seen in the Figure 2:
In 1984 it was the British architect Sir Frank Duffy who started using FM in Europe
when designing offices. Since then the development of FM in Europe has been very
diverse. National culture, language, law and market structure have influenced the
direction and form of facility management strongly [5].
It was not until the end of 1990’s that FM became a professional discipline in Spain.
The first most interested sectors in it were banking and telecommunications, as they
have plenty of squared meters of offices [6].
Thanks to the great effort and devotion of some professionals from different economic
sectors, the Spanish division of the IFMA was born in November 2001. These people
saw FM as an added value to the correct real estate management and its associated
services. They thought this could have a positive effect on the correct operation and
productivity of employees and companies [7].
Fig. 2.
FM implies integration of Place, Process, and People [5].

Facility Management market in Spain
13
Nowadays in Spain, a high percentage of the largest companies have in its structure, at
least one employee in charge of the Facility Management tasks. However, this activity
is not fully spread to the small and medium enterprises [6].
1.4 Facility Management principal benefits
Facility Management provides plenty of advantages to those organizations that decide to
implement it in their structure. According to the European Norm EN 15221/1, these are
the principal benefits FM offers:
- Clear and transparent communication between the demand side and the supply
side by dedicating persons as single points of contact for all services, which are
defined in a FM agreement.
- Most effective use of synergies amongst different services, which will help to
improve performance and reduce costs of an organization.
- Simple and manageable concept of internal and external responsibilities for
services, based on strategic decisions, which leads to systematic insourcing or
outsourcing procedures.
- Reduction of conflicts between internal and external service providers.
- Integration and coordination of all required support services.
- Transparent knowledge and information on service levels and costs, which can
be clearly communicated to the end users.
- Improvement of an organization sustainability by implementing a life cycle
analysis for the facilities [8].
1.5 Facility Management services
Facility Management comprises plenty of different functions and services. In table 1, an
organization chart can be observed with all services that FM provides to a company,
according to the IFMA Spain [9].

Facility Management market in Spain
14
Facility Management
Real Estate Project
Management
Building, personal, and business
services
Corporate
services
Strategy Restoration Maintenance Cafeteria Reception Travel
Space
planning Moving Supply Catering Concierge Fleets
Dealings
(rental and
investment)
Project
Management Cleaning Vending Post
Document
Management
Consultancy Construction
Management Gardening Reprography Messaging
Hygiene and
Safety
Assessment Waste
Management
Office
supplies Mailroom
Portfolio
planning
Plague
Management Audiovisual Security
Contract
management
Table 1.
Facility Management services [9]

Facility Management market in Spain
15
2. Facility Management in Spanish market
2.1 European and Spanish FM market classification
In order to determine the development stage of the FM market in a given country, in our
case Spain, a two step procedure may be used: (1) first FM operators are classified
according to a hierarchical criterion; (2) second the moment when the classes of FM
operators start operating in each market is found [10].
(1) Classification of the FM operators
In the European FM market providers may be classified into four big groups that,
depending on the extension and complexity of their supply, are hierarchically ranked:
Single services suppliers, focused on just one area of the activity: technical,
commercial or infrastructural;
Multi-services suppliers, which offer services’ packages, covering one or more
of the abovementioned areas;
Integrated services suppliers, which offer services of all areas of activity.
FM companies specialized in the management and coordination of sub-
suppliers and they are able to deeply exploit synergies and the business
potential. This class is not seen as the best solution but one of the possible ones
because the outsourcing partner is only “managing the services” and outsources
the delivery again. This leads to a situation where the outsourcing partner is
doing the same as the internal department. An interesting question is how will
do it better and more efficient [10].
(2) Evolution stages of the FM market
The time horizon to be considered includes the last 25 years and the development
scheme is divided into the following stages:
Pre-emerging markets, at the end of the 90’s appears single services supply,
presenting poor professionalism not only in the demand-side but also supply-
side of the market.
Emerging markets, where single services supply appears during the second half
of the 80’s and multi-services supply starts operating during the second half of
the 90’s. Large-sized enterprises entrust their facility services to a small number
of big FM operators, mainly foreign companies. Moreover, a high number of
small and medium-sized suppliers prosper in the FM market, characterized by a

Facility Management market in Spain
16
low level of competition. Except for large-sized enterprises, outsourcing of
facility services is not a widespread practice.
Developed markets, where facility services supply operates since at least 20
years. Single services supply co-exists besides multi-services supply in the
beginnings of 90’s. The FM market that in the 90’s started the privatization
process of the state-owned companies place in this evolution stage. Outsourcing
is continuously increasing and also the professionalism is growing.
Advanced markets, where the integrated services supply starts operating in the
second half of the 90’s and in the late decade the first Public Private Partnership
projects are implemented. [10]
In order to have a clearer view of the model, in table 2 the evolution stages of the
European FM markets can be observed:
According to IFMA Italia, in table 3 the classification of the European countries can be
observed:
Table 2.
Evolution stages of the European FM markets (source: Henzelmann and Teichmann, 2008; Porter, 1999;
WEF, 2008) [10]

Facility Management market in Spain
17
As table 3 shows, the FM market in Spain is classified as an ‘emerging’ market. It has
been growing at an average yearly rate of 10% between 2007 and 2009, when the world
economic crisis began. However, it is still far from the development of the Northern
European countries, such as the Netherlands or UK [11] [12].
The first services that were introduced and used for companies were the outsourcing of
cleaning and maintenance, both in the second half of the 80’s. After this first approach,
a decade later came the contracting out of services’ packages. Nowadays, integrated
facility management (IFM) contracts start to operate. However, single service providers
still outnumber IFM ones, probably, due to the fact that companies prefer to manage the
core business in-house [12].
2.2 State of the FM discipline in Spain
According to David Martínez, Global director FMHouse, in Spain little Facility
Management is executed, but the one is made is above average from other countries
much more developed, such as UK, the Netherlands or USA. He states that in Spain, as
it is so difficult to sell an idea, the product offered must be excellent in all ways [13].
Whatever it may be, there is a strong need for professional recognition among the
Spanish facility managers. The changes are happening very slowly. Although technical
and engineering skills are essential in the FM Department as well as the problem
solving ability, low level professionals held usually the Facility Manager position, in
terms of contract and salary schemes. Moreover, relational skills are given very little
Table 3.
Classification of the European FM markets [10]

Facility Management market in Spain
18
attention, notwithstanding the need for any Facility Manager to communicate and
associate with the top management [12].
2.3 Demand-side
In order to make a proper analyze of the Spanish enterprises’ organizational structure
concerning the facility services, a classification should be established between small and
medium-sized companies, large-sized firms, and big groups:
Small and medium-sized companies have neither a Facility Department nor a
Facility Manager. What they do have is technical specialists referring to
departments such as human resources, finances or procurement.
Large-sized enterprises own internal staff in charge of the facility services and
also some outsourcing levels.
Big groups have either a company of the group that serves the whole
corporation or a Business Unit [12].
The mentioned different levels of outsourcing in large-sized companies can be divided
as follows:
The majority of the facility services are managed and delivered in-house (with
the exception of the cleaning service, which is outsourced in almost all cases).
Most facility services are outsourced, but managed with internal personnel.
The integrated management of all the facility services is outsourced to a unique
provider, known as Integrated Facility Management (IFM) [12].
In large-sized companies, the Facility Management Department consists on average of
80 people, who manage all the department areas. As it has been previously mentioned,
single service providers outnumber IFM contracts, that is to say, companies in Spain
very rarely outsource all the facility services to one or more providers. According to EN
15221 the strategic and tactical management tasks have to stay in the demand side
company. For this reason, enterprises usually manage these sorts of tasks in-house.

Facility Management market in Spain
19
2.4 Outsourcing
Facility Management and Outsourcing are high related terms. When talking about FM,
outsourcing has a big role in it. According to an Ernst & Young study, these are the
main reasons why European companies (Spain represents the 14% of the companies
surveyed) outsource their services, as in figure 3 can be observed:
However, the risks of outsourcing should also be taken into account (see figure 4):
As in figure 4 can be observed, loss of confidentiality is mainly perceived as a risk by
Spanish organizations. The perception of loss of confidentiality plays a role in the
location of outsourcing. Graeme Butterworth, Leader of EY’s Center of Excellence
Outsourcing Advisory, comments: “When organizations perceive confidentiality as a
risk of outsourcing, they are less willing to outsource their services to another country”.
As is visible in figure 5, Spanish organizations outsource very little to nearshore and
offshore locations. Nearshore refers to from another country in the same continent and
Fig. 3.
Most important reasons for outsourcing [14].
Fig. 4.
Most important risks for outsourcing [14].

Facility Management market in Spain
20
offshore from an offshore location, usually located in Asia, the Middle East, Africa or
Latin America [14].
2.5 Supply-side
Nowadays, there are very few IFM providers in the FM market in Spain and fewer ones
sub-contracting all their tasks except the management. In chapter 2.1, a general
classification of operators has been given but not in the particular Spanish case. Four
types of operators can be identified:
Single services providers are very numerous. Sectors of maintenance and
cleaning services are fragmented and receive many small-sized enterprises.
Multi-services providers are also numerous. They come from the construction
and real estate sectors.
Design and architectural services providers, specialized in space management
services.
IFM providers are normally international operators. On the other hand, the
most important Spanish providers (Eulen and Clece) come from the soft services
sector (cleaning and security) [12].
Fig. 5.
Location of outsourced services per country [14].

Facility Management market in Spain
21
The concentration process is still very slow in the FM Spanish Market. According to
IFMA Italia, the total income of the top 20 companies (Table 4) is 53% of the whole
outsourced market:
In order to reduce fragmentation and saturation of the market, big providers tend to
concentrate. Another fact is that captive enterprises usually acquire small-sized firms, so
that they can increase their dimension. Furthermore, foreign providers acquire small
operators focused on soft and maintenance services to enter in the Spanish market. The
biggest FM companies mainly manage in the infrastructural, technical, and soft services
areas. An interesting point is that the market is mainly dominated by domestic
enterprises, although there are also important foreign firms in the top 20 such as ISS
(Denmark) or Bilfinger Berger AG (Germany) nowadays known as Bilfinger SE [12].
Table 4.
Top 20 FM companies of the Spanish market in 2008 (source IFMA Italia 2009) [12].

Facility Management market in Spain
22
2.6 Size of the FM market
Facility Management offer and service supply is so large that is difficult to provide a
reliable turnover datum. Only the market value of maintenance service was 7.9 billion €
in 2012, according to Business Development Knowledge (BDK).
According to a EuroFM study, the Facility Management volume of the market in Spain
comes to 51 billion €. Moreover, the implementation of this discipline would suppose
potential savings of 13 billion € (6 billion to the private sector and 7 billion to the public
sector). According to Pedro García Carro, IFMA Spain vice-president, these savings
would help a lot in the today crisis context, mainly in the public sector where cutbacks
and savings are primordial. He also states that the real estate management department
manages the second highest cost of any organization, after employee salaries. Taking
this into account, and performing a professional and strategic management in the
property and its services, it would suppose savings between 20% and 30% of the total
costs itself. Furthermore, the annual net profit would increase between 6% and 9%.
Facility Management is also extending in other sectors. According to Jose María Gil,
the Workplace Services director, the health-care sector has a big potential due to the
hospitals structure and because of the increasing importance of non-sanitary support
services inside hospitals [15].
2.7 Public sector market
According to Fernando Vázquez, the 3g office president, the public sector is
approximately 15 years in delay comparing to the private sector. Although the difficult
economic situation, they have performed a space optimization exercise. However, it
appears to be very difficult to enter in the public sector, as politicians focus just on the
four coming years. FM studies the building life in 25 or 30 years. Moreover, politicians
are not interested in maintenance. Pedro García Carro adds that public contracting
legislation obstructs the full performance of the service suppliers [15].
In May 2013, IFMA Spain and Alcobendas council signed the first collaboration
agreement to work together on a hydroefficiency project in order to optimize the cost
and management of the hydro resources through FM [16].

Facility Management market in Spain
23
2.8 Outlook on the next years
Both demand-side and supply-side of the Spanish FM market are changing structurally.
Outsourcing practice is increasingly adopted by clients; in the ‘80s cleaning and
maintenance services were mainly outsourced and in the ‘90s signed the first multi-
services contracts; today even management activities are outsourced, mainly in the
insurance and banking sectors, due to its large amount of offices as mentioned in some
points above. However, the definition of the demand of the primary activities regarding
Facility Services and infrastructure, the sourcing and controlling of the provision will
continue being carried out by the internal FM department.
Furthermore, while dimension of the Facility Department is being reduced, companies
are giving more importance in it, because, as real estate portfolios are being reduced, the
FM function is comparatively gaining in weight.
Professionalism is being increased in providers, particularly soft service suppliers are
focusing on mergers and consolidation. Public-Private Partnership (PPP) projects
practice started in 2005. Today around 20 projects are being carried out, mainly in the
health-care sector and in the Madrid area (like Alcobendas), but also new projects will
be launched in other municipalities, prisons, schools as well as health-care institutions.
Often PPP projects are headed by construction companies, as they satisfy dimensional
and financial requirements. As they do not have the management skills needed to
operate the buildings for the next 30 years, services’ management contracts to FM
companies are delivered [12].
According to Pedro García Carro, FM implementation in public administration is one of
the main objectives in the coming years. As mentioned before, public administration
faces an economic crisis context and FM could represent the best solution [15].

Facility Management market in Spain
24
3. FM volume market in main disciplines
3.1 Maintenance
The real estate maintenance sector invoiced in Spain in 2012 around 4.8 billion €, 0.2
billion € less than 2011, 4% less.
By business segment, although all invoice similar amounts, elevator maintenance has
had the highest invoice followed by the industrial machinery maintenance, the electrical
installation and lighting maintenance, and in last position HVAC (heating, ventilation
and air conditioning) equipment.
The number of employees in this sector was around 150.000 in 2012, including those
workers who were in charge in the maintenance of other type of installations besides
buildings.
The number of companies in this sector was over 6.500 in 2012. Like in the number of
employees, this number includes companies focused on the maintenance of other
installations.
The majority of enterprises are small and medium-size; the 10 main companies
represent approximately the 25% of the market share. Companies generally concentrate
in Madrid and Catalonia provinces.
The increasing number of specialized firms in maintenance services combined with the
cut spending policies of the companies, lead to a strong competence among these kinds
of enterprises [17].
In figure 6, it can be observed the number of companies, number of employees, and
invoice evolution in maintenance Spanish sector.
Fig. 6.
Evolution of Maintenance sector in Spain [17].

Facility Management market in Spain
25
3.2 Security
The private security sector invoice in Spain, particularly the vigilance, was over 2
billion €.
The number of employees in this sector was around 85.000 in 2011. The majority of
private security enterprises were small or medium-size because 70% had less than 20
employees. In 2011, there were only four firms with more than 5.000 employees.
The number of companies in this sector was 1.492 in 2011, 443 of these were vigilance
enterprises. The rest were, for instance, transportation, alarm systems, counseling,
deposits etc.
The concentration of the enterprises is evident, as the five biggest companies in the
sector represent more than 50% of the total invoice.
In Madrid, Catalonia, Andalucía, and Valencia communities exist the highest
concentration of companies.
The main sectors that order vigilance services are industry and energy, financial and
trade entities, closely followed by public administrations and transportation.
As figure 7 shows, there has been a decreasing tendency of the invoice due to cut
spending policies of companies and public administrations [17].
According to a survey carried out by IFMA Spain in February 2014, figure 8 illustrates
how the Security services will develop in the next years.
Fig. 7.
Evolution of Security sector in Spain [17].

Facility Management market in Spain
26
Figure 9 shows how companies manage the risk assessment.
Technological systems
Decrease of vigilants
Contractual flexibility
Link remuneration to results
Risk assessment is performed by means of an internal expert audit
Risk assessment is performed by the contracted security company
Risk assessment is performed by means of an external experit audit
Risk assessment is performed by the insurance company
56%
19%
15%
10%
Fig. 8.
Future plans of security services companies [17].
4%
14%
31%
51%
Fig. 9.
Risk assessment by the companies [17].

Facility Management market in Spain
27
3.3 Real Estate
In 2012, the real estate offices asset in Spain was approximately 25 million m2, with an
estimated value of 55 billion €.
In Madrid and Barcelona exists the biggest concentration of offices, with an estimated
stock of 13 million m2
in Madrid and 6 million m2 in Barcelona. The following are
Valencia, Seville, Bilbao or Malaga.
The monthly average rent depends on the city and the area in the city of the building.
Madrid and Barcelona have the most expensive monthly average rents, around 16 and
14 €/m2 respectively, whereas the Spanish average is about 12 €/m
2.
In 2011, in cities such as Bilbao, Valencia, Seville or Malaga, the monthly average rents
varied between 9 and 10 €/m2.
The real estate clearance of offices in 2011 was approximately 12% in Madrid, 14% in
Barcelona, 21% in Valencia and around 17% in Malaga or Seville. The Spanish average
is 16%.
Due to high availability and low demand, the rents are decreasing as figure 10 shows
[17].
According to a survey carried out by IFMA Spain in January 2014, figure 11 illustrates
the most important qualities (in order) a building office should have.
Fig. 10.
Evolution of Real Estate sector in Spain [17].

Facility Management market in Spain
28
Figure 12 shows the tendency the new building offices will have according to the
interviewed companies.
1 • Good communication and access
2 • Good image of the building
3 • Own building services
4 • Parking facilitiy
5 • Variety of services in the surroundings
1 • The demanding space will decrease due to labor
flexibility and telework implantation.
2 • More distinction will be searched with stamps, tags
and accreditations of the property.
3 • Common services in the building will improve by the
owner.
4 • More privative services will be offered to the tenants
by the owner.
5 • Companies will tend to occupy peripheral areas instead
of central due to lower cost.
Fig. 11.
Most important qualities in building offices [17].
Fig. 12.
Tendency of the new building offices [17].

Facility Management market in Spain
29
3.4 Restoration
The restoration sector in Spain invoiced in 2012 approximately 3.15 billion €, 100
million € less than 2011.
Although there is a tendency outsourcing in companies, the invoicing in any of the
segments was lower in 2012 than 2011.
The number of employees in 2012 in this sector was around 56,000. The average
employee number per company is 59 employees and more than 75% of the enterprises
have at least 100 employees in their organization.
In 2012, more than 950 firms worked in this sector, being the market share of the top 10
enterprises the 55% approximately.
Companies’ size varies depending on the segment where they operate. The biggest are
restoration firms for transportation.
In any of the food segments, both number of employees and companies is decreasing,
due to enterprises integration and the economic crisis.
Madrid and Catalonia are the communities where there are more companies, followed
by Valencia Community, Basque Country and Andalusia [17].
Figure 13 shows the decreasing tendency of both number of companies and employees.
According to a survey carried out by IFMA Spain in October 2013, figure 14 illustrates
what customers most appreciate with a restoration service.
Fig. 13.
Evolution of Restoration sector in Spain [17].

Facility Management market in Spain
30
Figure 15 illustrates the main benefits of having a collective restoration service in an
enterprise.
1 • Improves employees well-being
2 • Improves company image
3 • Helps labor conciliation
4 • Improves productivity
Fig. 14.
Most valuable features of a restoration service [17].
Fig. 15.
Main benefits of restoration services [17].

Facility Management market in Spain
31
3.5 Cleaning
Cleaning sector in Spain invoiced in 2010 approximately 7 billion €. The number of
employees in this sector was around 400,000 in 2010. The average number of
employees per enterprise is 34 workers. According to some other sources in January
2011, 94% of the companies had at least 20 employees.
The number of firms in this sector was 23,770 in 2010, decreasing to 23,430 in 2011.
The invoicing of the top 10 companies, which six of them belong to IFMA Spain,
represents the 25% of the market share.
The majority of the firms are in Madrid, Catalonia, and Andalusia.
Due to the economic crisis, medium-sized companies tend to reduce and they are
generally absorbed by the large-sized enterprises. However, small-sized companies
from self-employment are increasing.
In order to satisfy customers demand, large-sized cleaning firms are also offering other
services at the same time, such as maintenance or auxiliary services [17].
Figure 16 shows the decreasing tendency of number of enterprises, number of
employees, and invoicing.
According to a survey carried out by IFMA Spain in October 2013, figure 17 illustrates
which are the main proposals that would lead to bigger savings in cleaning service.
Fig. 16.
Evolution of cleaning sector in Spain [17].

Facility Management market in Spain
32
Figure 18 shows the mid-term tendency of the cleaning service in order of importance.
1 •Cost reduction
2 • Services integration
3 • Contracting for results
4 • Improvements in quality service
5 • Other options
Fig. 17.
Proposals with potential savings in cleaning services [17].
Fig. 18.
Mid-term tendency of cleaning service [17].

Facility Management market in Spain
33
4. Methodology
There are many aspects to consider before writing any Thesis. First of all, it is essential
the author informs himself of the topic he is going to undertake. At this stage, in order
to write this Thesis, it has been performed an extensive literature review, from looking
for scientific papers at TU library to looking up information through Internet.
Afterwards, by means of a persistent brainstorming, the main goals of this study have
been determined. At the same time, some data from companies settled in Spain have
been collected, so that the Thesis represents better the FM reality.
In order to collect the required data, three major research paradigms can be found:
Quantitative Research Method, Qualitative Research Method and Mixed Research.
Quantitative and qualitative methods both have particular weak points. So, it has been
considered convenient to use the research method “Mixed Research”. This term is used
to refer general type of research in which qualitative and quantitative research
techniques, methods, and other paradigm characteristics are brought together in an
overall study [18].
There are two major types of mixed research: Mixed Model Research and Mixed
Method Research/Approach. In the Mixed Method Research quantitative questionnaires
with qualitative data collection are combined e.g. individual interviews, focus groups,
observations and action research. That is to say, in one phase of the study qualitative
research paradigm is used and for the other phase of the study the researcher uses
quantitative research paradigm. Therefore, performing this combination allows the
researcher answering specific questions in a more proper way. It also allows the analyst
to have a feedback with the interviewers and it may help to rephrase some questions or
add more questions to make the survey even more efficient. On the other hand, there is
the Mixed Model Research. In this type of mixed research, quantitative and qualitative
approaches are also used. In this case, the survey contains rating scales (quantitative
data collection) and open-ended questions (qualitative data collection) [16][17][18].
To have an overall view of the methodology, there are eight stages in the mixed
research process, as shown in figure 19.

Facility Management market in Spain
34
In this study, both Mixed Model Research and Mixed Method Research have been
performed. To collect all the required data, a standardized questionnaire with up to 38
closed and opened questions has been used. First of all, the questionnaire was translated
from German to English, and afterwards to Spanish. Performing the interviews in
Spanish has enabled the fulfillment of the survey to be much faster and efficient. The
survey has been divided into six main areas that are as follows:
1. Organization: This part focuses on the general organization and which role FM
departments play in the company e.g existence of a FM department, hierarchy
and main goals of FM department.
2. Value added: This part concentrates on parameters that determine how
successful FM is for the company e.g savings, increases of productivity.
3. Outsourcing: This division focuses on how the company outsources its main
services e.g number of external service providers, fields of the external service
providers, or type of contract the external service is applied.
4. IT Support: This part cares of the use of IT systems and software by enterprises
e.g ERP and CAFM systems.
5. Basic data of the company: This part focuses on general information of the
company e.g. type of industry, number of employees, or value of the property.
6. Sustainability and CSR: This division concentrates on, as its noun says,
sustainability and which contribution FM can give.
Fig. 19.
Important steps in a mixed research study [19].

Facility Management market in Spain
35
The population for the survey has been the Top 500 companies (ranking is sales driven)
in Spain, 23 of these have participated in the survey. These enterprises have been
chosen randomly not only in terms of ranking but also in terms of type of industry. All
companies that had been contacted were exported to a MS Excel sheet to have a clearer
view of the number of enterprises studied. Interviewees have been the internal Facility
Managers or the people responsible for all FM tasks according to the European Norm
EN 15221-1. The tools used for the surveys have been phone and E-mail. All the phone
interviews with the Facility Managers of the different companies have been carried out
by one researcher. By this means, the data quality was more secured. These answers
have been entered in a MS Access database and afterwards exported into Microsoft
Excel in order to evaluate and analyze the data [18].
At the end, all results have been discussed and have helped to draw conclusions that
will answer the research questions formulated in the beginning of this Thesis.

Facility Management market in Spain
36
5. Results and analysis
This chapter will be divided into two parts: the first one will focus on the FM status quo
in Spain displaying most of the results collected from the 23 surveyed companies. These
results will be structured as follows: organization, outsourcing, IT support, basic data of
the company, and sustainability and CSR. The second part will show a comparison
between FM Spanish situation and some other European countries in the following
topics: organization, outsourcing and IT support. At the same time, all these results will
be discussed and analyzed.
5.1 FM status quo in Spain
5.1.1 Organization
To begin with, more than 80% of the companies have an own FM department, which
explains that FM in companies in Spain begins to have an important presence. Figure 20
shows more clearly the results.
Another important variable is the number of employees that FM departments have. It is
evident that FM departments are still quite small in terms of employees, as Figure 21
shows. Almost 70% of the FM departments do not have more than 10 members.
82,6%
17,4%
yes
no
Fig. 20.
Portion of companies with an own FM department.

Facility Management market in Spain
37
A positive aspect is that most of the FM departments are fully integrated in the
organizational structure of the enterprises, as Figure 22 illustrates.
In the FM Spanish market, cost reduction, outsourcing, or cost transparency are some of
the main objectives enterprises look for through the use of FM. It is remarkable that a
100% of the surveyed companies take cost reduction as an important objective. Figure
23 shows more precisely the strategies FM departments have.
26,3%
21,1% 21,1%
26,3%
5,3%
0,0%
5,0%
10,0%
15,0%
20,0%
25,0%
30,0%
1 to 2 3 to 5 6 to 10 11 to 50 above 100
68,4%
31,6% staff unit
line function
Fig. 21.
Number of employees of FM departments.
Fig. 22.
Hierarchic level of FM department.

Facility Management market in Spain
38
Also interesting to analyze are the problems that companies have to face in the field of
real estate/FM. In Spain, in almost 80% of the enterprises, the introduction of a new
philosophy is a problem to be solved or improved. Other problems are shown in Figure
24.
100,0%
94,7%
94,7%
94,7%
89,5%
89,5%
84,2%
84,2%
73,7%
68,4%
57,9%
52,6%
10,5%
0,0
%
10
,0%
20
,0%
30
,0%
40
,0%
50
,0%
60
,0%
70
,0%
80
,0%
90
,0%
10
0,0
%
cost reduction
outsourcing
flexibility through internal team
cost transparency
quality assurance
sustainability
increase service
save environment
increase productivity of core …
stability of value
centralization
production process in a timely …
others
78,3%
43,5%
26,1%
26,1%
21,7%
21,7%
21,7%
13,0%
13,0%
8,7%
8,7%
4,3%
4,3%
8,7%
8,7%
0,0
%
10
,0%
20
,0%
30
,0%
40
,0%
50
,0%
60
,0%
70
,0%
80
,0%
90
,0%
10
0,0
%
introduction of a new philosophy
realisation/implementation
data collection - facilities
comprehension of staff for FM
data collection - digital planning
lauching new software
balancing act serv. prov. - …
safety
maintenance/repair
start difficulties - flow
personnel costs/staff training
relocation
energy
no problems
no answer
Fig. 23.
Main goals FM departments have.
Fig. 24.
Biggest problems companies have in the field of FM.

Facility Management market in Spain
39
The biggest cost driver in the field of real estate/FM is maintenance/repair in the case of
Spain. However, there is not a big difference with the following cost drivers, such as
technology, energy or realization. Figure 25 shows more clearly this information.
During this Thesis, it has been mentioned that FM enables companies to manage better
their assets, so that they will be able to be more cost efficient and, as a consequence,
obtain savings. Figure 26 illustrates the fields/services with the biggest savings through
the use of FM (results expressed in companies’ percentage).
56,5%
43,5%
39,1%
39,1%
34,8%
34,8%
21,7%
17,4%
13,0%
13,0%
4,3%
8,7% 0
,0%
10
,0%
20
,0%
30
,0%
40
,0%
50
,0%
60
,0%
70
,0%
80
,0%
90
,0%
10
0,0
%
maintenance/repair
technology/hardware
realisation/implementation
energy
lauching new software
safety
balancing act serv. prov. - management
relocation
data collection - facilities
personnel costs/staff training
no cost drivers
no answer
69,6%
56,5% 47,8%
4,3% 4,3% 4,3%
17,4%
0,0% 10,0% 20,0% 30,0% 40,0% 50,0% 60,0% 70,0% 80,0% 90,0%
100,0%
Fig. 25.
Biggest cost drivers companies have in the field of FM.
Fig. 26.
Fields/services with the biggest savings through the use of FM (results expressed in
companies’ percentage).
Facility Management market in Spain
40
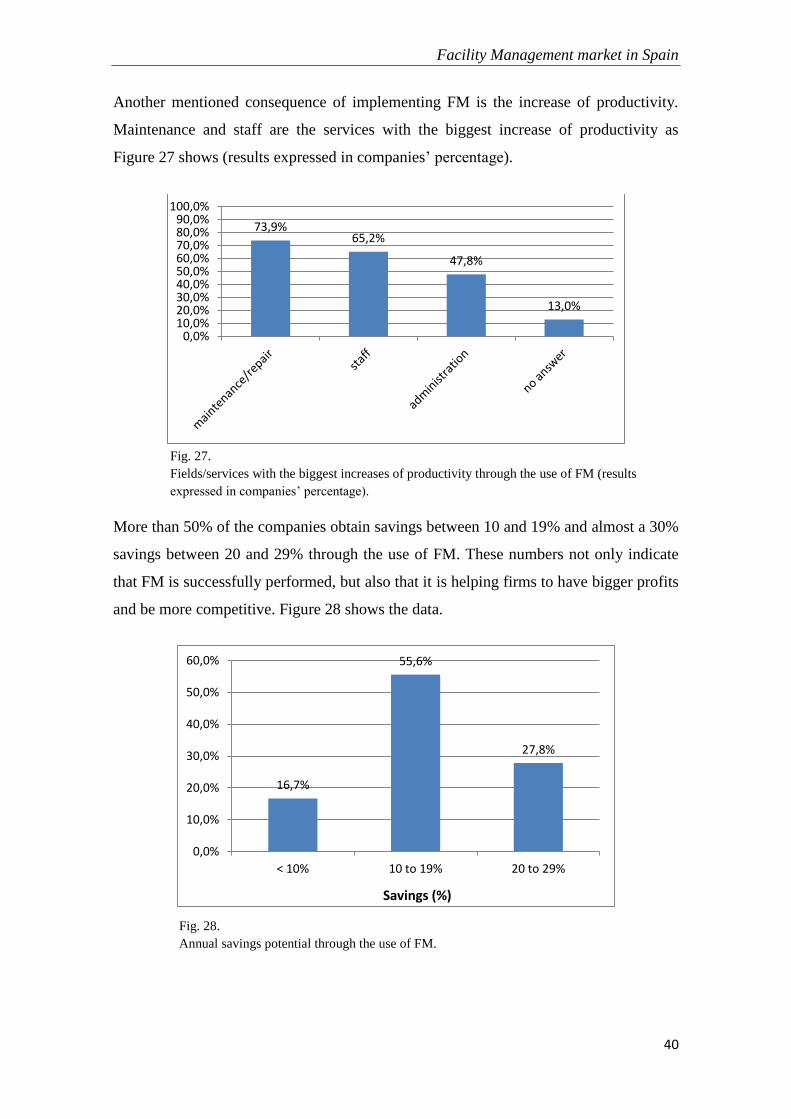
Another mentioned consequence of implementing FM is the increase of productivity.
Maintenance and staff are the services with the biggest increase of productivity as
Figure 27 shows (results expressed in companies’ percentage).
More than 50% of the companies obtain savings between 10 and 19% and almost a 30%
savings between 20 and 29% through the use of FM. These numbers not only indicate
that FM is successfully performed, but also that it is helping firms to have bigger profits
and be more competitive. Figure 28 shows the data.
73,9% 65,2%
47,8%
13,0%
0,0% 10,0% 20,0% 30,0% 40,0% 50,0% 60,0% 70,0% 80,0% 90,0%
100,0%
16,7%
55,6%
27,8%
0,0%
10,0%
20,0%
30,0%
40,0%
50,0%
60,0%
< 10% 10 to 19% 20 to 29%
Fig. 27.
Fields/services with the biggest increases of productivity through the use of FM (results
expressed in companies’ percentage).
Savings (%)
Fig. 28.
Annual savings potential through the use of FM.

Facility Management market in Spain
41
5.1.2 Outsourcing
As it has been previously observed in Figure 23, outsourcing is one of the main
strategies FM departments have. Therefore, the analysis of this parameter will lead to
more useful information. As Figure 29 shows, most of the companies retain between 3
and 10 external service providers. Contracting 1 or 2 providers seems to be quite
unusual.
A very remarkable fact is that the top companies in Spain tend to outsource their
services quite a lot. All the surveyed enterprises carry out at least 50% of their services.
Figure 30 illustrates more precisely this information.
5,9%
70,6%
23,5%
0,0%
10,0%
20,0%
30,0%
40,0%
50,0%
60,0%
70,0%
80,0%
90,0%
100,0%
1 to 2 3 to 10 above 10
20,0%
80,0%
50-74%
75-100%
Percentage of outsourced services
Number of ext. service providers
Fig. 29.
Number of external service providers retained by the companies.
Fig. 30.
How much do enterprises carry out their services.

Facility Management market in Spain
42
There are plenty of different services that can be outsourced. In this case, cleaning and
maintenance are the most outsourced services with a 100% of the companies. Figure 31
shows more accurately the areas of outsourcing. It can also be observed that the
outsourced services belong to support services.
In order to perform a good outsourcing policy, it is essential to choose the better
provider as possible. The reasons for choosing one provider or another are displayed in
Figure 32. It is remarkable that the most important reason is the price-performance ratio
followed by an active service provision. Some people would say that price is the main
characteristic companies search when contracting an external service provider. The
reality shows that it is not even in the top 5 reasons.
100,0%
100,0%
95,7% 95,7%
91,3%
82,6%
69,6%
65,2%
65,2%
65,2%
60,9%
56,5%
47,8%
47,8%
43,5%
30,4%
30,4%
30,4% 13,0%
8,7%
8,7%
0,0
%
10
,0%
20
,0%
30
,0%
40
,0%
50
,0%
60
,0%
70
,0%
80
,0%
90
,0%
10
0,0
%
cleaning
maintenance/repair
safety, security
postal service
fire protection
catering
switchboard
removal service
caretaker
heating/ventilation
disposal
planning (constr.)
logistic services
electric service
outdoor area helpdesk
vehicle fleet
energy management
others: gardening, transport
winter service
commercial services
Fig. 31.
Areas of outsourcing.

Facility Management market in Spain
43
5.1.3 IT support
Another variable that is highly linked to FM is Information Technology (IT). Two IT
systems that are used to support FM and Real Estate processes are CAFM-systems and
ERP-systems. CAFM (Computer Aided Facility Management) is a high-tech tool used
by facility professionals to track and manage virtually any facility-related asset. ERP
(Enterprise Resource Planning) is a business software system that enables companies to
share common data and activities throughout the entire enterprise, automate and
integrate the critical parts of its business processes and generate and access information
in real-time environment. Figure 33 shows that a little bit more than a 50% of the
surveyed companies use a CAFM system [21].
88%
69%
58%
54%
47%
43%
33%
30%
29%
22%
6%
31%
17%
41%
43%
38%
60%
30%
29%
56%
17%
5%
14%
7%
40%
42%
11%
8%
5%
5%
5%
11%
6%
0% 20% 40% 60% 80% 100%
price-performance …
active service provision
flexibility
quality
competency/know how
price
communication/feedb.
coordination
impression/references
former cooperation
very import.
important
indifferent
rather unimp.
unimportant
55,6% 44,4% yes
no
Fig. 32.
Main reasons when choosing an external service provider.
Fig. 33.
Portion of companies that use a CAFM system.
Facility Management market in Spain
44
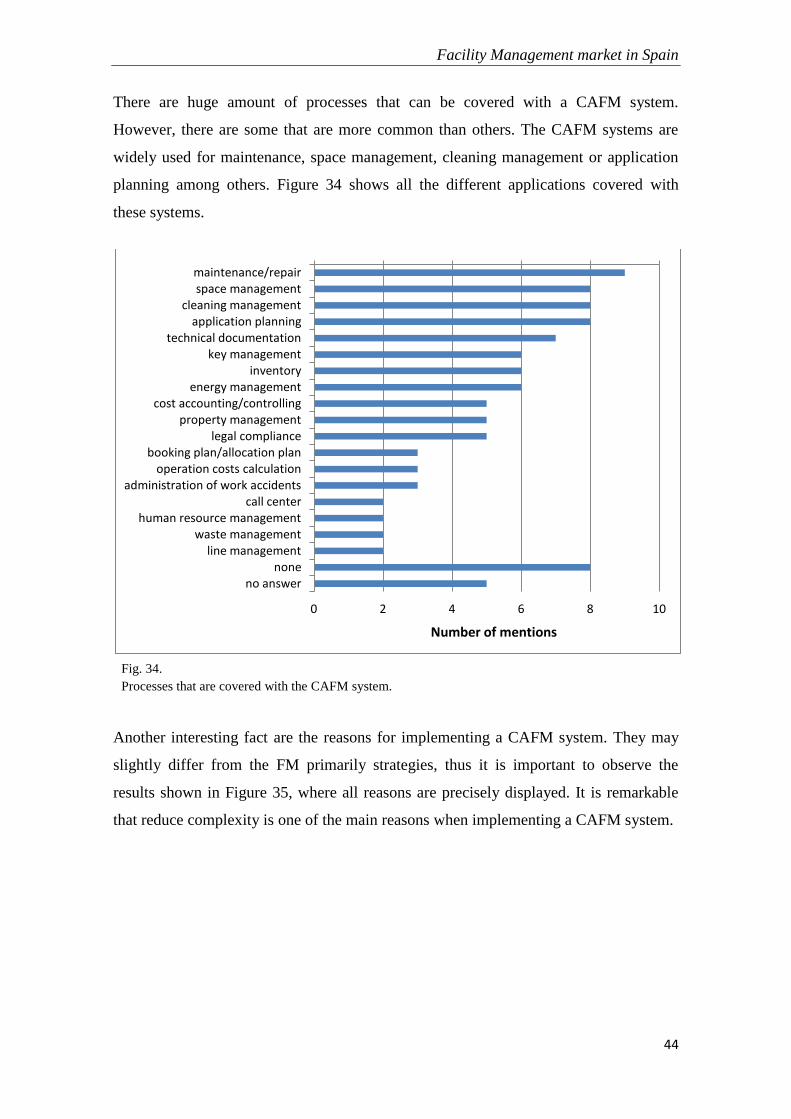
There are huge amount of processes that can be covered with a CAFM system.
However, there are some that are more common than others. The CAFM systems are
widely used for maintenance, space management, cleaning management or application
planning among others. Figure 34 shows all the different applications covered with
these systems.
Another interesting fact are the reasons for implementing a CAFM system. They may
slightly differ from the FM primarily strategies, thus it is important to observe the
results shown in Figure 35, where all reasons are precisely displayed. It is remarkable
that reduce complexity is one of the main reasons when implementing a CAFM system.
0 2 4 6 8 10
maintenance/repair space management
cleaning management application planning
technical documentation key management
inventory energy management
cost accounting/controlling property management
legal compliance booking plan/allocation plan
operation costs calculation administration of work accidents
call center human resource management
waste management line management
none no answer
Number of mentions
Fig. 34.
Processes that are covered with the CAFM system.

Facility Management market in Spain
45
A large portion of companies use an ERP system, more specifically, 89% of the
surveyed enterprises utilize an ERP system as Figure 36 shows.
Like CAFM systems, ERP systems enable organizations to control a wide range of
different business processes. In Spain, cost accounting and financial accounting are the
main processes covered by the companies that use an ERP system. However, there are
many other processes that are controlled with these systems. Figure 37 shows more
accurately all these covered business processes.
0 2 4 6 8 10
reduce complexity
consistent documentation
cost savings
increase in productivity
automatization
modernization
utilization of synergies
no answer
none
Number of mentions
88,9%
11,1%
yes
no
Fig. 35.
Reasons for implementing a CAFM system.
Fig. 36.
Portion of companies that use an ERP system.

Facility Management market in Spain
46
It is remarkable that the main reason for implementing a CAFM system and an ERP
system is the same, reduce complexity. It seems clear that “make things easier” is a big
reason for top companies in Spain when implementing any IT system. Figure 38 gives a
clearer view of the main reasons for implementing an ERP system.
0 5 10 15 20
cost accounting/controlling financial accounting
human resource management asset accounting/inventory man.
production material management/orders
distribution maintenance/repair
property management organization
call center legal compliance
administration of work accidents waste management
project management business processes
energy management none
no answer
Number of mentions
0 5 10 15
reduce complexity
increase in productivity
automatization
cost savings
control of processes
modernization
quick analysis
facilitate handling
utilization of synergies
consistent documentation
no answer
none
Number of mentions
Fig. 37.
Business processes covered with the ERP system.
Fig. 38.
Reasons for implementing an ERP system.

Facility Management market in Spain
47
5.1.4 Basic data of the company
A total of 23 companies of the Top 500 (ranking sales driven) have participated in this
study. As mentioned in previous chapters, these organizations have been chosen
randomly. Consumer goods has been the industry with most participation, closely
followed by chemistry, industry, and banking. Figure 39 shows all the different
industries that the interviewed enterprises belong to.
Bearing in mind the participant companies are in the Top 500, their organization will
probably have a big number of employees. Figure 40 corroborates this showing that
more than 80% of the surveyed firms have more than a 1000 employees within their
organization.
17,4%
21,7%
17,4% 4,3% 4,3%
17,4%
4,3%
4,3% 8,7%
chemistry, pharmaceutics
food, consumer goods
industry
training, education
electrical, ICT
banking, finance, insurance
Fig. 39.
Sectors where the interviewed companies belong to.

Facility Management market in Spain
48
5.1.5 Sustainability and CSR
Sustainability and CSR (Corporate Social Responsibility) are topics that must be taken
into account when analyzing FM. Figure 41 shows the importance that FM has for the
CSR of the company. In only 30% of the companies, FM is considered important for the
CSR of the enterprise. This number reveals that more work has to be done in order to
give FM a more important role within the organization.
8,7%
82,6%
8,7%
501-1000
> 1000
no answer
17,4%
13,0%
34,8%
13,0%
21,7%
0,0
%
5,0
%
10
,0%
15
,0%
20
,0%
25
,0%
30
,0%
35
,0%
40
,0%
very important
important
indifferent
rather unimportant
no answer
Fig. 40.
Number of employees of the companies.
Fig. 41.
Importance of FM for the CSR of the company.

Facility Management market in Spain
49
However, around 70% of the firms have a CSR annual report or some other publications
on CSR. Figure 42 illustrates these results.
A key performance indicator is how satisfied are facility managers with the success of
FM. Figure 43 shows that almost 60% of facility managers would rate the FM
performance as successful or very successful. These results clearly indicate that FM has
already been established in the Spanish market; notwithstanding there is still a lot of
work to do.
69,6%
13,0%
17,4%
yes
no
no answer
17,4%
39,1%
26,1%
17,4%
huge success
success
indifferent
no answer
Fig. 42.
Portion of firms that have a CSR annual report.
Fig. 43.
Facility managers’ rating of the overall success of FM.

Facility Management market in Spain
50
5.2 FM Spanish market compared to other European countries
As it has been previously mentioned, this chapter will focus on comparing FM Spanish
status quo with other European countries, displaying similarities and differences. By
this means, readers will have a wider view of the FM situation in Spain and in Europe.
5.2.1 Organization
As it has been mentioned in the previous chapter, more than 80% of the companies in
Spain have an own FM department. Although this fact may suggest a very high FM
settlement at enterprises in Spain, in Austria this portion is even higher with almost 90%
of the companies. Figure 44 shows data of other European countries such as Germany,
Bulgaria, and Romania.
As mentioned in the previous chapter, most of the FM departments do not have plenty
of employees in it. Looking at Figure 45, it can be observed that Austrian and Spanish
results are rather similar, whereas in Germany and Romania the FM departments tend to
have more employees.
68%
79% 80% 85% 87% 90% 87% 88%
70% 73%
35%
55%
75% 72%
82,60%
0%
10%
20%
30%
40%
50%
60%
70%
80%
90%
100%
Fig. 44.
Portion of companies with an own FM department by country and year [18].

Facility Management market in Spain
51
In the case of Spain, FM departments hold a more important role, in terms of hierarchy,
than other countries like Austria, Germany, or Romania. Figure 46 shows more
precisely the hierarchic level FM departments have in the company.
23% 23% 15%
29% 24% 36%
22%
38%
9%
26,00%
23% 31%
7%
22% 20%
23%
30%
22%
16% 9%
21,00%
20% 17%
7%
13% 24%
22% 23%
16%
15% 8%
21%
23% 22%
43%
28% 24%
16% 21% 19%
31%
58%
26%
6% 5%
14%
5% 4% 3% 3% 1%
15%
8%
4% 3% 14%
2% 4% 1% 3%
23%
8% 5%
0%
10%
20%
30%
40%
50%
60%
70%
80%
90%
100%
>100
51 to 100
11 to 50
6 to 10
3 to 5
1 to 2
22%
50%
14%
41% 26%
40% 35% 22% 19% 25%
68%
50%
46%
72%
36% 64% 50% 54%
59% 56%
67%
32% 28%
4% 14%
23% 9% 10% 11%
19% 25%
8%
0%
10%
20%
30%
40%
50%
60%
70%
80%
90%
100%
below
line function
staff unit
Fig. 45.
Number of employees within the FM departments by country and year [18].
Fig. 46.
Hierarchic level of FM department in different European countries [18].

Facility Management market in Spain
52
The strategies of the FM department slightly vary from one country to another. One
significant difference is that Austria gives more importance to stability of value than in
Spain or Romania. Another remarkable difference is that sustainability is much less
important for Romania than for Austria or Spain. In spite of all these differences, it can
be seen in Figure 47 that these countries have similar aims.
A much bigger difference can be observed in the cost drivers. There are some
similarities but it is more common to see differences among Austria, Romania, and
Spain. Figure 48 shows the biggest cost drivers companies have in real estate/FM field.
0% 10% 20% 30% 40% 50% 60% 70% 80% 90%
100%
Austria 2013
Romania 2013
Spain 2014
0%
10%
20%
30%
40%
50%
60%
lau
nch
ing
new
so
ftw
are
safe
ty
dat
a co
llect
ion
- …
dat
a co
llect
ion
- …
tech
no
logy
/har
dw
are
per
son
nel
co
sts/
staf
f …
relo
cati
on
reco
nst
ruct
ion
intr
od
uct
ion
of
a n
ew …
bal
anci
ng
act …
star
t d
iffi
cult
ies
- fl
ow
ener
gy
ren
t
un
der
stan
din
g FM
mai
nte
nan
ce -
rep
air
real
isat
ion
oth
ers
no
co
st d
rive
rs
no
an
swer
Austria 2013
Romania 2013
Spain 2014
Fig. 47.
Strategies of the FM department in Spain, Austria, and Romania [18].
Fig. 48.
Biggest cost drivers of companies in the field of FM in Spain, Austria, and Romania [18].
Facility Management market in Spain
53
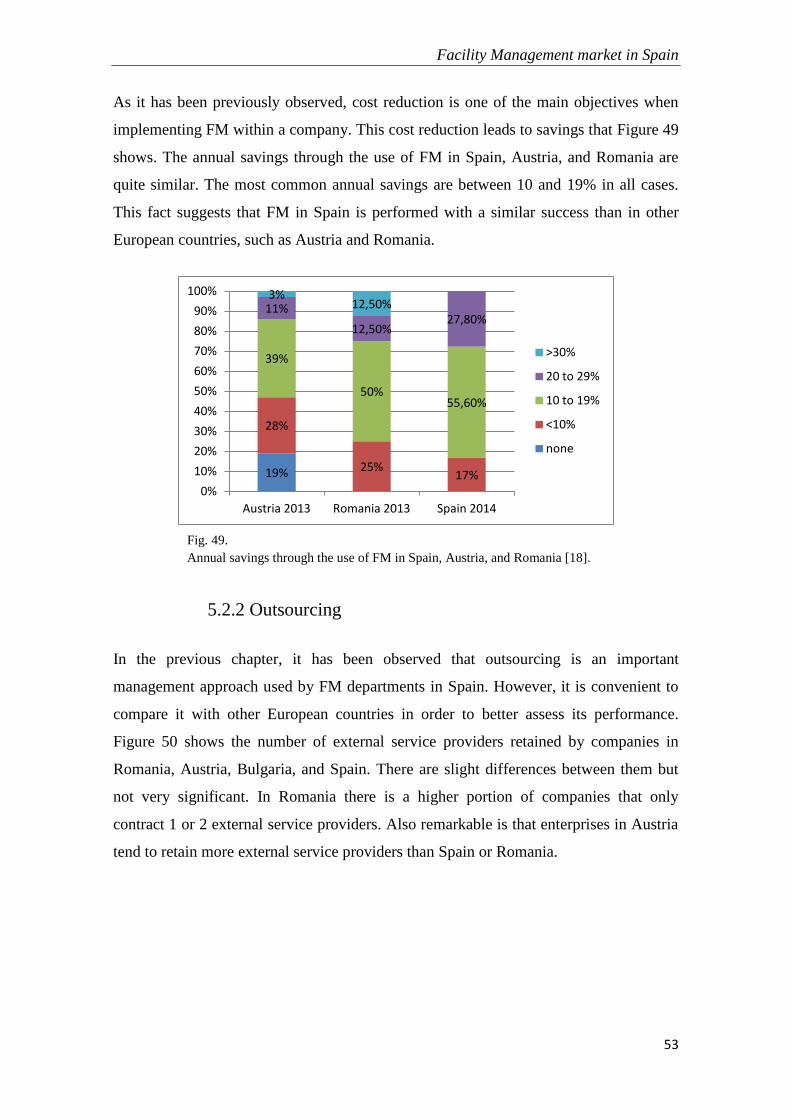
As it has been previously observed, cost reduction is one of the main objectives when
implementing FM within a company. This cost reduction leads to savings that Figure 49
shows. The annual savings through the use of FM in Spain, Austria, and Romania are
quite similar. The most common annual savings are between 10 and 19% in all cases.
This fact suggests that FM in Spain is performed with a similar success than in other
European countries, such as Austria and Romania.
5.2.2 Outsourcing
In the previous chapter, it has been observed that outsourcing is an important
management approach used by FM departments in Spain. However, it is convenient to
compare it with other European countries in order to better assess its performance.
Figure 50 shows the number of external service providers retained by companies in
Romania, Austria, Bulgaria, and Spain. There are slight differences between them but
not very significant. In Romania there is a higher portion of companies that only
contract 1 or 2 external service providers. Also remarkable is that enterprises in Austria
tend to retain more external service providers than Spain or Romania.
19%
28%
25% 17%
39%
50% 55,60%
11%
12,50% 27,80%
3% 12,50%
0%
10%
20%
30%
40%
50%
60%
70%
80%
90%
100%
Austria 2013 Romania 2013 Spain 2014
>30%
20 to 29%
10 to 19%
<10%
none
Fig. 49.
Annual savings through the use of FM in Spain, Austria, and Romania [18].

Facility Management market in Spain
54
Figure 51 illustrates the outsourcing areas where companies retain their external service
providers. This figure confirms that enterprises in Spain tend to outsource more their
services than other countries, in this case Austria and Romania. This is probably
explained due to the economic crisis that Spanish market dramatically suffered in the
last years. Unfortunately, in this crisis context, plenty of companies opted to outsource
part of their services in order to reduce costs. As a result, not only multinational
companies but also small and medium-sized enterprises are increasingly outsourcing
their services. However, there are some remarkable similarities, for instance, cleaning
and technical maintenance are one of the main outsourced areas for all these countries.
Also interesting is that winter service is hardly outsourced in Spain, whereas in Austria
is the second most outsourced service [22].
0% 10% 20% 30% 40% 50% 60% 70% 80% 90%
100%
Cle
anin
g
Win
ter
Serv
ice
Tech
nic
al …
Hea
tin
g/ve
nti
lati
on
Safe
ty, s
ecu
rity
Elec
tric
ser
vice
Cat
erin
g
Lan
dsc
apin
g/ga
rde…
Was
te m
anag
emen
t
Pla
nn
ing/
esta
tes …
Fire
pro
tect
ion
Mo
ve s
ervi
ce
Veh
icle
fle
et
Hel
pd
esk
Ener
gy p
rovi
sio
n
Po
stal
ser
vice
Tele
fon
ext
ensi
on
Car
etak
er/h
and
yman
Logi
stic
ser
vice
s
Co
mm
erci
al s
ervi
ces
Oth
ers
Austria 2013
Romania 2013
Spain 2014
Fig. 50.
Number of external service providers retained by companies [18].
Fig. 51.
Outsourcing areas in Austria, Spain, and Romania [18].

Facility Management market in Spain
55
5.2.3 IT support
It will be also interesting to compare the IT support used in Spain from other countries
like Austria or Romania. Figure 52 shows that there are some differences between these
countries in the portion of companies using a CAFM system. Spain is the country with a
higher portion of enterprises with a CAFM system with a 56%. Besides increasing
productivity, implementing a CAFM system entails more cost drivers, because of the
need to collect and maintain data. As it was observed in Figure 48, collecting data for
Austria is an important cost driver, whereas in Spain is not. This may explain why
companies in Spain tend to keep using CAFM systems in a higher portion, as it does not
represent a threatening cost [21].
There are significant differences in the reasons for implementing a CAFM system
between Austria, Romania, and Spain. However, there is not an evident pattern in the
results as Figure 53 shows.
27% 36%
56%
73% 64%
44%
0%
10%
20%
30%
40%
50%
60%
70%
80%
90%
100%
Austria 2013 Romania 2013 Spain 2014
no
yes
Fig. 52.
Portion of companies with a CAFM system in Austria, Romania, and Spain [18].

Facility Management market in Spain
56
The portion of firms with an ERP system is quite similar from one country to another.
Spain, with an 89% of the companies, is the country with a higher portion of companies
using an ERP system, followed by Romania and Austria. Figure 54 shows the results
more clearly. Figure 52 and 54 suggests that, as well as in Austria and Romania, most of
the surveyed companies in Spain use standard software (ERP) rather than graphics-
oriented (CAFM) to cover FM processes and functions.
65%
80% 89%
35%
20% 11%
0%
10%
20%
30%
40%
50%
60%
70%
80%
90%
100%
Austria 2013 Romania 2013 Spain 2014
no
yes
Fig. 53.
Reasons for implementing a CAFM system in Austria, Romania, and Spain [18].
Fig. 54.
Portion of enterprises with an ERP system [18].

Facility Management market in Spain
57
There are significant differences in the reasons for implementing an ERP system among
countries. Figure 55 shows more precisely the results. As happened before, there is not
an evident pattern in the results.
Fig. 55.
Reasons companies have for implementing an ERP system [18].

Facility Management market in Spain
58
6 Conclusions
At the beginning of this Thesis, some objectives were defined in order to perform this
study and to set more precisely the scope of the Thesis. Moreover, some research
questions were formulated in order to receive explanations that answered these
questions as much complete as possible. After having investigated and analyzed the FM
market in Spain, both theoretically and empirically, it is the ideal moment to assess
whether the goals have been accomplished or not.
The first objective was to know the value added FM provides to companies in Spain.
Throughout this entire Thesis, many benefits from implementing FM in an enterprise
have been seen, such as increase of productivity or important annual savings. In
business terms, these two factors are regarded as key performance indicators. That is
why, at first glance, FM provides important benefits to any company that implements it.
Another important aim was to determine the FM status quo in Spain, firstly focused on
qualitative terms and afterwards, focused on data analysis. This objective has been fully
fulfilled. At the first part of the Thesis, there is more qualitative data about the FM
Spanish situation. FM in Spain appears to be in a growing and development phase, so
that, there is still a long way to go; it is considered as an emerging market. There is still
quite a big distance from the top European countries, such as the Netherlands or UK.
However, the market volume that represents the real estate/FM field is quite remarkable.
At the second part of the Thesis, there has been all the data analysis from the
interviewed enterprises. This analysis has revealed that FM in Spain, at least in the top
companies, begins to play an important role in the market. Moreover, the big FM
growth in the last years permits professionals to be optimistic for the future.
The last but not least objective was to compare the FM Spanish status quo with other
European countries through the data analysis. Although it has been compared to few
countries, especially Austria and Romania, this comparison has been useful to set a
reference and to assess more strictly the FM Spanish market. As Austria is considered to
be a developed market of FM, comparing the results with this country is a good
reference point. In terms of organization, FM Spanish market is still a little bit behind
Austria or Germany as it has a lower portion of companies that have an own FM
department. The annual savings seem to be very similar and it makes difficult to assess

Facility Management market in Spain
59
whether the FM Spanish market is more successful or not. In outsourcing, companies in
Spain appear to be much acquainted in outsourcing their services, even more than
Austria. In IT support, the results shown make difficult to claim whether the FM in
Spain is more successful or not. The overall results suggest that FM in Spain is being
successful, but it is convenient to remember that these results have been taken from the
top companies. One of the FM Spanish weak points is the lack of FM settlement in
small and medium-sized companies and also in public administration.
Before finishing this study, it is convenient to remember the research questions
formulated at the beginning. Although these questions have been deeply answered
throughout the Thesis, in this chapter summarized answers of them will be given.
“What do enterprises in Spain want to accomplish with the use of FM?”
FM offers plenty of advantages but the main strategies undertaken by companies in
Spain are cost reduction, outsourcing, flexibility through the internal team, and cost
transparency.
“How big is the annual saving potential through the use of FM in Spain?”
Most of the enterprises obtain annual saving through the use of FM. More than 80% of
the companies have annual savings over 10%; meaningful results.
“How important is outsourcing for companies in Spain and which are the most
outsourced services?”
Outsourcing, as mentioned before, is one of the main strategies FM has and the results
confirm this fact. A very remarkable fact is that all surveyed companies outsource at
least 50% of their services, being cleaning and maintenance the most outsourced
services. So, nowadays outsourcing is definitely important for enterprises in Spain,
although the facility demand and services should always be managed by the internal FM
department.
“How different is the performance of FM in Spain from other European countries?”
The FM performance in Spain compared to other European countries is definitely
successful. FM Spanish market presents competitive results in terms of annual savings

Facility Management market in Spain
60
and increase of productivity among others. However, small, medium-sized companies,
and public administration are still far of the top level of other European countries.
More research in this field has to be done in order to check the FM Spanish market
progress throughout the next years.
8. REFERENCES
[1] European Standard EN 15221-1 (2006), pp. 5.
[2] European Standard EN 15221-1 (2006), pp. 8.
[3] http://www.ifma-spain.org/facility_management.php (accessed 01/04/2014)
[4]http://buildinginformationmanagement.wordpress.com/2012/02/10/european-facility-
management-data-standard-en-15221-3/ (accessed 20/07/2014)
[5] http://www.eurofm.org/about-us/what-is-fm/ (accessed 23/04/2014)
[6]https://www.facilityservices.es/library/Historia%20del%20FM%20%20articulo%20r
esumen%202011.pdf (accessed 27/04/2014)
[7] http://www.ifma-spain.org/facility_management_02.php (accessed 07/04/2014)
[8] European Standard EN 15221-1 (2006), pp. 4.
[9] http://www.ifma-spain.org/facility_management_05.php (accessed 07/04/2014)
[10] Aberto F. de Toni, Alberto Ferri and Mattia Montagner (2009): Open facility
management, A successful implementation in a public administration, pp. 30-32.
[11] Aberto F. de Toni, Alberto Ferri and Mattia Montagner (2009): Open facility
management, A successful implementation in a public administration, pp. 29.
[12] Aberto F. de Toni, Alberto Ferri and Mattia Montagner (2009): Open facility
management, A successful implementation in a public administration, pp. 47-50.
[13]http://www.facilitymanagementservices.es/actualidad-1/entrevistas/david-
mart%C3%ADnez/ (accessed 10/04/2014)
[14]http://www.ey.com/Publication/vwLUAssets/Outsourcing_in_Europe_2013/$FILE/
EY-outsourcing-survey.pdf (accessed 01/05/2014)
[15]http://www.ifma-spain.org/PDF/especial_fm_metros_2_2013.pdf(accessed
03/05/2014)
[16] http://www.ifma-spain.org/noticia_29.html (accessed 03/05/2014)

Facility Management market in Spain
61
[17] IFMA España Comisión de Research (2014): Grandes cifras del FM
[18] Redlein, A., Zobl, M. (2014): Facility Management in West- and Eastern Europe,
Vienna University of Technology, IFM
[19] http://www.southalabama.edu/coe/bset/johnson/lectures/lec14.htm (accessed
15/04/2014)
[20]http://libweb.surrey.ac.uk/library/skills/Introduction%20to%20Research%20and%2
0Managing%20Information%20Leicester/page_54.htm (accessed 15/04/2014)
[21] Redlein, A., Zobl, M. (2014): IT-Support within Facility Management in West- and
Eastern Europe, Vienna University of Technology, IFM
[22]http://www.economiadigital.es/es/notices/2013/10/la_cara_y_la_cruz_de_la_subcon
tratacion_en_espana_46227.php (accessed 23/06/2014)