facilitylocation-ppt-091012125230-phpapp02
TRANSCRIPT

8/7/2019 facilitylocation-ppt-091012125230-phpapp02
http://slidepdf.com/reader/full/facilitylocation-ppt-091012125230-phpapp02 1/90
Operations Management
By Prof Haresh

8/7/2019 facilitylocation-ppt-091012125230-phpapp02
http://slidepdf.com/reader/full/facilitylocation-ppt-091012125230-phpapp02 2/90
Course Content :a) Introduction / Operations strategy / Competitive advantage / Time based
competition.b) Product Decision and analysis/ Product Development
c) Process selection / Process Design / Process Analysisd) Facility locatione) Facility layoutf) Capacity planning, Capacity decisions / Waiting linesg) Aggregate Planningh) Basics of MRP / ERP
i) Basics of scheduling j) Basics of Project Managementk) Basics of work study/ job design / work measurementl) Basics of Quality control / SQC / TQMm) Basics of Environmental management and ISO 14000 / 9000.
n) Value Engineering and Analysis.
Reference Text :1. Production and OM ± S.N. Chary2. Production and OM ± James B. Dilworth3. Modern Production management ± Buffa
4. Production and OM ± Norman Gaither

8/7/2019 facilitylocation-ppt-091012125230-phpapp02
http://slidepdf.com/reader/full/facilitylocation-ppt-091012125230-phpapp02 3/90
a
Introduction /
Operations Strategy /
Competitive Advantage /
Time based Competition

8/7/2019 facilitylocation-ppt-091012125230-phpapp02
http://slidepdf.com/reader/full/facilitylocation-ppt-091012125230-phpapp02 4/90
Definitions of Operations management :
Some terms to be understood before,
Efficiency and effectiveness :
-Efficiency means doing something at the lowest possiblecost.
-Effectiveness means doing right things to create the mostvalue for the company.
- Often Maximizing effectiveness and efficiency at the sametime creates a conflict and hence a trade off is always sought.
Value : It can be understood as QUALITY in comparison with
PRICE.eg Better car at same price «Value has gone up
Better car at lower price «value goes way up.
It is a challenge for management to achieve higher
levels of value on continuous basis.

8/7/2019 facilitylocation-ppt-091012125230-phpapp02
http://slidepdf.com/reader/full/facilitylocation-ppt-091012125230-phpapp02 5/90
Why study Operations Management ? ± A business education is incomplete without an understanding of modern
operations tools used for managing operations: Supply chainmanagement, TQM, BPR , JIT, Six sigma etc fall under the OM umbrella
± Operations management provides a systematic way of looking atorganisational processes. It develops analytical frame of mind to dealwith real world problems may it be global expansion or traffic at bankteller window.
± Operations management presents interesting career opportunities.
± The concepts, models , tools of OM are widely used in managing other functions of a business.
What is Operations Management ?
± It is the design, operation and improvement of the systems that createand deliver the firm¶s products or services
± Tools like OR ( operation research) , IE ( industrial Engg) , MS ( Managementscience) etc are used in OM.

8/7/2019 facilitylocation-ppt-091012125230-phpapp02
http://slidepdf.com/reader/full/facilitylocation-ppt-091012125230-phpapp02 6/90
Supply chain of typical OEM
O E M
Manufacturingcompany
Warehouse
Dealer
Distributor
Direct sales
force
Retail
Retailer
Retail
Var iou
s
CUst
omer s
Web site
Tier 1 suppliers
Tier 2 & 3 suppliers

8/7/2019 facilitylocation-ppt-091012125230-phpapp02
http://slidepdf.com/reader/full/facilitylocation-ppt-091012125230-phpapp02 7/90
- OM is concerned with effective management of
all the individual processes involved in thesupply chain.
- With in operations function, management decisions canbe divided into three broad areas :
1. Strategic ( Long Term ) decisions
2. Tactical ( Intermediate term) decisions
3. Operational planning and control ( Short term)decisions

8/7/2019 facilitylocation-ppt-091012125230-phpapp02
http://slidepdf.com/reader/full/facilitylocation-ppt-091012125230-phpapp02 8/90
Production systems :
- A production system uses resources to transform inputs intosome desired output
- Transformation processes can be categorised as follows:1. Physical ( Manufacturing)
2. Location ( Transportation)
3. Exchange ( Retail)
4. Storage ( Warehousing)5. Physiological ( Health Care)
6. Informational ( Telecommunication)
- Next 2 slides are ,1. ³Input- transformation- output́ for some typical systems
2. Historical development of OR

8/7/2019 facilitylocation-ppt-091012125230-phpapp02
http://slidepdf.com/reader/full/facilitylocation-ppt-091012125230-phpapp02 9/90
Fast delivery,availability of SKUs
Storage andredistribution
Storage space, bins,stock keepers
Stock keepingunits ( SKUs)
DistributionCentre
Educatedindividuals
Impartingknowledge andskills, etc
Teachers, books,classrooms, etc
High schoolgraduates
College or university
High quality carsFabrication and
assembly of cars,etc
Tools, equipments,
workers, etc
Sheet steel,
engine parts
Automobile
factory
Satisfiedcustomers
Well prepared ,served, food , etc
Chefs, Food,ambience, etc
Hungrycustomers
Restaurant
On time, safe
delivery todestinations
Move to destination Airplanes, crews,
ticketing systems , etc
Travelers Air line
Sales to satisfied
customers
Attract shoppers,
get orders, etc
Goods, Sales staff,
Displays, etc
ShoppersDepartmental
store
Healthy
Individuals
Health careDoctors, Nurses,
Medical equipmentetc.
PatientsHospital
Typical
Desired
Output
Primary
Transformationfunctions
ResourcesPrimary
Inputs
System

8/7/2019 facilitylocation-ppt-091012125230-phpapp02
http://slidepdf.com/reader/full/facilitylocation-ppt-091012125230-phpapp02 10/90
OR group ( UK), George Dantzig (USA)
Linear ProgrammingMultidisciplinary teamapproach to complexproblems
1940s
Many groups in USA & EuropeSimulation, waiting line, decisiontheory, PERT, CPMExtensive development of OR research tools1950-60 s
IBM,
Joseph Orlicky &Oliver Wight ± MRP,
McDonald's restaurant
Shop scheduling, inventorycontrol, forecasting, projectmanagement, MRP, massproduction in service sector
Widespread use of computers, Service qualityand productivity
!970s
Walter Shewhart, Elton Mayo ( USA)Sampling inspection, SQC,activity sampling
Quality Control
Worker Motivation
1930s
Frederick Taylor, Henry Ford, FrankGilberth ( USA)
Time study, work study, motionstudy, activity scheduling chart,inventory control
Principles of scientificmanagement, Industrialpsychology, Economic lotsize
1910s
Amazon, Yahoo, Google, Online
shopping sites
Internet, wwwE - Commerce2000s
National society of standards , American society of quality control,Netscape, Microsoft, Oracle
ISO 9000, Value engg,concurrent engg, Internet, www,Client server software
TQM, BPR, Electronicenterprise, Supply chainmanagement
1990s
Harvard faculty ,Toyota motors
Manufacturing as competitivetool, Kanban, CAD/CAM, Robots,Bottleneck analysis, TOC
Manufacturing strategy, JIT,TQC, Factory automation1980s
Originator ToolsConceptYear

8/7/2019 facilitylocation-ppt-091012125230-phpapp02
http://slidepdf.com/reader/full/facilitylocation-ppt-091012125230-phpapp02 11/90
Current issues in operations management:
1. Effectively consolidating the operations resulting
from mergers and acquisitions.2. Developing flexible supply chains to enable mass
customization of products and services.
3. Managing global supplier, production and
distribution networks.4. Increased ³commoditization´ of suppliers.
5. Achieving the ³service factory´
6. Enhancing value added services7. Making efficient use of internet technology
8. Achieving good service from service firms.

8/7/2019 facilitylocation-ppt-091012125230-phpapp02
http://slidepdf.com/reader/full/facilitylocation-ppt-091012125230-phpapp02 12/90
Competitive Strategy :
± It is about being different from the competition in the local or global market place.
Competitive operations strategy breaks down into 3 components , ± Operations effectiveness : Relates to the core business
processes that are needed to run the business. It getsreflected in the costs associated with doing business.
± Customer Management : It relates to understanding andleveraging customer relationships better.
± Product Innovation : It involves the development of newproducts, markets and relationships to sustain growth.
It is concerned with setting broad policies and plans for using theresources of a firm to best support its long term competitivestrategy

8/7/2019 facilitylocation-ppt-091012125230-phpapp02
http://slidepdf.com/reader/full/facilitylocation-ppt-091012125230-phpapp02 13/90
Operations competitive dimensions :
Since different customer are attracted by differentattributes, it gives rise to different competitive positions
of a company or different competitive dimensions,1. Cost ± ³ Make it Cheap´
2. Product Quality and reliability- ³Make it Good´ ± goal is proper level of product quality as per the requirements of customer, noover design nor under design. Also ³Process Quality´ goal is to
produce error free products.3. Delivery speed ± ³ Make it fast´ , compared to competition
4. Delivery reliability ± Deliver it when promised.
5. Coping with changes in demand ± ³ Change its volume´
6. Flexibility and new product introduction speed ± ³ Change it´ ±
ability to offer a wide variety to customers and time required todevelop new product and change its processes to offer the newproduct to customers.
7. Other Product specified Criteria ± ³ Support It´ eg Technicalliaison and support , Meeting a launch date, Supplier after sale
support , Product mix options etc.

8/7/2019 facilitylocation-ppt-091012125230-phpapp02
http://slidepdf.com/reader/full/facilitylocation-ppt-091012125230-phpapp02 14/90
The Notion of Trade-offs:
± Generally an operation can not excel simultaneously on allcompetitive dimensions and has to decide which parameters
of performance are critical to the success of the businessand then concentrate the resources on it. Eg trade off of highquality vs. low cost.
Time based competition :
± Time is an important factor from operations point of view. ± Important from ³availability of product when required´ point
of view which demands need to manage the operations tomeet time targets.
± Catching up with the launch dates of promotional campaigns ± Very crucial in case of NPD.

8/7/2019 facilitylocation-ppt-091012125230-phpapp02
http://slidepdf.com/reader/full/facilitylocation-ppt-091012125230-phpapp02 15/90
b
Product decisions &
Analysis /
Product Development

8/7/2019 facilitylocation-ppt-091012125230-phpapp02
http://slidepdf.com/reader/full/facilitylocation-ppt-091012125230-phpapp02 16/90

8/7/2019 facilitylocation-ppt-091012125230-phpapp02
http://slidepdf.com/reader/full/facilitylocation-ppt-091012125230-phpapp02 17/90
PRODUCTIONWISE CLASSIFICATION
Above terminology, classifications, characterictstics , etc., are
important ingredients of production / operation management.
Sr No.
Productionsystem
Product Character Product Variety Examples
1 Continuous Homogenous Single product Sugar,paper,cement
2 Mass Heterogeneous Few products/
varieties
Plastic
goods3 Batch Heterogeneous Several
product/varietiesMotors,switchgears, pharma
4 Jobbing Custom Built Few Jobs Furnace,
Ship , etc

8/7/2019 facilitylocation-ppt-091012125230-phpapp02
http://slidepdf.com/reader/full/facilitylocation-ppt-091012125230-phpapp02 18/90

8/7/2019 facilitylocation-ppt-091012125230-phpapp02
http://slidepdf.com/reader/full/facilitylocation-ppt-091012125230-phpapp02 19/90
Some typical PLCs,
a) PLC curve of consumer product is fewmonths viz. fashion garments 12 months.
b) PLC curve of consumer durable product fewyears viz. 3 ±5 years for fan, frig, car etc.
c) PLC curve of Industrial products several
years viz. 5 ± 10 years lathe machine. PLC stages of TV industry for various
technological products, in Indian city / urban area,are,
1. Plasma TV ± introduction stage.
2. LCD TV ± Growth stage
3. Colour T.V. - maturity stage
4. Black & White ± Declination

8/7/2019 facilitylocation-ppt-091012125230-phpapp02
http://slidepdf.com/reader/full/facilitylocation-ppt-091012125230-phpapp02 20/90
3) PRODUCT DECISION Product decisions are required due to following circumstances:-
a) Due to decline in product life stage, new product required
(or modify existing product )b) For corporate expansions new products are required.
Following approaches may be used :-
(i) Vertical Expn : Forward integration of existing product viz.compressor manufacturer like Kirloskar can go from production
of Refrigerator, Air Conditioner etc. By backward integration viz.Frig, manufacturer like Godrej has already made backwardintegration by manufacturer compressor in house.
(ii) Horizontal Expn : Similar product manufacturer likeGodrej , producing Refrigerator as well bottle coolers
(iii) Concentric Expn : Expn. In same type of product classviz. ONIDA is producing Colour T.V. and Air conditioner for theluxurious products.

8/7/2019 facilitylocation-ppt-091012125230-phpapp02
http://slidepdf.com/reader/full/facilitylocation-ppt-091012125230-phpapp02 21/90
Above approaches have synergy of marketstrength as well as using / modifying existing
production facility. Realignment looks into,
1. Increase existing plant capacity.
2. Add / remove machineries.3. New Product design to use existing parts/components.
4. Train existing staff for new producttechnology
5. Possible use of existing tools, jigs andfixture.
8/7/2019 facilitylocation-ppt-091012125230-phpapp02
http://slidepdf.com/reader/full/facilitylocation-ppt-091012125230-phpapp02 22/90
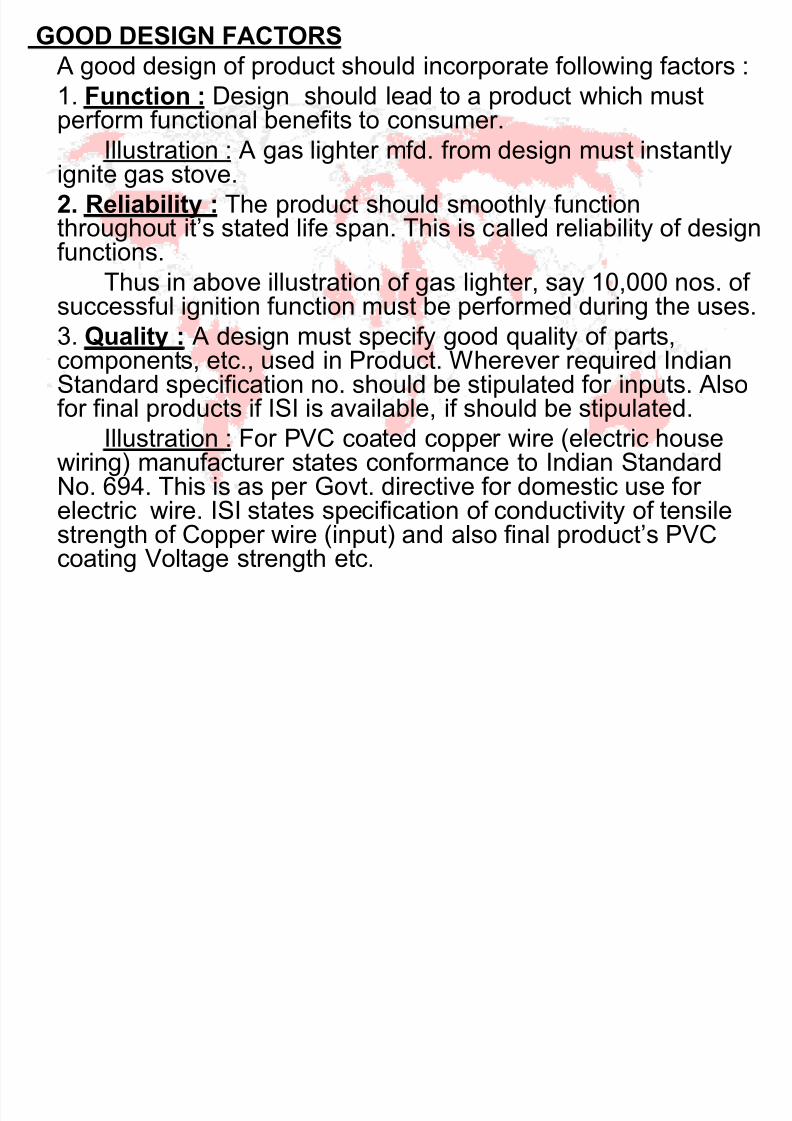
GOOD DESIGN FACTORS A good design of product should incorporate following factors :1. Function : Design should lead to a product which mustperform functional benefits to consumer.
Illustration : A gas lighter mfd. from design must instantlyignite gas stove.2. Reliability : The product should smoothly functionthroughout it¶s stated life span. This is called reliability of designfunctions.
Thus in above illustration of gas lighter, say 10,000 nos. of successful ignition function must be performed during the uses.3. Quality : A design must specify good quality of parts,components, etc., used in Product. Wherever required IndianStandard specification no. should be stipulated for inputs. Also
for final products if ISI is available, if should be stipulated.Illustration : For PVC coated copper wire (electric housewiring) manufacturer states conformance to Indian StandardNo. 694. This is as per Govt. directive for domestic use for electric wire. ISI states specification of conductivity of tensilestrength of Copper wire (input) and also final product¶s PVC
coating Voltage strength etc.

8/7/2019 facilitylocation-ppt-091012125230-phpapp02
http://slidepdf.com/reader/full/facilitylocation-ppt-091012125230-phpapp02 23/90
4. Producibility : Design drawings, specifications etc., should besimple and technically feasible for smooth production fromexisting / proposed machines, tools, dies etc., Also productioncycle time should be reasonable short.
Thereby plant and machinery will produce full capacity of product viz. production of 200 nos. of gas lighters per day.
5. Standardization : Design should specify maximum use of standard available input parts, components, raw material etc.Further it should also specify minimum variety and regular lotquantity of such inputs available in the market.
6. Minimum Production Cost : Cost of raw material, labour charges, overheads, etc. should be as minimum as possible.Thus when product margin is added to product cost, sales priceshould be competitive.
8/7/2019 facilitylocation-ppt-091012125230-phpapp02
http://slidepdf.com/reader/full/facilitylocation-ppt-091012125230-phpapp02 24/90
Product design ± specifies and takescare of characteristics like,
appearance, materials,
dimensions,
tolerances, and
performance standards
Product design must support productmanufacturability (the ease with whicha product can be made)

8/7/2019 facilitylocation-ppt-091012125230-phpapp02
http://slidepdf.com/reader/full/facilitylocation-ppt-091012125230-phpapp02 25/90

8/7/2019 facilitylocation-ppt-091012125230-phpapp02
http://slidepdf.com/reader/full/facilitylocation-ppt-091012125230-phpapp02 26/90
Product Design Process, 4 major steps,
Step 1 - Idea Development
- Someone thinks of a need and a product/service design
to satisfy ite.g. customers, marketing, engineering, competitors,
benchmarking, reverse engineering
Step 2 - Product / idea Screening
- Every business needs a formal/structured evaluationprocess
e.g. fit with facility and labor skills, size of market,contribution margin, break-even analysis, return on sales
Step 3 - Preliminary Design and Testing
- Technical specifications are developed, prototypes built,testing starts
Step 4 ± Final Design
- Final design based on test results, facility, equipment,material, & labour skills defined, suppliers identified

8/7/2019 facilitylocation-ppt-091012125230-phpapp02
http://slidepdf.com/reader/full/facilitylocation-ppt-091012125230-phpapp02 27/90
Product Screening Tool ±
Break-Even AnalysisBreak-even analysis , includes calculating
A) Total cost ±> sum of fixed and variable cost
Total cost = F + (VC)*Q
B) Revenue ±> amount of money brought in from sales
Revenue = (SP) * Q
Where,
Q = number of units sold
SP = Selling price per unit
VC = Variable cost per unit
F= Fixed cost

8/7/2019 facilitylocation-ppt-091012125230-phpapp02
http://slidepdf.com/reader/full/facilitylocation-ppt-091012125230-phpapp02 28/90
To compute the Break Even Quantity i.e. thequantity of goods company needs to sell to
cover its costs, we equate the Total costs andRevenue at that quantity ie, Q BE.
We get by rearranging,
QBE = F/ (SP - VC)
QBE = Break even quantity
F =Fixed costsSP = selling price/unit
VC = Variable cost / unit

8/7/2019 facilitylocation-ppt-091012125230-phpapp02
http://slidepdf.com/reader/full/facilitylocation-ppt-091012125230-phpapp02 29/90
Break-Even Analysis: Graphical Approach
Plot the total revenue line andthe total cost line
Intersection is break-even ± Estimate graphically
± Solve exactly
Profit for any quantity Q isTotal Revenue ± Total Cost
Sensitivity analysis can bedone to examine changes inall of the assumptions made

8/7/2019 facilitylocation-ppt-091012125230-phpapp02
http://slidepdf.com/reader/full/facilitylocation-ppt-091012125230-phpapp02 30/90
Example : Given that the selling price is $ 20 per unit and thevariable cost is $ 8 per unit and the fixed cost is $ 70,000 . Findthe BEQ. The actual sale quantity at this price is 12000 units, Find
the profit or loss in this case. Examine the strategy which assuresthe drop in price by $ 2 per unit can raise the demand to 15000units.
Breakeven Analysis for Fine Mfg.
0
2 0 0 0 0
0 0 0 0
0 0 0 0
8 0 0 0 0
1 0 0 0 0 0
1 2 0 0 0 0
1 0 0 0 0
1 0 0 0 0
1 8 0 0 0 0
0 2 0 0 0 0 0 0 0 0 0 8 0 0 0 1 0 0 0 0
Quantity produced
d o
l l T o t a l e ve n u e
T o t a l o s t
Solution :-
a) Total Revenue = 20Q; Total Cost = 70,000+8Q

8/7/2019 facilitylocation-ppt-091012125230-phpapp02
http://slidepdf.com/reader/full/facilitylocation-ppt-091012125230-phpapp02 31/90
Breakeven Quantity
= Fixed Cost / (Selling Price-Variable Cost)
= 70,000/(20-8) = 5,833.3
B. Given that, At selling price of $20/unit, demand is12,000 units and we need to find out the profit or loss inthis situation,
Pr ofit = Total Revenue-Total Cost
= 20(12,000) - [70,000+8(12,000)] = $74,000

8/7/2019 facilitylocation-ppt-091012125230-phpapp02
http://slidepdf.com/reader/full/facilitylocation-ppt-091012125230-phpapp02 32/90
The strategy that sets the unit price at $18 has a
larger profit by $6000, and hence can be considered.
C. Given that , At selling price of $18/unit, demand is
15,000 units and we need to find the total profit or lossat this selling price, then, we have,
Profit = Total Revenue-Total Cost
= 18(15,000) - [70,000+8(15,000)] = $80,000

8/7/2019 facilitylocation-ppt-091012125230-phpapp02
http://slidepdf.com/reader/full/facilitylocation-ppt-091012125230-phpapp02 33/90
Factors Impacting Product Design
Need to Design for Manufacturing ±
DFM
Series of guidelines to follow inorder to produce a product easily
and profitably
± Simplification - Minimize parts
± Standardization
Design parts for multiple
applications
± Use modular design
± Simplify operations

8/7/2019 facilitylocation-ppt-091012125230-phpapp02
http://slidepdf.com/reader/full/facilitylocation-ppt-091012125230-phpapp02 34/90
Remember the Tucker!
The Tucker automobile of the late 1940s stands out asone of the most celebrated failures in the annals of
American business. With its aerodynamic sheet metal,rear-mounted engine, and a Cyclops headlight that turned in tandem with the steering wheel, theprototype Tucker 48 shown to the public in 1947generated quite a bit of excitement. But the Tucker 48
never made it into mass production. Only 51 modelswere produced, all largely fabricated by hand at tremendous expense.

8/7/2019 facilitylocation-ppt-091012125230-phpapp02
http://slidepdf.com/reader/full/facilitylocation-ppt-091012125230-phpapp02 35/90
Remember the Tucker!
Existing equipment and processes were not capable of executing the relatively sophisticated design of theTucker 48 on a large scale. Thus the Tucker 48
provides an object lesson in the need to design for manufacturing (DFM). DFM is part of the concurrent engineering movement that blossomed in the 1980s.DFM stresses the need to incorporate the perspectiveof manufacturing engineering into the earliest stages of product design.

8/7/2019 facilitylocation-ppt-091012125230-phpapp02
http://slidepdf.com/reader/full/facilitylocation-ppt-091012125230-phpapp02 36/90
c
Process selection ,
Design &
Process Analysis

8/7/2019 facilitylocation-ppt-091012125230-phpapp02
http://slidepdf.com/reader/full/facilitylocation-ppt-091012125230-phpapp02 37/90
I) PRODUCTION S YSTEMS Broadly there are 2 types of Production Systems viz.
Product focused & Process focused. Each classification isfurther divided into 2 systems on the basis of nature andvolume of products.
1. PRODUCT FOCUSSED (Continuous) :
In this system, processing is completely adapted toproduct. Individual processes are physically arranged in the
sequence required, and the entire system is integrated for single purpose (product dedicated machines). Hence thiscontinuous system is called Product focused.
This system is suitable for highly standardised productwhich is required in large volume. viz. Paper Mill, Sugar Mill,
Cement Plant, Chemical Plant, Refinery etc. Thus this systemhas huge investment, large inventory, high degree of automation etc. But limited use of PPC. Exhibit I Edible oilrefinery Production Process.

8/7/2019 facilitylocation-ppt-091012125230-phpapp02
http://slidepdf.com/reader/full/facilitylocation-ppt-091012125230-phpapp02 38/90
Exhibit 1: Edible oil refinery process
Crude oil tank Physical refining
Chemical
refining usingsulphuric acidand centrifuges
Bleacher using
Bleaching earthand bleacher screens
SHE & Hot oilfurnace
Deodorizer
Polish filter Refined oil tank

8/7/2019 facilitylocation-ppt-091012125230-phpapp02
http://slidepdf.com/reader/full/facilitylocation-ppt-091012125230-phpapp02 39/90
2. PRODUCT FOCUSSED (MassProduction) :
In this system, main components / parts areproduced by continuous production system butthereafter assembled, tested and packed. Dueto this nature of production it is called 'Mass
Production System'. This System is suitable for Product with varieties and medium in volumeviz. Fan, Computer, Refrigerator, Automobiles
etc. It has a medium investment and inventory,semi-automation, & PPC applied. Exhibit IIshows Production of Refrigerator.

8/7/2019 facilitylocation-ppt-091012125230-phpapp02
http://slidepdf.com/reader/full/facilitylocation-ppt-091012125230-phpapp02 40/90
Exhibit II: Refrigerator Manufacturing
Compressor manufacturingand testingunit
Body and door moulding unit
Refrigerator assembly unit
Refrigerator
electricalwiring/ controlsunit
Evaporator coilfabrication andtesting unit
Refrigerator
final testingunit

8/7/2019 facilitylocation-ppt-091012125230-phpapp02
http://slidepdf.com/reader/full/facilitylocation-ppt-091012125230-phpapp02 41/90
3. PROCESS FOCUSSED (Batch Production) :
In this production system machines are generalpurpose and they are organized around (focused)production processes. Investments & Inventory aremedium value but no much automation (somemechanisation exists.) Machines are medium valuesviz. Lathe, Milling machine, ovens, bottling machinesetc.
Though operations are in sequence but the path maybe zig-zag leading. The production comes out in
batches eg Electric motors, pumps, switchgears,biscuit, soft drinks etc.
The final product is traceable up to the raw materialbatch which helps for trouble shooting.
Exhibit III shows process production of Biscuit making.

8/7/2019 facilitylocation-ppt-091012125230-phpapp02
http://slidepdf.com/reader/full/facilitylocation-ppt-091012125230-phpapp02 42/90
Exhibit III: Biscuit making ( Handling Marie, Snax, Goodday, Digestive etc on one line in batches)
Dough making facilitywhich mixers, voutator etcgeneral purpose machineswhich is required in allbiscuits
Cooling conveyor andmetal detector whichcan handle variousbiscuits
Layering and biscuitcutting or moulding
unit, which can beadopted to differenttypes of biscuits bychanging mould or cutter cylinder
Baking section withoven which canbake all types of biscuits
Packing section with different packingmachines arranged for different biscuitsand the biscuits are diverted usingdiverting guide to the required machines
Cartons to storagesection

8/7/2019 facilitylocation-ppt-091012125230-phpapp02
http://slidepdf.com/reader/full/facilitylocation-ppt-091012125230-phpapp02 43/90
4. PROCESS FOCUSEED (Jobbing work) :
In jobbing work, parts are manufactured at
various work stations in the plant like forgingstation, machining shop etc. and assembled /machined at site. Examples of jobs arefurnace, extruder, pressure vessel, reactor,
crane, conveyor belt etc. which are generallysupplied to product producing plants (describedabove.

8/7/2019 facilitylocation-ppt-091012125230-phpapp02
http://slidepdf.com/reader/full/facilitylocation-ppt-091012125230-phpapp02 44/90
Process Selection
Product design considerations mustinclude the process
Two broad process classificationsinclude ± Intermittent operations ± produce a
variety of products in lower volumes ± Repetitive operations ± produce one or a
few standardized products in high volume

8/7/2019 facilitylocation-ppt-091012125230-phpapp02
http://slidepdf.com/reader/full/facilitylocation-ppt-091012125230-phpapp02 45/90
Process Selection
Process selection is based on fiveconsiderations ± Type of process; range from intermittent to
repetitive
± Degree of vertical integration
± Flexibility of resources ± Mix between capital & human resources
± Degree of customer contact

8/7/2019 facilitylocation-ppt-091012125230-phpapp02
http://slidepdf.com/reader/full/facilitylocation-ppt-091012125230-phpapp02 46/90

8/7/2019 facilitylocation-ppt-091012125230-phpapp02
http://slidepdf.com/reader/full/facilitylocation-ppt-091012125230-phpapp02 47/90
Underlying Process Relationship BetweenVolume and Standardization Continuum
f

8/7/2019 facilitylocation-ppt-091012125230-phpapp02
http://slidepdf.com/reader/full/facilitylocation-ppt-091012125230-phpapp02 48/90
It is seen from the above diagram that stagesof product & process development areinterdependent and feed on each other.
Though volume depends on type of productionsystem, volume also depends on price/cost andquality competitiveness.
But organisation experience curve for improvedPPC, inventory, product / process design,layout, economy of scale etc. leads the
organisations to its own competitive strategy.
III PRODUCT PROCESS INNOVATIONS MODEL

8/7/2019 facilitylocation-ppt-091012125230-phpapp02
http://slidepdf.com/reader/full/facilitylocation-ppt-091012125230-phpapp02 49/90
III. PRODUCT - PROCESS INNOVATIONS MODEL
The competitiveness and profitability of firm depend in parton the design and quality of products and on the cost of
production. Therefore there exists a relationship of productinnovation to process technology and process innovation. It isdescribed in 3 stages of model below.
Rat
e
of
In
n0vation
Un coordinated processes ---------------------------------------------------------- Integrated Processes
Performance Maximization -------------------------------------------------------- Cost Minimization
Stages Of Development
Process Innovations
Cost Stimulated
Technology stimulated
Product Innovations
Need
Stimulated
Output rate stimulated

8/7/2019 facilitylocation-ppt-091012125230-phpapp02
http://slidepdf.com/reader/full/facilitylocation-ppt-091012125230-phpapp02 50/90
IV PROCESS SELECTION
8/7/2019 facilitylocation-ppt-091012125230-phpapp02
http://slidepdf.com/reader/full/facilitylocation-ppt-091012125230-phpapp02 51/90
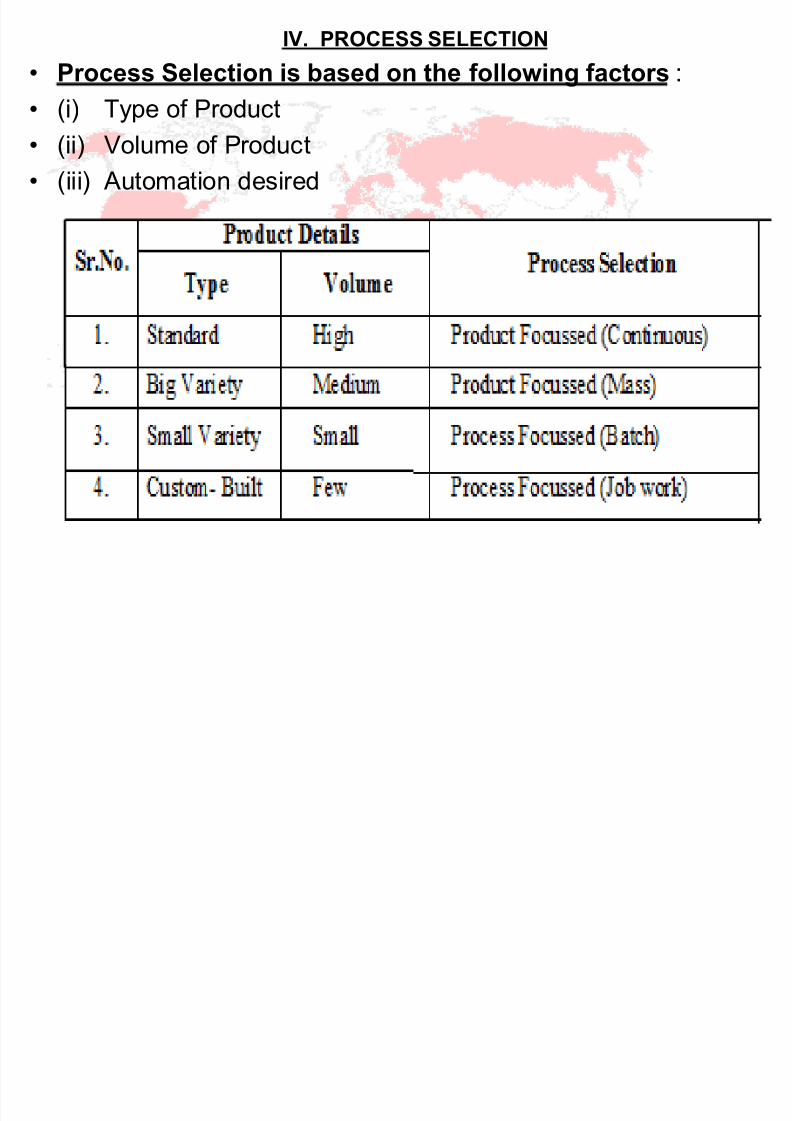
IV. PROCESS SELECTION
Process Selection is based on the following factors :
(i) Type of Product
(ii) Volume of Product (iii) Automation desired
Pl ll th 'P d t Lif C l ' d

8/7/2019 facilitylocation-ppt-091012125230-phpapp02
http://slidepdf.com/reader/full/facilitylocation-ppt-091012125230-phpapp02 52/90
Please recall, as the 'Product Life Cycle' proceeds'Process Life Cycle' follows it. Though stages maytake several years, productive system is required to be
repositioned / realigned.
Production of gear for motors, engines, etc. wasonce upon a time custom built product. But now withthe course of time, in advancement of technology, ithas become Mass Production.
M l / M h i d d A t t d

8/7/2019 facilitylocation-ppt-091012125230-phpapp02
http://slidepdf.com/reader/full/facilitylocation-ppt-091012125230-phpapp02 53/90
Manual / Mechanized and Automated processes.
Manual Technology
Mechanized Technology
Low ± Volume
Variety Products
General Purpose Machines
High ± Volume
Standardized products
Special Purpose machines
Automated Technology
Robots
NC Machines
CAD/ CAM
FMS
CIM
Automated Technology
Hard Automation
Robots

8/7/2019 facilitylocation-ppt-091012125230-phpapp02
http://slidepdf.com/reader/full/facilitylocation-ppt-091012125230-phpapp02 54/90
V) PROCESS DESIGN

8/7/2019 facilitylocation-ppt-091012125230-phpapp02
http://slidepdf.com/reader/full/facilitylocation-ppt-091012125230-phpapp02 55/90
V) PROCESS DESIGN Process design is based on the following factors. (i) Product Specification (ii) Availability of Input (iii) Plant Capacity desired (iv) Availability of Machines / Equipments from Manufacturer
Following are design stages: I) Operation Design : Firstly operation is selected on the basis of raw material and availability
of machine/equipment. On the similar line subsequent machines areselected for intermediate as well as final steps to achieve the productspecification viz. Cutting, Welding, Forging, Casting, Forming etc.
II) Special Processes : Special Processes are required to be custom-built with machinery
manufacturer. viz. Heat Treatment Plant, special coating etc.
III) Process Integration : Sequential arrangement of operations and processes is called process
integration. This also involves design of plant layout. Further it includesdesign of material handling equipments, conveyor belt, other automationequipments etc.
IV) C it D i

8/7/2019 facilitylocation-ppt-091012125230-phpapp02
http://slidepdf.com/reader/full/facilitylocation-ppt-091012125230-phpapp02 56/90
IV) Capacity Design :
Based on Project Report Plant output
capacity must be produced. V) Design Flexibility :
Design should be flexible for variation in
specification of product and also for additionalcapacity for future.
VI)Environmental Equipment Design :
If the process is involving hazardous gases,affluent etc., then suitable selection of Environmental equipment should be made.(Thereby Pollution Control Laws are obeyed).

8/7/2019 facilitylocation-ppt-091012125230-phpapp02
http://slidepdf.com/reader/full/facilitylocation-ppt-091012125230-phpapp02 57/90
Designing Processes
Process design tools include
± Process flow analysis
± Process flowchart
Design considerations include
± Make-to-stock strategy
± Assemble-to-order strategy
± Make-to-order strategy

8/7/2019 facilitylocation-ppt-091012125230-phpapp02
http://slidepdf.com/reader/full/facilitylocation-ppt-091012125230-phpapp02 58/90
Process Design Tools
Process flow analysis is a tool used to analyzeand document the sequence of steps within a
total process. Usually first step in ProcessReengineering.
Process Re-engineering is a structuredapproach used when major business changesare required as a result of: ± Major new products
± Quality improvement needed
± Better competitors
± Inadequate performance

8/7/2019 facilitylocation-ppt-091012125230-phpapp02
http://slidepdf.com/reader/full/facilitylocation-ppt-091012125230-phpapp02 59/90
Flowchart Symbols
Tasks or operations
Examples: Giving anadmission ticket to acustomer, installing aengine in a car, etc.
Decision Points Examples: How much
change should begiven to a customer,
which wrench shouldbe used, etc.
Purpose and Examples
Source: Chase, Jacobs & Aquilano, Operations Management for Competitive Advantage, 11/e

8/7/2019 facilitylocation-ppt-091012125230-phpapp02
http://slidepdf.com/reader/full/facilitylocation-ppt-091012125230-phpapp02 60/90
Examples: Sheds,lines of people waitingfor a service, etc.
Examples: Customersmoving to a seat,mechanic getting a
tool, etc.
Storage areas or queues
Flows of materials or
customers
Purpose and Examples
Flowchart Symbols
Source: Chase, Jacobs & Aquilano, Operations Management for Competitive Advantage, 11/e
P Ch i t t i

8/7/2019 facilitylocation-ppt-091012125230-phpapp02
http://slidepdf.com/reader/full/facilitylocation-ppt-091012125230-phpapp02 61/90
Process Choice strategies

8/7/2019 facilitylocation-ppt-091012125230-phpapp02
http://slidepdf.com/reader/full/facilitylocation-ppt-091012125230-phpapp02 62/90
Decisions for the two types of operations
VI) PROCESS ANALYSIS

8/7/2019 facilitylocation-ppt-091012125230-phpapp02
http://slidepdf.com/reader/full/facilitylocation-ppt-091012125230-phpapp02 63/90
VI) PROCESS ANALYSIS
Performance of process can be analysed on
the following criteria: 1. Quality Achievement :
Eg. If the process produces the products
with less than 2-3% rejection rate, then it isconsidered to be good process design.
2. Plant Capacity Achievement :
Eg. If the Plant can reach about 98-99% of installed capacity, then it is considered to begood achievement.

8/7/2019 facilitylocation-ppt-091012125230-phpapp02
http://slidepdf.com/reader/full/facilitylocation-ppt-091012125230-phpapp02 64/90
Process Technology in service and nonmanufacturing operations

8/7/2019 facilitylocation-ppt-091012125230-phpapp02
http://slidepdf.com/reader/full/facilitylocation-ppt-091012125230-phpapp02 65/90
Process Technology in service and nonmanufacturing operationsIn Service sectors also there is a clear trend in adopting moreadvanced process technologies to get the competitiveadvantage«some examples can be as below,
1. Containerization : By standardization of container sizes it has beenpossible to develop national and international systems for efficienthandling of large quantities of goods. Sophisticated computer andtelecommunication systems are used to support the need of container systems. Both sea and air freight reaps benefits from containerization.
2. Reservation systems in airline, railways etc, the interconnectionsbetween national and international carriers etc. Systems for check in,baggage check in and handling, seat allocation, special meals etc.
3. Warehousing: Advanced designs with computerized systems will storeand retrieve materials on command using controlled conveyors,
storage and retriever stackers etc.4. Point of sale systems : Bar coding and scanner systems, inventory
control systems etc.
5. Banking operations : ATMs, Electronic funds transfer, Check clearingusing MICR ( Magnetic ink character recognition)
Evaluation of alternatives and decisions : Use of Decision Tree

8/7/2019 facilitylocation-ppt-091012125230-phpapp02
http://slidepdf.com/reader/full/facilitylocation-ppt-091012125230-phpapp02 66/90
Evaluation of alternatives and decisions : Use of Decision Tree
Example : A firm is in situation of making a choice between ³Technology A´ . ³ Technology B´ and ³ Do Nothing´. In both the
alternatives A and B there is a ,chance of breakthrough asbelow,
Technology A : Chance of breakthrough 40%
Technology B : Chance of breakthrough 80%
The investments and annual operating costs are shown below.The do nothing alternative is a Manual technology and has noinvestment required .
A horizon of 5 years is adopted as representing the reasonableeconomic lives of technologies A and B, interest is at 10% and
the criteria is Expected Monetary value.
( from the present value table for a five year annuity at 10%interest is 3.79).
Evaluate the economic aspects of the 3 alternatives.

8/7/2019 facilitylocation-ppt-091012125230-phpapp02
http://slidepdf.com/reader/full/facilitylocation-ppt-091012125230-phpapp02 67/90
Investment and operating costs for Technology choices
Technology A Technology B Do Nothing
Investment $ 60,000 $ 40,000 -
Annual operatingcosts
$ 30,000
If breakthrough 1000 -
If No breakthrough 2000 -
If Breakthrough - 4000
If No breakthrough - 8000
Solution : Decision tree

8/7/2019 facilitylocation-ppt-091012125230-phpapp02
http://slidepdf.com/reader/full/facilitylocation-ppt-091012125230-phpapp02 68/90
Solution : Decision tree
A, investment- $ 60,000
B :Investment -$ 40,000
C : Do Nothing,
No investment
Annual op cost = $ 30,000
Present value = 3.791 X 30,000 = $ 113,730
Breakthrough successful, p= 0.4, Annualoperating cost = $ 1000,
Present value = 3.791 X 1000 = $ 3791
Breakthrough unsuccessful, p= 0.6, Annualoperating cost = $ 2000,
Present value = 3.791 X 2000 = $ 7582
Breakthrough successful , p= 0.8, Annual
operating cost = $ 4000,Present value = 3.791 X 4000 = $ 15164
Breakthrough unsuccessful, p= 0.2, Annualoperating cost = $ 8000,
Present value = 3.791 X 8000 = $ 30328
In order to evaluate the economic aspects of the 3 alternatives we

8/7/2019 facilitylocation-ppt-091012125230-phpapp02
http://slidepdf.com/reader/full/facilitylocation-ppt-091012125230-phpapp02 69/90
o de o e a ua e e eco o c aspec s o e 3 a e a es eproceed as follows,
1. Branches associated with A, the present value of the
annual operating expenses will be, considering the chanceaspect using related probabilities ,1. Breakthrough successful = $ 3791 X 0.4 = $ 1516.4
2. Breakthrough unsuccessful = $ 7582 X 0.6 = $ 4549.2
EMV = $ 6065.6
Present value of investment for A = $ 60,000.Total expected monetary value for alternative A is = $ 66,065.60
2. Similar calculations for alternative B will give us,
Total expected monetary value of alternative B is = $58196.8.
3. The do nothing alternative has a present value = $ 113,730
Expected Monetary values for the rolled back decision tree are,

8/7/2019 facilitylocation-ppt-091012125230-phpapp02
http://slidepdf.com/reader/full/facilitylocation-ppt-091012125230-phpapp02 70/90
In this case alternative B has lower EMV over a period of 5 yrs by$ 7868.8.
(After this calculations if Manager is of the opinion that thisdifference is not substantial in comparison to the advantage of meeting higher quality standard which can be achieved byadopting technology A then he can justify the choice of alternative A over B.)
A, $ 66,065.6
B, $ 58,196.8
Do nothing, $
113,730.00

8/7/2019 facilitylocation-ppt-091012125230-phpapp02
http://slidepdf.com/reader/full/facilitylocation-ppt-091012125230-phpapp02 71/90
d
Facility Location
1) NEW FACILITY LOCATION :

8/7/2019 facilitylocation-ppt-091012125230-phpapp02
http://slidepdf.com/reader/full/facilitylocation-ppt-091012125230-phpapp02 72/90
1) NEW FACILITY LOCATION :
±WH Y?
1. New Venture
2. Expansion
3. Industry & Environment Laws
4. Industrial Unrest
5. Political Instability6. STRATEGIC DECISION
2) DOMINANT FACTORS

8/7/2019 facilitylocation-ppt-091012125230-phpapp02
http://slidepdf.com/reader/full/facilitylocation-ppt-091012125230-phpapp02 73/90
2) DOMINANT FACTORS
1) Raw Material Based Mfg. : Facilities
using huge natural resources2) Electric Power Based : Mfg. Facility usinglarge Electric Power
3) Good Infrastructure :4) Market Based :
5) Govt. Policy : Govt. Incentives & Politicalwillingness
6) Land Cost , topography, etc.
7) Environmental Laws : Pollution ControlBoard Policy for location.
3) GENERAL APPROACH FOR SITE SELECTION

8/7/2019 facilitylocation-ppt-091012125230-phpapp02
http://slidepdf.com/reader/full/facilitylocation-ppt-091012125230-phpapp02 74/90
3) G O C O S S C O
1. Analysing Environment w.r.t. your business
2. Location Decision :National or International :Dabur¶s factory for Herbal products in California,U.S.A.
3. Regional Decision : Multi region or singleregion, for example Pepsi had 19 plant spreadover India.
4. Sub Region Decision :Transportation, Banking,Port nearness etc
5. Site Selection : Land cost, size, soil,topography, Vastushastra
6. Techno commercial analysis, ROI analysis of proposed location
4) BROWN & GIBSON ANALYTICAL MODEL (For Sit S l ti )

8/7/2019 facilitylocation-ppt-091012125230-phpapp02
http://slidepdf.com/reader/full/facilitylocation-ppt-091012125230-phpapp02 75/90
Site Selection)
In 1972, Brown & Gibson developed AnalyticalModel for Site Selection for Multiattribute Plantcharacteristics. It has following 3 criteria.
1. Critical Criteria : A criteria which is absolutelyessential for plant location.
2.Objective Criteria : Monetarily measurable criteriafor raw material, labour, utilities, taxes etc. iscalled Objective criteria. This criteria can alsobecome Critical criteria.
3.Subjective Criteria : Non-measurable criteria likeCommunity attitude and support, degree of recreation facility etc. are subjective factors. Itcan be both critical & subjective.
LOCATION MEASUREMENT FORMULA

8/7/2019 facilitylocation-ppt-091012125230-phpapp02
http://slidepdf.com/reader/full/facilitylocation-ppt-091012125230-phpapp02 76/90
LM = CFM x (X OFM + (1-X) x SFM)
WHERE,CFM = Critical Factor Measure (CFM = 0 OR 1)
OFM = Objective Factor Measure (0<OFM<1)SFM = Subjective Factor Measure (0<OFM<1)
Since CFM is 0 or 1, it leads either adequacy of Critical Factor or not. If 0 then such site is eliminated.
OFM = (Max. OFC ± OFC) .( Max. OFC - Min. OFC.)
where OFC is Objective Factor CostSFM = (SFWK x SWK), Where,
SFWK
= Wt. of Subjective Factor K w.r.t. all subjectivefactors.
SWK = Evaluation of Site, relative to all potential sites.X = Objective factor decision weight selected bymanagement.
** Illustrates decision location example, refer excel sheet.

8/7/2019 facilitylocation-ppt-091012125230-phpapp02
http://slidepdf.com/reader/full/facilitylocation-ppt-091012125230-phpapp02 77/90
6) SERVICE FACILITY TO LOCATION

8/7/2019 facilitylocation-ppt-091012125230-phpapp02
http://slidepdf.com/reader/full/facilitylocation-ppt-091012125230-phpapp02 78/90
6) SERVICE FACILITY TO LOCATION
Single Service facility & multiple customers-
Weber problem , Solution is given by Kuhn &Kuenne in 1962.
Criteria : 1) Minimum cost of travel , or
2) Minimum time for transportation.Single Facility Location & 5 Users ±Illustration.
8/7/2019 facilitylocation-ppt-091012125230-phpapp02
http://slidepdf.com/reader/full/facilitylocation-ppt-091012125230-phpapp02 79/90
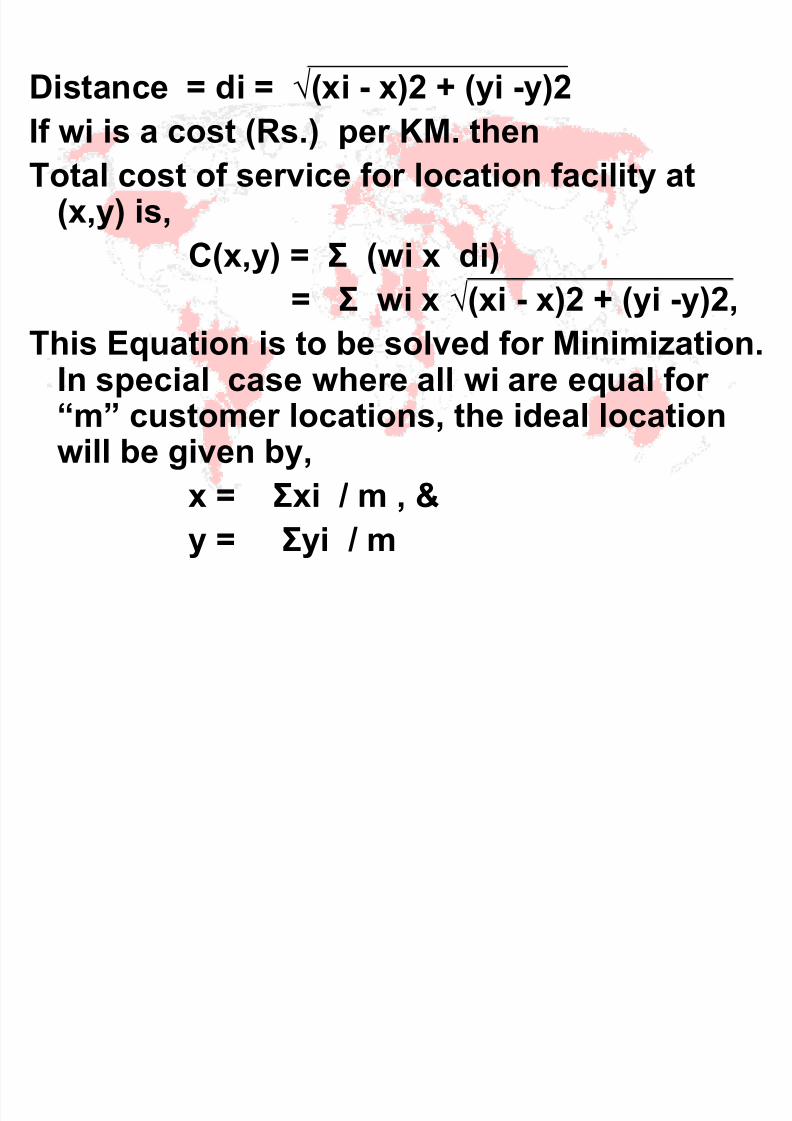
Distance = di = ¥(xi - x)2 + (yi -y)2If wi is a cost (Rs.) per KM. thenTotal cost of service for location facility at
(x,y) is,C(x,y) = (wi x di)
= wi x ¥(xi - x)2 + (yi -y)2,This Equation is to be solved for Minimization.
In special case where all wi are equal for
³m´ customer locations, the ideal locationwill be given by,x = xi / m , &y = yi / m
7) DISTRIBUTION METHODS
8/7/2019 facilitylocation-ppt-091012125230-phpapp02
http://slidepdf.com/reader/full/facilitylocation-ppt-091012125230-phpapp02 80/90
)
Distribution goods from facility to depot /
warehouse can be tackled by Linear Programming. Any one of the following 3methods can be used.
1.North-West Corner.
2.Least-Cost Method. (LCM)
3.Vogel's Approx. Method (VAM)
Let us understand with example one of thesemethods«.

8/7/2019 facilitylocation-ppt-091012125230-phpapp02
http://slidepdf.com/reader/full/facilitylocation-ppt-091012125230-phpapp02 81/90

8/7/2019 facilitylocation-ppt-091012125230-phpapp02
http://slidepdf.com/reader/full/facilitylocation-ppt-091012125230-phpapp02 82/90

8/7/2019 facilitylocation-ppt-091012125230-phpapp02
http://slidepdf.com/reader/full/facilitylocation-ppt-091012125230-phpapp02 83/90

8/7/2019 facilitylocation-ppt-091012125230-phpapp02
http://slidepdf.com/reader/full/facilitylocation-ppt-091012125230-phpapp02 84/90

8/7/2019 facilitylocation-ppt-091012125230-phpapp02
http://slidepdf.com/reader/full/facilitylocation-ppt-091012125230-phpapp02 85/90

8/7/2019 facilitylocation-ppt-091012125230-phpapp02
http://slidepdf.com/reader/full/facilitylocation-ppt-091012125230-phpapp02 86/90

8/7/2019 facilitylocation-ppt-091012125230-phpapp02
http://slidepdf.com/reader/full/facilitylocation-ppt-091012125230-phpapp02 87/90

8/7/2019 facilitylocation-ppt-091012125230-phpapp02
http://slidepdf.com/reader/full/facilitylocation-ppt-091012125230-phpapp02 88/90

8/7/2019 facilitylocation-ppt-091012125230-phpapp02
http://slidepdf.com/reader/full/facilitylocation-ppt-091012125230-phpapp02 89/90

8/7/2019 facilitylocation-ppt-091012125230-phpapp02
http://slidepdf.com/reader/full/facilitylocation-ppt-091012125230-phpapp02 90/90