fact sheet mahoning county boardman …web.epa.ohio.gov/dsw/permits/doc/3pk00002.fs.pdffact sheet...
TRANSCRIPT

Fact Sheet for NPDES Permit Renewal, Mahoning County Boardman WWTP, 2018
Page 1 of 35
National Pollutant Discharge Elimination System (NPDES) Permit Program
FACT SHEET
Regarding an NPDES Permit to Discharge to Waters of the State of Ohio
for the Mahoning County Boardman Wastewater Treatment Plant (WWTP)
Public Notice No.: 18-11-045 Ohio EPA Permit No.: 3PK00002*MD Public Notice Date: November 27, 2018 Application No.: OH0037249 Comment Period Ends: December 27, 2018 Name and Address of Facility Where Name and Address of Applicant: Discharge Occurs:
Mahoning County Board of Commissioners Mahoning County Boardman WWTP
Sanitary Engineering Department 7980 East Parkside Drive
761 Industrial Road Boardman, Ohio 44512
Youngstown, Ohio 44059 Mahoning County Receiving Water: Mill Creek (RM 9.59) Subsequent Stream Network: Mahoning River (RM
21.65), Beaver River, Ohio River
INTRODUCTION
Development of a Fact Sheet for NPDES permits is mandated by Title 40 of the Code of Federal Regulations
(CFR), Section 124.8 and 124.56. This document fulfills the requirements established in those regulations by
providing the information necessary to inform the public of actions proposed by the Ohio Environmental
Protection Agency (Ohio EPA), as well as the methods by which the public can participate in the process of
finalizing those actions.
This Fact Sheet is prepared in order to document the technical basis and risk management decisions that are
considered in the determination of water quality based NPDES Permit effluent limitations. The technical basis
for the Fact Sheet may consist of evaluations of promulgated effluent guidelines, existing effluent quality, instream
biological, chemical and physical conditions, and the relative risk of alternative effluent limitations. This Fact
Sheet details the discretionary decision-making process empowered to the Director by the Clean Water Act
(CWA) and Ohio Water Pollution Control Law (Ohio Revised Code [ORC] 6111). Decisions to award variances
to Water Quality Standards (WQS) or promulgated effluent guidelines for economic or technological reasons will
also be justified in the Fact Sheet where necessary.
No antidegradation review was necessary.
Effluent limits based on available treatment technologies are required by Section 301(b) of the CWA. Many of
these have already been established by the United States Environmental Protection Agency (U.S. EPA) in the
effluent guideline regulations (a.k.a. categorical regulations) for industry categories in 40 CFR Parts 405-499.
Technology-based regulations for publicly-owned treatment works are listed in the Secondary Treatment
Regulations (40 CFR Part 133). If regulations have not been established for a category of dischargers, the director
may establish technology-based limits based on best professional judgment (BPJ).
Ohio EPA reviews the need for water-quality-based limits on a pollutant-by-pollutant basis. Wasteload allocations
(WLAs) are used to develop these limits based on the pollutants that have been detected in the discharge, and the
receiving water’s assimilative capacity. The assimilative capacity depends on the flow in the water receiving the

Fact Sheet for NPDES Permit Renewal, Mahoning County Boardman WWTP, 2018
Page 2 of 35
discharge, and the concentration of the pollutant upstream. The greater the upstream flow, and the lower the
upstream concentration, the greater the assimilative capacity is. Assimilative capacity may represent dilution (as
in allocations for metals), or it may also incorporate the break-down of pollutants in the receiving water (as in
allocations for oxygen-demanding materials).
The need for water-quality-based limits is determined by comparing the WLA for a pollutant to a measure of the
effluent quality. The measure of effluent quality is called Projected Effluent Quality (PEQ). This is a statistical
measure of the average and maximum effluent values for a pollutant. As with any statistical method, the more
data that exists for a given pollutant, the more likely that PEQ will match the actual observed data. If there is a
small data set for a given pollutant, the highest measured value is multiplied by a statistical factor to obtain a PEQ;
for example, if only one sample exists, the factor is 6.2, for two samples - 3.8, for three samples - 3.0. The factors
continue to decline as samples sizes increase. These factors are intended to account for effluent variability, but if
the pollutant concentrations are fairly constant, these factors may make PEQ appear larger than it would be shown
to be if more sample results existed.
SUMMARY OF PERMIT CONDITIONS
The effluent limits and monitoring requirements proposed for most parameters are the same as in the current
permit, although some monitoring frequencies may have changed.
The wasteload allocation (WLA) placed bis (2-ethylhexyl) phthalate in Group 5. Water-quality-based effluent
limitations (WQBELs) and an associated compliance schedule are recommended.
Revisions to water quality standards (OAC 3745-1-07) that protect primary contact recreation became effective
on January 4, 2016. As a result, the monthly and weekly Escherichia Coli (E. coli) limits have become more
stringent.
Pursuant to ORC 6111.03, monthly effluent monitoring for dissolved orthophosphate has been included in the
permit.
Based on the WLA, monitoring for silver from the previous permit is recommended to be removed.
Downstream monitoring for total cyanide at Station 3PK00002901 is proposed to be removed.
This permit no longer authorizes the use of method 4500 CN-I from Standard Methods for free cyanide testing.
As soon as possible, the permittee must begin using approved methods for free cyanide listed in 40 CFR 136.
In Part II of the permit, special conditions are included that address sanitary sewer overflow (SSO) reporting;
operator certification, minimum staffing and operator of record; whole effluent toxicity (WET) testing; storm
water compliance; pretreatment program requirements; and outfall signage.
This permit renewal is proposed for a term of approximately 5 years.

Fact Sheet for NPDES Permit Renewal, Mahoning County Boardman WWTP, 2018
Page 3 of 35
Table of Contents
Page
INTRODUCTION................................................................................................................................................... 1
SUMMARY OF PERMIT CONDITIONS ............................................................................................................. 2
PROCEDURES FOR PARTICIPATION IN THE FORMULATION OF FINAL DETERMINATIONS ............ 5
INFORMATION REGARDING CERTAIN WATER QUALITY BASED EFFLUENT LIMITS ....................... 5
LOCATION OF DISCHARGE/RECEIVING WATER USE CLASSIFICATION ............................................... 7
FACILITY DESCRIPTION .................................................................................................................................... 7
DESCRIPTION OF EXISTING DISCHARGE ..................................................................................................... 8
ASSESSMENT OF IMPACT ON RECEIVING WATERS .................................................................................. 8
DEVELOPMENT OF WATER-QUALITY-BASED EFFLUENT LIMITS ......................................................... 9
REASONABLE POTENTIAL/ EFFLUENT LIMITS/HAZARD MANAGEMENT DECISIONS .................... 12
OTHER REQUIREMENTS .................................................................................................................................. 14
List of Figures
Figure 1. Location of Boardman WWTP .............................................................................................................. 17
Figure 2. Flow Diagram of Boardman WWTP ..................................................................................................... 18
Figure 3. Solids Handling Diagram of Boardman WWTP ................................................................................... 19
List of Tables
Table 1. Sewage Sludge Removal ......................................................................................................................... 20
Table 2. Average Annual Effluent Flow Rates ..................................................................................................... 20
Table 3. Sanitary Sewer Overflows...................................................................................................................... 20
Table 4. Effluent Characterization Using Self-Monitoring Data .......................................................................... 21
Table 5. Effluent Characterization Using Pretreatment Data ................................................................................ 23
Table 6. Projected Effluent Quality....................................................................................................................... 23
Table 7. Summary of Acute and Chronic Toxicity Results .................................................................................. 24
Table 8. Use Attainment Status ............................................................................................................................. 25

Fact Sheet for NPDES Permit Renewal, Mahoning County Boardman WWTP, 2018
Page 4 of 35
Table 9. Water Quality Criteria in the Study Area ................................................................................................ 27
Table 10. Instream Conditions and Discharger Flows ......................................................................................... 28
Table 11. Summary of Effluent Limits to Maintain Applicable Water Quality Criteria ....................................... 29
Table 12. Parameter Assessment ........................................................................................................................... 30
Table 13. Risk Assessment Results ...................................................................................................................... 31
Table 14. Final Effluent Limits for Outfall 3PK00002001 ................................................................................... 33
List of Addendums
Addendum 1. Acronyms ...................................................................................................................................... 35

Fact Sheet for NPDES Permit Renewal, Mahoning County Boardman WWTP, 2018
Page 5 of 35
PROCEDURES FOR PARTICIPATION IN THE FORMULATION OF FINAL DETERMINATIONS
The draft action shall be issued as a final action unless the Director revises the draft after consideration of the
record of a public meeting or written comments, or upon disapproval by the Administrator of the U.S.
Environmental Protection Agency.
Within thirty days of the date of the Public Notice, any person may request or petition for a public meeting for
presentation of evidence, statements or opinions. The purpose of the public meeting is to obtain additional
evidence. Statements concerning the issues raised by the party requesting the meeting are invited. Evidence may
be presented by the applicant, the state, and other parties, and following presentation of such evidence other
interested persons may present testimony of facts or statements of opinion.
Requests for public meetings shall be in writing and shall state the action of the Director objected to, the questions
to be considered, and the reasons the action is contested. Such requests should be addressed to:
Legal Records Section
Ohio Environmental Protection Agency
P.O. Box 1049
Columbus, Ohio 43216-1049
Interested persons are invited to submit written comments upon the discharge permit. Comments should be
submitted in person or by mail no later than 30 days after the date of this Public Notice. Deliver or mail all
comments to:
Ohio Environmental Protection Agency
Attention: Division of Surface Water
Permits Processing Unit
P.O. Box 1049
Columbus, Ohio 43216-1049
The Ohio EPA permit number and Public Notice numbers should appear on each page of any submitted comments.
All comments received no later than 30 days after the date of the Public Notice will be considered.
Citizens may conduct file reviews regarding specific companies or sites. Appointments are necessary to conduct
file reviews, because requests to review files have increased dramatically in recent years. The first 250 pages
copied are free. For requests to copy more than 250 pages, there is a five-cent charge for each page copied.
Payment is required by check or money order, made payable to Treasurer State of Ohio.
For additional information about this fact sheet or the draft permit, contact Joseph Trocchio at (330) 963-1193 or
INFORMATION REGARDING CERTAIN WATER QUALITY BASED EFFLUENT LIMITS
This draft permit may contain proposed WQBELs for parameters that are not priority pollutants.
See the following link for a list of the priority pollutants:
http://epa.ohio.gov/portals/35/pretreatment/Pretreatment_Program_Priority_Pollutant_Detection_Limits.pdf .
In accordance with ORC 6111.03(J)(3), the Director established these WQBELs after considering, to the extent
consistent with the Federal Water Pollution Control Act, evidence relating to the technical feasibility and
economic reasonableness of removing the polluting properties from those wastes and to evidence relating to

Fact Sheet for NPDES Permit Renewal, Mahoning County Boardman WWTP, 2018
Page 6 of 35
conditions calculated to result from that action and their relation to benefits to the people of the state and to
accomplishment of the purposes of this chapter. This determination was made based on data and information
available at the time the permit was drafted, which included the contents of the timely submitted NPDES permit
renewal application, along with any and all pertinent information available to the Director.
This public notice allows the permittee to provide to the Director for consideration during this public comment
period additional site-specific pertinent and factual information with respect to the technical feasibility and
economic reasonableness for achieving compliance with the proposed final effluent limitations for these
parameters. The permittee shall deliver or mail this information to:
Ohio Environmental Protection Agency
Attention: Division of Surface Water
Permits Processing Unit
P.O. Box 1049
Columbus, Ohio 43216-1049
Should the applicant need additional time to review, obtain or develop site-specific pertinent and factual
information with respect to the technical feasibility and economic reasonableness of achieving compliance with
these limitations, written notification for any additional time shall be sent to the above address no later than 30
days after the Public Notice Date on Page 1.
Should the applicant determine that compliance with the proposed WQBELs for parameters other than the priority
pollutants is technically and/or economically unattainable, the permittee may submit an application for a variance
to the applicable WQS used to develop the proposed effluent limitation in accordance with the terms and
conditions set forth in OAC 3745-33-07(D). The permittee shall submit this application to the above address no
later than 30 days after the Public Notice Date.
Alternately, the applicant may propose the development of site-specific WQS pursuant to OAC 3745-1-35. The
permittee shall submit written notification regarding their intent to develop site specific WQS for parameters that
are not priority pollutants to the above address no later than 30 days after the Public Notice Date.
Fact Sheet for NPDES Permit Renewal, Mahoning County Boardman WWTP, 2018
Page 7 of 35
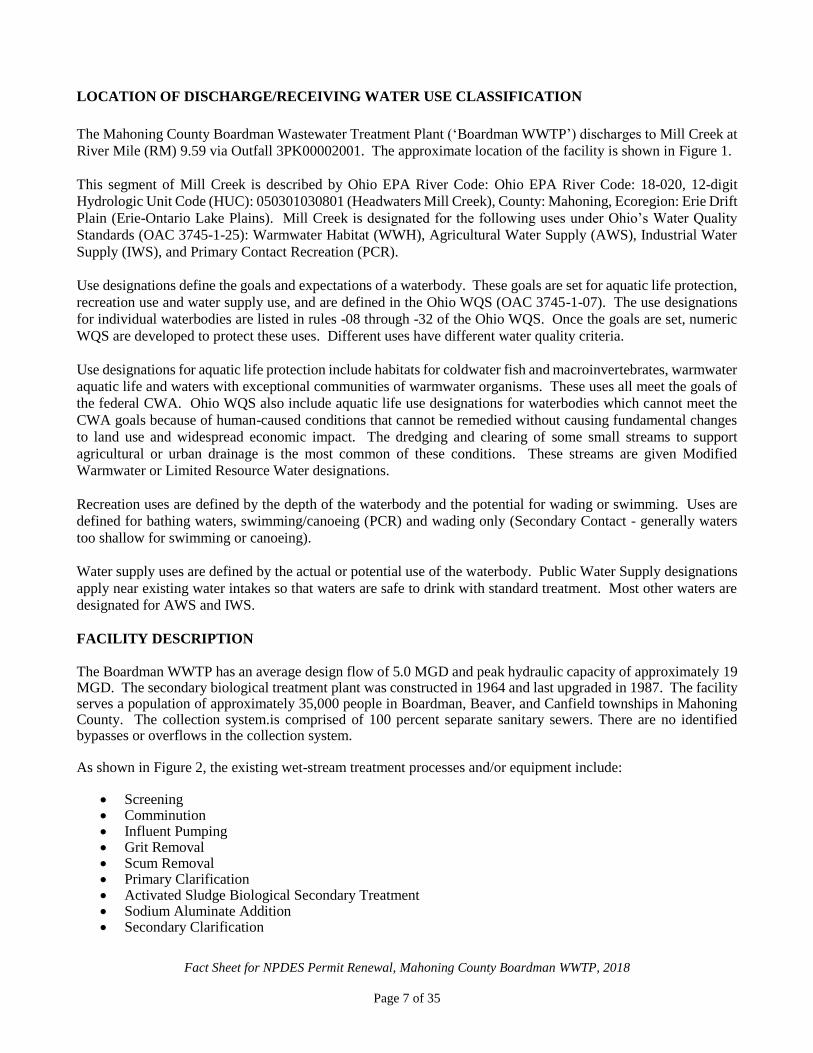
LOCATION OF DISCHARGE/RECEIVING WATER USE CLASSIFICATION
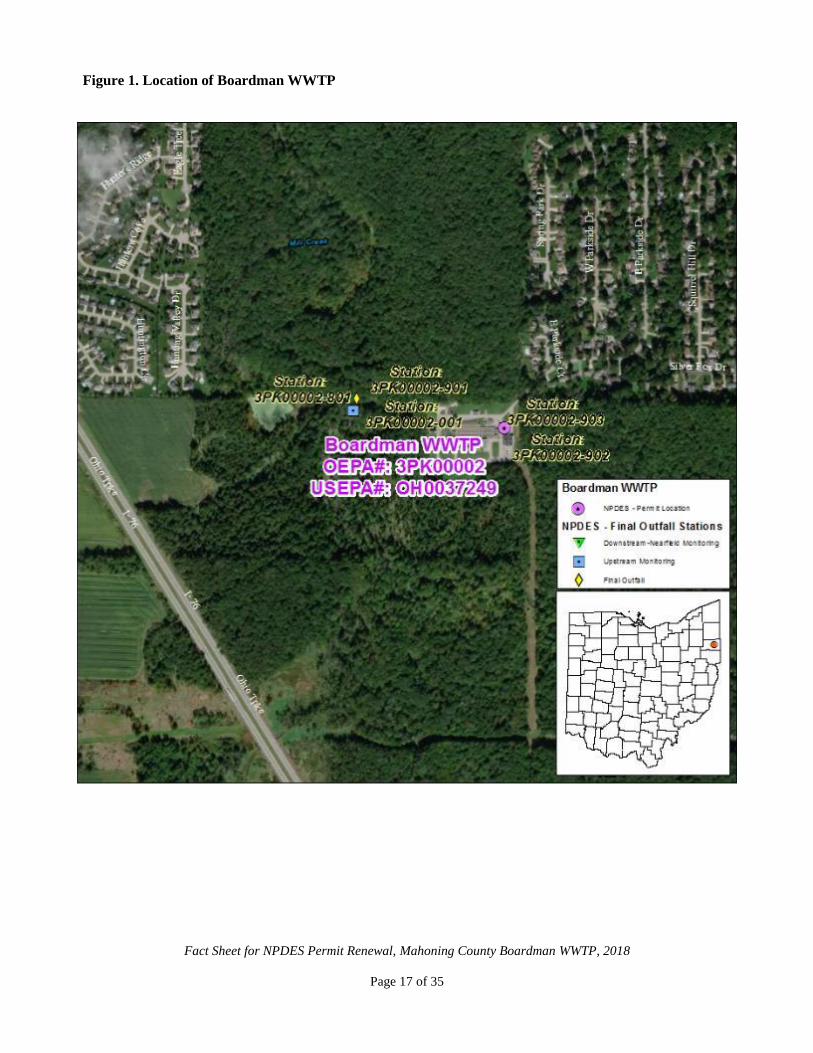
The Mahoning County Boardman Wastewater Treatment Plant (‘Boardman WWTP’) discharges to Mill Creek at
River Mile (RM) 9.59 via Outfall 3PK00002001. The approximate location of the facility is shown in Figure 1.
This segment of Mill Creek is described by Ohio EPA River Code: Ohio EPA River Code: 18-020, 12-digit
Hydrologic Unit Code (HUC): 050301030801 (Headwaters Mill Creek), County: Mahoning, Ecoregion: Erie Drift
Plain (Erie-Ontario Lake Plains). Mill Creek is designated for the following uses under Ohio’s Water Quality
Standards (OAC 3745-1-25): Warmwater Habitat (WWH), Agricultural Water Supply (AWS), Industrial Water
Supply (IWS), and Primary Contact Recreation (PCR).
Use designations define the goals and expectations of a waterbody. These goals are set for aquatic life protection,
recreation use and water supply use, and are defined in the Ohio WQS (OAC 3745-1-07). The use designations
for individual waterbodies are listed in rules -08 through -32 of the Ohio WQS. Once the goals are set, numeric
WQS are developed to protect these uses. Different uses have different water quality criteria.
Use designations for aquatic life protection include habitats for coldwater fish and macroinvertebrates, warmwater
aquatic life and waters with exceptional communities of warmwater organisms. These uses all meet the goals of
the federal CWA. Ohio WQS also include aquatic life use designations for waterbodies which cannot meet the
CWA goals because of human-caused conditions that cannot be remedied without causing fundamental changes
to land use and widespread economic impact. The dredging and clearing of some small streams to support
agricultural or urban drainage is the most common of these conditions. These streams are given Modified
Warmwater or Limited Resource Water designations.
Recreation uses are defined by the depth of the waterbody and the potential for wading or swimming. Uses are
defined for bathing waters, swimming/canoeing (PCR) and wading only (Secondary Contact - generally waters
too shallow for swimming or canoeing).
Water supply uses are defined by the actual or potential use of the waterbody. Public Water Supply designations
apply near existing water intakes so that waters are safe to drink with standard treatment. Most other waters are
designated for AWS and IWS.
FACILITY DESCRIPTION
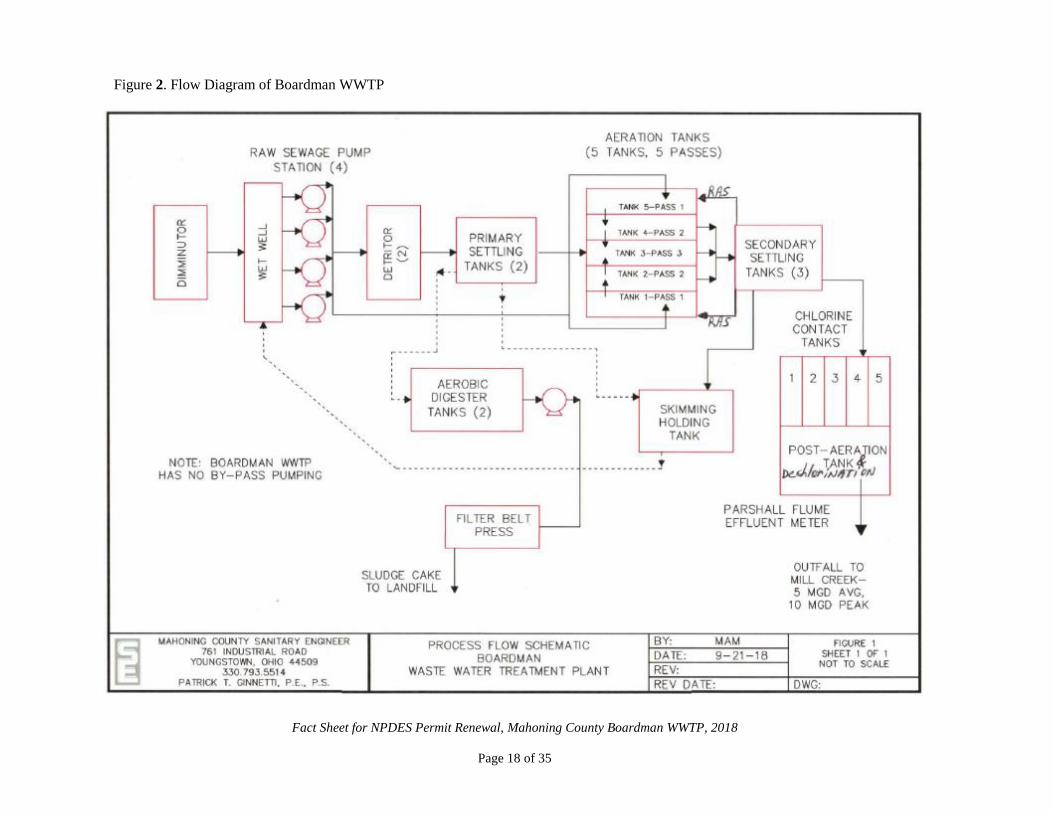
The Boardman WWTP has an average design flow of 5.0 MGD and peak hydraulic capacity of approximately 19 MGD. The secondary biological treatment plant was constructed in 1964 and last upgraded in 1987. The facility serves a population of approximately 35,000 people in Boardman, Beaver, and Canfield townships in Mahoning County. The collection system.is comprised of 100 percent separate sanitary sewers. There are no identified bypasses or overflows in the collection system. As shown in Figure 2, the existing wet-stream treatment processes and/or equipment include:
• Screening • Comminution • Influent Pumping • Grit Removal • Scum Removal • Primary Clarification • Activated Sludge Biological Secondary Treatment • Sodium Aluminate Addition • Secondary Clarification

Fact Sheet for NPDES Permit Renewal, Mahoning County Boardman WWTP, 2018
Page 8 of 35
• Chlorination • De-chlorination • Post-aeration.
Sludge is processed by sludge thickening, stabilization using aerobic digestion, dewatering with a belt filter press,
and disposal of stabilized sludge by transportation to a landfill (See Figure 3). Table 1 shows the quantities of
sludge removed for the period 2014 - 2017.
Mahoning County implements an Ohio EPA-approved pretreatment program. Local industrial users contribute
approximately 0.02 MGD to the flow received at the Boardman WWTP. Mahoning County has identified one
categorical industrial user tributary to the Boardman WWTP.
In December 2013, Mahoning County conducted a stress test to determine if additional flow could be processed
through the Boardman WWTP in response to future abandonment of the 0.55 MGD Mahoning County New
Middletown WWTP (3PH00016). The stress tests confirmed that a combined peak flow of 22.34 MGD could be
handled with some modifications and operational improvements to the facility. It was determined that to meet the
additional flow, installation of new influent pumps, construction of diffusers in the aeration tank, and increased
chlorine dosage would be required.
DESCRIPTION OF EXISTING DISCHARGE
The average annual effluent flow rate for Boardman WWTP for the period, 2014-2018, is presented in Table 2.
Boardman WWTP currently reports collection system sanitary sewer overflows (SSOs) utilizing Station
3PK00002300. Table 3 lists the SSOs for the period, 2014-2018.
Table 4 presents a summary of unaltered Discharge Monitoring Reports (DMRs). Data are presented for the
period January 2014 - June 2018; current permit limits are provided for comparison.
Table 5 presents chemical specific data compiled from data reported in annual pretreatment reports.
Table 6 summarizes the chemical specific data for Outfall 3PK00002001 by presenting the average and maximum
PEQ values.
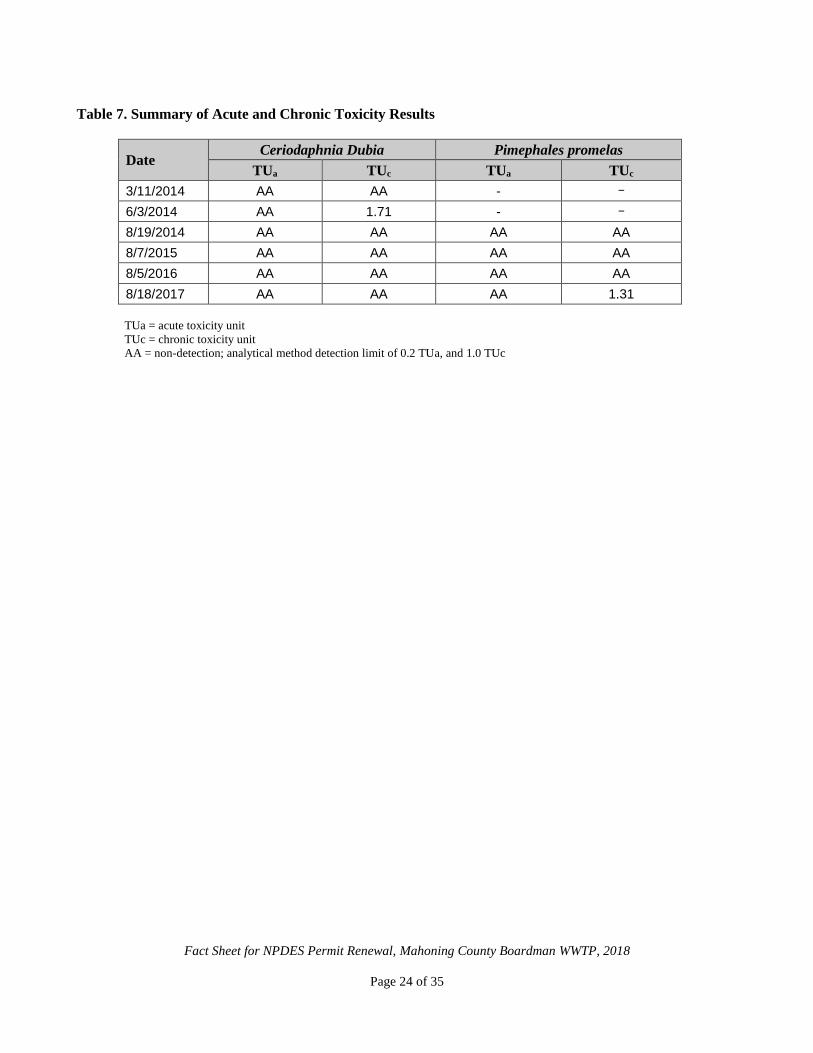
Table 7 summarizes the results of acute and chronic Whole Effluent Toxicity (WET) tests of the final effluent
using the water flea (Ceriodaphnia dubia) and fathead minnow (Pimephales promelas) as the test organisms.
ASSESSMENT OF IMPACT ON RECEIVING WATERS
The attainment status of the Mahoning River and its tributaries, including Mill Creek, is reported in the 2018 Ohio
Integrated Water Quality Monitoring and Assessment Report (“Integrated Report”). An assessment of the impact
of a permitted point source on the immediate receiving waters includes an evaluation of the available
chemical/physical, biological, and habitat data which have been collected by Ohio EPA pursuant to the Five-Year
Basin Approach for Monitoring and NPDES Reissuance. Other data may be used provided it was collected in
accordance with Ohio EPA methods and protocols as specified by the Ohio WQS and Ohio EPA guidance
documents. Other information which may be evaluated include, but is not limited to the following: NPDES
permittee self-monitoring data; effluent and mixing zone bioassays conducted by Ohio EPA, the permittee, or
U.S. EPA.
Fact Sheet for NPDES Permit Renewal, Mahoning County Boardman WWTP, 2018
Page 9 of 35
In evaluating this data, Ohio EPA attempts to link environmental stresses and measured pollutant exposure to the
health and diversity of biological communities. Stresses can include pollutant discharges (permitted and
unpermitted), land use effects, and habitat modifications. Indicators of exposure to these stresses include whole
effluent toxicity tests, fish tissue chemical data, and fish health biomarkers (for example, fish blood tests).
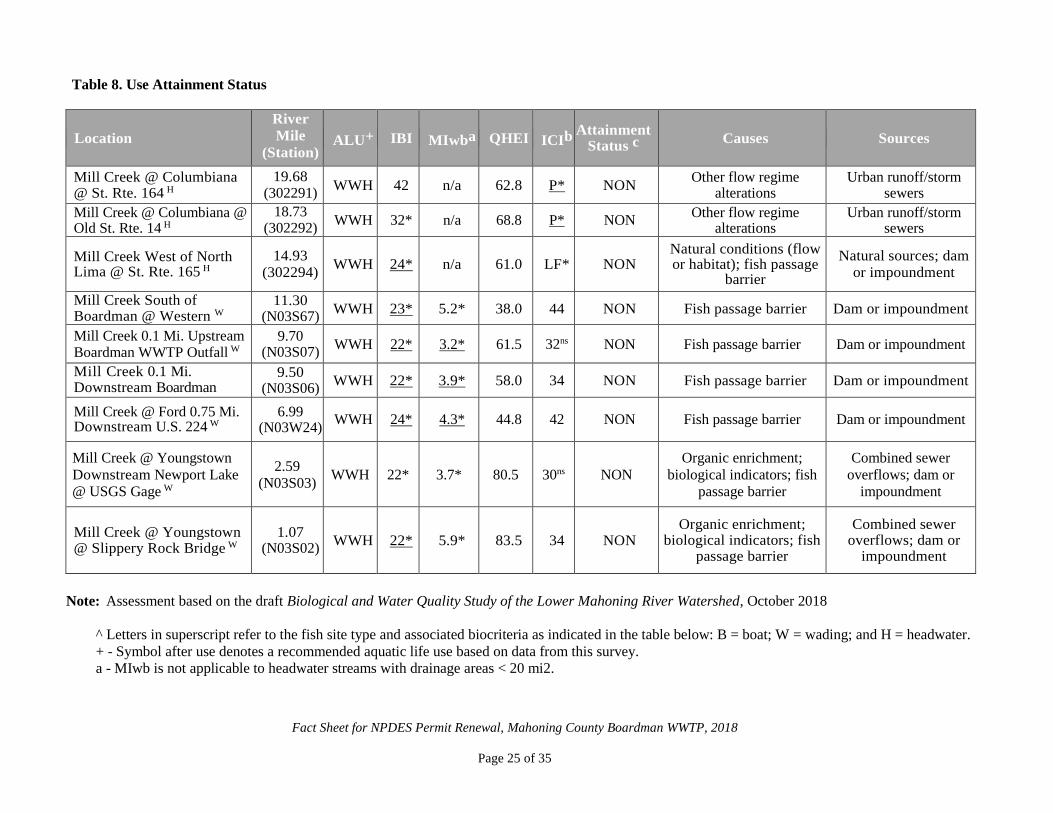
Use attainment is a term which describes the degree to which environmental indicators are either above or below
criteria specified by the Ohio WQS (OAC 3745-1). Assessing use attainment status for aquatic life uses primarily
relies on the Ohio EPA biological criteria (OAC 3745-1-07; Table 7-15). These criteria apply to rivers and streams
outside of mixing zones. Numerical biological criteria are based on measuring several characteristics of the fish
and macroinvertebrate communities; these characteristics are combined into multimetric biological indices
including the Index of Biotic Integrity (IBI) and modified Index of Well-Being (MIwb), which indicate the
response of the fish community, and the Invertebrate Community Index (ICI), which indicates the response of the
macroinvertebrate community. Numerical criteria are broken down by ecoregion, use designation, and stream or
river size. Ohio has five ecoregions defined by common topography, land use, potential vegetation and soil type.
Three attainment status results are possible at each sampling location -full, partial, or non-attainment. Full
attainment means that all of the applicable indices meet the biocriteria. Partial attainment means that one or more
of the applicable indices fails meet the biocriteria. Nonattainment means that either none of the applicable indices
meet the biocriteria or one of the organism groups indicates poor or very poor performance. An aquatic life use
attainment table (see Table 8) is constructed based on the sampling results and is arranged from upstream to
downstream and includes the sampling locations indicated by river mile, the applicable biological indices, the use
attainment status (i.e., full, partial, or non), the Qualitative Habitat Evaluation Index, and comments and
observations for each sampling location.
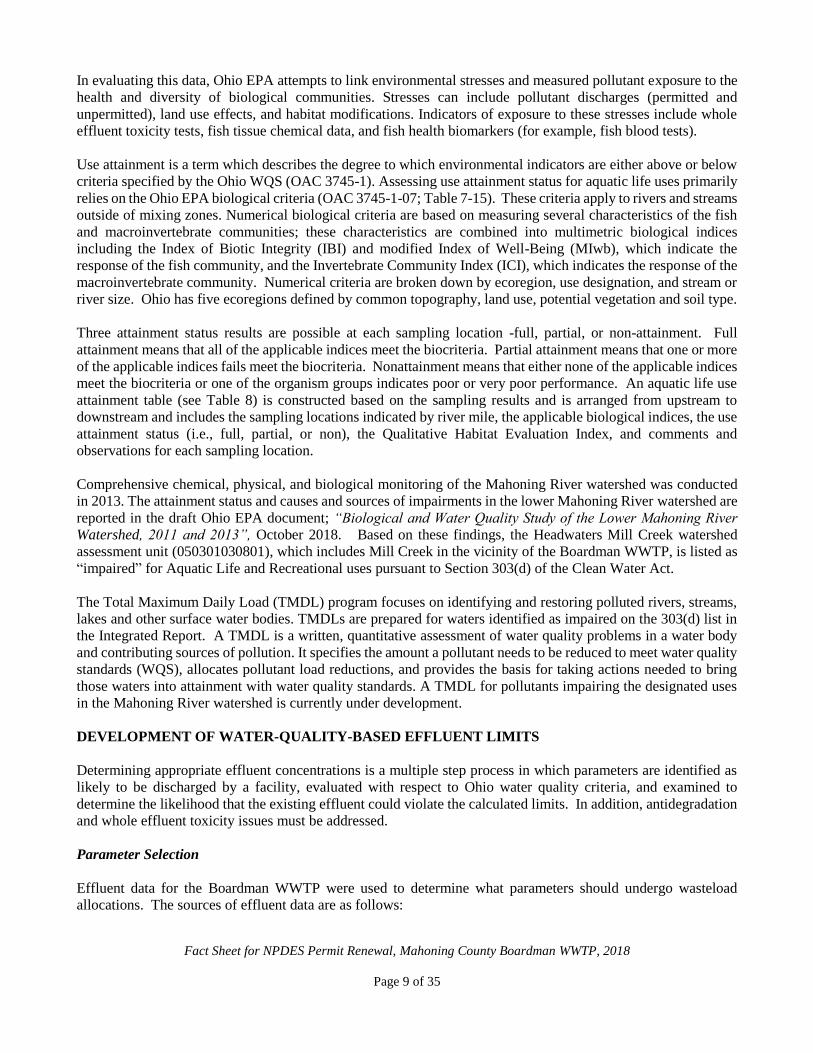
Comprehensive chemical, physical, and biological monitoring of the Mahoning River watershed was conducted
in 2013. The attainment status and causes and sources of impairments in the lower Mahoning River watershed are
reported in the draft Ohio EPA document; “Biological and Water Quality Study of the Lower Mahoning River
Watershed, 2011 and 2013”, October 2018. Based on these findings, the Headwaters Mill Creek watershed
assessment unit (050301030801), which includes Mill Creek in the vicinity of the Boardman WWTP, is listed as
“impaired” for Aquatic Life and Recreational uses pursuant to Section 303(d) of the Clean Water Act.
The Total Maximum Daily Load (TMDL) program focuses on identifying and restoring polluted rivers, streams,
lakes and other surface water bodies. TMDLs are prepared for waters identified as impaired on the 303(d) list in
the Integrated Report. A TMDL is a written, quantitative assessment of water quality problems in a water body
and contributing sources of pollution. It specifies the amount a pollutant needs to be reduced to meet water quality
standards (WQS), allocates pollutant load reductions, and provides the basis for taking actions needed to bring
those waters into attainment with water quality standards. A TMDL for pollutants impairing the designated uses
in the Mahoning River watershed is currently under development.
DEVELOPMENT OF WATER-QUALITY-BASED EFFLUENT LIMITS
Determining appropriate effluent concentrations is a multiple step process in which parameters are identified as
likely to be discharged by a facility, evaluated with respect to Ohio water quality criteria, and examined to
determine the likelihood that the existing effluent could violate the calculated limits. In addition, antidegradation
and whole effluent toxicity issues must be addressed.
Parameter Selection
Effluent data for the Boardman WWTP were used to determine what parameters should undergo wasteload
allocations. The sources of effluent data are as follows:
Fact Sheet for NPDES Permit Renewal, Mahoning County Boardman WWTP, 2018
Page 10 of 35
Self-monitoring data (DMRs) January 2014 through June 2018
Pretreatment program data 2014 through 2018
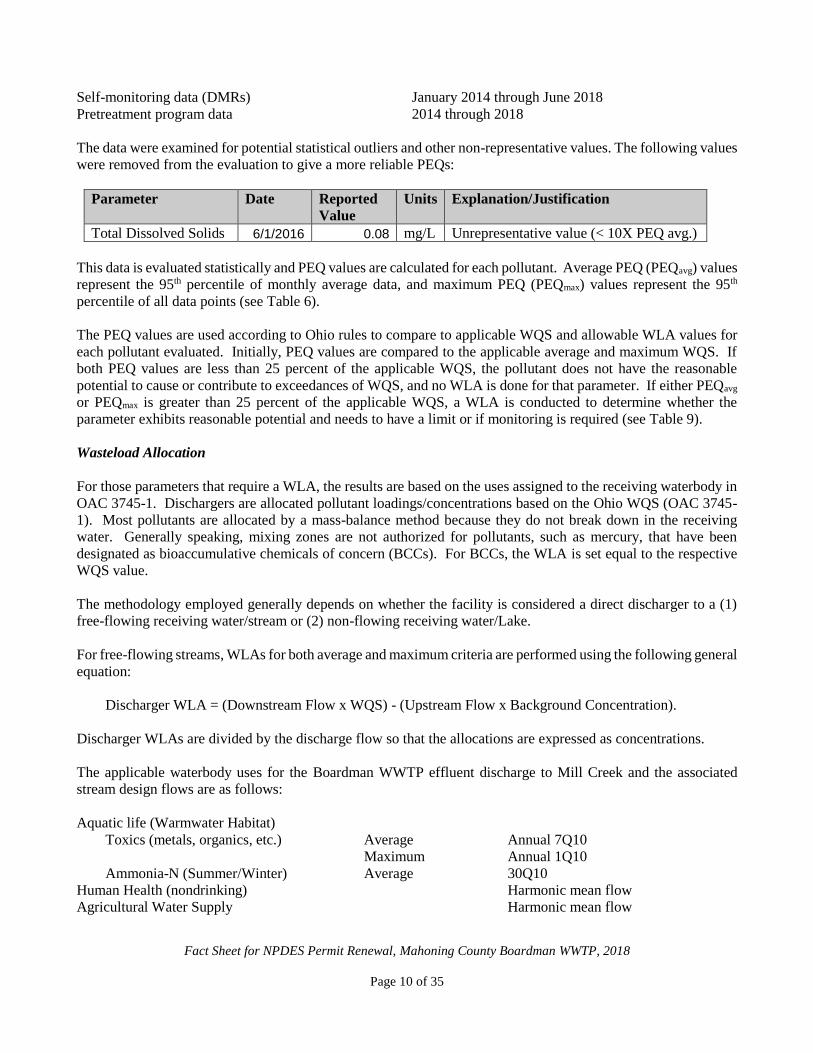
The data were examined for potential statistical outliers and other non-representative values. The following values
were removed from the evaluation to give a more reliable PEQs:
Parameter Date Reported
Value
Units Explanation/Justification
Total Dissolved Solids 6/1/2016 0.08 mg/L Unrepresentative value (< 10X PEQ avg.)
This data is evaluated statistically and PEQ values are calculated for each pollutant. Average PEQ (PEQavg) values
represent the 95th percentile of monthly average data, and maximum PEQ (PEQmax) values represent the 95th
percentile of all data points (see Table 6).
The PEQ values are used according to Ohio rules to compare to applicable WQS and allowable WLA values for
each pollutant evaluated. Initially, PEQ values are compared to the applicable average and maximum WQS. If
both PEQ values are less than 25 percent of the applicable WQS, the pollutant does not have the reasonable
potential to cause or contribute to exceedances of WQS, and no WLA is done for that parameter. If either PEQavg
or PEQmax is greater than 25 percent of the applicable WQS, a WLA is conducted to determine whether the
parameter exhibits reasonable potential and needs to have a limit or if monitoring is required (see Table 9).
Wasteload Allocation
For those parameters that require a WLA, the results are based on the uses assigned to the receiving waterbody in
OAC 3745-1. Dischargers are allocated pollutant loadings/concentrations based on the Ohio WQS (OAC 3745-
1). Most pollutants are allocated by a mass-balance method because they do not break down in the receiving
water. Generally speaking, mixing zones are not authorized for pollutants, such as mercury, that have been
designated as bioaccumulative chemicals of concern (BCCs). For BCCs, the WLA is set equal to the respective
WQS value.
The methodology employed generally depends on whether the facility is considered a direct discharger to a (1)
free-flowing receiving water/stream or (2) non-flowing receiving water/Lake.
For free-flowing streams, WLAs for both average and maximum criteria are performed using the following general
equation:
Discharger WLA = (Downstream Flow x WQS) - (Upstream Flow x Background Concentration).
Discharger WLAs are divided by the discharge flow so that the allocations are expressed as concentrations.
The applicable waterbody uses for the Boardman WWTP effluent discharge to Mill Creek and the associated
stream design flows are as follows:
Aquatic life (Warmwater Habitat)
Toxics (metals, organics, etc.) Average Annual 7Q10
Maximum Annual 1Q10
Ammonia-N (Summer/Winter) Average 30Q10
Human Health (nondrinking) Harmonic mean flow
Agricultural Water Supply Harmonic mean flow

Fact Sheet for NPDES Permit Renewal, Mahoning County Boardman WWTP, 2018
Page 11 of 35
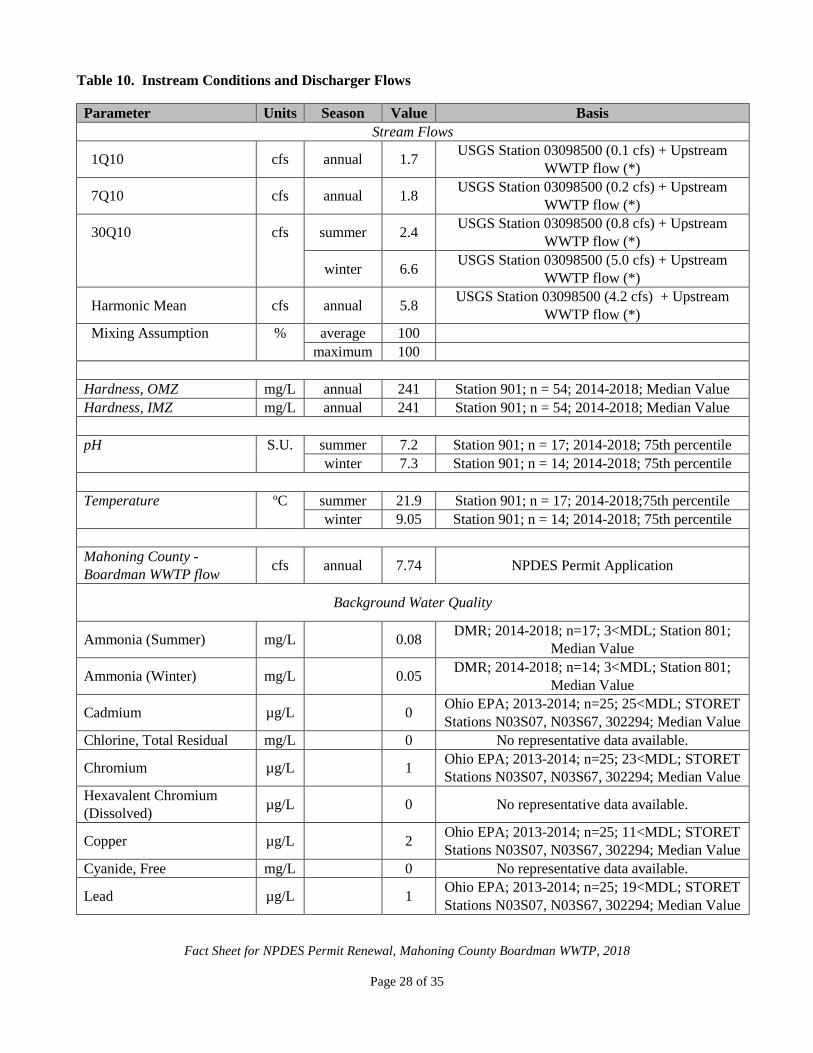
Allocations are developed using a percentage of stream design flow as specified in Table 10. Unlike in the
previous Fact Sheet, the current WLA utilized background stream information associated with the United States
Geological Survey (USGS) gage located on Mill Creek, i.e. USGS Gage 03098500: Mill Creek at Youngstown
OH.
The data used in the WLA are listed in Table 9 and Table 10. The wasteload allocation results that would allow
the Boardman WWTP to maintain all applicable water quality criteria are presented in Table 11.
Whole Effluent Toxicity WLA
Whole effluent toxicity (WET) is the total toxic effect of an effluent on aquatic life measured directly with a
toxicity test. Acute WET measures short term effects of the effluent while chronic WET measures longer term
and potentially more subtle effects of the effluent.
Water quality standards for WET are expressed in Ohio’s narrative “free from” WQS rule [OAC 3745-1-04(D)].
These “free froms” are translated into toxicity units (TUs) by the associated WQS Implementation Rule (OAC
3745-2-09). Wasteload allocations can then be calculated using TUs as if they were water quality criteria.
The WLA calculations for WET are similar to those for aquatic life criteria – using the chronic toxicity unit
(TUc) and 7Q10 flow for the average and the acute toxicity unit (TUa) and 1Q10 flow for the maximum. These
values are the levels of effluent toxicity that should not cause instream toxicity during critical low- flow
conditions. For Boardman WWTP, the WLA values are 0.40 TUa and 1.23 TUc.
The chronic toxicity unit (TUc) is defined as 100 divided by the IC25:
TUc = 100/IC25
This equation applies outside the mixing zone for warmwater, modified warmwater, exceptional warmwater,
coldwater, and seasonal salmonid use designations except when the following equation is more restrictive
(Ceriodaphnia dubia only):
TUc = 100/geometric mean of NOEC and LOEC
The acute toxicity unit (TUa) is defined as 100 divided by the LC50 for the most sensitive test species:
TUa = 100/LC50
This equation applies outside the mixing zone for warmwater, modified warmwater, exceptional warmwater,
coldwater, and seasonal salmonid use designations.
When the acute wasteload allocation is less than 1.0 TUa, it may be defined as:

Fact Sheet for NPDES Permit Renewal, Mahoning County Boardman WWTP, 2018
Page 12 of 35
Dilution Ratio Allowable Effluent Toxicity
(downstream flow to discharger flow) (percent effects in 100% effluent)
up to 2 to 1 30
greater than 2 to 1 but less than 2.7 to 1 40
2.7 to 1 to 3.3 to 1 50
Stream Dilution Ratio =
1Q10 + [WWTP flow
rate] = [1.7] cfs + [7.7] cfs = [1.22]
[WWTP flow rate] [7.7] cfs
The acute wasteload allocation for Boardman WWTP is 30 percent mortality in 100 percent effluent based on the
dilution ratio of 1.22 to 1.
REASONABLE POTENTIAL/ EFFLUENT LIMITS/HAZARD MANAGEMENT DECISIONS
After appropriate effluent limits are calculated, the reasonable potential of the discharger to violate the WQS must
be determined. Each parameter is examined and placed in a defined "group". Parameters that do not have a WQS
or do not require a WLA based on the initial screening are assigned to either group 1 or 2. For the allocated
parameters, the preliminary effluent limits (PEL) based on the most restrictive average and maximum WLAs are
selected from Table 11 . The average PEL (PELavg) is compared to the average PEQ (PEQavg) from Table 6, and
the PELmax is compared to the PEQmax. Based on the calculated percentage of the allocated value [(PEQavg ÷
PELavg) X 100, or (PEQmax ÷ PELmax) X 100)], the parameters are assigned to group 3, 4, or 5. The groupings are
listed in Table 12 and Table 13.
The final effluent limits are determined by evaluating the groupings in conjunction with other applicable rules and
regulations. Table 14 present the final effluent limits and monitoring requirements proposed for Boardman
WWTP Outfall 3PK00002001 and the basis for their recommendation. Unless otherwise indicated, the monitoring
frequencies proposed in the permit are continued from the existing permit.
Flow Rate and Water Temperature
Monitoring is proposed to continue for flow rate and water temperature to assist in the evaluation of
effluent quality and treatment plant performance. This is in accordance with Ohio EPA guidance.
Total Suspended Solids, 5-Day Carbonaceous Biochemical Oxygen Demand (CBOD5), Phosphorus,
and Ammonia-N (Summer)
The existing plant design limits for total suspended solids, 5-day carbonaceous biochemical oxygen
demand (CBOD5), phosphorus, and ammonia (summer) are recommended to continue.
Ammonia-N (Winter), Total Kjeldahl Nitrogen (TKN), and Nitrate+Nitrite (as N)
The existing permit does not include an effluent ammonia (winter) limitation. Therefore, an evaluation
was performed to determine if a WLA and associated ammonia effluent limits are necessary for the winter
months. Factors considered include, among other things, size of discharge, existing ammonia effluent
quality (i.e. PEQs), evidence of effluent or mixing zone toxicity, location of public water supply intakes,
etc. Based on the evaluation, the Boardman WWTP does not have the reasonable potential to contribute
to WQS exceedances and winter effluent limits are not necessary for ammonia.
Fact Sheet for NPDES Permit Renewal, Mahoning County Boardman WWTP, 2018
Page 13 of 35
The continuation of monitoring for TKN and nitrate+nitrite is proposed to continue based on best technical
judgment. The purpose of the monitoring is to maintain a data set tracking nutrient levels in the watershed.
Dissolved Oxygen, Oil and Grease, pH, and Escherichia (E.) coli
Limits recommended for dissolved oxygen, oil and grease, pH, and Escherichia coli are based on WQS
(OAC 3745-1).
Revisions to water quality standards that protect Primary Contact Recreation (PCR) criteria became
effective on January 4, 2016. All streams that were previously designated “Class B” PCR, e.g. Mill Creek,
have been reclassified as PCR. Hence, facilities discharging to theses streams will now have to meet more
stringent permit limits for E. coli. The monthly and weekly E. coli limits have been set at 126/100 ml and
284/100 ml, respectively.
Based on best technical judgment (BTJ), it is anticipated that the Boardman WWTP will be able to meet
the new E. coli limits and does not require a “schedule of compliance.”
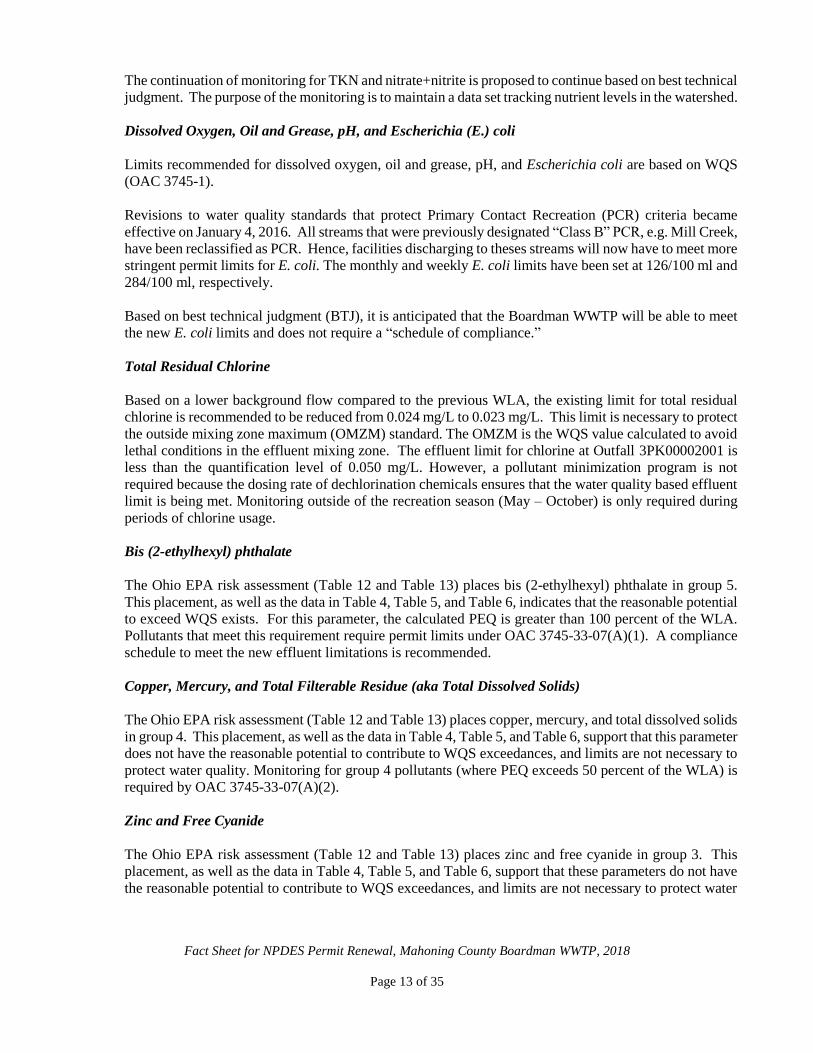
Total Residual Chlorine
Based on a lower background flow compared to the previous WLA, the existing limit for total residual
chlorine is recommended to be reduced from 0.024 mg/L to 0.023 mg/L. This limit is necessary to protect
the outside mixing zone maximum (OMZM) standard. The OMZM is the WQS value calculated to avoid
lethal conditions in the effluent mixing zone. The effluent limit for chlorine at Outfall 3PK00002001 is
less than the quantification level of 0.050 mg/L. However, a pollutant minimization program is not
required because the dosing rate of dechlorination chemicals ensures that the water quality based effluent
limit is being met. Monitoring outside of the recreation season (May – October) is only required during
periods of chlorine usage.
Bis (2-ethylhexyl) phthalate
The Ohio EPA risk assessment (Table 12 and Table 13) places bis (2-ethylhexyl) phthalate in group 5.
This placement, as well as the data in Table 4, Table 5, and Table 6, indicates that the reasonable potential
to exceed WQS exists. For this parameter, the calculated PEQ is greater than 100 percent of the WLA.
Pollutants that meet this requirement require permit limits under OAC 3745-33-07(A)(1). A compliance
schedule to meet the new effluent limitations is recommended.
Copper, Mercury, and Total Filterable Residue (aka Total Dissolved Solids)
The Ohio EPA risk assessment (Table 12 and Table 13) places copper, mercury, and total dissolved solids
in group 4. This placement, as well as the data in Table 4, Table 5, and Table 6, support that this parameter
does not have the reasonable potential to contribute to WQS exceedances, and limits are not necessary to
protect water quality. Monitoring for group 4 pollutants (where PEQ exceeds 50 percent of the WLA) is
required by OAC 3745-33-07(A)(2).
Zinc and Free Cyanide
The Ohio EPA risk assessment (Table 12 and Table 13) places zinc and free cyanide in group 3. This
placement, as well as the data in Table 4, Table 5, and Table 6, support that these parameters do not have
the reasonable potential to contribute to WQS exceedances, and limits are not necessary to protect water

Fact Sheet for NPDES Permit Renewal, Mahoning County Boardman WWTP, 2018
Page 14 of 35
quality. Monitoring at a low frequency, e.g. 1/quarter, is recommended to document that these pollutants
continue to remain at low levels.
Cadmium, Chromium, Hexavalent Chromium (Dissolved), Lead, Nickel, and Silver
The Ohio EPA risk assessment (Table 12 and Table 13 places these parameters in group 2. This
placement, as well as the data in Table 4, Table 5, and Table 6, support that these parameters do not have
the reasonable potential to contribute to WQS exceedances, and limits are not necessary to protect water
quality. Monitoring at a low frequency, e.g. 1/quarter, is recommended for cadmium, lead, nickel,
chromium, and hexavalent chromium to document that these pollutants continue to remain at low levels.
Silver monitoring from the previous permit is recommended to be removed.
Dissolved Orthophosphate
Monthly monitoring is for dissolved orthophosphate (as P) is required by ORC 6111.03. This monitoring
is utlized to further develop nutrient datasets for dissolved reactive phosphorus and to assist in stream and
watershed assessments and studies. Ohio EPA monitoring, as well as other in-stream monitoring, are
generally performed via the collection of grab samples. Thus, orthophosphate is proposed to be collected
by grab sample to maintain consistent data to support watershed and stream surveys. The grab sample
must be filtered within 15 minutes of collection using a 0.45-micron filter. The filtered sample must be
analyzed within 48 hours of sample collection.
Whole Effluent Toxicity (WET) Reasonable Potential
Based on evaluating the WET data presented in Table 7 and other pertinent data under the provisions of
OAC 3745-33-07(B), the Boardman WWTP is placed in Category 4 with respect to WET. This placement
indicates that reasonable potential for toxicity is not demonstrated with respect to C. dubia or P. promelas.
Annual chronic toxicity testing, with the determination of acute endpoints, is proposed consistent with the
minimum monitoring requirements contained in OAC 3754-33-07(B)(11).
Additional Monitoring Requirements
Additional monitoring requirements proposed at the final effluent, influent and upstream/downstream stations are
included for all facilities in Ohio and vary according to the type and size of the discharge. In addition to permit
compliance, this data is used to assist in the evaluation of effluent quality and treatment plant performance and
for designing plant improvements and conducting future stream studies.
Sludge
Limits and monitoring requirements proposed for the disposal of sewage sludge by the following management
practices are based on OAC 3745-40: removal to sanitary landfill (Station 3PK00002586) or transfer to another
facility with an NPDES permit (Station 3PK00002588).
OTHER REQUIREMENTS
Compliance Schedule(s)
Bis (2-ethylhexyl) phthalate – A 36-month compliance schedule is proposed for the Boardman WWTP to meet
the new final effluent limitations. Details are in Part I.C of the permit.
Fact Sheet for NPDES Permit Renewal, Mahoning County Boardman WWTP, 2018
Page 15 of 35
Pretreatment Local Limits Review - A 6-month compliance schedule is proposed for the Boardman WWTP to
submit a technical justification for either revising its local industrial user limits or retaining its existing local limits.
Details are in Part I.C of the permit.
Sanitary Sewer Overflow Reporting
Provisions for reporting SSOs are proposed in this permit. These provisions include: the reporting of the system-
wide number of SSO occurrences on monthly operating reports (i.e. Station 3PK00002300); telephone notification
of Ohio EPA and the local health department, and 5-day follow up written reports for certain high risk SSOs; and
preparation of an annual report that is submitted to Ohio EPA and made available to the public. Many of these
provisions were already required under the “Noncompliance Notification”, “Records Retention”, and “Facility
Operation and Quality Control” general conditions in Part III of Ohio NPDES permits.
Operator Certification and Operator of Record
Operator certification requirements have been included in Part II of the permit in accordance with OAC 3745-7.
These rules require the Boardman WWTP to have a Class IV wastewater treatment plant operator in charge of the
sewage treatment plant operations discharging through Outfall 3PK00002001. These rules also require the
permittee to designate one or more operator of record to oversee the technical operation of the treatment works.
Low-Level Free Cyanide Testing
Currently there are three approved methods for free cyanide listed in 40 CFR 136 that have a quantification level
lower than water quality-based effluent limits:
ASTM D7237-10, OIA-1677-09, and ASTM D4282-02. (Note: The use of ASTM D4282-02 requires
supporting documentation that it meets the requirement of a “sufficiently sensitive” test procedure as
defined in 40 CFR 122.44(i)(1)(iv)).
These methods will allow Ohio EPA to make more reliable water quality-related decisions regarding free cyanide.
Because the quantification levels are lower than any water quality-based effluent limits, it will also be possible to
directly evaluate compliance with free cyanide limits.
New NPDES permits no longer authorize the use of method 4500 CN-I from Standard Methods for free cyanide
testing. The new permits require permittees to begin using one of these approved methods as soon as possible. If
a permittee must use method 4500 CN-I during the transition to an approved method, they are instructed to report
the results on their DMR and enter “Method 4500 CN-I” in the remarks section.
Outfall Signage
Part II of the permit includes requirements for the permittee to maintain a permanent sign at Outfall 3PK00002001
to Mill Creek providing information about the discharge. Signage at outfalls is required pursuant to OAC 3745-
33-08(A). Signs are not required at in-plant sampling stations or at outfalls that are not accessible to the public by
land or by recreational use of the water body, e.g. submerged off-shore outfalls.
Part III
Part III of the permit details standard conditions that include monitoring, reporting requirements, compliance
responsibilities, and general requirements.
Fact Sheet for NPDES Permit Renewal, Mahoning County Boardman WWTP, 2018
Page 16 of 35
Storm Water Compliance
The Boardman WWTP has identified storm water outfalls that are subject to the industrial storm water regulations.
Parts IV, V, and VI have been included with the draft permit to ensure that any storm water flows from the facility
site are properly regulated and managed. As an alternative to complying with Parts IV, V, and VI, the Boardman
WWTP may seek permit coverage under the general permit for industrial storm water (permit # OHR000006) or
submit a “No Exposure Certification.” Parts IV, V, and VI will be removed from the final permit if: 1) the
Boardman WWTP submits a Notice of Intent (NOI) for coverage under the general permit for industrial storm
water or submits a No Exposure Certification, 2) Ohio EPA determines that the facility is eligible for coverage
under the general permit or meets the requirements for a No Exposure Certification, and 3) the determination by
Ohio EPA can be made prior to the issuance of the final permit.
Fact Sheet for NPDES Permit Renewal, Mahoning County Boardman WWTP, 2018
Page 17 of 35
Figure 1. Location of Boardman WWTP
Fact Sheet for NPDES Permit Renewal, Mahoning County Boardman WWTP, 2018
Page 18 of 35
Figure 2. Flow Diagram of Boardman WWTP

Fact Sheet for NPDES Permit Renewal, Mahoning County Boardman WWTP, 2018
Page 19 of 35
Figure 3. Solids Handling Diagram of Boardman WWTP

Fact Sheet for NPDES Permit Renewal, Mahoning County Boardman WWTP, 2018
Page 20 of 35
Table 1. Sewage Sludge Removal
Table 2. Average Annual Effluent Flow Rates
Year
Annual Flow (MGD)
50th
Percentile
95th
Percentile
Maximum
Mean
2014 365 3.064 6.0586 13.185 3.5428
2015 365 2.904 6.1876 17.298 3.3552
2016 366 2.707 4.941 9.637 3.0258
2017 365 2.992 6.1672 18.382 3.424
2018 (*) 181 3.634 8.903 23.035 4.5057
MGD = million gallons per day
(*) – Data thru June 2018
Table 3. Sanitary Sewer Overflows
Year No. of Events
2014 1
2017 7
2018 6
Year Dry Tons Removed
(Station 3PK00002586)
2014 580
2015 507.8
2016 675.1
2017 671.83

Fact Sheet for NPDES Permit Renewal, Mahoning County Boardman WWTP, 2018
Page 21 of 35
Table 4. Effluent Characterization Using Self-Monitoring Data
Parameter Season Units
Current Permit
Limits # Obs. Percentiles
Data Range
30 day Daily 50th 95th
Outfall 001
Water Temperature Annual C -- -- 1163 15.9 21.2 6.2-22.4
Dissolved Oxygen Summer mg/L -- 6.0 565 9.1 10.2 7.4-14.3
Dissolved Oxygen Winter mg/L -- 6.0 598 10.7 12.1 7.8-14.8
Total Suspended Solids Annual mg/L 12 18 648 2.2 6.6 0-12.2
Oil and Grease, Hexane Extr Method Annual mg/L -- 10 109 0 6.26 0-26.7
Nitrogen, Ammonia (NH3) Summer mg/L 1.5 2.25 a 312 0.075 0.426 0-3.87
Nitrogen, Ammonia (NH3) Winter mg/L -- -- 336 0.04 0.213 0-2.25
Nitrogen Kjeldahl, Total Annual mg/L -- -- 55 1.52 2.69 0.2-3.35
Nitrite Plus Nitrate, Total Annual mg/L -- -- 54 18.3 24.8 6.09-27.5
Phosphorus, Total (P) Annual mg/L 1.0 1.5 a 222 0.57 1.12 0-2.85
Orthophosphate, Dissolved (as P) Annual mg/L -- -- 19 0.47 0.891 0.15-0.99
Cyanide, Free Annual mg/L -- -- 7 0 0 0-0
Nickel, Total Recoverable Annual µg/L -- -- 18 0 2.65 0-5.58
Silver, Total Recoverable Annual µg/L -- -- 23 0 0 0-0
Zinc, Total Recoverable Annual µg/L -- -- 23 46 69.6 0-76.6
Cadmium, Total Recoverable Annual µg/L -- -- 18 0 0 0-0
Lead, Total Recoverable Annual µg/L -- -- 23 0 0 0-0
Chromium, Total Recoverable Annual µg/L -- -- 18 0 0 0-0
Copper, Total Recoverable Annual µg/L -- -- 23 4.47 14.5 0-29.5
Chromium, Dissolved Hexavalent Annual µg/L -- -- 23 0 0 0-9
Fecal Coliform Annual #/100 ml -- -- 39 208 1520 0-6050
E. coli Annual #/100 ml 161 362 a 279 90 315 0-6130
Bis(2-ethylhexyl) Phthalate Annual µg/L -- -- 18 2 7.15 0-8
Flow Rate Summer MGD -- -- 797 2.67 4.97 1.54-13.2
Flow Rate Winter MGD -- -- 845 3.49 7.21 1.77-23
Flow Rate Annual MGD -- -- 1642 3.02 6.18 1.54-23
Chlorine, Total Residual Annual mg/L -- 0.024 565 0 0 0-0

Fact Sheet for NPDES Permit Renewal, Mahoning County Boardman WWTP, 2018
Page 22 of 35
Parameter Season Units
Current Permit
Limits # Obs. Percentiles
Data Range
30 day Daily 50th 95th
Mercury, Total (Low Level) Annual ng/L -- -- 54 2.93 8.22 0-10.5
Cyanide, Free (Low-Level) Annual µg/L -- -- 47 0 8.4 0-12
Acute Toxicity, Ceriodaphnia dubia Annual TUa -- -- 6 0 0 0-0
Chronic Toxicity, Ceriodaphnia dubia Annual TUc -- -- 6 0 1.28 0-1.71
Acute Toxicity, Pimephales promelas Annual TUa -- -- 4 0 0 0-0
Chronic Toxicity, Pimephales promelas Annual TUc -- -- 4 0 1.11 0-1.31
pH, Maximum Annual S.U. -- 9.0 1163 7 7.2 6.5-7.9
pH, Minimum Annual S.U. -- 6.5 1163 6.9 7.2 6.3-7.9
Residue, Total Filterable Annual mg/L -- -- 16 710 838 0.08-980
CBOD 5 day Summer mg/L 10 15 a 312 3.3 6.4 0-14.1
CBOD 5 day Winter mg/L 10 15 a 336 2.7 5.5 0-13.5
All values are based on unaltered annual records unless otherwise indicated. * = For minimum pH, 5th percentile shown in place of 50th percentile; ** = For dissolved oxygen, 5th
percentile shown in place of 95th percentile; a = weekly average.”

Fact Sheet for NPDES Permit Renewal, Mahoning County Boardman WWTP, 2018
Page 23 of 35
Table 5. Effluent Characterization Using Pretreatment Data
Parameter (µg/l) Sample Date
4/8/2014 4/16/2015 4/6/2016 4/7/2017 4/6/2018
Antimony AA (25) AA (25) AA (15) AA (15) AA (15)
Arsenic AA (25) AA (25) AA (15) AA (15) AA (15)
Beryllium AA (1.5) AA (1.5) AA (1.5) AA (1.5) AA (1.5)
Cadmium AA (5) AA (5) AA (1) AA (1) AA (1)
Chromium AA (5) AA (5) AA (2) AA (2) AA (2)
Copper AA (10) 12.4 8.88 6.01 5.13
Lead AA (15) AA (15) AA (7) AA (7) AA (7)
Mercury AA (0.02) AA (0.15) AA (0.05) AA (0.05) AA (0.05)
Molybdenum -- -- AA (3) AA (3) AA (3)
Nickel AA (10) AA (10) AA (5) AA (5) AA (5)
Selenium AA (25) AA (25) AA (7) AA (7) AA (7)
Silver AA (5) AA (5) AA (5) AA (2) AA (2)
Thallium AA (20) AA (20) AA (5) AA (5) AA (5)
Zinc 35.2 42.8 31.6 25.7 30.5
Bis (2-ethylhexyl)
Phthalate 3.67 16.5 AA (10) 14.0 AA (10)
Table 6. Projected Effluent Quality
Parameter Units
Number of
Samples
Number
> MDL
PEQ
Average
PEQ
Maximum
Ammonia (Summer) mg/L 204 186 0.16065 0.3355
Ammonia (Winter) mg/L 168 143 0.089273 0.18433
Cadmium µg/L 23 0 -- --
Chlorine, Total Residual mg/L 565 0 -- --
Chromium µg/L 23 0 -- --
Hexavalent Chromium (Dissolved) µg/L 23 0 -- --
Copper µg/L 28 26 13.052 21.261
Cyanide, Free mg/L 54 15 0.006 0.01
Lead µg/L 23 0 -- --
Nickel µg/L 23 6 3.0507 5.2818
Nitrate-N + Nitrite-N mg/L 54 54 24.13 32.42
Silver µg/L 28 0 -- --
Zinc µg/L 28 26 65.656 90.529
Bis (2-ethylhexyl) phthalate µg/L 23 13 14.055 23.792
Dissolved Solids mg/L 15 15 872.38 1032.3
Mercury ng/L 54 53 7.7673 12.298 A = DMR data combined with Pretreatment Program data
DMR = Discharge Monitoring Report
MDL = analytical laboratory method detection limit
PEQ = projected effluent quality
Fact Sheet for NPDES Permit Renewal, Mahoning County Boardman WWTP, 2018
Page 24 of 35
Table 7. Summary of Acute and Chronic Toxicity Results
Date Ceriodaphnia Dubia Pimephales promelas
TUa TUc TUa TUc
3/11/2014 AA AA - -
6/3/2014 AA 1.71 - -
8/19/2014 AA AA AA AA
8/7/2015 AA AA AA AA
8/5/2016 AA AA AA AA
8/18/2017 AA AA AA 1.31
TUa = acute toxicity unit
TUc = chronic toxicity unit
AA = non-detection; analytical method detection limit of 0.2 TUa, and 1.0 TUc
Fact Sheet for NPDES Permit Renewal, Mahoning County Boardman WWTP, 2018
Page 25 of 35
Table 8. Use Attainment Status
Location
River
Mile
(Station)
ALU+ IBI MIwba QHEI ICIb Attainment
Status c Causes Sources
Mill Creek @ Columbiana @ St. Rte. 164 H
19.68 (302291)
WWH 42 n/a 62.8 P* NON Other flow regime
alterations Urban runoff/storm
sewers
Mill Creek @ Columbiana @ Old St. Rte. 14 H
18.73 (302292)
WWH 32* n/a 68.8 P* NON Other flow regime
alterations Urban runoff/storm
sewers
Mill Creek West of North Lima @ St. Rte. 165 H
14.93 (302294)
WWH 24* n/a 61.0 LF* NON Natural conditions (flow or habitat); fish passage
barrier
Natural sources; dam or impoundment
Mill Creek South of Boardman @ Western W Reserve Rd.
11.30 (N03S67)
WWH 23* 5.2* 38.0 44 NON Fish passage barrier Dam or impoundment
Mill Creek 0.1 Mi. Upstream Boardman WWTP Outfall W
9.70 (N03S07)
WWH 22* 3.2* 61.5 32ns NON Fish passage barrier Dam or impoundment
Mill Creek 0.1 Mi. Downstream Boardman WWTP Outfall
9.50 (N03S06)
WWH 22* 3.9* 58.0 34 NON Fish passage barrier Dam or impoundment
Mill Creek @ Ford 0.75 Mi. Downstream U.S. 224 W
6.99 (N03W24)
WWH 24* 4.3* 44.8 42 NON Fish passage barrier Dam or impoundment
Mill Creek @ Youngstown
Downstream Newport Lake
@ USGS Gage W
2.59
(N03S03) WWH 22* 3.7* 80.5 30ns NON
Organic enrichment;
biological indicators; fish
passage barrier
Combined sewer
overflows; dam or
impoundment
Mill Creek @ Youngstown @ Slippery Rock Bridge W
1.07 (N03S02)
WWH 22* 5.9* 83.5 34 NON Organic enrichment;
biological indicators; fish passage barrier
Combined sewer overflows; dam or
impoundment
Note: Assessment based on the draft Biological and Water Quality Study of the Lower Mahoning River Watershed, October 2018
^ Letters in superscript refer to the fish site type and associated biocriteria as indicated in the table below: B = boat; W = wading; and H = headwater.
+ - Symbol after use denotes a recommended aquatic life use based on data from this survey.
a - MIwb is not applicable to headwater streams with drainage areas < 20 mi2.

Fact Sheet for NPDES Permit Renewal, Mahoning County Boardman WWTP, 2018
Page 26 of 35
b - An evaluation of the qualitative sample based on attributes such as EPT taxa richness, number of sensitive taxa and community composition was
used when quantitative data was not available or considered unreliable. VP=Very Poor; P=Poor; LF=Low Fair; F=Fair; MG=Marginally Good;
G=Good; VG=Very Good; E=Exceptional.
c - Attainment is given for the proposed aquatic life use when a change is recommended: EWH = Exceptional Warmwater Habitat; WWH = Warmwater
Habitat.
ns - Nonsignificant departure from biocriteria (<4 IBI or ICI units, or <0.5 MIwb units).
* - Indicates significant departure from applicable biocriteria (>4 IBI or ICI units, or >0.5 MIwb units). Underlined scores are in the Poor or Very Poor
range.
Biological
Biological Criteria — Erie-Ontario Lake Plain
Index – Site Type EWH WWH MWH
IBI – Headwaters 50 40 24
IBI – Wading 50 38 24
IBI – Boat 48 40 24
MIwb – Wading 9.4 7.9 6.2
MIwb – Boat 9.6 8.7 5.8
ICI 46 34 22

Fact Sheet for NPDES Permit Renewal, Mahoning County Boardman WWTP, 2018
Page 27 of 35
Table 9. Water Quality Criteria in the Study Area
Outside Mixing Zone Criteria Inside
Average Maximum Mixing
Human Agri- Aquatic Aquatic Zone
Parameter Units Health culture Life Life Maximum
Ammonia (Summer) mg/L -- -- 1.9 -- --
Ammonia (Winter) mg/L -- -- 9.7 -- --
Cadmium µg/L -- 50 4.9 12 24
Chlorine, Total Residual mg/L -- -- 0.011 0.019 0.038
Chromium µg/L -- 100 180 3700 7400
Hexavalent Chromium
(Dissolved) µg/L -- -- 11 16 31
Copper µg/L 1300 500 20 32 64
Cyanide, Free mg/L 220 -- 0.012 0.046 0.092
Lead µg/L -- 100 20 380 750
Nickel µg/L 4600 200 110 990 2000
Nitrate-N + Nitrite-N mg/L -- 100 -- -- --
Silver µg/L -- -- 1.3 7.3 15
Zinc µg/L 69000 25000 250 250 500
Bis(2-ethylhexyl) phthalate µg/L 59c -- 8.4 1100 2100
Dissolved Solids mg/L -- -- 1500 -- --
Mercury A ng/L 12 10000 910 1700 3400 A = Denotes a Bioaccumulative Chemical of Concern (BCC) C = Criteria is based on a carcinogenic endpoint
Fact Sheet for NPDES Permit Renewal, Mahoning County Boardman WWTP, 2018
Page 28 of 35
Table 10. Instream Conditions and Discharger Flows
Parameter Units Season Value Basis
Stream Flows
1Q10 cfs annual 1.7 USGS Station 03098500 (0.1 cfs) + Upstream
WWTP flow (*)
7Q10 cfs annual 1.8 USGS Station 03098500 (0.2 cfs) + Upstream
WWTP flow (*)
30Q10 cfs summer 2.4 USGS Station 03098500 (0.8 cfs) + Upstream
WWTP flow (*)
winter 6.6 USGS Station 03098500 (5.0 cfs) + Upstream
WWTP flow (*)
Harmonic Mean cfs annual 5.8 USGS Station 03098500 (4.2 cfs) + Upstream
WWTP flow (*)
Mixing Assumption % average 100
maximum 100
Hardness, OMZ mg/L annual 241 Station 901; n = 54; 2014-2018; Median Value
Hardness, IMZ mg/L annual 241 Station 901; n = 54; 2014-2018; Median Value
pH S.U. summer 7.2 Station 901; n = 17; 2014-2018; 75th percentile
winter 7.3 Station 901; n = 14; 2014-2018; 75th percentile
Temperature ºC summer 21.9 Station 901; n = 17; 2014-2018;75th percentile
winter 9.05 Station 901; n = 14; 2014-2018; 75th percentile
Mahoning County -
Boardman WWTP flow cfs annual 7.74 NPDES Permit Application
Background Water Quality
Ammonia (Summer) mg/L 0.08 DMR; 2014-2018; n=17; 3<MDL; Station 801;
Median Value
Ammonia (Winter) mg/L 0.05 DMR; 2014-2018; n=14; 3<MDL; Station 801;
Median Value
Cadmium µg/L 0 Ohio EPA; 2013-2014; n=25; 25<MDL; STORET
Stations N03S07, N03S67, 302294; Median Value
Chlorine, Total Residual mg/L 0 No representative data available.
Chromium µg/L 1 Ohio EPA; 2013-2014; n=25; 23<MDL; STORET
Stations N03S07, N03S67, 302294; Median Value
Hexavalent Chromium
(Dissolved) µg/L 0 No representative data available.
Copper µg/L 2 Ohio EPA; 2013-2014; n=25; 11<MDL; STORET
Stations N03S07, N03S67, 302294; Median Value
Cyanide, Free mg/L 0 No representative data available.
Lead µg/L 1 Ohio EPA; 2013-2014; n=25; 19<MDL; STORET
Stations N03S07, N03S67, 302294; Median Value

Fact Sheet for NPDES Permit Renewal, Mahoning County Boardman WWTP, 2018
Page 29 of 35
Nickel µg/L 7.2 Ohio EPA; 2013-2014; n=25; 25<MDL; STORET
Stations N03S07, N03S67, 302294; Median Value
Nitrate-N + Nitrite-N mg/L 2.9 DMR; 2014-2018; n=47; 1<MDL; Station 801;
Median Value
Silver µg/L 0 No representative data available.
Zinc µg/L 11 Ohio EPA; 2013-2014; n=25; 10<MDL; STORET
Stations N03S07, N03S67, 302294; Median Value
Bis(2-ethylhexyl) phthalate µg/L 0 No representative data available.
Dissolved Solids mg/L 504 Ohio EPA; 2013-2014; n=25; 0<MDL; STORET
Stations N03S07, N03S67, 302294; Median Value
Mercury ng/L 0 No representative data available.
(*) 1.6 cfs (Median Value) from City of Columbiana WWTP
USGS = United States Geological Survey
STORET = USEPA STORage and RETrieval database
S.U. = Standard Units
cfs = cubic feet per second
MGD = Million Gallons per Day
Table 11. Summary of Effluent Limits to Maintain Applicable Water Quality Criteria
A Bioaccumulative Chemical of Concern (BCC). WQS must be met at end-of-pipe unless the requirements for an
exclusion are met as listed in 3745-1-06 (N).
Outside Mixing Zone Criteria Inside
Average Maximum Mixing
Human Agri- Aquatic Aquatic Zone
Parameter Units Health culture Life Life Maximum
Ammonia (Summer) mg/L -- -- 2.46 -- --
Ammonia (Winter) mg/L -- -- 17.93 -- --
Cadmium µg/L -- 87 6 15 24
Chlorine, Total Residual mg/L -- -- 0.014 0.023 0.038
Chromium µg/L -- 174 222 4513 7400
Hexavalent Chromium
(Dissolved) µg/L -- -- 14 20 31
Copper µg/L 2273 873 24 39 64
Cyanide, Free mg/L 385 -- 0.015 0.056 0.092
Lead µg/L -- 174 24 463 750
Nickel µg/L 8043 345 134 1206 2000
Nitrate-N + Nitrite-N mg/L -- 173 -- -- --
Silver µg/L -- -- 1.6 8.9 15
Zinc µg/L 120723 43735 306 303 500
Bis(2-ethylhexyl) phthalate µg/L 103 -- 10 1342 2100
Dissolved Solids mg/L -- -- 1732 -- --
Mercury A ng/L 12 10000 910 1700 3400

Fact Sheet for NPDES Permit Renewal, Mahoning County Boardman WWTP, 2018
Page 30 of 35
Table 12. Parameter Assessment
Group 1: Due to a lack of criteria, the following parameters could not be evaluated at this time.
No parameters placed in this group
Group 2: PEQ < 25 percent of WQS or all data below minimum detection limit. WLA not required.
No limit recommended; monitoring optional.
Ammonia (Winter) Cadmium Chlorine, Total Residual
Chromium
Hexavalent Chromium
(Dissolved) Lead
Nickel Nitrate-N + Nitrite-N Silver
Group 3: PEQmax < 50 percent of maximum PEL and PEQavg < 50 percent of average PEL. No
limit recommended; monitoring optional.
Cyanide, Free Zinc
Group 4: PEQmax >= 50 percent, but < 100 percent of the maximum PEL or PEQavg >= 50
percent, but < 100 percent of the average PEL. Monitoring is appropriate.
Copper Dissolved Solids Mercury
Group 5: Maximum PEQ >= 100 percent of the maximum PEL or average PEQ >= 100 percent of
the average PEL, or either the average or maximum PEQ is between 75 and 100 percent of
the PEL and certain conditions that increase the risk to the environment are present. Limit
recommended.
Limits to Protect Numeric Water Quality Criteria
Recommended Effluent Limits
Parameter Units Average Maximum
Bis (2-ethylhexyl) phthalate µg/L 10 1342
PEL = preliminary effluent limit
PEQ = projected effluent quality
WLA = wasteload allocation
WQS = water quality standard

Fact Sheet for NPDES Permit Renewal, Mahoning County Boardman WWTP, 2018
Page 31 of 35
Table 13. Risk Assessment Results
Group 2 - Parameters with PEQ < 25% of WQS
Parameter Units #
obs # > MDL PEQ
Average
WQS % PEQ
Maximum
WQSOMZM %
Ammonia-W mg/L 168 143 0.0893 9.7AL 1 0.184 -- --
Cadmium µg/L 23 0 0 4.9AL 0 0 12 0
Chlorine Total Residual mg/L 565 0 0 0.011AL 0 0 0.019 0
Chromium µg/L 23 0 0 100Ag 0 0 3700 0
Chromium VI - Diss µg/L 23 0 0 11AL 0 0 16 0
Lead µg/L 23 0 0 20AL 0 0 380 0
Nickel µg/L 23 6 3.05 110AL 3 5.28 990 1
Nitrate-N + Nitrite-N mg/L 54 54 24.1 100Ag 24 32.4 -- --
Silver µg/L 28 0 0 1.3AL 0 0 7.3 0
Group 3 - Parameters with PEQ < 50% of PEL
Parameter Units #
obs # > MDL PEQ
Average
WQS % PEQ
Maximum
WQSOMZM %
Cyanide - free mg/L 54 15 0.006 0.015AL 40 0.01 0.056 18
Zinc µg/L 28 26 65.7 306AL 21 90.5 303 30
Group 4 - Monitoring Required - Parameters with PEQ ≥ 50%, but < 100% of PEL
Parameter Units #
obs # > MDL PEQ
Average
WQS % PEQ
Maximum
WQSOMZM %
Copper µg/L 28 26 13.1 24AL 54 21.3 39 55
Dissolved solids (ave) mg/L 15 15 872 1732AL 50 1030 -- --
Mercury (BCC) ng/L 54 53 7.77 12HH 65 12.3 1700 1
Group 5 - Limits and monitoring required. Parameters with PEQ ≥ 100% of PEL or PEQ ≥ 75% of
PEL and certain conditions are met
Parameter Units #
obs # > MDL PEQ
Average
WQS % PEQ
Maximum
WQSOMZM %
Bis(2-ethylhexyl)
phthalate µg/L 23 13 14.1 10AL 141 23.8 1342 2
1 = The average criteria are protective of long-term conditions. The letters next to the WQS/PEL indicate the most restrictive
standard. Water uses to protect include:
Ag = Agricultural or Industrial Water Supply HH = Human Health
AL = Aquatic Life WL = Wildlife
2 = The maximum criteria are protective of short-term toxicity to aquatic life.
OMZM = Outside Mixing Zone Maximum
IMZM = Inside Mixing Zone Maximum - More restrictive than OMZM in situations where dilution is available
Fact Sheet for NPDES Permit Renewal, Mahoning County Boardman WWTP, 2018
Page 32 of 35
Other Abbreviations / Acronyms:
BCC = Bioaccumulative Chemical of Concern PEL = Preliminary Effluent Limit
MDL = Method Detection Limit PEQ = Projected Effluent Quality
obs = Observations (i.e., sampling events) WQS = Water Quality Standard

Fact Sheet for NPDES Permit Renewal, Mahoning County Boardman WWTP, 2018
Page 33 of 35
Table 14. Final Effluent Limits for Outfall 3PK00002001
Parameter
Units
Concentration Loading (kg/day)a
Basisb 30 Day
Average
Daily
Maximum
30 Day
Average
Daily
Maximum
Water Temperature °C - - - - - - - - - - - Monitor - - - - - - - - - - - - Mc
Dissolved Oxygen mg/L 6.0 min PD
Total Suspended Solids mg/L 12 18 d 229 343 d PD
Oil & Grease mg/L -- 10 -- -- WQS
Ammonia (as N) - Summer mg/L 1.5 2.25 d 28 43 d PD
Ammonia (as N) - Winter mg/L - - - - - - - - - - - Monitor - - - - - - - - - - - - Mc/BTJ
Total Kjeldahl Nitrogen mg/L - - - - - - - - - - - Monitor - - - - - - - - - - - - Mc/BTJ
Nitrate+Nitrite (as N) mg/L - - - - - - - - - - - Monitor - - - - - - - - - - - - Mc/BTJ
Phosphorus, Total mg/L 1.0 1.5 d 19 29 d PD
Orthophosphate, Dissolved (as P) mg/L - - - - - - - - - - - Monitor - - - - - - - - - - - - SB1
Cyanide, Free µg/L - - - - - - - - - - - Monitor - - - - - - - - - - - - Mc/BTJ
Nickel µg/L - - - - - - - - - - - Monitor - - - - - - - - - - - - Mc/BTJ
Zinc µg/L - - - - - - - - - - - Monitor - - - - - - - - - - - - Mc/BTJ
Cadmium µg/L - - - - - - - - - - - Monitor - - - - - - - - - - - - Mc/BTJ
Lead µg/L - - - - - - - - - - - Monitor - - - - - - - - - - - - Mc/BTJ
Chromium µg/L - - - - - - - - - - - Monitor - - - - - - - - - - - - Mc/BTJ
Copper µg/L - - - - - - - - - - - Monitor - - - - - - - - - - - - RP
Hexavalent Chromium µg/L - - - - - - - - - - - Monitor - - - - - - - - - - - - Mc/BTJ
E. coli #/100mL 126 284 d -- -- WQS
Chlorine, Total Residual mg/L -- 0.023 -- -- WQS
Bis (2-ethylhexyl) phthalate µg/L 10 1342 0.19 25.4 RP/WLA
Flow Rate MGD - - - - - - - - - - - Monitor - - - - - - - - - - - - Mc
Mercury ng/L - - - - - - - - - - - Monitor - - - - - - - - - - - - RP
Residue, Total Filterable mg/L - - - - - - - - - - - Monitor - - - - - - - - - - - - RP
Carbonaceous Biochemical
Oxygen Demand (5 day) mg/L 10 15 d 189 284 d PD
pH S.U. 6.5 min- 9.0 max -- -- WQS
Acute Toxicity, Ceriodaphnia
dubia TUa - - - - - - - - - - - Monitor - - - - - - - - - - - - WET
Acute Toxicity, Pimephales
promelas TUa - - - - - - - - - - - Monitor - - - - - - - - - - - - WET
Chronic Toxicity, Ceriodaphnia
dubia TUc - - - - - - - - - - - Monitor - - - - - - - - - - - - WET
Chronic Toxicity, Pimephales
promelas TUc - - - - - - - - - - - Monitor - - - - - - - - - - - - WET
a Effluent loadings based on average design discharge flow of 5.0 MGD. b Definitions: BTJ = Best Technical Judgment
Fact Sheet for NPDES Permit Renewal, Mahoning County Boardman WWTP, 2018
Page 34 of 35
M = Division of Surface Water NPDES Permit Guidance 1: Monitoring frequency requirements for Sanitary Discharges
PD = Plant Design (OAC 3745-33-05(E))
RP = Reasonable Potential for requiring water quality-based effluent limits and monitoring requirements in permits
(OAC 3745-33-07(A))
SB1 = Implementation of Senate Bill 1 [ORC 6111.03]
WET = Whole Effluent Toxicity (OAC 3745-33-07(B))
WLA = Wasteload Allocation procedures (OAC 3745-2)
WQS = Ohio Water Quality Standards (OAC 3745-1)
c Monitoring of flow and other indicator parameters is specified to assist in the evaluation of effluent quality and treatment plant
performance.
d 7-day average limit.

Fact Sheet for NPDES Permit Renewal, Mahoning County Boardman WWTP, 2018
Page 35 of 35
Addendum 1. Acronyms
ABS Anti-backsliding
BPJ Best professional judgment
CFR Code of Federal Regulations
CMOM Capacity Management, Operation, and Maintenance
CONSWLA Conservative substance wasteload allocation
CSO Combined sewer overflow
CWA Clean Water Act
DMR Discharge Monitoring Report
DMT Dissolved metal translator
IMZM Inside mixing zone maximum
LTCP Long-term Control Plan
MDL Analytical method detection limit
MGD Million gallons per day
NPDES National Pollutant Discharge Elimination System
OAC Ohio Administrative Code
Ohio EPA Ohio Environmental Protection Agency
OMZM Outside mixing zone maximum
ORC Ohio Revised Code
ORSANCO Ohio River Valley Water Sanitation Commission
PEL Preliminary effluent limit
PEQ Projected effluent quality
PMP Pollution Minimization Program
PPE Plant performance evaluation
SSO Sanitary sewer overflow
TMDL Total Daily Maximum Load
TRE Toxicity reduction evaluation
TU Toxicity unit
U.S. EPA United States Environmental Protection Agency
WET Whole effluent toxicity
WLA Wasteload allocation
WPCF Water Pollution Control Facility
WQBEL Water-quality-based effluent limit
WQS Water Quality Standards
WWTC Wastewater Treatment Plant