factbook october 2011
TRANSCRIPT

FACTS
The Hershey CompanyInvestor Relations Department100 Crystal A Drive, P.O. Box 810 Hershey, PA 17033-0810Internet: www.hersheys.com
Contacts:
Matthew F. MillerInvestor Relations ManagerTele: (717) 534-7554Fax: (717) 534-6550E-mail: [email protected]
Prepared by:
Mark K. PogharianVice President, Investor RelationsTele: (717) 534-7556Fax: (717) 534-6550E-mail: [email protected]

The Hershey Company
Fact Book Table of Contents
Page(s) Mission Statement 3
Acquisition/Divestiture Summary 4
Key Corporate Events 5-24
Financial Data
Summary of Statements of Income - GAAP: 2011 & 2010 25 Summary of Statements of Income - Pro Forma: 2011 & 2010 26
Six-Year Consolidated Financial Summary 27 Quarterly Performance (2010, 2009 & 2008) 28 2002 – 2010 GAAP & Non-GAAP Annual EPS 29 Capitalization 30
Financing Arrangements 31 Long Term Financial Objectives 32 Capital Expenditures 33 Depreciation 33 Cash Flow Analysis 34 Share Repurchases 35-36 Economic-ROIC 37 HSY Stock Statistics 38-39
Key Management Hershey Executive Team 40
Operations U.S. Confectionery Industry 41-43 U.S. Market Share 44-45
U.S. Classes of Trade 46 U.S. Snack Market 46 Hershey Products 47-48
Hershey Canada 49-51 Hershey International 52-53 Commodities Cocoa 54-55 Sugar 56 Hershey Manufacturing and Distribution 57

The Hershey Company
What it means to stakeholders
Delivering quality consumer-driven confectionery experiences for all occasions
Winning with an aligned and empowered organization…while having fun
Building collaborative relationships for profitable growth with our customers, suppliers and partners
Creating sustainable value
Consumers
Employees
Business Partners
Shareholders
Communities
Honoring our heritage through continued commitment to making a positive difference
Page 3

The Hershey Company
Page 4
DATE ACQUISITIONS (DIVESTITURES) REFERENCE
JUL 1963 H.B. Reese Candy Co. page 5
JUN 1966 San Giorgio Macaroni, Inc. - pasta page 5
SEP 1966 Delmonico Foods, Inc. - pasta page 5
DEC 1967 Cory Corporation page 5
JAN 1969 Nacional de Dulces - 50% equity interest page 5
MAY 1970 Portion Control Industries page 6
OCT 1974 Chadler Industrial du Bahia S.A. page 6
FEB 1977 AB Marabou -initial investment page 6
JUN 1977 (L.D. Properties Corporation) page 6
NOV 1977 Y&S Candies page 7
APR 1978 Procino-Rossi Corporation - pasta page 7
JAN 1979 Skinner Macaroni Company - pasta page 7
JAN 1979 Friendly Ice Cream Corporation page 8
JAN 1979 Codipra and Petybon - 40% equity interest page 7
SEP 1981 Philippine Cocoa Corporation page 9
NOV 1984 American Beauty Macaroni Company - pasta page 10
SEP 1985 Franklin's Restaurants Inc. page 8
NOV 1985 (Cory Food Service & Cory Canada Inc.) page 5
JUL 1986 Idlenot Farm Restaurants page 8
OCT 1986 (Chadler Industrial du Bahia S.A.) page 6
OCT 1986 The Dietrich Corporation (Ludens) page 10
DEC 1986 G&R Pasta Company - pasta page 10
DEC 1986 Litchfield Farm Shops page 8
JUN 1987 Nabisco Brands Ltd. -Canadian confectionery business page 11
AUG 1988 Cadbury's U.S. confectionery business page 11
SEP 1988 (Friendly Ice Cream Corporation) page 11
FEB 1990 Ronzoni Foods Corporation page 12
MAY 1990 (AB Marabou -sold interest) page 6
MAY 1991 Gubor Schokoladen - German confectionery page 12
MAY 1991 Dairymen's - aseptic drink business page 12
OCT 1991 Nacional de Dulces - remaining 50% equity page 12
FEB 1992 (Queen Anne, Inc) page 12
APR 1992 (Hershey do Brazil Participacoes including Petybon) page 13
MAY 1992 Freia Marabou A.S. - 18.6% interest page 13
OCT 1992 (Freia Marabou A.S. - 18.6% interest) page 13
JAN 1993 Hershey Japan Co. - remaining interest page 13
MAR 1993 Ideal / Mrs. Weiss - pasta page 13
SEP 1993 Sperlari -Italian sugar confectionery business page 13
OCT 1993 Overspecht BV - OZF Jamin- Dutch confectionery page 14
JUN 1995 (Overspecht BV - OZF Jamin- Dutch confectionery) page 14
DEC 1995 Henry Heide - confectionery page 15
JAN 1996 (Hershey Canada's Planters and Lifesavers businesses) page 15
FEB 1996 Kneisl Schokoladen GmbH - German confectionery page 15
DEC 1996 Leaf North America page 15
DEC 1996 (Gubor Schokoladen - German confectionery) page 15
DEC 1996 (Sperlari -Italian sugar confectionery business) page 15
JUN 1997 (Ford Gum and Machine Co., and Carousel Brands) page 16
JAN 1999 (Hershey's Pasta businesses) page 16
NOV 1999 (Dairymen's - aseptic drink business) page 16
DEC 2000 Nabisco - mints and gum businesses page 17
AUG 2001 Visagis - Brazilian confectioner page 17
SEP 2001 (Luden's Throat Drops business) page 17
JUN 2002 (Heide and certain other non-chocolate brands) page 17
AUG 2003 (Certain gum brands including Fruit Stripe, Rain-Blo and Super Bubble) page 18
OCT 2004 Grupo Lorena page 18
DEC 2004 Mauna Loa Macadamia Nut Corporation page 18
AUG 2005 Artisan Confections Company formed: Scharffen Berger; Joseph Schmidt page 19
OCT 2006 Dagoba Organic Chocolate, LLC page 20
APR 2007 Godrej Beverages & Foods, Ltd. page 22
MAY 2007 Lotte Confectionery Co., LTD page 23
FEB 2009 Van Houten (Asia) page 23
JAN 2012 Brookside Foods, LTD page 24
Items in bold represent acquisitions by Hershey which were not divested.

The Hershey Company
Page 5
Business Description The Hershey Company (originally Hershey Chocolate Corporation) was organized under the laws of the State of Delaware on October 24, 1927, as a successor to a business founded in 1894 by Milton S. Hershey. The Hershey Company and its subsidiaries are engaged in the manufacture, distribution and sale of consumer food products. The Company produces and distributes a broad line of chocolate, confectionery, and chocolate-related grocery products. Key Corporate Events Key corporate events include the following: (1) On April 15, 1961, construction began on a chocolate-manufacturing facility for Hershey
Chocolate of Canada Ltd. in Smiths Falls, Ontario. The plant was completed in June 1963. (2) In June 1963, the H. B. Reese Candy Co. and subsidiary Reeco, Inc. of Hershey, Pennsylvania,
were acquired for 666,361 shares of Hershey common stock. (3) In June 1966, the Company acquired San Giorgio Macaroni, Inc., Lebanon, Pennsylvania. In
September of the same year, a 90-percent interest in Delmonico Foods, Inc., Louisville, Kentucky was acquired. Subsequently the remaining 10 percent was acquired, and in January 1975, Delmonico Foods was merged into San Giorgio Macaroni, Inc.
(4) In December 1967, Cory Corporation of Chicago, Illinois, was acquired for $26.3 million. In
January 1975, Cory Coffee Service Plan, Inc. was merged into Cory Corporation and the name was changed to Cory Food Services, Inc. Cory provides a coffee and allied products service plan to office locations and small business concerns in the United States and Canada.
On November 22, 1985, the Company sold Cory Food Services, Inc. and Cory Canada Inc., two
wholly-owned subsidiaries, to ARA Services, Inc.of Philadelphia, Pennsylvania. Terms of the cash transaction were not disclosed. An after-tax loss on the disposal of the two subsidiaries in the amount of $7.0 million was recorded in the third quarter ended September 29, 1985.
(5) In January 1969, the Company acquired a 50-percent interest in Nacional de Dulces, S.A. de
C.V., a joint-venture company in Mexico, for approximately $1.0 million.
Not adjusted for the two-for-one stock split effective June 15, 2004, the two-for-one stock split effective September 13, 1996, or the three-for-one stock split effective September 15, 1986.

The Hershey Company
Page 6
On October 8, 1991, Hershey International, a division of The Hershey Company, purchased the
outstanding shares of Nacional de Dulces, S.A. de C.V. from its joint- venture partner, Grupo Carso, S.A. de C.V. for $10.0 million. Nacional de Dulces, a Mexican corporation, has its main offices and manufacturing plant in Guadalajara, Mexico. It produces and markets chocolate products in the Mexican market under the Hershey’s brand name. Subsequent to the acquisition, Nacional de Dulces was renamed Hershey Mexico.
(6) In January 1970, the Company began U.S. distribution of Kit Kat chocolate wafer bars for
Rowntree Mackintosh of England. In July 1971, another Rowntree Mackintosh product, Rolo caramels in milk chocolate, was added to the Hershey line. In January 1973, production of Kit Kat bars began at the Reese plant in Hershey, Pennsylvania. U.S. production of Rolo began at the Main Hershey plant in 1978.
(7) In May 1970, Portion Control Industries, Inc., Chicago, Illinois, was acquired for an issue of
500,000 shares of preferred stock. The operation was discontinued in 1975. (8) In 1974, the Company acquired a 22.5-percent interest in Chadler Industrial da Bahia S. A., a
cocoa processor in Salvador, Bahia, Brazil.
In October 1986, the Company sold its 22.5-percent interest in Chadler Industrial de Bahia. The sales price approximated the Company’s investment.
(9) In February 1977, a 17.1-percent equity interest was acquired in AB Marabou, a chocolate and confectionery company located in Sundbyberg, Sweden, for $3.8 million. In mid-1984, the Company purchased for $1.7 million an additional interest in AB Marabou in order to maintain its 17.1-percent equity interest.
On May 23, 1990, the Company sold its shares of AB Marabou to Orkla Borregaard A.S., of
Oslo, Norway, for $78 million. The transaction resulted in a one-time, after-tax gain of $35.3 million.
On May 5, 1992, the Company acquired an 18.6-percent interest in Freia Marabou A.S., the
leading Scandinavian chocolate, confectionery and snack food company. The interest was purchased from Orkla a.s, a diversified Norwegian company, for approximately $180 million. On October 27, 1992, the Company withdrew its bid to acquire Freia Marabou A.S. and tendered its 18.6-percent interest to a subsidiary of Philip Morris Companies Inc. The Company recorded a gain on the sale of its interest in Freia Marabou in March 1993. The sale resulted in a pre-tax gain of $80.6 million and had the effect of increasing net income by $40.6 million.
(10) In June 1977, the Company sold for $20 million the real estate and operating equipment of L. D. Properties Corporation, a wholly-owned subsidiary engaged in almond growing in California for an after-tax gain of $5.3 million.

The Hershey Company
Page 7
(11) In November 1977, Y&S Candies Inc. of Lancaster, Pennsylvania, a manufacturer of licorice-
type products, was acquired for 701,982* shares of Hershey Common Stock in a pooling-of-interests transaction. On January 5, 1982, Y & S Candies was merged into The Hershey Company.
(12) In April 1978, the Company acquired the net assets of Procino-Rossi Corporation, a regional
pasta manufacturer in Auburn, New York. (13) On January 3, 1979, the Company, in a pooling-of-interests transaction, acquired all of the
outstanding shares of common stock of Skinner Macaroni Company of Omaha, Nebraska, in exchange for 398,680 shares of Hershey’s Common Stock. Skinner’s products are sold through the Southwest, Southeast, Midwest and some western states. In early 1980, Skinner was merged into San Giorgio Macaroni, Inc. to form San Giorgio-Skinner, Inc. On January 5, 1982, San Giorgio-Skinner, Inc. was merged into the Company to form San Giorgio-Skinner Company, an operating division of the Company. Subsequent to the acquisition of the American Beauty brand in 1984, this operating division was renamed Hershey Pasta Group. See page 10, #22.
(14) In January 1979, the Cormpany acquired a 40-percent interest in Codipra and Petybon, joint-
venture companies with Matarazzo Food Group in Brazil, for $7.5 million. The Company purchased the remaining 60-percent interest of its joint venture with Matarazzo in 1982 at a cost of $13.0 million. Petybon manufactures pasta, biscuit and margarine products. Codipra, which sold and distributed these products, and Petybon were combined into one entity, Petybon S.A. In December 1986, an agreement was reached to establish a joint venture in Brazil with the Bunge Born Group and to merge its pasta operations into Petybon. Hershey owned 45.0 percent of that business combination. In June 1990, the Company’s ownership changed from 45.0 percent to 41.7 percent.
In April 1992, the Company completed the sale of Hershey do Brasil Participacoes, a holding
company which owned a 41.7-percent equity interest in Petybon S.A., to the Bunge Born Group for approximately $7.0 million. Petybon S.A., located in Brazil, is a producer of pasta, biscuits and margarine products. The sale resulted in a modest pre-tax gain and a reduction in the effective income tax rate during the second quarter of 1992.
Not adjusted for the two-for-one stock split effective June 15, 2004, the two-for-one stock split effective September 13, 1996, the three-for-one stock split effective September 15, 1986, or the two-for-one stock split effective September 15, 1983.

The Hershey Company
Page 8
(15) During January 1979, the Company acquired for cash substantially all of the outstanding
Common Stock of Friendly Ice Cream Corporation, of Wilbraham, Massachusetts, and Friendly became a wholly-owned subsidiary through a merger effective April 9, 1979. The total acquisition cost was approximately $164.0 million.
On September 30, 1985, Friendly Ice Cream Corporation purchased the stock of Franklin’s
Restaurants, Inc. for $3.0 million, and the Company assumed and immediately retired $3.5 million of Franklin’s debt. Franklin’s consisted of twelve full-service family restaurants located in northeastern Pennsylvania.
On July 14, 1986, Friendly Ice Cream Corporation acquired the Idlenot Farm Restaurant chain of
Springfield, Vermont for $3.4 million. Idlenot was a chain of 12 family-style restaurants located in Vermont, New Hampshire and New York.
On December 29, 1986, Friendly Ice Cream Corporation acquired Litchfield Farm Shops, Inc. of
Waterbury, Connecticut. Litchfield consisted of 23 family-style restaurants operating in Connecticut.
On September 2, 1988, the Company sold Friendly Ice Cream Corporation, its wholly-owned
subsidiary, to Tennessee Restaurant Company. The total amount received for Friendly’s stock, a convenant not to compete and a trademark license was $375 million. An after-tax gain in the amount of $53.4 million was recorded in the third quarter ended October 4, 1988.
(16) On August 7, 1979, the Company announced that it entered into exclusive Agent-Importer,
Trademark License and Technical Assistance Agreements with Fujiya Confectionery Co., Ltd. of Tokyo, Japan. Under those agreements, Fujiya imported, manufactured and sold Hershey’s products in the Japanese market. Fujiya is a leading manufacturer of chocolate and confectionery products, snack foods, beverages, ice cream and bakery products. It also owns and operates a chain of restaurants and coffee shops.
On July 12, 1989, the Company signed a joint-venture agreement with Fujiya Co., Ltd. of Tokyo,
to establish a new confectionery company in Japan. The new company, Hershey Japan Co. Ltd., which is headquartered in Tokyo, markets, sells and distributes Hershey’s chocolate and confectionery products in the Japanese market. This new agreement incorporated and expanded upon the agreement established on August 7, 1979.
In January 1993, the Company purchased the remaining outstanding shares of Hershey Japan
Co., Ltd., owned by its joint-venture partner.

The Hershey Company
Page 9
n Stock.
(17) In October 1980, the Company began the construction of a major confectionery manufacturing
facility in Stuarts Draft, Virginia, to support its new products program. The new plant was completed in October 1982, on schedule and within budget. The cost of the basic plant and equipment was approximately $86 million.
(18) On February 20, 1981, the Company entered into an exclusive licensing agreement with
Philippine Cocoa Corporation for the manufacture of Hershey’s products in that country. This agreement was for an initial five-year term and licensed the use of trademarks and manufacturing technology. The Company purchased a 30-percent equity interest in Philippine Cocoa Corporation in September 1981, which was increased to a 33.3-percent interest in 1986.
(19) On November 18, 1981, the Company offered 1.5 million* shares of Common Stock to the
public at $37 per share. The net proceeds from the sale of the Common Stock, $53,145,000, were added to the general funds of the Corporation to meet capital expenditure and working capital requirements.
(20) On August 2, 1983, the Company declared a two-for-one split of the Company’s Common Stock
effective September 15, 1983, to stockholders of record August 24, 1983. Prior stock splits include a three-for-one split effective September 16, 1947, and a five-for-one split effective March 27, 1962.
(21) On October 9, 1984, stockholders approved a proposal to increase the number of authorized
shares of Hershey’s capital stock from 52 million to 230 million; 150 million shares were designated as Common Stock, 75 million shares as Class B Common Stock and 5 million as Preferred Stock, each class having a par value of one dollar per share. Holders of the Common Stock are entitled to one vote per share and a cash dividend 10 percent higher than the cash dividend on the Class B Common Stock, while holders of the Class B Common Stock are entitled to ten votes per share. Holders of the Common Stock, voting separately as a class, elect one-sixth of the Board of Directors.
In an exchange offer completed on November 29, 1984, Hershey stockholders were given the
opportunity to exchange their shares of Common Stock for shares of the new Class B Common Stock on a one-for-one basis. In the offer, 5,102,002** shares of Common Stock were exchanged for Class B Common Stock shares. The Hershey Trust Company, Trustee for Milton Hershey School, the Company’s majority stockholder, exchanged 5,051,001** shares of the Common Stock for Class B Commo
Not adjusted for the two-for-one stock split effective June 15, 2004, the two-for-one stock split effective September 13, 1996, the three- for-one stock split effective September 15, 1986, or the two-for-one stock split effective September 15, 1983. **Not adjusted for the two-for-one stock split effective June 15, 2004, the two-for-one stock split effective September 13, 1996, or the three-for-one stock split effective September 15, 1986.

The Hershey Company
Page 10
(22) On November 16, 1984, the Company purchased for cash the inventory, buildings, land,
machinery and equipment, trademarks and certain other intangible assets of American Beauty (a division of The Pillsbury Company) for approximately $56 million and assumed certain liabilities. The acquisition was accounted for as a purchase. American Beauty produces a full line of consumer branded, dry pasta products distributed primarily in the central, southwestern and western United States.
(23) In 1984, the Company entered into a Technical Assistance and Know How and Trademark
License Agreement with Hai-Tai Confectionery Co., Ltd., of Seoul, Korea. Pursuant to that Agreement, Hai Tai manufactures and sells in the Korean market certain of the Corporation’s chocolate and confectionery products.
(24) On August 5, 1986, the Company declared a three-for-one split of Hershey’s Common Stock and
Class B Common Stock effective September 15, 1986, to stockholders of record August 22, 1986. See Page 9, #20 for prior stock splits.
(25) On October 27, 1986, the Company purchased the confectionery operations of The Dietrich
Corporation for approximately $100 million plus an amount equal to acquired cash and short-term investments. The purchase included Luden’s, maker of Luden’s throat drops, 5th Avenue candy bar, and Luden’s Mellomints candy mints; and Queen Anne, a producer of chocolate-covered cherries. The Luden’s plant is located in Reading, Pennsylvania.
In February 1992, the Company sold the Queen Anne business to Portland Food Products
Company, Portland, Oregon. (26) On November 14, 1986, a secondary offering of 5,175,000*** shares of Hershey Common Stock
by the Company’s largest stockholder, Hershey Trust Company, as Trustee for Milton Hershey School, was completed. In a concurrent, separate transaction, the Company purchased 3,825,000*** of its Common Stock shares from Hershey Trust Company. The acquired shares were retired and became authorized and unissued shares of Common Stock.
(27) On December 19, 1986, the Company acquired G&R Pasta Company, Inc. G&R produces a line
of dry gourmet pasta items under the Pastamania trademark. The products are distributed primarily through specialty and health food stores in the Philadelphia area.
In July 1992, the Company sold the assets of G&R Pasta Company to the Seimer Milling
Company of Tuetopolis, Illinois.
***Not adjusted for the two-for-one stock split effective June 15, 2004, or the two-for-one stock split effective September 13, 1996.

The Hershey Company
Page 11
(28) On April 27, 1987, stockholders approved a proposal to increase the number of authorized shares
of Hershey’s Common Stock from 150 million to 450 million shares. The authorized Class B Common Stock and Preferred Stock remained unchanged at 75 million shares and 5 million shares, respectively.
(29) On June 29, 1987, Hershey Canada Inc., a wholly-owned subsidiary of the Company, purchased
the assets and trademark rights of Nabisco Brands Ltd.’s Canadian confectionery and snack nut businesses. These businesses included candy sold under the brands Oh Henry! and Lowney, hard roll candy sold under the brand names Life Savers and Breath Savers, peanuts and other nuts sold under the brand name Planter’s, chocolate chips sold under the brand name Chipits, boxed chocolates sold under the Moirs brand name, and gum and chewy candy sold under the Care*Free and Bubble Yum brands. In 1986 these businesses had sales of approximately $135 million U.S.
The purchase price was approximately $162 million U.S., and the assets purchased included
land, land improvements, buildings, fixtures, furnishings, machinery and equipment, inventory, working capital, trademarks and software, and other assets used in the operation of purchased businesses. The Care*Free and Bubble Yum businesses were sold in November 1988, and the Planter’s, Life Savers, and Breath Savers businesses were sold in January 1996. See page 13, #53.
(30) On August 25, 1988, the Company purchased the U.S. confectionery operations of Cadbury
Schweppes plc. Cash consideration was $284.5 million plus the assumption of $30 million in debt. Plant locations involved in this transaction included facilities in Hazleton and York, Pennsylvania, as well as Naugatuck, Connecticut. The York plant was closed in January 1989, and operations were transferred to the Luden’s plant in Reading, Pennsylvania.
In addition to the purchase by The Hershey Company of Cadbury’s U.S. operating assets, the
parties entered into licensing arrangements under which Hershey is manufacturing, marketing and distributing Cadbury’s U.S. confectionery brands including Peter Paul Mounds, Peter Paul Almond Joy, York peppermint pattie, and the Cadbury label items including Dairy Milk, Fruit & Nut, Caramello and Creme Eggs. In 1987, Cadbury’s U.S. confectionery sales were approximately $300 million.
(31) On September 2, 1988, the Company sold Friendly Ice Cream Corporation, its wholly-owned
subsidiary, to Tennessee Restaurant Company. The total amount received for Friendly’s stock, a covenant not to compete and a trademark license was $375 million. An after-tax gain in the amount of $53.4 million was recorded in the third quarter ended October 4, 1988.

The Hershey Company
Page 12
(32) On February 12, 1990, the Company purchased all of the outstanding voting securities of
Ronzoni Foods Corporation from Kraft General Foods, Inc., for $78.2 million, plus the assumption of $3.7 million in debt. The purchase included Ronzoni’s dry pasta, pasta sauces and cheese businesses. The acquired businesses had sales of approximately $85 million in 1989.
(33) In March 1990, the Company signed a licensing agreement with Japan’s largest dairy products
company, Snow Brand Milk Products Co., Ltd. Snow Brand has been licensed to use the Hershey’s Trademark on all products in the cocoa-based ice cream and beverage categories.
(34) On January 9, 1991, the Company announced that it had recorded a one-time charge during the
fourth quarter of 1990 related to the modernization and relocation of certain manufacturing operations. The after-tax amount of the charge was approximately $15 million or $.17* per share.
(35) On May 2, 1991, the Company completed the purchase of the Gubor Schokoladen business of H.
Bahlsens Keksfabrik KG, a German company, for $31.9 million, plus the assumption of $9.0 million in debt. Gubor operates two manufacturing plants in Germany and produces and markets high quality, assorted pralines and seasonal chocolates under the Gubor brand name. Branded sales of Gubor in 1990 were approximately DM100 million (approximately $65 million U.S. at 1990 exchange rates), with total sales, including chocolate coatings, reaching DM155 million (approximately $100 million U.S.). The acquisition was effective as of January 1, 1991. The business was divested December 30, 1996.
(36) In May 1991, the Company purchased certain assets of Dairymen, Inc.’s ultra-high temperature
fluid milk-processing business, including a Savannah, Georgia manufacturing facility for $2.2 million, plus the assumption of $8.5 million debt.
(37) On October 8, 1991, Hershey International, a division of The Hershey Company, purchased the
outstanding shares of Nacional de Dulces, S.A. de C.V. from its joint venture partner, Grupo Carso, S.A. de C.V. for $10.0 million. Nacional de Dulces, a Mexican corporation, has its main offices and manufacturing plant in Guadalajara, Mexico. It produces and markets chocolate products in the Mexican market under the Hershey’s brand name. Subsequent to the acquisition, Nacional de Dulces was renamed Hershey Mexico. See page 5, #5.
(38) On February 13, 1992, the Company sold the Queen Anne chocolate-covered cherries business
to Portland Foods Products Company of Portland, Oregon.
*Not adjusted for the two-for-one stock split effective June 15, 2004, or the two-for-one stock split effective September 13, 1996.

The Hershey Company
Page 13
(39) In April 1992, the Company completed the sale of Hershey do Brasil Participacoes, a holding
company which owned a 41.7-percent equity interest in Petybon S.A., to the Bunge Born Group for approximately $7.0 million. Petybon S.A., located in Brazil, is a producer of pasta, biscuits and margarine products. The sale resulted in a modest pre-tax gain and a reduction in the effective income tax rate during the second quarter of 1992. See page 7, #14.
(40) In May 1992, the Company acquired an 18.6-percent interest in Freia Marabou a.s from Orkla
a.s, a diversified Norwegian company for approximately $180 million. Freia Marabou is the leading Scandinavian chocolate, confectionery and snack food company. The investment was accounted for under the cost method. See page 6, #9.
On October 27, 1992, the Company withdrew its bid to acquire Freia Marabou a.s and tendered
its 18.6-percent interest to a subsidiary of Philip Morris Companies Inc. The Company recorded a gain on the sale of its interest in Freia Marabou in March 1993. The sale resulted in a pre-tax gain of $80.6 million and had the effect of increasing net income by $40.6 million. See page 6, #9.
(41) In January 1993, the Company purchased the remaining outstanding shares of Hershey Japan
Co., Ltd. (“Hershey Japan”), owned by its joint-venture partner, Fujiya. Hershey Japan imports, markets, sells and distributes selected Hershey’s chocolate and confectionery products in the Japanese market.
(42) In March 1993, the Company purchased certain assets of the Ideal Macaroni Company and the
Mrs. Weiss Noodle Company (Ideal/Mrs. Weiss) for approximately $14.6 million. Ideal/Mrs. Weiss are located in the Cleveland, Ohio area.
(43) On June 25, 1993, the Company announced that the Board of Directors had approved a share
repurchase program to acquire from time-to-time in the open market, or through privately negotiated transactions, up to $200 million of its Common Stock. The program commenced shortly after the July 21, 1993, release of second quarter results.
(44) On September 14, 1993, the Company completed the acquisition of the Italian
confectionery business of Heinz Italia S.p.A. The business is the leader in the Italian sugar confectionery market and manufactures and markets a wide range of confectionery products, including sugar candies and traditional products for special occasions such as nougat and gift boxes. Products are marketed under the Sperlari, Dondi, and Scaramellini brands. Sales are approximately U.S. $100 million and manufacturing facilities are located in Cremona and Gordona in northern Italy. Its products are sold principally in the Italian market. The business was divested on December 30, 1996.

The Hershey Company
Page 14
(45) October 27, 1993, the Company completed the acquisition of Overspecht BV, a Dutch
confectionery concern which manufactures chocolate and sugar confectionery, baked goods and ice cream products for distribution primarily to private-label customers within the Benelux countries. Sales are approximately U.S. $65 million and manufacturing facilities are located in Oosterhout, the Netherlands and Ieper, Belgium. This business was divested in June 1995.
(46) On November 2, 1993, the Company purchased two million* of its Common Stock shares from
Hershey Trust Company, as Trustee for Milton Hershey School. The Company paid approximately $103.1 million in the transaction. This transaction is part of a $200-million stock repurchase program currently being conducted through open market purchases and privately negotiated transactions.
(47) On November 18, 1993, the Company filed a shelf registration statement with the Securities and
Exchange Commission under which it may offer up to $400 million of debt securities. Combined with the $100 million outstanding from a shelf registration filed in June 1990, the Company had the ability to issue up to $500 million of debt securities.
(48) On November 1, 1994, the Company recorded a pre-tax restructuring charge of $106.1 million,
following a comprehensive review of domestic and foreign operations, designed to enhance performance of operating assets by lowering operating and administrative costs, eliminating underperforming assets and streamlining the overall decision-making process. The charge of $106.1 million resulted in an after-tax charge of $80.2 million or $.92* per share in 1994.
As of December 31, 1995, $81.8 million of restructuring reserves had been utilized and $16.7
million had been reversed to reflect revisions and changes in estimates to the original restructuring program. The remaining $7.6 million of accrued restructuring reserves were utilized in early 1996 as the final aspects of the restructuring program are completed.
(49) On August 4, 1995, the Company purchased 9,049,773* shares of its Common Stock from the
Hershey Trust Company. The Corporation paid $55.25* per share, or approximately $500 million for the shares.
(50) In October 1995, the Company issued $200 million of 6.7% Notes due October 1, 2005. The
proceeds were used to repay short-term borrowings associated with the August 4, 1995, common stock repurchase. As of December 31, 1995, $300 million of debt securities remained available for issuance under the Company’s November 1993 Registration Statement.
* Not adjusted for the two-for-one stock split effective June 15, 2004, or the two-for-one stock split effective September 13, 1996.

The Hershey Company
Page 15
(51) On December 4, 1995, the Company announced an eleven-percent price increase on its standard
and king-size bars in the U.S. This price increase, the first in almost five years, was initiated as a result of increased costs for packaging, fuel, transportation, labor and benefits, as well as increased raw material costs.
(52) In December 1995, the Company completed the acquisition of the Henry Heide confectionery
business, for approximately $12.5 million. Henry Heide’s headquarters and manufacturing facility are located in New Brunswick, New Jersey, where it manufactures a variety of non-chocolate confectionery products including Jujyfruits candies, and Wunderbeans jellybeans. Sales for fiscal year ended September 1995 were approximately $20 million.
(53) In December 1995, the Company entered into definitive agreements with Johnvince Foods of
Ontario, Canada, to sell the assets of Hershey Canada’s Planters nut business, and with Beta Brands Inc., to sell the Life Savers and Breath Savers hard candy business. These divestitures were completed in January 1996. See page 11, #29.
(54) On February 6, 1996, the Board of Directors of The Hershey Company approved a share
repurchase program to acquire from time-to-time in the open market, or through privately negotiated transactions, up to $200 million of its Common Stock. The shares acquired by the Company will be held as Treasury shares.
(55) On February 12, 1996, the Company signed an agreement to purchase the assets of Kneisl
Schokoladen GmbH & Co. KG, a small German manufacturer of chocolate-covered fruits. The agreement was completed in May 1996, and the Kneisl business was integrated into Gubor’s operations. Kneisl had net sales of $8.2 million in 1995.
(56) On August 6, 1996, the Company declared a two-for-one stock split of its Common Stock and
Class B Common Stock effective September 13, 1996, to stockholders of record August 23, 1996. See page 9, #20 and page 10, #24 for prior stock splits.
(57) On December 30, 1996, the Company acquired Huhtamaki’s Leaf North American
Confectionery operations for U.S. $440 million plus royalties. Correspondingly, Huhtamaki acquired Hershey’s European confectionery interests, Gubor and Sperlari, for a purchase price of U.S. $110 million. Leaf confectionery products include Jolly Rancher, Whoppers, Milk Duds, Good & Plenty, Pay Day, Heath, Rainblo and Super Bubble. Both agreements were finalized on December 30, 1996. See page 12, #35 and page 13, #44.

The Hershey Company
Page 16
58) On March 11, 1997, the Company issued $150.0 million of 6.95% Notes due 2007 under the
November 1993 Form S-3 Registration Statement. Proceeds from the debt issuance were used to repay a portion of the commercial paper borrowings associated with the Leaf acquisition. In addition, on March 10, 1997, the Company issued a $150.0 million, 2-1/2 year amortizing, floating-to-fixed interest rate swap, maturing on September 10, 1999.
(59) On June 10, 1997, the Company sold the Ford Gum and Machine Company, Inc. and Carousel
Brands to Akron Confections, Inc. The Company acquired these assets as part of the December 30, 1996, acquisition of Leaf North America.
(60) On August 8, 1997, the Company purchased 9,900,990* shares of its Common Stock from the
Hershey Trust Company. The Company paid $50.50 per share, or approximately $500 million for the shares.
(61) On August 21, 1997, the Company issued $250 million of 7.20% Debentures due 2027 and $150
million of 6.95% Notes due 2012. Proceeds from the debt issuance were used to repay the short-term borrowings associated with the Common Stock purchase of August 8, 1997.
(62) On January 28, 1999, the Company announced the completion of the sale of its U.S. pasta
business to New World Pasta. The sale includes the American Beauty, Ideal, San Giorgio, Light ‘n Fluffy, P&R, Mrs. Weiss, Ronzoni, San Giorgio and Skinner pasta brands along with six manufacturing plants. As a result of the transaction, Hershey received $450 million in cash and retained a minority interest in the business. After-tax proceeds were approximately $340 million. The transaction resulted in a one-time after-tax gain of $165 million, or $1.17 per share* diluted, which was recorded in the first quarter of 1999.
(63) On February 16, 1999, the Board of Directors of The Hershey Company approved a share
repurchase program to acquire from time-to-time in the open market, or through privately negotiated transactions, up to $230 million of its Common Stock. This authorization was completed in February 2000, and a new $200 million authorization was initiated at that time. The shares acquired by the Company will be held as Treasury shares.
(64) In November, 1999, Hershey sold its aseptic packaging plant in Savannah, Georgia (Dairymen’s)
and switched to a contract manufacturing agreement for aseptic drinks. This asset sale is part of Hershey’s continuing effort to remove low return assets from its asset base.
In April 2002, the Company announced the licensing of its aseptically-packaged drink products in the United States to Morningstar, a division of Suiza.
_________________________ * Not adjusted for the two-for-one stock split effective June 15, 2004.

The Hershey Company
Page 17
(65) On May 1, 2000, the new 1.2 million square foot Eastern Distribution Center near Hershey, PA
began receiving inbound product shipments. Outbound product shipments to customers began on June 30, and full utilization was realized by the end of November 2000. Hershey’s newly renovated 405,000 square-foot regional distribution center in Atlanta, GA, began shipping product on May 15, 2000.
(66) On December 15, 2000, the Company purchased Nabisco's intense and breath freshener mints
and gum businesses for $135 million. The purchase of Nabisco’s business, which had 1999 sales of approximately $270 million, included Ice Breakers and Breath Savers Cool Blasts intense mints, Breath Savers mints, and Ice Breakers, Care*free, Stick*free, Bubble Yum and Fruit Stripe gums. Also included in the purchase was Nabisco's gum-manufacturing plant in Las Piedras, Puerto Rico.
(67) On August 1, 2001, the Company acquired the chocolate confectionery business of Visagis, a
Brazilian confectioner, for $17.1 million. The acquisition includes a manufacturing plant and confectionery equipment in Sao Roque, Brazil. The acquired brands, including I0-I0 and Visconti, had 2000 sales of approximately $20 million.
(68) On September 5, 2001, the Company announced the completion of the sale of the Luden’s Throat
Drops business to Pharmacia Corporation for approximately $60 million. Included in the sale were the trademarks and manufacturing equipment for the throat drop business. The Company recorded a gain of $19.2 million before tax, $1.1 million, or $.01 per share-diluted* after tax, as a result of the transaction. A higher gain for tax purposes reflected the low tax basis of the intangible assets included in the sale, resulting in taxes on the gain of $18.1 million.
(69) On October 24, 2001, the Company announced a pre-tax restructuring charge of $275 million, or
$1.24 per share-diluted*, supporting initiatives to enhance the future operating performance of the Company.
On January 8, 2002, the Company announced a higher realignment charge and additional anticipated savings from its value-enhancing initiatives announced on October 24, 2001. As a result, the business realignment charges will increase from $275 million to $310 million and from $1.24 to $1.39 per share-diluted*.
(70) On June 24, 2002, the Company announced the completion of the sale of a group of Hershey’s
non-chocolate confectionery brands for $12 million. Included in the transaction were Heide, Jujyfruits, Wunderbeans, and Amazin’ Fruit trademarked confectionery brands, as well as the rights to sell Chuckles-branded products, under license.
_________________________ * Not adjusted for the two-for-one stock split effective June 15, 2004.

The Hershey Company
Page 18
(71) On July 25, 2002, Hershey Foods Corporation confirmed that the Milton Hershey School
Trust, which at the time, controlled 77% of the combined voting power of The Hershey Company’s Common Stock and Class B Common Stock, informed the Company that it had decided to diversify its holdings and in this regard wanted The Hershey Company to explore a sale of the entire Company. On September 17, 2002, the Milton Hershey School Trust instructed the Company to terminate the sale process.
(72) On December 11, 2002, the Company announced a 10.8 percent price increase on its standard
size, king size, variety pack, and 6-pack lines. This is the first price change the Company has made on its standard size bars since 1996.
(73) On July 17, 2003, the Company announced realignment initiatives expected to result in a net charge of $17 million, or $.08 per share-diluted*. The total impact of the initiatives will be cash flow positive in 2003 and slightly accretive in 2004, resulting from expected savings of approximately $5 million, annually.
(74) On August 29, 2003, The Hershey Company announced that it had entered into a definitive agreement for the sale of a group of gum brands for $20 million to Farley’s & Sathers Candy Company. Included in the transaction were Fruit Stripe chewing gum, Rain-Blo gum balls, and Super Bubble bubble gum trademarked brands.
(75) On April 22, 2004, Hershey declared a two-for-one stock split of its Common Stock and Class B Stock effective June 15, 2004, to shareholders of record May 25, 2004. See page 9, #20; page 8, #24; and page 13, #56 for prior stock splits.
(76) In April 2004, the Company began charging its new 1,100,000 square-foot Mid-West Distribution Center. Shipments to customers from this facility began later that month. This concludes the consolidation and modernization of the Company’s distribution system.
(77) In October 2004, the Company’s Mexican Subsidiary, Hershey Mexico, acquired Grupo
Lorena, one of Mexico’s top confectionery companies, for $39.0 million. This business has annual sales of over $30 million. Included in the acquisition was the Pelon Pelo Rico brand.
(78) In December 2004, the Company acquired Mauna Loa Macadamia Nut Corporation (“Mauna Loa”) for $127.8 million. Mauna Loa is the leading processor and marketer of macadamia snacks with annual sales of approximately $80 million.
_______________________ * Not adjusted for the two-for-one stock split effective June 15, 2004.

The Hershey Company
Page 19
(79) In December 2004, the Company announced an increase in the wholesale prices of
approximately half of its domestic confectionery line. The changes represent a 3% price increase over Hershey’s entire domestic product line and will help offset increases in the Company’s input costs.
(80) In April 2005, Hershey’s Board of Directors approved an authorization to acquire up to $250 million of Hershey’s Common Stock.
(81) In April 2005, the Company’s stockholders approved an increase in the number of authorized shares of the Common Stock from 450 million to 900 million shares and the Class B Common Stock from 75 million to 150 million shares.
(82) In April 2005, the Company announced that its stockholders approved the company name change from Hershey Foods Corporation to The Hershey Company. The new name reflects the Company’s rich heritage and expresses how consumers and customers best know it.
(83) In July 2005, the Company announced an estimated pre-tax business realignment charge of $140 – $150 million, or $0.35 - $0.38 per share-diluted, supporting initiatives to enhance the future operating performance of the Company. Included are a voluntary workforce reduction through an Early Retirement Program and an Enhanced Mutual Separation Program, streamlining and creating new capabilities in Hershey’s North American operations, and closure of the Company’s under-utilized Las Piedras, Puerto Rico manufacturing facility.
(84) In August 2005, the Company announced that its newly formed, wholly owned subsidiary, Artisan Confections Company, has acquired the assets of Joseph Schmidt Confections, Inc. Hershey also completed the acquisition of Scharffen Berger Chocolate Maker, Inc. The combined purchase price for Scharffen Berger and Joseph Schmidt will be between $46.6 million and $61.1 million, with the final amount reflecting actual sales growth through 2007. Together, these companies have combined annual sales of approximately $25 million.
(85) In December 2005, the Company announced that its Board of Directors had approved an additional $500 million stock repurchase authorization. The Company continues to execute the $250 million buyback authorized in April 2005 and expects to complete both authorizations by the end of 2006.
In this connection, The Company and Hershey Trust Company, as trustee for the Milton Hershey School Trust (School Trust), have entered into an agreement under which the School Trust intends to participate on a proportional basis in the Company's stock purchases.

The Hershey Company
Page 20
(86) In December 2005, the Company announced that it intends to begin expensing employee stock options and other share-based compensation in accordance with Financial Accounting Standards Board Statement of Financial Accounting Standards No. 123 (Revised 2004), Share-Based Payment ("SFAS No. 123R"), under the modified retrospective method effective in the fourth quarter of 2005. Under the modified retrospective method, the full-year results for 2005 will be reported as though stock options granted by the Company had been expensed beginning January 1, 2005. Under the modified retrospective method, the financial statements for years prior to 2005 will be adjusted to reflect the impact of the adoption of SFAS No. 123R. The impact of adoption of SFAS No. 123R in 2005 was $0.09 per share-diluted, of which approximately $0.03 per share-diluted was recorded in the fourth quarter.
(87) The Company and Hershey Trust Company, as trustee for the Milton Hershey School
Trust, announced on January 27, 2006, that they have entered into an agreement under which the School Trust intends to participate on a proportional basis in the Company's Common Stock repurchase program. This agreement will take effect January 30, 2006, and expire July 31, 2006. This agreement is a renewal of an existing agreement which began December 13, 2005, and expiring January 30, 2006. The terms of the agreement are described in a Form 8-K filed with the SEC. The Company's Board of Directors had approved the repurchase of $250 million of its Common Stock in April 2005, of which $187.1 million was utilized through the end of 2005, leaving $62.9 million in that authorization. An additional $500 million authorization was approved by the Company's Board in December 2005. The Company expects to complete both authorizations by the end of 2006.
(88) In May 2006, the Company announced the establishment of the Hershey Center for Health and Nutrition. The Center will direct cutting-edge scientific research to develop products and technologies providing customers with health benefits in the areas of heart health, weight management, and mental and physical energy. The Center will build upon the science, clinical studies and research work already underway at The Hershey Company.
(89) In July, 2006, the Company and Hershey Trust Company, as trustee for the Milton Hershey School Trust, announced that they have entered into an agreement under which the School Trust intends to continue to participate on a proportional basis in the Company's Common Stock repurchase program. This agreement will take effect July 31, 2006, and expire February 2, 2007. This agreement is a renewal of an existing agreement which began January 30, 2006, and expired July 31, 2006. The terms of the agreement are described in a Form 8-K to be filed today with the SEC.
(90) In October, 2006, the Company, as part of its strategic focus on the high-growth premium chocolate segment, announced that it has acquired the assets and operations of Dagoba Organic
The Hershey Company
Page 21
Chocolate, LLC. Based in Ashland, Oregon, Dagoba is known for its high-quality natural and organic chocolate bars, hot chocolate and chocolate-covered coffee beans sold in natural foods outlets and gourmet stores.
(91) In December, 2006, the Company announced that its Board of Directors approved a $250
million stock repurchase authorization. The Company expects to complete its current repurchase authorization of $500 million by the end of 2006. Purchases under the new authorization will commence after the current program is completed. Acquired shares of the Common Stock will be held as treasury shares.
(92) In January 2007, the Company announced a manufacturing joint venture in China with Lotte Confectionery Co., Ltd., Korea’s leading confectionery and ice cream manufacturer. The joint venture will produce Hershey and Lotte products for the market in China.
(93) On February 15, 2007, the Company announced a comprehensive, three-year supply chain transformation program that is expected to be completed by December 31, 2009. Upon completion, this program will greatly enhance our manufacturing, sourcing and customer service capabilities, and will generate significant resources to invest in our growth initiatives. These initiatives include accelerated marketplace momentum within our core U.S. business, creation of innovative new product platforms to meet consumer and customer needs, and disciplined global expansion.
Under the program, which we will implement in stages over the next three years, we will significantly increase manufacturing capacity utilization by reducing the number of production lines by more than one-third; outsource production of low value-added items; and, construct a flexible, cost-effective production facility in Monterrey, Mexico to meet current and emerging marketplace needs.
We estimate that the program will incur pre-tax charges and non-recurring project implementation costs of $525 million to $575 million over the next three years. This estimate includes $275 million to $300 million in asset write-offs, $200 million to $225 million in employment-related costs, including the impact of curtailment charges associated with our pension and other post-retirement benefit plans, and approximately $50 million in project implementation costs. We will incur these charges primarily in 2007 and 2008, with approximately $300 million expected to be charged in 2007. We estimate the cash portion of the total charge to be $275 million to $300 million.
This initiative also includes gross capital investments of $300 million to $310 million. Capital investments over the implementation period are expected to be approximately $200 million more than previous expectations of $190 million to $200 million per year, resulting in total capital expenditures of $250 million to $300 million in 2007 and $225 million to $250 million in 2008 and 2009. Following completion of this initiative, we expect annual capital investments of approximately $140 million to $160 million. As a result of the program, we estimate that our gross margin should improve significantly, with on-going annual savings of approximately $170 million to $190 million generated by 2010.
The Hershey Company
Page 22
On January 27, 2009, the Company announced that the scope of the Global Supply Chain Transformation program increased modestly to include the closure of two subscale manufacturing facilities of Artisan Confections Company, a wholly owned subsidiary, and consolidation of the associated production into existing U.S. facilities, along with rationalization of other select items. These initiatives, which will be completed in 2009, increase the expected total cost and savings of the Global Supply Chain Transformation program by approximately $25 million and $5 million, respectively. Approximately $15 million of the increased costs are non-cash charges. Cumulative savings for the Global Supply Chain Transformation program are approximately $81 million and the estimate for total ongoing annual savings by 2010 is $175 million to $195 million. On April 23, 2009, the Company updated the forecast for total GSCT charges to $615 million to $665 million to include $40 million to $65 million of non-cash pension settlement charges. Per SFAS No. 88, incremental pension settlement charges were added to the total GSCT program estimates based upon the current trends of year-to-date employee withdrawals. The projected amount to be incurred in 2009 is $40 million to $50 million.
(94) On April 3, 2007, the Company announced the formation of a joint venture with Godrej Beverages and Foods, Ltd. to manufacture and distribute confectionery products, snacks, and beverages across India.
The agreement gives Hershey a 51 percent ownership stake in a joint venture that has
approximately $70 million in annual net sales, primarily in sugar confectionery and beverages. The combination will leverage Godrej’s manufacturing and distribution network with Hershey branded product manufactured in-country and distributed to over 1.6 million outlets in India.
(95) On April 4, 2007, the Company announced an increase in the wholesale prices of its domestic
confectionery line. An increase of approximately 4 – 5 percent on the Company’s standard bar, king-size bar, 6-pack and vending lines is effective immediately. These products represent roughly one-third of the Company’s portfolio. This action will help offset the Company’s input costs, including raw materials, fuel, utilities and transportation. While there has been no change in list prices on these impacted items since December 2004, over this period costs have continued to rise.
(96) On April 26, 2007, the Company announced a strategic supply and innovation partnership with Barry Callebaut, the world’s largest manufacturer of high-quality cocoa, industrial chocolate, and confectionery products.

The Hershey Company
Page 23
The companies will partner on a wide range of research and development activities with a focus on driving innovation in new chocolate taste experiences, premium chocolate, health and wellness, ingredient research and optimization. Under the agreement, Barry Callebaut will construct and operate a facility to provide chocolate for Hershey’s new plant in Monterrey, Mexico. Barry Callebaut will also lease a portion of Hershey’s Robinson, Ill., plant and operate chocolate-making equipment at the facility. The partnership includes a long-term global agreement under which Barry Callebaut will supply Hershey with a minimum of 80,000 tonnes per year of chocolate and chocolate products.
(97) In May, 2007, the Company entered into a manufacturing agreement in China with Lotte Confectionery Co., LTD., to produce Hershey products and certain Lotte product for the market in China. An investment of $39.0 million was made in 2007 for a 44% interest.
(98) On January 24, 2008 the Company announced the formation of a joint venture in Brazil with Pandurata Alimentos Ltda (manufacturer of products sold in Brazil and Latin America under the Bauducco brand) to manufacture, sell and distribute Hershey’s branded products across Brazil using the Bauducco distribution network.
(99) On January 28, 2008, the Company announced an increase in the wholesale prices on
approximately one-third of its domestic confectionery line. The changes represented a weighted average 13% increase on the Company's standard bar, king-size bar, 6-pack and vending lines and approximated a 3% price increase over Hershey's entire domestic product line. The price increase will help offset increases in areas of the Company's input costs, including raw materials, fuel, utilities, and transportation.
(100) On August 15, 2008, the Company announced an increase in wholesale prices across its U.S., Puerto Rico and export chocolate and sugar confectionery lines. These changes represented a weighted average 11% increase on the Company’s instant consumable, multi-pack and packaged candy lines, and approximated a 10% increase over Hershey’s entire domestic product line. The price increase will help offset a portion of the significant increases in the Company’s input costs, including raw materials, packaging materials, fuel, utilities, and transportation.
(101) Effective February 28, 2009 the Company licensed the Van Houten brand from Barry Callebaut. Specifically, Hershey has a perpetual and exclusive license of the Van Houten brand name and related trademarks in Asia Pacific, the Middle East and Australia/New Zealand for consumer products. Founded in 1990, Van Houten Singapore successfully develops and markets popular consumer chocolate products throughout Asia. This acquisition complements the Company's existing business in Asia and gives Hershey an immediate in-market presence in several high-potential markets, including Malaysia and Indonesia. The investment was about $15 million, or approximately 1-times sales.
(102) On December 8, 2010, the Company issued $350 million of 4.125% notes due 2020 in a public offering. The Company intends to use the net proceeds to fund its previously announced cash tender offer for any and all of its $150 million outstanding 6.95% Notes due 2012 and to pay related fees and expenses. All remaining proceeds from the Notes offering not used to purchase the 2012 Notes or to pay related fees and expenses will be used for general corporate purposes.

The Hershey Company
Page 24
(103) On June 14, 2010, the Company announced the Project Next Century initiative as part of the
Company’s ongoing efforts to create an advantaged supply chain and competitive cost structure. The Next Century capital investment includes a $200 million to $225 million plant expansion of the existing West Hershey facility and approximately $50 million to $75 million in distribution and administrative facilities located in Hershey, Pennsylvania. As part of the project, production will transition from the Company’s century-old facility at 19 East Chocolate Avenue in Hershey, Pennsylvania, to a planned expansion of the West Hershey facility, which was built in 1992. Production from the 19 East Chocolate Avenue plant, as well as a portion of the workforce, will be relocated to the West Hershey facility. This change is expected to result in the reduction of approximately 500 to 600 jobs as investments in technology and automation result in enhanced efficiency in the new building.
The Company estimates that Project Next Century program will incur pre-tax charges and non-recurring project implementation costs of $140 million to $170 million over the next three years. This estimate includes $120 million to $150 million in pre-tax business realignment and impairment charges and approximately $20 million in project implementation and start-up costs. The cash portion of the total charge is estimated to be $95 million to $110 million, including project implementation and start-up costs. Total capital expenditures related to the program are expected to be $250 million to $300 million. At the conclusion of the program in 2014, ongoing annual savings are expected to be approximately $60 million to $80 million.
(104) On March 30, 2011, the Company announced an increase in wholesale prices across its U.S.,
Puerto Rico and export chocolate and sugar confectionery lines. These changes represented a weighted average 9.8% increase on the Company’s instant consumable, multi-pack packaged candy and grocery lines. The price increase will help offset a portion of the significant increases in the Company’s input costs, including raw materials, packaging materials, fuel, utilities, and transportation that the Company expects to incur in the future.
(105) On November 8, 2011, the Company issued $250 million of 1.500% notes due 2016 in a public offering. The Hershey Company intends to use the net proceeds of the Notes Offering for general corporate purposes.
(106) On January 19, 2012, the Company completed the acquisition of Brookside Foods, LTD, a privately held confectionery company based in Abbotsford, British Columbia. Brookside is a chocolate confectionery company with great-tasting products based on a unique formula for making chocolate-covered fruit juice pieces. Brookside holds patents that enable it to make the centers of these distinctive products from real fruit juice. Brookside also makes traditional chocolate-covered nuts and dried fruit.

The Hershey Company
Page 25
The Hershey Company
Summary of Consolidated Statements of Income - GAAP for the periods ended December 31, 2011 and December 31, 2010
(in thousands except per share amounts) Fourth Quarter Twelve Months 2011 2010 2011 2010
Net Sales $ 1,567,145 $ 1,482,809 $ 6,080,788 $ 5,671,009 Costs and Expenses:
Cost of Sales 935,939 863,339 3,548,896 3,255,801Selling, Marketing and Administrative 397,156 391,227 1,477,750 1,426,477Business Realignment and Impairment
Charges, net 5,041 351 (886) 83,433
Total Costs and Expenses 1,338,136 1,254,917 5,025,760 4,765,711 Income Before Interest and Income Taxes (EBIT) 229,009 227,892 1,055,028 905,298Interest Expense, net 21,314 27,646 92,183 96,434 Income Before Income Taxes 207,695 200,246 962,845 808,864Provision for Income Taxes 65,562 64,733 333,883 299,065 Net Income $ 142,133 $ 135,513 $ 628,962 $ 509,799
Net Income Per Share - Basic - Common $ 0.65 $ 0.61 $ 2.85 $ 2.29
- Basic - Class B $ 0.59 $ 0.55 $ 2.58 $ 2.08
- Diluted - Common $ 0.62 $ 0.59 $ 2.74 $ 2.21
Shares Outstanding - Basic - Common 165,023 167,013 165,929 167,032
- Basic - Class B 60,632 60,707 60,645 60,708
- Diluted - Common 229,117 230,813 229,919 230,313
Key Margins:
Gross Margin 40.3% 41.8% 41.6% 42.6%EBIT Margin 14.6% 15.4% 17.4% 16.0%Net Margin 9.1% 9.1% 10.3% 9.0%

The Hershey Company
Page 26
The Hershey Company Summary of Consolidated Statements of Income – Pro Forma
for the periods ended December 31, 2011 and December 31, 2010 (in thousands except per share amounts)
Fourth Quarter Twelve Months 2011 2010 2011 2010 Net Sales $ 1,567,145 $ 1,482,809 $ 6,080,788 $ 5,671,009 Costs and Expenses:
Cost of Sales 914,189 856,794 3,503,800 3,242,157Selling, Marketing and Administrative 396,215 390,244 1,489,823 1,424,984
Total Costs and Expenses 1,310,404 1,247,038 4,993,623 4,667,141
Income Before Interest and Income Taxes (EBIT) 256,741 235,771 1,087,165 1,003,868Interest Expense, net 21,314 27,646 92,183 96,434 Income Before Income Taxes 235,427 208,125 994,982 907,434Provision for Income Taxes 75,791 67,750 346,254 319,700 Net Income $ 159,636 $ 140,375 $ 648,728 $ 587,734
Net Income Per Share - Basic - Common $ 0.73 $ 0.63 $ 2.94 $ 2.65
- Basic - Class B $ 0.66 $ 0.57 $ 2.66 $ 2.40
- Diluted - Common $ 0.70 $ 0.61 $ 2.82 $ 2.55
Shares Outstanding - Basic - Common 165,023 167,013 165,929 167,032
- Basic - Class B 60,632 60,707 60,645 60,708
- Diluted - Common 229,117 230,813 229,919 230,313
Key Margins:
Gross Margin 41.7% 42.2% 42.4% 42.8%EBIT Margin 16.4% 15.9% 17.9% 17.7% Net Margin 10.2% 9.5% 10.7% 10.4%

The Hershey Company
Page 27
SIX-YEAR CONSOLIDATED FINANCIAL SUMMARY All dollar and share amounts in thousands except market price
and per share statistics
5-Year Compound
Growth Rate
2011
2010
2009
2008
2007
2006
Summary of Operations
Net Sales ............................................. 4.2% $ 6,080,788 5,671,009 5,298,668 5,132,768 4,946,716 4,944,230
Cost of Sales ....................................... 2.9% $ 3,548,896 3,255,801 3,245,531 3,375,050 3,315,147 3,076,718Selling, Marketing and
Administrative .............................. 11.4% $ 1,477,750 1,426,477 1,208,672 1,073,019 895,874 860,378Business Realignment and
Impairment (Credits) Charges, Net ................................................ NA $ (886) 83,433 82,875 94,801 276,868 14,576
Interest Expense, Net .......................... (4.5)% $ 92,183 $ 333,883
96,434 90,459 97,876 118,585 116,056Provision for Income Taxes................ 1.0% 299,065 235,137 180,617 126,088 317,441
Net Income.......................................... 2.4% $ 628,962 509,799 435,994 311,405 214,154 559,061
Net Income Per Share:
—Basic—Class B Stock ........ 3.3% $ 2.58 2.08 1.77 1.27 .87 2.19—Diluted—Class B Stock..... 3.4% $ 2.56 2.07 1.77 1.27
1.41 .87 2.17
—Basic—Common Stock...... 3.2% $ 2.85 2.29 1.97 .96 2.44—Diluted—Common Stock .. 3.3% $ 2.74 2.21 1.90 1.36 .93 2.34
Weighted-Average Shares Outstanding:
—Basic—Common Stock...... 165,929 167,032 167,136 166,709 168,050 174,722—Basic—Class B Stock ........ 60,645 60,708 60,709 60,777 60,813 60,817—Diluted................................ 229,919 230,313 228,995 228,697
197,839 231,449 239,071
Dividends Paid on Common Stock..... 5.0% $ 228,269 213,013 198,371 190,199 178,873Per Share....................................... 6.0% $ 1.38 1.28 1.19 1.19 1.135 1.03
Dividends Paid on Class B Stock ....... 6.1% $ 75,814 70,421 65,032 65,110 62,064 56,256Per Share....................................... 6.2% $ 1.25 1.16 1.0712 1.0712 1.0206 .925
Depreciation........................................ 0.8% $ 188,491 169,677 157,996 227,183 292,658 181,038Advertising.......................................... 30.8% $ 414,171 391,145 241,184 161,133 127,896 108,327Payroll ................................................. .9% $ 676,482 641,756 613,568 645,456 645,083 645,480
Year-end Position and Statistics
Capital Additions ................................ 12.0% $ 323,961 179,538 126,324 262,643 189,698 183,496Capitalized Software Additions.......... 9.5% $ 23,606 21,949 19,146 20,336 14,194 15,016Total Assets......................................... 1.2% $ 4,412,199 4,272,732 3,675,031 3,634,719 4,247,113 4,157,565Short-term Debt and Current Portion
of Long-term Debt........................ (30.2)% $ 139,673 285,480 39,313 501,504 856,392 843,998Long-term Portion of Debt ................. 7.0% $ 1,748,500 1,541,825 1,502,730 1,505,954 1,279,965 1,248,128Stockholders’ Equity........................... 5.0% $ 872,648 937,601 760,339 349,944 623,520 683,423Full-time Employees........................... 11,800 11,300 12,100 12,800 12,400 12,800
Stockholders’ Data
Outstanding Shares of Common Stock and Class B Stock at Year- end 225,206 227,030 227,998 227,035 227,050 230,264Market Price of Common Stock at
Year-end ....................................... 4.4% $ 61.78 47.15 35.79 34.74 39.40 49.80Price Range During Year (high)......... $ 62.26 52.10 42.25 44.32 56.75 57.65Price Range During Year (low) .......... $ 46.24 35.76 30.27 32.10 38.21 48.20

The Hershey Company
Year 2011 1st Qtr 2nd Qtr 3rd Qtr 4th Qtr Year
Net Sales 1,564,223$ 1,325,171 1,624,249 1,567,145 6,080,788
EBIT 276,549$ 228,354 321,116 229,009 1,055,028
Net Income 160,115$ 130,019 196,695 142,133 628,962
Net Income per Share - Diluted (a)0.70$ 0.56 0.86 0.62 2.74
Year 2010 1st Qtr 2nd Qtr 3rd Qtr 4th Qtr Year
Net Sales 1,407,843$ 1,233,242 1,547,115 1,482,809 5,671,009
EBIT 253,334$ 124,424 299,648 227,892 905,298
Net Income 147,394$ 46,723 180,169 135,513 509,799
Net Income per Share - Diluted (a)0.64$ 0.20 0.78 0.59 2.21
Year 2009 1st Qtr 2nd Qtr 3rd Qtr 4th Qtr YearNet Sales 1,236,031$ 1,171,183 1,484,118 1,407,336 5,298,668
EBIT 152,934$ 116,676 279,624 212,356 761,590 Net Income 75,894$ 71,298 162,023 126,779 435,994 Net Income per Share - Diluted (a)
0.33$ 0.31 0.71 0.55 1.90
Year 2011 1st Qtr 2nd Qtr 3rd Qtr 4th Qtr Year
Net Sales 1,564,223$ 1,325,171 1,624,249 1,567,145 6,080,788
EBIT 286,260$ 226,563 317,601 256,741 1,087,165
Net Income 166,232$ 129,040 193,820 159,636 648,728
Net Income per Share - Diluted (a)0.72$ 0.56 0.84 0.70 2.82
Year 2010 1st Qtr 2nd Qtr 3rd Qtr 4th Qtr YearNet Sales 1,407,843$ 1,233,242 1,547,115 1,482,809 5,671,009
EBIT 253,334$ 210,657 304,106 235,771 1,003,868 Net Income 147,394$ 117,047 182,918 140,375 587,734 Net Income per Share - Diluted (a)
0.64$ 0.51 0.79 0.61 2.55
Year 2009 1st Qtr 2nd Qtr 3rd Qtr 4th Qtr YearNet Sales 1,236,031$ 1,171,183 1,484,118 1,407,336 5,298,668
EBIT 171,906$ 159,367 290,640 238,808 860,721 Net Income 85,992$ 97,965 168,508 144,352 496,817 Net Income per Share - Diluted (a)
0.38$ 0.43 0.73 0.63 2.17
* 2011, 2010 and 2009 Pro Forma excludes charges (credits) for business realignment initiatives.
weighted-average shares outstanding during the year.(a) Quarterly income per share amounts may not total to the annual amounts due to the impact of changes in
AS REPORTED
PRO FORMA*
Summary of Quarterly DataFor the years ended December 31, 2011, 2010 and 2009
(in thousands of dollars except per share amounts)
Page 28

The Hershey Company
Page 29
NON-GAAP EPS
NON-GAAP* GAAP
2011 $2.82 $2.74
2010 $2.55 $2.21
2009 $2.17 $1.90
2008 $1.88 $1.36
2007 $2.08 $0.93
2006 $2.37 $2.34
2005 $2.27 $1.97
2004 $2.00 $2.24
2003 $1.72 $1.66
2002 $1.54 $1.43
Excludes business realignment and other non-recurring items. All years have been adjusted to reflect the adoption of SFAS 123R and SAB No. 108.
*

The Hershey Company
Capitalization
Long-Term Debt: 2011 2010 2009 2008 2007(in thousands of dollars)
5.30% Notes Due 2011 - 250,000 250,000 250,000 250,000 6.95% Notes Due 2012 92,533 92,533 150,000 150,000 150,000 5.00% Notes Due 2013 250,000 250,000 250,000 250,000 -4.85% Notes Due 2015 250,000 250,000 250,000 250,000 250,000 5.45% Notes Due 2016 250,000 250,000 250,000 250,000 250,000 1.5% Notes Due 2016 250,000 - - - -4.125% Notes Due 2020 350,000 350,000 - - -8.8% Debentures Due 2021 100,000 100,000 100,000 100,000 100,000 7.20% Debentures Due 2027 250,000 250,000 250,000 250,000 250,000
Capitalized lease obligations - - - - -Other obligations, net discounts 53,560 10,684 17,977 24,338 36,069
1,846,093 1,803,217 1,517,977 1,524,338 1,286,069
Less--current portion (97,593) (261,392) (15,247) (18,384) (6,104)
TOTAL LONG-TERM DEBT 1,748,500 1,541,825 1,502,730 1,505,954 1,279,965
Stockholders' Equity: *
Common Stock 299,269 299,195 299,192 299,190 299,095Class B Common Stock 60,632 60,706 60,709 60,711 60,806Add'l. paid-in capital 490,817 434,865 394,678 352,375 335,256Accum. Other Comprehensive Income (442,331) (215,067) (202,844) (359,908) (27,979) Retained Earnings 4,699,597 4,374,718 4,148,353 3,975,762 3,927,306Treasury Stock (4,258,962) (4,052,101) (3,979,629) (4,009,931) (4,001,562)
The Hershey CompanyStockholders' Equity 849,022 902,316 720,459 318,199 592,922
Non-Controlling Interests in Subsidiaries 23,626 35,285 39,880 31,745 30,598
TOTAL STOCKHOLDERS' EQUITY 872,648 937,601 760,339 $349,944 $623,520
Total Capitalization 2,621,148 2,479,426 2,263,069 1,855,898 1,903,485
Long-Term Debt 66.7% 62.2% 66.4% 81.1% 67.2%Stockholders' Equity 33.3% 37.8% 33.6% 18.9% 32.8%
Total Capitalization 100% 100% 100% 100% 100%
* Restated for the effects of FAS 123
Year-End
Page 30

The Hershey Company
USA: Bank of America, N.A. $135 million $135 million J.P. Morgan Chase Bank 135 135 Citibank, N.A. 135 135 PNC Bank, N.A. 135 135 UBS 105 105 Royal Bank of Canada 100 100 US Bank, N.A. 75 75 The Northern Trust Co. 75 75 Sumitomo Mitsui Banking Corp. 75 75 Sovereign Bank (Santander) 75 75 CIBC, Inc. 30 30 U.S. AgBank, FCB, as Disclosed Agent 25 25
Total $ 1,100 million Total
Foreign Credit Lines: (local currency)*THC's guaranty
Hershey Canada Inc. - CAD Canadian Imperial Bank of Commerce* 10 m 9.8 m*THC's guaranty for C$ 21,000,000
Hershey Mexico S.A. de C.V. - MXN Banamex* 200 m 14.3 m*THC's guaranty
Hershey do Brasil Ltda. - BRL Citibank N.A.* 16 m 8.6 m*THC's guaranty 51%, Bauducco 49% Banco Itau ** 8 m 4.3 m Bradesco ** 12 m 6.4 m** Bauducco guaranty 100%
Hershey Philippines Inc. - PHP36 m 19.3 m
Citibank N.A.* 114.6 m 2.6 m*THC's guaranty
Hershey Foods Int'l. Trade (Shanghai) Citibank N.A.* 62.9 m 10.0 m
J.P. Morgan 62.9 m 10.0 m
*THC's guaranty
Hershey Commercial (Shanghai) Co., Ltd. 20.0 m
Citibank N.A.* 18.9 m 3.0 m
*THC's guaranty
Godrej - Hershey Foods & Beverages, Ltd. AXIS Bank 400 m 7.6 m
Hershey Singapore Pte. Citibank N.A. 0.4 m 0.3 m*THC's guaranty
TOTAL FOREIGN LINES US$ EQUIVALENT 76.9 m
Commercial Paper Standard & Poor's Corporation A1 Moody's Investors Service, Inc. P1
Long Term Bonds and Debentures Standard & Poor's Corporation A Moody's Investors Service, Inc. A2
U.S. $ Equivalent
TotalExpires October 2016
FINANCING ARRANGEMENTS Lines of Credit - December 31, 2011
$1.1 billion (U.S. $)
Page 31

The Hershey Company
Page 32
Long-Term Financial Strategy/Objectives
Net Sales 3 - 5%
EPS* 6 - 8%
*Diluted excluding items affecting comparability.

The Hershey Company
Capital expenditures (including software)
$143$170
1999 2000 20022001
$237
1998
$141
$204
$m
$145
2003 2004
$196 $194
2005
$199
2006 2007
$204
2008
$283
$145
2009
$201
2010 2011
$348
*
Operating Depreciation and Amortization *$m
$176$190
1999 2000 20022001
$178
1998
$163$158
$181
2003 2004
$190
2005
$218
$200
2006 2007
$202
Amounts excluded accelerated D&A that resulted from business realignment initiatives. Accelerated D&A totaled $33 million, $12 million, $4 million, $60 million and $109 million in 2011, 2010, 2009, 2008 & 2007, respectively.
$190
2008 2009
$178$185
2010 2011
$183
Page 33

The Hershey Company
2 8 3 . 0
2 0 1. 5
3 4 7 . 6
14 5 . 5
4 3 3 . 64 15 . 5
4 0 1. 64 2 1. 7
3 2 4 . 7
16 9 . 914 4 . 5
2 3 7 . 0
19 5 . 919 4 . 3
19 8 . 5
4 5 6 . 2
2 0 3 . 9
4 8 4 . 9
3 0 4 . 1
4 16 . 5
2 8 3 . 4
2 6 3 . 4
2 8 9 . 6
4 6 . 3
3 8 6 . 1
17 1. 2
16 7 . 8
3 8 1. 7
3 2 2 . 6
2 6 2 . 9
2 5 2 . 32 3 5 . 12 2 1. 22 0 5 . 7
18 4 . 7
15 4 . 8
3 13 . 0
Cash Flow Analysis
2001 2002 2003 2004 2005
Cash Flow from Operations
Dividends
CAP X including Software
($ Millions)
2006 2007 2008
706.4
625.3592.9
787.7
723.2
461.8
2009
778.8
408.9
656.8
1,065.7
2010 2011
901.4
519.6
580.1
312.3
Page 34

The Hershey Company
Avg. Price $27.66 per Share
Shares have been restated to reflect the two-for-one splits effective 9/13/96 and 6/15/04.
* August 4, 1995, August 8, 1997, February 25, 1999, and July 28, 2004: Privately negotiated transactions with the Milton Hershey School Trust.
Common Stock Repurchases
Repurchase History
Year Shares $Millions
1993 10,292,400 131.2 1994 3,512,156 40.3 1995 1,890,564 26.2 1995* 36,199,092 500.0 1996 3,180,420 66.1 1997 216,520 7.7 1997* 19,801,980 500.0 1998 630,178 16.1 1999 7,797,200 218.0 1999* 3,159,558 100.0 2000 4,569,078 99.9 2001 1,353,200 40.3 2002 2,600,690 84.2 2003 9,848,400 329.4 2004 2,632,500 115.6 2004* 11,281,589 501.4 2005 4,153,228 242.1 2006 10,601,482 562.9 2007 2,915,665 150.0 2008 -- -- 2009 -- -- 2010 -- -- 2011 1,902,753 100.0 138,538,653 3,831.4
Page 35

The Hershey Company
Repurchase HistoryMilton Hershey School Trust
Nov 1986* 15,300,000 86.9
Nov 1993 8,000,000 103.1
Aug 1995 36,199,092 500.0
Aug 1997 19,801,980 500.0
Feb 1999 3,159,558 100.0
July 2004 11,281,589 501.4
Dec 2005 68,728 3.9
YTD 12/31/06 689,704 38.5
94,500,651 $1,833.8
Average cost: $19.41 per share.
Date Shares $Millions
38* The Trust also sold 10,350,000 shares in a secondary offering on the same date.
Common Stock Repurchases
Year-end shares outstanding 361
350 347
309 306
286 286 277 273 271 268259
247 241230 227 227 228 227 225
100120140160180200220240260280300320340360380
92 93 94 95 96 97 98 99 00 01 02 03 04 05 06 07 08 09 10 11
Shares have been restated to reflect the two-for-one stock splits effective 9/13/96 and 6/15/04.
Page 36

The Hershey Company
Economic - ROIC
15.2%
14.0%
15.3%16.3%
16.9%17.8%
1998 1999 2000 2001 2002 2003 2004
19.3%
2005
20.0%
2006
18.9%
2007
16.5%
2008
14.1%
2009
16.1%
2010
18.3%
2011
17.7%
Economic – ROIC measures EVA in a percentage format.
EROIC is calculated by dividing net operating profit after taxes
(NOPAT) by the average invested capital.
Page 37

The Hershey Company
Market Summary 2011 2010 2009 2008 2007
Outstanding Shares of Common Stock and Class B Common Stock at Period-End (000) 225,206 227,030 227,998 227,035 227,050
Avg. Number of Shares of Common Stock and Class B Common Stock Outstanding YTD (000)
Basic 226,574 227,740 227,845 227,486 228,863 Diluted 229,919 230,313 228,995 228,697 231,449
Market Price of Common Stock at End of Period 61.78 47.15 35.79 34.74 39.40
Range (YTD) Low 46.24 35.76 30.27 32.10 38.21 High 62.26 52.1 42.25 44.32 56.75
Number of Common Stock and Class B Common Stock Holders at Year-End 38,244 39,132 39,967 40,549 40,901
Year-End Book Value Per Share 3.87 4.13 3.33 1.54 2.75
Year-End Market to Book 1,594% 1,142% 1,073% 2,254% 1,435%
Dividends Paid Per Share (YTD) Common Stock 1.3800 1.2800 1.1900 1.1900 1.1350 Class B Common Stock 1.2500 1.1600 1.0712 1.0712 1.0206 Year-End Yield on Dividends Paid 2.23% 2.71% 3.32% 3.43% 2.88%Payout Ratio - Continuing Operations 47% 48% 53% 61% 52%
Page 38
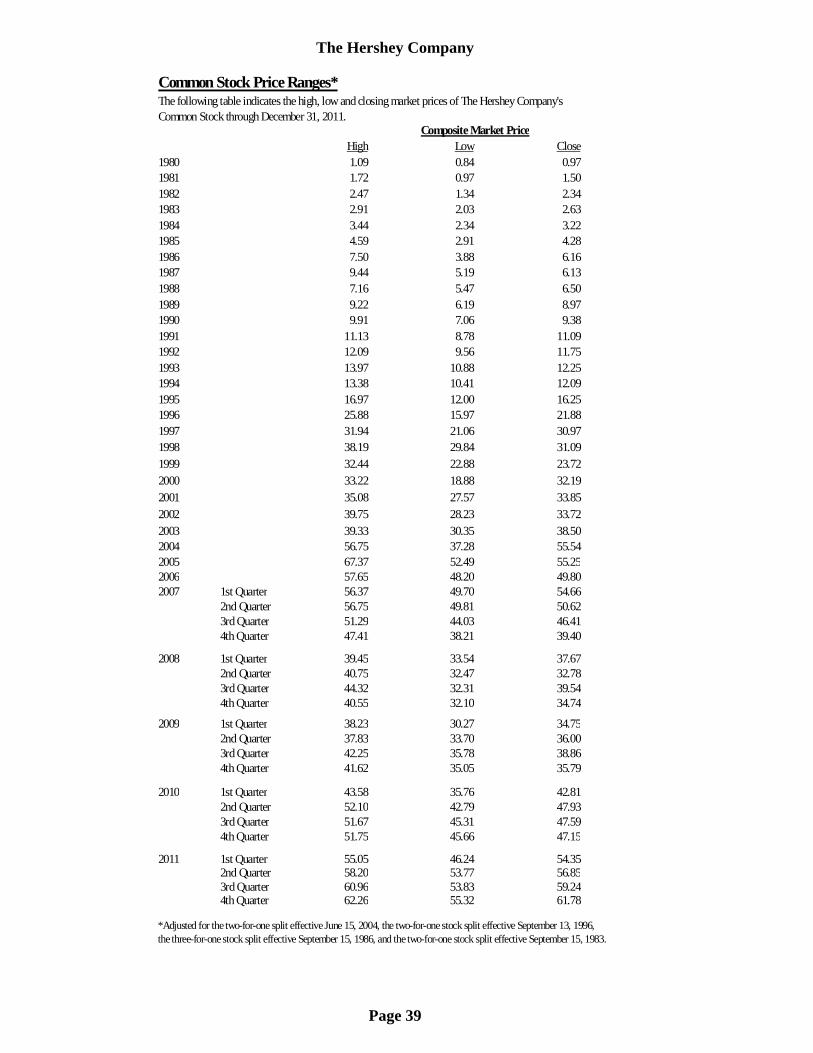
The Hershey Company
Page 39
Common Stock Price Ranges*The following table indicates the high, low and closing market prices of The Hershey Company'sCommon Stock through December 31, 2011.
Composite Market PriceHigh Low Close
1980 1.09 0.84 0.971981 1.72 0.97 1.501982 2.47 1.34 2.341983 2.91 2.03 2.631984 3.44 2.34 3.221985 4.59 2.91 4.281986 7.50 3.88 6.161987 9.44 5.19 6.131988 7.16 5.47 6.501989 9.22 6.19 8.971990 9.91 7.06 9.381991 11.13 8.78 11.091992 12.09 9.56 11.751993 13.97 10.88 12.251994 13.38 10.41 12.091995 16.97 12.00 16.251996 25.88 15.97 21.881997 31.94 21.06 30.971998 38.19 29.84 31.091999 32.44 22.88 23.722000 33.22 18.88 32.192001 35.08 27.57 33.85 2002 39.75 28.23 33.722003 39.33 30.35 38.502004 56.75 37.28 55.542005 67.37 52.49 55.252006 57.65 48.20 49.802007 1st Quarter 56.37 49.70 54.66
2nd Quarter 56.75 49.81 50.623rd Quarter 51.29 44.03 46.414th Quarter 47.41 38.21 39.40
2008 1st Quarter 39.45 33.54 37.672nd Quarter 40.75 32.47 32.783rd Quarter 44.32 32.31 39.544th Quarter 40.55 32.10 34.74
2009 1st Quarter 38.23 30.27 34.752nd Quarter 37.83 33.70 36.003rd Quarter 42.25 35.78 38.864th Quarter 41.62 35.05 35.79
2010 1st Quarter 43.58 35.76 42.812nd Quarter 52.10 42.79 47.933rd Quarter 51.67 45.31 47.594th Quarter 51.75 45.66 47.15
2011 1st Quarter 55.05 46.24 54.352nd Quarter 58.20 53.77 56.853rd Quarter 60.96 53.83 59.244th Quarter 62.26 55.32 61.78
*Adjusted for the two-for-one split effective June 15, 2004, the two-for-one stock split effective September 13, 1996, the three-for-one stock split effective September 15, 1986, and the two-for-one stock split effective September 15, 1983.

The Hershey Company
MANAGEMENT TEAM
Chief Executive Officer
Page 40
John P. Bilbrey President and Chief Executive Officer
Global Leadership Team
Humberto P. Alfonso Executive Vice President, CFO and Chief Administrative Officer
Michele G. Buck Senior Vice President, Chief Growth Officer
Thaddeus J. Jastrzebski Senior Vice President, President, Americas
Terence L. O’Day Senior Vice President, Global Operations Peter F. Smit Senior Vice President, President, Asia, Middle East & Africa
Burton H. Snyder Senior Vice President, General Counsel and Secretary
E. Daniel Vucovich, Jr. Senior Vice President, President, United States
Kevin R. Walling Senior Vice President, Chief Human Resources Officer D. Michael Wege Senior Vice President, Chief Commercial Officer

The Hershey Company
Page 41
The Hershey Company is the largest producer of quality chocolate in North America and a global leader in chocolate and sugar confectionery. Our principal product groups include chocolate and sugar confectionery products; pantry items, such as baking ingredients, toppings and beverages; and gum and mint refreshment products. Reportable Segment
We operate as a single reportable segment in manufacturing, marketing, selling and distributing our products under more than 80 brand names. Our three operating segments comprise geographic regions including the United States, the Americas, and Asia, Europe, the Middle East and Africa. We market our products in approximately 70 countries worldwide.
Organization We operate under a matrix reporting structure designed to ensure continued focus on North America and on continuing our transformation into a more global company. Our business is organized around geographic regions and strategic business units. It is designed to enable us to build processes for repeatable success in our global markets. Our geographic regions are accountable for delivering our annual financial plans. The key regions are:
The United States; The Americas, including Canada, Mexico, Brazil, Central America, Puerto Rico and global exports; and Asia, Europe, the Middle East and Africa.
In addition, the Hershey Experience manages our retail operations globally, including Hershey’s Chocolate World in Hershey, Pennsylvania, and Hershey’s retail stores in New York City, Chicago, Niagara Falls (Ontario), Shanghai, Dubai, and Singapore. Our two strategic business units are the chocolate business unit and the sweets and refreshment business unit. These strategic business units focus on certain components of our product line and are responsible for building and leveraging Hershey’s global brands, and disseminating best demonstrated practices around the world.

The Hershey Company
OPERATIONS
THE HERSHEY COMPANY: The United States of America
The U.S. confectionery industry was approximately $19.3 billion in 2010 at wholesale (including gum). Hershey is the market leader in chocolate confectionery in the United States. Using Department of Commerce data per below, the total U.S. confectionery industry demonstrates a 8-year compound annual growth rate of 2.9%. The chocolate category grew at 3.5%. Non-chocolate grew at 2.5%.
Total ConfectioneryApparent Consumption in Dollars (billions)
2002-2010
Source: US Department of Commerce, IBI updated 10/2011
Note: Apparent Consumption = Manufacturer Shipments – Exports + Imports
8.8 9.4 10.0 10.2 10.2 10.6 11.0 11.5
4.9 5.05.4 5.7 5.8 5.7 5.6 5.7
5.91.81.8
1.9 1.7 1.8 1.6 1.9 1.81.9
10.3
2002 2003 2004 2005 2006 2007 2008 2009 2010
Chocolate Sugar Conf. Gum
$15.4 $16.3$17.3 $17.6 $17.8 $18.1$17.5
$18.5$19.3
Page 42

The Hershey Company
Total ConfectioneryApparent Consumption In Pounds (billions)
2002 - 2010
3.4 3.4 3.4 3.6 3.5 3.4 3.5 3.6
2.9 3.0 3.13.3 3.4 3.3 3.3 3.3 3.3
0.5 0.5 0.50.5 0.5 0.5 0.4 0.4 0.4
3.6
2002 2003 2004 2005 2006 2007 2008 2009 2010
Chocolate Sugar Conf. Gum
6.7 6.9 7.1 7.3 7.4
Source: US Department of Commerce, IBI updated 10/2011
Note: Apparent Consumption = Manufacturer Shipments – Exports + Imports
7.3 7.1 7.2 7.4
Competition Major competition for Hershey's confectionery brands in the United States is provided by M & M/Mars, Wrigley, and Nestle. Hershey products also compete on a local basis with many local/regional brands.
Page 43

The Hershey Company
The confectionery industry is made up of over 1,200 brands and approximately 1,000 companies. However, only 15 to 20 companies have national distribution while the others enjoy only local or regional distribution. The following market share data for the food, drug, mass merchandiser [excluding Wal-Mart] and convenience store classes of trade [FDMxC] represents approximately 65% of The Hershey Company's retail sales.
2011 Change vs. 2010Mars/Wrigley 31.7 % -0.4 pts.Hershey 28.7 % 0.8 pts.
Cadbury (Adams) 7.4 % -0.5 pts.Nestle 5.4 % -0.1 pts.
Private Label 2.7 % 0.0 pts.R. Stover 2.5 % 0.1 pts.Lindt/Ghirardelli 2.2 % 0.0 pts.All Other 19.4 % 0.0 pts.
Category $ Growth at Retail: 4.5%Hershey $ Growth at Retail: 7.5%
IRI/Neilsen ($): Candy/Mint/Gum TOTUS F/D/MX/C
US Total Confectionery Market ShareFDMxC ($) 52 weeks ending 12/31/11
2011 Change vs. 2010Hershey 43.3 % 0.3 pts.
Mars/Wrigley 30.7 % 0.0 pts.Nestle 6.2 % -0.2 pts.R. Stover 4.6 % 0.1 pts.Lindt/Ghirardelli 4.1 % 0.0 pts.All Other 11.1 % -0.2 pts.
Category $ Growth at Retail: 6.5%Hershey $ Growth at Retail: 7.2%
IRI/Neilsen ($): Candy/Mint/Gum TOTUS F/D/MX/C
FDMxC ($) 52 weeks ending 12/31/11
US Chocolate Market Share
Page 44
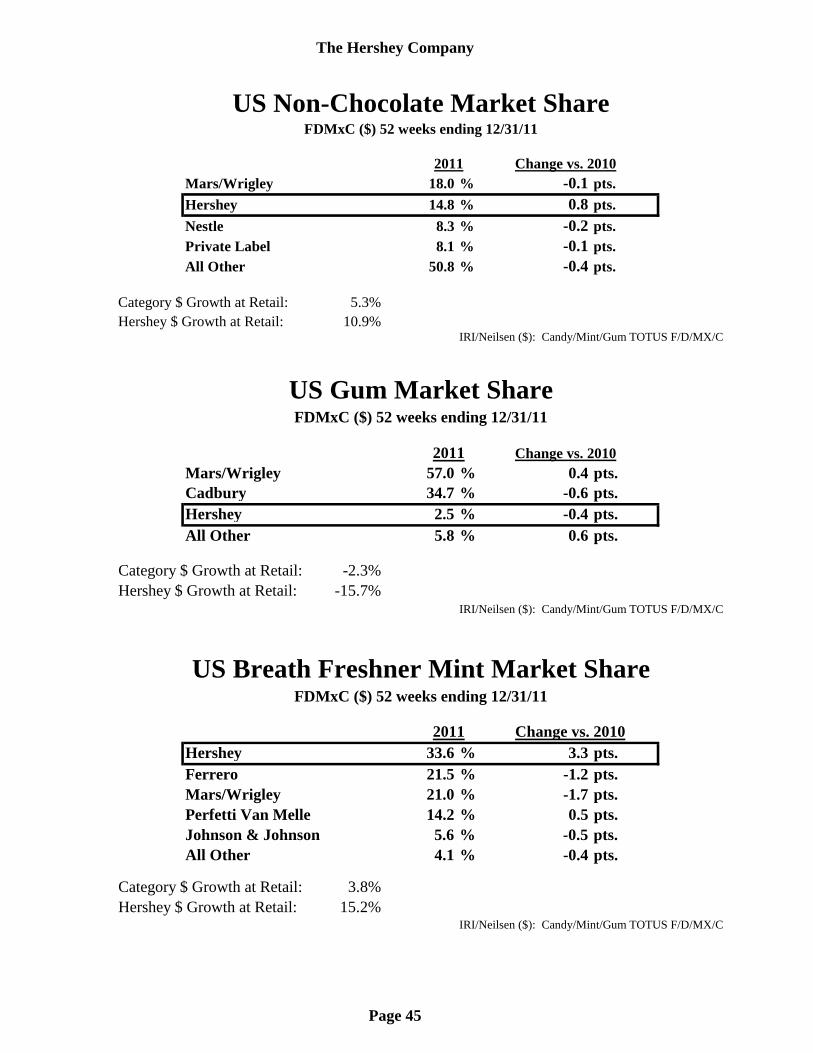
The Hershey Company
Change vs. 2010Mars/Wrigley 18.0 % -0.1 pts.
Hershey 14.8 % 0.8 pts.
Nestle 8.3 % -0.2 pts.Private Label 8.1 % -0.1 pts.All Other 50.8 % -0.4 pts.
Category $ Growth at Retail: 5.3%Hershey $ Growth at Retail: 10.9%
IRI/Neilsen ($): Candy/Mint/Gum TOTUS F/D/MX/C
Change vs. 2010Mars/Wrigley 57.0 % 0.4 pts.Cadbury 34.7 % -0.6 pts.Hershey 2.5 % -0.4 pts.All Other 5.8 % 0.6 pts.
Category $ Growth at Retail: -2.3%Hershey $ Growth at Retail: -15.7%
IRI/Neilsen ($): Candy/Mint/Gum TOTUS F/D/MX/C
Change vs. 2010Hershey 33.6 % 3.3 pts.Ferrero 21.5 % -1.2 pts.Mars/Wrigley 21.0 % -1.7 pts.Perfetti Van Melle 14.2 % 0.5 pts.Johnson & Johnson 5.6 % -0.5 pts.All Other 4.1 % -0.4 pts.
Category $ Growth at Retail: 3.8%Hershey $ Growth at Retail: 15.2%
IRI/Neilsen ($): Candy/Mint/Gum TOTUS F/D/MX/C
US Non-Chocolate Market ShareFDMxC ($) 52 weeks ending 12/31/11
US Gum Market ShareFDMxC ($) 52 weeks ending 12/31/11
US Breath Freshner Mint Market ShareFDMxC ($) 52 weeks ending 12/31/11
2011
2011
2011
Page 45

The Hershey Company
Customers
Full-time sales representatives and food brokers sell our products to our customers. Our customers are mainly wholesale distributors, chain grocery stores, mass merchandisers, chain drug stores, vending companies, wholesale clubs, convenience stores, dollar stores, concessionaires, and department stores. Our customers then resell our products to end-consumers in retail outlets in North America and other locations worldwide. In 2011, sales to McLane Company, Inc., one of the largest wholesale distributors in the United States to convenience stores, drug stores, wholesale clubs and mass merchandisers, amounted to approximately 22.3% of our total net sales. McLane Company, Inc. is the primary distributor of our products to Wal-Mart Stores, Inc.
Page 46
14
25
CC-- SSttoorreess
8
11
4 5
33 DDrruugg SSttoorreess
WWhhoolleessaallee CClluubbss
DDoollllaarr SSttoorreess
AAllll OOtthheerr
4422%%
Source: Hershey Internal Data
Source: Datamonitor, IRI Hershey Estimates
Snack/NutritionBars
Bakery Snacks
Salty Snacks
Cookies/Crackers
Confectionery
4%
13%
27%
16%
40%
U.S. Snack Market $80bn
SSuuppeerrmmaarrkkeettss
MMaassss MMeerrcchhaannddiisseerrss
PPeerrcceenntt ooff SSaalleess

The Hershey Company
Page 47
Products
United States
The primary products we sell in the United States include the following:
Under the HERSHEY’S brand franchise:
HERSHEY’S milk chocolate bar HERSHEY’S BLISS chocolates HERSHEY’S milk chocolate with almonds bar HERSHEY’S COOKIES ‘N’ CRÈME candy bar HERSHEY’S Extra Dark candy HERSHEY’S COOKIES ‘N’ CRÈME DROPS candy HERSHEY’S NUGGETS chocolates HERSHEY’S POT OF GOLD boxed chocolates HERSHEY’S DROPS chocolates HERSHEY’S sugar free chocolate candy HERSHEY’S AIR DELIGHT aerated milk chocolate HERSHEY’S HUGS candies HERSHEY’S MINIATURES chocolate candy
Under the REESE’S brand franchise:
REESE’S peanut butter cups REESE’S sugar free peanut butter cups REESE’S peanut butter cups minis REESE’S crispy and crunchy bar REESE’S PIECES candy REESE’S WHIPPS candy bar REESE’S BIG CUP peanut butter cups REESESTICKS wafer bars REESE’S NUTRAGEOUS candy bar REESE’S FAST BREAK candy bar
Under the KISSES brand franchise:
HERSHEY’S KISSES brand milk chocolates HERSHEY’S KISSES brand milk chocolates with almonds HERSHEY’S KISSES brand milk chocolates with cherry cordial crème HERSHEY’S KISSES brand chocolate meltaway milk chocolates HERSHEY’S KISSES brand milk chocolates filled with caramel HERSHEY’S KISSES brand SPECIAL DARK chocolates HERSHEY’S KISSES AIR DELIGHT aerated milk chocolates
Our other products we sell in the United States include the following:
5th AVENUE candy bar ALMOND JOY candy bar ALMOND JOY PIECES candy CADBURY chocolates CARAMELLO candy bar GOOD & PLENTY candy HEATH toffee bar JOLLY RANCHER candy JOLLY RANCHER sugar free candy KIT KAT wafer bar MILK DUDS candy MOUNDS candy bar MR. GOODBAR chocolate bar PAYDAY peanut caramel bar ROLO caramels in milk chocolate SKOR toffee bar
SPECIAL DARK chocolate bar SPECIAL DARK PIECES candy SYMPHONY milk chocolate bar SYMPHONY milk chocolate bar with almonds and toffee TAKE5 candy bar THINGAMAJIG candy bar TWIZZLERS candy TWIZZLERS sugar free candy WHATCHAMACALLIT candy bar WHOPPERS malted milk balls YORK peppermint pattie YORK sugar free peppermint pattie YORK PIECES candy ZAGNUT candy bar ZERO candy bar
We also sell products in the United States under the following product lines:
Premium products Artisan Confections Company, a wholly-owned subsidiary of The Hershey Company, markets SCHARFFEN BERGER high-
cacao dark chocolate products, and DAGOBA natural and organic chocolate products. Our SCHARFFEN BERGER products include chocolate bars, tasting squares and home baking products. DAGOBA products include chocolate bars, drinking chocolate and baking products.

The Hershey Company
Page 48
Products (continued)
Snack products
Our snack products include HERSHEY’S 100 calorie bars in several varieties, and MAUNA LOA macadamia snack nuts.
Refreshment products
Our line of refreshment products includes ICE BREAKERS mints and chewing gum, ICE BREAKERS ICE CUBES chewing gum, BREATH SAVERS mints, and BUBBLE YUM bubble gum.
Pantry items
Pantry items include HERSHEY’S, REESE’S, HEATH, and SCHARFFEN BERGER baking products. Our toppings and sundae syrups include REESE’S, HEATH and HERSHEY’S. We sell hot cocoa mix under the HERSHEY’S BLISS brand name.
Americas
The primary products we sell in the Americas include the following:
Canada
Principal products we sell in Canada are HERSHEY’S milk chocolate bars and milk chocolate with almonds bars; OH HENRY! candy bars; REESE PEANUT BUTTER CUPS candy; HERSHEY’S KISSES brand milk chocolates; TWIZZLERS candy; GLOSETTE chocolate-covered raisins, peanuts and almonds; JOLLY RANCHER candy; WHOPPERS malted milk balls; SKOR toffee bars; EAT MORE candy bars; POT OF GOLD boxed chocolates; and CHIPITS chocolate chips.
Mexico
We manufacture, import, market, sell and distribute chocolate, sweets, refreshment and beverage products in Mexico, under the HERSHEY’S, KISSES, JOLLY RANCHER and PELÓN PELO RICO brands.
Brazil
We manufacture, import and market chocolate, sweets and refreshment products in Brazil, including HERSHEY’S chocolate and confectionery items and IO-IO items.
Global Exports
We also import, market, sell and distribute chocolate, sweets and refreshment products in Central America and Puerto Rico, and export products to approximately 70 countries worldwide.
Asia, Europe, Middle East and Africa
We manufacture, market, sell and distribute sugar confectionery, beverage and cooking oil products in India, including NUTRINE and GODREJ confectionery and beverage products. We market, sell and distribute chocolate products in China, primarily under the HERSHEY’S and KISSES brands. We market, sell and distribute chocolate products in the Middle East, primarily under the HERSHEY’S, REESE’S and KISSES brands. We license the VAN HOUTEN brand name and related trademarks to sell chocolate products, cocoa, and baking products in Asia and the Middle East for the retail and duty-free distribution channels.

The Hershey Company
Page 49
CANADA On June 29, 1987, Hershey purchased the assets and trademark rights of Nabisco Brands Ltd.'s Canadian confectionery and snack nut businesses. These businesses included candy sold under the brands Oh Henry!, Eat-More, Glosette and Lowney, hard roll candy sold under the brand names Life Savers and Breath Savers, peanuts and other nuts sold under the brand name Planter's, baking chips sold under the brand name Chipits, boxed chocolates sold under the Moirs brand name, and gum and chewy candy sold under the Care*Free and Bubble Yum brands. (The gum and chewy candy business was sold in November 1988.) The acquisition tripled Hershey's Canadian sales, making it a leading confectioner in that country. In early 1996, the company sold the assets and trademark rights of the snack nut (Planters) and hard roll candy (Life Savers/Breath Savers) businesses. On December 31, 1996, as part of the North American acquisition of the Leaf business, Hershey Canada purchased the shares of Leaf Canada Inc. acquiring the rights to the Rainblo and Jolly Rancher ball gum business, Whoppers malted candy, Jolly Rancher candy and Mr. Freeze and Jolly Rancher water-based freezer snack business, and included a production facility in Scarborough, Ontario. The acquisition also included a significant non-branded, bulk ball gum business distributing to vending machine operators in Canada and the United States. The two corporations were merged into one, effective at the end of May 1997. Subsequently, it was determined that the bulk vend ball gum business and the Scarborough plant did not fit strategically into the business of Hershey’s North America. The manufacturing assets were sold on February 28, 1998. Production of the freezer snack businesses was moved to Hershey Canada’s Smiths Falls plant. Hershey Canada divested the gum business completely in September 2003 and divested the freezer snack business in October 2005. On February 15, 2007, The Hershey Company announced a plan to transform its global supply chain. As a result of this initiative, the decision was made in 2007 to close all 3 manufacturing locations in Canada and transfer production to facilities in the US and Mexico. The Montreal, Quebec and Dartmouth, Nova Scotia factories were closed at the end of 2007, and the Smiths Falls, Ontario plant at the end of 2008. Hershey Canada continues to operate a Distribution Center in Mississauga.

The Hershey Company
4-YearRetail Sales* 2010 2009 2008 2007 2006 CAGRCanada
Total Confection 3.68 3.58 3.50 3.40 3.27 3.0%Chocolate 2.57 2.48 2.41 2.32 2.23 3.7%Non-Chocolate 0.60 0.60 0.60 0.61 0.60 -0.3%Gum 0.51 0.50 0.49 0.47 0.44 3.9%
* Source: Euromonitor
Retail Confectionery Market($Billions)
Competition Prior to the acquisition of Nabisco Brands Ltd’s businesses in 1987, Hershey’s Canadian operations enjoyed market share leadership in licorice, sundae toppings and liquid milk modifiers. As a result of the acquisition, market share leadership was attained in the baking chips category and this leadership was further strengthened. In addition, Hershey has built its acquired boxed chocolate business into the number two market share position with Pot of Gold chocolates being Canada’s number one brand. Finally, Hershey currently holds the number two position in the important chocolate bar market. Other competitors in this latter category include Nestle, Cadbury and Mars.
Canadian Chocolate Market Share52 weeks ending December 17, 2011 - 5 Channels
$ Shr
Nestle 19.8 -0.4 ptsKraft Cadbury 18.0 -0.1 pts
Hershey 17.0 0.5 ptsMars 11.1 0.0 ptsLindt 8.7 0.1 ptsFerrero 6.1 0.1 ptsControl Label 5.2 0.6 ptsAll Other 14.3 -0.7 pts
$ ShrNestle Boxed 19.2 1.0 pts.Ferrero Boxed 18.0 0.1 pts.Hershey Boxed 12.4 0.1 pts.Lindt Boxed 11.3 -0.6 pts.Control Label Boxed 7.6 1.5 pts.Russell Stover Boxed 5.7 0.1 pts.Kraft Cadbury Boxed 5.2 0.1 pts.Storck Boxed 4.0 0.7 pts.Ganong Boxed 2.4 -0.3 pts.Laura Secord Boxed 1.5 -0.6 pts.All Other Boxed 12.6 -2.1 pts.
52 weeks ending December 17, 2011 - 5 Channels
Change yr. Over yr.
Change yr. Over yr.
Canadian Boxed Chocolate Market Share
Page 50

The Hershey Company
Page 51
Classes of Trade Hershey's Canadian channels of distribution are essentially the same as those utilized by the Company’s U.S. operation. A significant difference in the Canadian market is the consolidation of the food retail business which concentrates wholesale purchasing decisions to a much greater degree than in the United States, i.e., the Top 5 customers in Canada control almost 70% of all grocery sales1. Canadian Products Hershey markets many of the same brands in the Canadian market as it does in the United States, using a slightly different formula for Hershey's milk chocolate to better satisfy Canadian tastes. In addition, there are products sold solely to the Canadian market including: Almondillos chocolate Bridge Mixture candy Cherry Blossom candy Chipits baking chocolate Eat-More candy Glosette candy Goodies Licorice Candy Y&S Licorice Candy Pipes Lowney chocolates Oh Henry! Chocolate bar
The Hershey Company
Page 52
Transactions and Alliances On August 17, 2004, Hershey Mexico acquired the assets and brands of Grupo Lorena, a major confectionery business in Mexico with relevant presence in the US Hispanic community. Main brands are Pelon Pelo Rico in Spicy confectionery and Crayon in sugar confectionery. On January 29, 2007 the Company announced a manufacturing joint venture in China with Lotte Confectionery Co., Ltd, Korea’s leading confectionery and ice cream manufacturer. The joint venture produces for the Company Hershey’s branded products for sale in China and other Asian markets. On April 3, 2007 the Company announced the formation of a joint venture in India with Godrej Industries Ltd to manufacture and distribute confectionery products, snacks and beverages across India. On 24 January, 2008 the Company announced the formation of a joint venture in Brazil with Pandurata Alimentos Ltda (manufacturer of products sold in Brazil and Latin America under the Bauducco brand) to manufacture, sell and distribute Hershey’s branded products across Brazil using the Bauducco distribution network. Effective February 28, 2009 the Company licensed the Van Houten brand from Barry Callebaut. Specifically, Hershey has a perpetual and exclusive license of the Van Houten brand name and related trademarks in Asia Pacific, the Middle East and Australia/New Zealand for consumer products. Founded in 1990, Van Houten Singapore successfully develops and markets popular consumer chocolate products throughout Asia. This acquisition complements the Company's existing business in Asia and gives Hershey an immediate in-market presence in several high-potential markets, including Malaysia and Indonesia. The investment was about $15 million, or approximately 1-times sales.

The Hershey Company
HERSHEY INTERNATIONAL
4-YearRetail Sales* 2010 2009 2008 2007 2006 CAGR
JapanTotal Confection $10.0 $10.2 $10.0 $10.0 $10.0 0.0%Chocolate $4.2 $4.3 $4.3 $4.3 $4.3 -0.6%Non-Chocolate $3.7 $3.8 $3.7 $3.7 $3.6 0.7%Gum $2.1 $2.1 $2.0 $2.1 $2.1 -0.3%
ChinaTotal Confection $9.5 $8.7 $8.3 $7.8 $7.2 7.0%Chocolate $1.4 $1.2 $1.1 $1.0 $0.9 11.0%Non-Chocolate $5.8 $5.4 $5.2 $5.0 $4.7 5.8%Gum $2.3 $2.1 $2.0 $1.8 $1.7 8.2%
BrazilTotal Confection $11.1 $9.7 $8.9 $7.8 $7.2 11.4%Chocolate $4.9 $4.3 $3.8 $3.3 $2.8 15.0%Non-Chocolate $4.2 $3.6 $3.4 $3.1 $3.0 8.7%Gum $2.0 $1.8 $1.7 $1.4 $1.4 9.2%
South KoreaTotal Confection $1.0 $1.0 $1.0 $1.0 $1.0 1.0%Chocolate $0.4 $0.4 $0.4 $0.4 $0.4 2.6%Non-Chocolate $0.3 $0.3 $0.3 $0.3 $0.3 -0.2%Gum $0.3 $0.3 $0.3 $0.3 $0.3 0.3%
PhilippinesTotal Confection $0.7 $0.7 $0.6 $0.6 $0.5 5.2%Chocolate $0.3 $0.3 $0.3 $0.2 $0.2 6.1%Non-Chocolate $0.3 $0.3 $0.3 $0.3 $0.3 4.3%Gum $0.1 $0.1 $0.1 $0.1 $0.1 5.5%
IndiaTotal Confection $1.6 $1.3 $1.1 $0.9 $0.8 20.2%Chocolate $0.8 $0.6 $0.5 $0.4 $0.3 25.4%Non-Chocolate $0.6 $0.5 $0.4 $0.4 $0.4 12.1%Gum $0.3 $0.2 $0.2 $0.1 $0.1 28.9%
* Source: Euromonitor
Global Retail Confectionery Market($Billions)
Page 53

The Hershey Company
Commodities Cocoa Products Cocoa products such as cocoa butter, chocolate liquor and cocoa powder are key raw materials used in the production of the Company’s chocolate products. Cocoa beans are utilized by The Hershey Company’s suppliers to produce these cocoa products. The cocoa beans utilized by our suppliers are imported principally from West African, South American and Far Eastern equatorial regions. West Africa accounts for approximately 70% of the world's crop. Cocoa beans are not uniform, and the various grades and varieties reflect the diverse agricultural practices and natural conditions found in the many growing areas. Movements in cocoa bean prices are the primary driver of movements in cocoa product cost. It attempts to minimize the effect of cocoa bean price fluctuations by forward purchasing, from time to time, substantial quantities of chocolate liquor and cocoa powder and butter, and through the purchase and sale of cocoa futures and options contracts. The following graph depicts the movement of cocoa prices experienced since 1970, as measured by the average monthly closing prices on the ICE Futures U.S. commodity exchange in New York. The graph does not exactly represent the cost incurred by a cocoa buyer (since it does not reflect the varying premiums paid for higher quality beans, varying delivery times, or the price of imported chocolate liquor and cocoa butter). However, it is indicative of the cocoa bean cost movements chocolate manufacturers have confronted in the market place during this period of time.
Page 54
Cocoa Prices Monthly Average Settlement Prices* (as of December 2011)
Cents per pound
0
20
40
60
80
100
120
140
160
90 91 92 93 94 95 96 97 98 99 00 01 02 03 04 05 06 07 08 09 10 11
Source: Intercontinental Exchange
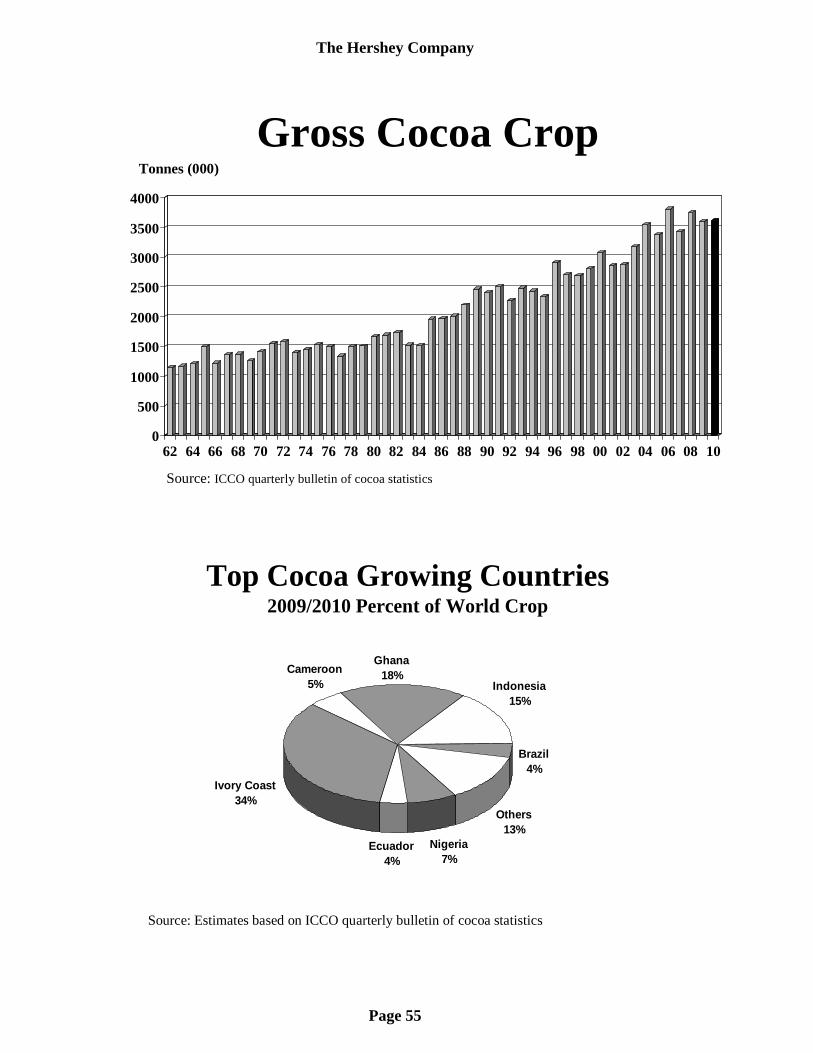
The Hershey Company
0
500
1000
1500
2000
2500
3000
3500
4000
62 64 66 68 70 72 74 76 78 80 82 84 86 88 90 92 94 96 98 00 02 04 06 08 10
Tonnes (000)
Gross Cocoa Crop
Source: ICCO quarterly bulletin of cocoa statistics
Ecuador4%
Indonesia15%
Ghana18%
Ivory Coast34%
Others13%
Brazil4%
Cameroon5%
Nigeria7%
Top Cocoa Growing Countries2009/2010 Percent of World Crop
Source: Estimates based on ICCO quarterly bulletin of cocoa statistics
Page 55

The Hershey Company
Sugar The U.S. price of sugar is subject to price supports under the Food, Conservation and Energy Act of 2008. Due to import quotas and duties imposed to support the price of sugar established by that legislation, sugar prices paid by United States users are currently substantially higher than prices on the world sugar market. The average wholesale list price of refined sugar, F.O.B. Northeast, has remained in a range of 25¢ to 45¢ per pound for the past ten years. The Company utilizes forward purchasing and other procurement practices, including, from time to time, the purchase and sale of sugar futures contracts. Therefore, the reported prices of sugar are not necessarily indicative of the Company's actual costs.
World Sugar Prices Monthly Average Settlement Prices* (as of January 2012)
Cents per pound
0
5
10
15
20
25
30
35
90 91 92 93 94 95 96 97 98 99 02 03 04 05 06 07 08 09 10 11 1200 01Year
Source: Intercontinental Exchange *Average of nearest 3 futures contracts
Sugar Prices: Domestic vs WorldMonthly Average Settlement Prices* (as of January 2012)
0
5
10
15
20
25
30
35
40
90 91 92 93 94 95 96 97 98 99 00 01 02 03 04 05 06 07 08 09 10 11 12
Cents per pound
*Average of nearest 3 futures contractsSource: Intercontinental Exchange
World Raws Price
Domestic Raws Price
Year
Page 56

The Hershey Company
Manufacturing and Distribution The Company owns and operates 11 principal confectionery manufacturing plants in North America.
Regional Distribution Centers
HSY Plants and Distribution Centers:
Robinson, IL
Memphis, TN
Monterrey, Mex
Hershey, PA (3)Lancaster, PAHazleton, PA
Hershey Area Distribution (2)
Stuarts Draft, VA
Ogden, UT
Plants
Edwardsville, ILHilo, HI
Guadalajara, Mex (2)
Mississauga, ON
Guadalajara Distribution
Page 57