factor market imperfections and rural land rental markets
TRANSCRIPT
Factor Market Imperfections and Rural Land Rental Markets in Northern
Ethiopian Highlands
By Hosa’ena Ghebru and Stein Holden
Department of Economics and Resource Management Norwegian University of Life Sciences
P.O. Box 5033, N_1432, Ås, Norway
Email: [email protected]
Abstract
In response to the national land policy that bans the formal land markets (sales
market) and the infrequent administrative land redistribution, the informal land rental
markets in Ethiopia plays a pivotal role in smoothing the imperfections in other farm
factor markets. A three round household panel data set (1998, 2001 and 2003) from
the northern highlands of Ethiopia (Tigrai) has been used to empirically explore the
determinants of participation and intensity of transaction in the land rental market
and assess the role of the recent regional policy reform that halts further land
redistribution and executes certification of rural land ownership titles. Results from
the study indicate that the land rental market (which involves 53% of the sample
respondents) serves as a crucial venue to correct the disproportional distribution
factor endowments and the imperfections in the non-land factor markets. However,
frictions in the land rental market itself cannot be denied which was found to
asymmetrically (unequally) affect the demand and supply sides of the tenancy market.
Though the study does not provide evidences to support the bargaining power of farm
households, the large number of constrained tenant households as compared to
landlords implies that, even if tenants are with better endowments of farm asset and
other durable asset endowments, the fragmented land holding may cause the supply
constrained tenancy market that favours landlord households. Thus, policy measures
to facilitate the transferability of land (legal enforcement of lease contracts) and
functioning of other farm input markets can significantly enhance the allocative
efficiency role of the rural land rental markets.
Key words: Land tenancy, market participation, transaction cost, selection bias, Ethiopia

2
I. INTRODUCTION
With markets being perfect, renting or buying land would be identical. Tenants
would pay rent to landlords and buyers would pay equivalent amounts to bank as
interest to loans. In a world, however, with asymmetric information (costly or
unavailable) and market imperfections in capital and various agricultural inputs
markets, there are good reasons for farm households (landlords and tenants) to prefer
transferring land through land lease markets than the formal land markets (buying and
selling). Here tenancy contracts are serving as way of tackling the market
imperfections in the land, labour, capital and other agricultural input markets.
(Sadoulet et al: 1998).
Besides the acute market imperfections for farm factors of production and high
transaction cost of non-land factor markets, the Ethiopian constitutions (1995) gives
the land rental markets an exceptional importance making it the only venue of land
transfer among farmers. In the current constitution (Ethiopian constitution - article 40
/ 1995) the right of ownership of rural and urban land, as well as natural resources, is
exclusively vested in the state and the peoples of Ethiopia. It further states that land is
a common property of the nations, nationalities and peoples of Ethiopia and shall not
be subject to sale or any other means of exchange.
In this context of prohibited land sales, mounting land scarcity and reduced frequency
of land reallocation, land rental markets take a particular importance with possible
efficiency and equity effects. Indeed, to the extent that land use rights cannot be
given to all farmers, access to land for cultivation or pasture can only be achieved
through short-term rental agreements between farmers with and without (enough)
land. Had it not been for land rental markets, such legal ban on the land sale and
purchase, and some reservations with regard to the administrative land redistribution
would have put the country in a very pressing problem of high market gap concerning
the demand and supply of rural arable land. Owing to this fact, the functioning of
such rural land rental markets affect, in one way or another, the functioning of the
overall economy and the strive towards poverty reduction.
As the constitution permits, short-term leases, such as rental and sharecropping, are
practiced all over the country [Ethiopia] in response to land scarcity in all regions.

3
Moreover, the regional land policy reform in the study area (Tigray) that halts
administrative land redistribution and certification of land ownership titles magnify
the role the informal land lease market could play in providing access to land and
facilitate households’ farm resource adjustment decisions.
The rural land tenancy market has received ample attention, both theoretically and
empirically. Much of the attentions, however, has focussed on the efficiency aspects
of alternative land tenure contracts (Otsuka, Chuma, and Hayami, 1992; Singh, 1989;
Otsuka and Hayami, 1988; Pender and Fafchamps, 2001; Stiglitz, 1974; Sadoulet et
al., 1997; Gavian and Ehui, 1999 and Ahmed et al., 2002) while considerable studies
have also been made on factors explaining farm households’ choice among various
tenure arrangements (Chaudhuri and maitra, 1996; and Allen and Lueck, 1992).
Majority of the studies, however, fail to address the primary factors influencing the
first hand decision of households’ participation in the tenancy market. Handful
researches have been made with particular emphasis on the role of factor market
imperfections as an important factor explaining the leasing behaviour of households
(Bliss and Stern, 1982; Bell, 1977; Nabi, 1985; and Skoufias, 1995).
These empirical literatures on the leasing behaviour of households, however, are
dominated by studies conducted in South and Southeast Asia leaving the Sub-Saharan
Africa (SSA) case to be still under explored. With particular reference to Ethiopia,
despite the highly debated issue of land tenure system in the country that lasts for
several decades, few studies have been conducted that address the issue of land
tenancy market (Pender and Fafchapmps, 2001; Kebede, 2003; Deininger, 2003; and
Teklu, 2004). Similar study by Tikabo and Holden (2003) has also been conducted
using data from highlands of Eritrea, which experience, more or less, similar farming
and agro-ecological features with the study area – Tigray, Ethiopia. To the best of
our knowledge, no study has been conducted to empirically explore the role of
transaction cost (factor market imperfections) in dictating the land tenancy market in
the country. The whole theme of this paper, thus, is to help filling this research gap
in the country and the SSA at large and, thereby, evaluates the impact of the recent
policy reform that started to individualize land rights and eliminate the scope for
further land redistribution.

4
In an attempt to explore the role of factor market imperfection in dictating the leasing
behaviour of households, the study focuses on the following three broad objectives: i)
to investigate factors that affect farm households’ probability of participating (market
entry) in the informal land rental markets, ii) to assess the role of factor market
imperfections in the farm resource adjustment decisions (intensity of participation) of
household, and iii) to examine the bargaining power status (market symmetry) of the
trading partners - landlord and the tenant. We address these issues by analysing a
household survey data from 400 sample households from 16 villages of Tigray –
northern highlands of Ethiopia.1 Conceptually, we build upon the model with factor
market imperfections (see Holden et al., 2001).
The overall results of the study indicate the unique structure of the tenancy market
which contradicts the predominantly customary literature of rich landlord and poor
tenants. Supporting our basic hypothesis, the farm asset endowment variables oxen
and the tropical livestock unit other than oxen (TLUOXP) were found significantly
(with OXP at 1% level) affecting farm households’ likelihood of participation
indicating households with relatively poor endowment of such non/semi-tradable farm
inputs tend to rent-out their land while the vice versa holds true for the tenant
households. The household relative labour (male and female) endowments, however,
were found to have weak effect on the likelihood of participation on both side of the
tenancy market which can be asserted as a sign of relative abundance of farm labour
or a relatively better functioning labour market with respect to oxen.
Like the cases of non-land factor markets, the regression results show the persistence
of frictions (imperfections) in the tenancy market that cause an incomplete factor ratio
adjustment process through the land lease market. The empirical evidence shows 38%
of the non-participant households are reported as constrained households who
involuntarily assume the autarky position of the tenancy market while 33% of the
participant (tenant and landlord) households still claim to operate less than their
optimal level of land transaction.
The simultaneous test for a balanced (equal) market response of two sides of the
market (the demand and supply sides) shows the hypothesis of asymmetric
1 Due to incompleteness of data and respondent dropouts, the entire analysis in this paper considers 372
sample respondents only.

5
(unbalanced) land lease market could not be rejected at 1% level of significance. In
support of this argument, the empirical evidences show 56 % of the tenant households
operate (transact) less than their desired level - they manage to obtain 64% of their
desired level of transaction. On the contrary, it is only 5% of the landlord households
that are identified as constrained agents though, in aggregate terms, they manage to
transact 98% of their desired level of land transaction.
The rest of the thesis is organized as follows. Charter 2 presents the conceptual
framework of the paper with some testable hypotheses. Chapter 3 presents the
conceptual framework including the testable hypotheses. Estimation methods
(econometric models) utilized to analyse the probability and intensity of land rental
transactions are addressed in the fourth chapter. In addition, description of the study
area, the method of data collection and statistical description of the data are discussed
in this chapter. Chapter 5 is devoted for results and discussion of the empirical
findings of the study. Summary and conclusions of the study with important policy
implications appear in chapter 6.
II. Conceptual frame work
With well functioning markets and perfect information, no or little economic
justification can possibly be given for the existence of rural land lease market. In a
world of perfect information and complete markets with zero transaction costs, the
ownership and distribution of land only affects households’ welfare without having
any efficiency outcomes. This is so since resource adjustment for efficiency purpose
can be made in any of the factor markets: Land, labour, oxen, etc. Thus, the common
existence of the informal land tenancy market in many developing societies shows
that the standard economic theory (with market clearing price) cannot explain such
economies.
A typical feature of such agrarian economies is the tenacious persistence of
imperfections in a number of factor markets. Thus, the absence of certain markets
and the functioning of others is in response to the behavioural and material factors
that influences household production and consumption decisions. Various literatures
(Binswanger and Rosezweing, 1986; De Janvry et al., 1991) show that, in such rural

6
settings, factor markets, especially non-land factor markets, will either be highly
imperfect or simply non-existent.
Thus, factor ratio adjustments through land rental market participation can only be
justifiable by comparing the relative costs associated with transacting of such farm
inputs (in this case, only when resource adjustment costs through transactions in Non-
land (NL) farm input markets) out-weighs the land lease transactions. Given this
situation, the development of rural land rental market plays a uniquely important role
in factor ratio adjustment process. For instance, having an alternative decision either
to take part in hiring-out excess NL input or renting (leasing)-in farm land, a rational
cost effective farm household opts for the later only under the condition of
prohibitively high imperfection (transaction costs) in the NL factor markets. Land
lease markets, therefore, facilitate easy transfer of land to productive households with
different initial relative endowment of farm inputs.
With considerable variations in methods and model specifications, recent empirical
works, from Asia, Latin America and Africa, witnessed that the relative ease of cost
of transaction in the land rental market makes it more preferable alternative venue of
factor ratio adjustment.
Giving more emphasis on leasing as an adjustment of land area cultivated to farm
inputs (Explicitly mentioned as labour and bullock) fixed for the farm household,
Bliss and Stern (1982) developed a land leasing model using data from the Indian
village of Palanpur. Describing ‘Desired Cultivated Area (DCA)’ as an area which
accords with the availability of non-land farm input (labour – L and Bullock – O )
supplies for the household, the model, then, considered leasing in or our as an
adjustment of land owned ( A ) towards DCA which they call the difference as ‘Net
land leased-in (NLI)’.
Showing the possible imperfections in the land lease market, the model defined DCA
and NLI as:
(1) DCA = f ( OL , ), and
(2) NLI = h(DCA - A )
Linear approximation by a first-order Taylor series expansion of equation (2) yields,

7
(3) NLI = K + AOfLf OL φφφ −+
Where K is the constant term; ф = DCAh ∂∂ / and fL and fO respectively are
Lf ∂∂ / and Of ∂∂ /
Thus, the BS model was estimated using a reduced form econometric expression of
equation 3 as NLI = 0β + 1β L + 2β O – 3β A + e, with 3β showing the
imperfection in the land rental market. Accordingly, they argued that as 3β
(coefficient of the owned farm size) converges to -1, it has a clear evidence of a
perfectly functioning land rental market showing a complete adjustment process.
Overall, their study from India shows the imperfect functioning of the tenancy market
with a coefficient of 3β = -0.78 which was found significantly different from -1.
However, the BS model may not be a plausible approach since variables common to
decision of leasing-in and leasing-out may have different directions and degree of
influence in the two sides (the demand and supply sides) of the land rental market.
(Tikabo and Holden: 2003)
In addressing the problem of failure to capture zero values of the dependent variable,
various successive studies have utilized a censored tobit model. Studies by Pender
and Fafchamps (2000); Kebede (2003) and Deininger et al. (2003) all from Ethiopia
and studies from Skoufias (1995) were few among the recent studies that utilized the
tobit model in analysing factors explaining the leasing behaviour of households.
Using data from four villages of Ethiopia, Pender and Fafchamps (2000) addressed
the issue of leasing decisions from the demand side of the market (leasing-in
decisions). Their maximum likelihood estimates support the argument that
imperfection in the non-land factor markets (oxen market) to cause farm households
leasing in decisions for the oxen endowment variable to have a positive significant
influence. Consistent with the findings of BS, the empirical evidence from the study
shows a pronounced imperfection in the land tenancy market witnessed by the
significant positive correlation between the area under cultivation (operational land)
and the amount of land owned. Contrary to studies by Kebede (2003) from Ethiopia
which further identifies livestock holding as an important factor dictating the tenancy
market participation, labour endowment of the farm household was reported to have
weak effect on the leasing behaviour of households.

8
Using a panel data from six villages of India, Skoufias (1995) separately analyse the
demand and supply side of the market for further test of symmetry between the two
sides of the market. The empirical evidence shows that imperfections in non-land
factor markets are the key factors explaining the arrangements of the informal tenancy
market. The findings from the study described leasing decisions as ways of pooling
land to non/semi-tradable factors of production like family labour and bullocks.
Furthermore, the study witnessed considerable imperfections in the land lease market
with asymmetric (unbalanced) impacts on the demand and supply sides of the market.
Separately treating the two sides of the market, the tobit results of Deininger et al.
(2003) are consistent with findings of other fellow studies from Ethiopia magnifying
the importance of agricultural ability (relative farm resource endowment) as key
factor in dictating the leasing behaviour of households. Robust with studies from
Pender and Fafchamps (2000) but contrary to findings of Kebede (2003), the family
labour endowment was not found to have a significant effect on the leasing decision
of households. Showing the persistence of imperfection in the oxen market, however,
the livestock holding (notably oxen) of farm households significantly affects
household participation decisions.
Here, it is important to note that, in all the three studies from Ethiopia, the number of
bullocks owned by a farm household was found to play a leading role in the tenancy
market showing the high imperfection in the sales and rental markets of such farm
resource. Holden and Shiferaw (2001) confirmed this with their study from the
central highlands of Ethiopia where they found liquidity constraints and moral hazard
involved in the oxen rental market to cause the imperfection in both sales and rental
markets.
Such studies with the censored tobit model, however, were not free from criticism
since they imposes a simplifying assumption that the same set of factors to influence
the decision to participate and decisions of how much to transact. Thus, the
sequential nature of the leasing decisions with different sets of factors explaining the
first-hand decision of participation and the extent of transaction may cause a selection
bias problem with censored tobit results.

9
To escape the persistence of such sample selection problem where different factors
influencing the participation and intensity of transaction, studies by Teklu et al.
(2004) and Tikabo and Holden (2003) adopted the two stage Heckman (1979)
selection model in analysing factors explaining the leasing behaviour of households
with the later study treating the two sides of the market separately.
Using data from three villages of Ethiopia, Teklu and Lemi (2004) analyse the leasing
decision of households as a sequential decision between participation and intensity
decision focusing on the supply side of the market (leasing-out decision). The
Heckman estimation results of the study found the relative endowment of family
labour and allocated farm land size significantly affect landlords leasing decision
though it couldn’t reject the weak effect of household livestock holding on the
participation as well as intensity of transaction.
Similarly, the study by Tikabo and Holden (2003) using data from the highlands of
Eritrea found the skew ness of distribution and imperfections in the non-land farm
inputs (both labour and bullocks) play an important role in influencing the leasing
decision of households. Moreover, the study also revealed the non-symmetrical
nature of the lease market with potential tenants facing a prohibitively high
transaction cost that caused severe entry barriers. Unlike similar studies from India
and Ethiopia, the results from the study witnessed a relatively well functioning
tenancy market in Eritrea with complete resource adjustment process in the informal
rural land lease market.
III. The Model and hypotheses
As mentioned before, the missing formal land markets (sales market) and fairly
egalitarian land distribution in the country (which takes less, if not no, account of
household farming ability) call for farm households to adjust farm input combinations
either through participation in the non-land farm input markets or the informal land
(land lease) markets.

10
The basic hypothesis is that, in an attempt to adjust farm input combinations, the
persistence of relatively high imperfections in non-land factor markets as compared to
the informal land markets determines farm households’ participation and level of
transaction in the land rental market. These imperfections can be attributable to
endogenous factors related to each respective household and/or other factors which
are exogenous to the household.
Thus, given the rural setting in the study area (where land selling is legally banned)
and review of some related literatures, a theoretical model is developed that includes
imperfections in land and non-land factor markets.
The model is developed under the assumption that the non/semi-tradability of non-
land farm inputs affect households’ decisions to take part in land lease markets.
Owing to the idiosyncratic production activities in the study area due to rain-fed
nature of cultivation system, market friction is believed to be relatively higher in the
non-land factor markets as compared to the land rental market. Accordingly, it is
postulated that household specific farming ability and variation in relative endowment
of land and non-land farm inputs across farm households participation in the tenancy
market. The model below uses Holden et al. (2001) as a spring board.
Let the representative farm household ‘i’ be endowed with cultivable land (Ā), labour
supply (_
L ), and oxen power (Ō). With simplifying assumptions of: 1) perfectly
functioning farm output market, 2) complementary relationship between farm land
and non-land farm inputs; and 3) prohibitively high transaction cost of exchanging
oxen services, the farm household total income can be derived from:
1. Farm activity
2. Labour income (off-farm employment)
3. Land rental market participation.
1. Farming activity
Here, the representative household crop production activity follows the standard
production function which is given by:
Qi = f (Ai, Lia, Ōi)
Where: Ai is operational land (area under cultivation)
Lia is labour power devoted for agricultural activity

11
Ō is oxen power which is fixed2
The production function Qi satisfies the standard assumptions of production function:
fLa, fA and fo > 0 and f LaLa, fAA, and foo < 0 as well as complementarities between farm
inputs.
2. Labour income (farm and off-farm employment)
A second possibility to generate income for the farm household is by devoting LH
= L
– Lia (L
H is positive, zero and negative for households that hires in labour, non
participant and hires out labour, respectively) amount of labour in the labour market at
the endogenously determined shadow wage wΨ. Similar to the oxen exchange market,
with the idiosyncratic nature of crop production activity and fairly egalitarian land
distribution, it is assumed that farm labour employment and income generation is
limited unlike the off-farm labour employment.
3. Land rental market
As part of adjustment of farm input combination through land lease market
participation, farm households can lease out part of their land endowment or lease in
additional land for farm production (AR = Ā – Ai) ( A
R is positive, zero and negative
for households that lease in land, don’t participate and lease out land, respectively)
where AR is net land rented-in and Ai is the operational land holding.
Taking all these elements together, we obtain the representative household i’s income
yi as:
Yi = P f(Lia, Ai, Ōi) + r
Ψ(Ā – Ai) + w
Ψ ( L – Li
a)
Where: P is market price of farm output
rΨ is land rental value
wΨ is the wage rate
Ψ Є {s, * , b} s : Leased out land / Hires out labour
* : Self – sufficient in land / labour
b : Leased in land / Hires in labour
Assuming the farm household maximizes utility from income , the maximization
problem will be:
Max U = V [P f{(Ā + AR), ( L + L
H), Ō)} + r
Ψ A
R + w
Ψ L
H]
2 It is our priori belief that oxen as farm input is fixed in response to the high liquidity constraint and
seasonality of crop cultivation system that limits the oxen sales and rental markets, respectively,
accompanied by the moral hazard involved in the later case.

12
AR L
H
Where: AR, L
H Є {s, * , b}
The utility maximization problem above satisfies the standard assumption of a utility
function (twice differentiable quasi-concave utility function with positive and
negative first and second derivatives, respectively) and yields the following first order
conditions for the land and labour factors:
By differentiating the above utility maximizing problem with respect to AR (A
s, A
*,
and Ab), we may derive the following three FOC’s:
FOC1: sA
fP
∂
∂= r
s…….. the price a household face as seller (landlord)
FOC2: A
fP
∂
∂ = r
* ……the shadow price of land (endogenous price)
FOC3: bA
fP
∂
∂ = r
b …the price a household face as buyer (tenant)
The price bands - (rs, and r
b) show the persistence of transaction cost in farm input
markets (the semi – tradability of the factors) with some households selling, some non
– participant (difficult to say self – sufficient) and some buying households which
may be a more realistic representation of factor markets in Ethiopia where a rental
market exists for farm inputs. The price band reflects possible transaction costs may
accrue due to search cost, moral hazard and seasonality (labour market), immobility
of land and transportation cost (land markets) (Holden et. al. 2001). The size of the
price band depends on the relative degree of imperfection showing rs < r
b.
Generally, farm households’ participation in the land lease market and their respective
position in the market (landlord or tenant households) depend on two major factors: 1)
the magnitude or level of the endogenous factor price r* (shadow price of land), and
2) the size of the price band which depicts the persistence and degree of transaction
cost that dictates market prices as a seller and as a buyer. This indirectly shows
households’ leasing behaviour (to participate or not as well as the intensity of
participation) depends, much, on the relative cost of transacting the land with
respective to non-land farm inputs.

13
Shadow price of land (r*)
When factor markets are imperfect and prices become unobservable, the shadow price
(household specific endogenous factor price) reflects the relative endowment of
factors – supply versus demand (in this particular case, land to non-land). For
instance, with a farm household endowed with relatively higher land to non-land farm
inputs will have a relatively lower shadow price of land (r* = ∂f/∂Ā
= MVPĀ) than
households with lower relative endowment of land. Thus, shadow prices, here,
largely dependent on household specific farm factor endowments though it is not a
sufficient condition to trigger household participation in the informal land tenancy
market.
In the absence of well functioning markets, farm households face different sets of
prices depending on their respective positions (net seller or net buyer) they take in
such imperfectly functioning markets. Such price variations for a net-buyer and a net-
seller (the price band) reflect the degree of market imperfection (level of transaction
cost) which could possibly be household specific (owing to various socio-economic
geographical and policy/institutional factors) or common (fixed) for all participants in
the market. See the figure below.
Figure 2 : Effects of transaction costs (price bands) on land transactions
Adopted from: Sadoulet et al. (1995)
price
r1* case 3
rb
Ab
r2*
case 2
A
s
rs
r3* case 1
Quantity of land

14
Where: case 1 = Condition for leasing-out land
Case 2 = Autarky position due to high transaction cost (wide price
bands)
Case 3 = Condition for leasing-in land
rs, and r
b = Market price observed in the supply and demand side of
the market
As and A
b = Amounts of land leased-out and leased-in , respectively
r1*, r2
* and r3
* = The shadow prices perceived by the tenant, non- participant and
landlord households.
Based on these argument, a farm household may assume three alternative positions in
the informal land tenancy market depending on the two influential foreces mentioned
above.
Case 1: Landlords (leasing out land) when:
[s
A
fP
∂
∂= r
s]
≥ [A
fP
∂
∂= r
*]
Where: rs : Market price in the supply side of the market
(Landlord price)
r*: The shadow price of land,
Note: We use the ≥ sign deliberately to include the possible
cases of incomplete resource adjustments
Case 2: Non – participants households (Autarky)@
[s
A
fP
∂
∂= r
s]
< [
A
fP
∂
∂= r
*] < [
bA
fP
∂
∂= r
b]
Where: rb : Market price in the demand side of the market (tenant
price)
Case 3: Tenant (leasing in land) when,
[b
A
fP
∂
∂= r
b]
≤ [A
fP
∂
∂= r
*]
Testable hypotheses
With zero or negligible transaction cost in farm input markets, the skew ness of
endowments in non-land farm inputs would rather not trigger the farm households
decision to participate in the informal rural land tenancy market for they can even out
this resource endowment gap by direct participation in labour or oxen markets.
However, owing to the very nature of crop cultivation which demands continuous and
15
dynamic adjustment decisions, hired labour is far from a perfect substitute of family
labour where the later is more involved in sharing output risks. Such supervision
constraints on the labour market accompanied by the liquidity constraint and moral
hazard involved in the oxen sales and rental markets, respectively, magnifies the
persistence of market imperfections in the non-land factor markets.
Therefore, Pooling non/semi-tradable inputs play a dominant role in rural household
decisions to participate in land lease markets as well as their level of transaction.
Landlords with low endowments of semi/non – tradable inputs (such as family labour
– male and female, oxen and other draft animals) relative to their land holdings will
look for potential tenants with high endowments of such farm inputs. (Hypothesis 1)
The semi/non-tradability and skewed distribution of the non-land farm inputs among
farm households cause farmland (physically immobile factor and fairly distributed
factor) to be more mobile than non-land farm factors (contrary to its ease of physical
mobility and highly skewed distribution). (Hypothesis 2)
Similar to the non-land farm factor markets, however, the persistence of production
risk, missing insurance markets, high searching and supervision cost and weak
property rights with lack enforcement tools, may result in imperfections in the rural
land tenancy market (Sadoulet, et al., 2001; Stiglitz, 1974; Cheung, 1969). Moreover,
the informal (poorly developed) nature of the tenancy market itself accompanied by
the past national land policy failures that legally ban any form of land transfer
threatens the functioning of the rural land tenancy market. Exposing the informal
nature of the tenancy market, almost all of the sample respondents from the 2003
survey were reported to have no legal contractual agreements regarding their land
lease transactions. Such imperfections directly associated with the rural land rental
markets limit the extent to which farm households are able to adjust the size of their
cultivated area (incomplete resource adjustment process) to even out imperfections in
other resource markets. (Hypothesis 3)
Moreover, access to land through the land rental market is constrained in communities
with weak property rights and poor institutional tools to enforce contractual
agreements (Sadoulet, 2001). Kinship networks are thus particularly effective in
16
providing mutual insurance and reduce market frictions (Sadoulet, et al., 1997).
Kinship ties among farm households, therefore, trigger more participation, and hence
the levels of transaction, in the informal land lease market. (Hypothesis 4)
In response to the supply constrained nature of the land lease market with a very high
land scarcity and population density, the imperfections in the tenancy market causes
non-symmetry and favours the landlord side of the market. (Hypothesis 5)
4. Estimation methods
In addressing the major research questions, four dependent variables have been
utilized to identify the determinants of participation in the informal land rental market
as well as farm households’ intensity of land transactions. Two dummy dependent
variables TENT and LLORD (for decisions to participant as a tenant and landlord,
respectively) and two log transformed continuous variables lnLLI and lnLLO (for
decisions how much to lease-in and how much to lease-out, respectively) have been
used.
Probability of participation (probit models)
As mentioned above, we model the decision to participate in the land lease market as
binary decision model (with left-hand side variables: 1 if lease-in or lease-out land
and 0 otherwise) treating two sides of the market separately. With major problems of
non-normality of the error term and heteroscedasticity (non-constant variance of the
error terms) concerning the standard OLS estimation of such models, we utilize the
maximum likelihood binary response model – probit model (Woldridge, 2000;
Gujarati, 2003;Green, 2000)
In making the decision regarding participation in the informal land lease market, we
assume there is unobserved factor (utility index) *
iR that explain why farm
households lease in or out land. We postulate this variable *
iR (latent variable) is a
function of vector of exogenous variables with the relationship specified as:
*
iR = γ ′Zi + iε (1)
Where *
iR is a latent variable (unobserved) that shows the perceived net benefits from
participation in the informal land lease market; Zi is a vector of exogenous variables

17
(household demographic variables, asset and physical endowment variables and other
village level factors such as distance to major market and population density) that
influence leasing behaviour of households; γ ′ is a vector of parameters; and iε is
independent of Zi which represents factors unobserved by the researcher but known to
the farmers (sample respondents). We further assume the random disturbance term iε
is normally distributed with zero mean and variance equal to one ( iε ~ N (0,1)).
Instead of observing the latent variable *
iR (perceived net-benefit of market
participation), we only observe a dichotomous variable (indicator variable) iR , which
follows the sign of the latent variable *
iR . When the perceived net-benefit of
participation (leasing in or out of land) is positive ( *
iR > 0), the farm household
participates in the informal land lease market with iR = 1.
Therefore, for farm household ‘i’, the observed binary response can be given as:
iR = 1 if *
iR = γ ′ Zi + iε > 0. …………………(2)
iR = 0 if *
iR = γ ′ Zi + iε ≤ 0……………….…(3)
Thus the distribution of iR given Zi can be obtained as:
P ( iR = 1 Zi) = P ( *
iR > 0 Zi)
= P(γ ′Zi + iε > 0 Zi)
= P ( iε > -γ ′ Zi Zi) …………………(4)
Denoting θ3 as the standard normal cumulative distribution function (cdf), equation
(4) yields:
P( iR = 1 Zi) = 1 – θ(-γ ′Zi)
P( iR = 1 Zi) = θ(γ ′Zi) ………………………………(5)
Thus, the probit model takes the basic form of equation (5) with 0 ≤ Pi ≤ 1.
Intensity of participation (level of land transaction)
3 ∫ ∞−
−==iZ
k
ii dkeZR'
2
2
1)()( '*
γ
πγθθ , where k is the standard normal variable i.e., k ~ N(0,
2δ )
18
Having the above probit model been estimated for decisions to transact or not (probit
model estimation), the test for selection bias involve two procedures: computing the
selectivity bias variable (Inverse Mill’s Ration – IMR); and estimation of the intensity
of leasing (the amount of land leased-in or out) using Ordinary least square (OLS)
methods by incorporating this new variable (IMR) to the intensity (second stage)
regression model.
To analyse the level (intensity) of transaction of farm households, let the land
transaction function be given by:
ii
R
i UXA += 'β …………………………………(6)
Where 'β is a vector of parameters to be estimated, Xi is a vector of regressors
(household demographic variables, asset and physical endowment variables and other
village level factors such as distance to major market and population density), Ui is a
normally distributed random disturbance term.
With the normality assumptions for the error terms Ui ~ N (0, σ2), εi ~ N(0,1) and corr
(Ui, εi) ≠ 0, estimating equation 6 using OLS method would yield inconsistent
estimates because the expected value of the error term conditional on the sample
selection criterion is non-zero (Madalla, 1983). Thus, conditional upon iR = 1
(positive values of *
iR ), the second stage Heckman selection model (1979) provides
consistent and asymptotically efficient estimates with the regression function given
by:
i
R
i XA'β= + ηλ(γ ′Zi) + Ui ………………..…..(7)
Where: λi is the selectivity bias variable (Inverse Mill’s Ratio) computed as λ(γ ′Zi) =
φ (γ ′ Zi) / Φ (γ ′ Zi), where φ and Φ are the density and cumulative standard normal
distribution function, respectively. As shown in Equation (7), the IMR is then
included as an additional regressor in the OLS lease intensity regression where the
regressors (variables) in the first stage model (Zi) are allowed to differ from the
regressors in the second regression equation (Xi) to meet the identification condition.
However, to avoid identification problems of picking the right variable that
significantly explain the first equation (probit estimation) but not the later, we use
different functional specification (double log function) in the second stage equation

19
while linear specification was adopted for the probit model estimation. This
procedure was required since identification of the indicator variable is necessary to
apply the two-stage Henchman selection model. (Tikabo and Holden: 2003)
Data and Sample Area Description
To analyse the probability and intensity of land lease transactions, a survey data
consisting of 16 villages (a sample 25 farm households from each) has been collected
from five administrative zones of the Tigray region of Ethiopia that covers 11
‘woredas’ or districts of the region (see figure 3 for detailed description of the study
area). The sampling method was administered at two levels: stratified random
sampling (taking agricultural potential, population pressure, access to irrigation, and
access to market into consideration) at village level and a simple random sampling at
a household level. The survey was conducted in May-July 2003 that represents the
2002/2003 crop season. Descriptive summary of the village level and household level
variables are shown in table 1 and 2, respectively
5. Results And Discussions
As mentioned in the previous section, four maximum likelihood probit model
specifications have been utilized to analyse the first stage estimation (the likelihood of
farm household participation in the informal tenancy market). As shown in table 4,
Prob(LI)-2 and Prob(LO)-2 models are the likelihood estimates of leasing-in and
leasing-out decisions using various household level variables and selected village
level attributes (like village access to major market, to irrigation project, etc) while
the remaining two (Prob(LI)-1 and Prob(LO)-1) are village fixed effect models -
probit models with the same household level variables but using 15 site dummies
instead of using the village level attributes.
To assess the intensity of participation, we utilized these two model specifications
Prob(LI)-2 and Prob(LO)-2 for having a relatively high predictive power over the
remaining two model specifications. The results using the Heckman selection model
(see table 6 and 8 for the demand and supply side of the market, respectively) show
that the problem of selection bias could not be rejected at 5% level of significance in
the leasing-in decision while there is no significant selection bias problem in the
landlord side of the market. Accordingly, we estimated the analysis of intensity of

20
leasing-out using alternative models of ordinary least square (OLS) (Tikabo and
Holden, 2003) and censored Tobit model (Skoufias, 1995; Pender and Fafchampe,
2001; Deininger, 2003; and Tikabo and Holden, 2003). On the other hand, two-stage
Heckman selection model has been utilized in analyzing households’ intensity of
leasing-in decisions since it captures and corrects the Selection bias problem (Tikabo
and Holden, 2003).
Likelihood of participation
Supporting our basic hypothesis (hypothesis 1), the relative endowment of non-land
farm inputs with respect to owned farm size were found to significantly influence the
household decisions to participate in the land lease market. As shown in table 4, oxen
per unit of owned land (Oxp) and the tropical livestock unit per unit of owned land
(Tluoxp) were found highly significant (with Oxp at 1% level) affecting the leasing
behaviour of households in all the models utilized.
This result supports our basic hypothesis of the non/semi-tradability of non-land farm
inputs triggers farm household participation in the tenancy market. This result may
indicate that there are higher transaction costs I the oxen rental market than in the
tenancy market with respect to access to those markets. This finding has be supported
by the fact that 43% of the sample respondents were reported to have no ox and yet
only 11.5 % of them engaged in oxen rental market. The highly significant and
negative coefficient of ownership of other livestock per unit of own land (tluoxp) in
the supply side of the market indicates that more wealthy households were less likely
to rent out their land. Households that have animals may need their land themselves to
produce fodder for their animals and landlords tend to be the poorest households that
lack the resources to farm their land themselves.
Consistent with our expectations, the coefficients showing household relative
endowments of labour (Totmalp and Totfemp) were found to have strong effect on the
leasing-out and leasing-in decisions, respectively. This finding appears to be
consistent across similar studies from Ethiopai (Deininger, 2001; Teklu et al, 2004;
Pender and Fafchamps, 2001) which can be an indication of an abundance of labour
or relatively better functioning labour market as compared to the oxen markets.

21
Though it plays a less important role in the leasing-out decidion, the gender
coefficient (Hhhs) was found to be consistent and highly significant in both models
utilized to assess the likelyhood of renting-in land. Accordingly, female-headed
households were less likely to rent in land after controlling for other differences in
endowments. This may be because landlords have less trust in female-headed
households as land managers. Potential female-headed tenant households may
therefore have been totally rationed out of the market even if they had the necessary
oxen endowment for farming. As a proxy variable for capturing farm experience and
physical ability, the age of the household head (Hhha) was found to a strong
significant effect on the land renting out decision showing that the older the age of the
household head, the higher the probability of renting-out land.
Previous participation in the market for tenancies had a strong positive effect on
current probability of participation in both sides of the market, attesting our priori
expectation that households well acquainted with the existing tenancy market (having
insiders market information) are more likely to participate in the market than
otherwise. This could be due to the high initial cost (fixed transaction cost) an agent
may face when first attempting to enter the market. All variables that capture village
level attributes appeared to play less important in relation to access to tenancy
markets.
Intensity of market participation
Intensity of leasing-out
We will now look at the determinants of the intensity of participation on the landlord
side of the market. As mentioned before, we found no signs of selection bias related
to participation on this side of the market (see table 7). We therefore discuss the
results from an ordinary least square and a truncated tobit model presented in Table 5.
We used a village level kinship variable (vilkin), which was constructed as the share
of all contracts in the village that were all among kin partners.
As the result shows, ownership status of farm inputs (all labour and livestock
endowment variables), though having a significant effect on the probability of
participation, both the OLS and truncated Tobit regression results shows a weak effect
of such factors on the amount of land rented out. The facts that 50% of the landlords

22
leased out all the land they owned (zero operational holding) and 83% of them with
zero oxen could be a possible explanation for the absence of partial factor ratio
adjustment with respect to oxen. Moreover, the fragmented land holding of farm
households (an average number of plots and farm size of :::: and :::, respectively),
might also explain the weak effect of these asset endowment variables on the intensity
decisions.
We see that land leased out did not adjust smoothly with the farm size of landlords as
the coefficient on farm size (fs) is only 0.136 and 0.151 in the OLS and truncated
Tobit models. Further attempt has been made to test if this is significantly less than
1.0, which was expected with a perfect land tenancy market with zero transaction
costs and constant returns to scale. The result rejects the hypotheses that fs=1 that
explains imperfect resource adjustment in the landlord side of the tenancy market.
In contrast with our 4th
hypothesis, kinship networks were found to have a negative
impact in dictating the leasing behaviour of households. We hypothesised that trust
may be higher among kin and therefore adjustment would be smoother in kin
contracts. This could imply that the land rental market functions better in villages with
a high share of kinship contracts. The highly significant but negative coefficient of
vilkin variable, on both the OLS and Tobit regression results, however, shows the
land rental market functions significantly better in villages with low share of kinship
contracts. A large share of kinship contracts could be a sign of a low-trust community
(Vilkin to have positive effect) or only due to a highly supply constrained (a very
small land holding) tenancy market where potential tenants solely rely on kin related
landlords to get any access to arable land. Thus, the counter-intuitive result could be
explained if the second case dominates the first one where social capital plays less
role than the miniature land holding of farm households.??? T his finding contrasts
with the theoretical foundation that social capital (mutual trust and minimized moral
hazard among kin tied partners) matters in wining the hearts of transacting agents -
landlords (Sadoulet, 2001).
More unequal land distribution (vgini) stimulated significantly renting out of land.
This contrasts with the participation models. The probability of land being rented out
was lower but those renting out land rented out more land in villages with more

23
skewed land distribution. This may indicate that those landlords who trusted the
market were willing to rent out more land where the demand was higher due to more
in egalitarian distribution.
Another interesting finding in Table5 was that households with off-farm income rent
out more land. This may indicate that there were imperfections in the labour market
since extra (“high-pay”) off-farm income was not used to hire (“low-pay”) labour to
substitute for lost household labour in farming. There are additional transaction costs
related to hiring and monitoring hired labour and such costs may even be higher for
households engaged in off-farm work than for other households.
Intensity of leasing-in
We used a maximum likelihood Heckman (1979) selection model for the analysis of
tentants’ degree (intensity) of participation in the land rental market, and we found
significant selection bias. The results of the second stage of the model are presented in
Table 6. We also run a Deaton regression model for testing the robustness of results
across these two models. The results of the Deaton regression model are also
presented in Table 6.
Unlike their profound effect on the likelihood of participation, both the Heckman and
Deaton regression results show oxen endowment to have a weak effect in dictating the
intensity of leasing-in land. This could be a strengthening force for our hypothesis for
having a supply-constrained tenancy market in the study area. The fact that rental
markets for such farm inputs (oxen) are highly imperfect and yet the statistical
insignificance of such parameters could lead to a strong argument that exogenous
factors (possibly, screening criteria of landlords) rather than the relative endowment
of farm inputs explain the level of transaction (degree of access to leased land).
Livestock wealth other than oxen (lntluox), however, was found to have a significant
and positive effect on the amount of land to rent in. Households with more
endowment of other livestocks tend to rent in more land possibly to provide fodder for
their livestock.
With both the endowments of family male and female labour having a weak effect on
the likelihood of participation (first-hand decision), the endowment of adult female

24
labour in a family, however, significantly reduces the amount of land rented in. This
result confirms the gender-specific nature of an agricultural task where the social
constraint on female labour market participation is very high.
Similar to the case of the landlord side of the market, the significant but negative
coefficient of vilkin variable using the Heckman model contrasts to our hypothesis
that tenants with kin related landlords enjoy relative ease of barriers in the process of
factor ratio adjustment through the informal lease market. This counter-intiutive
result could be the outcome of a possible interaction between two contradicting
factors (the share of kinship contracts in a village and the land holding status of
households in a village).
Contrary to the predominantly customary explanations, we found a significant
positive coefficient on the owned farm size variable. Surprisingly, the result is
puzzling as households with a relatively high “allocated” farm size are expected to
have less demand for rented plots and to lease-in less land. Spurious correlations
between plot size, farm size and area sizes leased-in/out could possibly cause the
situation. Locations with large farm sizes could typically be areas with larger sizes of
land lease-in or out. In an effort to correct the possible spurious correlation, an
attempt has been made to estimate the lease-in intensity regression using a relative
farm sizes with in villages (individual land holding / total village farm size). The
result, however, remains robust across these alternative models with the farm size
variable still having a positive significant effect on the amount of land leased-in.
There are good reasons, however, to treat the result cautiously since no further effort
(test) has been exerted to address the issue of scale of production (efficiency analysis)
due to the drought nature of the data collection perdior.
With some degree of reservation, the unexpected positive sign could possibly imply
that large farmers endowed with large farm sizes possess abundant complementary
farm assets (labour, oxen and other farm implements) and yet their relative factor ratio
(land to non-land) endowment remain to be low which may demand further
adjustment actions by leasing-in more land. This result, thus, could justify our
argument that relative rather than absolute farm resource endowment matters in
dictating the leasing behaviour of households.

25
As indicated in table 6, tenants who reside in villages with irrigation facilities (irrg),
more skewed land distribution (vgini), and less access to a major market (Mktd) were
found to rent in more land than otherwise. Due to low opportunity cost of farm labour
in remote areas (no or less off-farm engagements), landlords may opt for own
cultivation of their plots leaving few amount of land to be tenant operated.
Tenancy market friction and resource adjustment process
Our expectation of incomplete factor ratio adjustment through the land lease market
(Hypothesis 3) was not rejected for the coefficient of the allocated farm size in the
two intensity models (OLS for leasing out and Heckman for leasing in decisions)
were found to be significantly different from 1 in both sides of the tenancy market.
The result is more pronounced as 56% of the actual tenants were reported to be
constrained tenants who all want to lease in more land (see table 9). This shows, like
the imperfections in the non-land factor markets, frictions in the tenancy market cause
participant households to transact less than their optimal level. Fragmented land
holding and highly skewed distribution of non-land farm inputs accompanied by the
supply constrained nature of tenancy market, might be possible explanations behind
the observed fact in the demand side of the market.
Though it was only 5% of the landlord households that were identified as constrained
landlords who want to lease out more land, the informal nature of the tenancy
market4, the past policy failure which discourages leasing out practices and other
cultural and traditional factors5 could explain the frictions in this supply side of the
market.
Market symmetry and rationing out problem
In an attempt to test the hypothesis of asymmetric (non-symmetrical) nature of the
informal land lease market, a market symmetry test6 has been made applying the
censored Tobit model that analyse the determinants of net land leased-in as adopted
by Skoufias (1995). Using the tobit regression output (see table 10) from both the
4 Almost all of the land lease market participants have no formal contractual agreements while
transacting in the tenancy market. 5 Informal discussions with some of the elderly farmers show that farm households consider leasing out
the entire land one owns as socially undesirable act. 6 Testing the equality of two sides of the market both the signs and significance level of variables.

26
demand and supply side of the market, the results of the various Wald tests conducted
to test market symmetry (the equality of coefficients on both sides of the market)
show that the hypothesis of asymmetric resource adjustment in both sides (the
demand and supply sides) of the tenancy market could not be rejected.
As shown in table 7, the simultaneous test for the equality of all coefficients in the
two sides of the market (market symmetry test) is rejected with Wald statistic of
132.36 at 1% level of significance. To identify the factors (variables) responsible for
the asymmetric nature of the tenancy market, individual variable tests have been made
comparing the two sides of the market. As the result reported in the above table
shows, variables like owned farm size, kinship network, village access to market,
village distribution of land and previous participation in the tenancy market have been
identified as factors causing the non-symmetrical nature of the market. These results
suggest that the households’ marginal responsiveness towards adjusting the desired
cultivated area for these variables is not the same in each sides of the market.
Great caution, however, has to be exercised since the results (tests) are entirely based
on censored tobit model that fail to capture the sample selection problem (selection
bias) which was found significant in the tenant side of the market.
Despite the limitation of this econometric evidence, summary of relevant observed
evidences exhibit similar result showing imperfections in the tenancy market affect
the two sides of the market in an unbalanced way, mostly, favouring the landlord side
of the market. The is shown as both the fixed transaction costs (due to market entry
barriers) and variable transaction costs (cause incomplete resource adjustments)
affected more of the leasing-in decision than leasing-out decision. The prohibitively
high transaction cost that cause the non-symmetry in the market is more witnessed as
almost 1/3 of the current non-participants were reported to be rationed out tenants
(denied access to the tenancy market) while it is only 5% of them that would like to
lease-out but fail to find any trading partner.
Even among those farm households who manage to break the entry obstacle (the
current tenancy market participants), the intensity of degree of resource adjustment
through the tenancy market is more limited in the tenant side of the market where
55% of them were reported to operate (lease-in) land less than their optimal level

27
while it is only 4% of the landlords that lies under similar category. Tenant and
landlord households manage to transact 64% and 98% of their desired level of
transaction. This indicates a highly significant variable cost of transaction affects the
tenant households more than that of the landlord side where high population density
(growth), aggravating scarcity of land and very low off-farm employment
opportunities are to be mentioned as few among other causes.
6. Concluding Remarks
This paper has been motivated by the observations that the legally prohibited formal
land markets (sales market) and the recent halt in administrative land reallocation by
regional authority (Tigrai) make the land rental market the sole venue for land transfer
among farm households. Consistent with the anticipated impact of these policy
matters and the imperfections in non-land factor markets, the overall result of the
study shows the important role the informal tenancy market plays in bringing land to
imperfectly or non-tradable farm factors of production.
Supporting our basic hypothesis, the farm asset endowment variables oxen and the
tropical livestock unit other than oxen (TLUOX) were found significantly (with
OXEN at 1% level) affecting farm households’ likelihood of participation indicating
households with relatively poor endowment of such non/semi-tradable farm inputs
tend to rent-out their land while the vice versa holds true for the tenant households.
Contrary to our expectations, however, the household relative endowments of male
and female labour were found to have weak effect on the likelihood of participation
on both the demand and supply side of the tenancy market. Conditional upon
participation in the land lease market, tenant households’ intensity of participation
seem to be more responsive towards adjusting their relative endowment of non-land
farm inputs while landlord households are more responsive towards household
demographic variable (gender and age of the household head) than relative resource
endowments.
Like the cases of non-land factor markets, the regression results show the persistence
of frictions (imperfections) in the tenancy market that cause an incomplete factor ratio
adjustment process through the land lease market . This has been witnessed by the
fact that the parameters on the farm size variable were significantly lower than one

28
for landlords and had even a positive sign for tenants, indicating that there are
economies of scale in farming and transaction costs in the rental market. Past policies
in form of land redistributions, prohibition of tenancy contracts and later limiting the
length of tenancy contracts to one year may explain the low allocative efficiency of
the market for tenancies.
The simultaneous test for a balanced (equal) market response of two sides of the
market (the demand and supply sides) shows the hypothesis of asymmetric
(unbalanced) land lease market could not be rejected at 1% level of significance. This
result shows the imperfections in the land lease market affect the two sides of the
market (the tenant and landlord households) asymmetrically. In support of this
argument, the empirical evidences show 56 % of the tenant households to operate
(transact) less than their desired level - they manage to obtain 64% of their desired
level of transaction. On the contrary, it is only 5% of the landlord households that are
identified as constrained agents though, in aggregate terms, they manage to transact
98% of their desired level of land transaction.

29
RERERENCES
Adal Y. (1999). The rural land tenure system in Ethiopia since 1975: Some
observations about its impact on agricultural production and sustainable land
use. Institute of Development Research Addis Ababa, Ethiopia.
Alemu T. (1998). Farmers’ Willingness To Pay For Tenure Security. Ethiopian
Journal of Economics, Vol. VII, No.2, Addis Ababa, Ethiopia
Ananish Chaudhuri & Pushkar Maitra (1996), Determinants of land tenure
Contracts: theory and evidence from Rural India, Washington state University,
USA.
Berhe, T. (2002). Rural land redistribution in Northern Ethiopia: A case study of
two communities in Agame area, Tigray. In Workneh Negatu Et. Al. (Eds.)
“Current Issues On Land Tenure In Ethiopia.” Institute of development research,
Addis Ababa, Ethiopia
Binswanger, H. P. And M. R. Rosenzweing (1986). Behavioral and Material
Determinants of production relations in Agriculture. Journal of Development
studies 22, 503-539.
Bliss, C. J. and N. H. Stern (1982). Palanapur: The Economy of an Indian Village.
Delhi and New York, Oxford University press
D. Allen & D. Lueck (1992), 'Contract Choices In Modem Agriculture: Cash Rent
Versus Crop Share', The Journal Of Law & Economics, Vol. 35.
De Janvry, A. Fafchamps, M. And Sadoulet, E. (1991). Peasant Household
Behavior with missing markets: Some Paradoxes Explained. Economic Journal
101: 1400-1417
Deaton, A. (1997). The analysis of Household Surveys: A microeconomic
approach to development policy. Baltimore and London, published for the world
bank. The john Hopkins University press.
Deininger K. et. al. (January 2003). Market and Non-market transfers of land in
Ethiopia: Implications for efficiency, equity and no-farm development.
Unpublished. World Bank, Washington. USA.
Deininger K. et. al. (January 2003). Tenure Security And Land –Related
Investment : Evidence From Ethiopia. World bank policy research working paper
2991, Washington .
Gavian, S. And S. Ehui (1998). The relative efficiency of Alternative land
contracts in a mixed crop-livestock system in Ethiopia. Agricultural Economics
Vol (20): 37 –49.
Greene, W. H. (1997). Econometric analysis. New jersey, prentice Hall.

30
Hagos, F., J. Pender, and N. Gebreselassie (1999). Land Degradation in the
highlands of Tigray and strategies for sustainable land management: Socio-
economic and policy research working Paper No. 25, International Livestock
Research Institute, Ethiopia.
Heckman, J. (1979). “Sample selection as a specification Error.” Econometrica
Vol. 47: 153-161
Hoff, K., Braverman, a. and Stiglitz, J. E. (eds) (1993). The Economics of Rural
Organization Theory, practice and policy. Oxford university press. Oxford.
Holden, S. T. and Hagos, F. G. (2003). “Rural household poverty dynamics in the
Northern Ethiopia.” Unpublished.
Holden, S. T. and Tikabo, M. O. (2003). “Factor market imperfection and land
rental market in the highlands of Eritrea: theory and Evidence.” Unpublished.
Holden, S. T., B. Shireraw, et al. (2001). “market imperfections and land
productivity in the Highlands of Ethiopia.” Journal of agricultural Economics Vol.
52(3): PP 62-79
Keijiro Otsuka & Yujiro Hayami (1988). 'Theories of Share Tenancy: A Critical
Survey y', Economic Development And Cultural Change, Vol. 37 (1).
Otsuka, K. H. Chuma & Y. Hayami (1992). Land and labour contracts in agrarian
Economies: Theories and Facts. Journal of Economic Literature. Vol (30): 1965 –
2018.
Pender, L. J. and M. Fafchamps (2000). “Land lease markets and Agricultural
efficiency: Theory and evidence from Ethiopia.” Unpublished
Singh, N. (1989). Theories of Sharecropping. In P.K. Bardham (ed.), The Theory
of agrarian institutions, Oxford: Clarendon.
Skoufias, E. (1995) “household Resource, Transaction costs, and Adjustment
through land Tenancy.” Land Economics Vol. 71(1): 42-56
Stiglitz, J. E. (1974). Incentive and Risk sharing in Sharecropping. Review of
Economic studies. Vol (41): 219 – 255.
Stiglitz, J. E. (1986). The New Development Economics. World Development,
Vol. 14, No.2, p.257-265.
Tesfay Teklu and Adugna Lemi (2004). Factors affecting entry and intensity in
informal rental land markets in southern Ethiopain highlands. Unpublished.
Department of Economics, Western Michigan University, Kalamazoo, MI 49008,
USA.
Wooldridge, J.M. (2002). Econometric Analysis of Cross Section and Panel data.
The MIT Press.

31
Table 2. Description of Sampled ‘Tabias’ and Level of Land Lease Market Participation
Tabia
no.
Tabia Woreda
Population
density
(Persons/km2)
Distance
to market
(in Km)
Mean
rainfall
Irrigation
project
Land
distribution
(Gini
coeff.)
Tenancy
market
participation
1 Hintalo
Hintalo
wajirat 80.2 14 503.7 1 0.222 66%
2 Samre
Seharti
samre 248.9 1.25 557.5 0 0.363 84
3
Mahbere-
Genet Enderta 441.5 8 552.1 1 0.118 60
4 Mai-Alem Enderta 429.6 6 552.1 0 0.192 48
5 Seret D. Tembien 707 12.5 420.4 0 0.156 56
6 Kihen Wukro 160.6 23 420.4 0 0.169 65
7 Genfel Wukro 166.5 4 596.8 1 0.191 67
8
Emba-
Asmena
Tsaeda-
emba 631.1 7 419.05 0 0.345 56
9 Hagere-selam
Gulo
Mekeda 749.4 39 761.4 0 0.276 16
10 Debdebo Ahferom 161 6 668.52 0 0.199 65
11 Mai-Keyahti Ahferom 636.6 16 736.6 0 0.253 31
12 Adi-selam Mreb-leke 206.8 29 579.32 0 0.160 20
13 Hadegti
Laelay
Adiabo 130.8 9 832 0 0.292 40
14
Tsaeda-
Ambra
Laelay
Adiabo 41.8 20 596.55 0 0.252 62
15 Mai-adrasha
Tahtay
Koraro 440 5.2 893.55 1 0.249 62
16 Adi-Menabir
Tahtay
Koraro 236 21 783.4 0 0.281 59 Source: Hagos and Holden (2003)
32
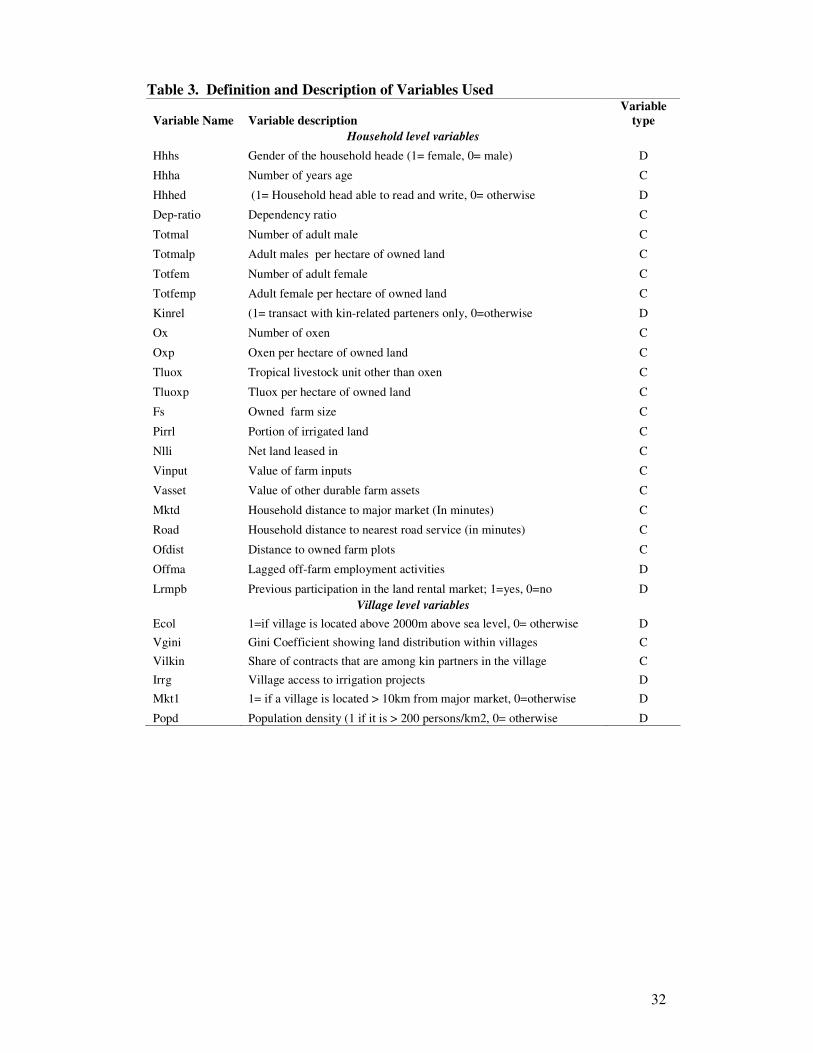
Table 3. Definition and Description of Variables Used
Variable Name Variable description
Variable
type
Household level variables
Hhhs Gender of the household heade (1= female, 0= male) D
Hhha Number of years age C
Hhhed (1= Household head able to read and write, 0= otherwise D
Dep-ratio Dependency ratio C
Totmal Number of adult male C
Totmalp Adult males per hectare of owned land C
Totfem Number of adult female C
Totfemp Adult female per hectare of owned land C
Kinrel (1= transact with kin-related parteners only, 0=otherwise D
Ox Number of oxen C
Oxp Oxen per hectare of owned land C
Tluox Tropical livestock unit other than oxen C
Tluoxp Tluox per hectare of owned land C
Fs Owned farm size C
Pirrl Portion of irrigated land C
Nlli Net land leased in C
Vinput Value of farm inputs C
Vasset Value of other durable farm assets C
Mktd Household distance to major market (In minutes) C
Road Household distance to nearest road service (in minutes) C
Ofdist Distance to owned farm plots C
Offma Lagged off-farm employment activities D
Lrmpb Previous participation in the land rental market; 1=yes, 0=no D
Village level variables
Ecol 1=if village is located above 2000m above sea level, 0= otherwise D
Vgini Gini Coefficient showing land distribution within villages C
Vilkin Share of contracts that are among kin partners in the village C
Irrg Village access to irrigation projects D
Mkt1 1= if a village is located > 10km from major market, 0=otherwise D
Popd Population density (1 if it is > 200 persons/km2, 0= otherwise D

33
Table 4. Probit Models for participation in both sides of the Tenancy Market Prob(LI)-1 Prob(LI)-2 Prob(LO)-1 Prob(LO)-2
fs 0.055 -0.006 -0.388 -0.333
(0.30) (0.04) (1.47) (1.36) hhhs -1.120*** -1.113*** 0.339 0.335
(3.13) (3.66) (0.93) (0.98) hhha -0.011 -0.010 0.020** 0.020***
(1.36) (1.46) (2.46) (2.72) hhhed 0.257 0.256 0.097 0.007
(1.17) (1.27) (0.35) (0.03) totmalp 0.045 0.000 -1.324** -1.394**
(0.12) (0.02) (2.01) (2.18) totfemp -1.128*** -1.000*** 0.097 0.141
(3.11) (3.23) (0.24) (0.37) dep-ratio -0.111 -0.100 0.025 0.027
(1.38) (1.38) (0.28) (0.32) oxp 1.409*** 1.406*** -3.973 *** -3.784 ***
(4.09) (4.36) (4.79) (4.68) tluoxp 0.375* 0.222 -0.831 ** -0.728*
(1.84) (1.22) (2.10) (1.94) mktd -0.000 -0.001 -0.003 ** -0.003*
(0.11) (0.54) (2.01) (1.94) road 0.001 0.000 0.004 0.001
(0.59) (0.04) (1.23) (0.63) Ofdist -0.001 -0.001 0.003* 0.003*
(0.82) (0.80) (1.84) (1.83) offma 0.086 0.035 0.452 0.435
(0.36) (0.17) (1.46) (1.63) lrmpb 1.808 *** 1.725 *** 1.869 *** 1.843 ***
(6.14) (6.59) (5.74) (5.88) vd2 0.095 -0.231 (0.17) (0.30) vd3 0.110 0.151 (0.20) (0.20) vd4 -0.238 -0.409 . . . . . . . . . vd16 0.696 -0.754 (1.21) (0.98) irrg -0.036 0.219 (0.15) (0.74) pop1 0.185 -0.026 (0.76) (0.10) mkt1 -0.274 0.194* (1.29) (0.72) ecol -0.384 0.209 (1.26) (0.62) vilkin 0.670 -1.507 (0.85) (1.49) Constant -1.484 -0.985 -1.712 -1.987 (1.79) (1.49) (1.49) (2.06)**
Number of obs. 372 372 347 372
Log pseudolikel. –128.85659 -134.15215 -105.83585 -109.68088
Pseudo R2 0.4273 0.4038 0.4643 0.4641
Note: * significant at 10%; ** significant at 5%; *** significant at 1%, **** significant at 0.1%.

34
Table 5. Factors explaining intensity of leasing-out land
OLS results Tobit results
fs 0.136*** 0.151
(3.70) (1.17) road -0.003** -0.013**
(2.05) (2.09) dep-ratio 0.056 0.069
(1.20) (0.50) hhhs 1.012*** 2.087***
(5.34) (3.21) hhha 0.013** 0.052***
(2.34) (2.77) hhhed 0.056 0.823
(0.32) (1.32) totmalp -0.000 -0.001
(1.28) (0.10) totfemp -0.000 -0.005
(1.02) (0.01) oxp 0.000 -4.995***
(0.63) (3.25) tluoxp 0.000 -2.529***
(0.76) (2.95) Ofdist 0.004*** 0.006*
(3.54) (1.86) pirrl -0.058 -1.443
(0.07) (0.48) offma 0.363 ** 1.316**
(2.02) (1.99) lrmpb 0.811 *** 5.686***
(4.72) (5.87) irrg 0.196 0.553
(0.91) (0.79) mkt1 -0.152 0.080
(0.87) (0.13) VGINI 3.742 *** 8.323*
(2.79) (1.81) pop1 -0.041 0.756
(0.23) (1.35) vilkin -1.356 ** -4.835**
(2.00) (1.98) _Cons -2.474*** -11.639***
(4.81) (5.29)
Number of obs = 372 Number of obs = 372
F(20 .68) = 8.08 Censored obs. = 283
Prob > F = 0.00 LR chi2(20) = 224.27
R - Squared = 0.636 prob > chi2 = 0.0000
Pseudo R2 = 0.4953
Log likelihood = -114.2868
Note: * significant at 10%; ** significant at 5%; and *** significant at 1%

35
Table 6. Factors explaining intensity of leasing-in land
Heckman model Deaton Model
fs 0.179 * 0.105 *
(1.80) (1.77) road 0.005 0.001
(1.05) (0.70) dep-ratio 0.002 0.022
(0.01) (0.55) hhhs 0.967 0.084
(0.86) (0.44) hhha -0.007 -0.000
(0.31) (0.02) hhhed -0.403 -0.042
(0.80) (0.20) totmalp -0.000 -0.000
(1.64) (2.80) totfemp -0.001 * -0.001) ***
(1.79) (13.22 tluoxp 0.001 ** 0.001) ***
(2.29) (15.21 Ofdist 0.005 0.001
(1.48) (0.54) pirrl -2.916 -1.269 **
(0.67) (2.03) offma 0.148 -0.114
(0.28) (0.57) irrg 1.132 * 0.245
(1.86) (1.07) mkt1 -0.917 *
(1.68) VGINI 9.123 ** 1.783
(2.16) (1.39) pop1 0.793 0.186
(1.47) (0.93) vilkin -4.040 *
(1.92) mktd 0.001 (1.16) lrmpb 0.012 (0.07) all kin 0.100 (0.47) Constant 1.943 -1.204 (1.03) Arthro -0.9231***
(0.35)
Lnsigma 0.8936****
(0.0916)
Rho -0.7274 (0.116)
Lambda -1.778
(0.412)
Pr(tent) 2.129* (1.92) tentpp3 1.548 (0.88) Chi2(1) 12.78
Prob>Chi2 0.004
Number of obs. 364 364 Uncensored obs. 107 Log pseudolikel –355.1127 R-squared 0.35**
Note: * significant at 10%; ** significant at 5%; *** significant at 1%;

36
Table 7: Tests of market symmetry on intensity of participation in LRM (Wald test of equality of coefficients)
Hypotheses Tested Wald Statistic( R)
Simultaneous equality of variables (r=19) 132.36***
individual variable tests (r = 1 for each)
fs 16.21***
fs-kins 19.63***
Road 2.33
depratio 3.85*
Kinrel 6.18**
hhhs 1.53
hhha 5.25**
hhhed 0.04
Totmal 4.89**
Totfem 0.82
ox 0.3
tluox 0.81
Ofdist 1.17
Pirrl 0.63
Offma 0.56
Lrmpb 10.84***
IrrgD 2.81
MktD 7.91***
Lgini 8.75***
PopD 1.99
Note: r = number of restrictions
• significant at 10%; ** significant at 5%; and *** significant at 1%

37
Table 8: Factors explaining the intensity of leasing-out (two-stage Heckman model) Heckman model stage1-lli
fsN 0.480*** -0.310
(3.61) (1.14) road -0.004 0.004
(0.90) (1.42) dep-ratio 0.065 0.018
(0.67) (0.19) hhhs 1.888*** 0.410
(2.79) (1.13) hhha -0.005 0.018**
(0.29) (2.20) hhhed -0.072 0.021
(0.14) (0.07) totmalp 3.526** -1.323**
(2.17) (2.03) totfemp -0.661 -0.010
(0.89) (0.03) tluoxp -1.375 -0.801**
(1.44) (2.07) Ofdist 0.000 0.003
(0.03) (1.75) pirrl 0.067
(0.03) offma 0.220 0.429
(0.35) (1.43) irrg 1.001
(1.71) mkt1 -0.551
(1.13) VGINI 7.904**
(2.15) pop1 0.305
(0.70) vilkin -0.605
(0.30) oxp -3.819***
(4.53) mktd -0.004**
(2.08) lrmpb 1.761***
(5.21)
vd2 -0.178 (0.25) . .
. .
. .
vd16 -0.789
(1.09)
Constant -1.722 -1.463
(0.87) (1.29) Artrho -0.6555
(0.4535)
Lnsigma 0.602 ****
(0.113)
Rho -0.5753
(0.3034)
Chi2(1) 2.22
Prob>Chi2 01365
Number of obs. 364
Uncensored obs. 86
Note: * significant at 10%; ** significant at 5%; *** significant at 1%;

38
Table 9: Rationing on the two sides of the market
Supply side of the market Demand side of the market
Number of constrained landlords 4 (5%)
Number of constrained tenants
7 61 (56%)
Amount of land leased-out 63.6 hectare Amount of land leased-in 80.75 hectare
Desired land to lease out 65.1 hectare Desired land to lease-in 126.5 hectare
Unfulfilled gap 1.5 Unfulfilled gap 45.75 hectare
% of the Actual -desired 8 98% % of the Actual -desired LLI 64%
Number of potential land lords 8 (5%) Number of potential Tenants 58 (33%)
Total sample respondents 89 Total sample respondents 109
Table 10: Factors explaining the intensity net land leased-in (Censored tobit model)
Tenants (net buyers) Landlords (net sellers)
Variables coef. Robust SE coef. Robust SE
fs 0.360 0.124*** -0.322 0.123*** Fs-kins 0.395 0.149*** -0.566 0.159*** kinrel 0.136 0.104 -0.205 0.089** Hhhs -0.006 0.177 -0.287 0.146**
Hhha -0.171 0.157 0.324 0.155** Hhhed -0.048 0.082 -0.021 0.103 Totmalp -0.002 0.140 -0.435 0.141*** Totfemp 0.190 0.094** 0.060 0.116 Oxp 0.062 0.076 -0.010 0.113 Tluoxp 0.033 0.066 0.120 0.078 Dep-ratio -0.211 0.161 0.180 0.123 road 0.021 0.033 -0.055 0.038
ofdist 0.015 0.032 -0.040 0.041 pirrl -0.044 0.631 -0.708 0.553 Offma 0.031 0.081 -0.064 0.102 Lrmpb -0.183 0.115 0.391 0.133*** IrrD 0.152 0.101 -0.095 0.110 MktD -0.222 0.084*** 0.129 0.094 Lgini 0.870 0.610 -1.721 0.655 Pop1 0.143 0.082 -0.027 0.091
con2 -1.360 0.700 1.607 0.731
Se 0.403 0.019
Number of obs = 372 Wald chi2(20) = 444.82 Log likelihood = -137.895 Prob > chi2 = 0.0000
Note: * significant at 10%; ** significant at 5%; and *** significant at 1%
7 Farmers were explicitly asked, given their farming capacity, if they want to lease-in more amount of
land 8 How much of their desired adjustment did farm households manage to satisfy through participation
in the tenancy market.