factor that influence teachers’ perception · pdf file ·...
TRANSCRIPT

International Journal of Scientific Research and Innovative Technology ISSN: 2313-3759 Vol. 4 No. 1; January 2017
29
FACTOR THAT INFLUENCE TEACHERS’ PERCEPTION TOWARDS
THE IMPLEMENTATION OF STRENGTHENING MATHEMATICS AND
SCIENCE IN SECONDARY EDUCATION (SMASSE PROGRAMME) IN
BUNGOMA COUNTY, KENYA
PETER WAMALWA
MED/CIT/004/13
Dr. Edwin N. Masibo
Department of Curriculum and Instructional Technology
Kibabii University
Prof. Stanley N. Mutsotso
Department of Curriculum and Instructional Technology
Kibabii University

International Journal of Scientific Research and Innovative Technology ISSN: 2313-3759 Vol. 4 No. 1; January 2017
30
ABSTRACT
Dismal performance in Mathematics and Science subjects poses a challenge towards realization of the Kenya
National development goal of industrialization by the year 2020. The government of Kenya in liaison with the
Japanese government came up with Strengthening of Mathematics and Science in Secondary Education
(SMASSE) to remedy the situation. This was to be achieved through in-service training for mathematics and
science teachers to improve on teacher classroom practices and student’s learning.This paper presents a
study on motivation as a strategy that influence mathematics and science teachers’ participation in the in-
service training. The study was guided by Rogers’s innovation-implementation diffusion theory. Descriptive
survey design was used and thetarget population was 1450 teachers teaching in 275 secondary schools and 9
sub-county Quality Assurance Officers (QASO). Simple random sampling and purposive sampling techniques
were used for a sample size of 438. Data was collected using questionnaires, interview schedules and an
observation guide. It was analyzed using both descriptive and inferential statistics and it was found out that
provision of motivation to teachers influence their participation. It was concluded that all teachers would
attend INSETs if motivated. From the conclusion, it was recommended that the national SMASSE office and
the MoEST should consider teachers’ views on motivation.
INTRODUCTION
Background
Modern learning theories emphasize that learners learn better if they are accorded autonomy in classroom,
time and facilities to construct knowledge for themselves and others (Brown, 1998). One of the goals of
education in Kenya is to prepare learners to contribute to the economic development of the country. In order to
realize this goal, it is envisaged that Mathematics and science will play a significant role. Because of this, the
Government has put emphasis on mathematics and science as being critical for the achievement of this goal.
According to Brown and Adams (2001), for such goal to be attained teachers must shift their attention away
from themselves as effective presenters of scientific informationto focus on student’s developmental needs to
learn science with understanding.
Efficient human capital development depends on the quality and effectiveness of teachers. It is probably for
this reason that the Koech report (RoK, 2000) recommended the Totally Integrated Quality Education and
Training (TIQET) for teacher trainees in teacher training institutionsapproved by thegovernment of Kenya.
The report of the National Committee on Educational objectives and policies (RoK, 1976) suggests that
improvement of the quality of the teacher is possible through training and retraining. It has been noted that
many teachers of science graduating from training institutions have not been exposed to all aspects of science
education (Hodson, 1993). He observed that teachers are ill prepared to teach effectively in the science
laboratory because they were brought up on a diet of content dominated cookery book type of practical work.
The Center for Mathematics, Science and Technology Education in Africa (CEMASTEA) aims at building
teachers’ capacities to enablethemcope with pedagogical related challenges encountered during curriculum
delivery. CEMASTEA coordinates SMASSE through In-Service Training (INSET) programmes. Skills
International Journal of Scientific Research and Innovative Technology ISSN: 2313-3759 Vol. 4 No. 1; January 2017
31
acquired during SMASSE INSETs support the Social Pillar of Kenya’s Vision 2030 (RoK, 2012). The
SMASSE Project Impact Assessment Survey (SPIAS) results indicate that the level of implementation of
Activity-focused, Student-centered, Experimenting and Improvisation through Plan, Do, See and Improve
(ASEI-PDSI) classroom practices innovation is low (SMASSE, 2002). This implies a glaring industrial skills
gap in Kenya. The alarming poor performance in mathematics and sciences puts the prospects of Kenya
becoming industrialized nation in jeopardy.
The SMASSE project was therefore,initiated to address the following factors deemed to affect the
performance of Mathematics and Sciences: teachers and learners attitude; teaching methodology; teachers’
mastery of content and development of teaching and learning materials (SMASSE, 1998). These factors were
to be addressed through INSETs for Mathematics and Science teachers in the whole country. Despite the
efforts and the objectives of the SMASSE project aimed at improving performance of mathematics and
science, very little has changed over the years. The continuous poor performance by students in these subjects
in national examinations has drawn concern from various stakeholders.
Mathematics and science teachers are expected to attend all the four INSET cycles as planned by the MoEST.
In cycle one; INSET emphasis is laid on attaining a positive attitude towards these subjects among the
stakeholders, the teachers and the learners.In cycle two, INSETs adopt a more practical oriented approach by
providing hands-on experience. This cycle provides opportunities to put into practice the principles of the
ASEI movement and PDSI approach. Cycle three focuses on classroom implementation of the ASEI/PDSI
classroom practices and, cycle four involves monitoring and evaluation which aims at improving the quality of
the project activities.
In Bungoma County, the training takes place at Cardinal Otunga Girl’s High school, Bungoma High School,
Friends School Kamusinga and Lugulu Girls’s High school. Despite the government’s involvement as a matter
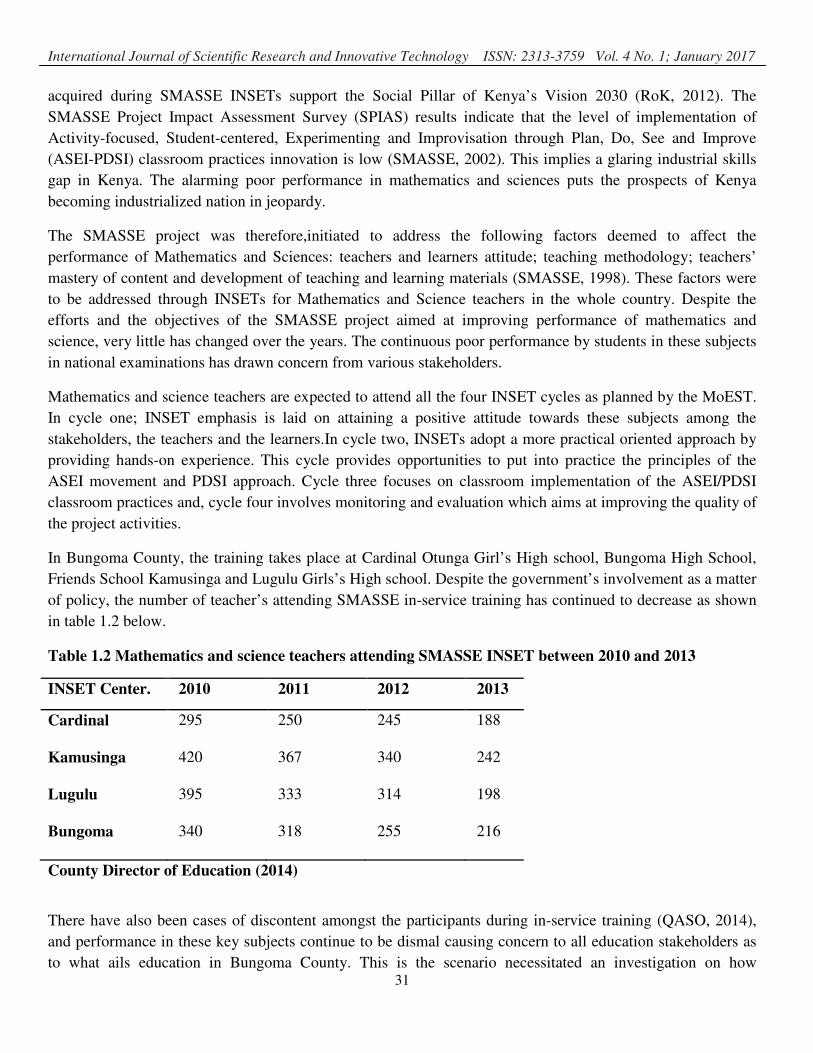
of policy, the number of teacher’s attending SMASSE in-service training has continued to decrease as shown
in table 1.2 below.
Table 1.2 Mathematics and science teachers attending SMASSE INSET between 2010 and 2013
County Director of Education (2014)
There have also been cases of discontent amongst the participants during in-service training (QASO, 2014),
and performance in these key subjects continue to be dismal causing concern to all education stakeholders as
to what ails education in Bungoma County. This is the scenario necessitated an investigation on how
INSET Center. 2010 2011 2012 2013
Cardinal 295 250 245 188
Kamusinga 420 367 340 242
Lugulu 395 333 314 198
Bungoma 340 318 255 216
International Journal of Scientific Research and Innovative Technology ISSN: 2313-3759 Vol. 4 No. 1; January 2017
32
motivation factor influence teachers’ perception on the implementation of SMASSE programme in Bungoma
County.
OBJECTIVE
.The objective of this paper was to find out the influence of motivational strategies on the teachers’
participation in the SMASSE in-service training Programme in Bungoma County.
RESEARCH METHODOLOGY
Introduction
This part of paper presents the research design; location of the study; target population; sample size and
sampling techniques; data collection instruments; data collection procedure; validity and reliability of the
research instruments; data collection and analysis procedures.
Research Design
This study was conducted through descriptive survey design. Descriptive survey involves collecting the
information by interviewing or administering a questionnaire to a sample of individuals (Orodho, 2003). This
design enabled the researcher to determine the present status of the population of the study with regard to a
number of variables. It enabled the researcher to collect information about teachers’ perception towards
implementation of SMASSE ASEI-PDSI tenets in classroom teaching and learning. The study examined the
situation as it is in Bungoma County. According to Mugenda (2003), descriptive survey involves collection of
data in order to determine whether and to what degree a relationship exists between two or more quantifiable
variables.
Area of Study
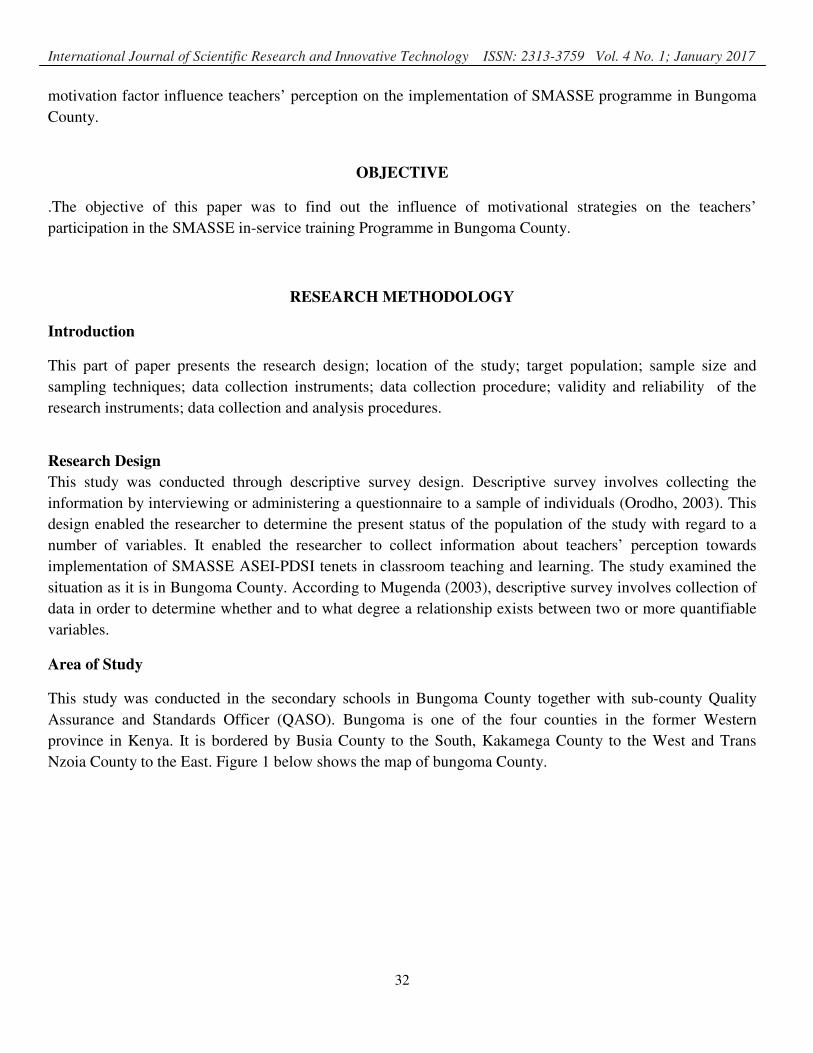
This study was conducted in the secondary schools in Bungoma County together with sub-county Quality
Assurance and Standards Officer (QASO). Bungoma is one of the four counties in the former Western
province in Kenya. It is bordered by Busia County to the South, Kakamega County to the West and Trans
Nzoia County to the East. Figure 1 below shows the map of bungoma County.
International Journal of Scientific Research and Innovative Technology ISSN: 2313-3759 Vol. 4 No. 1; January 2017
33
According to the Ministry of Planning and Development, the population of Bungoma County is estimated at
1,630,939 which make it the third most populated County in Kenya. The Taskforce Report on Education in
Bungoma County released in September, 2014 shows Performance in Mathematics and Science subjects have
been poor.The County was ranked last among the Counties bordering it.
International Journal of Scientific Research and Innovative Technology ISSN: 2313-3759 Vol. 4 No. 1; January 2017
34
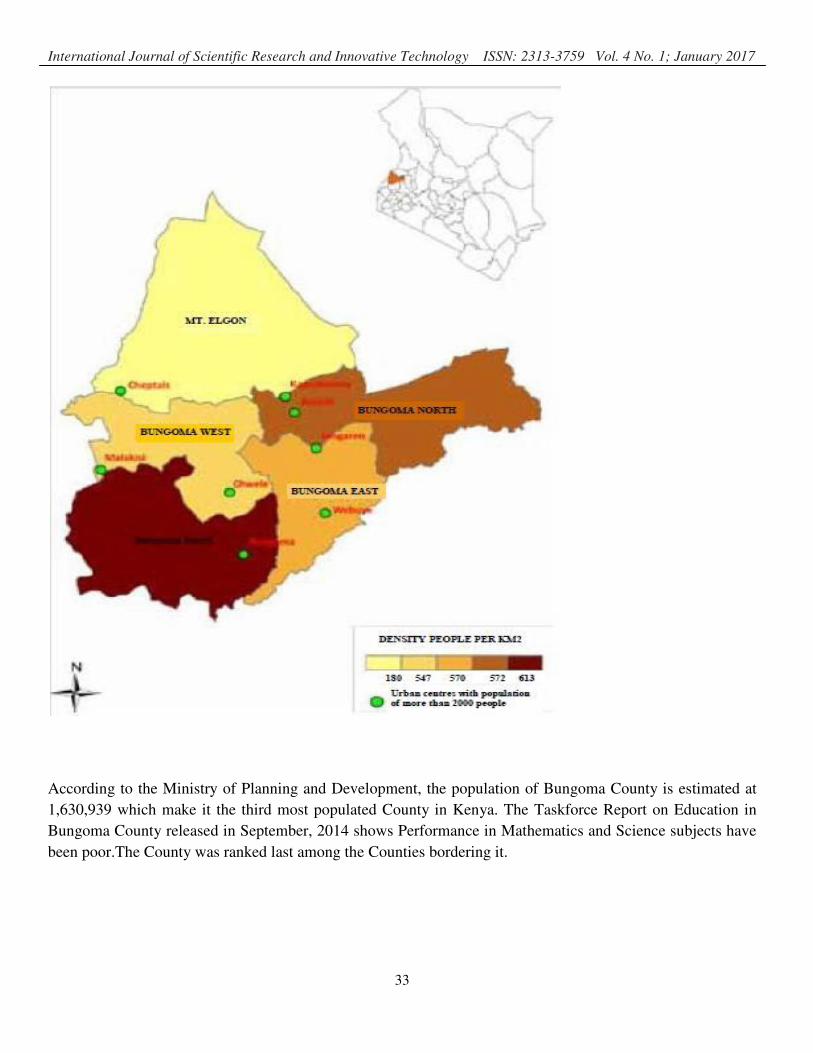
Study Population
The target population for this study was one thousand four hundred and fifty nine (1459). Out of this
population, one thousand four hundred and fifty (1450) weremathematics and science teachers, nine (9) Sub-
County QASOs. The researcher generalized the findings to this population. Table 3.1 shows target population
for schools per sub-county, number of mathematics and science teachers in each sub-county, number of
QASO and the INSET centres.
Table 3.1 Target Population
Sub-County No. of Schools No of Science &
Mathematics
Teacher
No of QASOs No of IN-SET
Centres
Bungoma Central 26 157 1 Nil
Bungoma East 48 218 1 1
Bungoma North 39 180 1 Nil
Bungoma South 43 250 1 2
Bungoma West 22 150 1 Nil
Bumula 36 198 1 Nil
Cheptais 14 45 1 Nil
Kimilili 31 165 1 1
Mt Elgon 16 87 1 Nil
Total 275 1450 9 4
Source: QASOs 2014 .
Sampling Techniques and Sample Size
The sample size was determined using the following technique;
Sampling Techniques
Since the study could not be conducted in all schools in Bungoma County, a representative sample was
selected from nine sub-counties for the study. Simple random sampling methodwas used to select 30%
secondary schools from each sub-county at a time that gave a representative sample. This was done using a
rotary method so that the remaining schools had equal opportunities of being picked. The researcher picked a
paper at a time and recorded the school’s namebefore picking the next school. The picking continued until
(30%) of the schools had been picked before sampling from the next sub-county. The process continued for all
the nine sub-counties and a total of 83 (30%) schools were sampled for this study as shown in table 3.2.

International Journal of Scientific Research and Innovative Technology ISSN: 2313-3759 Vol. 4 No. 1; January 2017
35
Table 3.2 Sampling Procedure
Sub-County No. of schools per
sub-county, N
No. of schools
sampled, n, was
given by {n=0.3xN}
No. of teachers
sampledfor study
was given
by[Ts=0.3xteachers
per sub-county]
Bungoma Central 26 08 48
Bungoma East 48 14 66
Bungoma North 39 12 54
Bungoma South 43 13 76
Bungoma West 22 07 45
Bumula 36 11 60
Cheptais 14 04 14
Kimilili 31 09 50
Mt Elgon 16 05 22
Total 275 83 435
The researcher used systematic random sampling procedure to sample out mathematics and science teachers
per sub-county. All the possible respondents were index from 1 to a maximum in each sub-county and the
researcher picked respondents at an interval that provided 30% respondents from each sub-county. The
procedure was done for all the nine sub-counties and a total of 435 (30%) respondents were picked for this
study. The researcher used simple random sampling to select 3 (33%) QASOs.
Sample Size
The main factor to consider in determining the sample size is the need to keep it manageable enough (Orodho
and Kombo, 2002). Therefore by studying the sample, one can be able to know more about the population
without having to study the entire population. Although Bungoma County has 275 public secondary schools,
only 83 (30.2%) schools were randomly sampled. A total sample of 438 (30.0%) respondents was selected
from the target population for the study. This sample consisted of 435 (30%) teachers of mathematics and
sciences, and 3 (33.3%) sub-county QASOs. This is considered as a representative sample since it falls within
the range advocated by Mugenda and Mugenda (2003) who argues that, a representative sample for a
descriptive survey study that fulfils requirements of efficiency, reliabilityand flexibility, shouldbe in the range
of 20% to 30%. Table 3.2 shows respondents sample size.

International Journal of Scientific Research and Innovative Technology ISSN: 2313-3759 Vol. 4 No. 1; January 2017
36
Table 3.3 Sample Size
Respondents Population
N
Sample
Population
n
Percentage
%
Sampling
Technique
Teachers 1450 435 30.0% Simple
Random
Sampling
QASOs 9 3 33.3% Purposive
Sampling
Sample Size 438 30.0%
Instruments for Data Collection
The research instruments for this study were Questionnaire, Observation and Interview schedules which were
developed by the researcher.
Questionnaire
The questionnaire is a research instrument that gathers data over a large sample (Kombo and Tromp, 2013). A
questionnaire ensures anonymity that gives respondents freedom to respond without fear of victimization
while allowing them to make their suggestions. The researcher used a questionnaire which had both open
ended and closed ended items. It had three sections. Section A sought the teachers’ background information
including age and academic/professional qualification. Section B had items that sought to establish how
motivational strategies influence respondents’ participation in the in-service training. Section E aimed at
finding suggestions for improvement of the implementation of SMASSE programme.
Interview Schedule
According to Koul (1993), interview method is often superior compared to other research tools. Once a
rapport has been established and confidence assured, certain confidential information can be divulged that
would otherwise have escaped the researcher (Platton, 1990). In addition, follow up can be made on incorrect
or incomplete answers to certain questions and the interviewer has the opportunity to gauge the sincerity of the
respondents’ information (Koul, 1993; Platton, 1990). This gave the researcher a complete and detailed
understanding of motivation provided to respondents and attributes of trainers.

International Journal of Scientific Research
Observation Schedule
It was used to obtain data on the use of A
able to evaluate the lesson sampled by in
techniques and improvisation during teac
Ethical Consideration
The permission to carry out this research
and the concerned parties. Permission wa
schools. The researcher kept any persona
to access it.
Data Analysis Procedure
Data was gathered from the field, coded
for Social Sciences (SPSS). Data collecte
FINDINGS
Gender of Respondents
There were 266 (62%) male and 163 (38
in-service training in Bungoma County.
Figu
ch and Innovative Technology ISSN: 2313-3759 Vo
37
f ASEI-PDSI practice during teaching and learnin
indicating the frequency use of teaching and lear
eaching and learning process.
ch and to use information obtained was sought fro
was obtained from the university, NACOSTI and
nal information confidential and did not allow any
ed and entered into the computer for analysis us
cted was presented using pie charts, tables and bar
(38%) female mathematics and science teachers w
y.
Male
62%
Female
38%
igure on Gender of the Respondents
ol. 4 No. 1; January 2017
ning. The researcher was
earning method, teaching
from relevant authorities
d the participating
ny unauthorized person
using Statistical Package
bar graphs.
who attended SMASSE

International Journal of Scientific Research and Innovative Technology ISSN: 2313-3759 Vol. 4 No. 1; January 2017
38
Professional Qualification of the Respondents
Respondents were asked to indicate their professional qualifications and the findings were represented as
shown below.
The finding shows that 318 (74%) respondents were Bachelor of Education degree holders, 47 (11%)
respondents were holders Bachelor of Science with a Post Graduate Diploma in Education, 43 (10%) were
Diploma holders in Education while 21(5%) respondents were Master of Education Degree. The findings
indicate that all the mathematics and science teachers were professionally trained.
0
10
20
30
40
50
60
70
80
90
100
Diploma BED BA/BSC WITH
PGDE
MED
Pe
rce
nta
ge
Figure on Respondents' Professional Qualification
International Journal of Scientific Research
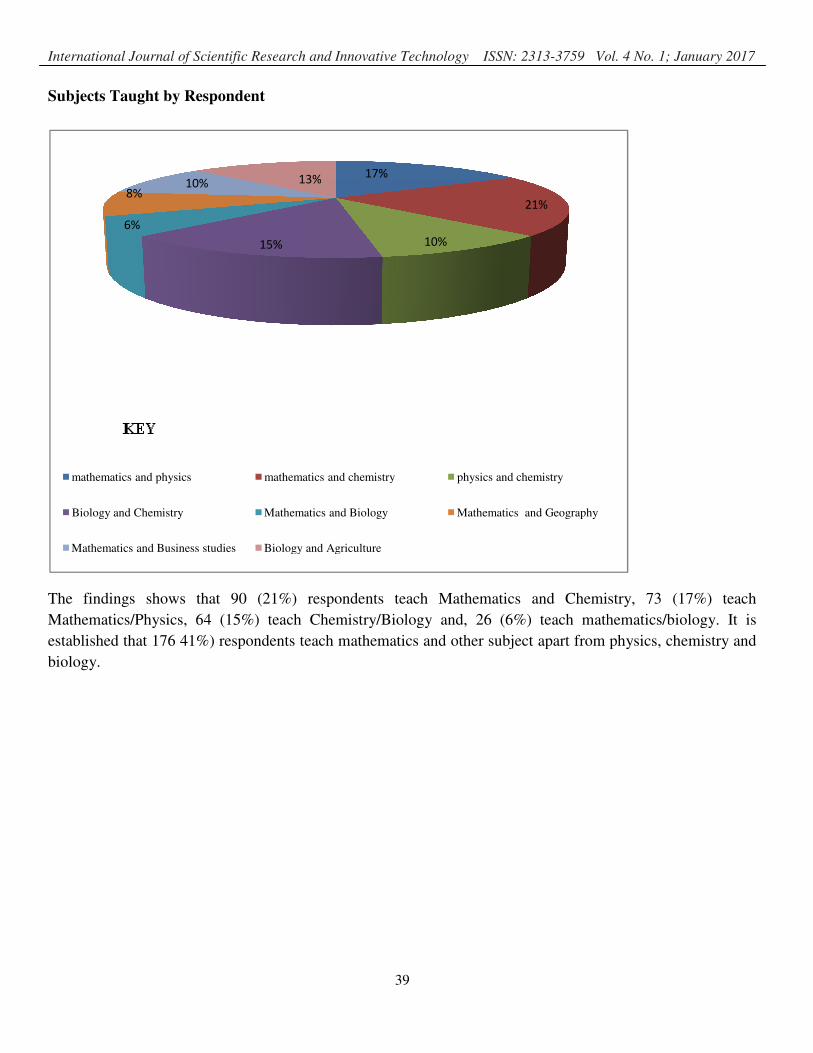
Subjects Taught by Respondent
The findings shows that 90 (21%)
Mathematics/Physics, 64 (15%) teach
established that 176 41%) respondents te
biology.
15%
6%
8%10% 13
mathematics and physics mathema
Biology and Chemistry Mathema
Mathematics and Business studies Biology
ch and Innovative Technology ISSN: 2313-3759 Vo
39
) respondents teach Mathematics and Chemis
h Chemistry/Biology and, 26 (6%) teach math
teach mathematics and other subject apart from
17%
21%
10%
13%
matics and chemistry physics and chemistry
matics and Biology Mathematics and Geography
y and Agriculture
ol. 4 No. 1; January 2017
istry, 73 (17%) teach
hematics/biology. It is
physics, chemistry and
International Journal of Scientific Research and Innovative Technology ISSN: 2313-3759 Vol. 4 No. 1; January 2017
40
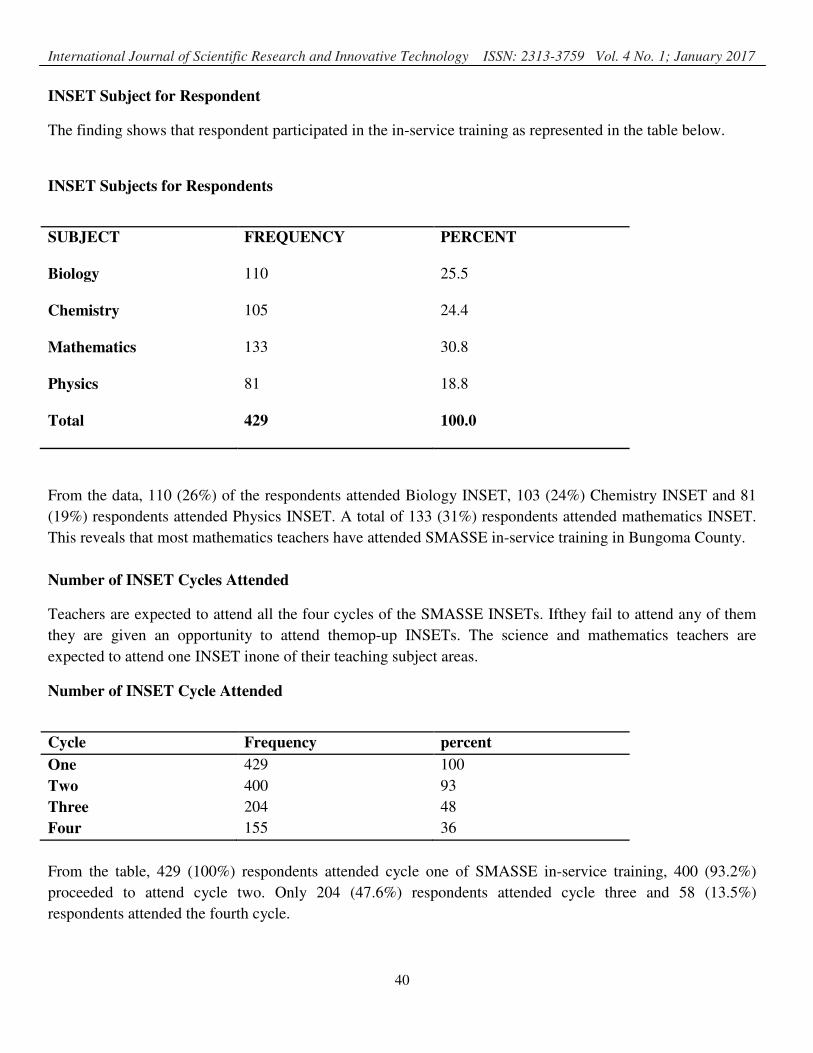
INSET Subject for Respondent
The finding shows that respondent participated in the in-service training as represented in the table below.
INSET Subjects for Respondents
SUBJECT FREQUENCY PERCENT
Biology 110 25.5
Chemistry 105 24.4
Mathematics 133 30.8
Physics 81 18.8
Total 429 100.0
From the data, 110 (26%) of the respondents attended Biology INSET, 103 (24%) Chemistry INSET and 81
(19%) respondents attended Physics INSET. A total of 133 (31%) respondents attended mathematics INSET.
This reveals that most mathematics teachers have attended SMASSE in-service training in Bungoma County.
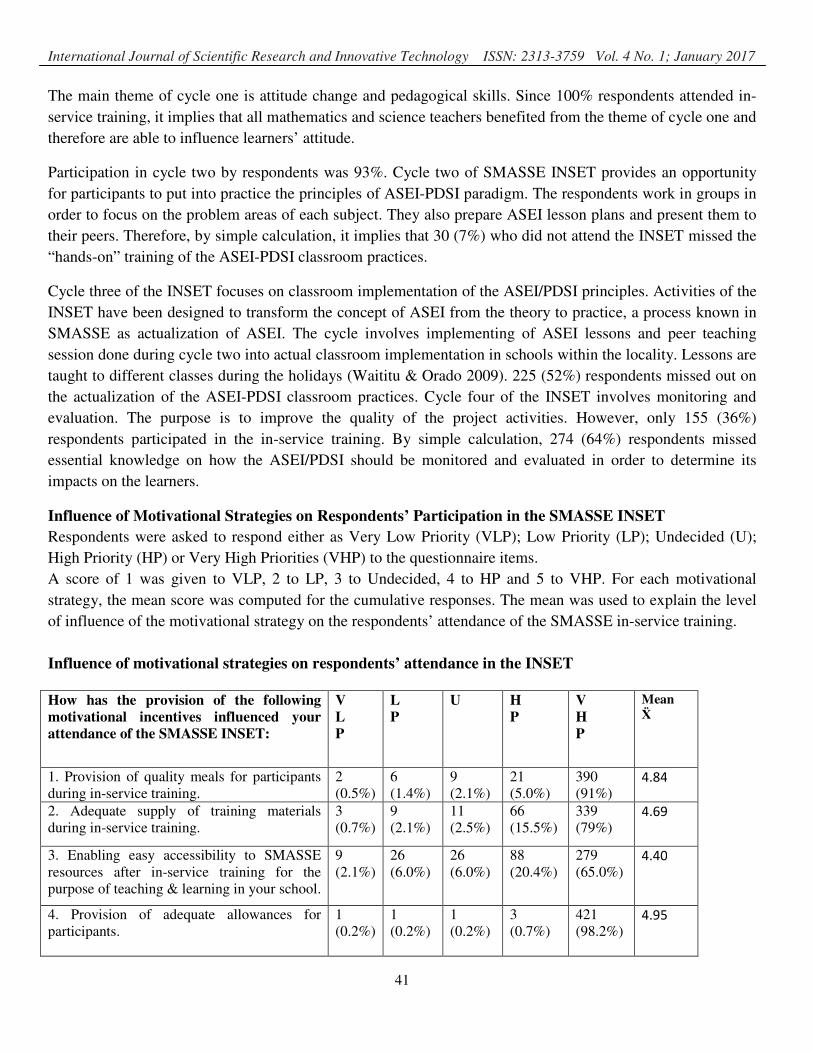
Number of INSET Cycles Attended
Teachers are expected to attend all the four cycles of the SMASSE INSETs. Ifthey fail to attend any of them
they are given an opportunity to attend themop-up INSETs. The science and mathematics teachers are
expected to attend one INSET inone of their teaching subject areas.
Number of INSET Cycle Attended
Cycle Frequency percent
One 429 100
Two 400 93
Three 204 48
Four 155 36
From the table, 429 (100%) respondents attended cycle one of SMASSE in-service training, 400 (93.2%)
proceeded to attend cycle two. Only 204 (47.6%) respondents attended cycle three and 58 (13.5%)
respondents attended the fourth cycle.
International Journal of Scientific Research and Innovative Technology ISSN: 2313-3759 Vol. 4 No. 1; January 2017
41
The main theme of cycle one is attitude change and pedagogical skills. Since 100% respondents attended in-
service training, it implies that all mathematics and science teachers benefited from the theme of cycle one and
therefore are able to influence learners’ attitude.
Participation in cycle two by respondents was 93%. Cycle two of SMASSE INSET provides an opportunity
for participants to put into practice the principles of ASEI-PDSI paradigm. The respondents work in groups in
order to focus on the problem areas of each subject. They also prepare ASEI lesson plans and present them to
their peers. Therefore, by simple calculation, it implies that 30 (7%) who did not attend the INSET missed the
“hands-on” training of the ASEI-PDSI classroom practices.
Cycle three of the INSET focuses on classroom implementation of the ASEI/PDSI principles. Activities of the
INSET have been designed to transform the concept of ASEI from the theory to practice, a process known in
SMASSE as actualization of ASEI. The cycle involves implementing of ASEI lessons and peer teaching
session done during cycle two into actual classroom implementation in schools within the locality. Lessons are
taught to different classes during the holidays (Waititu & Orado 2009). 225 (52%) respondents missed out on
the actualization of the ASEI-PDSI classroom practices. Cycle four of the INSET involves monitoring and
evaluation. The purpose is to improve the quality of the project activities. However, only 155 (36%)
respondents participated in the in-service training. By simple calculation, 274 (64%) respondents missed
essential knowledge on how the ASEI/PDSI should be monitored and evaluated in order to determine its
impacts on the learners.
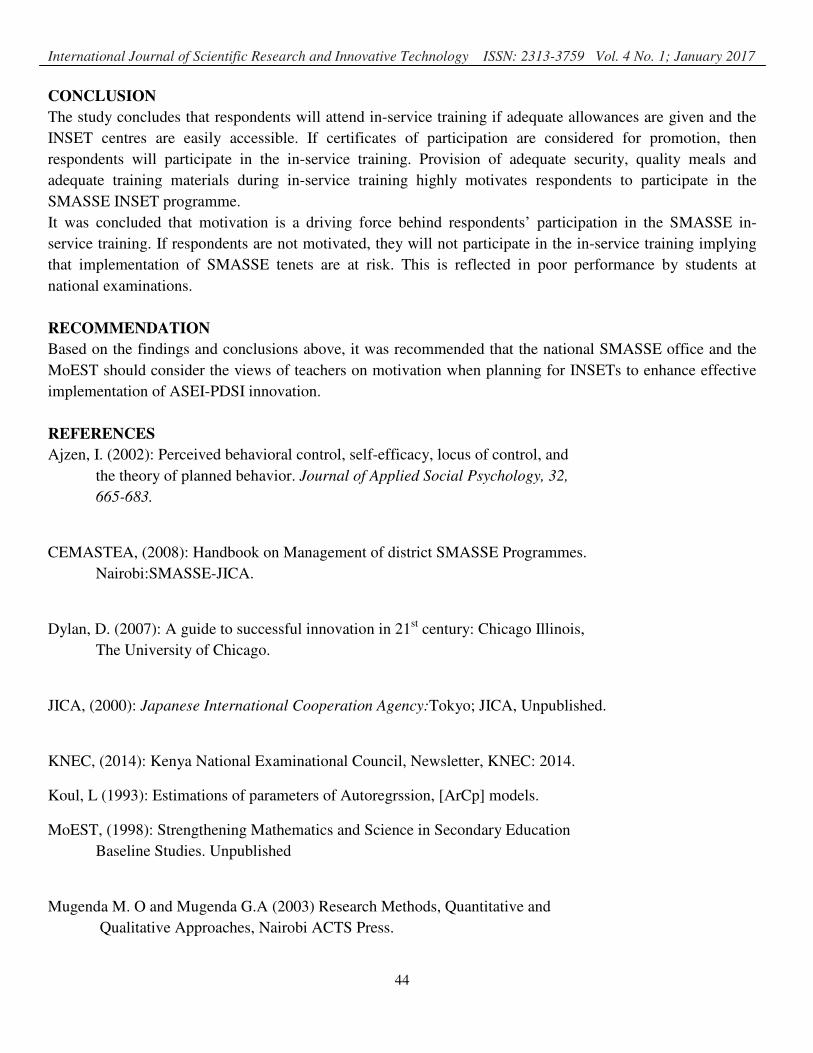
Influence of Motivational Strategies on Respondents’ Participation in the SMASSE INSET
Respondents were asked to respond either as Very Low Priority (VLP); Low Priority (LP); Undecided (U);
High Priority (HP) or Very High Priorities (VHP) to the questionnaire items.
A score of 1 was given to VLP, 2 to LP, 3 to Undecided, 4 to HP and 5 to VHP. For each motivational
strategy, the mean score was computed for the cumulative responses. The mean was used to explain the level
of influence of the motivational strategy on the respondents’ attendance of the SMASSE in-service training.
Influence of motivational strategies on respondents’ attendance in the INSET
How has the provision of the following
motivational incentives influenced your
attendance of the SMASSE INSET:
V
L
P
L
P
U H
P
V
H
P
Mean
Ẍ
1. Provision of quality meals for participants
during in-service training.
2
(0.5%)
6
(1.4%)
9
(2.1%)
21
(5.0%)
390
(91%) 4.84
2. Adequate supply of training materials
during in-service training.
3
(0.7%)
9
(2.1%)
11
(2.5%)
66
(15.5%)
339
(79%) 4.69
3. Enabling easy accessibility to SMASSE
resources after in-service training for the
purpose of teaching & learning in your school.
9
(2.1%)
26
(6.0%)
26
(6.0%)
88
(20.4%)
279
(65.0%) 4.40
4. Provision of adequate allowances for
participants.
1
(0.2%)
1
(0.2%)
1
(0.2%)
3
(0.7%)
421
(98.2%) 4.95

International Journal of Scientific Research and Innovative Technology ISSN: 2313-3759 Vol. 4 No. 1; January 2017
42
5. Provision of entertainment and recreational
facilities
112
(26%)
124
(29%)
56
(13%)
43
(10%)
94
(22%) 2.73
6. Provision of adequate security during the
in-service.
1
(0.2%)
3
(0.6%)
3
(0.6%)
32
(7.4%)
390
(91%) 4.88
7. Consideration of SMASSE INSET
certificates by TSC as basis of promotion of
participants at end of 4th-cycle.
2
(0.5%)
7
(1.6%)
2
(0.5%)
10
(2.3%)
406
(94.7%) 4.90
8. Accessibility to SMASSE in-service
training centre
1
(0.2%)
3
(0.7%)
1
(0.2%)
13
(3.0%)
409
(95.4%) 4.91
Results from table 4.4 show how respondents prioritize different motivational strategies. The mean for
cumulative response for every motivational strategy was calculated from the following relation:
Mean = Sum of product of responses and priority score
Number of respondents
The computed mean was used to explain how the strategy influenced participation in the in-service training.
Respondents were asked to prioritize provision of quality meals during in-service training. A mean of 4.84
was obtained implying that provision of quality meal to respondents highly influence their participation in the
in-service training. Similarly, respondents highly prioritize provision of adequate training resources during the
INSET. A mean of 4.69 was calculated showing that adequate resources during SMASSE in-service training
highly influence respondents’ participation.
From table 4.4, 367 (86%) respondents indicate that accessing SMASSE resources for the purpose of teaching
and learning in their school highly influences their attendance. The response on provision of allowance to
participant indicated a very high priority. A mean of 4.95 was obtained implying that provision of adequate
allowance to participants highly influence their participation.
Respondents were asked to prioritize how provision of entertainment and other recreational facilities during
in-service training influence participation. The findings were represented in table 4.4 from which a mean of
2.73 was computed. This implies that provision of entertainment does not influence participation.
Provision of adequate security during in-service training was considered as a very high priority by
respondents. A mean for cumulative responses on provision of security was presented in table 4.4. It implies
that good security at the INSET centre will motivate participation by respondents.
Respondents were asked to prioritize how consideration of SMASSE INSET certificates by Teachers Service
Commission (TSC) for promotion. The findings were presented in table 4.4 from which a mean of 4.90 was
obtained indicating a very high priority. This implies that consideration of certificate by TSC will highly
influence participation.

International Journal of Scientific Research and Innovative Technology ISSN: 2313-3759 Vol. 4 No. 1; January 2017
43
Finally, the researcher asked respondents to prioritize how accessibility to in-service training centres
influenced participation. A mean of 4.91 was calculated from the findings presented in table 4.4 under
accessibility to INSET centres implying a very high priority. From the mean, accessibility to training centres
highly influence respondents’ participation in the INSET.
Therefore, from the aforementioned analysis, the findings show that provision of motivation to participant
influence participation. The mean of motivational strategies were ranked as shown.
Ranking of Prioritized Motivational Strategies
The responses on provision of adequate allowance and accessibility to INSET centres highly influence their
participation. Respondents will not attend in-service training if certificate for participation have no value
attached; security at the INSET centre is not adequate and; meals provided are not of good quality. However,
provision of entertainment and other recreational facilities will not influence participation. Respondents will
attend with or without entertainment.
From table 4.5, the study concludes about objective one that provision of adequate allowance; accessibility to
in-service training centres; consideration of certificates for promotion; provision of adequate security and
quality meals highly motivate teachers to participate in the in-service training. Availability of sufficient
training materials during training and accessing SMASSE resources by mathematics and science teachers to
use in their schools for teaching and learning motivates respondents’ participation. Provision of entertainment
and recreational facilities do not motivate respondents to participate in the in-service training.
A study by Ndirangu, (2013) on factors influencing teachers’ level of implementation of strengthening of
mathematics and science in secondary education, did not consider provision of adequate allowance to
participants and accessibility to INSET centres as motivational strategies influencing participation. This study
therefore sought to fill the gap.
Motivational Strategy Mean
1. Provision of adequate allowances to participants. 4.95
2. Accessibility to SMASSE in-service training centre. 4.91
3. Consideration of SMASSE certificates for promotion. 4.90
4. Provision of adequate security at INSET centres. 4.88
5. Provision of quality meals during in-service training. 4.84
6. Adequate training materials during in-service training. 4.69
7. Accessing SMASSE resources for teaching/learning. 4.40
8. Provision of entertainment and other recreational facilities. 1.73
International Journal of Scientific Research and Innovative Technology ISSN: 2313-3759 Vol. 4 No. 1; January 2017
44
CONCLUSION
The study concludes that respondents will attend in-service training if adequate allowances are given and the
INSET centres are easily accessible. If certificates of participation are considered for promotion, then
respondents will participate in the in-service training. Provision of adequate security, quality meals and
adequate training materials during in-service training highly motivates respondents to participate in the
SMASSE INSET programme.
It was concluded that motivation is a driving force behind respondents’ participation in the SMASSE in-
service training. If respondents are not motivated, they will not participate in the in-service training implying
that implementation of SMASSE tenets are at risk. This is reflected in poor performance by students at
national examinations.
RECOMMENDATION
Based on the findings and conclusions above, it was recommended that the national SMASSE office and the
MoEST should consider the views of teachers on motivation when planning for INSETs to enhance effective
implementation of ASEI-PDSI innovation.
REFERENCES
Ajzen, I. (2002): Perceived behavioral control, self-efficacy, locus of control, and
the theory of planned behavior. Journal of Applied Social Psychology, 32,
665-683.
CEMASTEA, (2008): Handbook on Management of district SMASSE Programmes.
Nairobi:SMASSE-JICA.
Dylan, D. (2007): A guide to successful innovation in 21st century: Chicago Illinois,
The University of Chicago.
JICA, (2000): Japanese International Cooperation Agency:Tokyo; JICA, Unpublished.
KNEC, (2014): Kenya National Examinational Council, Newsletter, KNEC: 2014.
Koul, L (1993): Estimations of parameters of Autoregrssion, [ArCp] models.
MoEST, (1998): Strengthening Mathematics and Science in Secondary Education
Baseline Studies. Unpublished
Mugenda M. O and Mugenda G.A (2003) Research Methods, Quantitative and
Qualitative Approaches, Nairobi ACTS Press.
International Journal of Scientific Research and Innovative Technology ISSN: 2313-3759 Vol. 4 No. 1; January 2017
45
Ndirangu, C. W. (2006). An evaluation of smasse in-service project in Biology in
Kajiado district, Kenya. Master in Education Project: VDM.
Orodho, O. J. (2009): Research Instruments: Validity of Research instruments and data Reliability.
Orodho, O. J. (2009): Research Instruments: Validity of Research instruments and data Reliability.
Rogers E.M (1995): Diffusion of Innovation, (4th
ed). New York: The Free Press.
SMASSE, (2008): Handbook on management of district SMASSE Programmes. Nairobi
JICA.Unpublished.
Task Force, (2014): Report on KCSE 2013 Performance in Bungoma County.