factorial anova statistics for the social sciences psychology 340 spring 2010
TRANSCRIPT
Factorial ANOVA
Statistics for the Social SciencesPsychology 340
Spring 2010
PSY 340Statistics for the
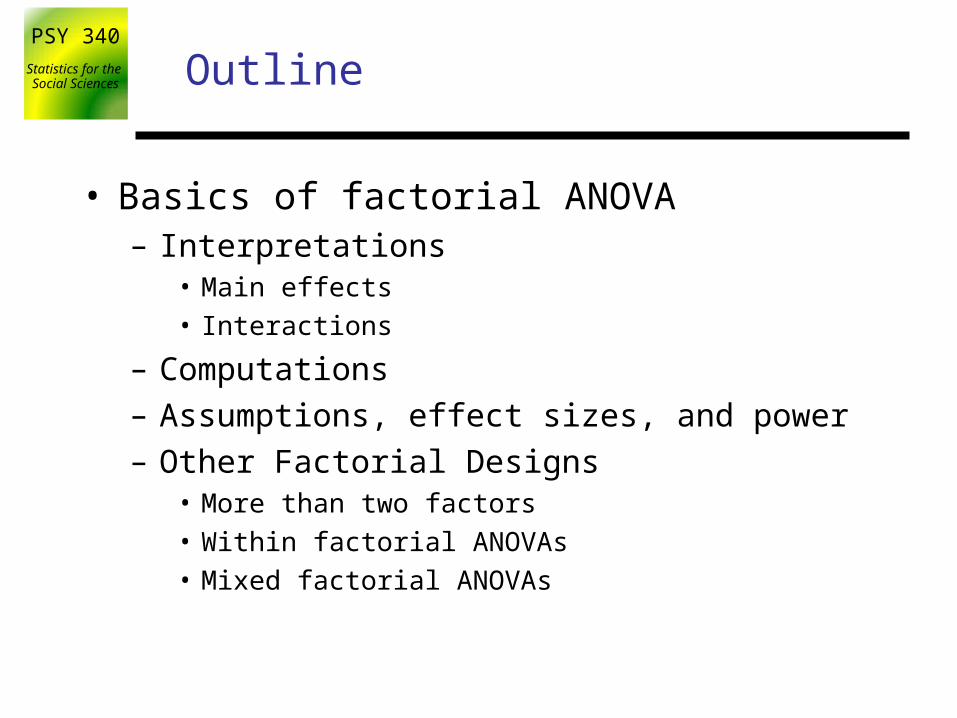
Social SciencesOutline
• Basics of factorial ANOVA– Interpretations
• Main effects
• Interactions
– Computations
– Assumptions, effect sizes, and power
– Other Factorial Designs• More than two factors
• Within factorial ANOVAs
• Mixed factorial ANOVAs

PSY 340Statistics for the
Social Sciences
Statistical analysis follows design
• The factorial (between groups) ANOVA:
– More than two groups
– Independent groups
– More than one Independent variable
PSY 340Statistics for the
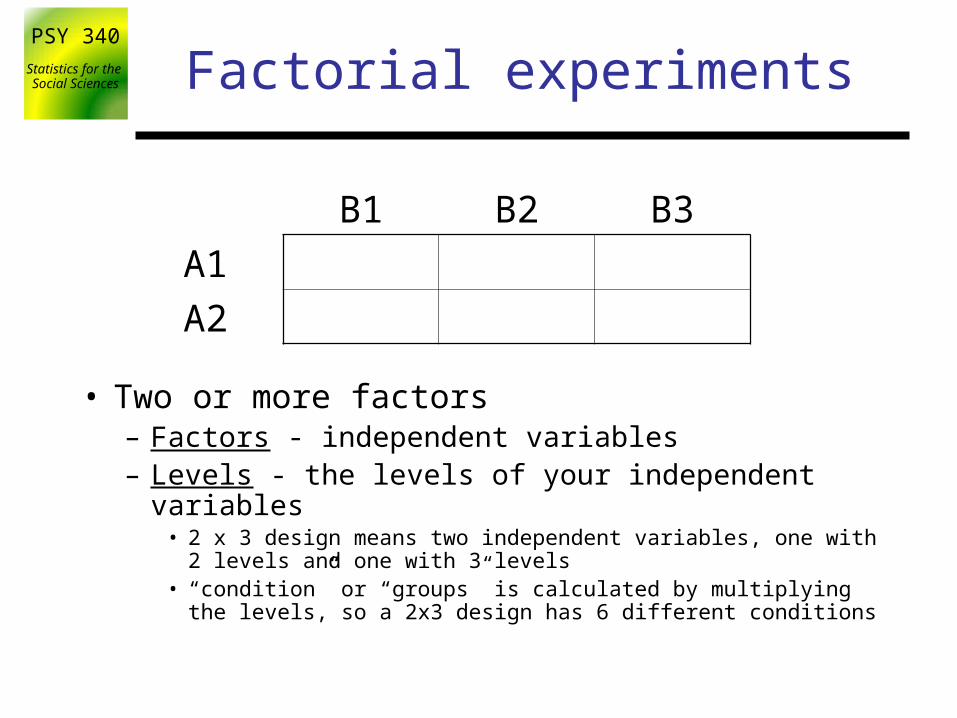
Social Sciences Factorial experiments
• Two or more factors– Factors - independent variables– Levels - the levels of your independent variables
• 2 x 3 design means two independent variables, one with 2 levels and one with 3 levels
• “condition” or “groups” is calculated by multiplying the levels, so a 2x3 design has 6 different conditions
B1 B2 B3
A1
A2

PSY 340Statistics for the
Social Sciences Factorial experiments
• Two or more factors (cont.)– Main effects - the effects of your independent variables
ignoring (collapsed across) the other independent variables
– Interaction effects - how your independent variables affect each other
• Example: 2x2 design, factors A and B
• Interaction:– At A1, B1 is bigger than B2
– At A2, B1 and B2 don’t differ
PSY 340Statistics for the
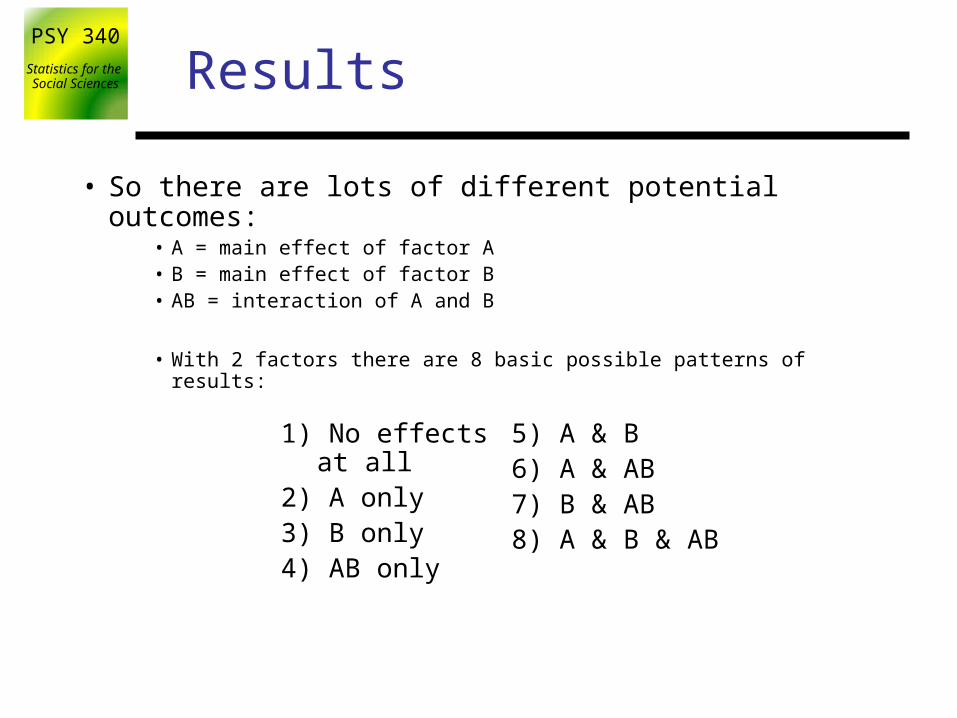
Social Sciences Results
• So there are lots of different potential outcomes:• A = main effect of factor A• B = main effect of factor B• AB = interaction of A and B
• With 2 factors there are 8 basic possible patterns of results:
5) A & B6) A & AB7) B & AB8) A & B & AB
1) No effects at all2) A only3) B only4) AB only
PSY 340Statistics for the
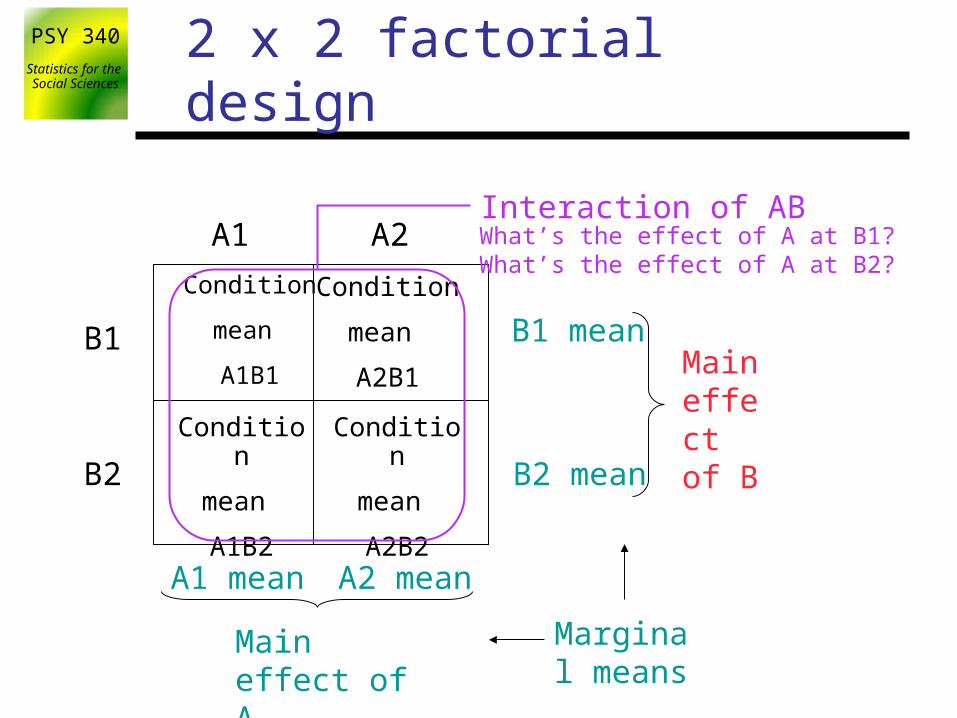
Social Sciences 2 x 2 factorial design
Condition
mean
A1B1
Condition
mean
A2B1
Condition
mean
A1B2
Condition
mean
A2B2
A1 A2
B2
B1
Marginal means
B1 mean
B2 mean
A1 mean A2 mean
Main effect of B
Main effect of A
Interaction of ABWhat’s the effect of A at B1?What’s the effect of A at B2?
PSY 340Statistics for the
Social Sciences
Main effect of AMain effect of BInteraction of A x B
A
B
A1 A2
B1
B2
Main Effect of A
Main Effect of B
60
45
45
30
6030
6030
A
A1 A2
Dependent
Vari
able
B1
B2
√X
X
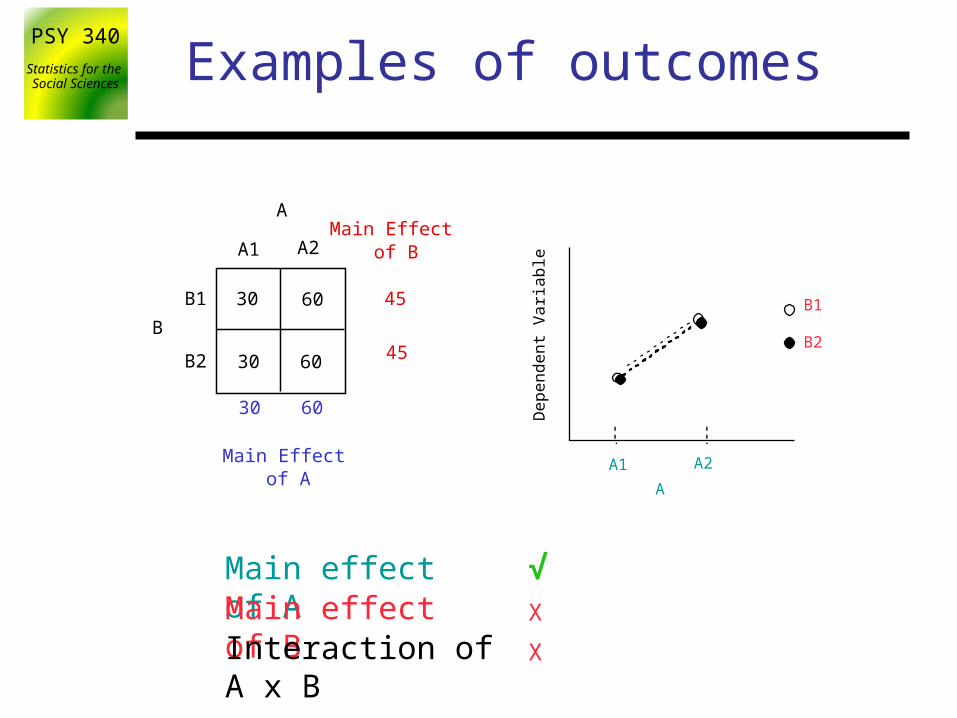
Examples of outcomes

PSY 340Statistics for the
Social Sciences
Main effect of AMain effect of BInteraction of A x B
A
B
A1 A2
B1
B2
Main Effect of A
Main Effect of B
45
60
30
45
3030
6060
A
A1 A2
Dependent
Vari
able
B1
B2
√X
X
Examples of outcomes
PSY 340Statistics for the
Social Sciences
Main effect of AMain effect of BInteraction of A x B
A
B
A1 A2
B1
B2
Main Effect of A
Main Effect of B
45
45
45
45
6030
3060
A
A1 A2
Dependent
Vari
able
B1
B2
√X
X
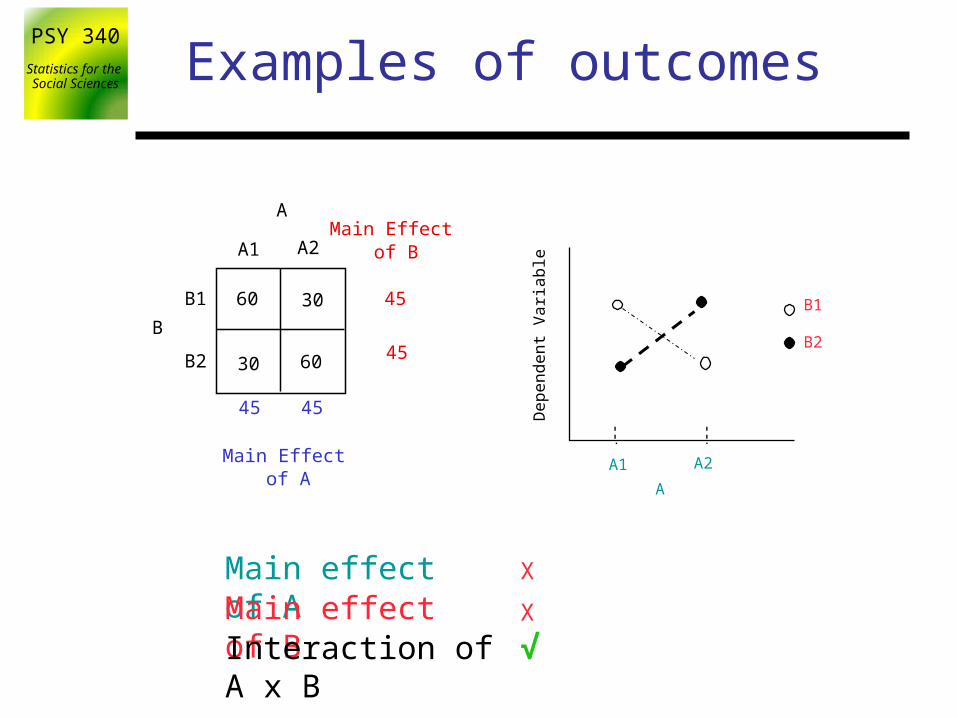
Examples of outcomes

PSY 340Statistics for the
Social Sciences
Main effect of AMain effect of BInteraction of A x B
A
B
A1 A2
B1
B2
Main Effect of A
Main Effect of B
45
45
30
30
3030
6030
A
A1 A2
Dependent
Vari
able
B1
B2
√
√
√
Examples of outcomes
PSY 340Statistics for the
Social Sciences Factorial Designs
• Benefits of factorial ANOVA (over doing separate 1-way ANOVA experiments)– Interaction effects
– One should always consider the interaction effects before trying to interpret the main effects
– Adding factors decreases the variability– Because you’re controlling more of the variables that
influence the dependent variable– This increases the statistical Power of the statistical tests
PSY 340Statistics for the
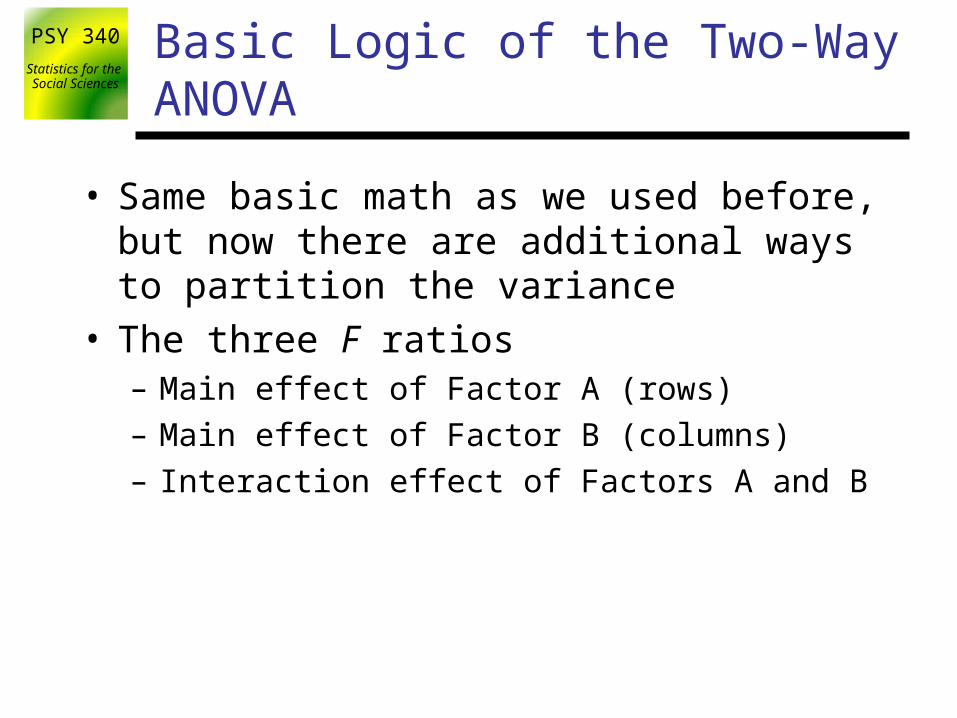
Social Sciences Basic Logic of the Two-Way ANOVA
• Same basic math as we used before, but now there are additional ways to partition the variance
• The three F ratios– Main effect of Factor A (rows)
– Main effect of Factor B (columns)
– Interaction effect of Factors A and B
PSY 340Statistics for the
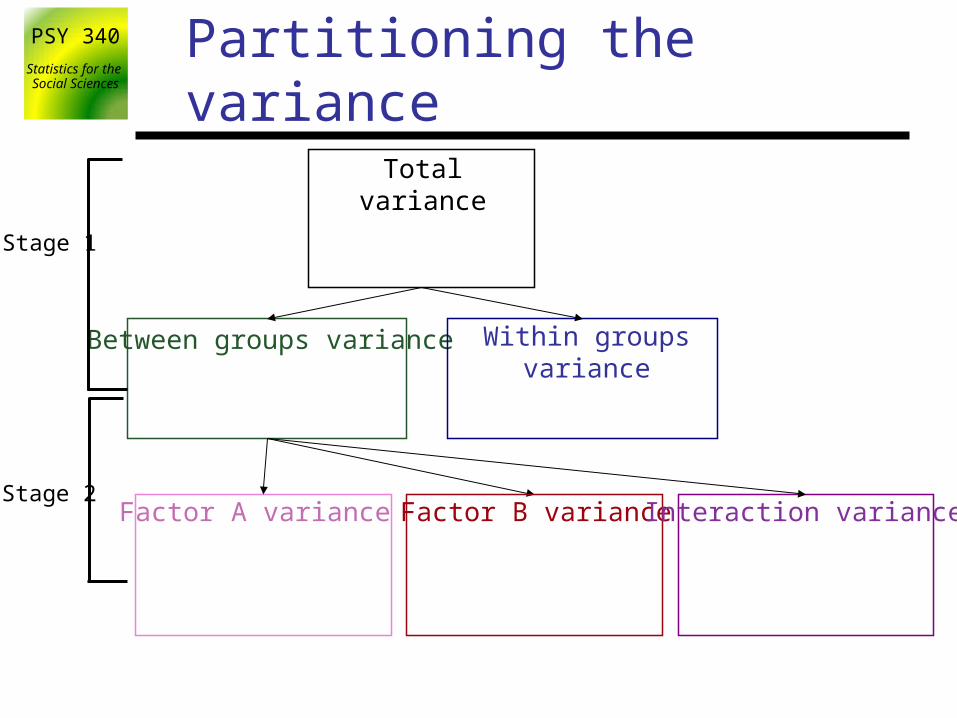
Social Sciences Partitioning the variance
Total variance
Stage 1
Between groups variance Within groups variance
Stage 2Factor A variance Factor B variance Interaction variance
PSY 340Statistics for the
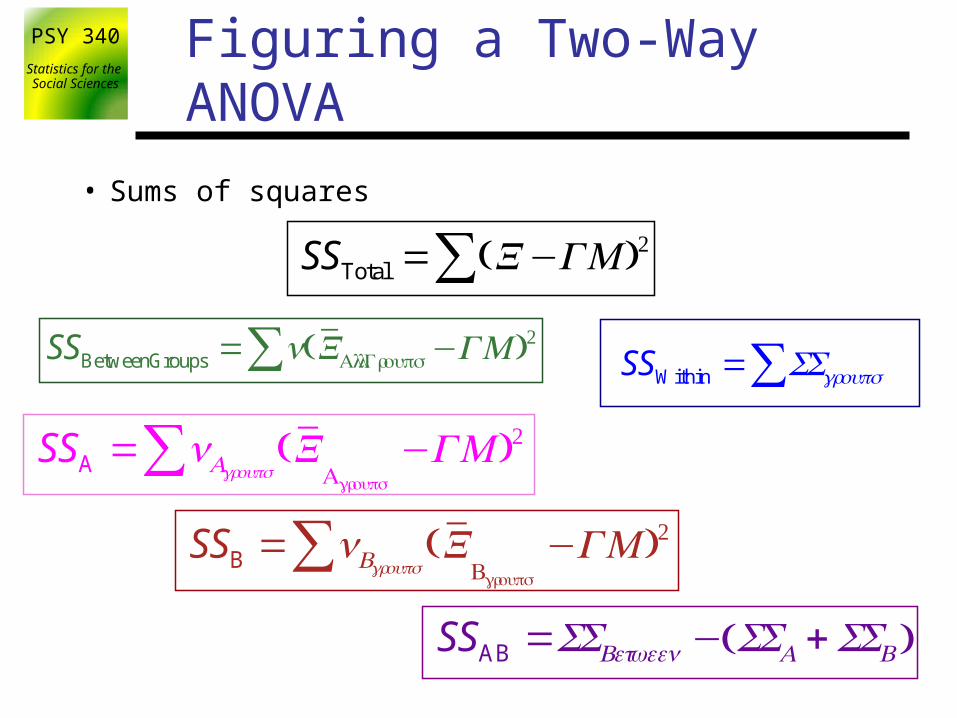
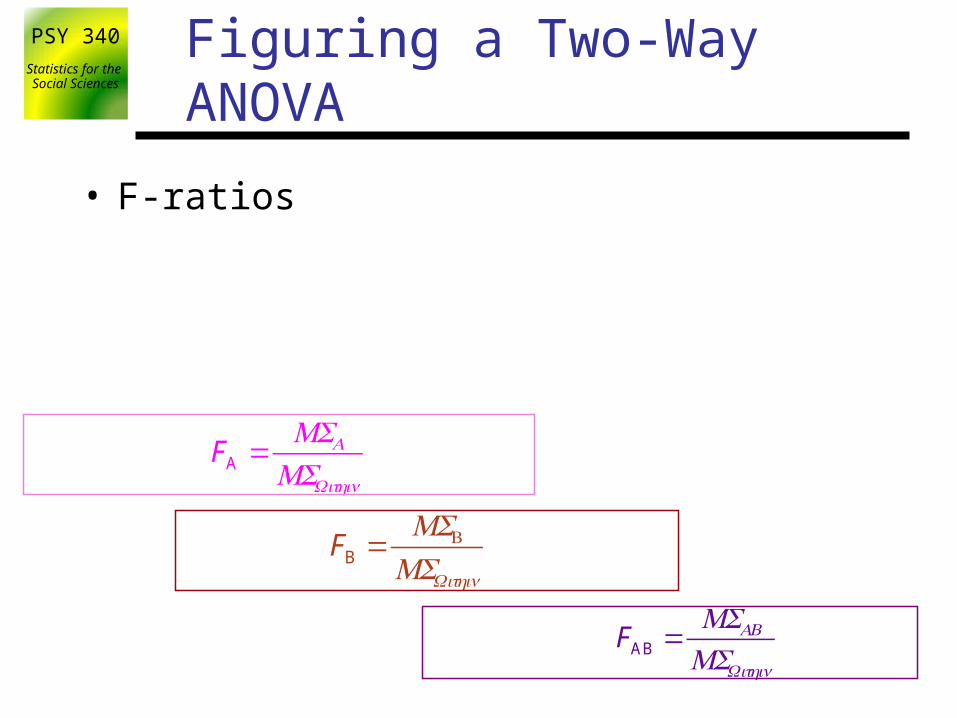
Social Sciences Figuring a Two-Way ANOVA
• Sums of squares
SSWithin = SSgroups∑
SSA = nAgroups(X∑
Agroups
−GM )2
SSAB =SSBetween − SSA +SSB( )
SSBetweenGroups = n(XAllGroups∑ −GM )2
SSTotal = (X∑ −GM )2
SSB = nBgroups(X∑
Bgroups
−GM )2

PSY 340Statistics for the
Social Sciences Figuring a Two-Way ANOVA
• Degrees of freedom
dfA =NA −1
dfB =NB −1
dfAB =NConditions −dfA −dfB −1
dfWithin = dfeach group∑Number of levels of A
Number of levels of A
Number of levels of B
Number of levels of B
PSY 340Statistics for the
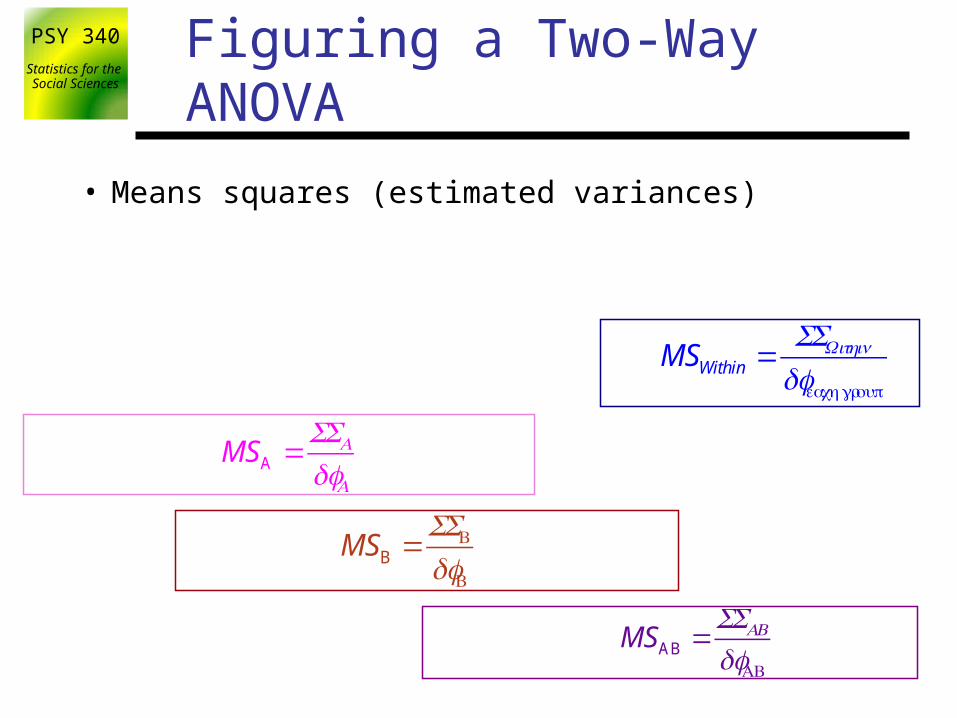
Social Sciences Figuring a Two-Way ANOVA
• Means squares (estimated variances)
MSA =SSA
dfA
MSB =SSB
dfB
MSAB =SSAB
dfAB
MSWithin =SSWithin
dfeach group
PSY 340Statistics for the
Social Sciences Figuring a Two-Way ANOVA
• F-ratios
FA =MSA
MSWithin
FB =MSB
MSWithin
FAB =MSAB
MSWithin
PSY 340Statistics for the
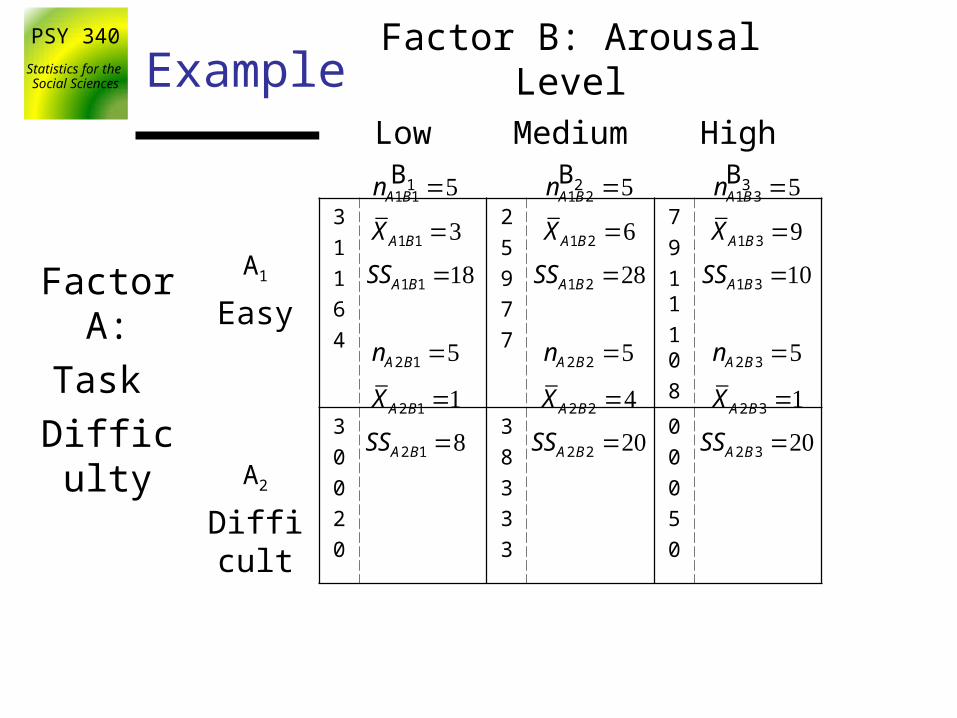
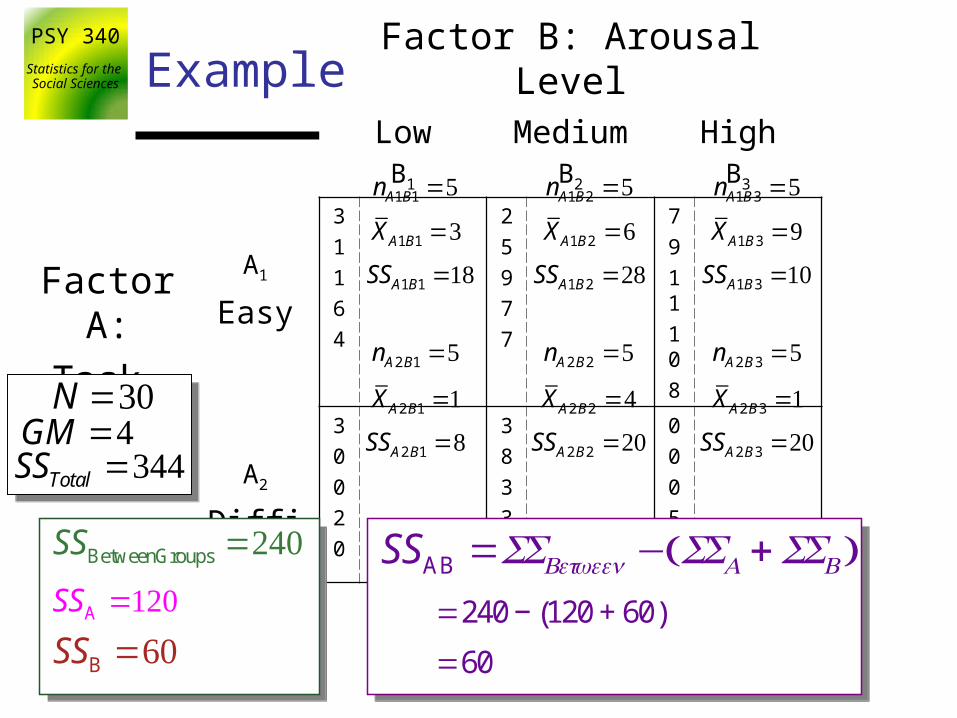
Social Sciences ExampleFactor B: Arousal Level
LowB1
MediumB2
HighB3
FactorA:
Task
Difficulty
A1
Easy
3
1
1
6
4
2
5
9
7
7
7
9
11
10
8
A2
Difficult
3
0
0
2
0
3
8
3
3
3
0
0
0
5
0
XA1B1 =3
SSA1B1 =18
nA1B1 =5
XA2 B1 =1 XA2 B2 =4
XA1B2 =6 XA1B3 =9
XA2 B3 =1
SSA1B2 =28 SSA1B3 =10
SSA2 B1 =8 SSA2 B2 =20 SSA2 B3 =20
nA1B2 =5 nA1B3 =5
nA2 B1 =5 nA2 B2 =5 nA2 B3 =5
PSY 340Statistics for the
Social Sciences ExampleFactor B: Arousal Level
LowB1
MediumB2
HighB3
FactorA:
Task
Difficulty
A1
Easy
3
1
1
6
4
2
5
9
7
7
7
9
11
10
8
A2
Difficult
3
0
0
2
0
3
8
3
3
3
0
0
0
5
0
XA1B1 =3
SSA1B1 =18
nA1B1 =5
XA2 B1 =1 XA2 B2 =4
XA1B2 =6 XA1B3 =9
XA2 B3 =1
SSA1B2 =28 SSA1B3 =10
SSA2 B1 =8 SSA2 B2 =20 SSA2 B3 =20
nA1B2 =5 nA1B3 =5
nA2 B1 =5 nA2 B2 =5 nA2 B3 =5
GM =4N =30
SSTotal =344
SSBetweenGroups = n(XAllGroups∑ −GM )2
=5(3 − 4)2 + 5(6 − 4)2 + 5(9 − 4)2 +5(1−4)2 + 5(4 −4)2 + 5(1−4)2
=240
SSWithin = SSgroups∑=18 + 28 +10 + 8 + 20 + 20
=104
PSY 340Statistics for the
Social Sciences ExampleFactor B: Arousal Level
LowB1
MediumB2
HighB3
FactorA:
Task
Difficulty
A1
Easy
3
1
1
6
4
2
5
9
7
7
7
9
11
10
8
A2
Difficult
3
0
0
2
0
3
8
3
3
3
0
0
0
5
0
XA1B1 =3
SSA1B1 =18
nA1B1 =5
XA2 B1 =1 XA2 B2 =4
XA1B2 =6 XA1B3 =9
XA2 B3 =1
SSA1B2 =28 SSA1B3 =10
SSA2 B1 =8 SSA2 B2 =20 SSA2 B3 =20
nA1B2 =5 nA1B3 =5
nA2 B1 =5 nA2 B2 =5 nA2 B3 =5
GM =4N =30
SSTotal =344
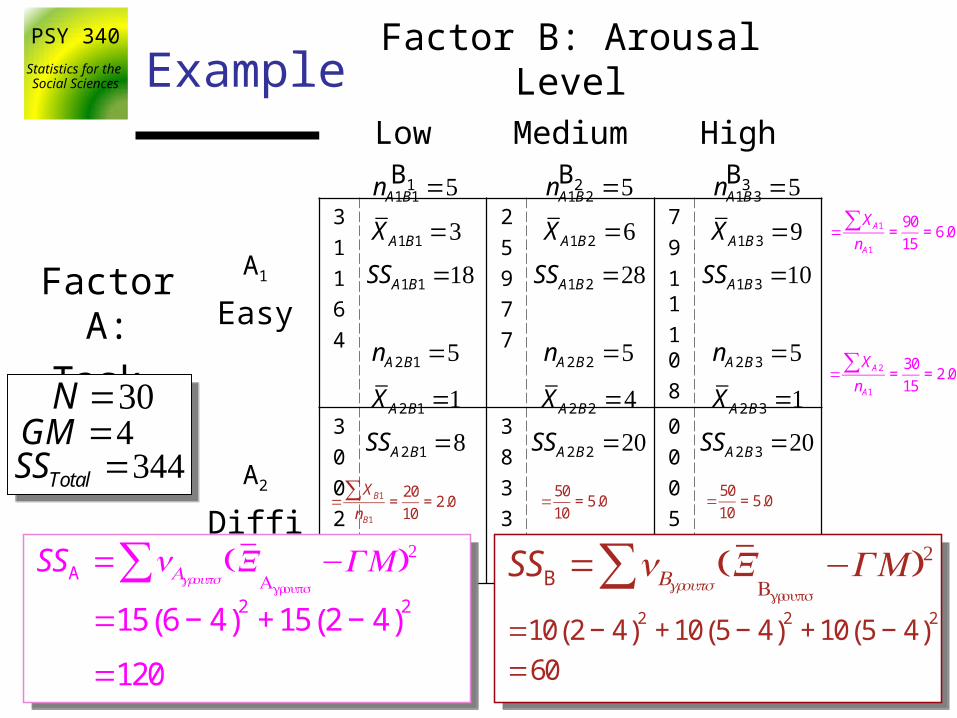
SSA = nAgroups(X∑
Agroups
−GM )2
=15 6 − 4( )2
+ 15 2 − 4( )2
=120
SSB = nBgroups(X∑
Bgroups
−GM )2
=10 2 − 4( )2
+10 5 − 4( )2
+10 5 − 4( )2
=60
=XB1∑
nB1
=20
10= 2.0 =
50
10= 5.0 =
50
10= 5.0
=XA1∑
nA1
=90
15= 6.0
=XA2∑
nA1
=30
15= 2.0
PSY 340Statistics for the
Social Sciences ExampleFactor B: Arousal Level
LowB1
MediumB2
HighB3
FactorA:
Task
Difficulty
A1
Easy
3
1
1
6
4
2
5
9
7
7
7
9
11
10
8
A2
Difficult
3
0
0
2
0
3
8
3
3
3
0
0
0
5
0
XA1B1 =3
SSA1B1 =18
nA1B1 =5
XA2 B1 =1 XA2 B2 =4
XA1B2 =6 XA1B3 =9
XA2 B3 =1
SSA1B2 =28 SSA1B3 =10
SSA2 B1 =8 SSA2 B2 =20 SSA2 B3 =20
nA1B2 =5 nA1B3 =5
nA2 B1 =5 nA2 B2 =5 nA2 B3 =5
GM =4N =30
SSTotal =344
SSBetweenGroups =240
SSA =120
SSB =60
SSAB =SSBetween − SSA +SSB( )=240 − 120 + 60( )
=60
PSY 340Statistics for the
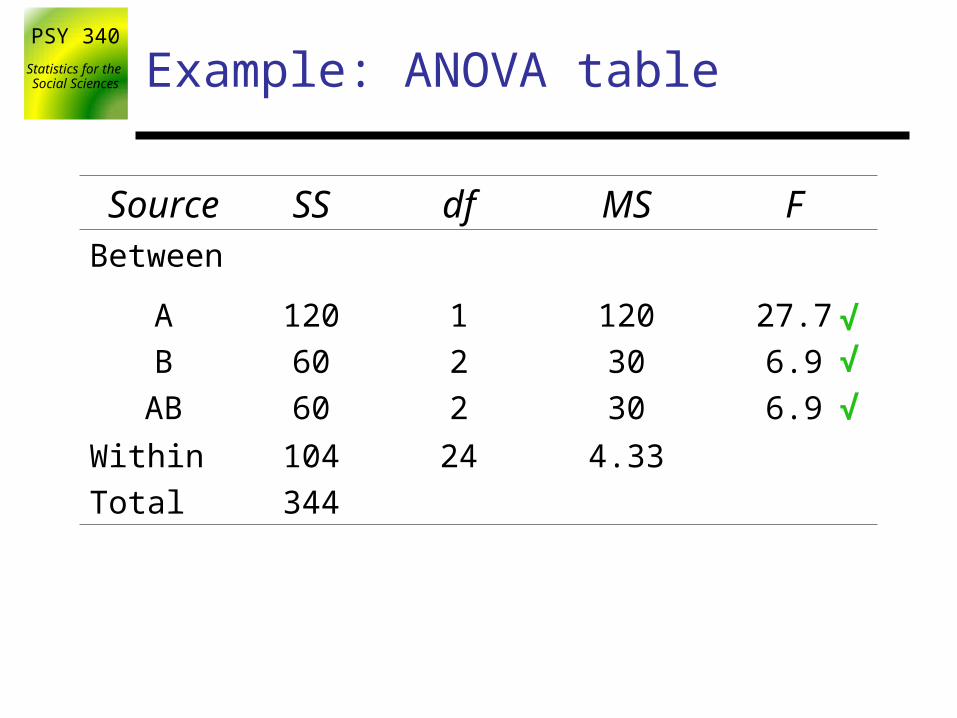
Social Sciences Example: ANOVA table
Source SS df MS FBetween
A
B
AB
120
60
60
1
2
2
120
30
30
27.7
6.9
6.9
Within
Total
104
344
24 4.33
√
√
√
PSY 340Statistics for the
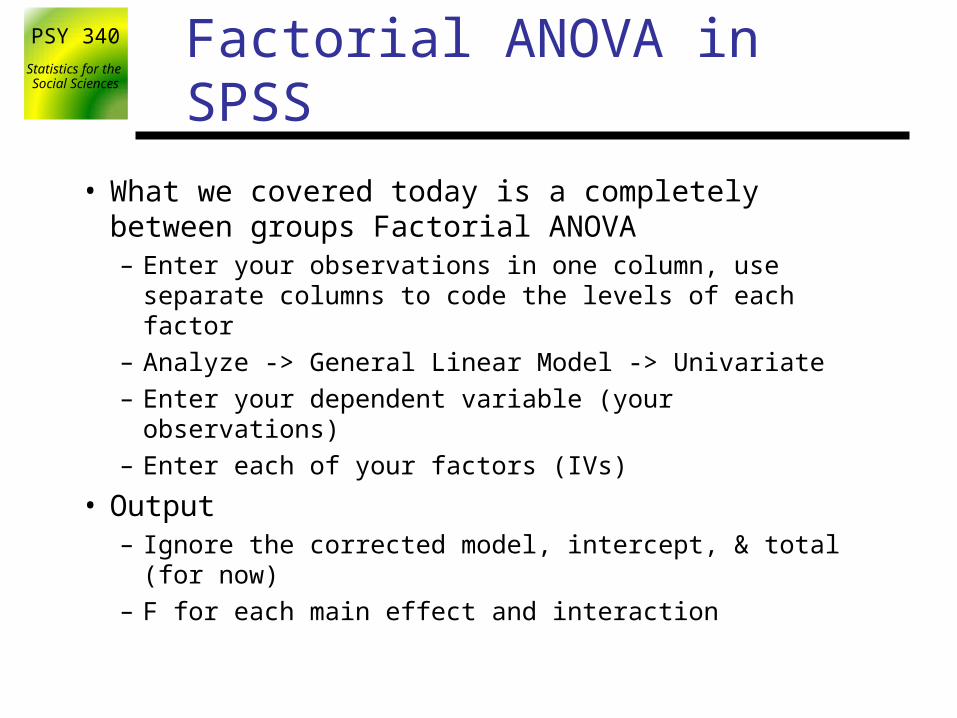
Social Sciences Factorial ANOVA in SPSS
• What we covered today is a completely between groups Factorial ANOVA– Enter your observations in one column, use separate
columns to code the levels of each factor
– Analyze -> General Linear Model -> Univariate
– Enter your dependent variable (your observations)
– Enter each of your factors (IVs)
• Output– Ignore the corrected model, intercept, & total (for now)
– F for each main effect and interaction
PSY 340Statistics for the
Social Sciences Assumptions in Two-Way ANOVA
• Populations follow a normal curve• Populations have equal variances• Assumptions apply to the populations that go with
each cell
PSY 340Statistics for the
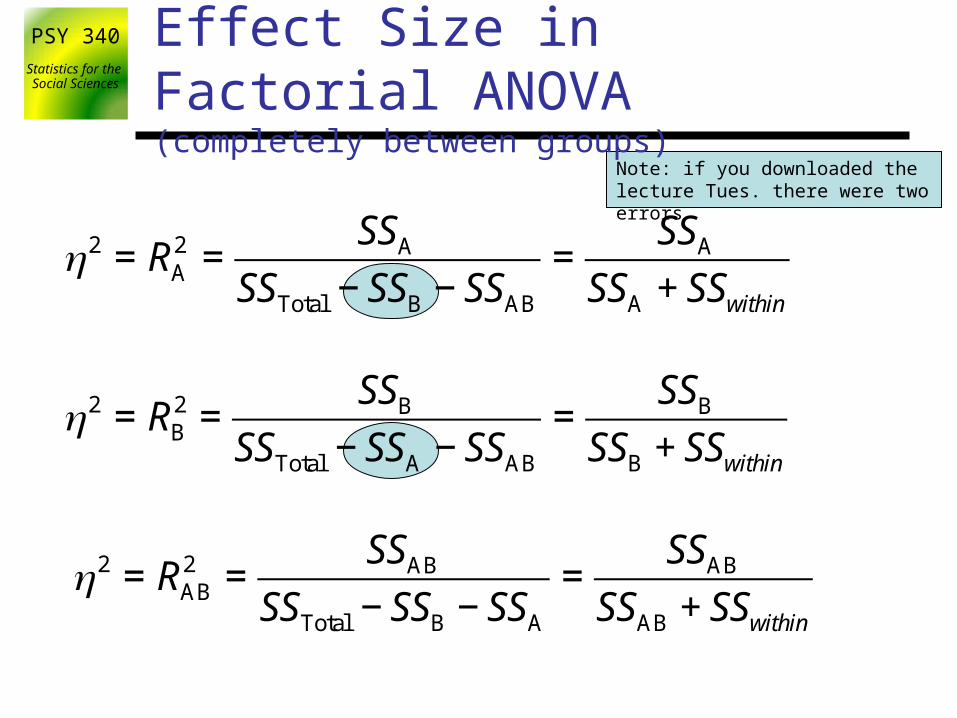
Social Sciences
Note: if you downloaded the lecture Tues. there were two errors
Effect Size in Factorial ANOVA (completely between groups)
η2 = RB2 =
SSB
SSTotal − SSA − SSAB
=SSB
SSB + SSwithin
η2 = RA2 =
SSA
SSTotal − SSB − SSAB
=SSA
SSA + SSwithin
η2 = RAB2 =
SSAB
SSTotal − SSB − SSA
=SSAB
SSAB + SSwithin
PSY 340Statistics for the
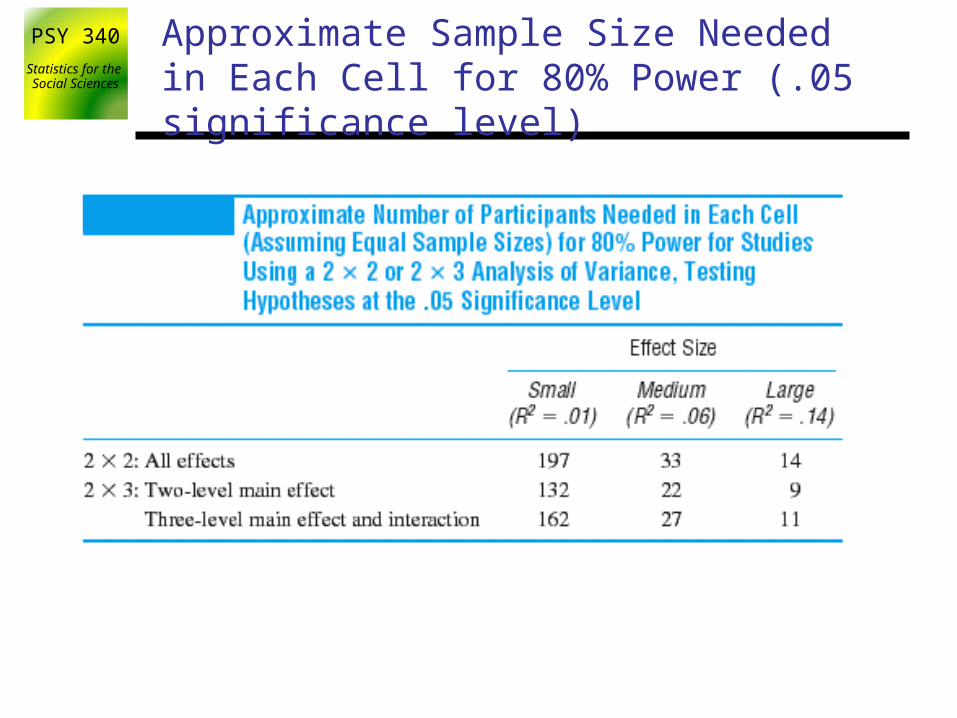
Social Sciences
Approximate Sample Size Needed in Each Cell for 80% Power (.05 significance level)
PSY 340Statistics for the
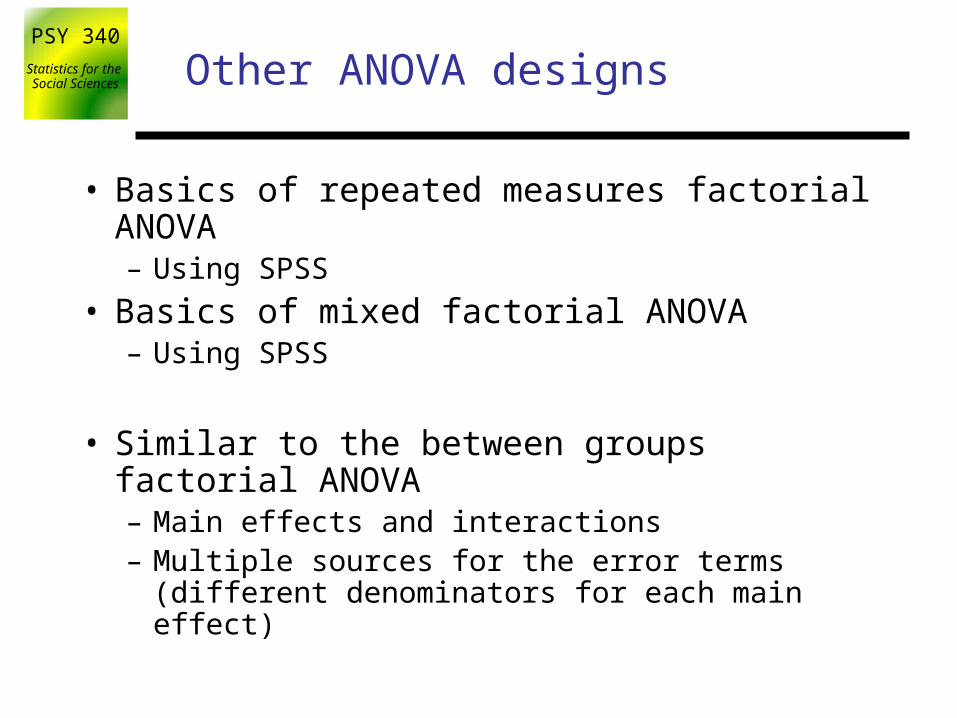
Social SciencesOther ANOVA designs
• Basics of repeated measures factorial ANOVA– Using SPSS
• Basics of mixed factorial ANOVA– Using SPSS
• Similar to the between groups factorial ANOVA– Main effects and interactions– Multiple sources for the error terms (different
denominators for each main effect)
PSY 340Statistics for the
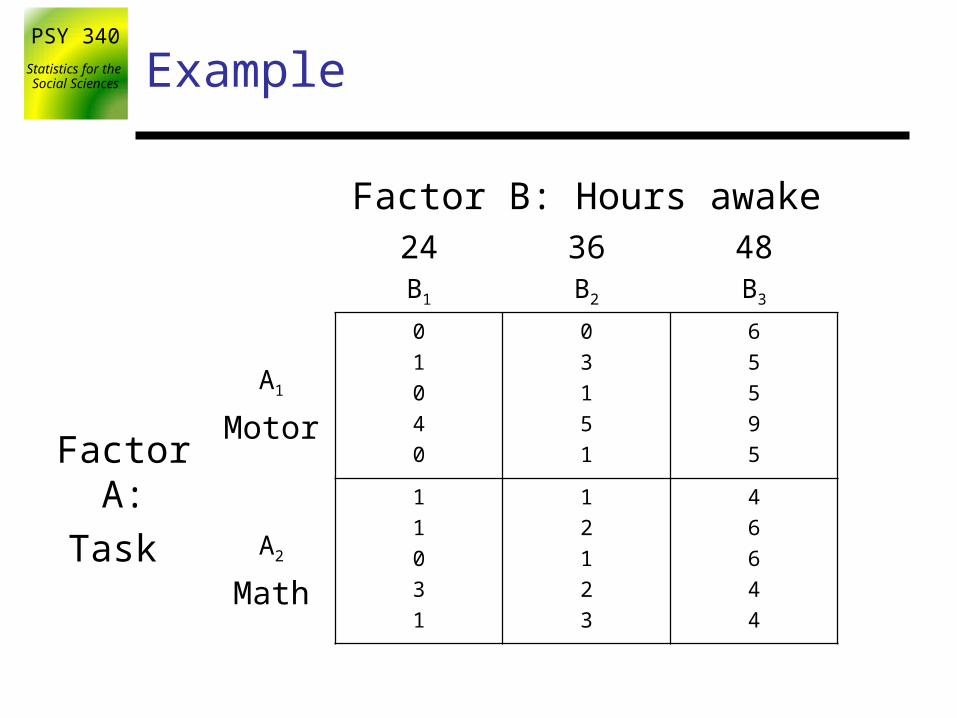
Social Sciences Example
• Suppose that you are interested in how sleep deprivation impacts performance. You test 5 people on two tasks (motor and math) over the course of time without sleep (24 hrs, 36 hrs, and 48 hrs). Dependent variable is number of errors in the tasks.– Both factors are manipulated as within subject
variables– Need to conduct a within groups factorial
ANOVA
PSY 340Statistics for the
Social Sciences Example
Factor B: Hours awake24B1
36B2
48B3
Factor A:
Task
A1
Motor
0
1
0
4
0
0
3
1
5
1
6
5
5
9
5
A2
Math
1
1
0
3
1
1
2
1
2
3
4
6
6
4
4
PSY 340Statistics for the
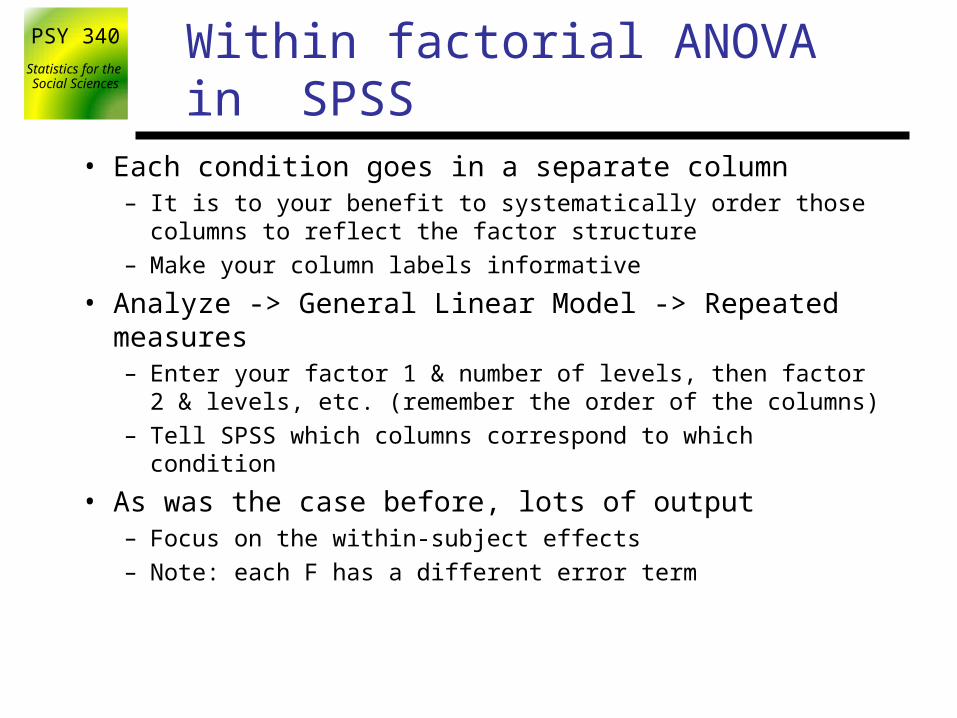
Social Sciences Within factorial ANOVA in SPSS
• Each condition goes in a separate column– It is to your benefit to systematically order those columns to reflect
the factor structure
– Make your column labels informative
• Analyze -> General Linear Model -> Repeated measures– Enter your factor 1 & number of levels, then factor 2 & levels, etc.
(remember the order of the columns)
– Tell SPSS which columns correspond to which condition
• As was the case before, lots of output– Focus on the within-subject effects
– Note: each F has a different error term

PSY 340Statistics for the
Social Sciences Example
Source SS df MS F p A
Error (A)
1.20
13.13
1
4
1.20
3.28
0.37 0.58
B
Error (B)
AB
Error (AB)
104.60
6.10
2.60
8.10
2
8
2
8
52.30
0.76
1.30
1.01
69.00 < 0.01
1.29 0.33
PSY 340Statistics for the
Social Sciences Example
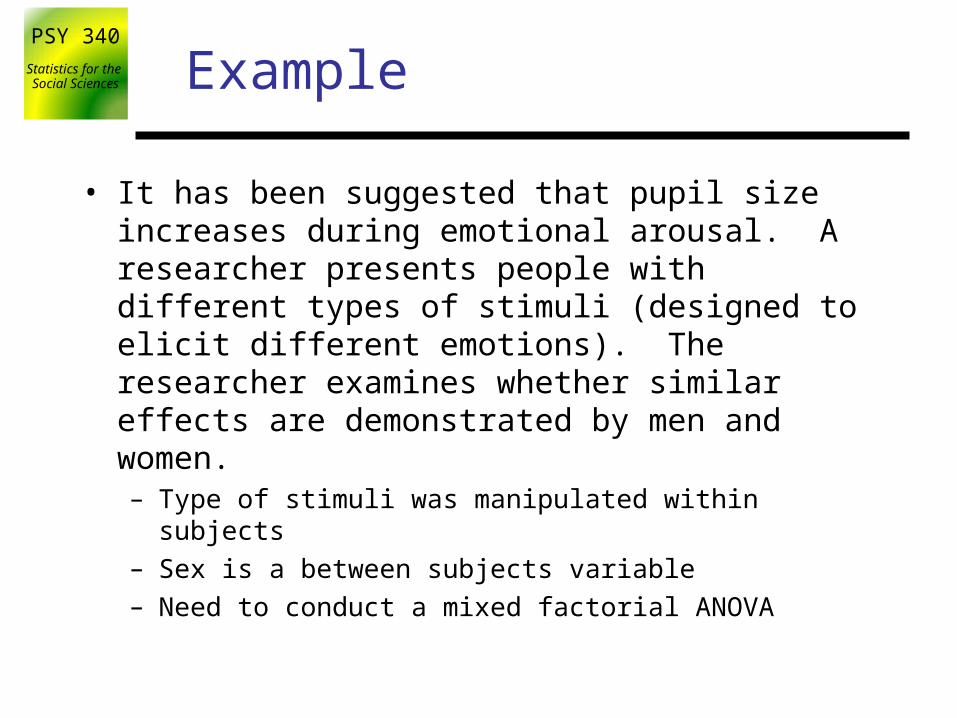
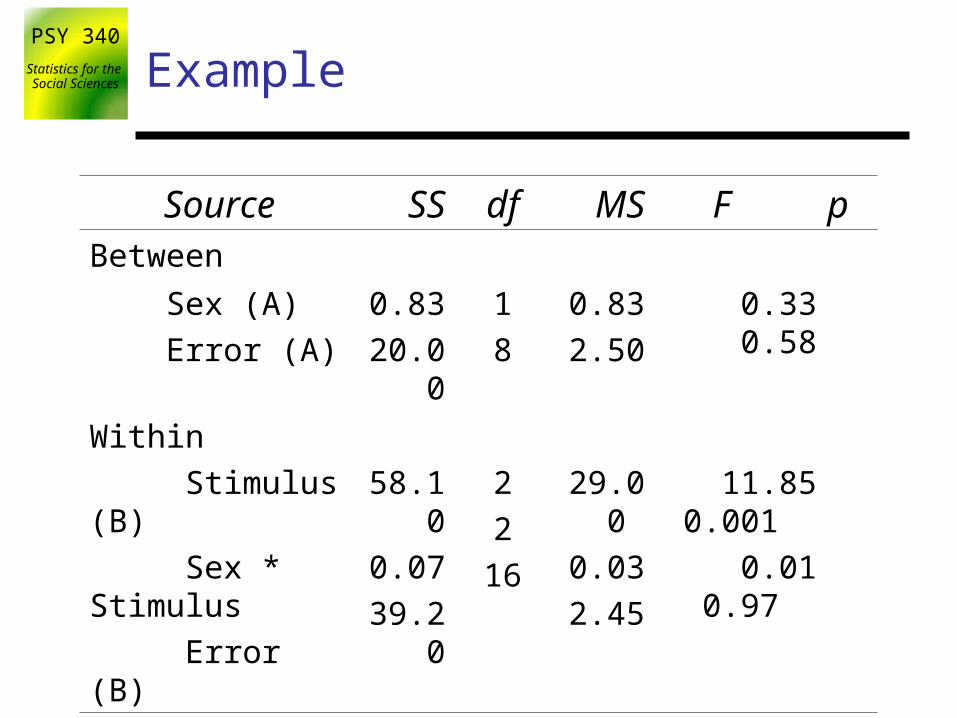
• It has been suggested that pupil size increases during emotional arousal. A researcher presents people with different types of stimuli (designed to elicit different emotions). The researcher examines whether similar effects are demonstrated by men and women.– Type of stimuli was manipulated within subjects
– Sex is a between subjects variable
– Need to conduct a mixed factorial ANOVA
PSY 340Statistics for the
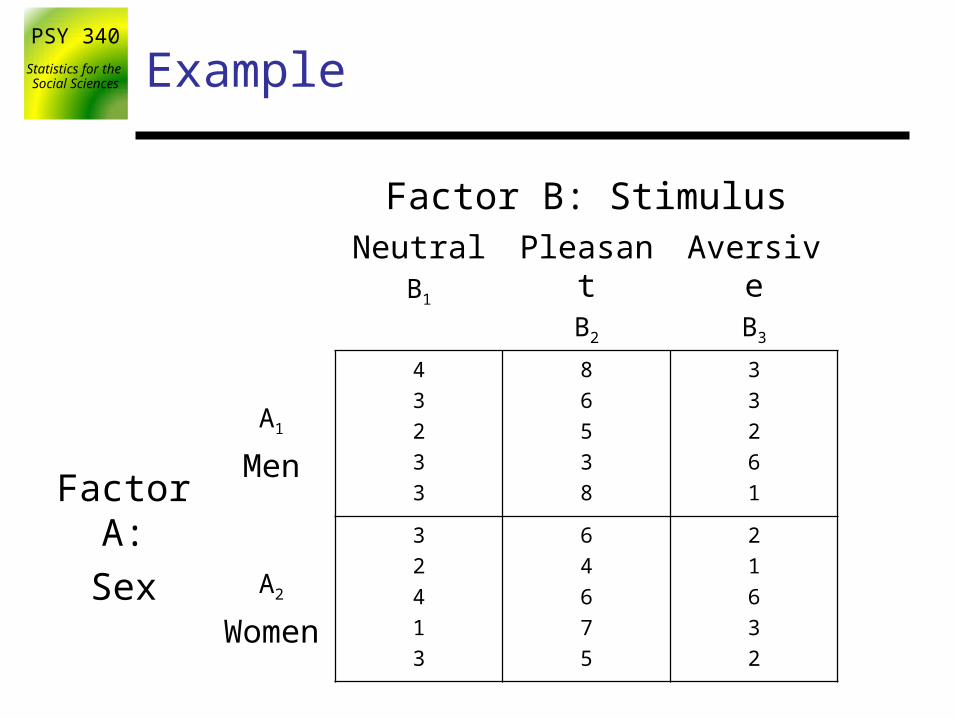
Social Sciences Example
Factor B: StimulusNeutral
B1
PleasantB2
AversiveB3
FactorA:
Sex
A1
Men
4
3
2
3
3
8
6
5
3
8
3
3
2
6
1
A2
Women
3
2
4
1
3
6
4
6
7
5
2
1
6
3
2
PSY 340Statistics for the
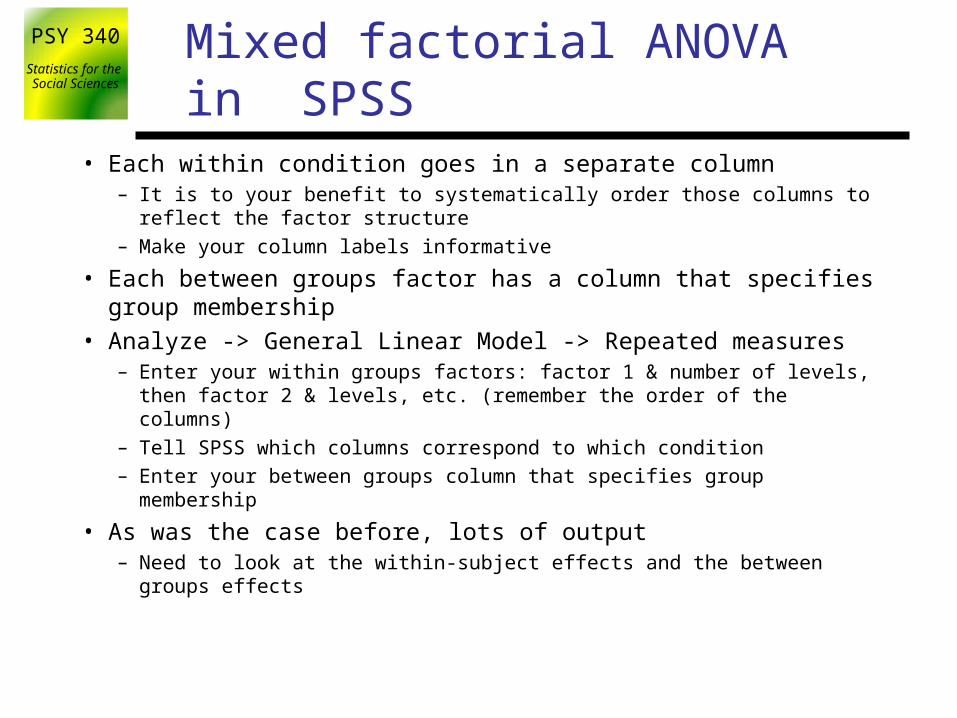
Social Sciences Mixed factorial ANOVA in SPSS
• Each within condition goes in a separate column– It is to your benefit to systematically order those columns to reflect the factor
structure– Make your column labels informative
• Each between groups factor has a column that specifies group membership
• Analyze -> General Linear Model -> Repeated measures– Enter your within groups factors: factor 1 & number of levels, then factor 2
& levels, etc. (remember the order of the columns)– Tell SPSS which columns correspond to which condition– Enter your between groups column that specifies group membership
• As was the case before, lots of output– Need to look at the within-subject effects and the between groups effects
PSY 340Statistics for the
Social Sciences Example
Source SS df MS F pBetween
Sex (A)
Error (A)
0.83
20.00
1
8
0.83
2.50
0.33 0.58
Within
Stimulus (B)
Sex * Stimulus
Error (B)
58.10
0.07
39.20
2
2
16
29.00
0.03
2.45
11.85 0.001
0.01 0.97
PSY 340Statistics for the
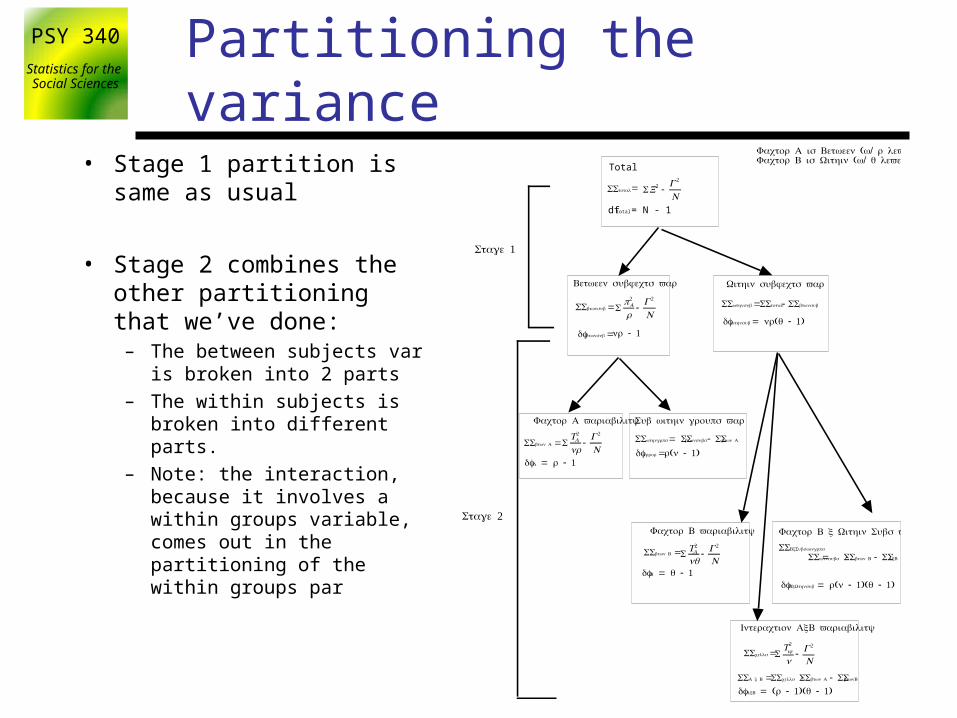
Social Sciences Partitioning the variance
dftotal = N - 1
Total
SX2 -G2
NSStotal =
1Stage
2Stage
( / )Factor A is Between w r levels ( / )Factor B is Within w q levels
Between subjects var
SSbtwnsub =
dfbtwnsub = - 1nr
SpA
2
r-
G2
N
Sub within groups var
SSwthngrps = SSbtwnsubs - SS btwn A
dferror = ( - 1)r n
Factor A variability
SS btwn A =
dfA = - 1r
STA
2
nr-
G2
N
Factor B variability
SS btwn B =
dfB = - 1q
STA
2
nq- G2
N
Within subjects var
dfwthnsub = ( - 1)nr q
SSwthnsub = SS total- SSbtwnsub
Interaction AxB variability
SS A x B = SScells -SS btwn A - SSbtwnB
dfAxB = ( - 1)( - 1)r q
SScells = STij
2
n- G2
N
Factor B x Within Subs var
dfBxWthnsub = ( - 1)( - 1)r n q
SSBxSubswingrps = SS /w insubs -SS btwn B - SSAxB
• Stage 1 partition is same as usual
• Stage 2 combines the other partitioning that we’ve done:
– The between subjects var is broken into 2 parts
– The within subjects is broken into different parts.
– Note: the interaction, because it involves a within groups variable, comes out in the partitioning of the within groups par