factors affecting disinfection by-product formation during
TRANSCRIPT

American Water Works Association
RESEARCH FOUNDATION
Factors AffectingDisinfectionBy-ProductFormation DuringChloramination
Subject Area: Water Treatment

Factors Affecting Disinfection By-Product Formation During Chloramination

The mission of the A WWA Research Foundation is to advance the science of water to improve the quality of life. Funded primarily through annual subscription payments from over 900 utilities, consulting firms, and manufacturers in North America and abroad, A WWARF sponsors research on all aspects of drinking water, including supply and resources, treatment, monitoring and analysis, distribution, management, and health effects.
From its headquarters in Denver, Colorado, the AWWARF staff directs and supports the efforts of over 500 volunteers, who are the heart of the research program. These volunteers, serving on various boards and committees, use their expertise to select and monitor research studies to benefit the entire drinking water community.
Research findings are disseminated through a number of technology transfer activi ties, including research reports, conferences, videotape summaries, and periodicals.

Factors Affecting Disinfection By-Product Formation During ChloraminationPrepared by:James M. Symons and Rebecca XiaDepartment of Civil and Environmental Engineering, University of Houston, Houston, Texas 77204-4791
Gerald E. Speitel Jr. and Alicia C. DiehlDepartment of Civil Engineering,University of Texas at Austin, Austin, Texas 78712
Cordelia J. Hwang, Stuart W. Krasner, and Sylvia E. BarrettMetropolitan Water District of Southern California, Water Quality Laboratory, 700 Moreno Avenue, La Verne, California 91750-3399
Sponsored by:AWWA Research Foundation6666 West Quincy Avenue Denver, Colorado 80235-3098
Published by theAWWA Research Foundation andAmerican Water Works Association
Disclaimer
This study was funded by the AWWA Research Foundation (AWWARF).AWWARF assumes no responsibility for the content of the research study
reported in this publication or for the opinions or statements of fact expressed in thereport. The mention of trade names for commercial products does not represent or imply
the approval or endorsement of AWWARF. This report is presented solely for informational purposes.
Library of Congress Cataloging-in-Publication Data Factors affecting disinfection by-product formation during
chloramination / prepared by James M. Symons ... [et al.]. xxxii,330p. 21.5*28cm.
"Sponsored by American Water Works Association ResearchFoundation."Includes bibliographical references.ISBNO-89867-906-0(alk. paper)1. Water-Purification-Disinfection~By-products. 2. Drinking
water-Purification United States. 3. Water-Purification- Chloramination. 4. Chloramines. 5. Water chemistry. I. Symons, James M. II. AWWA Research Foundation. TD459.F33 1997628.1'662-dc21 97-17672
OP
Copyright 1998by
AWWA Research Foundationand
American Water Works Association Printed in the U.S.A.
ISBNO-89867-906-0 Printed on recycled paper.

CONTENTS
LIST OF TABLES..................................................................................................................... xi
LIST OF FIGURES.................................................................................................................. xv
FOREWORD............................................................................................................................ xxi
ACKNOWLEDGMENTS........................................................................................................ xxiii
EXECUTIVE SUMMARY...................................................................................................... xxv
CHAPTER 1: GENERAL PURPOSE OF STUDY.................................................................. 1
CHAPTER 2: LITERATURE REVIEW.................................................................................... 3
Disinfection By-Product Formation ............................................................................... 3
Chloramine/Bromamine Chemistry................................................................................ 5
Recovery of DOX in Measurable DBPs......................................................................... 12
Identification of New DBPs............................................................................................ 13
CHAPTER 3: GENERAL SCOPE OF PROJECT..................................................................... 15
CHAPTER 4: ANALYTIC METHODS AND QUALITY
ASSURANCE/QUALITY CONTROL.......................................................................... 17
Simulated Distribution System Treatment...................................................................... 17
Methodology....................................................................................................... 17
Quality Control/Quality Assurance.................................................................... 18
Formation Potential........................................................................................................ 18
Methodology....................................................................................................... 18
Quality Control/Quality Assurance .................................................................... 19
Preformed Chloramines.................................................................................................. 19
Methodology.................................................................-.-. ............................... 19
Quality Control/Quality Assurance.................................................................... 20

Chorine Dosing Solution................................................................................................ 20
Methodology....................................................................................................... 20
Quality Control/Quality Assurance .................................................................... 20
Chlorine Dose................................................................................................................. 21
Methodology....................................................................................................... 21
Quality Control/Quality Assurance.................................................................... 21
Residual Concentrations................................................................................................. 21
Methodology....................................................................................................... 21
Quality Control/Quality Assurance.......................................................................23
Disinfection By-Product Sample Treatment................................................................... 23
Methodology....................................................................................................... 23
Quality Control/Quality Assurance .......................................................................24
Disinfection By-Product Analysis.................................................................................. 24
Overview............................................................................................................. 24
Trihalomethanes................................................................................................. 25
Haloacetic Acids................................................................................................. 26
Dissolved Organic Halogen................................................................................ 28
Cyanogen Halide (CNX).................................................................................... 31
Bromide Ion........................................................................................................ 35
Other Analytical Methods................................................................................... 36
CHAPTER 5: CONTROLLED BATCH STUDIES WITH PREFORMED
CHLORAMINES TASK la........................................................................................ 37
Objectives....................................................................................................................... 37
Experimental Approach.................................................................................................. 37
Source Water Quality...................................................................................................... 39
Influence of Total Residual................................................................................ 39
Influence of pH, Cfe/N Mass Ratio, Bromide Ion.......................................................... 50
Residual Species Monochloramine/Dichloramine .......................................... 50
Total Trihalomethanes and Dissolved Organic Halogen.................................... 54
Haloacetic Acids and Cyanogen Halides............................................................ 65
VI

Recovery of Dissolved Organic Halogen With 12 Measured
Disinfection By-Products........................................................................ 71
CHAPTER 6: CONTROLLED BENCH-SCALE MIXING
STUDIES TASK Ib.................................................................................................... 77
Objectives....................................................................................................................... 77
Experimental Approach.................................................................................................. 77
Influence of Mixing........................................................................................................ 81
Residual Species Monochloramine/Dichloramine .......................................... 81
Total Trihalomethanes and Dissolved Organic Halogen.................................... 84
Haloacetic Acids................................................................................................. 92
CyanogenHalides............................................................................................... 97
Implications for Mixing at Larger Scale............................................................. 101
Recovery of Dissolved Organic Halogen With 12 Measured
Disinfection By-Products................................................................................... 102
CHAPTER 7: PILOT PLANT STUDIES TASK 2............................................................... 109
Objectives...................................................................................................................... 109
Experimental Approach................................................................................................. 109
Description of Pilot Plants................................................................................ 109
Lake Austin Water............................................................................................ 114
Lake Houston Water.......................................................................................... 115
California State Project Water........................................................................... 116
Results............................................................................................................................ 118
Lake Austin Water............................................................................................. 119
Lake Houston Water.......................................................................................... 123
California State Project Water........................................................................... 130
Discussion...................................................................................................................... 135
Trihalomethanes................................................................................................ 135
Haloacetic Acids................................................................................................ 136
Cyanogen Halides.............................................................................................. 139
Vll
Dissolved Organic Halogen............................................................................... 140
Point of Chloramine Application....................................................................... 141
Conclusions.................................................................................................................... 142
CHAPTER 8: GEOGRAPHICALLY DIVERSE WATERS TASK 3................................... 143
Objective........................................................................................................................ 143
Experimental Approach................................................................................................. 143
Source Waters Studied....................................................................................... 143
Bench-Scale Studies.......................................................................................... 144
Full-Scale Studies/Historical Data..................................................................... 144
Results............................................................................................................................ 146
Midsouth Water................................................................................................. 146
Mississippi River Water.................................................................................... 156
Biscayne Aquifer............................................................................................... 164
Northeastern Creek Water................................................................................. 176
Pacific Northwest Lake Water........................................................................... 183
CHAPTER 9: ANALYTICAL APPROACHES TO DETERMINE "NEW"
CHLORAMINE DBFs TASK 4................................................................................. 193
Objectives...................................................................................................................... 193
Experimental Approach................................................................................................. 193
LC Techniques for Polar DBPs..................................................................................... 194
Overview............................................................................................................ 194
Experimental...................................................................................................... 195
Results and Discussion...................................................................................... 205
Conclusions........................................................................................................ 218
Analysis of DBPs by SDE GC-MS ............................................................................... 219
Overview..................................................................................^......................... 219
Analytical Methods............................................................................................ 220
Samples Evaluated............................................................................................. 224
Vlll

Results and Discussion...................................................................................... 226
Conclusions........................................................................................................ 233
UF Determination of AMW Distributions..................................................................... 233
Overview............................................................................................................ 233
Analytical Methods............................................................................................ 234
Experimental Plan.............................................................................................. 236
Method Development........................................................................................ 241
Results and Discussion...................................................................................... 245
Conclusions........................................................................................................ 254
Summary and Conclusions............................................................................................ 256
CHAPTER 10: CONCLUSIONS.............................................................................................. 257
Task la........................................................................................................................... 257
Task Ib........................................................................................................................... 259
Task 2............................................................................................................................. 260
Task 3............................................................................................................................. 262
Task 4............................................................................................................................. 264
CHAPTER 11: RECOMMENDATIONS TO WATER UTILITIES........................................ 267
APPENDIX A: ULTRAFILTRATION CALCULATIONS AND DATA............................... 271
APPENDIX B: DATA FROM INDIVIDUAL TASK 2 PILOT PLANT TESTS ......................281
REFERENCES............................................................................................................................309
LISTOFABBREVIATIONS......................................................................................................325
IX


TABLES
4.1 Recoveries of individual DBFs in the DOX analysis..................................................... 30
4.2 Results from replicates of the same City of Houston tap water sample......................... 31
4.3 Variation in DOX determination with time.................................................................... 32
4.4 CNX analytical standards............................................................................................... 33
5.1 Parameter values for matrix of experimental conditions................................................ 38
5.2 Quality of Lake Austin water collected on 9/17/93........................................................ 40
5.3 Quality of Lake Houston water collected on 10/28/93................................................... 41
5.4 Quality of Lake Houston water collected on 2/22/94..................................................... 42
5.5 Quality of California State Project water collected on 12/9/93...................................... 43
6.1 Chemistry conditions for batch mixing experiments...................................................... 80
6.2 Lake Austin water haloacetic acid concentrations for bench
mixing studies..................................................................................................... 96
6.3 Lake Houston water haloacetic acid concentrations for bench
mixing studies..................................................................................................... 98
6.4 California State Project water haloacetic acid concentrations for
bench mixing studies.......................................................................................... 99
6.5 CNX concentrations for bench mixing studies............................................................... 100
7.1 Summary of Lake Austin water pilot plant results (average values).............................. 120
7.2 Comparison of Task 2 and Tasks la and Ib with data for Lake
Austin water........................................................................................................ 123
7.3 Summary of Lake Houston water pilot plant results (average values)........................... 124
7.4 Comparison of Task 2 data with Tasks la and Ib data for Lake Houston water........... 129
7.5 Summary of California State Project water pilot plant
results (average values)....................................................................................... 131
7.6 Comparison of Task 2 with Tasks 1 a and 1 b data for
California State Project water............................................................................. 136
7.7 Summary of pilot plant data for all three waters tested.................................................. 137
7.8 Comparison of prechloramination and postchloramination ........................................... 141
8.1 Chloramination parameters for bench-scale studies of Task 3 waters ........................... 145
XI

8.2 Influence of water quality parameters on DBF formation in midsouth
water................................................................................................................... 148
8.3 Historical (1993/94) DBF data for midsouth utility....................................................... 153
8.4 Historical (1988/89) DBF data for midsouth utility....................................................... 154
8.5 Influence of water quality parameters on DBF formation in
Mississippi River water...................................................................................... 158
8.6 Historical DBF data for utility treating Mississippi River water.................................... 163
8.7 Influence of water quality parameters on DBF formation in
Biscayne Aquifer................................................................................................ 166
8.8 Historical (1994/95) DBF data for utility treating Biscayne
Aquifer water...................................................................................................... 170
8.9 Historical (1988/89) DBF data for utility treating colored
groundwater........................................................................................................ 172
8.10 Influence of water quality parameters on DBF formation in
northeastern creek water..................................................................................... 178
8.11 Historical DBF data for northeastern utility treating creek water.................................. 181
8.12 Influence of water quality parameters on DBF formation in
Pacific Northwest lake water.............................................................................. 185
8.13 Historical (1991) DBF data for Pacific Northwest utility............................................... 188
8.14 Historical (1994/95) DBF data for Pacific Northwest utility......................................... 190
9.1 Chlorinated model amines, amino acids, and peptides with
LC retention times.............................................................................................. 197
9.2 Comparison of conventional, microbore, and capillary LC ........................................... 200
9.3 Retention times for chlorination and chloramination by-products
of model peptides................................................................................................ 212
9.4 Electrospray mass spectrum interpretation for a reaction product
of chlorine with glycylalanine (monochlorinated product)................................ 217
9.5 Electrospray mass spectrum interpretation for a reaction product
of chlorine with glycylalanine (dichlorinated product)...................................... 217
9.6 Samples for SDE analysis............................................................................................... 225
9.7 Results of SDE GC-MS analyses for DBFs................................................................... 227
xn

9.8 Effect of bromide (and iodide) on THM speciation....................................................... 231
9.9 List of UF experiments................................................................................................... 237
9.10 Summary of coefficients of permeation......................................................................... 243
9.11 Refiltration experiment LHW...................................................................................... 244
9.12 Summary of DOC, SUVA, DOX, and DOX percentage values for bench-,
pilot-, and full-scale tests.................................................................................... 246
10.1 Summary of 2-d SDS disinfection by-product data........................................................ 263
A.I Example of UF calculations............................................................................................ 273
A.2 UF comparison of chloramination and chlorination CSPW........................................ 274
A.3 Comparison of chloramine treatment conditions LHW............................................... 275
A.4 UF data for LHW pilot plant (enhanced coagulation).................................................... 276
A.5 UF data for CSPW full-scale plant................................................................................. 277
A.6 UF data for midsouth water............................................................................................ 278
A.7 UF data for Pacific Northwest water.............................................................................. 279
B.I Lake Austin water pilot plant test run 1 A.................................................................... 282
B.2 Lake Austin water pilot plant test run IB.................................................................... 283
B.3 Lake Austin water pilot plant test run 2A.................................................................... 284
B.4 Lake Austin water pilot plant test run2B.................................................................... 285
B.5 Lake Austin water pilot plant test run 3....................................................................... 286
B.6 Lake Austin water pilot plant test run 4....................................................................... 287
B.7 Lake Austin water pilot plant test run 5A.................................................................... 288
B.8 Lake Austin water pilot plant test runSB.................................................................... 289
B.9 Lake Houston water pilot plant test run 1.................................................................... 290
B.10 Lake Houston water pilot plant test run 2.................................................................... 291
B.ll Lake Houston water pilot plant test run3A................................................................. 292
B.12 Lake Houston water pilot plant test run 3B................................................................. 293
B.13 Lake Houston water pilot plant test run 4A................................................................. 294
B.14 Lake Houston water pilot plant test run4B................................................................. 295
B.15 Lake Houston water pilot plant test run 5A................................................................. 296
B.16 Lake Houston water pilot plant test run 5B................................................................. 297
B.I7 California State Project water pilot plant test run 1..................................................... 298
xin

B.I8 California State Project water pilot plant test run 1 (repeat)....................................... 299
B.19 California State Project water pilot plant test run 2..................................................... 300
B.20 California State Project water pilot plant test run 3A.................................................. 301
B.21 California State Project water pilot plant test run 3B.................................................. 302
B.22 California State Project water pilot plant test run 4A.................................................. 303
B.23 California State Project water pilot plant test run 4A (repeat).................................... 304
B.24 California State Project water pilot plant test run 4B.................................................. 305
B.25 California State Project water pilot plant test run 4B (repeat)..................................... 306
B.26 California State Project water pilot plant test run 5..................................................... 307
xiv

FIGURES
2.1 Chloramine dose-residual curve for California State Project water................................. 6
2.2 Principal species of bromine and bromamines predominating after 1 to 2
minutes at various pH and ammonia:nitrogen ratios............................................ 9
5.1 Lake Houston water chemistry experiments: 2-d TTHM formation
at a C12 to N ratio of 3 to 1................................................................................... 44
5.2 Lake Houston water chemistry experiments: 2-d DOX formation
at a Cl2 to N ratio of 3 to 1................................................................................... 45
5.3 Lake Houston water chemistry experiments: 2-d TTHM formation
at a C12 to N ratio of 5 to 1................................................................................... 46
5.4 Lake Houston water chemistry experiments: 2-d DOX formation
at a Cl2 to N ratio of 5 to 1................................................................................... 47
5.5 Lake Houston water chemistry experiments: 2-d TTHM formation
at a C12 to N ratio of 7 to 1................................................................................... 48
5.6 Lake Houston water chemistry experiments: 2-d DOX formation
at a C12 to N ratio of 7 to 1................................................................................... 49
5.7 Lake Austin water, batch studies, dichloramine residuals as a percentage
of total residual as a function of C12/N ratio and pH at a total
residual chlorine of 2 mg/L.................................................................................. 51
5.8 Lake Houston water, batch studies, dichloramine residuals as a percentage
of total residual as a function of C12/N ratio and pH at a total
residual chlorine of 2 mg/L.................................................................................. 52
5.9 California State Project water, batch studies, dichloramine residuals as a
percentage of total residual as a function of C12/N ratio and pH
at a total residual chlorine of 2 mg/L................................................................... 53
5.10 Lake Austin water, batch studies, TTHM (ug/L) as a function of C12/N
ratio and pH at a nominal total residual chlorine of 2 mg/L................................ 55
5.11 Degree of bromination of THMs in Lake Austin water .................................................. 56
5.12 Lake Austin water, batch studies, DOX (ug C17L) as a function of C12/N
ratio and pH at a nominal total residual chlorine of 2 mg/L................................ 57
xv

5.13 Lake Houston water, batch studies, TTHM (ug/L) as a function of C12/N
ratio and pH at a nominal total residual chlorine of 2 mg/L................................ 60
5.14 Degree of bromination of THMs in Lake Houston water................................................ 61
5.15 Lake Houston water, batch studies, DOX (|ig C17L) as a function of C12/N
ratio and pH at a nominal total residual chlorine of 2 mg/L................................ 62
5.16 California State Project water, batch studies, TTHM (ug/L) as a function
of C12/N ratio and pH at a nominal total residual chlorine of 2 mg/L................. 63
5.17 California State Project water, batch studies, DOX (ug C17L) as a function
of C12/N ratio and pH at a nominal total residual chlorine of 2 mg/L................. 64
5.18 Degree of bromination of THMs in California State Project water................................. 65
5.19 Lake Austin water, batch studies, HAA6 (|J.g/L) and CNX (ug/L) as
a function of C12/N ratio and pH at a nominal total residual
chlorine of 2 mg/L............................................................................................... 66
5.20 Lake Houston water, batch studies, HAA6 (|J.g/L) as a function of
C12/N ratio and pH at a nominal total residual chlorine of 2 mg/L...................... 68
5.21 Lake Houston water, batch studies, CNX (|ig/L) as a function of
C12/N ratio and pH at a nominal total residual chlorine of 2 mg/L...................... 69
5.22 California State Project water, batch studies, HAA6 (ug/L) as a function of
C12/N ratio and pH at a total residual chlorine of 2 mg/L.................................... 70
5.23 California State Project water, batch studies, CNX (ug/L) as a function of
C12/N ratio and pH at a total residual chlorine of 2 mg/L.................................... 72
5.24 Lake Austin water chemistry experiments: Micromolar percentage of 2-d DOX
identified by summing the 12 measured 2-d DBFs at different
pHs and C12/N ratios............................................................................................ 73
5.25 Lake Houston water chemistry experiments: Micromolar percentage of 2-d DOX
identified by summing the 12 measured 2-d DBPs at different
pHs and C12/N ratios............................................................................................ 74
5.26 California State Project water chemistry experiments: Micromolar percentage of
2-d DOX identified by summing the 12 measured 2-d DBPs at
different pHs and C12/N ratios............................................................................. 75
xvi

6.1 Side view of baffled beaker and pouring apparatus, plan view of
baffled beaker, and plan view of jar test apparatus,
with pouring apparatus ........................................................................................ 79
6.2 Lake Austin water dichloramine fraction at pH 6, 7/1 C12/N ratio.................................. 82
6.3 Lake Houston water dichloramine fraction at pH 6, 3/1 C12/N ratio............................... 83
6.4 California State Project water dichloramine fraction at pH 6, 3/1 C12/N ratio................ 83
6.5 Impact of mixing on 2-d DBF formation in Lake Austin water at pH
about 6 and C12/N ratio of 7 to 1, ambient bromide (0.24 mg/L)........................ 85
6.6 Impact of mixing on 2-d DBF formation in Lake Austin water at pH
about 8 and C12/N ratio of 5 to 1, ambient bromide (0.24 mg/L)........................ 85
6.7 Impact of mixing on 2-d DBF formation in Lake Austin water at pH
about 10 and C12/N ratio of 5 to 1, ambient bromide (0.24 mg/L)...................... 86
6.8 Impact of mixing on 2-d DBF formation in Lake Austin water at pH
about 8 and C12/N ratio of 3 to 1, ambient bromide (0.24 mg/L)........................ 86
6.9 Impact of mixing on 2-d DBF formation in Lake Austin water at pH
about 10 and C12/N ratio of 3 to 1, ambient bromide (0.24 mg/L)...................... 87
6.10 Impact of mixing on 2-d DBF formation in Lake Houston water at pH
about 6 and C12/N ratio of 3 to 1, 0.5 mg/L bromide added................................ 89
6.11 Impact of mixing on 2-d DBF formation in Lake Houston water at pH
about 6 and C12/N ratio of 3 to 1, ambient bromide (0.08 mg/L)........................ 89
6.12 Impact of mixing on 2-d DBF formation in Lake Houston water at pH
about 8 and C12/N ratio of 7 to 1, ambient bromide (0.08 mg/L)........................ 90
6.13 Impact of mixing on 2-d DBF formation in Lake Houston water at pH
about 8 and C12/N ratio of 3 to 1, ambient bromide (0.08 mg/L)........................ 90
6.14 Impact of mixing on 2-d DBF formation in Lake Houston water at pH
about 10 and C12/N ratio of 5 to 1, ambient bromide (0.08 mg/L)...................... 91
6.15 Impact of mixing on 2-d DBF formation in California State Project water at pH
about 6 and C12/N ratio of 3 to 1, 0.5 mg/L bromide added................................ 93
6.16 Impact of mixing on 2-d DBF formation in California State Project water at pH
about 6 and C12/N ratio of 3 to 1, ambient bromide (0.10 mg/L)........................ 93
xvn

6.17 Impact of mixing on 2-d DBF formation in California State Project water at pH
about 8 and C12/N ratio of 7 to 1, ambient bromide (0.10 mg/L)........................ 94
6.18 Impact of mixing on 2-d DBF formation in California State Project water at pH
about 8 and C12/N ratio of 3 to 1, ambient bromide (0.10 mg/L)........................ 94
6.19 Impact of mixing on 2-d DBF formation in California State Project water at pH
about 10 and C12/N ratio of 3 to 1, ambient bromide (0.10 mg/L)...................... 95
6.20 Influence of mixing conditions on the percentage of DOX identified
by summing the 12 measured DBFs (S 12 DBPOX) in Lake Austin
water: pH about 6, C12/N ratio 7 to 1, 2 mg/L nominal total
residual after 2-d, ambient bromide (0.24 mg/L)............................................... 103
6.21 Influence of mixing conditions on the percentage of DOX identified
by summing the 12 measured DBFs (1. 12 DBPOX) in Lake Austin
water: pH about 8, C12/N ratio 3 to 1,2 mg/L nominal total
residual after 2-d, ambient bromide (0.24 mg/L)............................................... 103
6.22 Influence of mixing conditions on the percentage of DOX identified
by summing the 12 measured DBFs (2 12 DBPOX) in Lake Austin
water: pH about 10, C12/N ratio 3 to 1, 2 mg/L nominal total
residual after 2-d, ambient bromide (0.24 mg/L) ............................................... 104
6.23 Influence of mixing conditions on the percentage of DOX identified
by summing the 12 measured DBFs (I12 DBPOX) in Lake Houston
water: pH about 6, C12/N ratio 3 to 1, 2 mg/L nominal total
residual after 2-d, 0.5 mg/L bromide added....................................................... 105
6.24 Influence of mixing conditions on the percentage of DOX identified
by summing the 12 measured DBFs (112 DBPOX) in Lake Houston
water: pH about 8, C12/N ratio 3 to 1,2 mg/L nominal total
residual after 2-d, ambient bromide (0.08 mg/L) ............................................... 105
6.25 Influence of mixing conditions on the percentage of DOX identified
by summing the 12 measured DBFs (S 12 DBPOX) in Lake Houston
water: pH about 10, C12/N ratio 5 to 1,2 mg/L nominal total
residual after 2-d, ambient bromide (0.08 mg/L) ............................................... 106
xvm
6.26 Influence of mixing conditions on the percentage of DOX identified
by summing the 12 measured DBFs (2 12 DBPOX) in California
State Project water: pH about 6, Cla/N ratio 3 to 1, 2 mg/L nominal
total residual after 2-d, 0.5 mg/L bromide added............................................... 107
6.27 Influence of mixing conditions on the percentage of DOX identified
by summing the 12 measured DBFs (E 12 DBPOX) in California
State Project water: pH about 10, Cb/N ratio 3 to 1, 2 mg/L nominal
total residual after 2-d, ambient bromide (0.10 mg/L)....................................... 107
7.1 University of Houston pilot plant................................................................................... 110
7.2 City of Austin pilot plant................................................................................................ Ill
7.3 Metropolitan Water District of Southern California La Verne pilot plant..................... 112
8.1 Water treatment plant flow schematic for midsouth utility............................................ 147
8.2 Flow diagram of water purification process for utility treating
Mississippi River water...................................................................................... 157
8.3 Water treatment plant flow schematic for utility treating Biscayne Aquifer
water................................................................................................................... 165
8.4 Effect of chlorine dose on TTHM formation in colored groundwaters.......................... 175
8.5 Water treatment plant flow schematic for northeastern utility....................................... 177
8.6 Water treatment flow schematic for Pacific Northwest utility....................................... 184
9.1 High performance liquid chromatography system hardware configuration................... 199
9.2 Particle beam with nebulizer modification..................................................................... 201
9.3 a Enrichment system valve configuration, load mode and inj ect mode............................ 204
9.3b Enrichment system valve configuration, analysis mode................................................. 204
9.4 Chromatograms for LC-KI-UV analyses of LAW Task la samples
and reference solutions....................................................................................... 210
9.5 Chromatograms for LC-KI-UV analyses of the chlorination and
chloramination of glycylalanine......................................................................... 213
9.6 LC-ESI-MS Chromatograms for the reaction of chlorine with
glycylalanine: total ion current, 203 m/z chromatogram, and 278
m/zmasschromatogram..................................................................................... 215
xix

9.7 Mass spectra of LC-ESI-MS peaks from the reaction of chlorine with
glycylalanine....................................................................................................... 216
9.8a Simultaneous distillation extraction (SDE) apparatus.................................................... 221
9.8b Evaporative concentration system.................................................................................. 222
9.9 GC-MS chromatograms of SDE analyses of midsouth distribution system
water, midsouth plant influent, and chloraminated blank................................... 229
9.10 AMW distribution of DOC and UV-254 for source water CSPW
(June 1995)......................................................................................................... 247
9.11 AMW distribution of DOC, UV, and DOX for chlorinated CSPW
(June 1995)......................................................................................................... 248
9.12 AMW distribution of DOC, UV, and DOX for chloraminated CSPW
(June 1995)......................................................................................................... 248
9.13 AMW distribution of source water DOC and of DOC and DOX of
chloraminated LHW, SDS condition A (pH = 6, C12/N = 5/1,
with 48-hr residual of 4 mg/L)............................................................................ 249
9.14 AMW distribution of source water DOC and of DOC and DOX
of chloraminated LHW, SDS condition B (pH = 8, C12/N = 7/1,
with 48-hr residual of 4 mg/L)........................................................................... 249
9.15 Comparison of AMW distribution of DOC for four source waters................................ 251
9.16 Comparison of AMW distribution of DOC for four chloraminated waters................... 251
9.17 AMW distribution of DOC, UV, and DOX for LHW pilot plant effluent
(enhanced coagulation)....................................................................................... 252
9.18 AMW distribution of DOC, UV, and DOX for chloraminated water
from Pacific Northwest....................................................................................... 253
9.19 AMW distribution of DOC, UV, and DOX for chloraminated water
from the midsouth............................................................................................... 253
9.20 AMW distribution of DOC, UV, and DOX for prechlorinated/
postchloraminated CSPW (April 1995).............................................................. 255
9.21 AMW distribution of DOX for four chloraminated waters............................................ 255
xx

FOREWORD
The AWWA Research Foundation is a nonprofit corporation that is dedicated to the
implementation of a research effort to help utilities respond to regulatory requirements and
traditional high-priority concerns of the industry. The research agenda is developed through a process
of consultation with subscribers and drinking water professionals. Under the umbrella of a Strategic
Research Plan, the Research Advisory Council prioritizes the suggested projects based upon current
and future needs, applicability, and past work; the recommendations are forwarded to the Board of
Trustees for final selection. The foundation also sponsors research projects through the unsolicited
proposal process; the Collaborative Research, Research Applications, and Tailored Collaboration
programs; and various joint research efforts with organizations such as the U.S. Environmental
Protection Agency, the U.S. Bureau of Reclamation, and the Association of California Water
Agencies.
This publication is a result of one of these sponsored studies, and it is hoped that its findings
will be applied in communities throughout the world. The following report serves not only as a
means of communicating the results of the water industry's centralized research program but also as
a tool to enlist the further support of the nonmember utilities and individuals.
Projects are managed closely from their inception to the final report by the foundation's staff
and large cadre of volunteers who willingly contribute their time and expertise. The foundation
serves a planning and management function and awards contracts to other institutions such as water
utilities, universities, and engineering firms. The funding for this research effort comes primarily
from the Subscription Program, through which water utilities subscribe to the research program and
make an annual payment proportionate to the volume of water they deliver and consultants and
manufacturers subscribe based on their annual billings. The program offers a cost-effective and fair
method for funding research in the public interest.
A broad spectrum of water supply issues is addressed by the foundation's research agenda:
resources, treatment and operations, distribution and storage, water quality and analysis, toxicology,
economics, and management. The ultimate purpose of the coordinated effort is to assist water
suppliers to provide the highest possible quality of water economically and reliably. The true benefits
are realized when the results are implemented at the utility level. The foundation's trustees are
pleased to offer this publication as a contribution toward that end.
xxi
Disinfection practices in the U.S. drinking water industry are now evolving in response to
several concerns and will continue to evolve over the next decades. In response to current and
anticipated disinfection by-product (DBF) regulations, many utilities have begun to employ
chloramines as a disinfectant, and others will do so in the future. Also, in response both to DBF
regulations and to the Surface Water Treatment Rule (SWTR) and Enhanced SWTR, other utilities
will switch to ozone as the primary disinfectant and chloramines as the secondary disinfectant. A
third possibility is the initial use of free chlorine for disinfection purposes to meet the SWTR,
followed by the introduction of ammonia at some point in the treatment train to minimize further
formation of DBFs. This report addresses what chemical and operation factors influence DBF
formation; what known and unidentified DBFs are formed; and what treatment steps can be
implemented to lower the DBF concentration.
George W. Johnstone James F. Manwaring, P.E.
Chair, Board of Trustees Executive Director
AWWA Research Foundation AWWA Research Foundation
xxn

ACKNOWLEDGMENTS
The authors of this report are indebted to the cooperation and participation of the
following water treatment utilities that were involved in this project:
City of Austin Water Department, Austin, Texas
City of Houston Department of Public Works, Houston, Texas
Metropolitan Water District of Southern California
Palm Beach County Utility Department, West Palm Beach, Florida
Philadelphia Suburban Water Company
A utility in the mid-south
A utility treating Mississippi River water
A utility treating Pacific Northwest lake water
In addition, the advice and help of the Project Advisory Committee (PAC) and
AWWARF project officers Joel Catlin and Ann Scarritt were sincerely appreciated. The PAC
consisted of William Lauer, Program Manager, AWWA, Denver, Colo.; H. Paul Ringhand,
Research Chemist (retired), U.S. Environmental Protection Agency, Cincinnati, Ohio; E. Marco
Aieta, Senior Vice-President, Montgomery Watson, Boulder, Colo.; and Susan Teefy, Water
Quality Engineer, Alameda County Water Department, Fremont, Calif.
The authors would like to thank Djanette Khiari for her work on the simultaneous
distillation extraction and ultrafiltration experiments, Ted. K. Lieu for the liquid chromatography
and mass spectrometry work, Michael Sclimenti for developing the cyanogen halide method and
for work on the California State Project Water (CSPW) pilot plant, Marshall Ray for operation of
the CSPW plant, and Xiaoyan Chang for willing assistance whenever needed.
At the University of Houston, we acknowledge the assistance of Louis A. Simms,
Departmental Chemist, for his support of the dissolved organic halogen analytic work and of the
operation of the pilot plant treating Lake Houston Water.
xxm


EXECUTIVE SUMMARY
INTRODUCTION
Disinfection practices in the U.S. drinking water industry are now evolving in response to
several concerns and will continue to evolve over the next decade. In response to current and
anticipated disinfection by-product (DBF) regulations, many utilities have begun to employ
chloramines as a disinfectant, and others will do so in the future. Also, in response both to DBF
regulations and to the Surface Water Treatment Rule (SWTR) and Enhanced SWTR, other
utilities will switch to ozone as the primary disinfectant and chloramines as the secondary
disinfectant. A third possibility is the initial use of free chlorine for disinfection purposes to meet
the SWTR, followed by the introduction of ammonia at some point in the treatment train to
minimize further formation of DBFs.
Some known DBFs (e.g., trihalomethanes, haloacetic acids, and haloacetonitriles)
associated with chlorination have been observed during chloramination as well; however, these
chemicals are generally present at lower concentrations. A decreased dissolved organic halogen
(DOX) concentration also is observed upon chloramination; however, a smaller percentage of the
chemicals comprising the DOX has been identified for chloramination in comparison to
chlorination. Except for cyanogen chloride, halogen-substituted DBFs preferentially formed
from chloramination have not been identified. Furthermore, only limited work on the DBFs
from the chloramination of ozonated water (be they halogen-substituted or not) has been
performed. Thus, prior to this study, two key questions emerged in light of increased use of
chloramines:
1. Why are significant quantities of known DBFs formed in some cases?
2. Are any of the currently unidentified chloramination DBFs of health and potential
regulatory significance?
XXV

Formation of known DBFs may result from specific chemical characteristics of the water
or the chloramination process. These parameters might include the total organic carbon (TOC)
concentration, the bromide ion concentration, the pH, the chlorine to ammonia nitrogen ratio, the
relative ratio of mono- and dichloramine, the chloramine dosage, the order of addition of
chlorine and ammonia, and the intensity of mixing during this addition. Prior to this study, the
importance of these parameters in the formation of known DBFs during chloramination was not
well defined and needed detailed investigation.
To address the above issues, this project covered three primary aspects of work:
1. What chemical and operational factors influence DBF formation;
2. What known and unidentified DBFs are formed; and
3. What treatment steps can be implemented to lower the DBF concentrations.
The project research program consisted of laboratory and pilot-scale work, organized in a
logical progression, starting from a basic investigation of the influence of specific water quality
and operational parameters and progressing to identifying and implementing solutions to
minimize DBF formation under practical treatment conditions.
The primary participants in this project were the University of Houston (UH) and the City
of Houston, the University of Texas at Austin (UT) and the City of Austin, and the Metropolitan
Water District of Southern California (MWDSC). Five other utilities across the country
participated through a full-scale sampling program and provided water for limited laboratory-
scale testing. These utilities were selected to cover various raw water characteristics and
treatment conditions as well as to provide geographical diversity.
APPROACH
The project consisted of four main tasks. In the first task (Task la Chapter 5), batch
experiments were conducted on the three primary water sources, Lake Austin water (LAW),
Lake Houston water (LHW) and California State Project water (CSPW). Using preformed
xxvi

chloramines, the batch experiments to determine DBF formation during chloramination were
chosen to cover variable water chemistry conditions:
pH: 6, 8, 10,
total chlorine residual after 48 hours: 1,2,4 mg/L, and
C12/NH3-N mass ratio (called C12/N ratio): 3/1,5/1,7/1.
This task also included a study of variable mixing conditions, as well as sequential
addition of chlorine followed by ammonia, each under five different water chemistry conditions
(Task Ib Chapter 6):
low, medium, and high mixing energies with simultaneous addition of chlorine
and ammonia, and
chlorine then ammonia with a 30-second delay, low and medium mixing energies.
The formation of DBFs was then measured after two days holding time to simulate
passage through a distribution system (2-d simulated distribution system (SDS) DBFs).
In the second task (Task 2 Chapter 7), a pilot testing program on each of the primary
water sources was conducted to confirm the findings of the batch studies in continuous-flow.
The goal of this task was to provide insight into the expected behavior of full-scale plants.
Whereas Task la was performed entirely on source waters, Task 2 studied source water and post-
filter chloramination of conventionally treated water (i.e., coagulated or softened, settled and
filtered) with and without source water ozonation.
In the third task (Task 3 Chapter 8), the scope of the project was expanded to include
water sources in five other geographical locations: northeast, northwest, deep south (2) and mid-
south. These other water sources were selected to cover a wide range of water qualities and
operational characteristics. Operational data were collected from these five locations as well as
finished water samples for analysis. Finally, source water from these five locations was shipped
to the University of Texas, where selected laboratory-scale batch study tests were performed,
three conditions for each water.
xxvn

For each condition in the first two tasks, four trihalomethanes (THMs) and DOX
concentrations were determined for each sample collected and six haloacetic acids (HAAs) and
two cyanogen halides (CNX) (cyanogen chloride and cyanogen bromide) were determined on
selected representative samples. For Task 3, the complete suite of analyses was performed on all
full-scale and bench-scale tests.
The fourth task (Task 4 Chapter 9) consisted of development and application of
analytical techniques for identifying currently unknown DBFs. These new analytical techniques
were applied to selected representative samples collected throughout the study.
RESULTS
The results of this study confirm that DBF formation during chloramination generally
does not pose a regulatory concern based on current drinking water regulations and probably will
not cause a concern with the proposed Stage 1 regulations. Some problems may arise in meeting
the proposed Stage 2 regulations for HAAs (see Table 10.1). Although chloramines limit the
formation of THMs to concentrations generally below that of Stage 2 of the proposed
Disinfectants/Disinfection By-Products (D/DBP) Rule and limit trichloroacetic acid (TCAA)
generally to concentrations below the detection limit (BDL) of the analytic method used,
chloramines were not as effective in minimizing the formation of dihalogen-substituted HAAs
(DCAA, DBAA, and BCAA collectively called DXAA).
Even though chloramines generally do not produce concentrations of most regulated
chemicals that are of concern, formation of unregulated and uncharacterized halogenated
chemicals, as measured by the DOX analysis, is significant (as high as 300 ug C17L) under some
conditions. Therefore, water utilities may want to consider concentrations of both specific
regulated chemicals and DOX in selecting operating conditions for chloramination.
Some decrease in DBF formation may be observed through improved mixing at the point
of chemical addition. Also, simultaneous addition of chlorine and ammonia, in comparison to
delayed addition of ammonia, should reduce DBF formation, especially formation of THMs. In
bench scale mixing tests, the decrease in DBF formation through improved mixing and
simultaneous chemical addition did not exceed 50 percent based on 48-hr SDS tests; therefore,
this approach to DBF control is most applicable to situations where modest decreases in DBF
xxvm

formation are sought. The possible benefits from this approach also are a function of the quality
of the mixing and chemical addition schemes in current use.
System chemistry affects DBF formation far more than mixing. In general, the formation
of DBFs decreases with increasing pH (up to pH 10 studied) and decreasing Cli/N ratio (down to
3/1 studied) (see Chapters 5 and 6). Therefore, manipulation of these two major operating
variables can significantly impact DBF formation. Unfortunately, the general observations of the
effect of pH and Ck/N ratio on DBF formation may not hold for all waters near neutral pH (7 to
8.5) because of the complexity of haloamine chemistry over this pH range. Therefore, bench
scale testing like that performed in Task la of this research is recommended as an initial step in
investigating the impact of operating conditions on DBF formation. Further investigation at pilot
scale also may be warranted if substantial changes in operating conditions are contemplated.
As noted above, decreasing the Cb/N ratio, especially to low values such as 3/1,
decreases DBF formation. Unfortunately, some water utilities have experienced problems in
maintaining adequate microbiological quality in distribution systems at low C^/N ratios.
Growth of nitrifying bacteria is a particular problem. Therefore, minimizing DBF formation and
maintaining acceptable microbiological water quality in the distribution system may conflict
with one another. Possible adverse water quality impacts should be considered in conjunction
with a decrease in the Cli/N ratio to low levels.
Any strategy aimed at controlling DBF formation through modification of pH and the
Cli/N ratio will have practical ranges of workable values that are specific to each situation. In
some cases, the workable ranges may be inadequate to satisfactorily control DBF formation. In
this study, the HAA6 concentration usually consisted of only dehalogenated acids (e.g.,
dichloroacetic acid). Conceivably, the HAAS concentration in some waters could exceed the
proposed Stage 2 regulations. Under these circumstances, preozonation followed by
chloramination should be considered. This research showed that ozonation prior to
chloramination decreased the formation of both HAAs and DOX.
In addition to pH and the Cb/N ratio, two other system chemistry parameters may be
important in DBF formation: bromide and alkalinity. This research shows that, as the bromide
concentration increases (up to 0.74 mg/L studied), DBF formation likewise increases (see Figure
5.10 as an example) and the speciation within the individual classes of DBFs (e.g., THMs) shifts
toward the bromine substituted chemicals (see Figure 5.14 as an example). Therefore, water
XXIX

utilities that experience cyclical changes in the bromide concentration of their source water can
expect an increase in DBF formation when the bromide ion concentration increases and vice
versa.
Monochloramine can react with organics via an acid-catalyzed mechanism to yield
halogen-substituted organics. This reaction mechanism is catalyzed by proton donors such as
carbonic acid and bicarbonate, the latter of which is a component of alkalinity and a common
constituent of natural waters. Thus, as alkalinity increases, the rate of DBF formation also may
increase. Utilities that have significant alkalinity (up to 165 mg CaCOa/L were investigated),
especially those practicing or considering lime softening, may want to examine the effect of
alkalinity removal on DBF formation. The effect of alkalinity on DBF formation was not
formally part of this research; however, some very limited data from several pilot plant runs
suggest that alkalinity may impact DBF formation.
Specific DBFs (e.g., THMs, HAAs, CNX) may comprise a very small percentage of the
DOX concentration. Under such circumstances, water utilities may want to investigate their
water in more detail to identify additional chemicals. This research examined a number of new
analytical approaches for identifying additional chloramination DBFs (see Chapter 9). Ultra-
filtration (UF) using DOX and TOC surrogates and liquid chromatography (LC) are methods that
could be adopted by a research laboratory to provide general information about halogen-
substituted DBFs. As with other MS investigations into the identification of chlorination DBFs,
the ultimate goal is to develop analytical methods using more readily available instrumentation
once unknown DBFs have been identified. The actual practice of this approach cannot be
instituted, however, until more of the chloramine DBFs are identified and their health
significance evaluated. This study has shown that an initial full-scan, low resolution LC-
electrospray ionization (ESI)-mass spectrometry (MS) run can provide preliminary halogen
content and molecular weight information. Subsequent, high resolution MS and MS-MS runs
could then focus on peaks of interest to determine chemical composition and structure for DBF
identification.
XXX

CONCLUSIONS
In summary, the following major conclusions can be made based on the results of this
study. A complete list of conclusions is contained in Chapter 10.
The results from the bench-scale chemistry studies, the pilot-scale studies, and the
studies of geographically diverse waters generally agreed, giving confidence that
the findings of this study would be applicable to a wide variety of waters.
Over the range studied (1 to 4 mg/L), the total disinfectant residual after two days
of incubation had little influence on the resulting DBFs formed.
Controlling THMs to the levels of Stage 2 of the proposed D/DBP Rule using
chloramination should be possible.
Dihalogen-substituted HAAs (DXAA) dominated the 2-d SDS HAA6, implying
that they might not be well controlled by using chloramination.
Substantial quantities of 2-d SDS DOX were formed in all waters studied,
particularly when dichloramine was present.
Low percentages (commonly below 25 percent) of the 2-d DOX could be
accounted for by summing the molar concentration of the 12 2-d SDS DBFs
measured in this study, indicating that many unidentifiable DBFs were being
formed during chloramination.
In general, DBF formation increases as the pH decreases and the Cb/N ratio
increases.
The presence of bromide ion complicates the control of DBFs because of the
complexity of bromamine chemistry.
When bromide ion is present, CNBr is formed in addition to CNC1, thus
increasing the CNX. The base-catalyzed hydrolysis of CNX resulted in less CNX
being present after two days of incubation at higher pHs.
In the waters where source water chloramination and postfiltration chloramination
were compared, little effect on the resulting SDS DBFs was found.
XXXI
In the bench-scale batch tests, relative mixing energy had little influence on
resulting 2-d SDS DBF concentrations, but simultaneous addition of chlorine and
ammonia is recommended.
Ozonation altered DBF precursors such that applying ozone prior to
chloramination resulted in lessened concentrations of resulting 2-d SDS DBFs.
In some chloraminated water, the <500 dalton ultrafiltration (UF) fraction
represented approximately 43 to 61 percent of the DOX.
In some of the other chloraminated waters, the two highest molecular weight
fractions (the 3K to 10K and >10K) together represented approximately 39 to 55
percent of the DOX. Thus, significant concentrations of halogen-substituted DBFs
with very high molecular weight also are possible.
UF provides a unique analytical tool to preliminarily ascertain which molecular
weight fraction is most significant for a site specific chloramination.
Dihalomethanes (dibromo-, bromoiodo-, and diido-) may be specific
chloramination DBFs.
Monochloramine, not dichloramine, reacted with small model peptides.
UF, simultaneous distillation extraction gas chromatography-mass spectrometry
(SDE-GC-MS), liquid chromatography-electrospray ionization-mass spectrometry
(LC-ESI-MS), and liquid chromatography-potassium iodide-ultraviolet detection
(LC-KI-UV) are all techniques applicable to the study of chloramine DBFs.
RECOMMENDATIONS
Overall, practicing conventional coagulation, adding well mixed chlorine and ammonia
solutions simultaneously in the appropriate ratio, and keeping the pH in the distribution system
(as represented by incubation pH in this study) as high as possible after chloramination at as low
a Cb/N ratio as possible should minimize overall DBF formation. Where needed, preozonation
before chloramine addition should further decrease DBF formation.
xxxn

CHAPTER 1
GENERAL PURPOSE OF STUDY
Disinfection practices in the U.S. drinking water industry are now evolving in response to
several concerns and will continue to evolve over the next decade. In response to current and
anticipated disinfection by-product (DBF) regulations, many utilities have begun to employ
chloramines as a disinfectant, and others will do so in the future. Also, in response both to DBF
regulations and to the Surface Water Treatment Rule (SWTR) and Enhanced SWTR, other
utilities will switch to ozone as the primary disinfectant and chloramines as the secondary
disinfectant. A third possibility is the initial use of free chlorine for disinfection purposes to meet
the SWTR, followed by the introduction of ammonia at some point in the treatment train to
minimize further formation of DBFs.
Some known DBFs (e.g., trihalomethanes, haloacetic acids, and haloacetonitriles)
associated with chlorination have been observed during chloramination as well; however, these
chemicals are generally present at lower concentrations. A decreased dissolved organic halogen
(DOX) concentration also is observed upon chloramination; however, a smaller percentage of the
chemicals comprising the DOX has been identified for chloramination in comparison to
chlorination. Except for cyanogen chloride, halogen-substituted DBFs preferentially formed
from chloramination have not been identified. Furthermore, only limited work on the DBFs
from the chloramination of ozonated water (be they halogen-substituted or not) has been
performed. Thus, prior to this study, two key questions emerged in light of increased use of
chloramines:
1. Why are significant quantities of known DBFs formed in some cases?
2. Are any of the currently unidentified chloramination DBFs of health and potential
regulatory significance?
Formation of known DBFs may result from specific chemical characteristics of the water
or the chloramination process. These parameters might include the total organic carbon (TOC)
concentration, the bromide ion concentration, the pH, the chlorine to ammonia nitrogen mass
ratio (called Cb/N ratio), the relative ratio of mono- and dichloramine, the chloramine dosage,
the order of addition of chlorine and ammonia, and the intensity of mixing during this addition.
Prior to this study, the importance of these parameters in the formation of known DBFs during
chloramination was not well defined and needed detailed investigation.
To address the above issues, this project covered three primary aspects of work:
1. What chemical and operational factors influence DBF formation;
2. What known and unidentified DBFs are formed; and
3. What treatment steps can be implemented to lower the DBF concentrations.
The project research program consisted of laboratory and pilot-scale work, organized in a
logical progression, starting from a basic investigation of the influence of specific water quality
and operational parameters and progressing to identifying and implementing solutions to
minimize DBF formation under practical treatment conditions.
The primary participants in this project were the University of Houston (UH) and the City
of Houston, the University of Texas at Austin (UT) and the City of Austin, and the Metropolitan
Water District of Southern California (MWDSC). Five other utilities across the country
participated through a full-scale treatment plant sampling program and provided water for
limited laboratory-scale testing. These utilities were selected to cover various source water
characteristics and treatment conditions as well as to provide geographical diversity.

CHAPTER 2
LITERATURE REVIEW
This chapter is primarily a literature review on DBF formation during chloramination,
chloramine and bromamine chemistry, the nature of possible DBF precursors and the
identification of possible "new" DBFs.
DISINFECTION BY-PRODUCT FORMATION
In general, most reports indicate that chloramination of water produces limited formation
of specific DBFs of current and future regulatory concern, i.e., trihalomethanes (THMs),
haloacetic acids (HAAs), haloacetonitriles (HANs), and cyanogen chloride (CNC1). This review
will focus on the exceptions, which provide some insight into conditions that might promote
formation of specific DBFs during chloramination.
Jacangelo et al. (1989) evaluated pilot- and full-scale treatment trains at four utilities
treating surface waters. Ozone, chlorine and chloramines were studied in various combinations
as primary and secondary disinfectants. At Utility 2, ozone in combination with chloramines as
a secondary disinfectant caused very little formation of THMs, HAAs, HANs and cyanogen
chloride. At Utility 3, which practiced prechloramination, significant production of both THMs
and HAAs occurred; the distribution system concentration of each class of DBFs was 44 ug/L.
The authors speculated that the relatively high levels of DBFs resulted either from inadequate
mixing at the point of chlorine and ammonia addition or from the high raw water TOC (7.7
mg/L). At Utility 4, both ozonation/chloramination and chloramination alone were evaluated. In
both cases, some production of HAAs (10 ng/L) was observed, while the CNC1 concentration
was approximately 3 ng/L with ozonation/chloramination. The raw water had a relatively high
bromide concentration (320 ug/L), so perhaps this played a role in HAA formation. Although
far from conclusive, this study suggests that poor mixing at the point of chlorine and ammonia
application, a high raw water TOC concentration and a high raw water bromide concentration
may be important factors in DBF formation during chloramination.
Stevens et al. (1989) performed some limited tests on chloraminated Ohio River water
measuring non-purgeable organic halogen (NPOX), which is DOX minus the THMs. At a

chloramine dose of 22.9 mg/L, NPOX formation was 20% of that observed at a chlorine dose of
20 mg/L, indicating, as expected, that chloramines produce less halogen substituted by-products
than chlorine. NPOX formation with chloramination did, however, show a pH dependence. The
NPOX concentration was much greater at pH 5.9 than at pH 11.5. This suggests that pH may be
an important factor in studying DBP formation during chloramination.
Krasner et al. (1989a) found that cyanogen chloride was formed to a greater extent in
chloraminated waters in comparison to chlorinated waters. Also, the cyanogen chloride
concentration appeared to be a function of the Cb/N ratio, with the cyanogen chloride
concentration increasing as the ratio increased. This implies that the dichloramine concentration
may be important in cyanogen chloride (and perhaps cyanogen bromide) formation. The need to
consider the effects of chloramine speciation on DBP formation is also illustrated.
Shukairy and Summers (1992) studied ozonation and ozonation followed by
biodegradation in two water sources, groundwater humic substances and Ohio River water. The
waters were either chlorinated or chloraminated after treatment. For humic substances extracted
from groundwater and concentrated to a TOC concentration of 4.7 to 6.4 mg/L, NPOX formation
was 200-250 ug/L in both water treated by chloramination alone and water treated by
chloramination following ozonation. In Ohio River water the corresponding NPOX
concentration was 90 ng/L. In both waters, preozonation had little effect on NPOX formation
upon chloramination. The chloramine dose, however, did affect the resulting NPOX
concentration. The concentration approximately doubled as the chloramine dose was increased
from 1 to 5 mg/mg dissolved organic carbon (DOC). Biodegradation alone and ozonation
followed by biodegradation significantly decreased NPOX formation in both waters. Thus, this
work suggests some dependence of DBP formation on chloramine dose, as well as the potential
for beneficial contributions from a biodegradation step.
USEPA studies at Jefferson Parish, LA (Lykins et al. 1994) compared the performance of
four disinfection schemes in pilot plants operating in parallel: pre- and post-chlorination
(C\2/C\2\ pre- and post-chloramination (NHiCl/NHiCl), preozonation and post-chlorination
(Os/Cb), and preozonation and post-chloramination (Os/NFkCl). The first disinfectant addition
point was prior to a mixing chamber immediately before the sand filters, while the second
addition point was after the sand filters. Nineteen DBFs were measured, and DBP production as
a function of the disinfection scheme was, in descending order:

(NH2C1/NH2C1), and (O3/NH2C1). The use of chloramines dramatically lessened the
concentrations of all of the DBFs, as would be expected. With chloramination, HAAs,
consisting mostly of dichloroacetic acid, were present in the highest concentrations, followed by
the THMs. The concentrations of many DBFs were below the method detection limit. DOX
concentrations averaged 540 ug C17L for C12/C12, 59 ug C1YL for NH2C1/NH2C1 and were about
equal to background for O3/NH2C1. Although the production of halogen-substituted DBFs
decreased through the use of chloramine, it was not eliminated. Also, halogen-substituted DBF
production was greater with (NH2C1/NH2C1) than with (O3/NH2C1).
The City of Portland, OR in the past used prechloramination to treat a low pH (< 7) and
low bromide water. The C12/N mass ratio was 7/1, which favors production of dichloramine.
The resulting THM concentrations were less than 10 ng/L, but HAA concentrations ranged from
20 to 40 ug/L in the distribution system.
The MWDSC treats California State Project Water (CSPW) at the Henry J. Mills
Filtration Plant and used chloramines in the past as the primary disinfectant. During that time,
THMs were less than 10 ug/L. During drought conditions, the bromide concentration in the
water increased to 0.5 mg/L, a relatively high level. As a consequence of this increase, THM
and HAA concentrations on the order of 20 ug/L and 10 ug/L, respectively, were observed.
These increases may have been associated with the instability of bromamines that would be
formed in the high bromide ion concentration water by the reaction of ammonia with
hypobromous acid after oxidation of bromide ion with chlorine.
CHLORAMINE/BROMAMINE CHEMISTRY
Chloramine chemistry is fairly well understood at this time and can be summarized in its
simplest form by the three reversible reactions listed below:
NH3 + HOC1 <-» NH2C1 + H2O (2.1)
NH2C1 + HOC1 <-> NHC12 + H2O (2.2)
NHC12 + HOC1 <-> NC13 + H2O (2.3)

2.5
) 2.0
1.5
1.0
0.5
ttWCUBV 'BE fOOttCUBV (OM
Trichloramine._
2
i
3
i
456 Chlorine Dose (mg/L)
10
8 10 12 Chlorine/Nitrogen Ratio
14 16 18 20
Source: Modified from Barrett et al. (1985)
Figure 2.1 Chloramine dose-residual curve for California State Project water
The dominant chloramine species is a function of the Ch/N ratio and pH. An example is shown
in Figure 2.1 for California State Project water in which the ammonia dose was constant at 0.5
mg N/L and the chlorine dose was varied. At small chlorine doses, NF^Cl dominated, reaching a
peak concentration at a Cb/N ratio of about 5/1. At larger doses, the NF^Cl concentration
decreased and NHCh formed, reaching a peak concentration at a Ch/N ratio of about 8/1. At
even larger chlorine doses (C^/N ratio of 10/1 and greater), both mono- and dichloramine
disappeared and trichloramine and free chlorine formed. This progression from monochloramine
to trichloramine and eventually free chlorine is known as breakpoint chlorination.
Monochloramine is generally the chemical of interest in drinking water disinfection. The
production of dichloramine is favored as the Ch/N ratio increases and the pH decreases. The
hydrolysis reactions (the reverse reactions in Eq. 2.1-2.3) also are of considerable interest
because they generate HOC1, which may be important in the formation of chlorine substituted
orgam'cs, HOBr/OBr", and bromamines. Also, the monochloramine hydrolysis reaction liberates
ammonia, which is needed for bromamine formation. The hydrolysis of monochloramine is a
minimum at pH 8 to 8.5 and is larger at both pH 6 and 10. At equilibrium, several percent, at
most, of the monochloramine is hydrolyzed. The hydrolysis equilibrium for dichloramine is
considerably greater than that for monochloramine, but the rate of hydrolysis is much slower
(Morris and Issac 1983). In addition to hydrolysis and Eq. 2.3, dichloramine decomposes by
several other reactions, as summarized by Jafvert and Valentine (1992). Two of the reaction
pathways are base catalyzed. Therefore, dichloramine decomposition accelerates as the pH
increases and as the concentration of bases increases (e.g., alkalinity). Taken together, the
kinetic and equilibrium considerations lead to the conclusion that dichloramine is much less
stable than monochloramine under most conditions of practical interest. The greater instability
of dichloramine may lead to underestimates of its significance in DBF formation if chloramine
residual speciation measurements are performed after relatively long contact times, which might
be typical of distribution system samples or simulated distribution system tests.
Monochloramine decomposes through disproportionation to dichloramine, with subse
quent decomposition of dichloramine being primarily responsible for oxidant loss. The two
major pathways for monochloramine disproportionation are hydrolysis of monochloramine with
subsequent reaction of free chlorine with monochloramine (Eq. 2.1 and 2.2) and general acid
catalysis, as shown in Eq. 2.4 (Valentine and Jafvert 1988):
NH2C1 + NH2C1 + H+ <-» NHC12 + NH3 + H+ (2.4)
General acid catalysis also liberates ammonia. The rate of general acid catalysis (Eq. 2.4) is a
function of the concentration of proton donors and increases as their concentration increases and
the pH decreases. Valentine and Jafvert (1988) note that the carbonate system, via carbonic acid
and bicarbonate, may significantly increase the rate of acid-catalyzed disproportionation at
concentrations and pH values typical of many drinking waters. Thus, the decomposition rate of
both monochloramine and dichloramine may increase as alkalinity increases.
Monochloramine will produce DOX, ranging from 9-49% of that observed with free
chlorine (Jensen et al. 1985). Monochloramine has little tendency to produce THMs and should
lead to minimal production of HAAs (Coughlan and Davis 1983). Snyder and Margerum (1982)
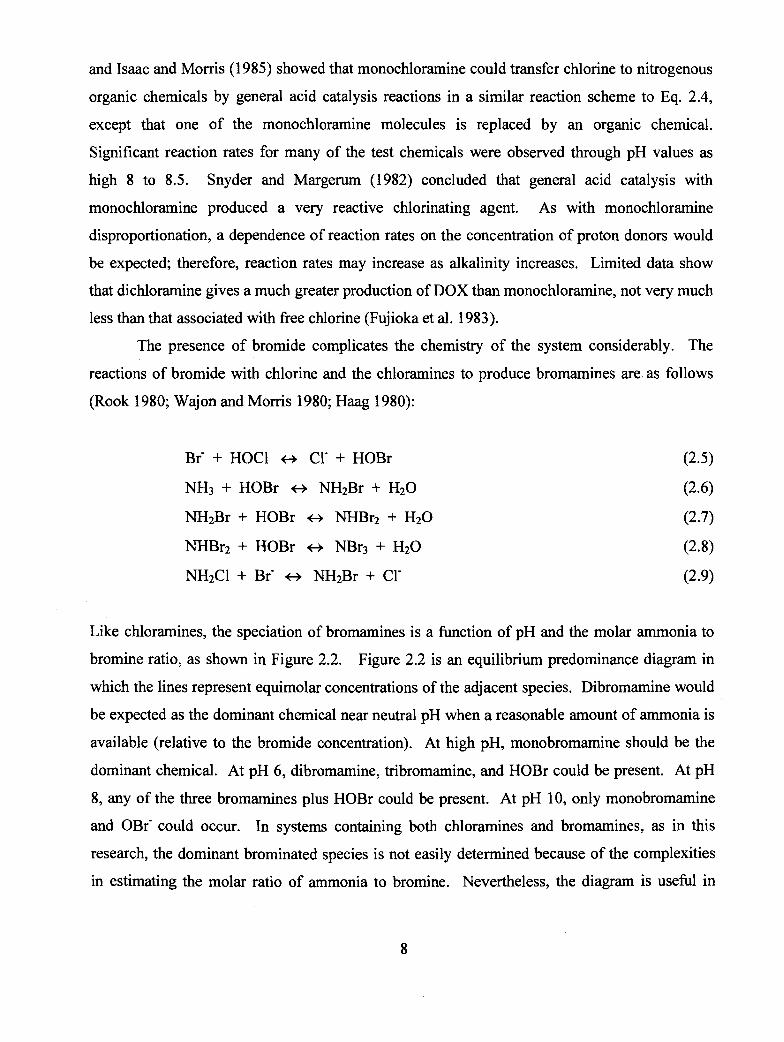
and Isaac and Morris (1985) showed that monochloramine could transfer chlorine to nitrogenous
organic chemicals by general acid catalysis reactions in a similar reaction scheme to Eq. 2.4,
except that one of the monochloramine molecules is replaced by an organic chemical.
Significant reaction rates for many of the test chemicals were observed through pH values as
high 8 to 8.5. Snyder and Margerum (1982) concluded that general acid catalysis with
monochloramine produced a very reactive chlorinating agent. As with monochloramine
disproportionation, a dependence of reaction rates on the concentration of proton donors would
be expected; therefore, reaction rates may increase as alkalinity increases. Limited data show
that dichloramine gives a much greater production of DOX than monochloramine, not very much
less than that associated with free chlorine (Fujioka et al. 1983).
The presence of bromide complicates the chemistry of the system considerably. The
reactions of bromide with chlorine and the chloramines to produce bromamines are as follows
(Rook 1980; Wajon and Morris 1980; Haag 1980):
Bf + HOC! <-» cr + HOBr (2.5)
NH3 + HOBr <-» NH2Br + H2O (2.6)
NH2Br + HOBr <-> NHBr2 + H2O (2.7)
NHBr2 + HOBr <-> NBr3 + H2O (2.8)
NH2C1 + Br' <-» NH2Br + CK (2.9)
Like chloramines, the speciation of bromamines is a function of pH and the molar ammonia to
bromine ratio, as shown in Figure 2.2. Figure 2.2 is an equilibrium predominance diagram in
which the lines represent equimolar concentrations of the adjacent species. Dibromamine would
be expected as the dominant chemical near neutral pH when a reasonable amount of ammonia is
available (relative to the bromide concentration). At high pH, monobromamine should be the
dominant chemical. At pH 6, dibromamine, tribromamine, and HOBr could be present. At pH
8, any of the three bromamines plus HOBr could be present. At pH 10, only monobromamine
and OBr" could occur. In systems containing both chloramines and bromamines, as in this
research, the dominant brominated species is not easily determined because of the complexities
in estimating the molar ratio of ammonia to bromine. Nevertheless, the diagram is useful in

-2
? 2-'o: ~
w * 0
o
<9O
i T I I I I I i i
Br 2 HOBr
NHBr 2
I
6
PH
OBr-
NH 2 Br
10
Source: Adapted from Johnson and Sun (1975)
Figure 2.2 Principal species of bromine and bromamines predominating after 1 to 2 minutes at
various pH and ammonia:nitrogen ratios
indicating which species might be present as a function of pH. Clearly, the chemistry is probably
most complicated over the pH range of 7 to 8.5 because of the possibility of forming any one of
the three bromamines.
Bromamines form rapidly, relative to chloramines, and are less stable, dissipating rapidly
in the environment. For example, the half-life of dibromamine is 30 min and monobromamine is
19 hr at pH 8 (Wajon and Morris 1980), Thus, dibromamine is considerably less stable than
monobromamine. The decomposition rate of dibromamine decreases as pH increases (especially
in the range of pH 6-8), as the ammonia concentration increases, and as the dibromamine
concentration decreases. Several pathways for dibromamine decomposition have been
postulated. Some of these pathways show HOBr as a decomposition product. Nitrogen gas is a
typical product, although one pathway shows some ammonia as a decomposition product (Jolley
and Carpenter 1983). Decomposition of tribromamine also yields HOBr as a product. The rate
of decomposition increases with increasing pH and increasing ammonia concentration.
Similarly, hydrolysis of monobromamine yields HOBr as a product. The rate of decomposition
increases with increasing pH and decreasing ammonia concentration. Bromamine species are

highly reactive and appear as free chlorine in the standard analytical techniques used to measure
free and combined chlorine (Palin 1975; Gordon et al. 1987). Because bromamine species are
short-lived, however, their contribution to the total disinfectant concentration should be minimal
after the 24- to 48 hour incubation times used to simulate DBF formation in water distribution
systems.
The reactivity of bromamines in the formation of DBFs is largely unknown, although one
report indicates little formation of THMs with dibromamine (Sugam and Helz 1980). If
bromamines are reactive and if the reactivity varies among the bromamine species, DBF
formation should vary with pH and bromide concentration because of the anticipated dependence
of speciation on these variables.
In the presence of ammonia and bromide, the chlorination of waters may produce
bromochloramine in addition to chloramines and bromamines (Valentine 1986). Various
reactions have been proposed for the production of bromochloramine as follows (Wajon and
Morris 1980; Gazda et al. 1993):
NH2C1 + HOBr o NHBrCl + H2O (2.10)
NH2C1 + Br" <-» NHBrCl + other products (2.11)
NH2Br + HOC1 <-> NHBrCl + other products (2.12)
NH2C1 + NHBr2 <-> NHBrCl + other products (2.13)
NH2C1 + NH2Br <-> NHBrCl + other products (2.14)
The reaction of hypobromous acid with monochloramine (Eq. 2.10) is at least three orders of
magnitude faster at pH 6.5 than the reaction of bromide with monochloramine (Eq. 2.11) (Gazda
etal. 1993).
Valentine (1986) studied the oxidation of AyV-diethyl-p-phenylenediamine (DPD) by
bromochloramine. Bromochloramine reacted rapidly with DPD, leading Valentine to conclude
that the bromine atom of bromochloramine is very labile and reactive and that in reactions with
organic chemicals bromochloramine should produce products similar in nature to those produced
by free bromine. In conducting the experiments, Valentine produced bromochloramine by
adding bromide to solutions of monochloramine at pH 6.5. Analysis of the resulting solution
showed significant concentrations of only monochloramine and bromochloramine and no
10

measurable amounts of the bromamine species. Although the results apply to only one
condition, they are suggestive of the possible importance of bromochloramine in DBF formation
in bromide containing waters. Bromochloramine is essentially half bromamine and half
chloramine in character; therefore, in the standard techniques for measuring free and combined
chlorine, half the bromochloramine concentration appears in the free chlorine fraction and half in
the combined chlorine fraction (Valentine 1986).
Consideration of the above allows some general listing of expectations for the
experiments conducted in this project:
1. Formation of DOX is expected in the presence of monochloramine, although little
THM and HAA formation may be observed.
2. Dichloramine concentrations may be significant at low pH and high Cfe/N ratios.
3. If dichloramine is more reactive (as suggested by some DOX data) or if its
instability leads to a greater free chlorine concentration (especially at the 7/1
Cb/N ratio), larger concentrations of DOX, THM, and HAAs should result with
dichloramine, relative to monochloramine.
4. Alkalinity may influence system chemistry through base catalysis of dichloramine
decomposition and acid catalysis of both monochloramine decomposition and
monochloramine reactions with organic chemicals.
5. If bromide is present in the water, HOBr/OBr", bromamines, and
bromochloramine may form. These species should lead to a greater production of
DBFs because of their high reactivity, and increasing bromide concentration
should increase the production of DBFs. Where DBF speciation is analyzed,
increased concentrations of brominated species should be observed.
6. Of the three pH values tested (6, 8, and 10), the greatest uncertainty about
bromamine speciation is at pH 8, and it seems quite possible that this speciation
could vary considerably among water sources at pH 8 for identical conditions of
chloramination. Thus, the DBF formation in the presence of bromide also could
vary considerably.
7. Dibromamine is the least stable bromamine, and HOBr is a likely decomposition
product. Therefore, conditions that select for dibromarnine formation may
11

accentuate DBF production because of reactions with the HOBr generated during
decomposition. This should be most obvious at pH 6 and possibly pH 8.
8. Chloramination conditions leading to the largest concentrations of free chlorine
(high Ch/N ratios and low pH) should promote the largest formation of free and
combined bromine.
9. Examination of dichloramine:total chlorine and dichloramine:monochloramine
ratios as a function of bromide concentration may indicate the relative role of
bromide and bromamine formation in these systems. Reduced formation of
dichloramine in the presence of bromide would indicate that HOC1 is being
consumed by bromide oxidation in preference to dichloramine production from
monochloramine. Also, increases in the free chlorine concentration as the
bromide concentration increases may be indicative of brominated species because
the latter are measured as free chlorine in the standard analytical methods.
RECOVERY OF DOX IN MEASURABLE DBFs
Krasner et al. (1989) correlated the measured molar concentration of DOX with the
arithmetic molar sum of the 21 individual disinfection by-products (DBFs) measured in a survey
of 35 utilities. The correlation coefficient (r) was 0.56, although some increase in DOX
concentration occurred during shipment of the non-dechlorinated samples. The authors state,
"When data for only the utilities that chloraminated were used, the correlation improved," but the
actual value was not given. Also, recovery factors for the individual DBFs in the DOX
determination were not used. These data indicated a little less than 30 percent of the measured
DOX was accounted for by summing the 21 measured DBFs.
Singer et al. (1992) reported on a study where eight water treatment plants were each
sampled three times during the period from June 1991 to February 1992. Plotting the sum of 12
individually measured DBFs versus DOX produced a line with a slope of 0.36 and an R2 value of
0.83, thus indicating that approximately 36% of the measured DOX was accounted for by
summing the 12 individual DBFs.
12

IDENTIFICATION OF NEW DBFs
A search of the literature showed that the characterization of by-products formed upon
chloramination of drinking water is incomplete, with only a small fraction of compounds
identified and currently being monitored. This group consists of small (one and two carbon)
chlorinated and brominated compounds. Other chloramination by-products have been identified
in nonpotable water, i.e., in wastewater and in solutions of fulvic acid, amino acids, amines, and
other organic compounds (Crochet and Kovacic 1973; Ingols et al. 1953; Burttshell et al. 1959;
Minisci and Galli 1965; Kotiaho et al. 1991; and Kanniganti 1992). For example, chlorinated
aldehydes, chlorinated acids and chlorinated ketone by-products have been identified when
fulvic acid is chloraminated (Kanniganti 1992).
In a more general sense, some work has been done on surrogates of DBFs formed upon
treatment. Significant amounts of nonpurgeable organic halogens are formed with
chloramination even though less THMs and other purgeable organic halogen compounds are
formed compared to chlorination (Amy et al. 1990). Furthermore, chloramination (with
monochloramine) of fulvic acid has been hypothesized to produce DOX with compounds of
higher molecular weight than chlorine-produced DOX (Jensen et al. 1985).
Numerous nitrogen containing compounds exist in surface waters, including NOM
substances such as amino acids, peptides, proteins, humic materials, chlorophylls and man-made
organic chemicals such as herbicides, pesticides, and nitrophenols (Le Cloirec et al. 1983) The
total dissolved amino acid concentration in surface waters has been reported to range from 50 to
1000 ug/L (Hureiki et al. 1994) and in some cases has increased after ozonation or biological
filtration (Le Cloirec et al. 1983). Amino acids and peptides may be chlorinated by direct-
transfer mechanisms from inorganic chloramines (Snyder and Margerum 1982; Isaac and Morris
1983a) to produce organic chloramines. Another plausible mechanism for chloramination
reactions is via formation of an imine intermediate to yield a nitrile (Le Cloirec and Martin
1985).
Currently identified and unidentified DBFs may be of interest to utilities for a variety of
reasons, including disinfection differences between species. The current conventional measure
ments for chlorine cannot distinguish all of the chlorine species that may be present (Wolfe et al.
1985). The compounds may only be short-lived intermediates (Isaac and Morris 1983b) or they
13
may be slow to form (White 1992). Water utilities may experience false positives in the
distribution system, indicating the presence of inorganic chloramines where there is none (Wolfe
etal. 1985).
A method that is designed to cover a wide range of target and nontarget compounds with
a broad range of chemical structures is known as a broad-spectrum analysis. Gas
chromatography/mass spectrometry (GC/MS) has conventionally been used for broad screen
analyses because it allows for many compounds (e.g., volatiles and semivolatiles) to be identified
and quantified. GC/MS cannot be used for nonvolatile or heat sensitive compounds, however.
Jersey (1991) developed an HPLC method that is capable of distinguishing between inorganic
monochloramine and inorganic dichloramine and other chlorinated amines and chlorinated
amino acids. Membrane introduction MS has been used for inorganic chloramines (Kotiaho et
al. 1992) and also for organic chloramines (Kotiaho et al. 1991). DBFs associated with
monochloramine could be identified by liquid chromatography (LC) or capillary zone
electrophoresis interfaced to MS (Kotiaho et al. 1992). Budde et al. (1990) describe the use of
LC/PB/MS as a possible broad-spectrum analytical technique applicable to the determination of
nonvolatile compounds in drinking water. Schroder (1991) has described the use of
LC/thermospray/MS for the analysis of surface water.
14

CHAPTERS
GENERAL SCOPE OF PROJECT
The project consisted of four main tasks. In the first task, batch experiments were
conducted on the three primary water sources, Lake Austin water (LAW), Lake Houston water
(LHW) and California State Project water (CSPW). Using preformed chloramines (Task la), the
batch experiments were chosen to cover variable water chemistry conditions:
1. pH: 6, 8,10,
2. total chlorine residual after 48 hours: 1,2,4 mg/L, and
3. C12/NH3-N mass ratio (called C12/N ratio): 3/1,5/1,7/1.
This task also included a study of variable mixing conditions, each under five different
water chemistry conditions (Task Ib):
1. low, medium, and high mixing energies with simultaneous addition of chlorine
and ammonia, and
2. low and medium mixing energies with the addition of chlorine followed by
ammonia after a 30 second delay.
The formation of DBFs was then measured after two days holding time to simulate
passage through a distribution system (2-d simulated distribution system (SDS) DBFs).
In the second task, a pilot testing program on each of the primary water sources was
conducted to confirm the findings of the batch studies in continuous-flow. The goal of this task
was to provide insight into the expected behavior of full-scale plants. Whereas Task 1 was
performed entirely on source waters, Task 2 studied source water and post-filter chloramination
of conventionally treated water (i.e., coagulated or softened, settled and filtered) with and
without source water ozonation.
In the third task, the scope of the project was expanded to include water sources in five
other geographical locations: northeast, northwest, deep south (2) and mid-south. These other
water sources were selected to cover a wide range of water qualities and operational
15

characteristics. Operational data were collected from these five locations as well as finished
water samples for analysis. Finally, source water from these five locations was shipped to the
UT, where selected batch study experiments were performed, three conditions for each water.
For each condition in the first two tasks, four trihalomethanes (THMs) and DOX
concentrations were determined for each sample collected, and six haloacetic acids (HAAs) and
two cyanogen halide (CNX) (cyanogen chloride and cyanogen bromide) were determined on
selected representative samples. For Task 3, the complete suite of analyses was performed on all
full-scale and bench-scale tests.
The fourth task consisted of development and application of analytical techniques for
identifying currently unknown DBFs. These new analytical techniques were applied to selected
representative samples collected throughout the study.
16

CHAPTER 4
ANALYTIC METHODS AND QUALITY ASSURANCE/QUALITY CONTROL
Each major analytical method used in this study for routine analyses is described briefly.
The associated quality control/quality assurance procedures also are presented.
SIMULATED DISTRIBUTION SYSTEM TREATMENT
Methodology
The simulated distribution system (SDS) measurement attempts to simulate conditions
existing in a typical drinking water distribution system. SDS experiments were performed
extensively on each of the three primary waters, and to lesser extent on the various utility waters.
To ensure consistency of results, a 250-L sample of each primary water was obtained and stored
at 4 C. Raw source water was used (1) because raw water frequently is chloraminated in
treatment plants, and (2) to provide a "worst-case" scenario.
For the batch chemistry studies (Task la), 1-L batches of water were dosed to achieve a
matrix of experimental conditions. Before dosing the water, it was brought to room temperature
(22 C) and its pH was adjusted. The pH was adjusted with nitric acid or sodium hydroxide.
Pure acid or base was used, rather than a buffer, to eliminate any competing reactions. A
sequential filling procedure was adopted when filling the bottles in order to achieve mixing.
First the bottles were partially filled with the sample water. The appropriate dosing solutions
were then added to the partially filled bottles. Care was taken not to overflow the bottles
because they contained reagents. Finally, the bottles were filled slightly overfull with sample
water and capped with a Teflon-lined septum. This procedure provided turbulence that
distributed chemicals throughout the bottle. Bromide was added using a potassium bromide
solution. Chlorine was added in the form of preformed chloramines. The bottles were held at
22 C for 48 hours.
17

Quality Control/Quality Assurance
Duplicate bottles were prepared for the first Task 1A samples. Chlorine residual and
THM concentration were measured on the duplicate samples. Very good reproducibility of
chlorine residual and THM concentration was found. Chlorine residual, for a sample size of 60,
had a sample standard deviation of 0.029 and a mean of 1.40. Total THM concentration had a
standard deviation of 0.81 and a mean of 22.2 for a sample size of 44.
Bottles used for sample treatment were washed with Alconox and rinsed four times with
distilled water, then soaked in 50% by volume nitric acid and rinsed seven times with distilled
water. They were then baked for 12 or more hours at 400 C and stored covered. Teflon septa,
when reused, were washed following the same procedure, with the addition of an acetone wash
after the Alconox step and with the elimination of the baking step.
Reagent grade chemicals were used for all solutions. All solutions were mixed with
distilled, deionized water produced on a Milli-Q filter apparatus. Before use, this water was
determined to be free of chlorine demand.
FORMATION POTENTIAL
Methodology
The potential for formation of DBFs in the three primary source waters was measured.
Water for disinfection by-products formation potential (FP) analysis was chlorinated to the
concentration that resulted in a residual free chlorine concentration of between 3 and 5 mg/L
after 4 days contact time at pH 6, 8, and 10. Four-day chlorine demand among samples varied
from 3 to 11 mg/L. Therefore, doses ranged from 6 to 26 mg/L of chlorine. The method used
here follows protocols described in Standard Method 5710 (APHA et al. 1992) with modifi
cations.
The sample water pH was first adjusted with nitric acid or sodium hydroxide. The water
was then placed in 1-L amber glass bottles. A sequential filling procedure was adopted when
filling the bottles in order to achieve mixing as described above. A bottle was half-filled, the
appropriate chlorine solution was added, and the bottle was filled head-space free and capped
18
with a Teflon-lined cap. Each water was chlorinated at three chlorine concentrations, and the
sample with a chlorine residual closest to 4 mg/L was used for analyses. Disinfection by-product
formation potential (DBPFP) is defined here as the concentration of a given disinfection by
product in the water after contact with chlorine under these conditions. The absence of DBFs at
time zero was assumed.
Quality Control/Quality Assurance
Bottles used for sample treatment were washed with Alconox and rinsed four times with
distilled water, then soaked in 50% by volume nitric acid and rinsed seven times with distilled
water. They were then baked for 12 or more hours at 400 C and stored covered. Teflon septa,
when reused, were washed following the same procedure, with the addition of an acetone wash
after the Alconox step and with the elimination of the baking step.
Reagent grade chemicals were used for all solutions. All solutions were mixed with
distilled, deionized water produced on a Milli-Q filter apparatus.
PREFORMED CHLORAMINES
Methodology
Preformed chloramines were used in the batch chemistry experiments (Task la).
Preformed chloramines were created by mixing aqueous ammonium sulfate and sodium
hypochlorite solutions. These solutions were formulated so that approximately equal volumes of
the two, when combined, would produce the desired Cb/N ratio. Both solutions were adjusted to
pH 9 with nitric acid and/or sodium hydroxide. The concentration of the chlorine solution was
measured prior to creating preformed chloramines, and small adjustments were made, as needed,
in the volume of ammonium solution added to ensure the correct C12/N ratio. The chlorine
solution was added slowly to the ammonium solution with constant mixing in an ice bath at 1 C.
After 15 minutes of mixing, the concentration of the chloramine solution was measured prior to
dosing the samples.
19

Quality Control/Quality Assurance
Before using a preformed chloramine solution for dosing samples, the concentration was
determined by iodometric titration. Two measurements were made. If these differed by greater
than 0.10 mg/mL, two more measurements were made. If these second measurements differed
by greater than 0.10 mg/mL, a third pair of measurements was made. If these differed by greater
than 0.10 mg/mL, the chloramine solution was discarded and remixed. An average of the two
appropriate measurements was used for calculations. All solutions were mixed with distilled,
deionized water produced on a Milli-Q filter apparatus. Preformed chloramine solutions were
mixed immediately before use and were discarded after use.
CHLORINE DOSING SOLUTION
Methodology
Hypochlorite stock solution was mixed using Aldrich reagent grade sodium hypochlorite
(NaOCl). When shipped, the NaOCl was nominally 10 percent NaOCl, but its concentration
diminished over time. One mL of straight reagent grade NaOCl in 25 mL deionized water was
titrated with standardized sodium thiosulfate titrant. The resulting solution contained
approximately 20 mg/mL C\2 and was used to make the chlorine dosing solution. The desired
concentration of the dosing solution was 4.5 mg/mL.
The required volume of stock solution to produce 250 mL of an approximately 5 mg/mL
dosing solution was calculated. This volume was diluted to 250 mL with deionized water and
stored in an amber bottle with a Teflon lined cap at 4 C until the concentration dropped below 5
mg/mL, between 2 and 4 weeks.
Quality Control/Quality Assurance
Before using the chlorine solution for dosing samples or making a preformed chloramine
solution, the concentration was determined with iodometric titration. Two measurements were
made. If these differed by greater than 0.10 mg/mL, two more measurements were made. If
20

these second measurements differed by greater than 0.10 mg/mL, a third pair of measurements
was made. If these differed by greater than 0.10 mg/mL, the chlorine solution was discarded and
remixed. All solutions were mixed with distilled, deionized water produced on a Milli-Q filter
apparatus.
CHLORINE DOSE
Methodology
The volume of chlorine dosing solution added to 1-L bottles (1.025 L actual volume) for
formation potential (FP) and simulated distribution system (SDS) measurements was calculated
as:
Volume dosing solution (mL) = 1.025 (L) x Desired dose (mg/L)
Dosing solution concentration (mg/mL)
The dosing solution was added to bottles using the appropriate volume Eppendorf pipette.
Quality Control/Quality Assurance
The calculated dose volume was rounded to the nearest uL. This value was recorded and
the resulting actual dose concentration was used in subsequent calculations.
RESIDUAL CONCENTRATIONS
Methodology
Free chlorine, monochloramine and dichloramine residuals were determined using
Standard Method 4500-C1 D for amperometric titration (APHA et al. 1992). High concentration
21

solutions, such as the preformed chloramine dosing solutions, were analyzed using Standard
Method 4500-C1B (APHA et al. 1992) for iodometric titration.
High concentrations, including the residual chlorine in FP samples, were measured using
the standard iodometric titration technique: Standard Method 4500-C1 B Iodometric Method I.
Sample water was placed in a beaker. Five mL of glacial acetic acid and 1 g potassium iodide
(KI) were added while stirring. A yellow-orange color appeared at this stage because of
liberation of iodine. The sample was titrated with the appropriate normality solution until it was
a pale lemon yellow. At this point, 4 mL of starch indicator was added to produce a deep blue
color. Titration was continued until disappearance of blue tint. Titrant volume was recorded and
used to calculate the chlorine concentration.
Lower concentrations of chlorine, such as residual chlorine in SDS experiments, were
measured using amperometric titration: Method 4500-C1 D (APHA et al. 1992). This procedure
measured free chlorine, monochloramine, and dichloramine. A sample of between 100 mL and
200 mL was brought to pH 7 and titrated with 0.564 N phenylarsine oxide until all movement of
the amperometric titrator needle stopped. This first volume of titrant indicated free chlorine.
Next, 0.2 mL of 50 g/L KI was added, and the amperometric titrator setting was changed to
"combined chlorine." Titration continued until all movement of the needle once again ceased.
This second volume of titrant indicated monochloramine. Finally, the pH of the solution was
brought down to 4 with 1.0 mL of acetic acid buffer, and 1.0 mL of 50 g/L KI was added.
Titration continued until all movement of the needle once again ceased. This final volume of
titrant indicated dichloramine. After analysis, the electrode was thoroughly rinsed with
deionized water to avoid carryover of KI into the analysis of the next sample.
The amperometric titration technique also would measure free bromines and
bromamines, if present. All the brominated species would most likely be measured as free
chlorine in the analytical technique. Given the instability of bromamines and the high reactivity
of free bromine, no appreciable concentrations of these chemicals would be expected after the
48-hour incubation period of the SDS experiments.
22

Quality Control/Quality Assurance
A series of 12 measurements on a sample spiked with chloramines showed a standard
deviation of 0.0078 mg/L at an average concentration of 1.86 mg/L for monochloramine and a
standard deviation of 0.027 mg/L at an average concentration of 1.92 mg/L for dichloramine.
The coefficients of variation were 0.42% and 1.41%, respectively.
Before performing iodometric titration on samples, the sodium thiosulfate titrant to be
used was standardized against a potassium dichromate standard, as discussed in Standard
Method 4500-C1 B (APHA et al. 1992). The potassium dichromate solution was mixed using
freshly boiled, then cooled, deionized water. The potassium dichromate was measured to five
decimal places on a Mettler analytical balance. Two separate solutions were made and labeled A
and B. These solutions were stored in the dark at room temperature. The sodium thiosulfate
titrant was standardized against both solutions before using. The sodium thiosulfate titrant was
stored at 4 C and brought to room temperature before use.
Phenylarsine oxide of the correct normality for amperometric titration was obtained from
Aldrich Chemical Company (Milwaukee, Wis.). Before proceeding with titration, a sample of
dilute mono-chloramine was measured to ensure that the system was operational.
DISINFECTION BY-PRODUCT SAMPLE TREATMENT
Methodology
After termination of the incubation period for either simulated distribution system or
formation potential measurements, samples were taken from each 1-L amber bottle. Two 42-mL
samples were taken for THM analysis; two 42-mL samples were taken for HAA analysis; four
42-mL samples were taken for CNX analysis; and two 250-mL samples were taken for DOX
analysis. The water remaining in the 1-L bottle was used for pH and residual chlorine
measurements as described above.
23

Before the sample vials were filled, preservatives and/or dechlorinating agents were
added. THM samples were dosed with 0.5 mL of glacial acetic acid for preservation and with
0.2 mL of 100 g/L sodium sulflte solution for dechlorination. HAA samples were dosed with 0.8
g of solid ammonium chloride for dechlorination. DOX samples were dosed with 0.5 mL of
nitric acid for preservation, and with 0.5 mL of a 100 g/L sodium sulfite solution for
dechlorination. CNX samples were dosed with 0.1 mL of 0.1 N sulfuric acid for preservation
and with approximately 0.05 mL of freshly prepared 0.142 M ascorbic acid for dechlorination.
Water was poured into the vial until it was very slightly overfilled. If the pH of the unpreserved
sample was anticipated to be high (9 to 10), additional acid was added to achieve the desired pH
of 2.0 to 3.0. Care was taken not to overflow the vials containing reagent. A Teflon septum was
placed on the vial and affixed with a plastic screw cap, head-space-free.
These head-space-free samples were placed in a 4 C refrigerator until analyzed or
shipped. Samples for trihalomethane analysis were stored for up to 28 days. Samples for
haloacetic acid analysis were stored for up to 9 days. Samples for CNX and DOX analysis were
immediately shipped via next-day-air in coolers containing blue-ice to ensure that they remained
chilled.
Quality Control/Quality Assurance
Ascorbic acid and sodium sulfite dechlorination agents were mixed immediately before
use and were not stored. Bottles were washed using the procedure described above. Vials were
baked for 12 or more hours at 550 C.
DISINFECTION BY-PRODUCT ANALYSIS
Overview
THMs were measured by the liquid-liquid extraction methods of Henderson et al. (1976).
HAAs were measured by microextraction at pH 0.5 with methyl tert-buty\ ether (MTBE) and
24

methylation with diazomethane (Krasner et al. 1989b; Barth and Fair 1992). A J&W DB1701
(Folsom, Calif.) capillary column with an electron capture detector was used in gas
chromatographic analysis of THMs and HAAs. DOX was measured with Standard Method
5320B (APHA et al. 1992). CNX was measured using the micro-liquid-liquid-extraction method
of Sclimenti et al. (1994). Bromide was measured by ion chromatography (Kuo et al. 1990).
Trihalomethanes
Methodology
Trihalomethanes were extracted from water with pentane. Trichloroethene (TCE) at an
approximate concentration of 0.7 mg/L pentane was used as the internal standard for gas
chromatagraphic (GC) analysis. Samples were stored in 42-mL nominal vials at 4 C and taken
from cold storage immediately prior to extraction. Only Pierce 42-mL vials were used for the
THM samples taken in Austin, to ensure consistent volume.
Two mL of pentane containing internal standard was taken up in a 5-mL or 3-mL glass
syringe. The sample vial was held upside down, and a syringe needle was inserted through the
Teflon septum, penetrating less than 0.25 inches (0.6 cm), to provide an outlet for displaced
water. Standard pentane was then injected into the vial. The needle of the pentane syringe was
fully inserted, to approximately 1.5 inches (4 cm), while the pentane was injected. After
injection of pentane, the syringe and syringe needle were removed, and vials were placed upside
down in a rack to minimize contact of the organic layer with the punctured septum.
After all the samples were injected with pentane, they were shaken for one hour at a
moderate speed on a horizontal shaker table. Finally, the organic layer was removed from the
vial with a sterile disposable glass pipette and placed in a 1.5-mL GC vial. The GC vial was
capped with a Teflon septum. The vials were placed in a 4 C refrigerator or in a -10 C freezer
depending upon the length of delay before GC analysis. Vials were stored up to one week in the
freezer.
25

Gas chromatographic analysis was performed on a Hewlett Packard (Avondale, Pa.)
5 890A GC equipped with an automatic sampler. For trihalomethanes, a 30-m J&W 1701 fused
silica capillary column with a film thickness of 0.25 mm was used. One uL of sample was
injected; three injections were made for each sample. The initial oven temperature was 70 C for
10 minutes, followed by a 10 C/minute ramp to a maximum temperature of 130 C. Retention
times varied slightly from run to run, so before performing analyses for a given experiment the
100 ng/L standard was analyzed. Separation was good for all peaks.
Quality Assurance/Quality Control
Aqueous standards were extracted and analyzed in the same manner as the samples to
compensate for extraction efficiency. TCE at an approximate concentration of 0.7 mg/L pentane
was used as the internal standard. The ratio of the area of the peak of interest to the peak of the
internal standard was used to quantify concentration.
A five-point standard curve was run with every GC run to eliminate the effect of possible
equipment operating condition variations. The standard concentrations ranged from 1.0 to 20
Hg/L for SDS samples. The standard concentrations ranged from 5.0 to 100 (j.g/L for FP samples.
Typical calibration curves for chloroform achieved a correlation coefficient of 0.990 or better.
Typical calibration curves for the other three compounds achieved a correlation coefficient of
0.998 or better.
Haloacetic Acids
Methodology
Haloacetic acid analysis was performed following the microextraction procedure of Barth
and Fair (1992). This method is similar to Standard Method 6233B (APHA et al. 1992). The
method consists of a series of steps: extraction of acids into ether from water at high ionic
26

strength, followed by esterification of acids with diazomethane to aid in GC identification of
species. Sample water was prepared and stored as described above. Samples were taken from
cold storage immediately prior to extraction. Diazomethane (DAM) was produced immediately
before sample extraction via Standard Method 6233B (APHA et al. 1992) and stored at -70 C
until needed. The DAM storage vial was placed in a weigh boat filled with water, which then
froze. The ice thus formed ensured that the DAM would remain cold after removal from the
freezer, during use.
A 30-mL aliquot of water was taken from the 42-mL sample vial with a 30-mL glass
syringe and transferred to a clean 42-mL vial. Three grams of copper sulfate, 12 g of baked
sodium sulfate, 1.5 mL of concentrated sulfuric acid and 3.0 mL of MTBE were then added to
the vial. The vial was capped, immediately shaken rapidly by hand for 45 seconds, capped with
a Teflon lined septum and placed upside down in a rack. When all sample vials had been treated
in this way, they were placed on a high speed shaker table for 9 minutes. The samples were then
allowed to stand quiescently for 3 minutes to allow separation of the aqueous and organic layers.
Exactly 2.0 mL of the ether layer was transferred from the sample vial to a thick walled
3-mL reaction vial using a 3-mL or a 5-mL glass syringe. The reaction vials were placed in
a -10 C freezer for 7 minutes to chill. When the vials were completely chilled, both the vials and
freshly prepared diazomethane were removed from the freezer. Using a 1-mL Eppendorf pipette,
0.250 mL of cold diazomethane was added to each reaction vial to esterify the acids. The vials
were then placed in the 4 C refrigerator to react for 15 minutes. After reaction, the vials were
removed and the excess diazomethane was quenched with 0.2 mg of silica gel. The MTBE
containing the esterified acids was transferred to 1.5-mL GC vials using sterile glass pipettes.
These samples were analyzed immediately.
Gas chromatographic analysis was performed on a Hewlett Packard 5 890A GC equipped
with an automatic sampler. For HAAs, a 30-m J&W 1701 fused silica capillary column with a
film thickness of 0.25 mm was used. Four uL of sample was injected, and three injections were
made for each sample. The initial oven temperature was 37 C for 14 minutes, followed by a
27

10 C/minute temperature ramp to a temperature of 70 C. A temperature of 70 C was held for 11
minutes, followed by a 10 C/minute temperature ramp to a temperature of 200 C. Good
separation was found for all peaks. In natural waters, the chromatograms had a great deal of
noise, producing some interfering peaks.
Quality Assurance/Quality Control
Aqueous standards were extracted and analyzed in the same manner as the samples to
compensate for extraction efficiency. 1,2-dibromopropane (1,2-DBF) was used as the internal
standard. The ratio of the area of the peak of interest to the peak of the internal standard was
used to quantify concentration.
A five-point standard curve was run with every GC run to eliminate the effect of possible
equipment operating condition variations. The standard concentrations ranged from 1.0 to 20
ug/L for SDS samples. The standard concentrations ranged from 5.0 to 100 u^g/L for FP samples.
Typical calibration curves for MCAA had a correlation coefficient of 0.98 or better. Typical
calibration curves for the other five compounds achieved a correlation coefficient of 0.998 or
better.
Dissolved Organic Halogen
Methodology
Dissolved organic halogen (DOX) is a group parameter that measures "all" of the
halogen-substituted organic compounds in a sample. DOX was analyzed using a Mitsubishi
Chemical Industries Total Organic Halogen Analyzer Model TOX-10 (currently distributed by
Cosa Instruments, Norwood, N.J.). The concentration of dissolved organic halogen was
determined by Standard Method 5320B (APHA et all992).
The general procedure was as follows. First, a 50-mL water sample was automatically
fed at a constant rate through two columns packed with activated carbon produced specifically
for this purpose. The columns were transferred to a washing channel and washed with a 5 g/L as
nitrate solution to desorb the inorganic halide ions adsorbed. The columns were
28

subsequently analyzed for DOX content using microcoulometric titration. A determination was
deemed acceptable if less than 10 percent of the total DOX was recovered from the second
column in series.
A 10 fig C17L 2,4,6-trichlorophenol standard was tested twice with recoveries of 83.4
percent and 91.3 percent, respectively. This gives an indication of the method detection limit.
Each DOX sample was analyzed twice. If the sample values deviated from each other by 10
ug/L or more, a third DOX determination was performed on the duplicate sample bottle. The
DOX concentrations reported were the average of replicate samples.
Before conducting the DOX experiments, the recoveries of the various DBFs of interest
in the DOX analysis were measured in control studies. The results are presented in Table 4.1.
The stock solutions were prepared by dissolving an exactly weighed amount of one specific DBF
in deionized (DI) water. All standard solutions were prepared by the appropriate dilutions of
stock solution with DI water. Adequate recoveries in most of the DOX analyses were found,
thus justifying the use of this analysis as an indicator of a broad spectrum of DBFs. Low
recoveries could be caused by poor adsorption on the activated carbon or by loss during the
nitrate-wash step in the analysis.
Quality Control/Quality Assurance
Two different sets of tests were conducted to evaluate the performance of the DOX
determination. One consisted of eight replicates of a City of Houston tap water sample (Table
4.2). This gave a measure of the precision of the test.
To ensure that the equipment was performing properly, each day a standard of 49.9 jag
C17L of 2,4,6-trichlorophenol in DI water was analyzed. This indicated whether or not the
analysis was "in control" that day. In addition, sample activated carbon blanks were tested
frequently. The results of these tests (Table 4.3) indicate the general reliability of the DOX test.
29

Table 4.1
Recoveries of individual DBFs in the DOX analysis
Haloacetic Acids
Formula Weight
Weight of Compound in Stock, mg/lOOmL
mmole Compound/L
mmoleX/L
Standard solution*, nmol X/L
DOX, ugC17L(Test-l)
DOX, umol/L
Recovery
DOX, MgCf/L (Test-2)
DOX, ujnol/L
Recovery
DOX, MgCl"/L (Test-3)
DOX,pmol/L
Recovery
DOX, Mg C17L(Test^)
DOX, nmol/L
Recovery
MCAA
94.50
670.2
70.92
70.92
3.55
19.4
0.55
15.4%
9.2
0.26
7.3%
8.0
0.23
6.4%
9.6
0.27
7.6%
DCAA
128.9
382.0
29.64
59.27
2.96
37.78
1.06
35.9%
33.0
0.93
31.4%
TCAA
163.39
439.0
26.87
80.60
4.03
140.28
3.95
98.0%
141.84
4.00
99.1%
134.72
3.79
94.2%
MBAA
138.9
223.0
16.05
16.05
0.80
21.3
0.60
74.7%
23.36
0.66
82.0%
17.94
0.51
63.0%
DBAA
217.86
384.6
17.65
35.31
1.77
56.28
1.59
89.8%
52.0
1.46
83.0%
52.7
1.48
84.1%
66.56
1.87
106.2%
CyanogenHalides
BCAA CNBr CNC1 CHC1,
173.5 106 61.5 119.5
19.848 100
1.14 8.37
2.29 25.10
4.58 1.42 6.02 1.26
148.5 57.7 213.6 38.1
4.18 1.63 20.1 1.07
91.4% 114.9% 9.4% 85.5%
133.0 44.8 213.6 38.8
3.75 1.26 18.5 1.09
81.9%' 89.2% 8.7% 87.1%
142.4
4.01
87.7%
Trihalomethanes
CHCl2Br CHClBr2
164 208.5
100 100
6.10 4.80
18.29 14.39
0.91 0.72
30.0 24.7
0.85 0.70
92.4% 96.7%
30.1 23.3
0.85 0.66
92.7% 91.2%
CHBr,
253
100
3.95
11.86
0.59
21.2
0.60
95.0%
20.0
0.56
95.0%
Mean Recovery
Standard Deviation
Coefficient of Variation
9.2%
4.2%
45.7%
33.6%
3.2%
9.6%
97.1%
2.6%
2.7%
73.2%
9.6%
13.1%
90.8%
10.7%
11.8%
87.0% 102.0% 9.1% 86.3%
4.8% 18.2% 0.5% 1.1%
5.5% 17.8% 5.4% 1.3%
92.5% 94.0%
0.2% 3.9%
0.2% 4.1%
95.0%
0.0%
0.0%
X = halide*20,000; 1 dilution of stock solution, except for BCAA, which was a 500:1 dilution; standard solutions of CNCI and CNBr were prepared directly
30

Table 4.2
Results from replicates of the same City of Houston tap water sample
Test Number
1
2
3
4
5
6
7
8
Mean Value
Standard Deviation
Coefficient of Variation
DOX Concentration, ug C17L
145.5
158.8
148.8
177.8
156.3
149.7
155.9
156.1
156.1
9.9
6.3%
Cyanogen Halide (CNX)
Methodology
Materials used. The extraction solvent used was MTBE (OmniSolv; EM Science,
Gibbstown, N.J.). The Na2SC>4 was from J. T. Baker, Inc. (Jackson, Tenn.), and the sulfuric acid
(H2SO4) was American Chemical Society (ACS) reagent grade from Fisher Scientific Co.
(Pittsburgh, Pa.). The "dechlorinating/dechloraminating agent" was 1-ascorbic acid from Sigma
Chemical Co. (St. Louis, Mo.). The methanol for stock standard solutions was GC-GC/MS
solvent from Burdick & Jackson (Muskegon, Mich.).
31

Table 4.3
Variation in DOX determination with time
ExperimentDate
10/3/9310/4/9310/11/9310/12/9310/25/9310/26/9311/15/931 1/22/9311/29/9311/30/9312/6/93
12/13/9312/14/931/10/941/17/941/24/941/25/942/8/94
2/1 1/942/23/948/9/94
10/11/9510/12/9510/19/9511/16/9512/17/951/27/952/26/953/26/95
Mean ValuesStandardDeviation
Coefficient of Variation
DOX Blank ValueGig as CD
0.550.470.510.440.460.300.450.390.360.350.420.330.360.300.500.440.260.330.450.290.300.280.430.500.520.410.370.460.520.41
0.08
19.51%
Concentration of DOX in Standard(ugCr/L)
NRNRNRNRNRNR95.888.2NR93.8NR93.6NR
104.8NR89.3NR10298.092.691.4100.6102.888.597.892.396.791.2102.095.6
5.2
5.5%
NR = Not run
32

Table 4.4 outlines the source and physical information for the analytes. The reference
internal standard used, 1,2-DBP, was 98% pure (Chem Services, Inc., West Chester, Pa.). The
internal standard was added at the 100 mg/L level in the MTBE used for extraction. The reagent
water used for preparation of procedural standards was made in the laboratory by an organic-
pure water (OPW) system (Milli-Q UV Plus Ultra-Pure; Millipore Corp., Bedford, Mass.). The
source water for the OPW system was purified laboratory water (Super-Q) that had been
subjected to several stages of cartridge-type purification to filter and demineralize the water and
trap the organic compounds. The OPW was prepared daily or as needed, as storage can increase
the opportunity for contamination from laboratory solvents, etc.
Stock standard solutions. Primary stock solutions were prepared gravimetrically in
methanol from pure compounds. Separate primary stock solutions were prepared for CNC1 and
CNBr. CNC1 is available as a pure gas, whereas CNBr was obtained commercially as a solid
(CNC1, however, may also be purchased as a dilute solution). The primary stock solution for
CNC1 was prepared by measuring 15 mL of pure gas into a gas-tight syringe. (This step must be
performed in a fume hood, ideally in a chemical containment room, as CNC1 is a highly toxic
gas.) This volume was then injected immediately into the head space of a freezer-cooled
(-10 C), septum-sealed, and tared 10-mL volumetric flask containing 8 mL of methanol. The
volumetric flask was inverted several times to dissolve the gas and then weighed to determine
Table 4.4
CNX analytical standards
Compound
Cyanogen Chloride
Cyanogen Bromide
Source Purity (%)
Island* 99.5
Aldrichf 97
Molecular
Weight
61.47
105.93
Boiling
Point ( C)
13.8
61-62
Density
(g/cm3 )
1.186
2.015
* Island Pyrochemical Industries, Great Neck, NY
t Aldrich Chemical Company, Inc., Milwaukee, WI
33

the concentration. The CNC1 primary stock solution was diluted to final volume with methanol,
sealed, and mixed by inverting the flask several times. The final concentration of this primary
stock solution varied between 1 and 2 mg/mL.
The primary stock solution for CNBr was prepared by weighing out an appropriate
amount of the pure compound into a tared, 10-mL, glass-stoppered volumetric flask containing 8
mL of methanol so that the final concentration was approximately 10 mg/mL. The CNBr
primary stock solution was diluted to final volume with methanol, stoppered, and mixed by
inverting the flasks several times. Each of the CNX primary stock solutions were then
transferred to clean, 15-mL, amber-glass storage bottles, with Teflon-faced septa and screw caps,
and stored at 4 C. These primary stock solutions were prepared fresh every 3-6 months.
A secondary standard solution used for procedural standards and matrix spikes was
prepared by diluting the appropriate amount of each primary stock solution into 1.0 mL of
methanol so that the resulting concentration of each analyte was approximately 30 mg/L. This
secondary standard solution was prepared weekly or as needed.
Analytical procedure. The head-space-free samples were extracted as soon as possible
after collection because of the CNBr's instability. Typically, the samples were extracted upon
receipt at the laboratory. No samples more than 48 hr old were analyzed. Resampling and
reanalysis were required if the sample holding time was exceeded. A 30-mL sample aliquot was
extracted after addition of 10 g of Na2SO4 and 4 mL of MTBE. The sample was shaken in a
mechanical shaker (Eberbach Corp., Ann Arbor, Mich.) for 10 min on a fast setting. The layers
were allowed to separate, and the MTBE layer was transferred to two 1.5-mL autosampler vials
and stored at 4 C. The extracts were then analyzed on the GC/ECD.
Gas chromatography. The extracts were analyzed on a GC (model 3600; Varian
Instrument Group, Sunnyvale, Calif.) installed with a septum-equipped, programmable-
temperature injector (SPI model 1093; Varian), ECD, and autosampler (model 8100; Varian).
The analytical column used was a Dura-bond (DB) 624 fused silica capillary column (J&W
Scientific, Folsom, Calif.) with a film thickness of 1.8 mm, an internal diameter of 0.32 mm, and
a length of 30 m. This thick-filmed column, designed for VOCs, was needed to obtain baseline
resolution of all the analytes. A constant-current, pulse-modulated, nickel-63 (63Ni) ECD with a
standard-size cell was used for detection.
34

Quality Control/Quality Assurance
Aqueous procedural standards were extracted and analyzed in the same manner as the
samples in order to compensate for extraction efficiency. Quantitation was accomplished using
an external standard calibration curve. Additional calibration utilizing the internal standard was
found unnecessary. The internal reference standard, 1,2-DBP, was used only to monitor the
performance of the autosampler injections. The calibration standards ranged from 0.5 to 20 ug/L
for both CNXs. Typical calibration curves for both compounds, using a best-fit polynomial,
achieved a coefficient of determination (R2) of better than 0.999 for each compound.
The method detection limits for CNC1 and CNBr were 0.13 ug/L and 0.26 |ag/L,
respectively. The mean recovery for matrix spikes was 98.6% for CNC1 and 100% for CNBr.
The normalized difference duplicate analyses ranged between 0.1 and 19% for CNC1 and 0 and
19% for CNBr.
Bromide Ion
Methodology
The bromide ion concentration was measured by chemically suppressed ion
chromatography (1C) with conductivity detection. USEPA Method 300.0 (USEPA 1993) was
followed except for the separator columns and eluant. A Dionex (Sunnyvale, Calif.) AS9-SC
analytical column using 22 mM HsBOs with 22 mM ^28407 was used.
Quality Control/Quality Assurance
The method detection limit (MDL) was 0.01 mg/L. The precision was 4 % at the 0.05
mg/L concentration.
35

OTHER ANALYTICAL METHODS
Total organic carbon (TOC) was measured following Standard Method 5310 (APHA et
al. 1992). Alkalinity was measured with Standard Method 2320 (APHA et al. 1992). Turbidity
was measured using Standard Method 2130 (APHA et al. 1992). The pH of various solutions
and samples was determined using Standard Method 4500-H+ B (APHA et al. 1992).
36

CHAPTER 5 CONTROLLED BATCH STUDIES WITH PREFORMED CHLORAMINES—TASK la
OBJECTIVES
A portion of the first research task consisted of a series of batch experiments conducted
on the three primary water sources: Lake Austin Water (LAW), Lake Houston Water (LHW),
and California State Project Water (CSPW). Experiments were conducted sequentially on each
water source. The batch experiments screened a wide variety of treatment conditions to identify
conditions that promote DBP formation. Of particular interest were the interrelationships among
total residual concentration, residual speciation, chlorine to nitrogen mass ratio, pH, and the
concentration of bromide as they affected the production of the 12 measured DBFs and DOX.
The results of these experiments also aided in the selection of operating conditions for pilot plant
studies and in the selection of appropriate water utilities across the country for sampling.
EXPERIMENTAL APPROACH
The batch experiments were performed at the University of Texas, using one large
sample of water from each source, except for Lake Houston, where two samples were collected.
Collection of 250 L of water occurred during periods of typical raw water quality. The water
was shipped as rapidly as possible and stored at 4 C prior to testing in the various batch
experiments. The experiments were conducted directly on the raw water, so that the maximum
DBP precursor concentrations were present to simulate worst case conditions.
The major variables were TOC concentration, bromide concentration, chloramine dose,
pH and Cla/N ratio. For any given water, the TOC concentration was constant, leaving four
variables to study. Each variable was studied at different levels to establish its importance in
DBP formation. To avoid confounding effects from imperfect mixing, the experiments were
conducted with preformed chloramines. The matrix of experimental conditions is outlined
below.
Three levels of pH were studied to cover the range of current practice. Similarly, three
C12/N ratios were studied to span the broadest possible range of operation in practice. Three
37
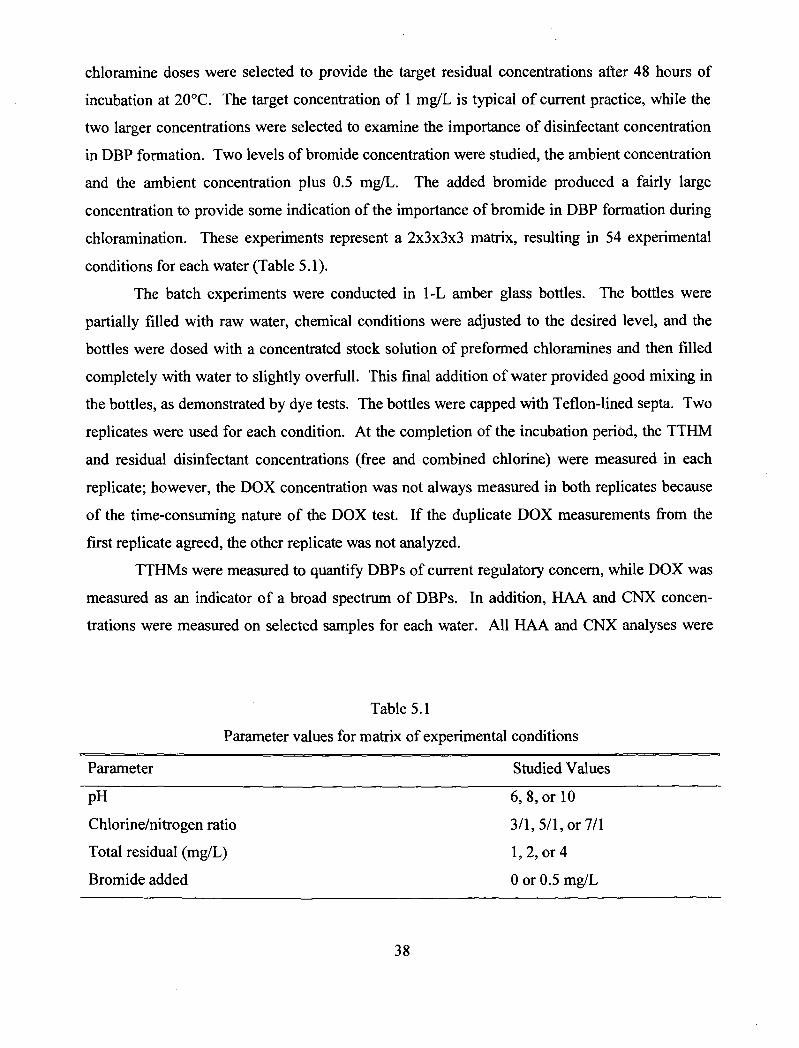
chloramine doses were selected to provide the target residual concentrations after 48 hours of
incubation at 20 C. The target concentration of 1 mg/L is typical of current practice, while the
two larger concentrations were selected to examine the importance of disinfectant concentration
in DBF formation. Two levels of bromide concentration were studied, the ambient concentration
and the ambient concentration plus 0.5 mg/L. The added bromide produced a fairly large
concentration to provide some indication of the importance of bromide in DBF formation during
chloramination. These experiments represent a 2x3x3x3 matrix, resulting in 54 experimental
conditions for each water (Table 5.1).
The batch experiments were conducted in 1-L amber glass bottles. The bottles were
partially filled with raw water, chemical conditions were adjusted to the desired level, and the
bottles were dosed with a concentrated stock solution of preformed chloramines and then filled
completely with water to slightly overfull. This final addition of water provided good mixing in
the bottles, as demonstrated by dye tests. The bottles were capped with Teflon-lined septa. Two
replicates were used for each condition. At the completion of the incubation period, the TTHM
and residual disinfectant concentrations (free and combined chlorine) were measured in each
replicate; however, the DOX concentration was not always measured in both replicates because
of the time-consuming nature of the DOX test. If the duplicate DOX measurements from the
first replicate agreed, the other replicate was not analyzed.
TTHMs were measured to quantify DBFs of current regulatory concern, while DOX was
measured as an indicator of a broad spectrum of DBFs. In addition, HAA and CNX concen
trations were measured on selected samples for each water. All HAA and CNX analyses were
Table 5.1
Parameter values for matrix of experimental conditions
Parameter Studied Values
~pti 6, 8, or 10
Chlorine/nitrogen ratio 3/1, 5/1, or 7/1
Total residual (mg/L) 1,2, or 4
Bromide added 0 or 0.5 mg/L
38
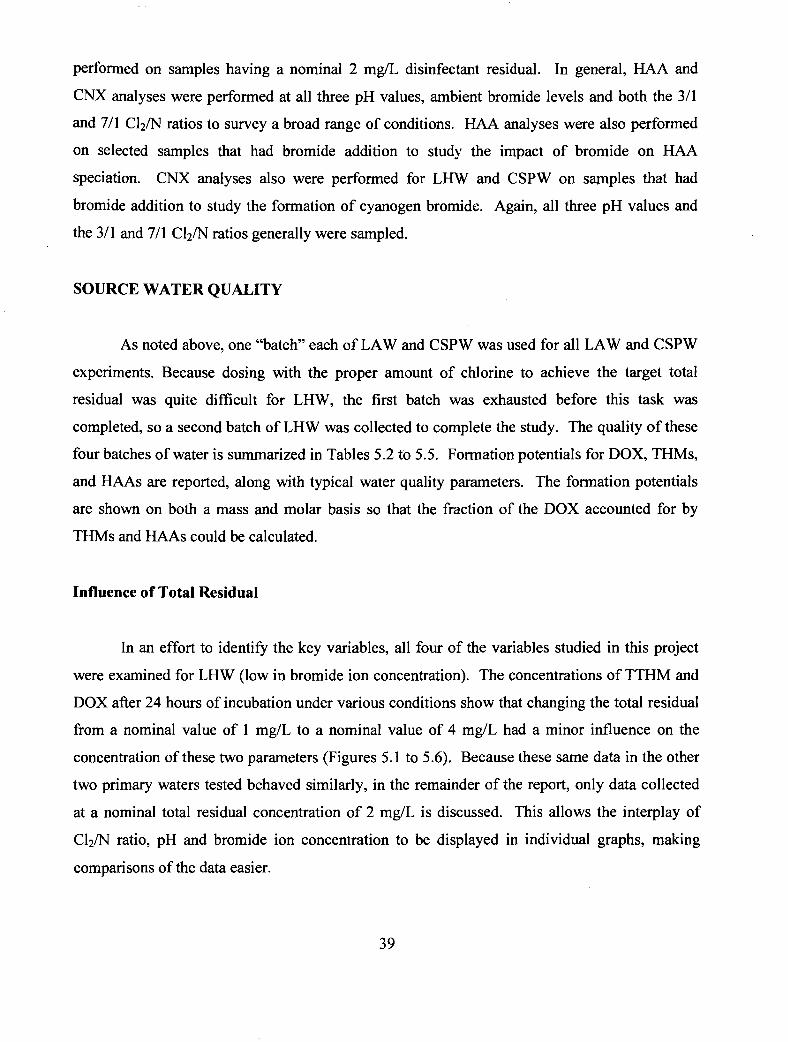
performed on samples having a nominal 2 mg/L disinfectant residual. In general, HAA and
CNX analyses were performed at all three pH values, ambient bromide levels and both the 3/1
and 7/1 Cfe/N ratios to survey a broad range of conditions. HAA analyses were also performed
on selected samples that had bromide addition to study the impact of bromide on HAA
speciation. CNX analyses also were performed for LHW and CSPW on samples that had
bromide addition to study the formation of cyanogen bromide. Again, all three pH values and
the 3/1 and 7/1 Cfe/N ratios generally were sampled.
SOURCE WATER QUALITY
As noted above, one "batch" each of LAW and CSPW was used for all LAW and CSPW
experiments. Because dosing with the proper amount of chlorine to achieve the target total
residual was quite difficult for LHW, the first batch was exhausted before this task was
completed, so a second batch of LHW was collected to complete the study. The quality of these
four batches of water is summarized in Tables 5.2 to 5.5. Formation potentials for DOX, THMs,
and HAAs are reported, along with typical water quality parameters. The formation potentials
are shown on both a mass and molar basis so that the fraction of the DOX accounted for by
THMs and HAAs could be calculated.
Influence of Total Residual
In an effort to identify the key variables, all four of the variables studied in this project
were examined for LHW (low in bromide ion concentration). The concentrations of TTHM and
DOX after 24 hours of incubation under various conditions show that changing the total residual
from a nominal value of 1 mg/L to a nominal value of 4 mg/L had a minor influence on the
concentration of these two parameters (Figures 5.1 to 5.6). Because these same data in the other
two primary waters tested behaved similarly, in the remainder of the report, only data collected
at a nominal total residual concentration of 2 mg/L is discussed. This allows the interplay of
C12/N ratio, pH and bromide ion concentration to be displayed in individual graphs, making
comparisons of the data easier.
39

Table 5.2
Quality of Lake Austin Water collected on 9/17/93
Parameter ConcentrationTOC, mg/L
Bromide, mg/L
DOXo, ug Cl/L
Free Chlorine Demand, mg/L
pH
Turbidity/
Alkalinity, mg CaCCb/L
DOXFP4THMFP4
CHC13
CHBrCl2
CHBr2Cl
CHBr3
THMFP
TTHMX
HAAFP4
MCAA
DCAA
TCAA
MBAA
DBAA
BCAA
HAAFP
THAAX
DBPXFP
Percent of DOXFP4
3.1
0.24
6.8
4.1
8.1
0.53
156
pH
Hg/L
839.5
21.6
36.1
32.4
3.9
94.0
3.5
18.0
34.6
28.6
12.4
0.0
97.1
6
Hmole/L
23.65
0.18
0.22
0.16
0.02
0.57
1.72
0.04
0.14
0.21
0.21
0.06
0.00
0.65
1.27
2.99
12.6
PH
ug/L
647.5
29.4
42.4
50.3
9.4
131.5
1.4
19.2
31.9
25.9
15.0
0.0
93.4
8
(imole/L
18.24
0.25
0.26
0.24
0.04
0.78
2.35
0.01
0.15
0.20
0.19
0.07
0.00
0.61
1.22
3.57
19.6
pH
Hg/L
524.0
46.5
61.0
68.4
22.7
198.6
1.6
18.1
28.0
26.5
21.2
0.0
95.4
10
umole/L
14.76
0.39
0.37
0.33
0.09
1.18
3.54
0.02
0.14
0.17
0.19
0.10
0.00
0.62
1.20
4.74
32.1
Note: "0" is concentration at time of sampling, "4" indicates after a 4-day incubation period
40

Table 5.3
Quality of Lake Houston water
Parameter
collected on 10/28/93
ConcentrationTOC, mg/L Bromide, mg/L DOX0, ug Cl/L Free Chlorine Demand, mg/L PH TurbidityAlkalinity, mg CaCO3/L
DOXFP4THMFP4
CHC13CHBrCbCHBr2ClCHBr3THMFPTTHMX
HAAFP4MCAADCAATCAAMBAADBAABCAAHAAFPTHAAX
DBPXFPPercent of DOXFP4
9.2 0.08 17.5 14.9 7.4 5225
PHug/L
IVD
203.236.72.61.4
243.9
10.796.2165.10.00.010.0
282.0
6umole/L
IVD
1.700.220.010.011.945.83
0.110.751.010.000.000.061.934.7510.58
*
PHug/L
IVD
291.350.74.00.0
346.0
12.1121.8147.00.00.014.5
295.4
8umole/L
IVD
2.440.310.020.002.778.30
0.130.940.900.000.000.082.064.8813.18
*
pHug/L
IVD
444.262.55.90.0
512.6
6.9123.162.40.00.015.1
207.5
10umole/L
IVD
3.720.380.030.004.1312.38
0.070.960.380.000.000.091.503.3015.68
*
Note: "0" is concentration at time of sampling, "4" indicates after a 4-day incubation periodIVD = invalid data* Cannot be calculated because DOXFP4 data were invalid
41

Table 5.4
Quality of Lake Houston water collected on 2/22/94
Parameter Concentration
TOC, mg/L
Bromide, mg/L
DOXo, ug Cl/L
Free Chlorine Demand, mg/L
Turbidity
Alkalinity, mg CaCO3/L
DOXFP4THMFP4
CHC13
CHBrCb
CHBr2Cl
CHBr3
THMFP
TTHMX
HAAFP4
MCAA
DCAA
TCAA
MBAA
DBAA
BCAA
HAAFP
THAAX
DBPXFPPercent of DOXFP4
6.7
0.075
35.7
12.3
56
46.8
pHHg/L
2513
186.5
27.2
2.8
0.3
216.8
1.3
110.2
208.6
0.0
0.0
15.4
335.5
6umole/L
70.8
1.56
0.17
0.01
0.00
1.74
5.22
0.01
0.85
1.28
0.00
0.00
0.09
2.23
5.73
10.9515.5
pHHg/L
2125
313.1
46.5
3.8
0.3
363.7
15.9
163.7
201.0
0.0
0.0
23.7
404.3
8umole/L
59.9
2.62
0.28
0.02
0.00
2.92
8.77
0.17
1.27
1.23
0.00
0.00
0.14
2.80
6.67
15.4425.8
pHlig/L
1158
61.0
68.4
22.7
152.1
16.7
131.9
58.3
0.0
0.0
20.9
227.8
10umole/L
32.6
0.00
0.37
0.33
0.09
0.79
2.37
0.18
1.02
0.36
0.00
0.00
0.12
20.90
3.53
5.9118.1
Note: "0" is concentration at time of sampling, "4" indicates after a 4-day incubation period
42

Table 5.5
Quality of California State Project water collected on 12/9/93
Parameter Concentration
TOC, mg/L
Bromide, mg/L
DOXo, ug Cl/L
Free Chlorine Demand, mg/L
PH
Turbidity
Alkalinity, mg CaCO3/L
DOXFP4
THMFP4
CHC13
CHBrCl2
CHBr2Cl
CHBr3
THMFP
TTHMX
HAAFP4
MCAA
DCAA
TCAA
MBAA
DBAA
BCAA
HAAFP
THAAX
DBPXFP
Percent of DOXFP4
2.4
0.103
2.5
5.3
7.6
0.5
73
pH
ug/L
365.5
65.2
55.4
24.0
16.0
160.6
0.0
21.3
40.4
0.0
0.0
12.8
74.5
6
umole/L
10.29
0.55
0.34
0.12
0.06
1.06
3.19
0.00
0.17
0.25
0.00
0.00
0.07
0.49
1.22
4.41
42.8
pH
Hg/L
375.4
121.7
87.8
46.0
3.8
259.3
0.0
30.9
25.0
0.0
0.0
18.4
74.3
8
(amole/L
10.57
1.02
0.54
0.22
0.02
1.79
5.37
0.00
0.24
0.15
0.00
0.00
0.11
0.50
1.15
6.52
61.7
pH
Hg/L I
398.6
176.4
70.2
41.3
7.6
295.5
8.3
25.7
5.8
0.0
0.0
15.7
55.5
10
imole/L
11.23
1.48
0.43
0.20
0.03
2.13
6.40
0.09
0.20
0.04
0.00
0.00
0.09
0.41
0.77
7.17
63.9
Note: "0" is concentration at time of sampling, "4" indicates after a 4-day incubation period
43
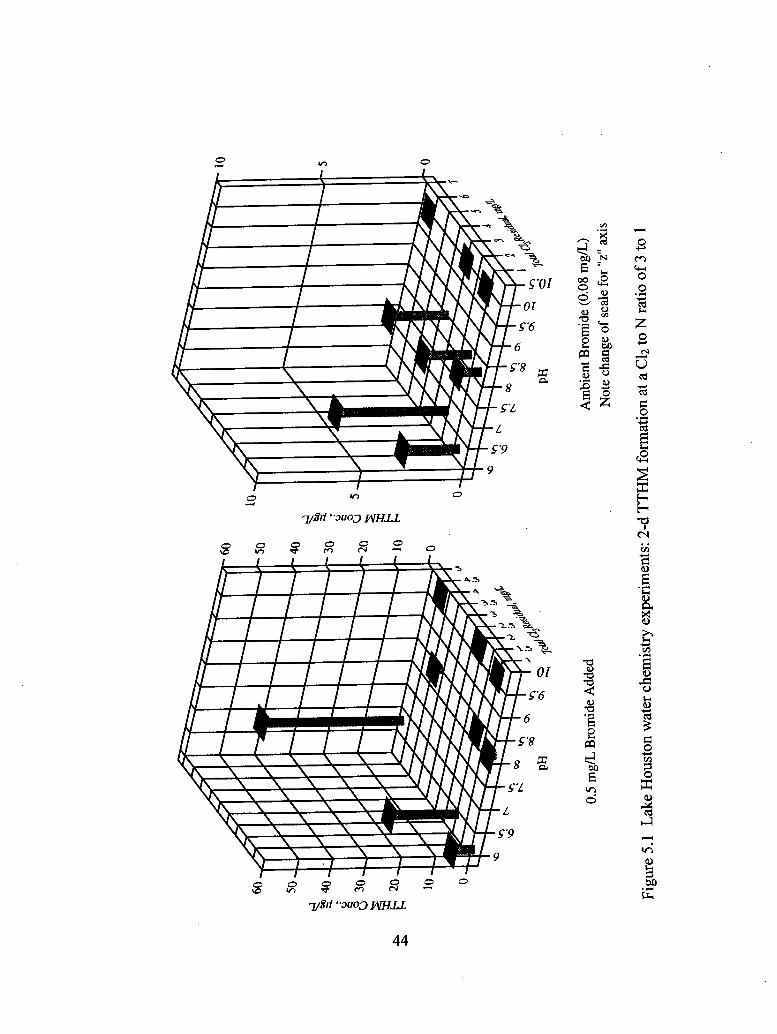
PH
0.5
mg/
L Br
omid
e A
dded
Figu
re 5
.1
Lak
e H
oust
on w
ater
che
mis
try
expe
rim
ents
: 2-
d T
TH
M f
orm
atio
n at
a C
12 to
N r
atio
of 3
to
1
Am
bien
t Bro
mid
e (0
.08
mg/
L)
Not
e ch
ange
of s
cale
for
"z"
axis

300
b 25o
f
200
1
150
100 50 0
I I
PH
0.5
mg/
L B
rom
ide
Add
edA
mbi
ent B
rom
ide
(0.0
8 m
g/L)
Figu
re 5
.2 L
ake
Hou
ston
wat
er c
hem
istry
exp
erim
ents
: 2-d
DO
X fo
rmat
ion
at a
C\2
to N
ratio
of 3
to 1

ON
PH
0.5
mg/
L B
rom
ide
Add
edA
mbi
ent B
rom
ide
(0.0
8 m
g.L)
Figu
re 5
.3 L
ake
Hou
ston
wat
er c
hem
istr
y ex
perim
ents
: 2-
d T
TH
M f
orm
atio
n at
a C
12 to
N ra
tio o
f 5 to
1

§ '
PH
0.5
mg/
L B
rom
ide
Add
ed
PH
Am
bien
t Bro
mid
e ( 0
.08
mg/
L)
Figu
re 5
.4 L
ake
Hou
ston
wat
er c
hem
istry
exp
erim
ents
: 2-
d D
OX
for
mat
ion
at a
Ch
to N
rat
io o
f 5 to
1

OO
PHPH
0.5
mg/
L B
rom
ide
Add
edA
mbi
ent B
rom
ide
(0.0
8 m
g/L
)
Figu
re 5
.5
Lak
e H
oust
on w
ater
che
mis
try
expe
rim
ents
: 2-
d TT
HM
for
mat
ion
at a
Cb
to N
rat
io o
f 7 to
1

8
10PH
11
0.5
mg/
L B
rom
ide
Add
edA
mbi
ent B
rom
ide
(0.0
8 m
g/L
)
Figu
re 5
.6 L
ake
Hou
ston
wat
er c
hem
istr
y ex
perim
ents
: 2-
d D
OX
for
mat
ion
at a
Cb
to N
ratio
of 7
to 1

INFLUENCE OF pH, C12/N MASS RATIO, BROMIDE ION
Residual Species—Monochloramine/Dichloramine
Figure 5.7 shows the dichloramine to total residual ratio after 48 hours in LAW.
Appreciable dichloramine concentrations were observed only at pH 6. At pH 8 and 10, either
very little dichloramine was formed or it decomposed before the 48-hour measurement. As
expected, the dichloramine to total residual ratio increased with increasing Ch/N ratio. When the
water was spiked with bromide, the dichloramine to total residual ratio decreased at all chlorine
to nitrogen ratios. Considering that chloramines were first formed in bromide-free water and
then samples were dosed with the solution of preformed chloramines, the implication is that free
chlorine and dichloramine were consumed in reactions with bromide. The total chlorine demand
of the water was greater with bromide addition, which provides additional evidence of reactions
with bromide and suggests that the brominated species decomposed before the 48-hour
measurement, as expected. Presumably, chloramine hydrolysis and decomposition (to yield free
chlorine and subsequently free bromine), bromide substitution into the chloramines, or both
would be the mechanisms for bromamine production under such conditions. The further
implication is that more bromine substitution of organic matter will occur as the bromide
concentration increases.
The dichloramine to total residual ratio after 48 hours in LHW (Figure 5.8) was similar to
LAW in that appreciable concentrations were observed only at pH 6. LHW, however, showed a
much smaller decrease in dichloramine concentration in response to bromide addition than did
LAW. This dampened response suggests that less formation of free and combined bromine may
have occurred in this water. It is unclear whether the difference between the two waters is
attributable to differences in inorganic or organic chemistry. LHW has more TOC and much less
alkalinity/hardness as compared with LAW (Table 5.2 to 5.4).
The effect of bromide on the dichloramine to total residual ratio in CSPW (Figure 5.9)
was similar to that observed in Lake Austin, especially at Ch/N ratios of 7/1 and 5/1. This is
again suggestive of significant formation of free or combined bromine. The TOC in CSPW is
similar to that of LAW, and the alkalinity is intermediate between LHW and LAW. Thus, the
data suggest that either a high TOC concentration or low alkalinity "stabilizes" the dichloramine
50

0.5
mg/
L B
rom
ide
Add
ed
Am
bien
t Bro
mid
e (0
.24
mg/
L)
Figu
re 5
.7 L
ake
Aus
tin w
ater
, bat
ch s
tudi
es, d
ichl
oram
ine
resi
dual
s as
a p
erce
ntag
e of
tota
l res
idua
l as
a fu
nctio
n of
Cfe
/N
ratio
and
pH
at a
tota
l res
idua
l chl
orin
e of 2
mg/
L
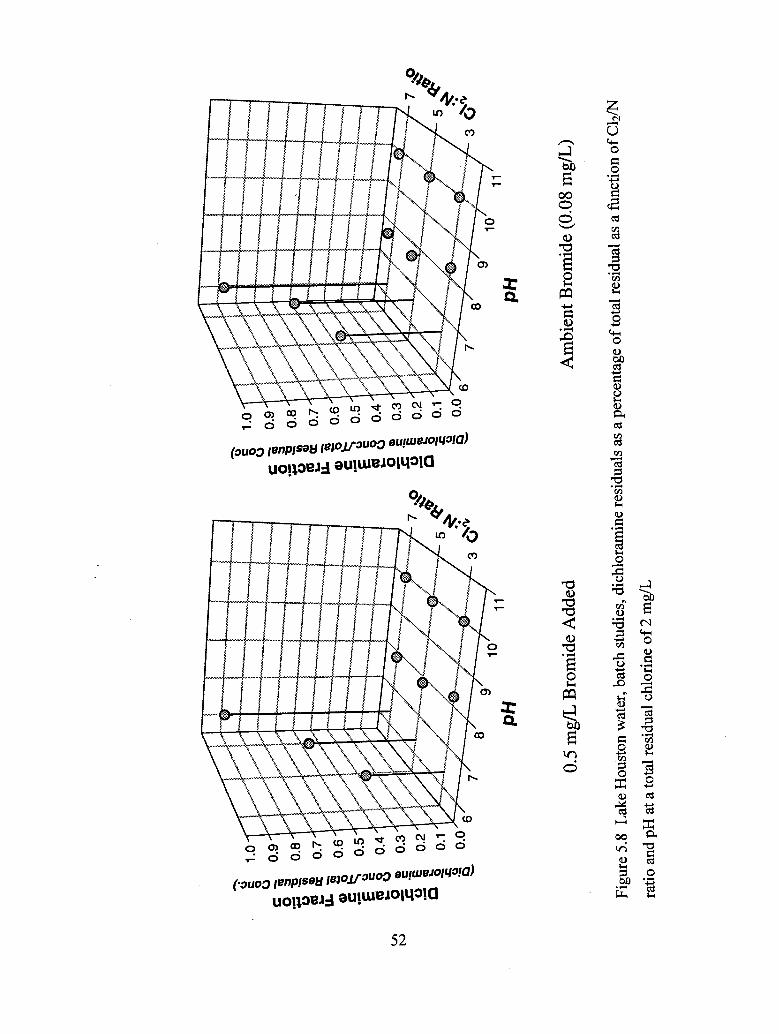
to
•—
Q.5
mg/
L B
rom
ide
Add
edA
mbi
ent B
rom
ide
(0.0
8 m
g/L
)
Figu
re 5
.8 L
ake
Hou
ston
wat
er, b
atch
stu
dies
, dic
hlor
amin
e re
sidu
als
as a
per
cent
age
of to
tal r
esid
ual a
s a
func
tion
of C
fe/N
ratio
and
pH
at a
tota
l res
idua
l chl
orin
e of
2 m
g/L

u>
11'
0.5
mg/
L B
rom
ide
Add
ed
of C
12/N
ratio
and
PH
at a
tota
l res
idua
l chl
orin
e of
2 m
g/L
Am
bien
t Bro
mid
e (0
.10
mg/
L)
as a
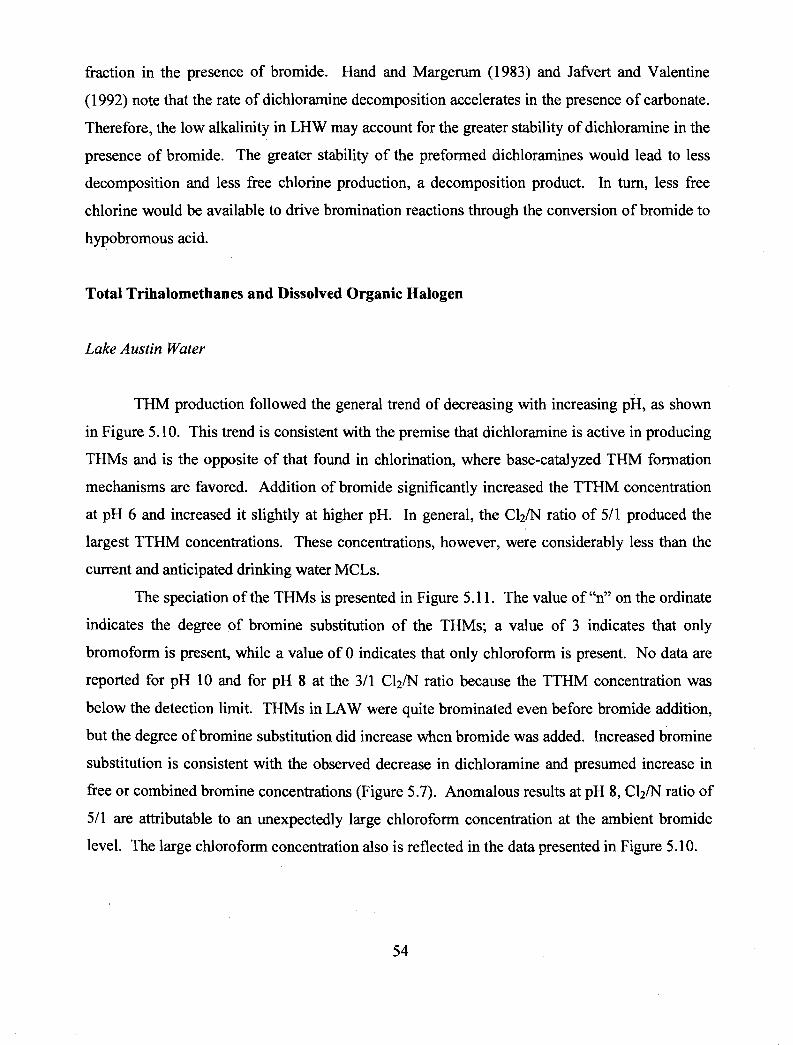
fraction in the presence of bromide. Hand and Margerum (1983) and Jafvert and Valentine
(1992) note that the rate of dichloramine decomposition accelerates in the presence of carbonate.
Therefore, the low alkalinity in LHW may account for the greater stability of dichloramine in the
presence of bromide. The greater stability of the preformed dichloramines would lead to less
decomposition and less free chlorine production, a decomposition product. In turn, less free
chlorine would be available to drive bromination reactions through the conversion of bromide to
hypobromous acid.
Total Trihalomethanes and Dissolved Organic Halogen
Lake Austin Water
THM production followed the general trend of decreasing with increasing pH, as shown
in Figure 5.10. This trend is consistent with the premise that dichloramine is active in producing
THMs and is the opposite of that found in chlorination, where base-catalyzed THM formation
mechanisms are favored. Addition of bromide significantly increased the TTHM concentration
at pH 6 and increased it slightly at higher pH. In general, the Cb/N ratio of 5/1 produced the
largest TTHM concentrations. These concentrations, however, were considerably less than the
current and anticipated drinking water MCLs.
The speciation of the THMs is presented in Figure 5.11. The value of "n" on the ordinate
indicates the degree of bromine substitution of the THMs; a value of 3 indicates that only
bromoform is present, while a value of 0 indicates that only chloroform is present. No data are
reported for pH 10 and for pH 8 at the 3/1 C12/N ratio because the TTHM concentration was
below the detection limit. THMs in LAW were quite brominated even before bromide addition,
but the degree of bromine substitution did increase when bromide was added. Increased bromine
substitution is consistent with the observed decrease in dichloramine and presumed increase in
free or combined bromine concentrations (Figure 5.7). Anomalous results at pH 8, Cb/N ratio of
5/1 are attributable to an unexpectedly large chloroform concentration at the ambient bromide
level. The large chloroform concentration also is reflected in the data presented in Figure 5.10.
54

0.5
mg/
L B
rom
ide
Add
edA
mbi
ent B
rom
ide
(0.2
4 m
g/L)
n 5
me/
L B
rom
ide
AUUC
U
- f r
i /N
ratio
and
PH
at a
nom
inal
tota
l res
idua
lch
lori
ne o
f 2 m
g/L

o
Io ffl
2 -
1 -
O,
C !LJ pH 6, Ambient Br BB pH 8, Ambient Br
E3pH6, Br'added ESS pH 8, Br'added
3to1 5to1 CI2:N Ratio
7to1
Figure 5.11 Degree of bromination of THMs in Lake Austin water
The DOX data (Figure 5.12) give a more complete view of overall DBF formation. Most
of the data follow the general trend of decreasing DBF formation with increasing pH. The key
exception is at pH 8 and a C12/N ratio of 5/1, where a DOX peak occurred with and without
bromide addition. Bromide addition accentuated the production of DOX for nearly all
conditions. Although the DOX analysis cannot differentiate between chlorinated and brominated
organics, the increased production of DOX with bromide addition strongly suggests that
brominated DBFs were formed. Moreover, the DOX measurement underestimates the bromide
impact on a mass basis because it measures all halogens as chloride and because bromide has a
higher molecular weight than chloride.
The DOX data at pH 6 showed some correlation to the dichloratnine concentration
(Figure 5.7). At the ambient bromide concentration, both the DOX concentration and the
dichloramine fraction increased as the C^/N ratio increased, suggesting that dichloramine played
an important role in DOX formation. With bromide addition, the DOX concentration and the
56

300
o o> 3 x o 0
300
250
200
0.5
mg/
L B
rom
ide
adde
dA
mbi
ent B
rom
ide
(0.2
4 m
g/L
)
Figu
re 5
.12
Lake
Aus
tin w
ater
, bat
ch s
tudi
es, D
OX
(ug
C1Y
L) a
s a
func
tion
of C
b/N
ratio
and
pH
at a
nom
inal
tota
l
resi
dual
chl
orin
e of
2 m
g/L

dichloramine fraction again increased as the Cb/N ratio increased; however, their responses
relative to those measured at the ambient bromide concentration differed. The DOX concen
tration with bromide addition was substantially larger at each Cla/N ratio, while the dichloramine
fraction was substantially smaller. These data imply that the addition of bromide caused the
production of brominated species at the expense of dichloramine and that these brominated
species were more reactive with organic matter than the chlorinated species, resulting in a greater
production of DOX.
The peaks in DOX and TTHM concentrations at pH 8 and a Cli/N ratio of 5/1 are
difficult to explain. No dichloramine was present at pH 8 after 48 hours (Figure 5.7), and Jafvert
and Valentine (1992) note that dichloramine decays rapidly at pH 8. Therefore, dichloramine's
role in DOX and TTHM formation was probably much less than at pH 6, where a dichloramine
residual was maintained throughout the incubation period. Other, more reactive chlorinated and
brominated species must have formed. Possibilities include acid-catalyzed reactions with
monochloramine and bromochloramine. NHsCl* is a powerful chlorinating agent and exists in
equilibrium with monochloramine (Snyder and Margerum 1982). Unfortunately, the complexity
of haloamine chemistry at mid-range pH precludes identification of the reactive species without
some more fundamental, highly-controlled experiments, which were beyond the scope of this
work. Although the large peak in DOX concentration at pH 8 might be of some concern, the
results also point to a solution to the problem through modification of the Ch/N ratio. The DOX
concentration was much smaller at both the 3/1 and 7/1 Ch/N ratios. Reasons for the sensitivity
of DOX formation to the Cb/N ratio likewise are not apparent.
Dichloramine was cited above as a likely halogenating agent at pH 6. DBF formation by
NHaCl"1" and acid-catalyzed reactions with monochloramine also may have occurred at pH 6,
although the smaller monochloramine concentration at pH 6, relative to pH 8, may have limited
their influence. Little DBF formation by these mechanisms would be expected at pH 10 because
of the small proton concentration, as illustrated by Snyder and Margerum (1982) in studies with
amines.
58

Lake Houston Water
As with LAW, the TTHM concentrations (Figure 5.13) generally decreased with
increasing pH. The addition of bromide stimulated some additional TTHM production, but the
impact was smaller than in LAW. This is in keeping with the smaller effect of bromide on the
dichloramine to total residual ratio in LHW (Figure 5.8) and the resulting presumption of smaller
free and combined bromine concentrations. A noticeable exception to the general trend occurred
near pH 8 at the 7/1 Cb/N ratio, where a concentration peak was observed, especially with
bromide addition. Even here, however, the TTHM concentration of approximately 40 ng/L was
below current and anticipated regulatory levels. As expected, the addition of bromide increased
the degree of bromine substitution of the THMs (Figure 5.14), but the degree of bromine
substitution was still much smaller than observed in LAW. As with LAW, the smallest value of
n in the presence of added bromide occurred at a Cb/N ratio of 5/1.
The DOX concentration was quite sensitive to the Cb/N ratio and pH and quite
insensitive to the bromide concentration (Figure 5.15). DOX showed even less dependence than
TTHMs on the added bromide. The correlation between dichloramine concentration and DOX
concentration at pH 6 was not nearly as strong as in LAW. The smallest DOX concentration
occurred at the 7/1 Cb/N ratio, which corresponded to the largest dichloramine fraction,
approximately 0.9 (Figure 5.8). These data suggest that species in addition to dichloramine may
be important in DOX formation at pH 6. As was suggested for LAW, NH3C1+ and acid-catalyzed
reactions with monochloramine may be important mechanisms for DBF formation at pH 6.
Thus, the very low concentration of monochloramine at the 7/1 Cb/N ratio may account for the
small DOX formation.
Relatively large DOX concentrations also were observed near pH 8 for the 5/1 and 7/1
Cb/N ratios. As noted above, the maximum TTHM concentration occurred near pH 8 at the 7/1
Cb/N ratio. As with LAW, essentially no dichloramine was measured at pH 8 and 10 after 48
hours; therefore, species other than dichloramine, such as NHsCl+ and acid-catalyzed reactions
with monochloramine, probably played a significant role in DOX formation. The DOX
concentration did decrease considerably near pH 8 at the 3/1 Cb/N ratio. Thus, as with LAW,
59

ON
O
0.5
mg/
L B
rom
ide
Add
edA
mbi
ent B
rom
ide
(0.0
8 m
g/U
O
fcl2
/Nra
,io an
d pH
atan
omin
alto
ta, r
esid
ual
chlo
rine
of 2
mg/
L

c _o
I 2
ICD
0) 0)
0
pH 6, Ambient Br pH 6, Br" added
pH 8, Ambient Br" pH 8, Br" added
Cl3to1 5to1
CI2 :N Ratio7 to 1
Figure 5.14 Degree of bromination of THMs in Lake Houston water
testing of different Cb/N ratios on a water source undergoing chloramination may be warranted
to find a ratio that meets disinfection needs while minimizing DBF production.
California State Project Water
In CSPW, the data, without significant exceptions, followed the general trend outlined
above of lower DBF concentration with increasing pH and decreasing CVN ratio, as shown in
Figure 5.16 for TTHMs and Figure 5.17 for DOX. The increased TTHM and DOX
concentrations with bromide addition are again suggestive of the occurrence of bromine
substitution reactions. The THM speciation data (Figure 5.18) further support the occurrence of
bromine substitution reactions, as the n value increased with bromide addition for all conditions
producing measurable THM concentrations.
61

ON
NJ
300
300
0.5
mg/
L B
rom
ide
Add
ed
Am
bien
t Bro
mid
e (0
.08
mg/
L)
Figu
re 5
.15
Lak
e H
oust
on w
ater
, bat
ch s
tudi
es, D
OX
(ug
C17
L) a
s a
func
tion
of C
12/N
ratio
and
pH
at a
nom
inal
tota
l res
idua
l
chlo
rine
of 2
mg/
L

ON u>
X
0.5
mg/
L B
rom
ide
Add
edA
mbi
ent B
rom
ide
(0.1
0 m
g/L
)
Figu
re 5
.16
Cal
ifor
nia
Stat
e Pr
ojec
t wat
er, b
atch
stu
dies
, TT
HM
(|ig
/L)
as a
fun
ctio
n of
C12
/N r
atio
and
pH
at a
nom
inal
tota
l
resi
dual
chl
orin
e of
2 m
g/L
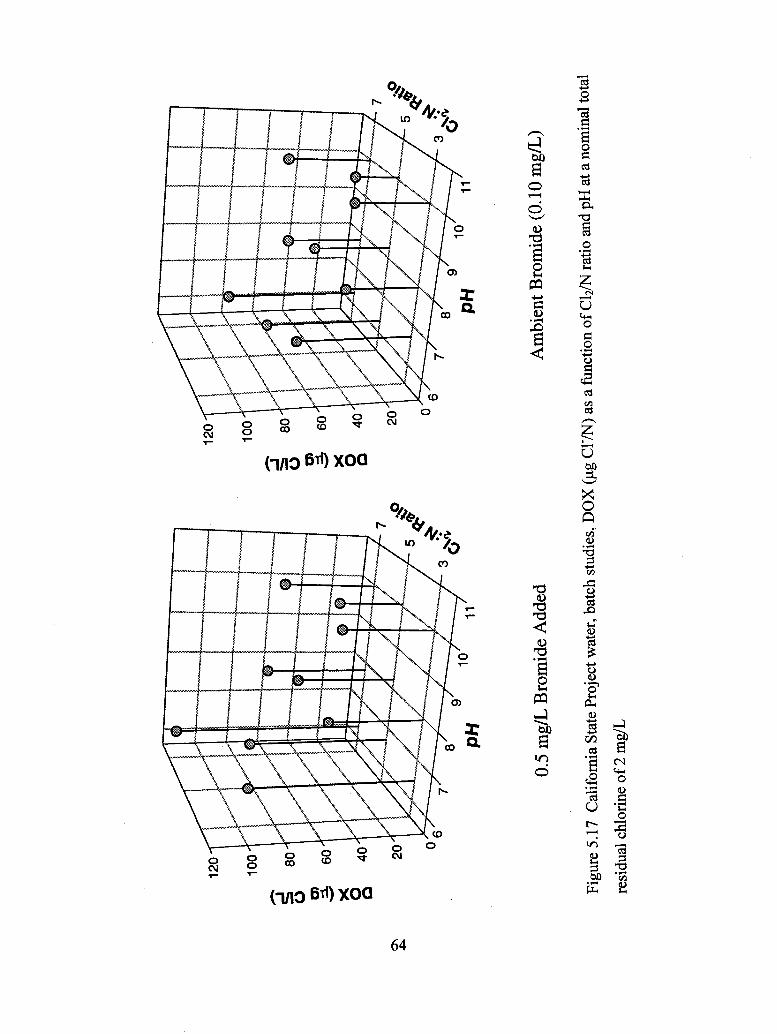
120
100
o O) a X o o
20
0.5
mg/
L B
rom
ide
Add
edA
mbi
ent B
rom
ide
(0.1
0 m
g/L
)
Figu
re 5
.17
Cal
ifor
nia
Stat
e Pr
ojec
t wat
er, b
atch
stu
dies
, DO
X (
ug C
17N
) as
a fu
nctio
n
resi
dual
chl
orin
e of
2 m
g/L
ratio
and
pH
at a
nom
inal
tota
l

« 2 -^
ICDH
O
D)
{§
C
pH 6, Ambient Br pH 6, Br" added
pH 8, Ambient Br pH 8, Br" added
3to1 5to1 CI2 :N Ratio
7to1
Figure 5.18 Degree of bromination of THMs in California State Project water
Haloacetic Acids and Cyanogen Halides
Lake Austin Water
The HAA6 and CNX concentrations for LAW are shown in Figure 5.19. In general, the
concentrations of both classes of chemicals increased as the pH decreased and the Cb/N ratio
increased. The dihalogenated species (DCAA, BCAA, DBAA) were the dominant HAAs. Of
these, DBAA was present at the largest concentration because of the relatively large ambient
bromide concentration (0.24 mg/L). Similarly, the CNBr concentration was greater than the
CNC1 concentration at pH 6 and 8. CNX is unstable at pH 10, so very low concentrations of
both CNBr and CNC1 were observed.
65

12.5 0.
0
Am
bien
t Bro
mid
e (0
.24
mg/
L)
Am
bien
t Bro
mid
e (0
.24
mg/
L)
Figu
re 5
.19
Lak
e A
ustin
wat
er, b
atch
stu
dies
, HA
A6
(ng/
L)
and
CN
X (
ug/L
) as
a f
unct
ion
of C
12/N
rat
io a
nd p
H a
t a
nom
inal
tota
l res
idua
l chl
orin
e of
2 m
g/L

Lake Houston Water
The HAA6 concentrations for LHW are presented in Figure 5.20. The HAA6
concentration was greater than in Lake Austin, reaching levels under some conditions that might
be of future regulatory concern. As with Lake Austin, the HAA6 concentration increased as the
pH decreased and the Cli/N ratio increased. The addition of bromide did not have a large effect
on the HAA6 concentration, but the speciation of HAAs shifted toward the brominated
chemicals. Again, the dihalogenated species dominated, with DCAA present at the largest
concentration under ambient conditions and BCAA at the largest concentration when bromide
was added to the water. The CNX concentrations were also larger than in Lake Austin (Figure
5.21), especially at pH 8 and the 5/1 and 7/1 Cli/N ratios. In the absence of bromide addition,
CNC1 dominated the CNX because of the low ambient bromide concentration in Lake Houston.
With bromide addition, the CNX concentrations increased and CNBr was formed, with CNBr
generally dominating at pH 6 and CNC1 still dominating at pH 8 and 10. Again, low
concentrations of CNX were observed at pH 10, as expected.
California State Project Water
The HAA6 concentrations for eight CSPW samples are presented in Figure 5.22. The
trends observed in the other two waters held at pH 6 and 8; the HAA6 concentration increased as
the pH decreased and the C^/N ratio increased. The HAA6 concentrations at pH 10 were larger
than would be expected based on the trends observed in LAW and LHW. The HAA6
concentrations were similar to those observed with LAW and less than those observed in LHW.
The addition of bromide also significantly increased the HAA6 concentration. The three
dihalogenated species dominated the HAAs under ambient conditions (0.10 mg/L Br"), while
BCAA and DBAA were the only HAAs present when bromide was added. The production of
the dihalogenated acetic acids in all three waters indicates that the use of chloramines may not
control these DBFs particularly well. Therefore, dihalogenated acetic acids may be of concern in
some chloraminated waters in meeting anticipated future regulations.
67

50
oo
0.5
mg/
L B
rom
ide
Add
edA
mbi
ent B
rom
ide
(0.0
8 m
g/L
)
Figu
re 5
.20
Lake
Hou
ston
wat
er, b
atch
stu
dies
, HA
A6
(|ag/
L) a
s a
func
tion
of C
12/N
rat
io a
nd p
H a
t a n
omin
al to
tal r
esid
ual
chlo
rine
of 2
mg/
L

0.5
mg/
L B
rom
ide
Add
edA
mbi
ent B
rom
ide
(0.0
8 m
g/L
)
Figu
re 5
.21
Lake
Hou
ston
wat
er, b
atch
stu
dies
, CN
X (
ng/L
) as
a fu
nctio
n of
Cb/
N ra
tio a
nd p
H a
t a n
omin
al to
tal r
esid
ual
chlo
rine
of 2
mg/
L
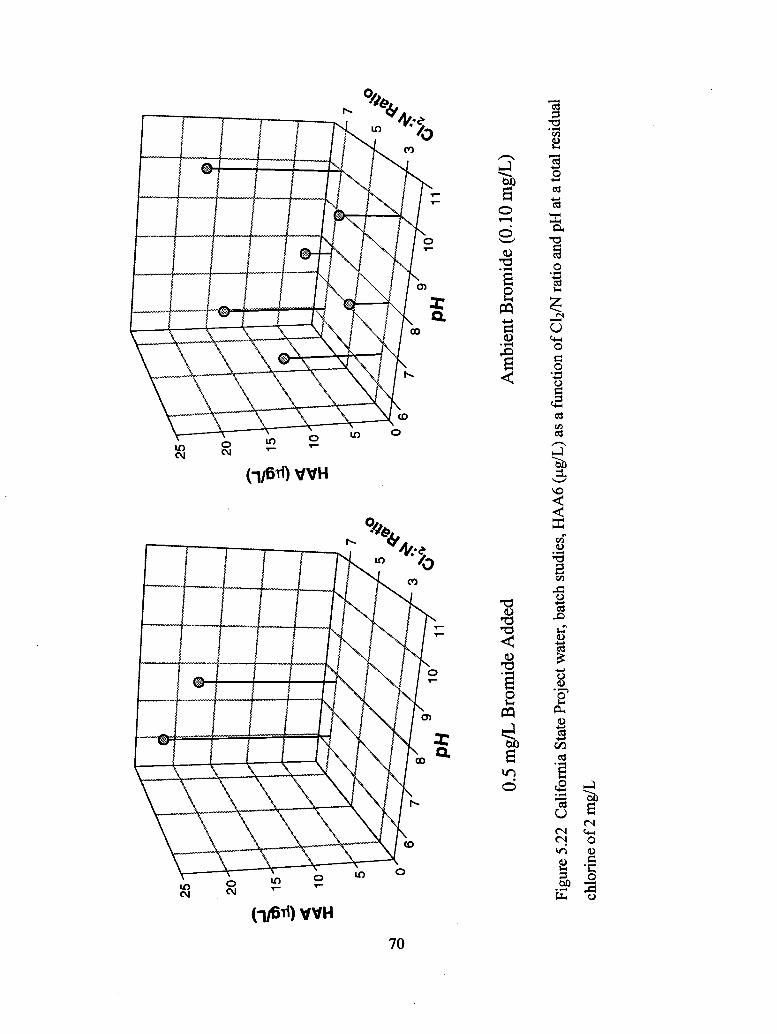
2525
0.5
mg/
L B
rom
ide
Add
edA
mbi
ent B
rom
ide
(0.1
0 m
g/L
)
Figu
re 5
.22
Cal
ifor
nia
Stat
e Pr
ojec
t wat
er, b
atch
stu
dies
, HA
A6
(ug/
L)
as a
func
tion
of C
b/N
rat
io a
nd p
H a
t a to
tal r
esid
ual
chlo
rine
of 2
mg/
L
The CNX (Figure 5.23) was approximately evenly split between CNC1 and CNBr at
ambient conditions, with CNBr dominating when bromide was added. As with the two other
waters, the maximum CNX concentration occurred at pH 8, which suggests that dichloramine is
not the primary species involved in CNX production. Again, NHaCl* and acid-catalyzed
reactions with monochloramine may be more important.
Recovery of Dissolved Organic Halogen With 12 Measured Disinfection By-Products
As noted above, during Task la, certain samples were selected for additional DBF SDS
analyses beyond the SDS THMs and SDS DOX determinations. These selected samples were
also tested for SDS HAA6 and SDS CNC1 and SDS CNBr. Thus, in these samples, after the 48
hours of incubation, 12 DBFs were measured, as well as DOX.
In an effort to determine the qualitative magnitude of the "unknown" halogen-substituted
DBFs that were being formed in these samples, each of the 12 measured DBFs was converted to
umol/L of DOX that it would have contributed to the DOX measurement. The recoveries noted
in Table 4.1 were used in making this calculation. These 12 "DOX equivalencies" were then
summed and compared to the measured DOX concentration. These comparisons are reported as
percentages ((Z 12 Measured DBPOX/DOX) (100)) in Figures 5.24 through 5.26 for the Task la
samples.
The most striking feature of these three figures is that the recovery values are all 35
percent or less, several less than 5 percent. These data tend to be quite variable because of
analytic error in the 12 DBF measurements as well as the analytic error in the DOX
determination. This may be the cause of .the lack of clear trends. In general, the recovery
percentage is lower at the 3/1 Cb/N weight ratio as compared to the 7/1 Cb/N weight ratio.
Recall in the work of Singer et al. (1992) that the slope of the best fit line through the
data was about one-third of the slope of a 100 percent recovery line. Thus, with both free
chlorine and chloramine, a large concentration of "unidentifiable" halogen-substituted DBFs are
formed in the application of these oxidants.
71

to
•W
0.5
mg/
L B
rom
ide
Add
edA
mbi
ent B
rom
ide
(0.1
0 m
g/L
)
Figu
re 5
.23
Cal
ifor
nia
Stat
e Pr
ojec
t wat
er, b
atch
stu
dies
, CN
X (
ug/L
) as
a fu
nctio
n of
C12
/N r
atio
and
pH
at a
tota
l res
idua
l
chlo
rine
of 2
mg/
L

Ambient Bromide (0.24 mg/L) 2 mg/L total residual after 48 hrs.
Figure 5.24 Lake Austin water chemistry experiments: Micromolar percentage of 2-d DOX
identified by summing the 12 measured 2-d DBFs at different pHs and Cla/N ratios
73

Ambient Bromide (0.25 mg/L) 2 mg/L total residual after 48 his.
Figure 5.25 Lake Houston water chemistry experiments: Micromolar percentage of 2-d DOX
identified by summing the 12 measured 2-d DBFs at different pHs and Cb/N ratios
74

gQ
1
II
Ambient Bromide (0.10 mg/L) 2 mg/L total residual after 48 hrs.
Figure 5.26 California State Project water chemistry experiments: Micromolar percentage of
2-d DOX identified by summing the 12 measured 2-d DBPs at different pHs and C^/N ratios
75


CHAPTER 6 CONTROLLED BENCH-SCALE MIXING STUDIES—TASK Ib
OBJECTIVES
The experiments investigated the impact of mixing at the point of ammonia and chlorine
addition on DBF formation. In particular, the relative importance of system chemistry versus
mixing conditions in DBF formation was of interest. Two underlying questions motivated the
design of these experiments. First, can inadequate mixing exacerbate DBF formation under
conditions in which the system chemistry favors DBF formation? Second, can inadequate
mixing cause significant DBF formation under conditions in which the system chemistry leads to
little DBF formation? These questions were investigated in a series of batch mixing experiments
in which chlorine and ammonia solutions were dosed either simultaneously or with a specified
delay in dosing ammonia.
EXPERIMENTAL APPROACH
The experiments were conducted in a jar test apparatus at various known values of G
(mean velocity gradient). The main experimental variables were the mixing intensity and the
relative timing in dosing the chlorine and ammonia solutions. Results from the chemistry
experiments were used to select conditions in which mixing intensity may play an important role.
Therefore, a smaller number of conditions were evaluated for each water than in the chemistry
experiments.
The experiments were conducted in 2-L beakers that had Plexiglas baffles installed
according to the pattern of Lai et al. (1975). The calibration curve of Cornwell and Bishop
(1983) was used to calculate G as a function of impeller speed. A correction factor for water
depth was applied based on the formula developed by Cornwell and Bishop (1983). The beakers
were also equipped with two dosing funnels of the design proposed by Hudson (1981) to
reproducibly deliver the chlorine and ammonia dosing solutions to the same location in each
vessel.
7.7

The dosing solutions were delivered to the beakers simultaneously. Simultaneous dosing
was accomplished using an apparatus, shown schematically in Figure 6.1, consisting of an axial
dowel with twelve 20-mL test tubes connected to it. The tubes were connected to a short piece
of bronze pipe with an inner diameter slightly larger than the outer diameter of the dowel. The
bronze pipe was slipped onto the dowel. The connection between the test tube and the pipe was
made near the top of the test tube so that the tubes would be upright when at rest. The test tubes
were affixed to the axial dowel in two batteries of six tubes each, each battery being free to rotate
about the shaft as a group. One set of tubes was used for the chlorine solution, the other for the
ammonia solution. The mouth of each test tube was aligned with one of the funnels when the
tubes were rotated into the pouring position. Thus, when the tubes were filled with the
appropriate solution, upon rotation of the tubes, the solution was discharged from the tubes into
the beakers simultaneously.
The mixing pattern was established in each beaker before the dosing solutions were
applied. Mixing continued for 1 minute after the completion of dosing. Samples were then
transferred rapidly to amber bottles and held for 48 hours at 22 C. As with the chemistry
experiments, the THM and DOX concentrations were measured for all samples at the end of the
incubation period. HAA and CNX concentrations were measured on selected samples. Residual
disinfectant concentration was measured after 48 hours.
A standard jar test apparatus allows six samples to be run simultaneously, with the
mixing intensity the same in each sample. One sample was used as a control and was dosed with
preformed chloramines; therefore, five chemistry conditions could be conveniently investigated
in each experiment. Five different combinations of mixing intensities and timing of the dosing
solutions were studied to span the spectrum of practical applications. Thus, for each water a
matrix of five chemistry conditions by five mixing and dosing conditions resulted, plus five
controls. The five mixing and dosing conditions are listed below and were the same for the three
waters.
1. Low G 60 sec-1, simultaneous addition of chlorine and ammonia, 1 minute of
mixing after chemical addition;
2. Intermediate G 500 sec-1, simultaneous addition of chlorine and ammonia, 1
minute of mixing after chemical addition;
78

Pour
ing
posi
tion
Six
2-L
baffl
ed
beak
ers
in ja
r te
st
appa
ratu
s
'"••
•
n 4
"""•
Res
ting
Posi
tion
. __ .
""•-
•••-
..
F -..
F
jp e
>'our
ing
>ath •X /
\ I
Nitr
ogen
Dos
ing
Funn
el
——
7 C
hlor
ine
/
Dos
ing
/
Funn
el
I*"-
-...-
&
®
Baffl
es
i
.Rot
or
Loca
tion
Chl
orin
e D
osin
gFu
nnel
2-L
Beak
er
• 1)
1
§r 1
solu
tion
dosi
ng t
ube
batte
ry
'Am
mon
ia s
olut
ion
dosi
ng t
ube
batte
ry
Baffl
e
Loca
tion
Nitro
gen
Dosi
ngFu
nnel
* 9
B
Pour
ing
Path Do
wel
Figu
re 6
.1
(A)
Side
vie
w o
f baf
fled
beak
er a
nd p
ouri
ng a
ppar
atus
, (B
) pla
n vi
ew o
f baf
fled
beak
er, a
nd (C
) pla
n vi
ew o
f jar
te
st a
ppar
atus
, with
pou
ring
app
arat
us

3.
4.
5.
High G 1000 sec" 1 , simultaneous addition of chlorine and ammonia, 1 minute of
mixing after chemical addition;
Low G 60 sec" 1 , chlorine addition with 30-second delay before ammonia
addition, 1 minute of mixing after ammonia addition; and
Intermediate G 500 sec" 1 , chlorine addition with 30-second delay before
ammonia addition, 1 minute of mixing after ammonia addition.
The five chemistry conditions were selected for each water based on the results of the
batch chemistry experiments of Task la and are tabulated in Table 6.1. The first three
Table 6.1
Chemistry conditions for batch mixing experiments
Condition
LAW1*LAW 2LAW 3LAW 4*LAWS*LHW1*LHW2LHW3LHW4*LHW5*CSPW1*CSPW2CSPW3CSPW4*CSPW5*
pH
6810810668810668810
C12/N Ratio
7/15/15/13/13/13/13/17/13/15/13/13/17/13/13/1
Target 48-hr residual(mg/L)
222222222222222
bromide
ambientambientambientambientambient
+ 0.5 mg/Lambientambientambientambient
+ 0.5 mg/Lambientambientambientambient
* Analyzed for HAAs and CNX
80
conditions for LAW were selected because they produced the most DBF formation at each pH in
Task la. Minimal DBF formation was expected for the fourth and fifth conditions unless
inadequate mixing or delayed dosing of ammonia promoted DBF formation. For LHW, the first
condition was selected to obtain the maximum DBF production with bromide addition. The
second condition was selected as a control on bromide addition and as a typical operating
condition for this type of water. The third condition was selected because it seemed to produce
the most DBFs in the batch experiments. The fourth condition was selected to simulate a typical
operating condition for this type of water, while the fifth condition was selected to provide an
indication of performance at pH 10. For CSPW, the first condition was selected to obtain the
maximum DBF production with bromide addition at a realistic Cb/N ratio. The second
condition was selected as a control on bromide addition. The third and fourth conditions were
selected to simulate the full range of conditions for pH 8. The fifth condition was selected to
provide an indication of performance at pH 10; the ratio of 3/1 was selected over 5/1 because
greater DBF formation was expected, based on the results of Task la.
INFLUENCE OF MIXING
Residual Species—Monochloramine/Dichloramine
Significant dichloramine concentrations were observed after 48 hours only in the
experiments conducted at pH 6, as expected. Thus, chloramine speciation data are presented
only for one pH 6 experiment on LAW and two each on LHW and CSPW. As noted above, a
control with preformed chloramines was run at one of the five mixing conditions in each
experiment, and these data are presented as well. The dichloramine fraction for Experiment
LAW1 (C12/N of 7/1, ambient bromide) is shown in Figure 6.2. A very large fraction of the total
chlorine residual consisted of dichloramine at all mixing conditions. The control with preformed
chloramines fell within the range of the other data (Figure 6.2). Also, these data agreed well
with the corresponding experiment in Task la.
81

•Ambient Bromide Concentration (0.24 mg/L) O Control. Ambient Bromide Concentration
Medium Med./delay Mixing Condition
Low Low/delay
Figure 6.2 Lake Austin water dichloramine fraction at pH 6, 7/1 Cb/N ratio
In LHW, two experiments were conducted at a CVN of ratio 3/1: with and without
bromide addition. The mixing condition had no clear effect on the dichloramine fraction (Figure
6.3). The dichloramine fraction at the ambient bromide concentration was somewhat larger than
that observed in Task 1 a, especially for the medium intensity mixing. With bromide addition,
the dichloramine fraction was considerably larger than that observed in Task la for all mixing
conditions. The mixing studies were conducted with the second batch of LHW; therefore,
differences between Tasks la and Ib may be attributable to differences in water quality between
the two LHW batches.
Two experiments also were conducted in CSPW at a Cli/N of ratio 3/1: with and without
bromide addition. The experiment at ambient bromide had a larger dichloramine fraction at all
mixing conditions than the experiment with bromide added (Figure 6.4). These differences are
consistent with the consumption of chlorine for the production of bromine and bromamines at the
82

•Ambient Bromide Concentration (0.08 mg/L)S0.5 mg/L Bromide AddedO Control, 0.5 mg/L Bromide AddedO Control, Ambient Bromide Concentration i
High Medium Med./delay
Mixing Condition
Low Low/delay
Figure 6.3 Lake Houston water dichloramine fraction at pH 6, 3/1 C12/N ratio
0.60•Ambient Bromide Concentration (0.10 mg/L) jB0.5 mg/L Bromide Added0 Control, 0.5 mg/L Bromide AddedO Control, Ambient Bromide Concentration
0.00High Medium Med./delay
Mixing Condition
Low Low/delay
Figure 6.4 California State Project water dichloramine fraction at pH 6, 3/1 /C^/N ratio
83

expense of dichloramine production (see Chapter 5). With the exception of the ambient bromide
control, the dichloramine fraction tended to be only slightly larger than that observed in Task la.
Taken as a whole, the experiments on the three water sources indicate that mixing
conditions do not significantly affect the disinfectant speciation at the contact times characteristic
of water distribution systems (e.g., 48 hours). Rather, the system chemistry is the controlling
factor. For contact times characteristic of rapid mix basins (e.g., minutes), mixing might have a
substantial effect on speciation; however, disinfectant speciation shortly after disinfectant
addition was not studied in this research.
Total Trihalomethanes and Dissolved Organic Halogen
Lake Austin Water
The results of the Lake Austin mixing experiments are presented graphically in Figures
6.5 through 6.9, which show the 2-day DBF SDS concentrations (TTHM2 and DOX2). Each
figure represents a given chemistry condition, thus facilitating comparisons among the mixing
conditions. Each figure also includes results from the corresponding control experiment with
preformed chloramines and the corresponding Task la batch experiment. Ideally, the data from
the control and batch experiments should be identical. As noted above, maximum DBF
formation at the respective pH was expected for the first three conditions, while minimal DBF
formation was expected for the fourth and fifth conditions. In general, the data showed the same
trends observed in Task la of decreasing DBF formation with increasing pH and decreasing
CVN ratios. No clear trends were apparent on the impact of mixing conditions on DBF
production. The largest DOX concentrations were observed with medium intensity mixing and
delayed ammonia addition. These DOX concentrations, however, were unexpectedly insensitive
to system chemistry, which arouses a certain degree of suspicion about the data for this mixing
condition. The largest TTHM concentrations generally occurred with medium intensity mixing,
and delayed addition of ammonia had a negligible effect on TTHM formation. Apparently, the
kinetics of THM formation are slow enough that a short delay in ammonia addition is not crucial.
Overall, the results point to a secondary role of mixing in DBF formation in comparison to
system chemistry.
84

160
140
I 120c
•x 100
I 80
U 60
a 40* 20
0High Medium Med./delay Low Low/delay Preformed Batch
Figure 6.5 Impact of mixing on 2-d DBF formation in Lake Austin water at pH about 6 and
C12/N ratio of 7 to 1, ambient bromide (0.24 mg/L)
160
140
120
^^ 100o
1I 80
S* 60
40
20
High Medium MedVdelay Low Low/delay Preformed Batch
Figure 6.6 Impact of mixing on 2-d DBF formation in Lake Austin water at pH about 8 and
Cb/N ratio of 5 to 1, ambient bromide (0.24 mg/L)
85

160 160
0High Medium Med./delay Low Low/delay Preformed Batch
0
Figure 6.7 Impact of mixing on 2-d DBF formation in Lake Austin water at pH about 10 and
ratio of 5 to 1, ambient bromide (0.24 mg/L)
High Medium Med./delay Low Low/delay Preformed Batch
Figure 6.8 Impact of mixing on 2-d DBF formation in Lake Austin water at pH about 8 and
C12/N ratio of 3 to 1, ambient bromide (0.24 mg/L)
86

0High Medium MedVdelay Low Low/delay Preformed Batch
0
Figure 6.9 Impact of mixing on 2-d DBF formation in Lake Austin water at pH about 10 and
C12/N ratio of 3 to 1, ambient bromide (0.24 mg/L)
87

Lake Houston Water
The results of the Lake Houston mixing experiments are presented in Figures 6.10
through 6.14 and show several trends. With respect to the chemistry conditions, the increase in
TTHM and DOX concentrations when bromide was added is evident (Figures 6.10 and 6.11).
Also, changing the Cb/N ratio from 7/1 to 3/1 at pH 8 lowered the concentrations of TTHMs and
DOX (Figures 6.12 and 6.13). The lowest concentrations of THMs and DOX were formed at pH
10 (Figure 6.14). These patterns were seen in Task la (Figure 5.13 and somewhat in Figure
5.15). Except for the DOX data presented in Figure 6.10, the "preformed" and "batch" data
agreed fairly well. This disagreement may largely result because the "batch" data were
measured on the first Lake Houston sample and the "preformed" data were measured on the
second Lake Houston sample.
In general, the high and medium intensity mixing conditions produced the lower TTHM
concentrations, while low intensity mixing or delayed addition of ammonia produced higher
concentrations of TTHMs. In addition, the controls with preformed chloramines produced the
lowest THM concentrations. Generally, the range of THM concentrations varied within a factor
of approximately two across the range of mixing conditions for a given chemistry condition.
The DOX data are more difficult to interpret because they do not show much dependence
on the mixing condition. In general, however, higher concentrations of DOX were formed when
a delay in adding the ammonia occurred (Figures 6.11, 6.13, and 6.14).
The results indicate that both mixing and chemical addition points (or timing) influence
TTHM formation. The impact is certainly not dramatic (i.e., factor of 2 for THMs and 1.4 for
DOX), but utilities experiencing problems with TTHM and DOX formation may still observe
noticeable decreases in DBF formation through improvement in either or both of these areas.
The improvement is likely to be greater for THMs than for DOX because the kinetics of THM
formation appear to be more rapid than the kinetics of DOX formation in general.
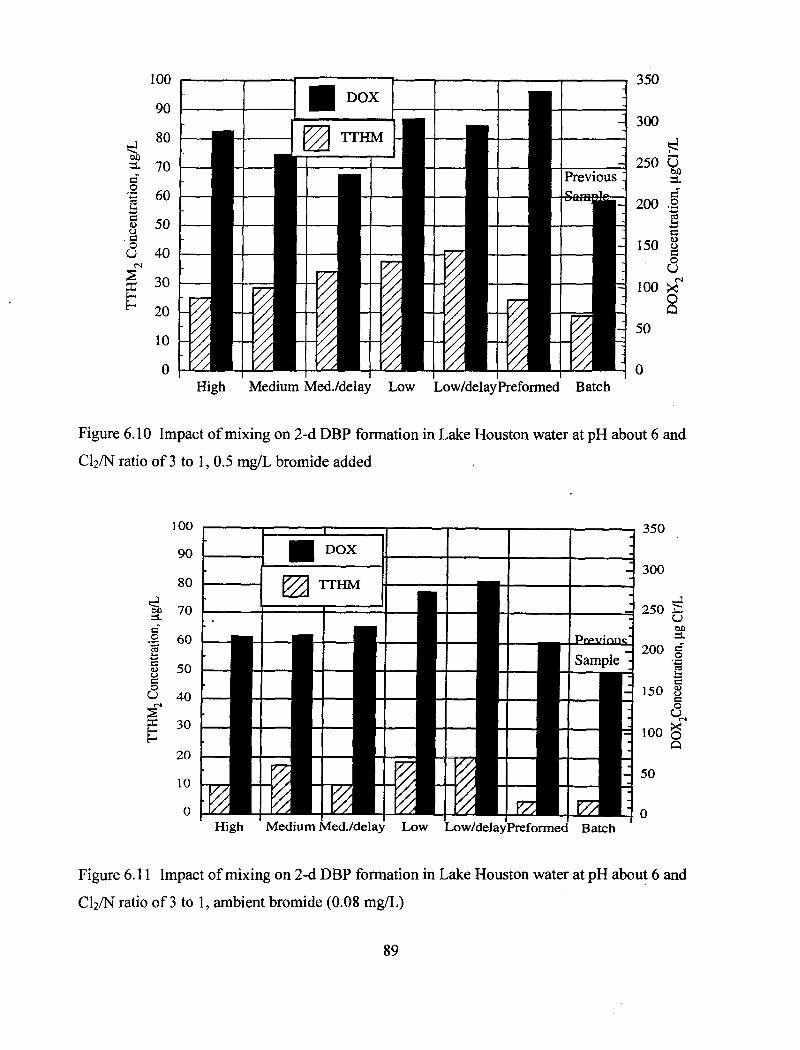
0High Medium MedVdelay Low Low/delayPreformed Batch
Figure 6.10 Impact of mixing on 2-d DBF formation in Lake Houston water at pH about 6 and
ratio of 3 to 1, 0.5 mg/L bromide added
I_oto u-C
6
High Medium Med./delay Low Low/delay Preformed Batch
Figure 6.11 Impact of mixing on 2-d DBF formation in Lake Houston water at pH about 6 and
C12/N ratio of 3 to 1, ambient bromide (0.08 mg/L)
89
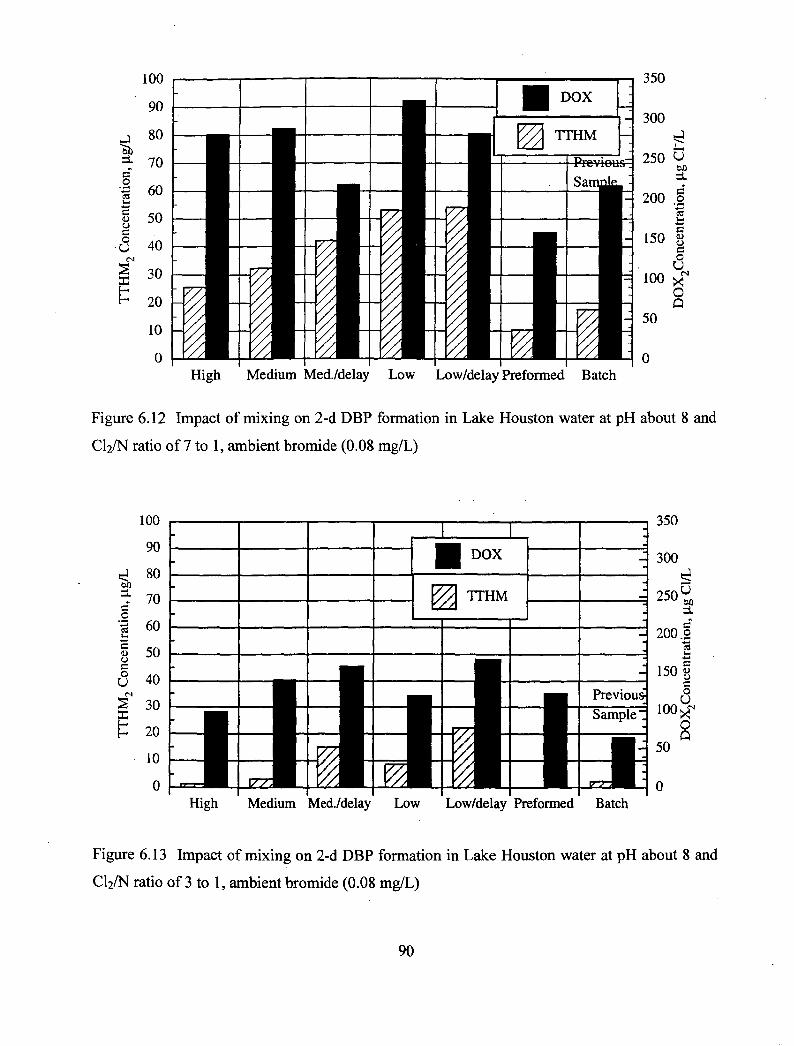
High Medium Med./delay Low Low/delay Preformed Batch
Figure 6.12 Impact of mixing on 2-d DBF formation in Lake Houston water at pH about 8 and
Cb/N ratio of 7 to 1, ambient bromide (0.08 mg/L)
High Medium Med./delay Low Low/delay Preformed Batch
Figure 6.13 Impact of mixing on 2-d DBF formation in Lake Houston water at pH about 8 and
C12/N ratio of 3 to 1, ambient bromide (0.08 mg/L)
90

350
Io1•*-*g
§ U
^-H
E
10
0 0High Medium Med./delay Low Low/delay Preformed Batch
Figure 6.14 Impact of mixing on 2-d DBF formation in Lake Houston water at pH about 10 and
C12/N ratio of 5 to 1, ambient bromide (0.08 mg/L)
91

California State Project Water
The results of the CSPW mixing experiments are presented in Figures 6.15 through 6.19
and show several trends. The expected increase in TTHM and DOX concentrations when
bromide was added is evident (Figures 6.15 and 6.16). Also as expected, changing the Cb/N
ratio from 7/1 to 3/1 at pH 8 substantially lowered the TTHM and DOX concentrations (Figures
6.17 and 6.18). The lowest TTHM and DOX concentrations occurred at pH 10 (Figure 6.19).
Except for the data presented in Figure 6.19, the "preformed" and "batch" data agreed fairly
well.
As with the LHW, a priori, one would expect the TTHM and DOX concentrations to
increase "to the right" across Figures 6.15 through 6.19, with the last two data sets on the right
equal to each other and equal to or less than the data collected in the "left-hand" condition,
high-energy mixing. Some anomalies in this trend did occur, as in the low-energy mixing data in
Figure 6.15 for TTHM, and the "medium with delay" DOX data in Figures 6.17 and 6.18. In
general, however, the high and medium intensity mixing conditions produced the lower TTHM
and DOX concentrations, while low intensity mixing or delayed addition of ammonia produced
higher concentrations. Generally, the range of TTHM and DOX concentrations varied within a
factor of approximately two across the range of mixing conditions for a given chemistry
condition (i.e., pH, Cb/N ratio). Therefore, these data also indicate that utilities may achieve
some decreases in THM and DOX formation through improved mixing, simultaneous addition of
chlorine and ammonia, or both.
Haloacetic Acids
Lake Austin Water
In general, only three HA As were formed during the Lake Austin mixing study, DCAA,
DBAA, and BCAA, with the latter two dominating the HAA6 (Table 6.2). The pH 6, 7/1 C12/N
ratio conditions produced the most HAA6 for all of the conditions studied. As with the TTHM
and DOX data, a one-minute period of free chlorine did not enhance HAA6 formation. For the
92

0High Medium MedVdelay Low Low/delay Preformed Batch
Figure 6.15 Impact of mixing on 2-d DBF formation in California State Project water at pH
about 6 and Ck/N ratio of 3 to 1, 0.5 mg/L bromide added
80
70 —
High Medium Med./delay Low Low/delay Preformed Batch
Figure 6.16 Impact of mixing on 2-d DBF formation in California State Project water at pH
about 6 and Cb/N ratio of 3 to 1, ambient bromide (0.10 mg/L)
93

0High Medium MedVdelay Low Low/delay Preformed Batch
0
Figure 6.17 Impact of mixing on 2-d DBF formation in California State Project water at pH
about 8 and Cb/N ratio of 7 to 1, ambient bromide (0.10 mg/L)
80
High Medium Med./delay Low Low/delay Preformed Batch
Figure 6.18 Impact of mixing on 2-d DBP formation in California State Project water at pH
about 8 and C12/N ratio of 3 to 1, ambient bromide (0.10 mg/L)
94
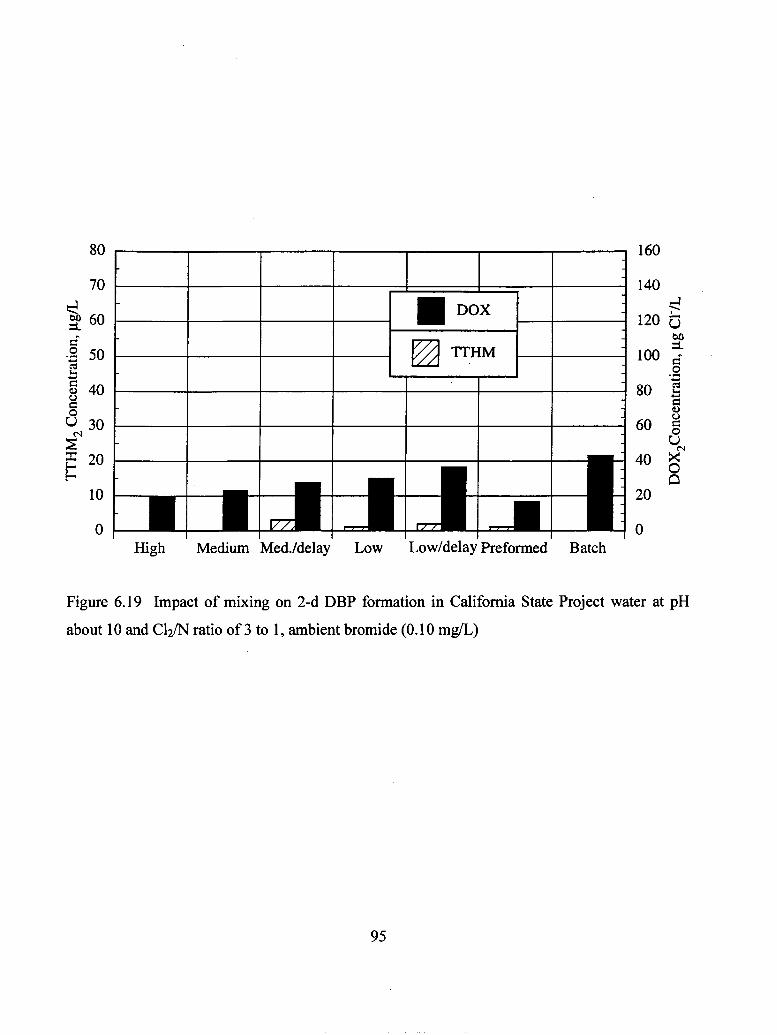
80
0 0
u
I4-*
24^
U
o UXs
High Medium Med./delay Low Low/delay Preformed Batch
Figure 6.19 Impact of mixing on 2-d DBP formation in California State Project water at pH
about 10 and C12/N ratio of 3 to 1, ambient bromide (0.10 mg/L)
95

Table 6.2
Lake Austin water haloacetic acid concentrations for bench mixing studies
Mixing Condition
High
Medium
Medium w/ delay
Low
Low w/ delay
Task la
High
Medium
Medium w/ delay
Low
Low w/ delay
Task la
High
Medium
Medium w/ delay
Low
Low w/ delay
Task la
CAA BAA DCAA TCAA BCAA (ug/L) (ng/L) (ug/L) (ug/L) (ug/L)
nd
nd
nd
nd
nd
1.1
nd
nd
nd
nd
nd
bdl
nd
nd
nd
nd
nd
bdl
pH 6, 7/1
bdl
bdl
bdl
bdl
bdl
bdl
pH 8, 3/1
bdl
bdl
bdl
bdl
bdl
bdl
pH 10, 3/1
nd
nd
nd
nd
nd
DBAA(ug/L)
HAA6(ug/L)
Cb/N ratio, ambient bromide
4.7
4.7
2.4
4.0
2.1
3.3
1.2
bdl
bdl
bdl
bdl
bdl
6.7
7.7
4.5
5.5
5.4
6.3
5.0
5.6
5.0
4.6
4.2
8.5
17.5
18.0
11.9
14.1
11.8
19.2
Cb/N ratio, ambient bromide
4.5
2.2
2.3
bdl
bdl
2.1
C12/N ratio,
3.1
1.4
2.8
bdl
1.0
bdl 1.0
bdl
nd
bdl
bdl
bdl
bdl
ambient bromide
bdl
nd
bdl
bdl
bdl
bdl
3.0
1.9
3.5
bdl
1.8
2.1
1.7
0.8
1.5
bdl
bdl
bdl
1.8
1.3
1.1
bdl
0.3
2.0
1.6
1.2
bdl
bdl
bdl
1.4
9.3
5.4
6.9
0.0
2.0
6.2
6.3
3.4
4.3
0.0
1.0
2.4
Note: All HAA concentrations are 48-hr SDS values
bdl = below detection limit nd = none detected
96

other two exposure conditions, pH 8 and pH 10, 3/1 Cb/N ratio, the HAA6 concentration was
very low (<10 ug/L). Only small differences in HAA6 concentrations were observed with
different mixing conditions at each chemistry condition.
Lake Houston and California State Project Waters
Similarly, no consistent trend is evident for the HAA6 concentration in the Lake Houston
(Table 6.3) and California State Project mixing studies (Table 6.4) as a function of mixing
intensity or dosing timing. Perhaps the formation kinetics are slower than for THMs, so mixing
and the timing of chemical addition are less important, or the impact of these variables is within
the uncertainty of the HAA analytical method. As expected, a difference was observed with and
without bromide addition. In the absence of bromide addition, DCAA was virtually the only
HAA formed in LHW. With bromide, significant production of both BCAA and DBAA was
observed in LHW and greater production of BCAA and DBAA was observed in CSPW.
Cyanogen Halides
In all three waters, good agreement was observed between HAA6 concentrations
measured in Task la with preformed chloramines and those measured in the Task Ib mixing
studies. Again, this suggests that HAA formation kinetics are rather slow in comparison to the
kinetics of chloramine formation; therefore, within typical operating conditions, chemical dosing
and mixing are of secondary importance in HAA formation.
The cyanogen halide (CNX) results of the bench-scale mixing studies of the three waters
are given in Table 6.5. In all three waters, neither cyanogen chloride (CNC1) nor cyanogen
bromide (CNBr) was found at pH 10 because of base-catalyzed hydrolysis of these compounds.
All the CNC1 levels were low, ranging from less than 0.7 ug/L to 2.8 ug/L, with small variations
in CNC1 concentrations (0.4 to 1.8 ug/L) with changes in mixing conditions. In Lake Austin, at
pH 6 and 8, the concentration of CNC1 for the high-intensity mixing test was slightly greater than
for the low and medium mixing intensities with or without delay in ammonia addition. In Lake
Houston, no consistent trend was observed, with highest CNC1 concentrations at low mixing
97

Table 6.3
Lake Houston water haloacetic acid concentrations for bench mixing studies
Mixing Condition
CAA BAA DCAA(ug/L) (ug/L) (ug/L)
pH 6, 3/1 Cl
High
Medium
Medium
Medium w/ delay
Low
Low
Low w/delay
High
Medium
Medium w/ delay
Low
Low w/ delay
Task la
High
Medium
Medium w/ delay
Low
Low w/ delay
nd
nd
nd
nd
nd
nd
bdl
PH
nd
nd
nd
nd
nd
bdl
pH
nd
nd
nd
nd
2.3
bdl
bdl
bdl
bdl
bdl
bdl
1.5
TCAA BCAA (ug/L) (ug/L)
DBAA(ug/L)
HAA6(ug/L)
,2/N ratio, bromide added
13.3
26.3
17.8
4.8
20.6
19.7
17.1
bdl
1.2
bdl
1.1
bdl
2.2
2.3
24.2
26.7
21.3
8.7
31.1
27.0
28.3
21.1
32.8
12.6
4.4
25.7
21.0
21.7
58.6
87.0
51.7
19.0
77.4
69.9
70.9
8, 3/1 Cb/N ratio, ambient bromide
nd
nd
nd
nd
nd
bdl
10, 5/1 Cl
nd
nd
nd
nd
bdl
26.2
29.9
25.7
32.5
31.2
20.0
bdl
nd
2.5
bdl
2.9
bdl
bdl
1.9
2.5
bdl
4.4
6.5
bdl
bdl
bdl
bdl
bdl
1.9
26.2
31.8
30.7
32.5
38.5
28.4
2/N ratio, ambient bromide
42.3
43.9
30.5
40.9
37.0
bdl
nd
bdl
bdl
1.0
bdl
3.2
2.5
bdl
4.0
bdl
bdl
bdl
bdl
bdl
42.3
47.1
33.0
40.9
44.3
Note: All HAA concentrations are 48-hr SDS values
bdl = below detection limit nd = none detected
98

Table 6.4
California State Project water haloacetic acid concentrations for bench mixing studies
Mixing Condition
High
Medium
Medium w/ delay
Low
Low w/delay
High
Medium
Medium w/ delay
Low
Low w/ delay
Task la
High
Medium
Medium w/ delay
Low
Low w/ delay
Task la
CAA
nd
nd
nd
nd
nd
nd
nd
nd
nd
nd
bdl
nd
nd
nd
nd
nd
2.7
BAA(Hg/L)
pH 6, 3/1
bdl
bdl
bdl
bdl
bdl
pH 8, 3/1 (
nd
nd
nd
nd
nd
bdl
pHl 0,3/1
nd
nd
nd
nd
nd
nd
DCAA
C12/N ratio,
1.7
1.7
4.9
2.3
1.2
TCAA (Hg/L)
bromide
bdl
bdl
bdl
bdl
bdl
BCAA
added
5.7
6.3
6.3
6.6
5.2
DBAA(ug/L)
10.4
11.7
12.8
12.0
11.2
HAA6(HR/L)
17.8
19.7
24.0
20.9
17.6
C12/N ratio, ambient bromide
4.3
7.6
9.1
5.1
5.5
2.8
C12/N ratio,
4.5
5.0
5.2
4.9
5.8
2.5
bdl
1.1
bdl
bdl
bdl
bdl
2.1
2.3
2.8
2.5
2.8
2.1
bdl
2.5
1.1
1.2
1.4
bdl
6.4
13.5
13.0
8.8
9.7
4.9
ambient bromide
bdl
bdl
bdl
bdl
bdl
bdl
1.5
1.9
2.1
2.1
2.1
1.1
bdl
1.0
1.2
1.2
1.2
1.1
6.0
7.9
8.5
8.2
9.1
7.4
Note: All HAA concentrations are 48-hr SDS values bdl = below detection limit nd = none detected
99

o
o
Tab
le 6
.5
CN
X c
once
ntra
tions
for
ben
ch m
ixin
g st
udie
s
Mix
ing
Con
ditio
n
CNC1
(Hg/
L)
CN
Br
(ug/
L)
CN
X
(Hg/
L)
CNC1
(Hg/
L)
CN
Br
(ug/
L),
.
CN
X
'(ug/
L)
CNC1
(Hg/
L)
CN
Br
(Hg/
L)
CN
X
(Hg/
L)
Lake
Aus
tin W
ater
Hig
h
Med
ium
Med
ium
w/ d
elay
Low
Low
w/ d
elay
pH 6
, 7/1
2.7
1.1 0.9 1.5
1.3
C12/N
, am
bien
t Br
5.0
6.5
5.0
6.5
5.8
7.7
7.6
5.9
8.0
7.1
pH 8
, 3/1
1.7
1.0
1.0
1.0
1.0
C12/N
, am
bien
t
nd nd nd nd nd
Br"
1.7
1.0
1.0
1.0
. i.o
PH
nd nd nd nd nd
10, 5
/1 C
12/N
,
nd nd nd nd nd
ambi
ent B
r"
nd nd nd nd nd
Lake
Hou
ston
Wat
er
Hig
h
Med
ium
Med
ium
w/ d
elay
Low
Low
w/ d
elay
pH 6
, 3/1
1.6
1.0
1.7
1.5
1.6
C12/N
, Bf
adde
d
5.0
2.7
2.2
5.4
5.8
6.6
3.7
3.9
6.9
7.4
pH 8
, 3/1
1.5
1.4
1.7
2.8
2.0
C12/N
, am
bien
t
nd nd
* ,
nd nd nd
Br"
1.5
1.4
1.7
2.8
'2.0
pH
nd nd nd nd nd
10, 5
/1 C
12/N
,
nd nd nd nd nd
ambi
ent B
r" nd nd nd nd nd
Cal
iforn
ia S
tate
Pro
ject
Wat
er
Hig
h
Med
ium
Med
ium
w/ d
elay
Low
Low
w/ d
elay
pH 6
, 3/1
nd nd 0.7 nd nd
C12/N
, Br'a
dded
6.2
6.4
7.9
7.7
8.0
6.2
6.4
8.6
7.7
8.0
pH 8
, 3/1
1.0
0.9 1.3 1.2
0.9
C12/N
, am
bien
t Br"
nd nd nd nd nd
1.0
0.9
'
1.3
1.2
.0.9
pH
nd nd nd nd nd
10, 3
/1 C
12/N
,
nd nd nd nd nd
ambi
ent B
r" nd nd nd nd nd
Note:
All
CNC1
and
CN
Br c
once
ntra
tions
are
48-
hr S
DS
valu
es
nd =
non
e de
tect
ed; n
d <
0.7
for C
NC1
, nd
< 1.
0 fo
r CN
Br
intensities for pH 8 data and a dip in the CNC1 level at a medium mixing intensity (no delay) for
pH 6. In the CSPW, no significant differences in CNC1 concentrations were observed as mixing
conditions were varied.
CNBr was only found in the mixing studies conducted at pH 6. In Lake Austin, CNBr
levels showed no discernible trend. In Lake Houston, significantly higher CNBr levels occurred
in the low- and high-intensity mixing experiments. The concentrations for the two medium
energy mixing experiments appeared to be atypically low, however, based on the results of the
Task la studies. In CSPW, CNBr levels were slightly higher in the tests with delayed or
low-intensity mixing as compared to the medium- and high-intensity mixing experiments with no
delay. As with the CNC1 results, however, the differences tended to be relatively small and may
not be statistically significant.
The CNC1 and CNBr concentrations in the mixing studies showed good agreement with
those measured in the Task la studies with preformed chloramines. Thus, as with the HAAs,
chemistry conditions (e.g., pH, Cli/N ratio) appear to impact CNX formation more than the
mixing intensity and dosing timing.
Implications for Mixing at Larger Scale
Given that the mixing experiments were conducted at small scale in laboratory-sized
beakers, it is appropriate to consider how these results relate to the larger-scale mixing occurring
in practice. Clark and Fiessinger (1991) reviewed the literature on mixing and scaleup, and
highlighted several scale-up relationships. Unfortunately, rapid mixing is not well understood,
which is reflected in the available scaleup relationships. Depending upon the relationship
selected, G at large scale should be greater than, equal to, or less than the small-scale G to
achieve the same degree of mixing. For this particular application, relationships that show G at
larger scale equal to or greater than the small-scale G are probably most appropriate because
chloramine formation kinetics are relatively fast. Even with this narrowing of the range of
scaleup relationships, considerable uncertainty remains about the effect of scale on mixing.
Consideration of several aspects of the experimental design and objectives also provides
some insight into the effect of scale on mixing. First, the issue of relative reaction times must be
considered. Rapid mixing occurred for 1 to 2 minutes, prior to 48 hours of incubation to
101

simulate distribution system conditions. Therefore, unless the DBF reaction kinetics were very
rapid, the less than ideal mixing conditions that may have occurred during the brief mixing
period would have been overwhelmed by the far longer reaction time provided by the simulated
distribution system test, which was the focus of this research. Second, two of the mixing
conditions provided a 30-second delay between the addition of chlorine and the subsequent
addition of ammonia. These two mixing conditions may be viewed either as a test of delayed
ammonia addition or as a way of simulating poor mixing during simultaneous addition of the two
chemicals. A 30-second delay in ammonia addition represents a significant opportunity for DBF
formation within the context of typical rapid mix detention times. Third, the G values used in
this research (60, 500, and 1000 sec" 1 ) are smaller than those used in practice. For example, a
high G value at full scale to achieve good mixing would be larger than the high G value of 1000
sec" 1 used in this research. Therefore, the scaling relationships suggesting that G must increase
with scale to maintain identical mixing were followed in a qualitative way in this research.
Considering that the experimental conditions covered a broad range of mixing intensities
and included delayed addition of ammonia, and considering that the objective was to simulate
the impact of mixing at the point of disinfectant addition on distribution system DBF
concentrations, the mixing experiments should provide a reasonable estimate of the relative
impact of mixing on DBF formation at full scale.
RECOVERY OF DISSOLVED ORGANIC HALOGEN WITH 12 MEASURED DISINFECTION BY-PRODUCTS
Among the samples collected during Task Ib, certain samples were selected for
additional DBF SDS analyses beyond the SDS THMs and SDS DOX determinations. These
selected samples were also tested for SDS HAA6 and SDS CNC1 and SDS CNBr. Thus, in these
samples, after the 48 hours of incubation, 12 DBFs were measured, as well as DOX.
These data are presented for the Task Ib samples in Figures 6.20 to 6.27 for each of the
three primary waters. Here again, as in Task la (Figures 5.24 to 5.26), the recovery values are
quite low, less than 16 percent for LHW, less than 23 percent for LAW, and less than 32 percent
for CSPW. For Lake Houston and CSPW, mixing intensity had little effect on the recovery
102

25
oQ
10QCN
I*o=1. "~ 0
CNXdataNotA \/a i 1 ..JillHigh Medium MedVdelay Low Low/delay Batch
Figure 6.20 Influence of mixing conditions on the percentage of DOX identified by summing
the 12 measured DBFs (E 12 DBPOX) in Lake Austin water: pH about 6, C12/N ratio 7 to 1,2
mg/L nominal total residual after 2-d, ambient bromide (0.24 mg/L)
High Medium Med./delay Low Low/delay Batch
Figure 6.21 Influence of mixing conditions on the percentage of DOX identified by summing
the 12 measured DBFs (E 12 DBPOX) in Lake Austin water: pH about 8, C12/N ratio 3 to 1, 2
mg/L nominal total residual after 2-d, ambient bromide (0.24 mg/L)
103

High Medium Med./delay Low Low/delay Batch
Figure 6.22 Influence of mixing conditions on the percentage of DOX identified by summing
the 12 measured DBFs (Z 12 DBPOX) in Lake Austin water: pH about 10, C12/N ratio 3 to 1, 2
mg/L nominal total residual after 2-d, ambient bromide (0.24 mg/L)
104

High Medium Med./delay Low Low/delay Batch
Figure 6.23 Influence of mixing conditions on the percentage of DOX identified by summing
the 12 measured DBFs (2 12 DBPOX) in Lake Houston water: pH about 6, C12/N ratio 3 to 1, 2
mg/L nominal total residual after 2-d, 0.5 mg/L bromide added
0High Medium MedVdelay Low Low/delay Batch
Figure 6.24 Influence of mixing conditions on the percentage of DOX identified by summing
the 12 measured DBFs (Z 12 DBPOX) in Lake Houston water: pH about 8, C12/N ratio 3 to 1, 2
mg/L nominal total residual after 2-d, ambient bromide (0.08 mg/L)
105

High Medium Med./delay Low Low/delay Batch
Figure 6.25 Influence of mixing conditions on the percentage of DOX identified by summing
the 12 measured DBFs (1, 12 DBPOX) in Lake Houston water: pH about 10, C12/N ratio 5 to 1, 2
mg/L nominal total residual after 2-d, ambient bromide (0.08 mg/L)
106

High Low Low/delay BatchMedium Med./delay
Figure 6.26 Influence of mixing conditions on the percentage of DOX identified by summing
the 12 measured DBFs (2 12 DBPOX) in California State Project water: pH about 6, C12/N ratio
3 to 1, 2 mg/L nominal total residual after 2-d, 0.5 mg/L bromide added
High Medium Med7delay Low Low/delay Batch
Figure 6.27 Influence of mixing conditions on the percentage of DOX identified by summing
the 12 measured DBFs (Z 12 DBPOX) in California State Project water: pH about 10, C12/N
ratio 3 to 1, 2 mg/L nominal total residual after 2-d, ambient bromide (0.10 mg/L)
107
factor. Differences were noted in the LAW samples (Figures 6.20 to 6.22) but no particular
pattern developed.
As mentioned previously, the work of Singer et al. (1992) showed that the slope of the
best fit line through the data was about one-third of the slope of a 100 percent recovery line.
Thus, with both free chlorine and chloramines, a large concentration of "unidentifiable" halogen-
substituted DBFs are formed in the application of these oxidants.
108

CHAPTER 7
PILOT PLANT STUDIES—TASK 2
OBJECTIVES
In contrast to Task 1, which was all performed at bench scale, Task 2 was all performed
in pilot plants. The purposes of this phase of the study were to investigate the effects of scaleup
and the influence of some of the key variables in continuous-flow systems, to compare the Task
la results in the batch mode with the continuous-flow mode, and to investigate the influence of
coagulation, enhanced coagulation, ozonation, biofiltration treatment, and point of chlora-
mination (source water versus filtered water) on the resulting DBF formation.
EXPERIMENTAL APPROACH
Studies were conducted on each of the primary waters, Lake Austin, Lake Houston, and
California State Project Water. Schematic diagrams of each of the pilot plants are presented in
Figures 7.1 to 7.3. For all of the studies, pilot-plant effluents were incubated for 48 hours at
22 C (25 C for LHW) with a target total residual at the end of incubation of 2 mg/L to simulate
the distribution systems (i.e., SDS-type testing). Various SDS incubation pHs were used, as
described in detail below.
Description of Pilot Plants
Houston
The University of Houston pilot plant consists of a static rapid mixer, a tapered
flocculator, a tube settler with 19 tubes (1-inch ID) at a 60 degree angle and a dual-media filter
(anthracite coal over sand) (see Figure 7.1). The entire plant operates under pressure provided
by a centrifugal pump. The flocculator, settling basin, and filter are constructed of hard, clear
plastic. A flow of 0.3 gallons per minute (1.1 L/min.) (about 450 gallons or 1,700 L per day)
produces an approach velocity in the filter of about 2 gpm/ft2 (5m/hr) and 144 minute detention
109

ROTA
MET
ER
FLO
CCUL
ATO
R
TUBE
SET
TLER
FLO
CCUL
ATO
R DR
IVE
nPR
ESSU
RE R
EDUC
ING
VA
LVE
STO
RAG
ETAN
K
MIX
ER
WO
ODE
N ST
AND
CARB
OY
LPU
MP
STAT
IC
MIX
ER [
[
( *
WAT
PU
N
CH
EM
H4
SODI
UM
HYPO
CHLO
RITE
AMM
ONI
UM
CHLO
RIDE
ALUM
Figu
re 7
.1
Uni
vers
ity o
f Hou
ston
pilo
t pla
nt

OZON
E CO
NTAC
TOR
CONS
TANT
HEA
D BO
XCH
EMIC
AL IN
JECT
ION
n
RAW
WAT
ER P
UMP
RAPI
D MI
X RO
CCUL
ATIO
N 3-S
TAGE
SEDI
MENT
ATIO
N
SOLID
S RE
CIRC
ULAT
ION
CONT
ACT B
OX
rDCA
RBON
FILT
RATIO
N
TRAN
SFER
PU
MP
TO D
RAIN
Figu
re 7
.2 C
ity o
f Aus
tin p
ilot p
lant

CA
LIFO
RN
IA R
IVER
WA
TER
SU
PPLY
LIN
E
1 ST
ATE
PRO
JEC
T W
ATER
SU
PPLY
LIN
E TO
DR
AIN
MET
ADJU
STAB
LE
OVE
RFL
OW
S V i < <
MA
FLOW
ER ~
~*"
Q
U /}
-+, —
——
MIX
ERS
F T
^*
ADJU
STA
f T
OVE
RFLC
~®
~
MIX
ING
&
-«-
HO
LDIN
G
— ®
- TA
NK
/p.
~*~
— |yTO
DR
AIN CH
EMIC
AL F
EED
1
' '
1 1
1 >v
' °
TT
T^
^
^
t <
> —
— *
FL >
CC
4 A
1"*"
R
APID
BLE
)WS
. \
^ ( JLAT
K
I /
N BA
SIN
S
/ME
TER
S
^
^
^III
CH
EMIC
AL F
EED
O
O
r— 1
.
IN
\\
#0 U -e—
MIX
ING
&
OZO
NE
CO
NTA
CT
CO
LUM
NS
HO
LDIN
G
TAN
K /p
\ (J (j (j (J
__
— "f
eJ^
r TO
DR
AIN
i • (7
^
f \
_/t
?——
——
——
——
——
——
——
——
' ——
OT
yv
HOLD
JNG
W^
TAN
K
, ,,
1p -
••
TRAI
N "
A"
- -®
- TR
AIN
"A
" L
TRAI
N "
B"
J
' '
SEDI
MEN
TATI
ON
' '
SEDI
MEN
TATI
ON
——
. SE
DIM
ENTA
TIO
N ~
®~
BASI
N #1
BA
SIN
#2
BASI
N #1
OVE
RFL
OW
i — f_
nrn
— '
DIS
TRIB
UTI
ON
TAN
K AT
OP
FILT
ERS
<>
***•
"*
"*
'""*
,-1
A A
OVE
RFL
OW
TO
DR
AIN
Q-*
- FI
LTER
S
Figu
re 7
.3 M
etro
polit
an W
ater
Dis
tric
t of S
outh
ern
Cal
ifor
nia
La
Ver
ne p
ilot p
lant

time. In operation on LHW, this pilot plant regularly produced water containing 0.5 NTU or less
of effluent turbidity. In the source water chloramination tests, sodium hypochlorite solution and
the ammonium sulfate solution were stored in separate carboys and pumped in the proper
proportion into the source water just prior to a static mixer. In the postfiltration chloramination
tests, a static mixer was placed immediately after the filter, and this is where the two solutions
were added.
The pilot plant is instrumented with a pressure gauge for determining head loss in the
filter and a rotameter for flow control. During backwash, both surface wash and upflow
backwash were available. As the total volume of the pilot plant is about 45 gallons (170 liters),
the theoretical detention time is 144 minutes at a flow rate of 0.3 gpm (1.1 L/min). Thus, about
10 bed volumes pass through the pilot plant each day. For this study, the pilot plant was placed at
the City of Houston's East Water Treatment Plant, where the source was LHW.
Austin
A schematic flow diagram of the Austin pilot plant is presented in Figure 7.2. The plant
has a nominal capacity of 6 gpm (23 L/min.) and consists of two ozone contactors; one
coagulation, flocculation, settling and recarbonation train; three mixed media filters; and two
granular activated carbon (GAC) adsorbers. The ozone contactors were configured for series
operation in a pre-ozonation treatment mode. The pilot plant permitted evaluation of a variety of
different treatment options. For example, the plant was operated with or without preozonation,
and chloramines were injected at several points in the treatment train. For source water
chloramination, chlorine and ammonia solutions were mixed separately in 55-gallon (210-L)
drums and pumped into the influent stream continuously.
Metropolitan Water District of Southern California
MWDSC's pilot-scale water treatment facility is located at its F.E. Weymouth Filtration
Plant in La Verne, Calif. The 6-gpm (23-L/min.) pilot plant was designed to simulate full-scale
conventional treatment, including preoxidation (using ozone); coagulation and flocculation; and
dual-media filtration (see Figure 7.3). The means to test biological filtration were also used.
113

Various ozone dosages were applied countercurrent to the water flow through 4-in. (10-cm)
ceramic diffusers in 16 ft (4.9 m) x 6 in. (15.2 cm) glass ozone contactors. The ozone transfer
efficiencies were >98 percent. For experiments using prechloramination, concurrent chlorine
addition and ammonia addition, at various mass ratios to produce the desired total chloramine
level, were injected at the rapid mix just prior to coagulation. In one of the tests (Run 2), a
deliberate one minute delay in the addition of the ammonia solution was included to assess the
influence of a short period of free chlorine on the formation of DBFs. Conventional alum
coagulation for turbidity removal (not enhanced coagulation) and sedimentation was followed by
dual-media filtration. Two types of filters were used, anthracite coal/sand and GAC/sand at a
filtration rate of 6 gpm/ft2 (15 m/h).
Lake Austin Water
Because the pH of LAW is approximately 8 and current treatment consists of lime
softening, these pilot studies examined performance at SDS incubation pH levels of 8 and 10
only. The full-scale plant used a Cli/N ratio of 4/1.
Operating conditions are outlined below:
Runs 1A and IB: Cb/N of 3/1, ambient bromide concentration, source water
chloramination, lime softening. Two sets of samples were collected after
filtration for SDS measurements. The first set was incubated at pH 10, and the
second set was adjusted to pH 8 with sulfuric acid before incubation to simulate
recarbonation. Thus, this filter run effectively simulated two conditions in the
distribution system for DBF formation.
Runs 2A and 2B: C12/N of 5/1, ambient bromide concentration, source water
chloramination, lime softening. Two sets of samples were collected after
filtration for SDS measurements. The first set was incubated at pH 10, and the
second set was adjusted to pH 8 before incubation to simulate recarbonation.
Thus, this filter run effectively simulated two conditions in the distribution system
for DBF formation.
114

Run 3: CVNof 5/1, ambient bromide concentration, source water
chloramination. In this experiment, the pilot plant was operated as a direct
filtration plant with alum addition to simulate a realistic operating scheme if lime
softening were not practiced on this water. The SDS samples were incubated at
pH8.
Run 4: C^/N of 5/1, ambient bromide concentration, postfilter chloramination.
In this experiment, the pilot plant was again operated as a direct filtration plant
with alum addition with chloramination after some precursor removal. The SDS
samples were incubated at pH 8.
Runs 5A and 5B: CVN of 5/1, ambient bromide concentration, source water
ozonation (applied ozone dose equaled 1 mg/mg TOC, qualitative positive low
ozone residual in contactor effluent), lime softening, and postchloramination.
Two sets of samples were collected after filtration (not biologically active because
of pH 10 and intermittent operation) for SDS measurements at pH 10 and 8, as
before.
Each experiment lasted three days, with a steady-state sampling period of three days.
During this sampling period, samples were collected twice daily for DBF analyses.
Lake Houston Water
Because LHW is very soft and has low alkalinity with an ambient pH of approximately
6.5, and because the current treatment consists of alum coagulation, these pilot studies examined
performance at SDS incubation pH levels of 6 and 8. The full-scale plant operates at a Cli/N
ratio of 5/1.
Operating conditions are outlined below:
Run 1: Cla/N of 3/1, ambient bromide concentration, conventional coagulation,
prechloramination. One set of SDS effluent samples was collected and incubated
at pH 8.
115
Run 2: C^/N of 3/1, ambient bromide concentration, conventional coagulation,
postchloramination. One set of SDS effluent samples was collected and incubated
at pH 8.
Runs 3A and 3B: Cb/N of 3/1, ambient bromide concentration, prechloramination,
enhanced coagulation. Two sets of SDS effluent samples were collected, one
incubated at pH 8 and the other incubated at pH 6. This allowed an assessment of
the impact of pH utilizing the enhanced coagulation pH (6) and a pH level (8) for
corrosion control.
Runs 4A and 4B: C^/N of 3/1, ambient bromide concentration, enhanced
coagulation, chloramination after filtration. This test was conducted to assess
moving the point of disinfection because CT credit will not be given in the
proposed Disinfectants/DBP Rule for source water chlorination and
chloramination, because, according to the rule, specified TOC levels must be
removed through enhanced coagulation or softening before disinfection (USEPA
1994b). Two sets of SDS effluent samples were collected, one incubated at pH 8
and the other incubated at pH 6.
Runs 5A and 5B: Cfe/N of 3/1, 0.5 mg/L bromide ion added, prechloramination,
conventional coagulation. Two sets of SDS effluent samples were collected, one
incubated at pH 8 and the other incubated at pH 6.
Each experiment lasted three or four days, with a steady-state sampling period of one to
three days. During this sampling period, samples were collected twice daily for DBF analysis.
California State Project Water
Because CSPW has a pH of nearly 8 and more alkalinity than LHW, operation at other
pH values would not simulate realistic treatment conditions for this water. Both standard
conventional treatment and ozonation with and without biofiltration were studied on CSPW.
MWDSC used a pilot plant with two parallel trains, one of which operated in a conventional
mode with chloramination as the sole disinfectant, whereas the other train operated with
116

ozonation, biofiltration, and chloramination. Also, different process scenarios were studied in
the same pilot plant run by collecting samples before and after biologically active filters. The
samples collected before the filter were filtered through a type A/E glass fiber filter (Gelman
Sciences, Inc., Ann Arbor, Mich.), nominal one-micrometer (urn) pore diameter, in the
laboratory before chloramination to simulate the impact of filtration alone (without
biodegradation).
The batch test conditions of ambient bromide ion concentration pH 8, Cla/N ratios of
3/1 and 5/1, and a final total chlorine residual concentration of about 2 mg/L were selected for
testing at the pilot plant because they represented the most realistic conditions for treatment of
this water. Formerly, MWDSC chloraminated at a 3/1 C12/N ratio and currently (1996) uses a
5/1 ratio. In addition to an increase in scale (-3.5 gpm) and incorporation of flow dynamics, the
pilot plant included conventional alum coagulation and filtration for all runs and preozonation
for two sets of runs. Each run was conducted for a minimum of two days with samples collected
twice daily. Two of the tests were repeated two weeks after the initial runs to assess variability
(i.e., because of source water changes and plant reconfiguration).
Operating conditions are outlined below:
Run 1: Cla/N of 5/1, ambient bromide, source water chloramination, concurrent
addition in rapid mix, conventional alum treatment, SDS incubation at pH 8. This
run was repeated two weeks after the initial test to assess variability (Run 1
repeat).
Run 2: Ch/N of 5/1, ambient bromide, conventional alum treatment, post-
sedimentation, chloramination with delay, SDS incubation at pH 8. The chlorine
and ammonia addition was staggered (i.e., chlorine was added to sedimentation
basin effluent and the ammonia added one minute later to the filter influent), and
mixing was achieved by turbulence in the pipe.
Runs 3A and 3B: C^/N of 5/1, ambient bromide, preozonation and post-filter
chloramination, ozone residual of 0.35 mg/L (required to achieve a 1/2 log of
Giardia inactivation), SDS incubation at pH 8. The ozone dose (applied =
transferred) was 0.75 mg/L (ozone-to-TOC ratio of 0.23/1 mg/mg). One set of
samples was collected before biofiltration (3B) and another set after biofiltration
117

RESULTS
(3A). The A samples were filtered through the pilot plant's biologically active
GAC filters, and the B samples were batch filtered through a type A/E glass fiber
filter (Gelman), nominal 1-um pore diameter, before batch SDS chloramination
(addition of ammonia then chlorine with vigorous mixing). Possibly
biodegradation may have been occurring in the pilot plant before the biofilters (in
the flocculation/sedimentation basins), as the ozonation train of the plant was
operated without any disinfectant residual through the fiocculation and
sedimentation basins. Biodegradation has been observed in MWDSC's oxidation
demonstration plant (Coffey et al. 1996).
Runs 4A and 4B: Cb/N of 5/1, ambient bromide, preozonation and post-filter
chloramination, ozone residual of 0.55 mg/L (required to achieve 2 logs of
Giardia inactivation), SDS incubation at pH 8. The ozone dose (applied =
transferred) was near 1.8 mg/L (or ozone-to-TOC ratio of 0.61 mg/mg). One set
of samples was collected before biofiltration (4B) and another set after
biofiltration (4A). Samples collected before biofiltration were conventionally
filtered in the laboratory as described above. Both sets of samples were then
batch chloraminated. In an effort to remove any biologically active sites in the
pilot plant flocculation/sedimentation basins, the basins were cleaned and these
runs repeated (Runs 4A repeat and 4B repeat).
Run 5: Cb/N of 3/1, ambient bromide, source water chloramination, concurrent
addition in rapid mix followed by conventional alum treatment. The target SDS
pH was 8. This test allowed comparison with Task la batch study data and also
showed the effect of a different Cb/N ratio.
All of the pilot plants produced effluent turbidities between 0.05 and 0.37 NTU, with
most of the values below 0.15 NTU. Thus, the pilot plants were operating well. Note that the
ammonia-nitrogen (Ntb-N) concentration was not measured. The nitrogen dose was calculated
based on the desired Cb/N ratio and the measured chlorine dose.
118

Lake Austin Water
The data from the eight individual runs are presented in Tables B.I to B.8 in Appendix B.
The data in Table 7.1 are a summary of the key average output values for all eight runs. This
allows for an easy comparison of the influence of the variable operating conditions on the quality
of the effluent.
Residual Disinfectant Species and Concentration
No dichloramine was present in any of the effluent samples at the end of the SDS test.
Also, most of the total residuals were near the target concentration of 2 mg/L.
Disinfection By-Product Formation
Trihalomethanes. The TTHM concentrations were less than 10 ug/L in all of the runs.
The highest TTHM concentration occurred in Run 3, which had the highest source water TOC
concentrations of those runs for which this parameter was measured (4.6 mg/L versus 2.5 to 3.6
mg/L). Note that because of the greater amount of precursor material, Run 3 had the highest
chlorine demand. Thus, to achieve the target residual concentration, more chlorine was added to
Run 3. This may have contributed to the higher concentrations of TTHMs. Moving the point of
chloramine application to after filtration (Run 4) did demonstrate, however, that if direct
filtration was allowed to be completed prior to disinfectant application, TTHM concentrations
would be lower. On the other hand, Run 4 also had 1.0 mg/L less TOC in the source water,
which confounds the analysis.
Haloacetic acids. The HAA6 concentrations were typically in the range of 10 to
20 ug/L. Ozonation, however, did have a positive influence on the removal of HAA6 precursor
119
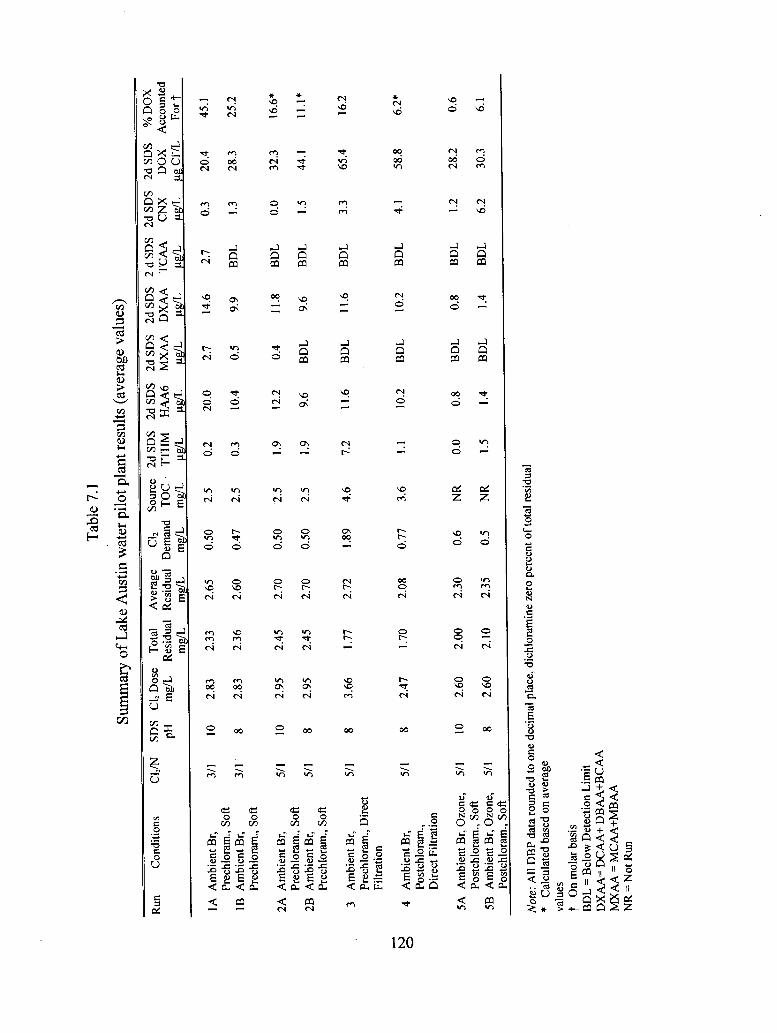
Tabl
e 7.
1
Sum
mar
y of
Lak
e A
ustin
wat
er p
ilot p
lant
resu
lts (
aver
age
valu
es)
Run
C
ondi
tions
1A A
mbi
ent B
r,Pr
echl
oram
., So
ftIB
Am
bien
t Br,
Prec
hlor
am.,
Soft
2A A
mbi
ent B
r,Pr
echl
oram
., So
ft2B
Am
bien
t Br,
C12/N 3/1
3/1
5/1
5/1
SDS
pH 10 8 10 8
C12 D
ose
mg/
L
2.83
2.83
2.95
2.95
Tota
l R
esid
ual
mg/
L
2.33
2.36
2.45
2.45
Ave
rage
R
esid
ual
mg/
L
2.65
2.60
2.70
2.70
C12
Dem
and
mg/
L
0.50
0.47
0.50
0.50
Sour
ce
TOC
m
g/L
2.5
2.5
2.5
2.5
2dSD
S TT
HM
ug
/L
0.2
0.3 1.9
1.9
2dSD
S H
AA
6 ug
/L
20.0
10.4
12.2
9.6
2dSD
S M
XA
A
ug/L
2.7
0.5
0.4
BD
L
2dSD
S D
XA
Aug
/L
14.6
9.9
11.8
9.6
2dS
DS
TC
AA
Ug/
L
2.7
BD
L
BD
L
BD
L
2dSD
S C
NX
ug
/L
0.3 1.3
0.0 1.5
2dSD
S D
OX
ug
ClT
L
20.4
28.3
32.3
44.1
% D
OX
A
ccou
nted
F
ort
45.1
25.2
16.6
*
11.1
*
Prec
hlor
am.,
Soft
3 A
mbi
ent B
r, 5/
1 Pr
echl
oram
., D
irect
Fi
ltrat
ion
4 A
mbi
ent B
r, 5/
1 Po
stch
lora
m.,
Dire
ct F
iltra
tion
5A A
mbi
ent B
r, O
zone
, 5/
1Po
stch
lora
m.,
Soft
5B A
mbi
ent B
r, O
zone
, 5/
1Po
stch
lora
m.,
Soft
8 3.66
1.77
8 2.47
1.70
10
2.60
2.00
8 2.60
2.10
2.72
1.89
4.6
7.2
2.08
0.77
3.6
1.1
2.30
0.6
NR
0.0
2.35
0.5
NR
1.5
11.6
BDL
11.6
BDL
3.3
65.4
16.2
10.2
BDL
10.2
BDL
4.1
58.8
6.2*
0.8
BDL
0.8
BDL
1.2
28.2
0.6
1.4
BDL
1.4
BDL
6.2
30.3
6.1
Note:
All
DB
F da
ta ro
unde
d to
one
dec
imal
pla
ce, d
ichl
oram
ine
zero
per
cent
of t
otal
res
idua
l
* C
alcu
late
d ba
sed
on a
vera
geva
lues
t O
n m
olar
bas
isB
DL
= B
elow
Det
ectio
n Li
mit
DX
AA
= D
CA
A+
DB
AA
+BC
AA
MX
AA
= M
CA
A+M
BA
AN
R =
Not
Run

as evidenced by the lower concentrations in Runs 5A and 5B (i.e., 0.8 to 1.4 ug/L). Because
ozone can oxidize bromide to bromate, HAA concentrations may have been lower because the
inorganic precursor bromide was lessened in concentration. In other LAW runs, bromine-
substituted HAAs dominated the HAA6 formation. Miltner et. al (1992) observed such a
phenomenon during ozonation studies of bromide-containing waters. In contrast to the TTHMs,
completion of direct filtration prior to chloramination (Run 4) did not lower the HAA6
concentration. An inspection of the data in Table 7.1 shows that the dihalogen-substituted acetic
acids (DXAA) dominated the HAA6 formation in all runs. Chloramines may preferentially form
DXAAs. Smith et al. (1993) found that TCAA was the principal HAA formed during
chlorination, whereas it was not detected during chloramination, yet appreciable formation of
DXAA did occur during chloramination.
Cyanogen halides. CNXs undergo base-catalyzed hydrolysis. Thus, their formation and
stability were high when both treatment and distribution were at pH 8 (i.e., Runs 3 and 4). CNX
formed to a slightly greater extent when incubated at pH 8 after softening at pH 10 (Run 5B),
whereas incubation at pH 10 destroyed them. As with HAA6, moving the point of
chloramination in a direct filtration scheme (compare Run 3 with Run 4) did not influence the
formation of CNX. CNBr was only formed in Run 5B, after ozonation and incubation at pH 8.
The formation of CNBr by ozonation has also been reported in the literature (Krasner et al.
199 la).
Dissolved organic halogen. The most DOX was formed in Runs 3 and 4, at a Ck/N ratio
of 5/1 and an incubation pH of 8 (which is consistent with Task la results), with moving the
point of chloramination having little effect. In every case, Run IB, 2B, and 5B, incubating the
effluent sample at lower pH increased the concentration of DOX somewhat. Comparing Runs
1A and IB with Runs 2A and 2B, respectively, indicates that using a Cb/N ratio of 3/1 produced
somewhat less DOX than a C^/N ratio of 5/1. Comparing Runs 2A and 2B with Runs 5A and
5B, respectively, shows the positive influence of ozonation on destroying DOX precursor.
Finally, the DOX concentration was higher in Run 3 (65.4 ug C17L) as compared to Run
2B (44.1 ug C17L). The chloramination conditions of these runs were identical, except Run 3
was direct filtration without softening of a source water with a TOC concentration of 4.6 mg/L
and Run 2B involved softening of a source water only containing 2.5 mg/L of TOC. TOC
121

removal was 35 percent in the direct filtration run (i.e., effluent TOC of 3.0 mg/L), and although
TOC removal was not measured in Run 2B, traditionally it has not been high during the
softening of LAW. Thus, the major difference between the two runs was the TOC concentration.
Percentage of DOXAccounted for by the Measured DBFs
The percentage of DOX that was accounted for by the 12 measured DBFs ranged from
0.6 percent in Run 5 A to 45.1 percent in Run 1A. In three of the runs, Run 2A, 2B and 4, none
of the individual samples were complete enough to allow the calculation of a recovery
percentage (i.e., not all 12 DBFs were measured in any one sample set), so it was calculated
based on the average values of the 12 measured DBFs measured throughout the runs. The
relatively high concentration of HAA6 and the relatively low concentration of DOX in Run 1A
accounted for the higher percentage of DOX that was accounted for by the 12 measured DBFs in
this test.
Comparison With Task la and Ib Data
The data reported in Chapters 5 (Task la) and 6 (Task Ib) were used for comparison with
the Task 2 data. In Task la, preformed chloramines were added to untreated water, and in Task
Ib chlorine and ammonia were added to untreated water at various mixing intensities. Because
mixing was intense in the rapid mix portion of the pilot plants, the "high" mixing energy data
will be used for comparison to Task 2. Only two runs were performed where all of the
parameters could be compared to Task la and Ib data collected under a similar pH and Cb/N
ratio. In these two situations (Table 7.2), the data agreed fairly well, even though LAW was
tested at different points in time for these three experiments (Task la, Task Ib, and Task 2).
Note that for every situation except the CNX concentration incubated at pH 8, the concentrations
of the SDS DBFs were higher in the pilot plant effluent than in the Task Ib "high" mix
investigation. This may indicate that somewhat less mixing occurred in the pilot plant than in
the Task Ib batch tests. On the other hand, in Task 2, Run 1A and IB, the prechloraminated
water was held at pH 9.5 during the softening part of the treatment; thus, this high pH may have
122

affected some DBFs before the start of the SDS test on the pilot plant effluent (e.g., hydrolysis of
CNX at pH 9.5 before SDS testing at pH 8 in Run IB). This did not occur in the Task Ib study.
Lake Houston Water
The data from the eight individual runs are presented in Tables B.9 to B.I6 in Appendix
B. The data in Table 7.3 are a summary of the key average output values for all eight runs. This
allows for an easy comparison of the influence of the variable operating conditions on the quality
of the effluent.
Residual Disinfectant Species and Concentration
Dichloramine was present in the effluent samples at the end of the SDS test in the three
incubations conducted at pH 6, Runs 3B (41 percent), 4B (15 percent), and 5B (31 percent). A
little free chlorine was present after incubation of a few of the Run 1, Run 5 A, and Run 5B
Table 7.2
Comparison of Task 2 and Tasks la and Ib with data for Lake Austin water
TOC, mg/L
Br', mg/L
TTHMs, ug/L
HAA6, ug/L
CNX, ug/L
DOX, ug C17L
% DOX Accounted for
C12/N = 3/1Task 2
Run 1A*2.5
0.3
0.2
20.0
0.3
20.4
45.1
, Incubation pHIOTask la Task Ib
"High" Mix3.1
0.24
BDL
3.2
BDL
BDL
IND
3.1
0.24
BDL
6.3
BDL
11.5
14.3
C12/N = 3/1Task 2
Run IB*2.5
0.3
0.3
10.4
1.3
28.3
25.2
[, IncubationTask la
3.1
0.24
BDL
6.2
4.3
31.5
13.5
pH8Task Ib
"High" Mix3.1
0.24
BDL
9.3
1.7
23.3
10.6
* At pH 9.5 during treatment by lime softening BDL = Below detection limit. IND = Indeterminable, DOX concentration below detection limit.
123

Tabl
e 7.
3
Sum
mar
y of
Lak
e H
oust
on w
ater
pilo
t pla
nt r
esul
ts (
aver
age
valu
es)
C12
2d
2d
2d
2d
2d
2d
2d
%
Run
C
ondi
tions
C1
2/N
Inc.
D
ose
Tota
l C1
2 So
urce
Ef
f. R
emov
e SD
S SD
S SD
S SD
S SD
S SD
S SD
S D
OX
pH
mg/
L R
esid
ual
Dem
and
TOC
TO
C
TOC
TT
HM
H
AA
6 M
XA
A
DX
AA
TC
AA
C
NX
D
OX
A
ccou
nted
mg/
L m
g/L
mg/
L %
%
ug
/L
ug/L
ug
/L
ug/L
ug
/L
ug/L
ug
C17
L Fo
r**
1 A
mb.
Br,
Prec
hlor
am.,
3/1
8 9.
00
2.80
6.
20
4.5
2.06
* 54
3.
6 19
.9
0.5
18.5
0.
9 0.
3 10
4.2
6.4
Con
v. C
oag
2 A
mb.
Br,
Con
v. C
oag.
3/
1 8
8.00
2.
80
5.20
12
.3
3.95
68
4.
0 14
.1
BD
L 12
.5
1.6
10.6
10
8.1
6.5
Post
chlo
ram
inat
ion
» »
to
-^
3A
Am
b. B
r, Pr
echl
oram
., 3/
1 8
7.20
1.
50
5.70
10
.1
3.13
69
6.
3 23
.5
BD
L 21
.4
2.1
6.8
101.
6 10
.7
Enh.
Coa
g.
3B
Am
b. B
r, Pr
echl
oram
., 3/
1 6
7.20
1.
80
5.40
10
.1
3.13
69
5.
8 25
.7
BD
L 23
.5
2.1
9.8
112.
3 9.
5
Enh.
Coa
g.
4A
Am
b. B
r, En
h. C
oag.
, 3/
1 8
7.70
2.
80
4.90
10
.3
3.37
67
7.
3 23
.2
1.1
20.1
3.
3 1.
9 81
.9
14.4
Post
chlo
ram
inat
ion
4B
Am
b. B
r, En
h. C
oag.
, 3/
1 6
7.00
3.
00
4.00
10
.3
3.37
67
8.
3 5.
2f
BD
L 4.
1 J
0.6
20.7
§ 11
2.0
10.9
Post
chlo
ram
inat
ion
(con
tinue
s)
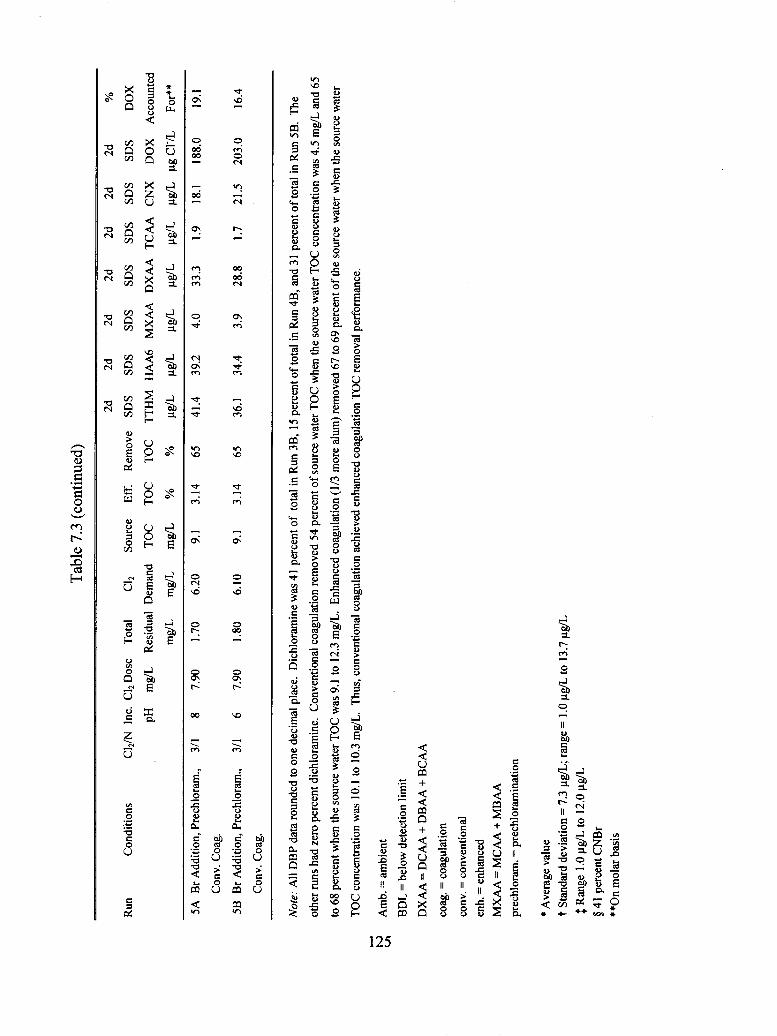
Tabl
e 7.
3 (c
ontin
ued)
2d
2d
2d
2d
2d
2d
2d
%
Run
C
ondi
tions
C1
2/N
Inc.
Cl2
Dos
e To
tal
C12
Sour
ce
Eff.
Rem
ove
SDS
SDS
SDS
SDS
SDS
SDS
SDS
DO
X
pH
mg/
L R
esid
ual
Dem
and
TOC
TO
C
TOC
TT
HM
H
AA
6 M
XA
A
DX
AA
TC
AA
C
NX
D
OX
A
ccou
nted
mg/
L m
g/L
mg/
L %
%
ug
/L
ug/L
ug
/L
ug/L
ug
/L
ug/L
ug
ClY
L Fo
r**
5A B
r Add
ition
, Pre
chlo
ram
., 3/
1 8
7.90
1.
70
6.20
9.
1 3.
14
65
41.4
39
.2
4.0
33.3
1.
9 18
.1
188.
0 19
.1
Con
v. C
oag.
5B
Br A
dditi
on, P
rech
lora
m.,
3/1
6 7.
90
1.80
6.
10
9.1
3.14
65
36
.1
34.4
3.
9 28
.8
1.7
21.5
20
3.0
16.4
Con
v. C
oag.
Note:
All
DB
F da
ta ro
unde
d to
one
dec
imal
pla
ce.
Dic
hlor
amin
e w
as 4
1 pe
rcen
t of
tota
l in
Run
3B
, 15
per
cent
of t
otal
in R
un 4
B, a
nd 3
1 pe
rcen
t of t
otal
in
Run
5B.
The
othe
r run
s ha
d ze
ro p
erce
nt d
ichl
oram
ine.
Con
vent
iona
l coa
gula
tion
rem
oved
54
perc
ent o
f sou
rce
wat
er T
OC
whe
n th
e so
urce
wat
er T
OC
con
cent
ratio
n w
as 4
.5 m
g/L
and
65
to 6
8 pe
rcen
t whe
n th
e so
urce
wat
er T
OC
was
9.1
to
12.3
mg/
L. E
nhan
ced
coag
ulat
ion
(1/3
mor
e al
um)
rem
oved
67
to 6
9 pe
rcen
t of t
he s
ourc
e w
ater
whe
n th
e so
urce
wat
er
TOC
con
cent
ratio
n w
as 1
0.1
to 1
0.3
mg/
L. T
hus,
conv
entio
nal c
oagu
latio
n ac
hiev
ed e
nhan
ced
coag
ulat
ion
TOC
rem
oval
per
form
ance
.
Am
b. =
am
bien
t
BD
L =
belo
w d
etec
tion
limit
DX
AA
= D
CA
A +
DB
AA
+ B
CA
A
coag
. = c
oagu
latio
n
conv
. = c
onve
ntio
nal
enh.
= e
nhan
ced
MX
AA
= M
CA
A +
MB
AA
prec
hlor
am. =
pre
chlo
ram
inat
ion
* Ave
rage
val
uef
Stan
dard
dev
iatio
n =
7.3
ug/L
; ran
ge =
1.0
ug/
L to
13.
7 ug
/L}
Ran
ge 1
.0 u
g/L
to 1
2.0
ug/L
§41
perc
ent C
NB
r**
On
mol
ar b
asis
samples, but the concentrations were only 0.3 mg/L or less. The total residuals varied from 1.5 to
3.0 mg/L, fairly close to the target of 2 mg/L, and the chlorine demand varied from 4.0 to 6.2
mg/L.
Disinfection By-Product Formation
Trihalomethanes. The TTHM concentrations were less than 10 ug/L in all of the ambient
bromide runs. The highest TTHM concentrations occurred in Runs 5A and 5B (i.e., 41.4 and
36.1 ug/L, respectively), when the source water was spiked with bromide ion. Dibromochlo-
romethane and bromoform both were formed at both incubation pHs in the bromide-spiked runs.
A little bromine substitution did occur even when bromide ion was not added, where the ambient
bromide ion concentration was about 0.05 mg/L. Increasing the alum dose from 66 to 88 mg/L
in an attempt to enhance the coagulation process did not result in a decline in the SDS TTHM
concentrations.
The TOC removal in the "conventional" coagulation runs were: Run 1 54 percent, Run
2 68 percent, and Run 5 65 percent. Increasing the alum dose from the usual 66 mg/L to 88
mg/L, a 33 percent increase in coagulant (Runs 3A and 3B and 4A and 4B), resulted in 69
percent TOC removal in Runs 3A and 3B and 67 percent TOC removal in Runs 4A and 4B.
Higher doses of coagulant could not be used (without concurrent caustic addition) because of
insufficient alkalinity in the source water to buffer the acidic properties of the alum. Except for
Run 1, which had a relatively low source water TOC concentration (4.5 mg/L), the range of the
effluent TOC concentration was from 3.13 to 3.95 mg/L. The high removal percentages were
greater than called for in the M/DBP Rule in the enhanced coagulation section, even though
conventional alum doses were used. Moving the point of chloramination had no impact in this
set of runs.
Haloacetic acids. In Run 3A compared with 3B and Run 5A compared with 5B, the
incubation pH did not have a significant effect on 2d SDS HAA6 concentrations. Furthermore,
comparing Run 1 with 2 and Run 3A with 4A, the point of chloramination did not influence 2d
SDS HAA6 concentrations. Adding bromide ion in Runs 5A and 5B did increase the 2d SDS
HAA6 concentration from a typical range of 14.1 to 25.7 ug/L at ambient bromide ion
concentration to 34.4 to 39.2 ug/L for the bromide-spiked samples. Dichloroacetic acid (DCAA)
126

was the predominant HAA produced in the ambient-bromide samples, whereas trichloroacetic
acid (TCAA) was formed at relatively low levels. In the bromide-spiked samples, high
concentrations of DCAA, bromochloroacetic acid (BCAA) and dibromoacetic acid (DBAA)
were produced. In general, the DXAAs dominated the HAA6 formation, suggesting that
chloramines minimize TTHM and TCAA formation, but not that of DXAA.
With respect to 2d SDS HAA6, Run 4B was problematic. The 2d SDS HAA6
concentration was 13.7 ug/L in one test (which is comparable to that detected in other ambient-
bromide runs, 14.1 to 25.7 ^ig/L), whereas almost none of the HAAs were detected in the other.
All of the other HAA6 concentrations in this run suggest analytic problems.
Cyanogen halides. Changing from prechloramination to postchloramination resulted in a
large increase in the concentration of CNX from Runs 3B and 4B, whereas in comparing Runs
3A and 4A a decrease occurred. Although the concentration of CNX increased from Run 1 to
Run 2, the source water TOC concentration also increased by almost threefold. In general,
incubating the SDS samples at pH 8 rather than pH 6 resulted in less CNX being formed;
compare Runs 3A, 4A, and 5A with Runs 3B, 4B, and 5B. In Runs 5A and 5B, more CNBr was
formed than in the ambient bromide runs, except for Run 4B, in which a surprisingly high
amount of CNBr was formed in spite of only 0.05 mg/L bromide ion being present.
Dissolved organic halogen. Changing the point of chloramination from the source water
to the filtered water had little effect on the concentration of 2d SDS DOX formed. The small
decline that occurred when comparing Run 3A with 4A may have been because the water in Run
3A was at the low pH of the pilot plant (about 4.8) for nearly 2.5 hours plus the time elapsed
until the sample was returned to the laboratory for pH adjustment. In Run 4A, as the water
exited the filter, it was pH adjusted and chloraminated. Thus, chloramines were never in this
sample at acidic pH.
When free chlorine is used (as has been shown in other studies), changing the point of
chlorination has a significant influence on DOX formation. Possibly the kinetics of DOX
formation during chloramination are relatively slow compared to the time it takes to remove the
TOC; thus, the point of chloramine application may be less critical.
As noted before, the two coagulation conditions (conventional versus enhanced) were not
that different. Samples incubated at pH 6 produced somewhat more DOX than samples
127

incubated at pH 8. Fleischacker and Randtke (1983) also showed that lower incubation pH
favors the formation of DOX.
Runs 5A and 5B, in which bromide ion was added to the source water, produced the most
2d SDS DOX, even though the DOX test underreports dissolved organic bromine (DOBr)
because the test reports all halogen measured as chloride. In the ambient-bromide samples, the
DOX concentration ranged from 81.9 to 112.0 ^g C17L, whereas in the bromide-spiked samples
the DOX concentration was 188.0 to 203.0 ng C17L. As shown with the THM analyses in Runs
5 A and 5B, more bromine was substituted when the bromide ion level was raised.
Percentage of DOX Accounted for by the Measured DBFs
Relatively low percentages of DOX were accounted for by the 12 measured DBFs in
these samples, except for Runs 5A and 5B (bromide-spiked samples), in which the percentages
were somewhat higher. In the presence of excess bromide ion, the TTHM, HAA6 and CNX
concentrations were relatively high (the numerator in the calculation), and the DOBr was under-
reported (therefore the DOX the denominator in the calculation is unnaturally low); thus the
percent recoveries were a little higher. All percentages were, however, based on molar
concentrations to minimize problems associated with bromine-substituted DBF formation when
compared to DOX measurement on a chloride basis.
Comparison With Task la and Ib Data
Six runs were performed where all of the parameters could be compared to Task la data
(adding preformed chloramines to untreated water) and three runs could be compared to Task Ib
data (simultaneous addition of chlorine and ammonia with "high" mixing energy) collected
under similar incubation pH and Cla/N ratios. In these comparisons (Table 7.4), the largest area
of variation was the CNX data for Runs 2, 3 A, 4B and 5B. CNX formation was more variable
than that of the other DBFs. Explaining the difference in the HAA6 concentration in Task la as
compared to Run 4B (which was anomalous when compared to the other Task 2 runs and
appeared to have analytic problems) is difficult. The rest of the comparisons were fairly good,
128
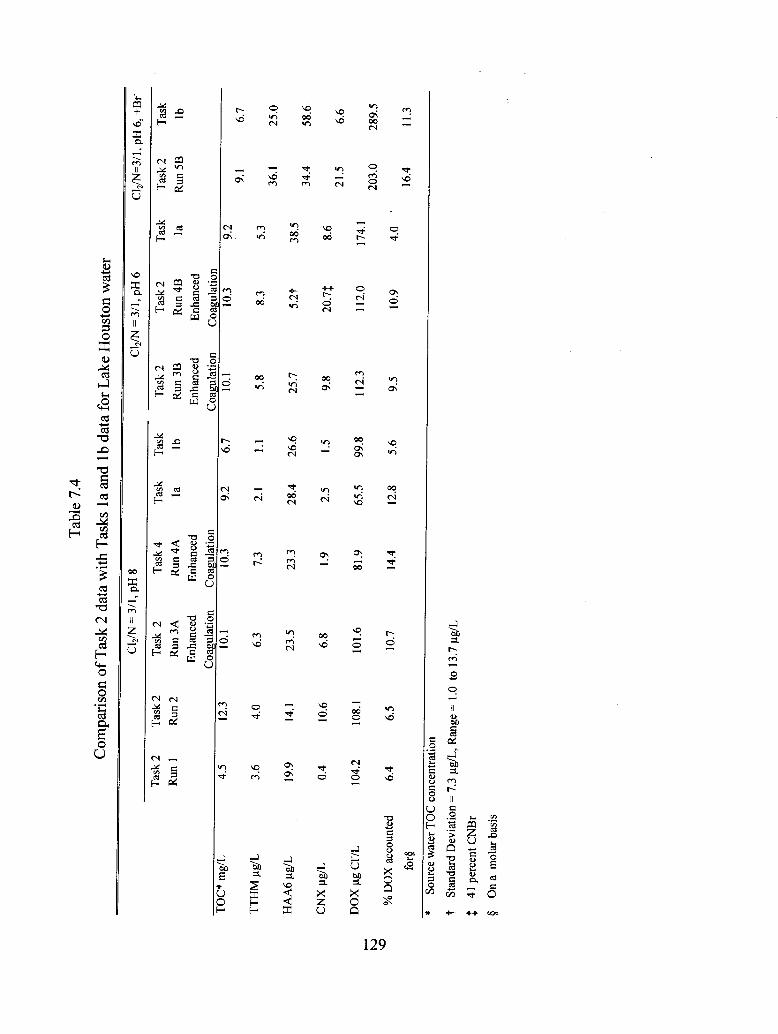
to
Tab
le 7
.4
Com
pari
son
of T
ask
2 da
ta w
ith T
asks
la
and
Ib d
ata
for
Lak
e H
oust
on w
ater
TOC
* m
g/L
TTH
M u
g/L
HA
A6
ug/L
CN
Xug
/L
DO
X u
g C1
VL
% D
OX
acc
ount
ed
for§
Task
2
Run
1
4.5
3.6
19.9
0.4
104.
2
6.4
Task
2
Run
2
12.3
4.0
14.1
10.6
108.
1
6.5
C12/N
= 3
/1,
Task
2
Run
3A
Enha
nced
Coa
gula
tion
10.1
6.3
23.5
6.8
101.
6
10.7
,pH
8 Task
4
Run
4A
Enha
nced
Coa
gula
tion
10.3
7.3
23.3
1.9
81.9
14.4
Cl2/N
= 3
/l,p
H6
Task
la 9.2
2.1
28.4
2.5
65.5
12.8
Task
Ib 6.7
1.1 26.6
1.5
99.8
5.6
Task
2
Run
3B
Enha
nced
Coa
gula
tion
10.1
5.8
25.7
9.8
112.
3
9.5
Task
2
Run
4B
Enha
nced
Coa
gula
tion
10.3
8.3
5.2T
20.7
J
112.
0
10.9
Task
la 9.2
5.3
38.5
8.6
174.
1
4.0
C12/N
=3/1
,
Task
2
Run
5B
9.1
36.1
34.4
21.5
203.
0
16.4
pH 6
, +B
r-
Task
Ib 6.7
25.0
58.6
6.6
289.
5
11.3
* So
urce
wat
er T
OC
con
cent
ratio
n
t St
anda
rd D
evia
tion
= 7.
3 ug
/L, R
ange
=1.
0 to
13.
7 ug
/L}
41 p
erce
nt C
NB
r
§ O
n a
mol
ar b
asis

considering that these tests were performed on source water sampled at different points in time
and that the method of applying the chloramines was different.
California State Project Water
The data from the ten individual runs are presented in Tables B. 17 to B.26 of Appendix
B. The data in Table 7.5 are a summary of the key average output values for all ten runs. This
allows for an easy comparison of the influence of the variable operating conditions on the quality
of the effluent.
Residual Disinfectant Species and Concentration
No dichloramine was present in any of the effluent samples at the end of the SDS test.
Also, most of the total residuals were slightly less than the target residual of 2 mg/L. The data in
Table 7.5 show a slight increase in chlorine demand in the runs that included biofiltration, 3A
and 4A, when compared to the companion runs with conventional filtration, 3B and 4B.
Disinfection By-Product Formation
Trihalomethanes. The TTHM concentrations were very low in seven of the ten runs (< 5
ug/L), Runs 3A and 3B, 4A and 4B (including repeats) and Run 5. These were the runs in which
ozone was the primary disinfectant and chloramines were added post-filtration, albeit by bench-
scale addition, and the one run with a Ch/N ratio of 3/1.
In Run 1 and Run 1 repeat (5/1 Cb/N ratio), the TTHMs were much higher than
produced by preformed chloramines in Task la (24 to 40 |j.g/L versus below detection limit) and
may have been caused by localized free chlorine concentrations in the pilot plant. This would
also be consistent with the pilot plant operator's observation that the total chlorine residuals were
difficult to adjust and even decreased when the free chlorine dose increased (indicating that the
maximum (5/1 C^/N ratio) on the breakpoint curve had been passed). The Run 1 repeat TTHM
130

Tabl
e 7.
5
Sum
mar
y of
Cal
ifor
nia
Stat
e Pr
ojec
t wat
er p
ilot p
lant
res
ults
(av
erag
e va
lues
)
Run
C
ondi
tions
C1
2/N
SDS
CI2
Tota
l C1
2 So
urce
2d
SD
S 2d
SD
S 2d
SD
S 2d
SD
S 2d
SD
S 2d
SD
S 2d
SD
S 2d
SD
S 2d
SD
S %
DO
XpH
D
ose
Res
. D
eman
d TO
C
TTH
M
HA
A6
MX
AA
D
XA
A
TCA
A
CN
X
CNC1
C
NB
r D
OX
A
ccou
nted
for*
m
g/L
mg/
L m
g/L
mg/
L ug
/L
ug/L
ug
/L
ug/L
ug
/L
ug/L
ug
/L
ug/L
ug
C17
L
1 A
mbi
ent B
r, Pr
eNH
2Cl,
Con
curr
ent A
dditi
on, A
lum
1 R
epea
t
2 A
mbi
ent B
r, A
lum
, Po
stN
H2C
l w/d
elay
f
3A A
mbi
ent B
r, Pr
eO3 (
0.35
mg/
LR
esid
ual),
Bio
filtra
tion,
Pos
tNH
2Cl
3B
Am
bien
t Br,
PreO
3 (0.
35 m
g/L
Res
idua
l),C
onve
ntio
nal f
iltra
tion,
Pos
tNH
2Cl
5/1
8 2.
16
1.26
0.
90
5/1
8 2.
95
1.63
1.
32
5/1
8 N
A
1.60
N
A
3.2
23.5
10
.2
0
2.9
39.6
15
.0
0
3.2
44.6
12
.0
0
10.2
0
12.1
5.
2 6.
9 44
.0
45.4
15.0
0
13.8
4.
3 9.
5 73
.6
41.1
11.0
1.
0 20
.6
10.7
J 9.
9 10
9.6
30.4
5/1
8 2.
50
1.55
0.
95
3.2
3.0
2.4
0.4
2.1
0 7.
9 6.
6 1.
3 54
.4
6.3
5/1
8 2.
50
1.68
0.
82
3.2
2.8
3.6§
2.
4 1.
8 0
9.7
9.0*
* 0.
7 56
.7
5.8
4A A
mbi
ent B
r, Pr
eO3 (
0.55
mg/
L 5/
1 8
2.60
1.
64
0.96
Res
idua
l),B
iofil
tratio
n, P
ostN
H2C
l 4A
Rep
eat
5/1
8 2.
60
1.52
1.
08
2.9
3.4
2.6
0
3.0
4.4
3.3
0
2.6
0 5.
6 4.
5 1.1
24
.3
17.7
3.3
0 5.
3 4.
5 0.
8 42
.6
13.1
(con
tinue
s)

Tabl
e 7.
5 (c
ontin
ued)
Run
C
ondi
tions
C1
2/N
SDS
C12
Tota
l C1
2 So
urce
2d
SD
S 2d
SD
S 2d
SD
S 2d
SD
S 2d
SD
S 2d
SD
S 2d
SD
S 2d
SD
S 2d
SD
S %
DO
X
pH
Dos
e R
es.
Dem
and
TOC
TT
HM
H
AA
6 M
XA
A
DX
AA
TC
AA
C
NX
CN
C1
CN
Br
DO
X
Acc
ount
edfo
r*
mg/
L m
g/L
mg/
L m
g/L
ug/L
ug
/L
ug/L
ug
/L
ug/L
ug
/L
ug/L
ug
/L
ug C
1"/L
4B
Am
bien
t Br,
PreO
3 (0.
55 m
g/L
Res
idua
l),C
onve
ntio
nal
filtra
tion,
Post
NH
2Cl
4B
Rep
eat
5 A
mbi
ent B
r, Pr
eNH
2Cl,
Con
curr
ent A
dditi
on, A
lum
5/1
8 2.
60
1.81
0.
79
2.9
3.8
2.1
02.
10
5.1
5/1
8 2.
60
1.74
0.
86
3.0
4.6
5.7
0.5
5.2
0 6.
2
3/1
8 3.
20
2.73
0.
47
NA
1.
4 12
.7
1.5
11.2
0
4.0
4.4
0.7
44.9
12
.6
5.4
0.9
39.0
15
.3
3.0
1.0
44.4
6.
2
Note:
All
DB
F da
ta ro
unde
d to
one
dec
imal
pla
ce.
No
dich
lora
min
e in
any
of t
he s
ampl
es.
Val
ues
belo
w d
etec
tion
limit
are
liste
d as
zer
o.
DXAA = DCAA + DBAA + BCAA
MXAA = MCAA + MBAA
NA
= n
ot a
vaila
ble
Post
NH
2C1
= po
stch
lora
min
atio
n
Pre
NH
2C1
= pr
echl
oram
inat
ion
Pre
O3=
pre
ozon
atio
nR
es. =
resi
dual
*On
a m
olar
bas
ist
Chl
orin
e ad
ded
first
, the
n am
mon
ia
J R
ange
= 5
.4-1
7.5
ug/L
§ St
anda
rd d
evia
tion
= 1.
4 u.
g/L
**R
ange
= 5
.9-1
4.1
ug/L

results were even higher than the original Run 1 by approximately 70 percent. The variation
may have been caused by differences in chloramine demand (0.9 and 1.3 mg/L in Run 1 and Run
1 repeat, respectively), source water changes, mixing, or a combination of these factors. The
Cb/N ratio for Runs 1 and 5 were 5/1 and 3/1, respectively, and may account for the higher
TTHM concentrations that occurred in Run 1 and Run 1 repeat because the Task 1 a data showed,
in general, more TTHM formation as the C^/N ratio was increased. Previous bench-scale work
at the MWDSC (Barrett et al. 1985) has shown that free chlorine exists past the maximum of the
breakpoint curve and before the breakpoint for short contact times near a 5/1 Cb/N ratio, as in
Run 1 and Run 1 repeat, whereas no free chlorine is present at a 3/1 Cb/N ratio, as in Run 5 (see
Figure 2.1).
In Run 2, chlorine was added to the sedimentation basin effluent and ammonia was added
approximately one minute later at the filter influent. This short period of free chlorination
caused the TTHM concentration to increase in Run 2 (44.6 ug/L) to even more than in Runs 1
and 1 repeat.
Haloacetic acids. The HAA6 concentrations were highest in Runs 1, 1 repeat, 2, and 5
(Table 7.5). Ozonation appeared to lower the HAA6 formation in Runs 3 and 4, but the
influence of biofiltration was difficult to assess because the concentration of HAA6 was so low.
Similar HAA6 concentrations were formed in Runs 1 and 1 repeat and Run 5 (similar treatment
scheme), although Run 5 was conducted at a lower Cb/N ratio (3/1) than Runs 1 and 1 repeat
(5/1). As was observed for LAW and LHW, the formation of the dihalogen-substituted HA As
(i.e., DCAA, BCAA, and DBAA) was controlled less by chloramination compared to the
formation of TCAA.
Cyanogen halides. The concentration of CNX was the highest in Run 2, where a short
period of free chlorine existed. Krasner et al. (1991b) observed that a short free chlorine contact
before chloramination produced more CNC1 when compared to concurrent addition of chlorine
and ammonia. Note, however, that the increase in CNC1 concentration in Run 2 (delay between
the addition of chlorine and ammonia) was inconsistent from sample to sample, ranging from 5.4
to 17.5 ug/L.
CNC1 was typically at 4 to 7 ug/L in each run, except for Run 2 (with sequential addition
of chlorine and ammonia) and Run 3B (with ozone and no biofiltration). Pederson et al. (1995)
found that CNC1 formed from the reaction of monochloramine with formaldehyde.
133

Formaldehyde is formed by ozone but can be removed during biofiltration (Krasner et al. 1993).
Thus, ozonation without biofiltration has the potential to increase CNC1, which was observed in
Run 3B but not 4B.
In Runs 1 and 2, CNBr was formed at levels of 6.9 to 9.9 ug/L. In Run 5, at a lower
Cb/N ratio (3/1), the CNBr concentration was only 1.0 ug/L. In Runs 3 and 4 (with ozonation)
CNBr was found at 1.3 to 0.7 ug/L. CNBr can be formed by ozone but can be removed in a
biologically active filter (Krasner et al. 1990). Possibly CNBr was formed during ozonation,
then it was removed during biofiltration, and, finally, less was formed during postchloramination
because the precursors had already been used.
Dissolved organic halogen. The period of free chlorination that existed in Run 2
produced the highest concentration of DOX, 109.6 ug C17L (Table 7.5). The increase in ozone
dose between Runs 3A and 3B and Runs 4A and 4B resulted in a decrease in DOX concentration
(54.4 to 56.7 ug C17L compared to 24.3 to 44.9 ug C17L caused by destruction of precursor),
but biodegrading the sample prior to SDS incubation did not remove any more of the DOX
precursors; compare Runs 3A with 3B and Runs 4A, 4A repeat with 4B, 4B repeat. Runs 1 and
5, in which only the Cb/N ratio changed, produced very similar 2d SDS DOX concentrations.
Run 1 repeat, however, produced a much higher DOX concentration than Run 1 (73.6 vs. 44.0
ug C17L). As noted above, the chloramine demand was somewhat higher for Run 1 repeat.
Percentage DOX Accounted for by the Measured DBFs
The recovery of DOX in the 12 measured DBFs was relatively low for Runs 3 A, 3B, 4A,
4A repeat, 4B, 4B repeat, and 5, ranging from 5.8 to 17.7 percent, because of the low
concentrations of the 12 measured DBFs. In Runs 1, 1 repeat, and 2, where higher concen
trations of the 12 measured DBFs were detected, the amount of DOX accounted for by the 12
measured DBFs was correspondingly higher, 30.4 to 45.4 percent.
Comparison With Task la and Task Ib Data
Only one run (Run 5, where the chlorine and ammonia solutions were simultaneously
added to the influent water) was performed where all of the parameters could be compared to
134
Task la and Task Ib data (adding preformed chloramines to untreated water) collected under a
similar pH and Cb/N weight ratio. For this case (Table 7.6), good agreement was obtained for
THM and DOX for both Task la and Task Ib and for Run 5. Although the HAA6 concentration
in Run 5 was about two times the concentration in Tasks la and Ib, the bromide ion
concentration in Run 5 was almost three times the concentration in Tasks la and Ib.
Two tests also allowed the comparison of TTHM and DOX concentrations, Run 1 and
Run 1 repeat, with Task la. The most significant difference was the higher TTHM
concentrations in Run 1 and Run 1 repeat compared to Task la, which was discussed earlier as
possibly caused by poor mixing conditions in the pilot plant. Note that the TTHMs for Run 1
repeat (39.6 ng/L) were almost the same as the concentrations formed in Run 2 (44.6 \ig/L, see
Table 7.31), in which ammonia addition was deliberately delayed to show the influence of
sequential addition and the presence of some free chlorine.
DISCUSSION
Only the three runs with incubation pHs of 6 produced any dichloramine. Review of
Tables 7.2, 7.4, and 7.6 indicates that where applicable, the Task 2 data agreed fairly well with
the Tasks la and Ib (high mixing intensity) data, with a few notable exceptions. This agreement
occurred in spite of Tasks la and Ib being conducted on source water and Task 2 data being
collected on treated and filtered water. Table 7.7 repeats all of the summary data from Tables
7.2, 7.4, and 7.6 in a single table for easy comparison of the key Task 2 data.
Trihalomethanes
All of the filter effluents produced 2d SDS TTHM concentrations that would meet the
current MCL (0.10 mg/L) and the proposed Stage 1 MCL of 0.080 mg/L. All but two runs,
LHW Run 5A (bromide addition and pH 8 incubation) and CSPW Run 2 (one minute delay in
adding the ammonium chloride), would meet the proposed Stage 2 MCL of 0.040 mg/L. In
addition, LHW Run 5B and CSPW Run 1 repeat produced TTHM levels too close to the
proposed Stage 2 MCL to reliably assure potential compliance under these operating regimes.
135

Table 7.6
Comparison of Task 2 with Tasks la and Ib data for California State Project water
Cl2/N3/l,pH8
TOC, mg/L
Br", mg/L
TTHMs, ng/L
HAA6, ug/L
CNX, jig/L
DOX, ug C17L
% DOXAccounted for
Task 2 Run5
NR
0.28
1.4
12.7
4.0
44.4
6.2
Task la
2.4
0.10
0.7
4.9
2.8
42.5
4.3
Task Ib
2.4
0.10
BDL
6.4
NR
31.1
NA
Cl2/N5/l,pH8
Task 2 Runl
3.2
0.23
23.5
10.2
12.1
44.0
45.4
Task 2 RunlRepeat
2.9
0.23
39.6
15.0
13.8
73.6
41.4
Task la
2.4
0.10
BDL
NR
NR
46.1
NA
BDL = Below detection limits NA = Not applicable NR = Not run
The other variables studied had little measurable influence. With respect to TTHM formation,
two conditions are of paramount importance, the rapid reaction that takes place when bromide
ion is present or when free chlorine is present. Thus, rapid mixing of the chlorine and ammonia
is important if TTHM formation is to be minimized.
Haloacetic Acids
In LHW, incubation pH (i.e., pH 8 vs. 6) did not seem to have much effect; compare
Runs 3A and 3B and Runs 5A and 5B. Except for LHW Runs 5A and 5B (bromide addition),
all of the filter effluents from all three waters produced 2d SDS HAA6 concentrations that would
meet both the proposed Stage 1 (0.060 mg HAA5/L) and Stage 2 MCL (0.030 mg HAA5/L),
even though a sixth HAA (BCAA) was included in the arithmetic sum. In addition, LHW Runs
136

Table 7.7
Summary of pilot plant data for all three waters tested
Run Conditions C12/N
Ratio
Inc.
PH
Total
Res.
mg/L
2d SDS 2d SDS DXAA/ 2d SDS CNC1/ 2d SDS % DOX
TTHM HAA6 HAA6 CNX CNX DOX Account-
ug/L ug/L Ratio ug/L Ratio ug C1VL ed for
Lake Austin water (Table 7.9) *
1A
IB
2A
2B
3
4
5A
5B
Ambient Br, Prechloram.
Ambient Br, Prechloram.
Ambient Br, Prechloram.
Ambient Br, Prechloram.
Ambient Br, Direct Fill., Prechloram.
Ambient Br, Direct Filt.,Postchloram.
Ambient Br, Ozone, Postchloram.
Ambient Br, Ozone, Postchloram.
3/1
3/1
5/1
5/1
5/1
5/1
5/1
5/1
10
8
10
8
8
8
10
8
2.3
2.4
2.5
2.5
1.8
1.7
2.0
2.1
0.2
0.3
1.9
1.9
7.2
1.1
BDL
1.5
20.0
10.4
12.2
9.6
11.6
10.2
0.8
1.4
0.7
1.0
1.0
1.0
1.0
1.0
1.0
1.0
0.3
1.3
0.0
1.5
3.3
4.1
1.2
6.2
1.0
1.0
NA
1.0
1.0
1.0
1.0
0.7
20.4
28.3
32.3
44.1
65.4
58.8
28.2
30.3
45.1
25.2
16.6f
ll.lf
16.2
6.2t
0.6
6.1
Lake Houston water (Table 7.19) J
1
2
3A
3B
4A
4B
5A
5B
Ambient Br, Prechloram., Conv. Coag.
Ambient Br, Conv. Coag. Postchloram.
Ambient Br, Prechloram., Enh. Coag.
Ambient Br, Prechloram., Enh. Coag.
Ambient Br, Enh. Coag., Postchloram.
Ambient Br, Enh. Coag., Postchloram.
Br Addition, Prechloram., Conv. Coag.
Br Addition, Prechloram., Conv. Coag.
3tol
3tol
3tol
3tol
3tol
3tol
3 to 1
3tol
8
8
8
6
8
6
8
6
2.8
2.8
1.5
1.8
2.8
3.0
1.7
1.8
3.6
4.0
6.3
5.8
7.3
8.3
41.4
36.1
19.9
14.1
23.5
25.7
23.2
5.2§
39.2
34.4
0.9
0.9
0.9
0.9
0.9
0.8
0.8
0.8
0.3
10.6
6.8
9.8
1.9
20.7
18.1
21.5
1.0
0.9
1.0
0.7
1.0
0.6
0.1
0.3
104.2
108.1
101.6
112.3
81.9
112.0
188.0
203.0
6.4
6.5
10.7
9.5
14.4
10.9
19.1
16.4
(continues)
137
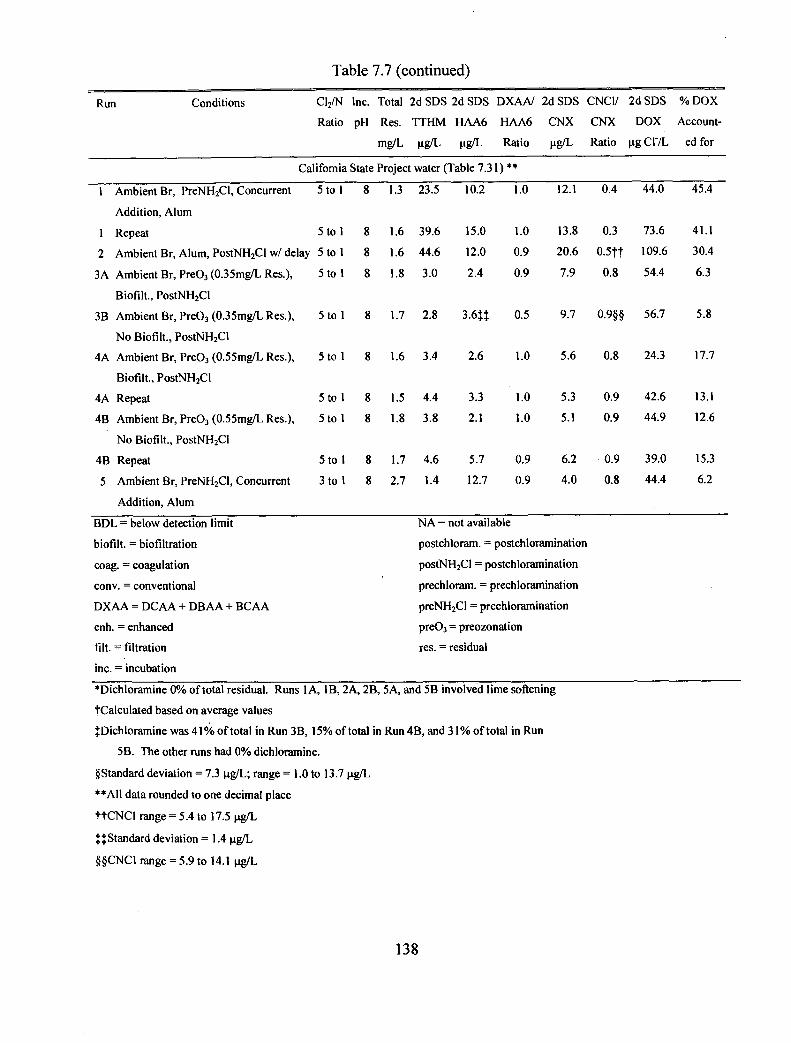
Table 7.7 (continued)
Run Conditions C12/N Inc. Total 2d SDS
Ratio pH Res. TTHM
mg/L ug/L
2dSDS DXAA/ 2d SDS
HAA6 HAA6 CNX
ug/L Ratio ug/L
CNC1/ 2dSDS %DOX
CNX DOX Account-
Ratio ug C1VL ed for
California State Project water (Table 7.31) **
1
1
2
3A
3B
4A
4A
4B
4B
5
Ambient Br, PreNH2Cl, Concurrent
Addition, Alum
Repeat
Ambient Br, Alum, PostNH2Cl w/ delay
Ambient Br, PreO3 (0.35mg/L Res.),
Biofilt., PostNH2Cl
Ambient Br, PreO3 (0.35mg/L Res.),
No Biofilt., PostNH2Cl
Ambient Br, PreO3 (0.55mg/L Res.),
Biofilt., PostNH2Cl
Repeat
Ambient Br, PreO3 (0.55mg/L Res.),
No Biofilt., PostNH2Cl
Repeat
Ambient Br, PreNH2Cl, Concurrent
Addition, Alum
5tol
5tol
5tol
5tol
5tol
5tol
5tol
5tol
5tol
3tol
8
8
8
8
8
8
8
8
8
8
1.3
1.6
1.6
1.8
1.7
1.6
1.5
1.8
1.7
2.7
23.5
39.6
44.6
3.0
2.8
3.4
4.4
3.8
4.6
1.4
10.2
15.0
12.0
2.4
3.6JJ
2.6
3.3
2.1
5.7
12.7
1.0
1.0
0.9
0.9
0.5
1.0
1.0
1.0
0.9
0.9
12.1
13.8
20.6
7.9
9.7
5.6
5.3
5.1
6.2
4.0
0.4
0.3
o.stt0.8
0.9§§
0.8
0.9
0.9
0.9
0.8
44.0
73.6
109.6
54.4
56.7
24.3
42.6
44.9
39.0
44.4
45.4
41.1
30.4
6.3
5.8
17.7
13.1
12.6
15.3
6.2
BDL = below detection limit
biofilt. = biofiltration
coag. = coagulation
conv. = conventional
DXAA = DCAA + DBAA + BCAA
enh. = enhanced
filt. = filtration
inc. = incubation
NA = not available
postchloram. = postchloramination
postNH2Cl = postchloramination
prechloram. = prechloramination
preNH2Cl = prechloramination
preO3 = preozonation
res. = residual
*Dichloramine 0% of total residual. Runs 1A, IB, 2A, 2B, 5A, and 5B involved lime softening
*( Calculated based on average values
{Dichloramine was 41% of total in Run 3B, 15% of total in Run 4B, and 31% of total in Run
5B. The other runs had 0% dichloramine.
§Standard deviation = 7.3 ug/L; range = 1.0 to 13.7 ug/L
**A11 data rounded to one decimal place
ttCNCI range = 5.4 to 17.5 ug/L
tJStandard deviation = 1.4 ug/L
§§CNCI range = 5.9 to 14.1 ng/L
138

3A, 3B, and 4A produced HAA6 levels too close to the proposed Stage 2 MCL to reliably assure
potential compliance under these operating regimes.
Ozonation in LAW Runs 5A and 5B and CSPW Runs 3A, 3B, 4A, 4B, 4A repeat, and 4B
repeat altered the HAA6 precursor material including the inorganic precursor bromide so that
significantly lower concentrations of 2d SDS HAA6 were formed. The other variables studied
had little measurable influence.
The ratio of (DCAA+DBAA+BCAA)/HAA6 was consistently high in all runs in all three
waters (0.7 to 1.0), except for Run 3B in CSPW, where the low (DCAA+DBAA+BCAA)/HAA6
ratio may have been caused by the high standard deviation in the HAA6 data. These high
(DCAA+DBAA+BCAA)/HAA6 ratios indicate that chloramines are less able to control the
dihalogen-substituted haloacetic acids as compared to the monohalogen-substituted HAAs and
TCAA. During the ozonation of fulvic acid, Reckhow and Singer (1984) observed that TCAA
precursors were destroyed whereas the precursors of DCAA were not. This again indicates that
the precursors of TCAA and DCAA are different.
Cyanogen Halides
When comparing higher and lower incubation pHs in LAW and LHW, the lower
incubation pH always produced more 2d SDS CNX; compare LAW Runs 1A and IB, 2A and
2B, and 5A and 5B and LHW Runs 3A and 3B, 4A and 4B, and 5A and 5B. In LAW, the higher
incubation pH of 10 produced low CNX concentration because of base-catalyzed hydrolysis. In
LHW, in which the incubation pHs were 6 and 8, hydrolysis should have been less problematic.
Compared to data from other runs, high 2d SDS CNX concentrations (approximately 20 ng/L)
were produced from LHW Runs 4B (a postchloramination run with an incubation pH of 6) and
CSPW Run 2 (with sequential chlorine and ammonia addition) and in LHW Run 5A and 5B, in
which some additional bromide ion was spiked. The CNC1/CNX ratio showed that in most
cases, the CNX was dominated by CNC1. The relatively high concentration of CNBr was
expected in LHW Runs 5A and 5B, as bromide ion was added. Likewise, moderate amounts of
CNBr in CSPW in Run 1 and Run 1 repeat are consistent with the moderate bromide ion
concentration (0.23 ug/L). The lower CNBr concentrations in CSPW Runs 3A, 4A, and 4A
repeat are consistent with the formation of CNBr and the subsequent removal through
139

biofiltration. The variability of the CNC1 concentrations in CSPW Run 2 and Run 3B may have
influenced the CNC1/CNX ratio.
Dissolved Organic Halogen
When comparing higher and lower incubation pH levels in LAW (pH 10 versus pH 8)
and LHW (pH 8 versus pH 6), the lower incubation pH always produced somewhat more 2d
SDS DOX; compare LAW Runs 1A and IB, 2A and 2B, and 5A and 5B and LHW Runs 3A and
3B, 4A and 4B, and 5A and 5B. The one minute delay in adding the ammonium chloride in
CSPW Run 2 resulted in an increase in the concentration of 2d SDS DOX. In some cases
moving the point of chloramination to after filtration resulted in a slightly lower 2d SDS DOX
(compare LHW Run 3A with 4A), but this trend was not seen in other runs (see below). The
addition of bromide ion in LHW Runs 5 A and 5B resulted in the highest measured 2d SDS DOX
concentration (188.0 to 203.0 ug C17L). Increasing the coagulant dose from 66 mg alum/L to 88
mg alum/L had little effect on the resulting 2d SDS DOX concentration (compare LHW Run 1
with Run 3A and LHW Run 2 with Run 4A), as both coagulant doses achieved similar removals
of TOC, removals that would be defined as enhanced coagulation.
When comparing LAW Runs 2B and 5B, in which both runs involved softening and
chloramination at pH 8, ozone had an effect on DOX formation (lowered the DOX concentration
from 44.1 ug C17L to 30.3 ug C17L). Less of an effect from ozone was observed, however, for
LAW Runs 2A and 5A, in which the incubation pH was 10. Also, when comparing CSPW Runs
3A and 3B with CSPW Runs 4A and 4B, the higher ozone dose decreased the 2d SDS DOX
concentration further.
For all of the calculated percentages of DOX accounted for by the 12 measured DBFs on
a molar basis, the data ranged from 0.6 percent to 45.4 percent. The median value was 12.6
percent. This means that a relatively small fraction of the halogen-substituted compounds being
formed by chloramines can be measured by common techniques.
140

Point of Chloramine Application
Four sets of runs were performed where the only operational difference was the point of
chloramine application, either in the source water (precloramination) or in the filtered water
(postchloramination). The data collected in these four sets of runs (Table 7.8), demonstrated
that, for most of the DBFs measured, the point of chloramine application had little effect on the
resulting concentration after two days. Although rate of formation studies were not performed
on LHW and LAW, apparently the precursor in those waters is so relatively unreactive that the
untreated water can be chloraminated without increasing the 2-day SDS concentration, when
compared to chloramination after some TOX removal. Figure 56 in Symons et al. (1981)
demonstrates this effect graphically.
Table 7.8
Comparison of prechloramination and postchloramination
Run
LAW
3
4
LHW
1
2
3A
4A
3B
4B
Conditions
Prechloramination
Postchloramination
Prechloramination
Postchloramination
Prechloramination
Postchloramination
Prechloramination
Postchloramination
C12/N
5/1
5/1
3/1
3/1
3/1
3/1
3/1
3/1
SDSpH
8
8
8
8
8
8
6
6
TOCmg/L
4.6
2.8
4.5
4.0
10.1
3.4
10.1
3.4
TTHMug/L
7.2
1.1
3.6
4.0
6.3
7.3
5.8
8.3
HAA6 "g/L
11.6
10.2
19.9
14.1
23.5
23.2
25.7
5.2+7.3
CNXug/L
3.3
4.1
0.3
10.6
6.8
1.9
9.8
20.7
DOX ug C17L
65.4
58.8
104.2
108.1
101.6
81.9
112.3
112.0
141

CONCLUSIONS
In conclusion, based on these data, preozonating, adding well mixed chlorine and
ammonia simultaneously, and keeping the pH of chloramination as high as possible would seem
to be the best prescription for treatment to control the concentrations of all of the DBFs measured
(see LAW Runs 5A and 5B and CSPW Run 4B). Location of the chloramination step was not
important because mixing at large scale would probably be more vigorous than at small scale, the
DBF data collected here may somewhat overestimate what might be expected in the field.
Insufficient data were collected in Task 2 to provide any conclusions on the influence of Cli/N
ratio on DBF formation; however, that parameter was well studied in Task la, the results of
which indicated that lower Cb/N ratios were advantageous.
142

CHAPTER 8
GEOGRAPHICALLY DIVERSE WATERS—TASK 3
OBJECTIVE
The objective of Task 3 was to validate the results observed in the three primary study
waters (from Tasks 1 and 2) in diverse waters nationwide. The waters studied were selected so
as to comprise a representative group. Geographical representation in itself was insufficient, as
many water quality parameters that affect chloramine DBF formation (e.g., concentrations of
TOC and bromide, ambient water pH, elevated pH levels during lime softening) transcend
geographical location.
The Task 3 waters were evaluated at bench and full scale. In addition, historical
distribution-system data were requested. The bench-scale tests represented an opportunity to
evaluate the effects of water quality parameters and chloramination operating conditions on DBF
formation. The current and historical distribution-system data provided (1) a comparison of full-
scale findings to bench-scale results and (2) information on DBF exposure with current and
historical chloramination practices.
EXPERIMENTAL APPROACH
Source Waters Studied
Studies were conducted on each of five waters nationwide: a midsouth lake/groundwater
supply, the Mississippi River, the Biscayne Aquifer, a northeastern creek, and a Pacific
Northwest lake. The midsouth water supply studied is very high in bromide (i.e., 1.500 to 3000
|j.g/L), and the Biscayne Aquifer is very high in TOC (i.e., 9 to 17 mg/L). On the other hand, the
Pacific Northwest lake is very low in TOC (i.e., 1.1 to 2.2 mg/L) and contains very little bromide
(e.g., 7 Mg/L). In addition, that water is distributed at a relatively low pH (i.e., 6.4 to 6.9), and
the local utility that uses this source water has historically applied chloramines at a Cla/N ratio of
7/1. The Biscayne Aquifer and the Mississippi River water are both treated by lime softening
(up to pH levels of 10.1 and 9.4, respectively). The northeastern utility conventionally treats a
143

surface water with average TOC and bromide levels (i.e., 2.0 to 4.7 mg/L TOC, 50 ug/L
bromide).
Bench-Scale Studies
Each of the Task 3 waters were subjected to three sets of chloramination conditions at
bench scale (Table 8.1); these conditions were similar to those used in Task la to study the three
primary waters. One or two of these C^/N ratios and pH conditions were selected for bench-
scale testing of the Task 3 waters to match the current full-scale treatment, historical full-scale
treatment, or both of each water. The other conditions (total of three per source water) were
selected to provide some contrast for the water quality parameters that were of most interest for
each water in the study.
In each Task 3 test, preformed chloramines were added to untreated source water
adjusted to the pH of interest. (In each of the following tables, the free-chlorine dose used in
preparing the preformed chloramines is provided, along with the Cb/N ratio. The denominator
in the Cla/N ratio was based upon the ammonia-nitrogen concentration of the ammonium
chloride used in preparing the preformed chloramines; thus, the ratio was based on a calculated
value.) These chloraminated samples were stored at room temperature (22 C) for a 48-h period.
A sufficient amount of chloramines was added to each sample so that the final residual (after 48
h) was approximately 2 to 3 mg/L. This created a 2-d SDS value for each parameter measured.
A target 48-h total residual of 2 mg/L was chosen for Task 3, as this proved to be (1) ideal based
on Task 1 and 2 testing and (2) representative of conditions used in typical full-scale
chloraminated distribution systems nationwide.
Full-Scale Studies/Historical Data
A distribution-system sample from each of the Task 3 utilities was collected to obtain
full-scale data. In addition, one year of historical, seasonal (quarterly) THM data was requested.
If the utility had made a major change in chloramination practices in recent history, one year of
144

Table 8.1
Chloramination parameters for bench-scale studies of Task 3 waters
Source Water
Midsouth water
Mississippi River
Biscayne Aquifer
Northeastern creek
Pacific Northwest lake
Batch Number
1
2
3
1
2
3
1
2
3
1
2
3
1
2
3
C12/N Ratio*
5/1
5/1
5/1
3/1
5/1
5/1
3/1
5/1
5/1
3/1
5/1
5/1
7/1
5/1
5/1
PH
6
8
10
8
8
10
10
10
8
8
8
6
6
6
8
*Cl2/N ratio of preformed chloramines.
additional data was requested that represented the previous chloramination conditions. The
current distribution sample, as well as the historical data, represented an opportunity to (1)
evaluate the effects of water quality parameters and chloramination operating conditions beyond
the matrix of elements studied in Task la (e.g., at different pH or Cb/N ratios or both, with more
than one stage of chlorination/chloramination) and (2) provide a comparison of full-scale data to
bench-scale experiments.
Because the operating conditions of some utilities were somewhat different than the
values of these parameters in Task la, complete one-to-one comparisons between full-scale and
bench-scale Task 3 data were not always possible. Instead, the full-scale data emphasize actual
145

DBF occurrence levels, whereas the bench-scale studies provided an opportunity to validate the
observations made during the Task la bench-scale testing of the three primary waters. Also,
some of the source waters contained other sources of nitrogen in addition to the ammonia added
for chloramination (e.g., source-water ammonia). Thus, the C^/N ratio in these studies was not
always that obtained from the addition of chlorine and ammonia during chloramination.
RESULTS
Midsouth Water
Influence of Water Quality Parameters on DBF Formation
Figure 8.1 and Table 8.2 show the current treatment of the midsouth water and the DBF
data for the finished water. The water was chloraminated at a Ch/N ratio of 3.8/1 (assuming
there were no other sources of nitrogen in the source water). The finished-water pH was 7.1. In
addition, the source water (with a bromide level of 1500 ng/L) was subjected to three bench-
scale experiments with a Cb/N ratio of 5/1 at pH levels of 6, 8, and 10 (Table 8.2).
As was observed in tests on the three primary waters, dichloramine formation was
significantly influenced by pH (Figures 5.7, 5.8, and 5.9). Bench-scale chloramination at pH
levels of 6, 8, and 10 resulted in the dichloramine residual representing 26, 2, and 0 percent of
the total residual, respectively. In addition, a significantly higher amount of preformed
chloramines was required to meet the target residual after 48 h at pH 6 than was required with
the pH 8 test (20 versus 5 mg/L chloramine dose, respectively). (At the lower pH,
monochloramine is less stable and is converted, in part, to dichloramine.) DOX, THM, and
HAA formation increased with decreasing pH. Higher DBF production at the lower pH was
probably caused by the presence of a larger chloramine dose, as well as a higher amount of
dichloramines. For the bromide-spiked LHW (Figure 5.15) and CSPW (Figure 5.17) (i.e., total
bromide levels of 580 and 600 ^ig/L, respectively), chloramination at a C12/N ratio of 5/1
produced a similar pH effect on DOX formation; whereas, in bromide-spiked LAW (Figure 5.12)
(total bromide level of 740 ug/L), DOX formation at a C12/N ratio of 5/1 was highest at pH 8,
146

——
ALU
M
CHLO
RAM
INES
DECA
NT
WAT
ER
LIM
E AD
DITI
ONBA
SIN
(pH
ADJ)
SOLI
DSCO
NTAC
T |
BASI
N
FLOC
CULA
TION
BA
SIN
TODE
CANT
BASI
N
SEDI
MENT
ATIO
N BA
SIN
^.....T
TO E
VAPO
RATI
ONPO
ND
DECA
NT W
ATER
TO
LIM
E AD
DITI
ON B
ASIN
Nr
^^m
m m
m m
• •
FILT
ER B
ACKW
ASH
FILT
ERS
FREE
TO D
ECAN
T BA
SIN
____
__^^
>M
CLE
ARW
ELL
I
I DIS
TRIB
UTIO
N PU
MPS
CLEA
RWEL
L
CLEA
RWEL
L
DIST
RI
BUTI
ON
PUM
PS
Figu
re 8
.1 W
ater t
reat
men
t pla
nt fl
ow sc
hem
atic
for m
idso
uth
utili
ty
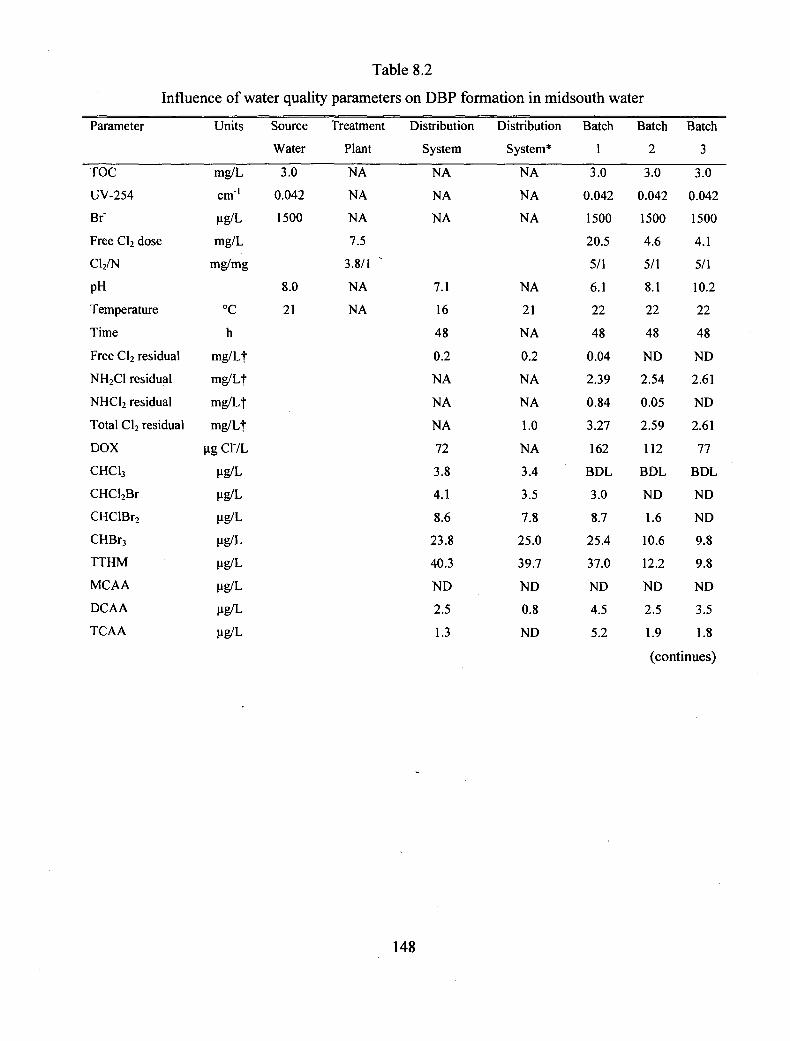
Table 8.2 Influence of water quality parameters on DBF formation in midsouth water
Parameter
TOCUV-254Bf
Free C12 doseC12/N
pH
TemperatureTime
Free C12 residual
NH2C1 residual
NHC12 residual
Total C12 residual
DOX
CHC13
CHCl2BrCHClBr2
CHBr3TTHM
MCAA
DCAA
TCAA
Units Source Treatment Water Plant
mg/L 3.0 NAcm-' 0.042 NAug/L 1500 NA
mg/L 7.5
mg/mg 3.8/18.0 NA
°C 21 NA
hmg/Ltmg/Lt
mg/Lt
mg/Lt
ugClVL
ug/L
ug/Lug/L
ug/Lug/L
ug/Lug/L
Mg/L
Distribution System
NANA
NA
7.1
16
48
0.2
NA
NA
NA
72
3.8
4.1
8.6
23.840.3
ND
2.5
1.3
Distribution System*
NA
NA
NA
NA21
NA
0.2
NA
NA
1.0
NA
3.4
3.5
7.825.0
39.7
ND
0.8
ND
Batch
1
3.0
0.0421500
20.5
5/1
6.1
22
48
0.042.39
0.84
3.27
162
BDL
3.0
8.725.4
37.0
ND
4.5
5.2
Batch
2
3.0
0.0421500
4.6
5/1
8.122
48
ND
2.54
0.05
2.59
112
BDL
ND
1.6
10.612.2
ND
2.5
1.9
Batch
3
3.0
0.0421500
4.15/1
10.2
22
48
ND
2.61
ND
2.61
77
BDL
ND
ND
9.8
9.8
ND
3.5
1.8
(continues)
148

Table 8.2 (continued)
Parameter
BCAA
MBAA
DBAA
HAA6
CNC1CNBr
CNX
TTHMOX/DOX
HAA6OX/DOXCNXOX/DOXDBPOX/DOXn
n'(3/6)
TTHM-Br/Br'HAA6-Br/Br-CNX-Br/Br'
Units Source Treatment Distribution
Water Plant System
Ug/L 4.4
Ug/L 2.0ug/L 6. 1
ug/L 16.2ug/L NDug/L NQug/L NQ
%
%
%
%
%%%
Distribution
System*
3.00.7
10.9
15.4
ND
4.74.7
Batch
1
6.4
2.4
10.2
28.7
0.5
17
18
7.7
6.1
3.8
17.62.51
0.88
2.20.80.8
Batch
2
3.9
ND
5.7
14.0
0.77.4
8.1
3.1
4.2
2.6
9.9
2.85
0.94
0.80.40.4
Batch
3
2.1
ND1.6
9.0
NDND
ND
3.3
3.9
0
7.2
3.00
0.46
0.60.10
BDL = Below detection limit.NA = Not analyzed or not available.ND = Not detected.NQ = Not quantitated; value -3-4 ug/L.
* Distribution system resampled 42 days after original sampling of source and finished water; batch 1-3 bench-scale testing based upon original source and finished water.
fAs C12
149

followed by pH 6 and then pH 10. For those LAW tests (Figure 5.10), however, the THM
formation did increase with decreasing pH, similar to what was observed for the midsouth water.
CNBr was the predominant CNX in this high-bromide-containing water. As was
observed in the Task la studies (Figures 5.19, 5.21, and 5.23), neither CNX was present (or, if
present, was barely detected) at pH 10 because of base-catalyzed hydrolysis. CNBr was at a higher concentration at pH 6 than at pH 8 in the midsouth water (17 versus 7.4 ug/L,
o
respectively). In the Task la studies, CNX was studied at a C12/N ratio of 5/1 for LHW (direct comparisons to the other two primary waters cannot be made, as those waters were not evaluated for CNX formation at a Cfe/N ratio of 5/1). CNBr formation was somewhat higher at pH 6 than at pH 8 for both the ambient-bromide and bromide-spiked LHW samples; however, the values were too low in the LHW samples (i.e., <1 to 4.5 ug/L) to determine significant trends. The very
high bromide level of the midsouth water produced high enough values of CNBr in order to
better evaluate the impact of pH (i.e., to ascertain whether pH had an effect) on the production of
this CNX at a C12/N ratio of 5/1.
The effects of bromide in the midsouth water on THM and HAA speciation were also
observed. Bromoform was the dominant THM at all pH levels, resulting in a bromine
incorporation factor, n, of 2.5 to 3.0, where
n = Si x [CHCl(3.i)Bri] / Z[CHCl(3-i)Bri] - TTHM-Br/TTHM
THM concentrations are expressed on a molar basis, and n ranges from 0 (for 100 percent
chloroform) to 3 (for 100 percent bromoform) (Gould et al. 1983). (TTHM-Br is the molar sum of bromine in individual THMs.) Bromamines (or free bromine) probably played a significant
role in DBF formation in this water (this issue is discussed further in the historical data section below).
Bromine incorporation into the HAAs was less dramatic. In this study, six of the nine
possible HAAs were measured (i.e., monochloro-, dichloro-, trichloro-, bromochloro-,
monobromo-, and dibromoacetic acid [MCAA, DCAA, TCAA, BCAA, MBAA, and DBAA]).
150
The bromine incorporation factor for the three brominated HAAs, n' (3/6), was 0.46 to 0.94, where
n' [3/6] = [1 x (BCAA+MBAA) + 2 x DBAA] /(MCAA+DCAA+TCAA+BCAA+MBAA+DBAA)
HAA concentrations are expressed on a molar basis, and n' (3/6) ranges from 0 (for 100 percent
of the six measured HAAs as MCAA, DCAA, and TCAA) to 2 (for 100 percent DBAA) (Symons et al. 1994; Shukairy et al. 1994).
For example, at pH 6, a total of 0.20 and 0.15 umol/L of total HAA6 chlorine and bromine (HAA6-C1 and HAA6-Br), respectively, were formed, whereas a total of 0.08 and 0.40 umol/L of TTHM chlorine (TTHM-C1) and TTHM-Br, respectively, were formed. Under these conditions (in this high-bromide water), TTHM-Br was greater than TTHM-C1, whereas HAA6-
Br and HAA6-C1 were approximately the same. As three brominated HAAs were not measured (because of a lack of analytical standards for bromodichloroacetic and dibromochloroacetic acids
and, typically, a poor recovery of tribromoacetic acid by the existing analytical methodology), the formation of brominated HAAs was probably underaccounted for by the measurement of HAA6 (Cowman and Singer 1996). For the midsouth water, the bromide utilization (e.g., umol TTHM-Br/umol Br") was highest at pH 6 (i.e., 2.2, 0.8, and 0.8 percent for THMs, HAA6, and CNBr, respectively).
The percentage of DOX in the bench-scale chloraminated midsouth water that was accounted for by the measured DBFs (where the molar sum of DBF organic halogen [DBPOX] for the measured DBFs is divided by the DOX and expressed on a percentage basis) was 7.2 to
18 percent on a molar basis; this percentage was similar to that observed in Task la waters (Figures 5.24, 5.25, and 5.26). The amount accounted for increased with decreasing pH. At pH
6, THMs, HAA6, and CNX accounted for 7.7, 6.1, and 3.8 percent of the DOX (on a molar
basis), respectively.
The full-scale distribution-system sample from the midsouth utility represented a somewhat lower Cfe/N ratio (3.8/1) and a pH level (7.1) in between the levels evaluated in the bench-scale tests (pH 6 and 8). Chloramine speciation data were not available for this sample, but the neutral pH and a Cb/N ratio (3.8/1) that was lower than the C12/N ratio at the maximum
151

in the breakpoint curve (the maximum occurs at a Cb/N ratio of 5/1) suggest that dichloramine
formation would be relatively low.
DOX formation in the full-scale sample was less than that observed in the bench-scale
tests (which were run under somewhat different chloramination conditions than those applied at
full scale). On the other hand, THM formation was similar to that observed in the bench-scale
test at pH 6 (and Cb/N ratio of 5/1), whereas the HAA6 production was similar to that measured in the bench-scale test at pH 8 (and C^/N ratio of 5/1). The full-scale plant chloraminated water
had an ambient pH of 8.0 and distributed it at a pH of 7.1; therefore, the THM and HAA6 data
matching the bench-scale tests at pH 6 and 8, respectively, appear somewhat consistent considering that the bench and full scale tests did not utilize exactly the same parameter values.
The full-scale CNBr values of <4.7 |ig/L are lower than that observed in the bench-scale
tests. In Task la, CNBr in bromide-spiked LHW at pH 8 decreased in concentration (from 6.4 to
3.9 to <1 ug/L) with decreasing Cb/N ratio. Thus, the use of a somewhat lower Ch/N ratio in the full-scale midsouth-utility sample should explain the somewhat lower CNBr occurrence.
Interpretation of Historical Data
Tables 8.3 and 8.4 show historical data for the midsouth utility. In addition to evaluating
some of this utility's recent historical data (i.e., April 1993 through January 1994), some older
data (i.e., May 1988 through February 1989) from this utility's treatment of some of their other
source waters (Krasner et al. 1989a; MWDSC and JMM 1989) were examined. The 1988/89
waters had bromide levels of up to 3,000 ug/L. These 1988/89 waters were chloraminated at a pH of 7.3 to 8.3 with a C12/N ratio of 3/1, which produced DOX levels ranging from 110 to 350 ug C17L. In both sets of historical data, bromoform dominated THM formation, with TTHMs ranging from 40 to 161 ng/L. The bench-scale tests on this midsouth water suggest that chloramination at a higher pH would be a potential strategy to minimize DBF formation in this high-bromide water.
In the 1988/89 data set, free chlorine residuals within the plant were somewhat higher than the values in the plant effluents (i.e., 0.2-0.4 versus 0.1 mg/L for the three quarters in which
both residuals were measured). During chloramination in which breakpoint chlorination is not
achieved, there should not be a free chlorine residual. The free chlorine residual measured
152

Table 8.3
Historical (1993/94) DBF data for midsouth utility
Parameter
CHC13
CHCl2Br
CHClBr2
CHBr3
TTHM
CH2ClBr
CH2Br2
Units
ug/L
Hg/L
ug/L
Hg/L
ug/Lug/L
ug/L
April 14, 1993 Finished
Water
2.3
6.2
19.5
89.1
117.1
NA
NA
Sept. 29, 1993 Finished
Water
0.8
2.2
5.4
33
41
1.1
6.3
Dec. 21,1993 Finished
Water
1.2
3.8
14
142
161
ND
ND
Jan. 10, 1994 Finished
Water
0.9
4.8
12.3
30.9
48.9
3.2
15.3
NA = Not analyzed.
ND = Not detected.
within the plant may represent, in part, the presence of bromamines or hypobromous acid (or both) (Palin 1975), and these bromine-containing species may be responsible for the formation of
the brominated DBFs.In the 1993/94 data set, there were two sample periods in which the TTHMs exceeded
100 ug/L. Apparently the chlorine was added prior to the ammonia at this facility. Because of the very high amount of bromide typically present in this water supply, even a short period of
free chlorine contact may have been sufficient to generate a significant amount of THMs in
addition to what was formed during chloramination.For the 1988/89 data set, HAA5 ranged from 11 to 21 ug/L (BCAA was not measured at
that time), hi these samples, DBAA dominated HAA formation. Most likely these waters contained other bromine-substituted HAAs (e.g., bromodichloroacetic acid) for which measurements were not made (Cowman and Singer 1996). CNC1 was the only CNX measured at the time of this study; its value ranged from 0.1 to 0.3 ug/L. This midsouth utility was part of a 35-utility DBF study performed in 1988/89. In the 35-utility DBF study, CNC1 was observed
153

Tabl
e 8.
4
Histo
rical
(198
8/89
) DBF
dat
a for
mid
sout
h ut
ility
May
16,
1988
Para
met
erTO
CU
V-2
54B
fFr
ee C
12 d
ose
C12/N
pH Tem
pera
ture
Free
C12
resid
ual
Tota
l C12
resid
ual
DO
XCH
C13
CHCl
2Br
Uni
tsm
g/L
cm"1
Mg/L
mg/
Lm
g/m
g
°Cm
g/L*
mg/
L*ug
ClV
LM
g/LM
g/L
Sour
ce
Wate
rN
AN
AN
A
NA
NA
Trea
t. Pl
ant
NA
NA
NA 6.0
3/1 NA
NA
NA NA
Plan
t Ef
fl. 4.3 NA
NA 7.5 23 0.2 3.7
350
0.6 3.1
Aug
ust 1
5, 19
88So
urce
W
ater
4.6
0.16
630
00 7.9 28
Trea
t. Pl
ant
3.9
0.06
5N
A 6.0
3/1 7.3 28 0.2 3.5
Plan
t Ef
fl. 3.8 0.05
6N
A 7,3 28 0.1 3.3 180
1.0 3.8
Nov
embe
r 1, 1
988
Sour
ce
Wat
er4.
90.
092
2890 8.3 20
Trea
t. Pl
ant
3.6 0.05
5N
A 6.0
3/1 7.3 20 0.3 4.1
Plan
t Ef
fl. 3.6
0.03
8N
A 7.3 20 0.1 3.3 140
0.6
2.9
Febr
uary
6, 1
989
Sour
ce
Wat
er5.3 0.10
428
00
NA 6
Trea
t. Pl
ant
Plan
t Ef
fl.4.5
4.
20.
036
0.03
3N
A
NA
6.0 3/1 NA
N
A6
60.4
0.1
4.9
4.5 110
0.7
4.1(c
ontin
ues)

Tabl
e 8.
4 (c
ontin
ued)
Para
met
erCH
ClBr
2CH
Br3
TTH
MM
CAA
DCA
ATC
AA
MBA
AD
BAA
HA
AS
CNC1
Uni
ts ug/L
ug/L
ug/L
ug/L
ug/L
ug/L
ug/L
ug/L
ug/L
ug/L
May
16,
1988
Sour
ce
Trea
t. Pl
ant
Wat
er
Plan
t Ef
fl. 9.9
26.7
40.3
ND 1.3 ND 1.7 14.5
17.5
0.1
Aug
ust 1
5, 19
88So
urce
Tr
eat.
Plan
tW
ater
Pl
ant
Effl. 8.6
29.8
43.2
ND 0.9
ND 1.2 19.0
21.1 0.1
Nov
embe
r 1,
1988
Sour
ce
Trea
t. Pl
ant
Wat
er
Plan
t Ef
fl. 9.2 40 53 ND 0.8
ND 1.2 13.1
15.1
0.2
Febr
uary
6, 1
989
Sour
ce
Trea
t. Pl
ant
Wat
er
Plan
t Ef
fl. 11 31 47 1.0 0.9
ND 1.4 7.8
11.1
0.3
Effl.
= E
fflue
ntN
A =
Not
ana
lyze
d or
not
ava
ilabl
e.N
D =
Not
det
ecte
d.Tr
eat.
= Tr
eatm
ent
*As C
12

to be preferentially formed in chloraminated waters as compared to chlorinated ones (Krasner et
al. 1989a; MWDSC and JMM 1989). The samples from this midsouth utility, however, were the
one set of chloraminated waters that did not follow this trend. The current data indicate that the CNX formation in the water of this midsouth utility favors CNBr, the bromine-substituted
analogue of CNC1.
For the 1993/94 data set, THM results were obtained as part of a volatile organic compound (VOC) analysis, with gas chromatography/mass spectrometry, during three
samplings. Seventy-two VOCs were analyzed for, almost all of which are synthetic organic chemicals rather than DBFs. During two sample periods, bromochloromethane (CFbClBr) and
dibromomethane (CHiB^) were detected in chloraminated samples from this midsouth utility in
addition to the THMs (Table 8.3); no other VOCs were detected. Also, the formation of
dihalomethanes (other possible by-products of chloramination) was observed in Task 4 testing of
the midsouth chloraminated water (discussed further in Chapter 9). The data sets from this
midsouth utility indicate that bromine-substituted DBFs can be formed during chloramination of a high-bromide water.
Mississippi River Water
Influence of Water Quality Parameters on DBF Formation
Figure 8.2 and Table 8.5 show the current treatment of Mississippi River water at the
participating softening plant and the DBF data for the finished water. The water was
chloraminated at a Cb/N ratio of 4/1 and lime softened. The finished-water pH was 9.0. In
addition, the source water was subjected to three bench-scale experiments with Cb/N ratios of 3/1 and 5/1 at pH 8 and with a C12/N ratio of 5/1 at pH 10 (Table 8.5).
Chloramination at the chosen Cli/N ratios and pH levels resulted in all of the chloramines being measured as monochloramine. The three sets of bench-scale conditions resulted in similar DOX, THM, and HAA6 levels, with a somewhat higher level of DOX at a C12/N ratio of 5/1 and a pH of 8 and the lowest concentration at a Cb/N ratio of 3/1 and a pH of 8. In the Task 1 a study of the three primary waters (at ambient bromide) (Figures 5.12, 5.15, and 5.17) for the same
156

POLY
ELEC
TROL
YTE
LIME
AND
FE
RRIC
SU
LFAT
E
RIVE
R IN
TAKE
- BA
R SC
REEN
PU
MPI
NG'
& SU
RFAC
E ST
ATIO
N SP
RAY
SLOW
MECH
ANIC
AL
MIXI
NG
SETT
LING
BAS
INS
W/M
ECHA
NICA
LSL
UDGE
REMO
VAL
SLUD
GEDI
SCHA
RGE
0 RI
VER
FREE
CH
LORI
NE
^ AM
MONI
A SECO
NDAR
YSE
TTLI
NG
RESE
RVOI
RSPO
LYPH
OSPH
ATE
FLUO
RIDE
i>"
RAPI
DSA
NDRL
TERS
CLEA
RWEL
L HIGH
- PR
ESSU
RE
DIST
RIBU
TION
.
, PU
MPS
*-*
Figu
re 8
.2 Fl
ow d
iagr
am o
f wat
er p
urifi
catio
n pr
oces
s for
util
ity tr
eatin
g M
ississ
ippi
Riv
er w
ater

Table 8.5 Influence of water quality parameters on DBF formation in Mississippi River water
ParameterTOCUV-254BfFree C12 DoseClj/NPHTemperatureTimeFree C12ResidualNH2C1NHC12ResidualTotal C12ResidualDOX :CHC13CHCl2BrCHClBr2CHBr3TTHMMCAADCAATCAA
Unitsmg/Lcm" 1
Mg/Lmg/L
mg/mg
°C
hmg/L*
mg/L*mg/L*
mg/L*
MgClYLMg/LMg/LMg/LMg/LMg/LMg/LMg/LMg/L
Source Treatment Distribution Water Plant System
2.9 NA NA0.079 NA NA
40 NA NA4.34/1
7.7 NA 9.022 NA 24
24NA
<2.3NA
2.3
839.62.8
BDLBDL12.41.3
18.94.4
Batch 1
2.90.079
402.83/18.22248
ND
2.0ND
2.1
595.8NDNDND5.8ND11.01.8
Batch2
2.90.079
404.85/18.02248
ND
2.06ND
2.06
805.5NDNDND5.5ND14.42.2
Batch3
2.90.079
404.75/110.02248
ND
2.5ND
2.5
685.8NDNDND5.8ND14.22.6
(continues)
158

Table 8.5 (continued)
ParameterBCAAMBAADBAAHAA6CNC1CNBrCNXTTHMOX/DOXHAA6OX/DOXCNXOX/DOXDBPOX/DOXnn '(3/6)TTHM-Br/Br-HAA6-Br/Br"CNX-Br/Br"
Source Treatment Distribution Units Water Plant SystemHg/L 3.9Hg/L ND|j.g/L 0.6Hg/L 29.0fig/L 1 .0Hg/L 0.6(jg/L 1.5
%/O
%%
/o
%%
Batch 1
2.6NDND15.42.2NR2.27.56.92.216.6
00.13
03.00
Batch2
3.2NDND19.88.7ND8.75.36.56.418.1
00.13
03.7NA
Batch3
2.8NDND19.6NDNDND6.57.70
14.30
0.110
3.20
BDL = Below detection limit.NA = Not analyzed or not available.ND = Not detected.NR = Not reported; sample not analyzed within holding time.
*As C12 .
159

three sets of conditions studied for the Mississippi River water only (C^/N ratios of 3/1 and 5/1
at pH 8 and a C12/N ratio of 5/1 at pH 10), a C12/N ratio of 5/1 and a pH of 8 also resulted in the highest DOX formation. Because only three of the nine possible Cb/N ratios and pH levels were studied in the Mississippi River water samples, it is not possible to determine whether the DOX
formation trends for the three primary waters were completely reproduced in the Mississippi River water. (The tests in the other Task 3 waters, however, were set up to evaluate the other
C12/N ratios and pH levels evaluated in Task la.)
CNBr was not detected (with a detection limit of 0.5 ng/L) in bench-scale tests of this water, which contained bromide at an average level (40 ^ig/L). CNCl was detected in the pH 8
samples, and the level increased with increasing Cli/N ratio (8.7 j^g/L versus 2.2 ng/L).
Likewise, in the Task la study of ambient-bromide LHW at pH 8 (the only Task la water that
was studied for CNX formation at the intermediate Cli/N ratio of 5/1), more CNCl was formed with a Cli/N ratio of 5/1 than for a 3/1 ratio (15.5 ng/L versus 2.5 ug/L). Ohya and Kanno
(1985) found that CNCl was formed by the reaction of humic acid with hypochlorous acid in the
presence of the ammonium ion. The amount of CNCl was at a maximum when the reaction
mixture contained a Cb/N weight ratio of 8-9/1 (Ohya and Kanno 1985). Similarly, in the Task
la study of ambient-bromide LHW at pH 8, the CNCl concentration was at a maximum at the C12/N ratio of 7/1 (16.9 ng/L).
The effect of bromide was negligible in this water. Chloroform was the only THM
formed in the bench-scale tests; therefore, n equaled 0. DCAA was the dominant HAA formed, whereas TCAA—the other major HAA produced during the chlorination of low-bromide waters
(Krasner et al. 1989a)—was formed at a relatively low level. The value of «' (3/6) for these samples was 0.11 to 0.13. These data are consistent with the observation made during the testing
of the primary waters that DCAA is a chloramine DBF. Smith et al. (1993) also found that
although TCAA was the principal HAA formed during chlorination, it was not detected during
chloramination, whereas there was appreciable DCAA formation. This observation is also consistent with the findings that, when ammonium chloride is used to quench free chlorine
residuals in HAA samples, DCAA forms slowly (over the course of approximately one week) even when stored at 4°C (Krasner et al. 1989b). Thus, at ambient water temperature, some level
of DCAA formation in low-bromide waters (like that observed in the Mississippi River water) should be expected. In addition, BCAA should form, as this is the analogue of DCAA in which
160

one of the chlorine atoms has been replaced with a bromine atom. In the bench-scale studies for
the Mississippi River water, 11 to 14 ug/L of DCAA and 3 ug/L of BCAA were produced,
whereas only 6 ug/L of chloroform formed.
The percentage of DOX in Mississippi River water that was accounted for by the
measured DBFs (14 to 18 percent on a molar basis) was similar to that observed in Task la
waters (Figures 5.24, 5.25, and 5.26) and in the midsouth water (Table 8.2). THMs, HAA6, and
CNC1 accounted for 5.3 to 7.5, 6.5 to 7.7, and 0 to 6.4 percent of the DOX (on a molar basis),
respectively. Under the bench-scale conditions tested, changes in CNC1 formation were the most
significant.
The full-scale distribution system sample from the softening plant represented an
intermediate Cb/N ratio (4/1) and an intermediate pH value (9.0) compared to what was
evaluated at the bench scale. In addition, the distribution-system sample only had a retention
time of ~24 h, whereas the bench-scale tests were conducted for 48 h. The chloramine residual
of the distribution-system sample was reported to be mostly monochloramine. The distribution-
system sample had somewhat higher DOX, THM, and HAA6 concentrations than in the bench-
scale experiment performed at a Cb/N ratio of 5/1 at a pH of 8. The higher concentrations of
DBFs observed at full scale (as compared to bench scale) may have been due, in part, to the
addition of chlorine upstream of ammonia addition at the treatment plant, which probably
resulted in some free-chlorine contact prior to the formation of chloramines.
Chloroform was still the predominant THM in the full-scale distribution system (9.6
ug/L), with a small amount of bromodichloromethane formation (2.8 ^ig/L). DCAA was still the
predominant HAA (18.9 ug/L), with a smaller amount of TCAA produced (4.4 jag/L). In
addition, the other dihalogen-substituted HAAs (BCAA and DBAA) were present, albeit to
lesser extents in this water, with its low-to-moderate concentration of bromide. These data
suggest that the precursors for dihalogenated HAAs may in some cases be different than the
precursors for trihalogenated HAAs. For example, during the ozonation of fulvic acid, Reckhow
and Singer (1984) observed that TCAA precursors were destroyed, whereas the precursors of
DCAA were not. Thus, alternative disinfectants impact DCAA and TCAA precursors
differently. Young et al. (1995) observed that chloral hydrate (trichloroacetaldehyde) production
was minimized by chloramination, whereas the formation of dichloroacetonitrile (DCAN) was
similar during chlorination and chloramination. The results indicated that DCAN was produced
161
from the reaction of chloramines with reaction by-products such as dichloroacetaldehyde. Thus, chloramination has been shown in other studies to form a dihalogen-substituted DBF preferentially over a related trihalogenated species.
CNC1 was found in the distribution system at a level that was lower than that found during bench-scale testing at pH 8 but higher than the "not detected" level found in bench-scale testing at pH 10. At the distribution-system pH of 9.0, base-catalyzed hydrolysis was not as complete as at pH 10. In the 1988/89 35-utility DBF study (Krasner et al. 1989a), another softening plant formed CNC1 (at 4 j^g/L) in the plant, but the level dissipated (down to 1.0 |j.g/L) in the distribution system at a pH of 9.0. Thus, base-catalyzed hydrolysis at pH 9 can be used to minimize exposure to CNC1.
Interpretation of Historical Data
Table 8.6 shows historical data for the softening plant treating Mississippi River water. The water was chloraminated at a Cb/N ratio of 4/1 and lime softened at a pH of 9.1-9.4. The finished-water pH was 8.9-9.2. TTHMs ranged from 0 to 12 |ig/L, with chloroform as the dominant species. Data for other DBFs were not available. Clearly, chloramination of Mississippi River water at this softening facility controlled THM formation. The proposed Disinfectants/DBF Rule (USEPA 1994b) will also set standards for the control of HAAs, as well as TOC. The proposed Stage 1 and 2 maximum contaminant levels (MCLs) for HAAS are 0.060 and 0.030 mg/L, respectively. Based on the current treatment and bench-scale data, compliance with the proposed Stage 1 MCL should be obtainable, whereas the one data point for the current treatment was barely below the proposed Stage 2 MCL based on the HAA6 value of 29.0 |ig/L (the HAAS value, which excludes BCAA, was 25 (ag/L). More data on HAA occurrence will need to be collected, however, to make an assessment of potential compliance with the proposed Stage 2 MCL for HAAS using the existing treatment.
162

Tabl
e 8.6
o\
Hist
oric
al D
BF d
ata
for u
tility
trea
ting
Miss
issip
pi R
iver
wat
erFe
brua
ry 1
7, 19
94Pa
ra
met
erTO
CC1
2do
seC1
2/NPH Te
mp.
Tim
eCH
C13
CHC1
2Br CH
C1Br
2CH
Br3
TTHM
Plan
t Un
its
Inf.
mg/
L 2.
6m
g/L
mg/
mg
7.9°C
1.7
h ug/L
Hg/L
Hg/L
Mg/L
ug/L
Trea
t. Pl
ant
NA 3.5 4/1 9.1 16
Dist.
Syst.
NA 8.9 24 24 7 1 ND ND 8
May
3, 1
994
Plan
t Tr
eat.
Inf.
Plan
t2.5
NA 4.3 4/1
7.7
9.416
22
Dist.
Sy
st.NA 9.0 23 24 9 3 ND ND 12
Sept
embe
r 20,
199
4Pl
ant
Trea
t. Di
st.
Inf.
Plan
t Sy
st.2.
6 NA
NA
5 4/17.9
9.4
8.9
23
28
29 24 ND ND ND
ND ND
Dece
mbe
r 29,
Plan
t Tr
eat.
Inf.
Plan
t2.
9 NA 4.3 4/1
7.9
9.25.0
NA
1994 Di
st.Sy
st. NA 9.2 14 24 9 2 ND
ND 11
Janu
ary
25, 1
995
Plan
t Tr
eat.
Dist.
In
f. Pl
ant
Syst.
2.8
NA
NA4.
2
4/18.0
9.2
9.0
4.4
15
14 24 9 2 ND
ND 11Di
st. S
yst.
= Di
strib
utio
n Sy
stem
Inf.
= In
fluen
tNA
= N
ot an
alyz
ed o
r not
avai
labl
eND
= N
ot d
etecte
dTe
mp.
= Te
mpe
ratu
treTr
eat.=
Tre
atmen
t

Biscayne Aquifer
Influence of Water Quality Parameters on DBF Formation
Figure 8.3 and Table 8.7 show the current treatment of Biscayne Aquifer water at one of
the treatment plants of the participating utility, as well as the DBF data for the finished water. This source water is very complex to treat, as it is relatively high in THM precursors, color,
ammonia, and hydrogen sulfide. At the plant, source water was prechlorinated at ambient pH (i.e., 7), lime-softened at a pH of 9 to 10, and postchloraminated. The finished- water pH was 8-9.
The source water was subjected to three bench-scale experiments with preformed
chloramines, with target C^/N ratios of 3/1 and 5/1 at pH 10 and a C12/N ratio of 5/1 at pH 8. Once the preformed chloramines were added to the source water, however, the C12/N ratio
theoretically should have changed. Assuming that preformed chloramines did not oxidize the hydrogen sulfide as free chlorine does (see discussion below), but that the C12/N ratio did go
down because the ammonia concentration was increased by the presence of source-water
ammonia, the theoretical C12/N ratio of the bench-scale tests was probably in the range of 1.5/1 to 2.7/1.
In the full-scale plant, however, the water was prechlorinated with free chlorine prior to postchloramination. Based upon full-scale data at this plant, in which the prechlorination does
not breakpoint-chlorinate the source-water ammonia and the postchlorination does not
effectively reduce the color, a portion of the chlorine is probably being consumed by oxidation of the hydrogen sulfide. In ozone pilot plant tests of colored groundwater performed by other
investigators, color was not destroyed until the hydrogen sulfide was oxidized (Dunkelberger et al. 1992). Stoichiometrically, the complete oxidation of hydrogen sulfide to sulfate requires an 8.3/1 ratio (on a weight basis) of chlorine to hydrogen sulfide (Equation 8.1), whereas a 2.1/1
weight ratio will oxidize hydrogen sulfide to sulfur and water (Equation 8.2) (White 1992):
4H2O-»H2SO4 +8HC1 (8.1)
H2S + C12 -> S^ + 2 HC1 (8.2)
164

o\
WAT
ER
FROM
W
ELLS
«—
——
— P
RECH
LORI
NATI
ON
LIME
I P
OLYM
ER
I {
GENE
RAL
FILTE
R ,N I
A CO
NTRA
FLOT
YPE"
0"
UPFL
OW C
LARI
FIER
PUSH
MI
XFL
OCCU
LATI
ON
ZONE
SODI
UM H
EXAM
ETAP
HOSP
HATE
- PO
STCH
LORI
NATI
ON-
FILT
ERS
FILT
ERS
SMAL
L CL
EARW
ELL
TRAN
SFER
PU
MPS
CLEA
RWEL
L
CLEA
RWEL
L
HIGH
- PR
ESSU
RE
DIST
RIBU
TION
PU
MPS
Note:
Cen
traflo
w is
a pro
duct
of G
ener
al Fi
lter,
Am
es, I
owa.
Figu
re 8
.3 W
ater t
reat
men
t pla
nt fl
ow sc
hem
atic
for u
tility
trea
ting
Bisc
ayne
Aqu
ifer w
ater

Table 8.7 Influence of water quality parameters on DBF formation in Biscayne Aquifer
Treatment Plant
ParameterTOCUV-254Br'
Free C12 doseEffective C12 dose*Ammonia doseTotal ammoniaTheoretical C12/N
pHTemperatureTimeFree C12 residualNH2C1 residualNHC12 residualTotal C12 residualDOXCHC13CHCl2BrCHClBr2CHBr3TTHM
Source PreCl2 Units Watermg/L 8.9cm' 1 0.209 NAUg/L 89 NAmg/L NAmg/L 8mg/L 4.8mg/L 1.3 0
mg/m 1 .3
g7.1 3.7/1
°C 26 NAh NA
mg/Ltmg/Ltmg/Ltmg/Lt
ugClYLug/Lug/Lug/Lug/Lug/L
PostCl2 Dist. Syst.NA
NA NANA NANA13
17.80.92.2
8.1/1 9.2NA 29NA 48
NA2.2NA2.243182.519.22.9ND
104.6
Batch1
8.90.209
893.93.91.32.6
1.5/1
9.82248
ND2.20ND2.2092
BDLNDNDNDND
Batch2
8.90.209
896.26.21.22.5
2.5/1
9.82248
ND1.81ND1.81115
BDLNDNDNDND
Batch3
8.90.209
897.27.21.42.7
2.7/1
8.22248
ND2.440.062.501480.8NDNDND0.8
(continues)
166

Table 8.7 (continued)
Treatment Plant
ParameterMCAADCAATCAABCAAMBAADBAAHAA6CNC1CNBrCNXTTHMOX/DOXHAA6OX/DOXCNXOX/DOXDBPOX/DOXnn ' (3/6)TTHM-Br/Br"HAA6-Br/Br-CNX-Br/Br-
Source PreCl2 Units Water"g/L"g/Lug/L(ig/Lug/L"g/LHg/L"g/L"g/L"g/L
%/o
/o
/o
/o
%/o
PostCl2 Dist. Syst.4.4
42.213.89.4ND1.8
71.61.4ND1.4
17.74.80.2
22.60.180.1413.06.30
Batch 1
ND6.22.01.8
NDND9.90.5ND0.50
3.30.33.6NA0.15
00.90
Batch2
ND8.62.62.2NDND13.40.7ND0.70
3.50.43.9NA0.13
01.10
Batch3
1.413.92.72.6NDND20.53.6ND3.60.43.51.45.40
0.100
1.30
BDL = below detection limit Dist. Syst. = Distribution System NA = not analyzed or not available ND = not detected Post C12 = Postchlorination PreCl2 = Prechlorination
*Raw-water H2 S = 0.5 mg/L; assuming H2 S oxidized during prechlorination at the full-scale plant. tAs C12 .
167

At a pH of around 7.0, approximately 70 percent of the hydrogen sulfide is oxidized to sulfate and 30 percent to sulfur and water, whereas at pH values of 9 and 10, approximately 50 percent is oxidized to sulfate and 50 percent to sulfur and water (White 1992).
At the time of this sampling, the source-water hydrogen sulfide level was 0.5 mg/L. Thus, the full-scale prechlorination at pH 7 theoretically could have experienced a 3.2-mg/L chlorine demand, as 70 percent of the hydrogen sulfide should have been completely oxidized to sulfate and 30 percent should have been partially oxidized to sulfur. Therefore, if this much chlorine was utilized to oxidize the hydrogen sulfide, then the effective chlorine dose would have
been reduced by the hydrogen sulfide's chlorine demand.
Because the chlorine addition in the full-scale prechlorination should have been inadequate to achieve breakpoint, the total ammonia should equal the source-water amount (1.3 mg/L during this testing) plus the amount added as part of the postchloramination. Based upon this assumption—and taking into account the chlorine demand from hydrogen sulfide (discussed above)—the theoretical Cfe/N ratios of the full-scale treatment were probably around 4/1 and 8/1 for the pre- and postchlorination, respectively. These Cb/N ratios, however, do not consider other sources of chlorine demand (e.g., any chlorine used in oxidizing color-causing organic matter). Thus, it is unlikely that the actual Cla/N ratio was that high during postchloramination, or there would have been breakpoint chlorination of the ammonia. Also, it has been assumed that the ammonia-nitrogen concentration was at a significantly higher concentration than that of
any organic nitrogen that may have been present.
As a result of the low Cb/N ratios and the pH levels used in the bench-scale tests, the chloramine speciation was essentially all monochloramine. A trace of dichloramine (0.06 mg/L) was detected in the pH 8 test only, and it was only in that test that any THMs were detected (0.8 ug/L as the average value of replicate analyses). HAAs were detected in all of the bench tests, with the highest value (20 ug/L) detected in the pH 8 test. The major HAA formed in these tests was DCAA (6-14 ug/L), followed by TCAA (2.0-2.7 ug/L) and BCAA (1.8-2.6 ug/L). Even under these conditions, in which relatively low Cb/N ratios were used, dihalogen-substituted HAAs were formed when THMs were essentially absent. CNC1 was barely detected (0.5 to 0.7
^ig/L) in the pH 10 tests, whereas 3.6 ug/L CNC1 was measured in the pH 8 experiment.A substantial amount of DOX (92 to 148 |*g C17L) was formed in the bench-scale
experiments, suggesting that monochloramine can react with DOX precursors when a relatively
168

high amount of TOC is present, even though the Cfe/N ratio was low. (Snyder and Margerum
[1982] have studied the kinetics of chlorine transfer during chloramination.) In these bench-
scale tests, DOX formation increased with either increasing Cb/N ratio or decreasing pH.
Comparing these results to the Task la studies is difficult, as the three primary waters did not
have such high source-water inorganic chlorine demands. In the bench-scale testing of the
Biscayne Aquifer water, the percentage of DOX accounted for by the measured DBFs was quite
low (3.6 to 5.4 percent). Under these conditions (e.g., a low Cb/N ratio), some degree of
halogen substitution of humic substances occurred, but possibly the conditions were inadequate
to break the halogen-substituted by-products down to the more commonly measured DBFs. Also
under these conditions, bromide utilization was very low (0.9-1.3 percent for the HAAs, none for
the THMs or CNX) in spite of a moderate amount of bromide (89 ng/L).
In the full-scale application, although the Cb/N ratio calculated for the postchlorination
(8/1) was sufficient to breakpoint-chlorinate ammonia, the calculations performed did not
account for chlorine demand from the organic matter (e.g., any chlorine used in oxidizing the
color-causing organic matter). Under these operating conditions, very high amounts of DOX
(431 ng C17L), THMs (105 jig/L), and HAA6 (72 jig/L) were produced. Most of the mass of
HAAs was caused by DCAA (42 ng/L), followed by TCAA (14 fig/L) and BCAA (9 ug/L). For
the full-scale water, the percentage of DOX accounted for by the measured DBFs (23 percent)
was consistent with that observed in other waters studied in this project (Figures 5.24, 5.25, and
5.26). Under these chloramination conditions, bromide utilization was significantly higher (13
and 6 percent for TTHM-Br/Br" and HAA6-Br/Br", respectively) than in the bench-scale tests.
CNC1 (1.4 ng/L) was lower than in the pH 8 bench test, probably because of base-catalyzed
hydrolysis at the distribution-system pH of 9.2.
Interpretation of Historical Data
Tables 8.8 and 8.9 show historical data for the utility treating Biscayne Aquifer water. In
addition to evaluating some of this utility's recent historical data (i.e., February 1994 through
February 1995), some older data (i.e., April 1988 through January 1989) from one of the utility's
other facilities that treated water from another aquifer (MWDSC and JMM 1989) were
examined. In both sets of historical data, high-TOC water (i.e., 11-17 mg/L) was prechlorinated,
169

Tabl
e 8.8
Histo
rical
(199
4/95
) DBF
dat
a for
util
ity tr
eatin
g Bi
scay
ne A
quife
r wat
er
Febr
uary
9, 1
994
May
4, 1
994
Aug
usts
, 199
4 N
ovem
ber 9
,
Para
met
erTO
C*
Free
C12
dose
Effe
ctive
Cl2d
oset
Am
mon
iado
seTo
tal
amm
onia
jTh
eore
tical
C12/N
Units mg/
L
mg/
L
mg/
L
mg/
L
mg/
L
mg/
mg
Trea
tPr
e C1
2NA 9.5 6.9 1.6 4.3
/1
.Pla
nt Post
C12
NA 3.7 10.6
0.9 2.5 6.8/1
Trea
tDi
st.
Pre
Syst.
C1
27-
9 NA 3.5 0.
9 1.6 0.6/1
.Pla
nt Post
C12
NA 10.8
11.7 1.5 3.1 3.7/1
Trea
t.Di
st.
Pre
Syst.
C1
27-
9 NA 9.0 6.4 1.6 4.0
/1
Plan
tPo
st C1
2NA 15
.9
22.3 1.1 2.7 6.7/1
Trea
tDi
st.
Pre
Syst.
C1
27-
9 NA 7.0 4.
4 1.6 2.8/1
.Pla
nt Post
C12
NA 18.6
23.0 1.0 2.6
5.4/1
1994
Fe
brua
ry 2
3, 1
995
Trea
t.Di
st.
Pre
Syst.
C1
27-
9 NA 7.0 4.
4 1.6 2.8/1
Plan
tPo
st Di
st.
C12
Syst.
NA
7-9
12.7
17.1 1.0 2.6
5.4/1
(con
tinue
s)

Tabl
e 8.8
(con
tinue
d)
Febr
uary
9, 1
994
May
4, 1
994
Para
met
erpH
§Ti
me*
*
CHC1
3CH
Cl2B
rCH
ClBr
2CH
Br3
TTH
M
Uni
ts h ug/L
ug/L
ug/L
ug/L
ug/L
Trea
t. Pl
ant
Trea
t. Pl
ant
Pre
Post
Dist.
Pr
e Po
stC1
2 C1
2 Sy
st.
C12
C12
8.8
8.6
9.2
18 32.9
7.1 1.4 ND
41.4
Dist.
Syst. 8.2 18 26.7
4.9 1.2 ND
32.8
Aug
ust5
, 19
94Tr
eat.
Plan
tPr
e Po
st Di
st.C1
2 C1
2 Sy
st.10
.1 9.
2 18 NA
NA
NA
NA
74.2
Nov
embe
r 9, 1
994
Trea
t. Pl
ant
Pre
Post
Dist.
C12
C12
Syst.
10.0
9.1 18 N
AN
AN
AN
A95
.6
Febr
uary
23,
199
5Tr
eat.
Plan
tPr
e Po
st Di
st.C1
2 C1
2 Sy
st.10
.0 9.1 18 55
.08.
00.
7N
D63
.7Di
st. S
yst.
= D
istrib
utio
n Sy
stem
Post
C12 =
Pos
tchl
orin
atio
nPr
e C1
2 = P
rech
lorin
atio
nN
A =
not
ana
lyze
d or
not
ava
ilabl
eN
D =
not
det
ecte
dTr
eat.
Plan
t = T
reat
men
t Pla
nt
*Raw
-wate
r TOC
= 1
1-17
mg/L
.*(
•Hist
orica
l raw
-wat
er H
2S in
this
regi
on =
0.3
-0.6
mg/
L;th
eref
ore
assu
min
g -0
.4 m
g/L
H2S
and
that
H2S
oxi
dize
d du
ring
prec
hlor
inat
ion.
JR
aw-w
ater
am
mon
ia =
1.5
-1.7
mg/
L; t
here
fore
ass
umin
g -1
.6 m
g/L
NH
3-N.
§Raw
-wat
erpH
= 7
.1-7
.4.
**D
istrib
utio
n-sy
stem
TH
Ms r
epre
sent
the
aver
age
of fi
ve d
istrib
utio
n-sy
stem
sam
ples
w
ith re
tent
ion
times
of 2
, 12,
18, 2
4, a
nd 3
6 h
(ave
rage
tim
e =
18 h
r).

-J K)
Tabl
e 8.9
Histo
rical
(198
8/89
) DBF
dat
a for
util
ity tr
eatin
g co
lore
d gr
ound
water
*
April
4, 1
988
Para
mete
rTO
CUV
-254
Br'
C12 d
ose
Effe
ctive
Cl2d
oset
Am
mon
iado
seTo
tal Amm
onia§
Theo
retic
alC1
2/NpH Te
mp.
Total
C12
resid
ual
DOX
Units mg/
Lcm
'1
mg/
Lm
g/L
mg/
L
mg/
L
mg/
L
mg/
mg
°C
mg/
L**
ug C
17L
Pre
Inf.
C12
NA
NANA
NA
NA
NA 10 7.4
1.6
1.6 4.6/1
NA
NANA
NA NA
Post
C12
NA NA NA 10 17.4 1.0 2.6
7.2/1
NA NA NA
Augu
stPr
e Ef
f. In
f. C1
29.1
10
.6 NA
NA
.358
NANA
18
0 NA 10 7.4
1.6
1.6 4.6/1
8.8
7.0
NA24
25
NA
3.8
NA20
0
1, 19
88Po
st C1
28.0 .18
6NA 13 20
.4 1.2 2.8 7.4/1
8.9 26 5.8
Oct
ober
17,
1988
Pre
Eff.
Inf.
C12
7.8
12.7
NA.18
1 .35
1 NA
NA
170
NA 10 7.4
1.6
1.6 4.6/1
8.9
7.2
NA25
24
NA
5.6
NA35
0
Post
C12
Eff.
Inf.
8.6
8.3
10.7
.187
.179
.414
NA
NA
170
8 15.4
0.8 2.4
1.6
7.0/1
9.1
9.2
6.924
25
23
4.4
5.0 250
Janu
ary
23, 1
989
Pre
C12
NA NA NA 13 10.4 1.6 6.5/1
NA NA NA
Post
C12
8.4 .243
NA 8 18.4 1 2.6 9.1/1
8.9 24 6.4
Eff.
8.1 .232 NA 9.1 24 5.8 310
(con
tinue
s)

Tabl
e 8.
9 (c
ontin
ued)
Para
met
erCH
C13
CHCl
2Br
CHCl
Br2
CHBr
3TT
HM
MCA
AD
CAA
TCA
AM
BAA
DBA
AHA
ASCN
C1
Uni
ts ug/L
ug/L
Mg/L
ug/L
ug/L
Mg/L
Mg/L
Mg/L
ug/L
Mg/L
Mg/L
Mg/L
Apr
il 4,
198
8Pr
e Po
st In
f. C1
2 C1
2 Ef
f. 15 2.7
0.5
ND 19 1.5 9.8
6.7
ND
ND 18 NA
Aug
ust 1
, 198
8Pr
e Po
st In
f. C1
2 C1
2 Ef
f. 44 10 2.4
ND 56 2.3 15 10 ND
ND 27 5.4
Oct
ober
17,
1988
Pre
Post
Inf.
C12
C12
Eff. 26 4.5
0.7 1.4 33 2.1 15 8.8
ND
ND 26 7.3
Janu
ary
23, 1
989
Pre
Post
Inf.
C12
C12
Eff.
37 9.3 1.7 0.1 48 2.8 19 13 ND
ND 35 12
Eff.
= Ef
fluen
tIn
f. =
Influ
ent
Post
C12 =
Pos
tchl
orin
atio
nPr
e C12
= P
rech
lorin
atio
nN
A =
not
ana
lyze
d or
not
ava
ilabl
eN
D =
not
det
ecte
dTe
mp.
= T
empe
ratu
re
The
se d
ata t
aken
from
ano
ther
faci
lity
treat
ing
wat
er fr
om a
noth
er a
quife
r nea
r the
Bisc
ayne
Aqu
ifer.
•("Hi
storic
al so
urce
-wat
er H
2S in
this
regi
on =
0.3
-0.6
mg/
L; a
ssum
ing
-0.4
mg/
L H
2S a
nd th
at H
2S o
xidi
zed
durin
g pr
echl
orin
atio
n.JA
mm
onia
dos
ed im
med
iate
ly a
fter p
ostc
hlor
ine
addi
tion
poin
t.§H
istor
ical
sou
rce-
wat
er a
mm
onia
in th
is re
gion
= 1
.5-1
.7 m
g/L;
ass
umin
g -1
,6 m
g/L
NH
3-N.
**As
C12
.

lime-softened (at pH 9 to 10), and postchlorinated. Prechlorination doses ranged from 4 to 13 mg/L, and postchlorination doses were 4 to 19 mg/L. Based on historical source-water ammonia levels of 1.5 to 1.7 mg/L and hydrogen sulfide levels of 0.3 to 0.6 mg/L, theoretical C^/N ratios during prechlorination were in the range of 0.6/1 to 6/1, and for postchlorination they were in the range of 4/1 to 9/1. As discussed above, the actual C^/N ratios were probably lower if there was a significant chlorine demand from other constituents in the water.1
For these historical data sets, TTHMs ranged from 19 to 96 ug/L, with chloroform the dominant THM (where THM speciation data were available). Figure 8.4 shows the effect of chlorine dose on TTHM formation in these colored groundwaters for the current and historical data, as well as the bench-scale experiments. All of the parameters were not identical in each sampling (e.g., contact time); however, this figure highlights the general trend. Low chlorine doses (<7 mg/L) resulted in low Cb/N ratios and essentially no THMs. In these limited data sets, total chlorine doses (for pre- and postchlorination) of 13 to 20 mg/L resulted in 19 to 64 ug/L TTHMs, whereas total chlorine doses of >21 mg/L resulted in 48 to 105 ug/L TTHMs. The correlation coefficients r and r2 for the chlorine-dose/TTHM-formation relationship (i.e., best-fit line not forced through zero) are 0.829 and 0.688, respectively; a high degree of scatter occurred in the data (Figure 8.4).
For the 1988/89 data set, plant-effluent DOX concentrations ranged from 200 to 350 ug C17L, HAAS concentrations were 18 to 35 ng/L, and the CNC1 concentrations ranged from 5 to 12 ug/L. These CNC1 results are higher than those detected in the current distribution system (1.4 ug/L); however, the 1988/89 samples were collected at the plant effluent and may not reflect the full effect of base-catalyzed hydrolysis in the distribution system.
In ozone pilot plant tests of colored groundwater performed by other investigators, ozonation was found to oxidize the hydrogen sulfide, destroy color, and significantly reduce the THM formation potential (Dunkelberger et al. 1992). Ozonation, however, did not have a significant impact on the HAA formation potential. Other analyses of this colored groundwater after ozonation and biofiltration with a 2-h SDS test—with a 4.2 mg/L free chlorine dose in a sample with 1.6 mg/L of raw-water ammonia-nitrogen—yielded 5.9 ug/L TTHMs and 15 ug/L HAAS (Glaze and Weinberg 1993). In this testing, DCAA was the major HAA formed (8.7 ug/L).
174

110
100 90 80
I70
3 6
0(A
50 40 30 20 10 0
i _ ii
._
_ ( _
..'1
r
~ -
-— —
^ ..........
..........
- -.—.
11
! /
........
. _._
... i
. ..
1 i
/
: • : i : +„«
..-„
..*—
'"""
•
...-"
•''....
........
........
... ...._
...
f i /
•i •i
/i » »
•' *
.._; ..-
* !
.* '
................
................
............ ..
................
................
.............^.
.....-..........
................
......_
f lUU
SI
MIIIIIIU
IIIC
1 •
• £
Hyd
roge
n Su
lfide
=2
- 3.1
mg/
L,
: 0.3
- 0.
6 m
g/L
•-
i .
....
. . i
......
... ..
.. ...
. ...
.. ..—
10
15
20
Tota
l Chl
orin
e Do
se (m
g/L)
2530
Figu
re 8
.4 Ef
fect
of c
hlor
ine
dose
on
TTHM
form
atio
n in
col
ored
gro
undw
ater
s

Northeastern Creek Water
Influence of Water Quality Parameters on DBF Formation
Figure 8.5 and Table 8.10 show the current treatment of the northeastern creek water and the DBF data for the finished water. The finished water, however, represents a blend from two different treatment plants (40-60 percent was from the treatment plant treating the creek water). The water was prechlorinated to breakpoint-chlorinate the source-water ammonia (0.1 mg/L); conventionally treated with alum coagulation; partially dechlorinated with sulfur dioxide addition (0.22 mg/L); and postchloraminated at a Clj/N ratio of 3/1 (where the ratio equaled the filter-effluent chlorine residual plus the postchlorination dosage divided by the ammonia dosage). The finished-water pH was 7.1. The source water was subjected to three bench-scale experiments, with C12/N ratios of 2.7/1 and 4.5/1 at pH 8 and with a C12/N ratio of 4.3/1 at pH 6. The Cb/N ratio in the bench-scale experiments is based on the sum of the source-water ammonia and ammonia present in the preformed chloramines, as no prechlorination was used in these experiments to breakpoint-chlorinate the source-water ammonia.
As was observed in tests on the three primary waters (Figures 5.7, 5.8, and 5.9), a significant percentage of the chloramines at pH 6 was dichloramine (68 percent). In these bench- scale tests, the highest DOX and THM formation was at pH 6, whereas a greater amount of HAAs were produced at pH 8. In Task la testing at either a C12/N ratio of 3/1 or 5/1, DOX formation in LHW (Figure 5.15) and CSPW (Figure 5.17) was higher at pH 6 than at pH 8, whereas the maximum DOX for LAW (Figure 5.12) was at pH 8 for a C12/N ratio of 5/1.
In the northeastern creek water, CNC1 formation was highest at a C12/N ratio of 4.5/1 and a pH of 8 (8 ug/L versus 3 [ig/L in the other two tests). Likewise, in the Task la study of ambient-bromide LHW, more CNC1 was formed at a C12/N ratio of 5/1 and a pH of 8 (16 ug/L) than at the lower C12/N ratio (2 ug/L) or the lower pH (7 ug/L).
The effect of bromide was negligible in this water, which contained an average level of bromide (50 ug/L). At pH 8, bromide utilization was highest for the HAAs, whereas at pH 6 it was highest for the THMs. CNBr levels were at or somewhat above the minimum reporting level of 0.5
176

POW
DERE
DAC
TIVA
TED
CARB
ON
HIGH
-LIF
TDI
STRI
BUTI
ONPU
MP
Figu
re 8
.5 W
ater t
reat
men
t pla
nt fl
ow sc
hem
atic
for n
orth
easte
rn u
tility

Table 8.10 Influence of water quality parameters on DBF formation in northeastern creek water
Treatment Plant
ParameterTOC
UV-254Br'
Free C12 dose
Ammonia dose
Total ammonia
CI 2/N
PH
TemperatureTime
Free CI2 residual
NH2C1 residual
NHC12 residual
Total C1 2 residual
DOX
CHC1 3
CHCl2Br
CHClBr2CHBr3
TTHM
MCAA
Source PreCl2 Units Watermg/L 2.0 NA
cm' 1 0.038 NA
ug/L 50 NA
mg/L 3.5
mg/L
mg/L 0.1 0.1
mg/mg >8/l7.4 NA
°C 13 NA
h
mg/Lt
mg/Lt
mg/Ltmg/Lf
ugClVL
ug/L
ug/Lug/Lug/L
ug/Lug/L
PostCl2 Dist. Syst.*
NA NA
NA NA
NA NA
1.2
0.50.6
3/1
NA 7.1
NA 17NA
NAJ
NAJ
NAJ
NA$
59
17.9
8.8
1.0ND
27.7
ND
Batch1
2.0
0.038
50
2.8
0.9
1.0
2.7/1
8.1
22
48
ND
1.76
0.09
1.85
75
3.2
BDL
ND
ND
3.2
ND
Batch2
2.0
0.038
50
4.6
0.9
1.0
4.5/1
7.8
22
48
ND
1.55
ND
1.55
89
2.5
BDL
ND
ND
2.5
1.3
Batch3
2.0
0.038
50
3.2
0.60.7
4.3/1
6.0
22
48
ND
0.58
1.25
1.83144
3.3
2.3
1.2ND
6.8
ND
(continues)
178

Table 8.10 (continued)
Parameter
DCAATCAABCAAMBAADBAAHAA6CNC1CNBrCNXTTHMOX/DOXHAA6OX/DOXCNXOX/DOXDBPOX/DOXn
n '(3/6)TTHM-Br/Br'HAA6-Br/Br-CNX-Br/Br"
Treatment PlantSource PreCl2 PostCl2 Dist.
Units Water Syst.*
ug/L 3.9ug/L 5.1ug/L 2.3ug/L NDug/L 1.2ug/L 12.5Ug/L 1 .4ug/L 0.8ug/L 2.2
%%%/O
/o
/O
%
Batch1
9.72.73.3ND0.816.52.6ND2.63.36.62.011.9
00.23
04.20
Batch2
6.42.73.82.01.8
18.08.30.58.82.25.85.713.7
00.42
08.40.7
Batch3
1.61.71.8NDND5.13.20.84.03.11.41.56.0
0.540.314.11.71.2
BDL = below detection limitDist. Syst. = Distribution SystemNA = Not analyzed or not availableND = Not detectedPost C12 = PostchlorinationPre C12 = prechlorination
*40-60 percent of distribution-system sample came from treatment plant treating creek water.fAs C12^Normally, the distribution system has 0.1-0.2 mg/L free C1 2 residual and 0.6-0.7 mg/L NH2C1residual.
179

The percentage of DOX that was accounted for by the measured DBFs was higher at pH
(12-14 percent) than at pH 6 (6 percent). DOX formation was highest at pH 6, but the makeup of the specific DBFs formed under these conditions was not as well characterized as at pH 8 (i.e., a
smaller percentage of the DOX was accounted for by the measured DBFs at pH 6).In the full-scale facility, DBF formation was different because the water was initially
breakpoint-chlorinated. (In addition, only 40-60 percent of the distribution-system sample came
from the treatment plant treating the creek water.) Under these conditions, the DBF precursors were allowed to react with free chlorine prior to postchloramination. THMs readily formed
during the prechlorination/postchloramination scheme (28 ug/L), whereas THM formation was
well-controlled during bench-scale chloramination (2-7 ng/L).On the other hand, HAA formation at pH 7-8 was similar in bench- and full-scale tests
(12-18 ug/L). During bench-scale chloramination at pH 8, DCAA was the major HAA formed
(6-10 ng/L), with a smaller amount of TCAA formation (3 |ig/L), whereas DCAA and TCAA
production during the prechlorination/postchloramination scheme were similar (4-5 ug/L each). In the 35-utility DBF study, in which most of the facilities utilized prechlorination with or
without postchloramination, the median occurrences of DCAA and TCAA in plant effluents
were comparable (4-7 ug/L each) (Krasner et al. 1989a). These results, and those observed for
other Task la and Task 3 waters in this study, suggest that chloramination is more effective in controlling the production of THMs and TCAA than it is in controlling DCAA formation.
Interpretation of Historical Data
Table 8.11 shows historical data for the northeastern plant treating creek water. The
water was prechlorinated to breakpoint-chlorinate source-water ammonia and was postchloraminated at a Cb/N ratio of 3/1. TTHM concentrations ranged from 14 to 70 ug/L, and
HAA6 concentrations were 26 to 45 ng/L. These levels reflect the exposure of the DBF precursors to free chlorine during prechlorination. In these samples, TCAA levels (19 to 28
ug/L) were higher than the DCAA concentrations (2 to 14 |4.g/L), which is opposite to the trend
observed during bench-scale chloramination, where free-chlorine contact was not experienced.
Surface-water systems that have source-water ammonia typically will breakpoint chlorinate, so that a free chlorine residual is available for disinfection credit. At the northeastern
180
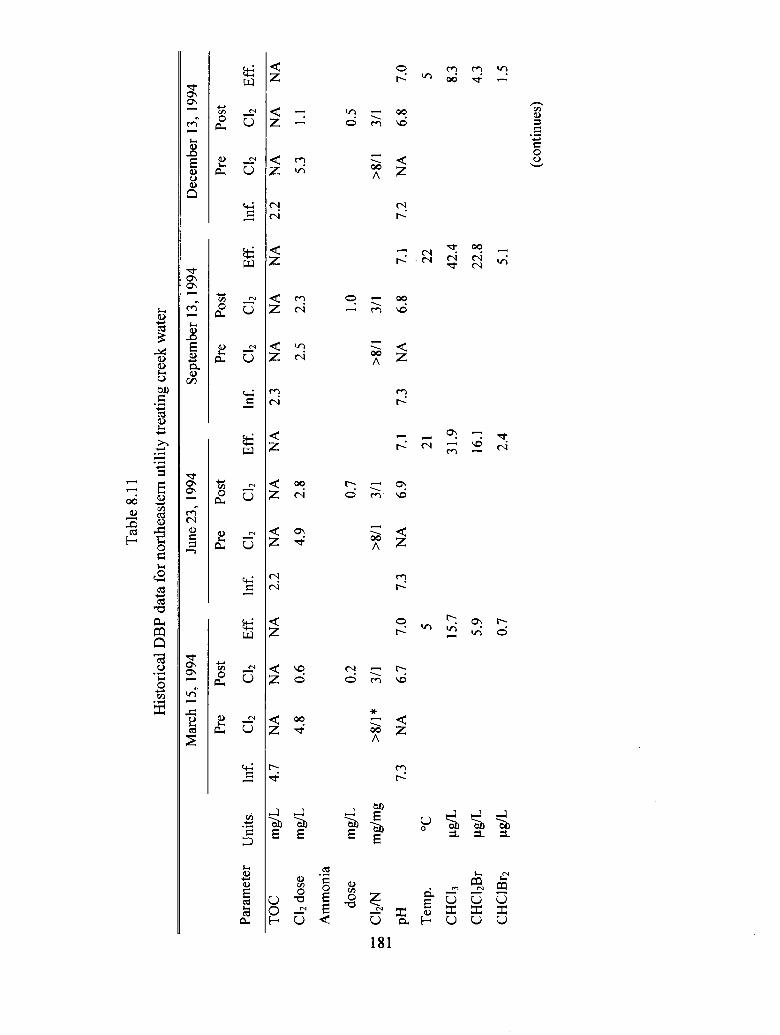
oo
Tabl
e 8.1
1
Hist
oric
al D
BF d
ata
for n
orth
easte
rn u
tility
trea
ting
cree
k w
ater
Mar
ch 1
5, 19
94
Para
met
er
TOC
C12 d
ose
Am
mon
ia
dose
C12/N
pH Tem
p.CH
C13
CHCl
2Br
CHCl
Br2
Pre
Uni
ts In
f. C1
2
mg/
L 4.
7 N
Am
g/L
4.8
mg/
L
mg/
mg
>8/l*
7.3
NA
°C Hg/L
ug/L
Hg/L
Post
C12
NA 0.6
0.2
3/1 6.7
Eff.
Inf.
NA
2.
2
7.0
7.3
5 15.7
5.9
0.7
June
23,
199
4
Pre
Post
C12
C12
NA
N
A
4.9
2.8
0.7
>8/l
3/1
NA
6.
9
Sept
embe
r 1 3
, 1 9
94
Dec
embe
r 1 3
, 1 9
94
Eff.
Inf.
NA
2.
3
7.1
7.321 31
.9
16.1
2.4
Pre
Post
C12
C12
NA
N
A
2.5
2.3 1.0
>8/l
3/1
NA
6.
8
Pre
Eff.
Inf.
C12
NA
2.
2 N
A 5.3 >8/l
7.1
7.2
NA
22 42.4
22.8
5.1
Post
C12
NA 1.1 0.5
3/1 6.8
Eff. NA
7.0 5 8.3 4.3 1.5
(con
tinue
s)
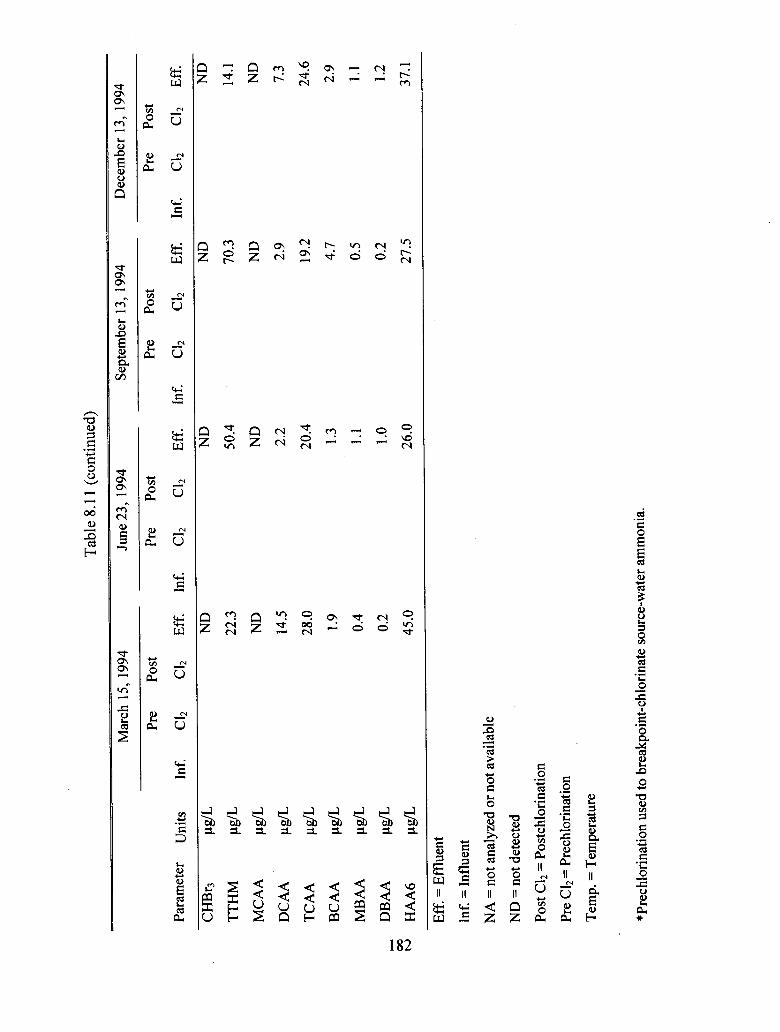
Tabl
e 8.
11 (
cont
inue
d)
Para
met
er
CHBr
3TT
HMM
CAA
DCAA
TCAA
BCAA
MBA
A^
DBAA
10
HAA6
Units Hg
/LHg
/L"g
/L"g
/LHg
/LHg
/L|ig
/L"g
/LHg
/L
Mar
ch 1
5, 19
94
Pre
Post
Inf.
C12
C12
Eff.
Inf.
ND
22.3
ND
14.5
28.0 1.9 0.4
0.2 45.0
June
23,
1994
Pre
Post
C12
C12
Eff. ND
50.4
ND 2.2
20.4 1.3 1.1 1.0 26.0
Sept
embe
r 13,
1994
Pre
Post
Inf.
C12
C12
Eff.
ND
70.3
ND 2.9
19.2
4.7 0.5 0.2 27.5
Dec
embe
r 13,
1994
Pre
Post
Inf.
C12
C12
Eff. ND
14.1
ND 7.3 24.6
2.9 1.1 1.2 37.1
Eff.
= Ef
fluen
tIn
f. =
Influ
ent
NA
= n
ot an
alyze
d or
not
avai
labl
e
ND
= n
ot d
etecte
dPo
st C1
2 = P
ostc
hlor
inat
ion
Pre
C12 =
Pre
chlo
rinat
ion
Tem
p. =
Tem
pera
ture
*Pre
chlo
rinati
on u
sed
to b
reak
poin
t-chl
orin
ate
sour
ce-w
ater
amm
onia.

plant treating creek water, the THM and HAA formation was curtailed with postchloramination. These historical DBF levels are below the proposed Stage 1 MCLs for TTHMs and HAA5 (0.080 and 0.060 mg/L, respectively). Compliance, however, with the proposed Stage 2 MCLs of 0.040 mg/L TTHMs and 0.030 mg/L HAAS might require a change in treatment (e.g., a switch to an alternative disinfectant for primary disinfection, with chloramines for secondary disinfection), as the historical HAAS concentrations—excluding the BCAA values—were 23 to 42 ug/L.
Pacific Northwest Lake Water
Influence of Water Quality Parameters on DBF Formation
Figure 8.6 and Table 8.12 show the current treatment of the Pacific Northwest lake water and the DBF data for the finished water. The water is low in both TOC (1.4 mg/L) and bromide (7 |ag/L) and is an unfiltered supply. It is chlorinated for disinfection, and ammonia is added (2- 5 h downstream) at a Cb/N ratio of 4.7/1 for distribution, with a finished-water pH of 6.7. Historically, the utility treating this source water added the ammonia 30 s after the chlorine at a Cb/N ratio of 7/1. This historical chloramination scheme produced a total chlorine residual of 1.7 mg/L on the average (in 1990), with average residuals of 0.7 and 1.0 mg/L for mono- and dichloramine, respectively. The source water from this utility was subjected to three bench-scale experiments, with C12/N ratios of 7/1 and 5/1 at pH 6.3 and at a C12/N ratio of 5/1 at pH 7.4.
As was observed in tests on the three primary waters, dichloramine formation was significantly influenced by pH and Cb/N ratio (Figures 5.7, 5.8, and 5.9). Bench-scale chloramination at pH 6.3, with Cb/N ratios of 7/1 and 5/1, resulted in the dichloramine residual representing 79 and 32 percent of the total residual, respectively, whereas at pH 7.4 and a Cb/N ratio of 5/1, dichloramine only accounted for 3 percent of the total residual. The high percentage of dichloramine produced in the bench-scale test at a Cb/N ratio of 7/1 and at a pH of 6 is comparable to the historical full-scale percentage (60 percent).
DOX and HAA formation were higher at pH 6.3 than at pH 7.4. (No THMs were formed at either pH in the bench-scale experiments.) As has been observed in the other Task la and Task 3 waters in this study, DCAA was the major HAA produced (10-13 ng/L at pH 6.3). CNC1
183

00
WA
TER
SHED
A
ND
SU
PPLY DI
VERS
ION
DAM
AN
D HE
ADW
ORK
S
DAM
NO
. 1
CH
LOR
INE
DAM
NO
. 2
AM
MO
NIA
Figu
re 8
.6 W
ater
trea
tmen
t flo
w sc
hem
atic
for P
acifi
c N
orth
wes
t util
ity

Table 8.12
Influence of water quality parameters on DBF formation in Pacific Northwest lake water
ParameterTOCUV-254Br'
Free C12 doseC12/NpHTemperatureTimeFree C12
residualNH2C1
residualNHC12
residualTotal C1 2
residualDOXCHC13CHCl2BrCHClBr2CHBr3TTHMMCAADCAATCAA
Source Treatment Units Water Plantmg/L 1.4 NAcm' 1 0.028 NAug/L 7 NAmg/L 2.6
mg/mg 4.7/17.0 NA
°C 9.3 NAh
mg/L*
mg/L*
mg/L*
mg/L*
ugCl'/LHg/LHg/L"g/L|^g/Ll^g/L"g/LHg/Lug/L
Dist.Syst.NANANA
6.710
320ND
NA
NA
0.67
8510.6BDLBDLBDL10.61.016.318.5
Batch1
1.40.028
73.47/16.32248
0.05
0.31
1.33
1.69
39BDLNDNDNDNDND9.72.7
Batch2
1.40.028
73.25/16.32248
ND
1.24
0.59
1.83
36BDLNDNDNDNDND12.81.8
Batch3
1.40.028
74.55/17.42248ND
2.42
0.08
2.50
27BDLNDNDNDNDND3.61.7
(continues)
185

Table 8.12 (continued)
ParameterBCAA
MBAA
DBAA
HAA6
CNC1
CNBr
CNXTTHMOX/DOX
HAA6OX/DOX
CNXOX/DOX
DBPOX/DOX
n
n ' (3/6)
TTHM-Br/Br-
HAA6-Br/Br-
CNX-Br/Br'
Source Treatment Dist. Units Water Plant Syst.jig/L 2.1
Hg/L ND
Hg/L ND
^g/L 37.8
Hg/L 2.8
Hg/L 0.6
Hg/L 3.4
%
%
%
%
%
%
%
Batch 1
1.8
ND
ND
14.2
2.4
0.5
2.9
0
10.7
4.1
14.8
NA
0.10
0
11.8
5
Batch2
1.5
ND
ND
16.1
2.3
0.5
2.8
011.2
4.2
15.5 ,NA
0.07
0
9.8
5
Batch3
2.7
ND
NR
8.0
6
0.5
7
010.0
13.7
23.7
NA
0.29
017.7
5
BDL = Below detection limit.
Dist. Syst. = Distribution System
NA = Not analyzed or not available.
ND = Not detected.
NR = Not reported; interference with DBAA peak in this sample.
*As C12
186

formation was highest at pH 8 (6 ng/L, versus 2 ug/L at pH 6), which is consistent with that observed for LHW and the northeastern creek water tests at a C12/N ratio of 5/1 (Table 8.10).
The percentage of DOX that was accounted for by the measured DBFs (15-24 percent) was consistent with other waters in this project (Figures 5.24, 5.25, and 5.26). HAAs accounted for 10-11 percent of the DOX (on a molar basis) in each of the bench-scale tests, whereas the CNXs varied from 4 to 14 percent of the DOX.
In the current full-scale treatment, the free-chlorine contact time resulted in a significantly higher concentration of DOX compared to that found in the batch studies (85 versus 27-39 ng C17L with bench-scale chloramination), as well as a higher HAA6 concentration (38 versus 8-16 ug/L) and THM formation (11 |ig/L). As observed with the prechlorination scenario for the northeastern creek water (Table 8.10), DCAA and TCAA formation were now comparable (16-18 ug/L of each). CNC1 formation, however, was consistent with that seen in the bench-scale tests at pH 6.3 (2-3 ng/L). The prechlorination changed the amount and speciation of the THMs and HAAs formed, whereas the postchloramination produced CNC1 results similar to those of the bench-scale chloramination. The testing in this water confirmed that chloramines minimize THM and TCAA formation, whereas DCAA can be produced at a significant level during chloramination.
Interpretation of Historical Data
Tables 8.13 and 8.14 show historical data for the Pacific Northwest facility. In 1991, the water was chlorinated, followed 30 s later by ammonia addition at a 7/1 Cb/N ratio, whereas in the 1994/95 data sets, the water was chlorinated, with ammonia addition 2-5 h later at a 5/1 Cb/N ratio. The THM/HAA data represent the average values of four distribution-system locations with average retention times of 58 to 68 h. In the 1991 data set, TTHM concentrations were relatively low (1-5 ug/L), whereas with the current prechlorination scheme the TTHM concentrations have been up to 14-18 ug/L. The HAA results appear to be higher with the new disinfection scenario. The HAAS concentrations (without BCAA) were 15 and 26 ng/L on the two sample dates for which HAA data were available in 1991, whereas the HAA6 concentration (with 0-2 \ig/L BCAA) was 29-40 ng/L in the 1994/95 data set These results are similar to those
187

00 oo
Tabl
e 8.
13
Hist
oric
al (1
991)
DBF
dat
a for
Pac
ific
Nor
thw
est u
tility
Febr
uary
20,
199
1
Para
met
er
TOC
Bf
Free
C12
dose
C12/N
PH Tem
p.
DO
X
CHC1
3
CHCl
2Br
Sour
ce
Trea
t.
Uni
ts W
ater
Pl
ant
mg/
L 1.3
N
A
ug/L
<5
0 N
A
mg/
L 1.8
mg/
m
7/1
g6.
9 N
A°C
ug C
17L
ug/L
ug/L
Dist
.
Syst.
NA
NA 6.8
NA 73 5.0
ND
Apr
il 9,
199
1
Sour
ce
Trea
t.
Wat
er
Plan
t
1.4
NA
<50
NA 1.8 7/1
6.9
NA
Dist
.
Syst.
NA
NA 6.9 8.5
NA 1.2 ND
Aug
ust 2
0, 1
991
Sour
ce
Trea
t.
Wat
er
Plan
t
1.1
NA
NA
N
A 1.8 7/1
7.4
NA
Dist
.
Syst.
NA
NA 6.7
17.5
NA 4.2 0.8
Dec
embe
r 10,
1991
Sour
ce
Trea
t.
Wat
er
Plan
t
2.2
NA
NA
N
A 1.8 7/1
6.8
NA
Dist
.
Syst.
NA
NA 6.5 6.0
120
4.2
ND
(con
tinue
s)

Tabl
e 8.
13 (
cont
inue
d)
00
Para
met
er
CHCl
Br2
CHBr
3TT
HM
MCA
A
DCA
A
TCA
A
MBA
A
DBA
A
HAAS
CNC1
Uni
ts
Hg/L
Hg/L
HB/L
"g/L
Hg/L
Hg/L
ug/L
ug/L
ug/L
ug/L
Febr
uary
20,
199
1
Sour
ce
Trea
t. D
ist.
Wat
er
Plan
t Sy
st.
ND
ND 5.0
NA
NA
NA
NA
NA
NA
NA
Apr
il 9,
1991
Sour
ce
Trea
t. D
ist.
Wat
er
Plan
t Sy
st.
ND
ND 1.2 NA
NA
NA
NA
NA
NA 6.4
Aug
ust 2
0, 1
991
Sour
ce
Trea
t. D
ist.
Wat
er
Plan
t Sy
st.
ND
ND 5.0
ND
13.6
12.3
ND
ND
25.8
NA
Dec
embe
r 10
, 199
1
Sour
ce
Trea
t. D
ist.
Wat
er
Plan
t Sy
st.
ND
ND 4.2
ND 15 ND
ND
ND 15 NA
Dist
. Sys
t. =
Dist
ribut
ion
Syste
mN
A =
Not
ana
lyze
d or
not
ava
ilabl
e.
ND
= N
ot d
etec
ted.
Tem
p. =
Tem
pera
ture
Trea
t. Pl
ant =
Tre
atm
ent P
lant

Tabl
e 8.
14
Histo
rical
(199
4/95
) DBF
dat
a for
Pac
ific N
orth
wes
t util
ity
April
12,
1994
Para
met
er
TOC
Br'
Free
C12
dose
C12/N
pH Tem
p.D
OX
CHC1
3CH
Cl2B
rCH
ClBr
2
Sour
ce
Uni
ts W
ater
mg/
L 1.1
fjg/L
N
A
mg/
Lm
g/m
g7.1
°C
MgC
lVL
Mg/L
Mg/L
Mg/L
Trea
t.
Plan
t
NA
NA 1.8 5/1 NA
Dist.
Syst.
NA
NA 6.4
9.0
NA 13 0.7
ND
Aug
ust 2
, 199
4
Sour
ce
Trea
t.
Wat
er
Plan
t
1.2
NA
NA
N
A 1.7 5/17.
0 N
A
Dist.
Syst.
NA
NA 6.7
NA
NA 15 1.1 ND
Dec
embe
r 6, 1
994
Febr
uary
14,
1995
Sour
ce
Trea
t.
Wat
er
Plan
t
2.0
NA
NA
N
A 1.8 5/17.
2 N
A
Dist.
So
urce
Syst.
W
ater
NA
1.4
NA
N
A
6.7
7.37.2 N
A 17 0.8
ND
Trea
t.
Plan
t
NA
NA 1.8 5/1 NA
Dist.
Syst.
NA
NA 6.7 6.5 NA 14 0.5 ND
(con
tinue
s)

Tabl
e 8.
14 (c
ontin
ued)
Para
met
er
CHBr
3
TTH
M
MCA
A
DCA
A
TCA
A
BCA
A
MBA
A
DBA
A
HA
A6
CNC1
Uni
ts
"g/L
Hg/L
Hg/L
"g/L
ug/L
ug/L
Mg/L
"g/L
Hg/L
Hg/L
Apr
il 12
, 199
4
Sour
ce
Trea
t. D
ist.
Wat
er
Plan
t Sy
st.
ND 14 ND 16 13 ND
ND
ND 29 NA
Aug
ust 2
, 199
4
Sour
ce
Trea
t. D
ist.
Wat
er
Plan
t Sy
st.
ND 16 ND 11 13 2.3
ND 2.0 28 NA
Dec
embe
r 6, 1
994
Sour
ce
Trea
t. D
ist.
Wat
er
Plan
t Sy
st.
ND 18 ND 16 15 1.8 ND 1.2 34 NA
Febr
uary
14,
1995
Sour
ce
Trea
t. D
ist.
Wat
er
Plan
t Sy
st.
ND 15 ND 20 16 2.3
ND 1.5 40 NA
Dist
. Sys
t. =
Dist
ribut
ion
Syste
mN
A =
Not
ana
lyze
d or
not
ava
ilabl
e.
ND
= N
ot d
etec
ted.
Tem
p. =
Tem
pera
ture
Trea
t. Pl
ant =
Tre
atm
ent P
lant

shown for the bench- and current full-scale data in Table 8.12. In one of the two HAA sets from
1991, DCAA was the only HAA detected, whereas DCAA and TCAA are the dominant HAAs in
all of the 1994/95 sets.Although the current full-scale disinfection scenario is resulting in higher levels of THMs
and HAAs, this scheme incorporates a significant amount of free-chlorine contact time, which is
mportant from a microbial perspective for the treatment of an unfiltered surface-water supply.
192

CHAPTER 9ANALYTICAL APPROACHES TO DETERMINE
"NEW" CHLORAMINE DBPs—TASK 4
OBJECTIVES
The objectives of Task 4 of this project were (1) to investigate analytical approaches for the determination of previously undetected DBPs associated with chloramination and (2) to use this protocol to measure chloramine DBPs.
To accomplish this, the following scheme was used:
• Evaluate suitability of liquid chromatography (LC) and LC-mass spectrometry
(MS) analytical methods for the determination of high polarity, low volatility chloramine DBPs, with particular emphasis on N-chloro organic compounds.
• Evaluate and implement concentration techniques to improve sensitivities
(detectability) for semivolatile chloramine DBPs.
• Characterize chloraminated samples by apparent molecular weight (AMW) and relate the distribution of AMW to the methods being developed.
EXPERIMENTAL APPROACH
Inorganic chloramines are weaker oxidants than chlorine and would be expected to produce less fragmentation, incomplete oxidation of functional groups, and less halogenation per molecule of DBF precursor. The DBPs formed from chloramination would therefore tend to retain their general precursor polarity characteristics and general precursor structure and occur at lower concentrations than those produced by chlorination. Chloramine DBPs are also expected to cover a wide range of molecular weights and volatilities. To address these issues, a combination of three approaches was used in this study to provide information on the nature of chloramine DBPs and insight into applicable analytical techniques. The work focused primarily on halogenated by-products as halogenated chlorine DBPs have been shown to be of health
concern (Bull and McCabe 1985).
193

Some chlorination by-products can also be formed by chloramination (e.g., THMs and HAAs); therefore, as a starting point, various chlorine DBFs were used as model compounds to evaluate analytical techniques. Some of the model compounds were also studied in Tasks 1 to 3
to determine if they could be produced by chloramines.
Because only approximately 10 to 20 percent of the DOX produced during
chloramination could be accounted for by target compounds measured with gas chromatography
(GC) (Tasks 1 to 3), LC techniques were explored for chloramine DBFs. LC separation coupled
with UV absorbance and MS detection was evaluated for the analysis of N-chloro organic compounds (organic chloramines) and related compounds that are polar, reactive, and nonvolatile. Two methods of interfacing LC and MS were evaluated, particle beam (PB) and
electrospray ionization (ESI).Concentration techniques were evaluated to increase sensitivity for chloramine DBF
detection. An on-line enrichment method was developed for LC, and to further increase
concentration, a separate graphitized carbon (carbopak-B) solid phase extraction (SPEB)
technique was explored. Simultaneous distillation extraction (SDE) concentration, coupled with
GC-MS, was adapted for detection of semivolatile chloramine DBFs.
To provide a better understanding of the nature of chloramine DBFs and to determine the extent of chloramine DBFs detectable by the techniques developed in this study, work was undertaken to determine the size (i.e., molecular weight) distribution of the organic matter and, specifically, the halogenated organic matter after chloramination. An ultrafiltration (UF)
technique was evaluated and utilized to study chloramination effects on a variety of waters.
Results obtained with this approach are expected to guide future detection and analyses.
LC TECHNIQUES FOR POLAR DBFs
Overview
High performance LC was selected as an approach for separating polar chloramine DBFs of low volatility, such as N-chloro organic compounds, prior to identification by MS. The high polarity, low volatility, and instability associated with these by-products make LC a logical
194
choice for chromatographic separation. Many similar compounds are not amenable to GC
techniques unless they undergo complex derivatization processes.
The early portion of the study focused on "bringing on-line" a suitable LC method,
utilizing a UV detector, before investigating the feasibility of using PB as the interface to couple
the LC with the MS for specific compound identification. In addition to chromatographic
conditions, sample concentration techniques, detection, and MS interfacing were evaluated. To
improve detection of low-level chloramine DBFs, on-line enrichment, SPEB, and UF were
investigated. (UF is discussed in a later section.) Post-column KI (potassium iodide)
derivatization (Yoon and Jensen 1993a; 1993b) combined with UV absorbance and MS,
independently or in parallel, was used for detection and compound identification. The use of
conventional, microbore, and capillary reverse-phase LC systems was also explored. LC
conditions were optimized for sensitivity and chromatographic separation prior to PB-MS
interfacing. The initial work was developed and evaluated based on model compounds. Later
work also included analyses of natural waters. The analysis of a model compound was also
conducted using LC-ESI-MS.
Experimental
Model Compound Selection
The model compounds were selected based on chlorination studies of organic nitrogen-
containing wastewaters by Jersey and Johnson (1992) and others (Conyers and Scully 1993;
McCormick et al. 1993). N-chloro alkylamines are relatively stable and are close in character to
the inorganic monochloramine. Chlorinated amino acids and chlorinated peptides were selected
because of the occurrence of the parent compounds and related precursors in natural waters.
Chloramination is expected to form some of the same by-products as chlorination. Not all
chlorination by-products will be formed with chloramination, however, and other unique
chloramination by-products may be formed. Low-molecular-weight compounds were also
chosen to help identify chloramine DBFs that interfere in the total chlorine residual
measurements. These tests are used by utilities to measure disinfecting capability and by kidney
dialysis facilities as an indication of monochloramine removal. The chlorinated by-products of
195
five alkylamines (CLAMs), six amino acids (CLAAs), five peptides (CLPs), monochloramine, and dichloramine were selected as model compounds to be used for initial LC method development (see Table 9.1).
Reagents
The chlorine-containing model compounds are not commercially available. Solutions of the model compounds were prepared fresh daily by chlorination or chloramination of the parent amine, amino acid, or peptide. In some cases, the structure and amount of chlorinated product(s) formed varied with reaction conditions; however, for consistency, the concentrations of model compounds used in this work refer to the initial concentration of the parent compound. Stock solutions (approximately 30,000 mg/L) of each parent amino acid and peptide (Aldrich, Milwaukee, Wis.) were prepared in acidified water to dissolve the compound. Each parent amine was dissolved in water without acid. The chlorine solution (approximately 4,000 mg/L as C\2) was prepared using sodium hypochlorite and buffered at pH 7 with potassium dihydrogen phosphate. The chlorine stock solution was standardized daily using a colorimeter (Hach Model DR-1A, Loveland, Colo.) or an amperometric titrator (Hach, Loveland, Colo.) (Standard Methods; APHA et al. 1992).
Ammonium chloride (1,000 mg/L as N) was used as the ammonia source.The phosphate buffer, 0.02 M and 0.002 M, pH 6.2, was used to maintain pH. The
preparation of the mobile phase included pH verification, filtering through a 0.22-um membrane filter, and degassing by vacuum filtration or sonication daily.
The KI derivatization reagent (pH 4) was 0.09 M KI in 0.24 M acetic acid/0.054 M sodium acetate buffer.
Two solvent systems were used in the project. The first solvent system was methanol (B&J Brand, High Purity Solvent, Baxter Healthcare Corp., Muskegon, Mich.) and water (glass- distilled, reverse osmosis-treated Super-Q), whereas the second system was acetonitrile (B&J Brand, High Purity Solvent) and water. Whenever possible the methanol/water solvent system
196
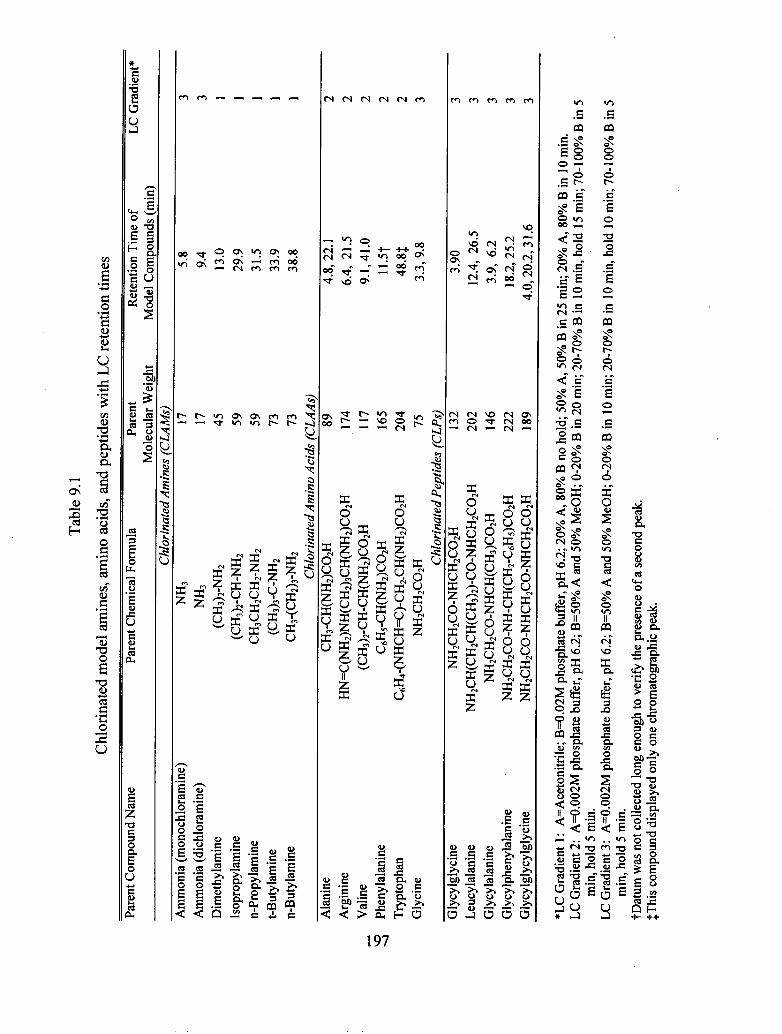
vo
Tabl
e 9.1
Ch
lorin
ated
mod
el a
min
es, a
min
o ac
ids,
and
pept
ides
with
LC
rete
ntio
n tim
esPa
rent
Com
poun
d Na
me
Pare
nt C
hem
ical F
orm
ula
Pare
ntM
olec
ular
Weig
htRe
tentio
n Ti
me
ofM
odel
Com
poun
ds (m
in)
LC G
radi
ent*
Chlo
rinat
ed A
min
es (C
LAM
s)Am
mon
ia (m
onoc
hlor
amin
e)Am
mon
ia (d
ichl
oram
ine)
Dim
ethyl
amin
eIso
prop
ylam
ine
n-Pr
opyl
amin
et-B
utyl
amin
en-
Buty
lamin
e
NH3
NH3
(CH
3)2-N
H2
(CH
3)2-C
H-NH
2CH
3CH
2CH
2-NH
2(C
H3)3-
C-NH
2CH
3-(CH
2)3-N
H2
17 17 45 59 59 73 73
5.8 9.4 13.0
29.9
31.5
33.9
38.8
3 3 1 1 1 1 1Ch
lorin
ated
Am
ino
Acid
s (C
LAAs
)Al
anin
eAr
gini
neVa
line
Phen
ylala
nine
Tryp
toph
anGl
ycin
e
CH3-C
H(NH
2)CO2
HHN
=C(N
H2)N
H(CH
2)3CH
(NH
2)C02
H(C
H3)2
-CH-
CH(N
H2)C
O2H
C6H5
-CH(
NH2)C
02H
C6H4
-(NHC
H=C)
-CH
2.CH(
NH2)C
O2H
NH2C
H2C
O2H
89 174
117
165
204 75
4.8,
22.1
6.4,
21.5
9.1,
41.0
ll.Sf
48.8
J3.3
, 9.8
2 2 2 2 2 3Ch
lorin
ated
Pep
tides
(CLP
s)Gl
ycyl
glyc
ine
Leuc
ylala
nine
Glyc
ylala
nine
Glyc
ylph
enyl
alani
neGl
ycyl
glyc
ylgl
ycin
e
NH2C
H2C
O-NH
CH2C
O2H
NH2C
H(CH
2CH(
CH3)2
)-CO-
NHCH
2CO
2HNH
2CH
2CO-
NHCH
(CH
3)C02
HN
H2C
H2C
O-NH
-CH(
CH2-C
6H5)C
02H
NH2C
H2C
O-NH
CH2C
O-NH
CH2C
02H
132
202
146
222
189
3.90
12.4,
26.5
3.9,
6.218
.2,2
5.2
4.0,
20.2
,31.
6
3 3 3 3 3
*LC
Grad
ient 1
: A=
Aceto
nitri
le; B
=0.0
2M p
hosp
hate
buffe
r, pH
6.2;
20%
A, 8
0% B
no
hold
; 50%
A, 5
0% B
in 2
5 m
in; 2
0% A
, 80%
B in
10 m
in.
LC G
radi
ent 2
: A
=0.0
02M
pho
spha
te bu
ffer,
pH 6
.2; B
=50%
A a
nd 5
0% M
eOH;
0-2
0% B
in 2
0 m
in; 2
0-70
% B
in 1
0 min
, hol
d 15
min
; 70-
100%
B in
5m
in, h
old
5 m
in.
LC G
radi
ent 3
: A=
0.00
2M p
hosp
hate
buffe
r, pH
6.2;
B=5
0% A
and
50%
MeO
H; 0
-20%
B in
10 m
in; 2
0-70
% B
in 1
0 min
, hol
d 10
min
; 70-
100%
B in
5m
in, h
old
5 m
in.
t Datu
m w
as n
ot co
llecte
d lo
ng en
ough
to v
erify
the p
rese
nce
of a
seco
nd p
eak.
JThi
s com
poun
d di
splay
ed o
nly
one
chro
mato
grap
hic p
eak.

was used instead of the acetonitrile/water system because of the negative health effects associated with acetonitrile.
LC Systems
Two LC systems were used during the methods development process (see Figure 9.1). (Table 9.1 shows the LC gradients used.) One LC was a Waters model 600 MS LC system (Milford, Mass.) equipped with a Waters 484 UV detector and a Waters U6K injector. The other system was a Dionex DX300 Advanced Gradient Pump (Sunnyvale, Calif.) equipped with a Kratos Spectroflow 783 UV detector (Manchester, England [no longer in business]) and a Rheodyne 9000 injector (Cotati, Calif). Data collection and processing for both LC systems were performed using a Nelson Analytical Xtrachrom chromatography data system (Perkin- Elmer, Norwalk, Conn.) or Perkin-Elmer Nelson Turbochrom version 4 software (Norwalk, Conn.). Both LC systems were evaluated as conventional and microbore LC systems with KI- UV and PB-MS. The operating conditions are summarized in Table 9.2. The conventional LC column (Alltech, Deerfield, 111.) was 4.6 mm ID x 250 mm with Econosil C18, 5-fj.m particles. An Alltech Versapak LC column with the same dimensions and specifications was also used and provided similar separations with approximately 40 percent reduction in LC pump pressure.
The Waters conventional LC was also operated as a capillary LC system after replacing the conventional flow parts with commercially-available capillary LC components (LC Packings, San Francisco, Calif). The conversion to a capillary system required replacing the conventional injector with a micro-injector capable of injection volumes down to 160 nL, replacing the conventional UV flow cell with a capillary flow cell (UZ-WA84, LC Packings), replacing the conventional column with a capillary packed column (12-inch [30.5-cm] length, 320-um ID, 5-um Ci 8 packing [FUS-30-05-Ci 8], LC Packings), and adding a mobile phase splitter (Acurate® IC-70, LC Packings). The narrow capillary LC peaks allowed for improved separation of compounds compared to conventional and microbore size columns. The capillary LC system operated with flow rates between 1 to 10 nL/min. The packed capillary column provided increased LC resolution (specification of 75,000 plates) and yielded LC peak widths on the order of 45 to 60 seconds wide.
198

Reag
ent
Wat
er
Enric
hmen
t Pu
mp
J 7HP
LC
Pum
p
J 7M
obile
Ph
ase
A5
mL
Sam
ple
Loop
Mob
ile
Phas
e B
Switc
hing
Va
lve
Anal
ytic
al
Colu
mn
Enric
hmen
t C
olum
n
Was
te
Teflo
n'O
pen
Tubu
lar
Reac
tor
UV D
etec
tor
at 3
53 n
m
Parti
cle
Beam
Inte
rface tt
Mas
s Sp
ectr
omet
eran
dC
ompu
ter
Data
Sys
tem
Vacu
um
Pum
ps
Split
Pum
p
Kl
Post
-Col
umn
Reag
ent
.Com
pute
r Da
ta S
yste
m
Was
te
Figu
re 9
.1 H
igh
perfo
rman
ce li
quid
chr
omat
ogra
phy
syste
m h
ardw
are
conf
igur
atio
n

Table 9.2
Comparison of conventional, microbore, and capillary LC
Column internal
diameter (mm. I.D.)
Flow rates (uL/min)
Injection volumes (uL)
System pressure (psi)
System pressure (kPa)Efficiency (plates/m)
LC peak width (min)
Conventional
>4.0
500-2000
5-300
800-1700
5500-11,70020K-40K
1-2
Microbore
2.1
100-400
5-250
1500-2500
10,000-170035K-70K
1-1.5
Microbore
1.0
10-50
5-50L
1700-2700
11,700-18,60050K-90K
1-1.5
Capillary
0.32
5-15
0.060-10
2000-3000
13,800-20,90090K-120K
0.75-1.0
Capillary
0.20
1-10
0.06-5
2000-3000
13,800-20,200>100K
0.75-1.0
For LC detection, a UV detector (Kratos or Waters) was considered first as an MS
surrogate for the development of the LC separation because it is inexpensive to operate, readily
available, and could be used easily by a utility or commercial laboratory in the future. Because
UV absorbance by the CLAAs and the CLAMs is poor and the non-chlorinated amino acids
absorb UV light in the same region as the CLAAs, the KI derivatization method of Yoon and
Jensen (1993 a; 1993b) was used to lower the detection limit approximately 100 fold (compared
to UV alone) and to distinguish the CLAAs from the parent compounds. KI derivatization and
UV absorption at 353 nm will only detect those by-products that are oxidizable, such as the
N-chloro compounds that contain an active chlorine atom. The LC-KI-UV system was used
either as an independent system or in conjunction with PB-MS (see Figure 9.2). A separate
postcolumn addition pump (Model 100A, Altex, Beckman Instruments, Fullerton, Calif.) was
used to feed the KI solution into a mixing tee, where it reacted with the N-chloro compounds in
the sample and facilitated the release of the iodine product. A reaction delay tube (0.8 mm ID,
10-ft [305-cm] length coiled Teflon® tubing) was attached between the mixing tee and the UV
detector. The reaction delay tube was used to allow sufficient time for the reaction to reach
completion prior to UV detection of the iodine product (X = 353 nm). This method is similar to
that of Jersey and Johnson (1992) that combined KI postcolumn derivatization with
200

to
Extra
con
nect
or to
redu
ce n
ebul
izer
'g
as v
olum
e at
leas
t tw
ofol
d
Neb
uliz
er
Mod
ifica
tion
1—'
Skim
mer
s _
Des
olva
tion
Cha
mbe
r
Cus
tom
ized
Nee
dle
Hel
ium
In
let
Neb
uliz
er
Figu
re 9
.2 P
artic
le b
eam
with
neb
uliz
er m
odifi
catio
n

electrochemical detection of the iodine product. For the current study, however, the inorganic Is"
reaction product was monitored on the LC-UV detector at A,=353 run.The CLAMs, CLAAs, and CLPs were used to evaluate the LC-KI-UV system. The
method was also applied to compare DBF formation from chloramination and chlorination of the parent peptides. Equal molar amounts of (1) chloramines and peptides and (2) chlorine and peptides were used. The chloramines were preformed at a Cla/N weight ratio of 5/1. Chloraminations of gylcylalanine and glycylphenylalanine were also monitored at pH 6 and 8. To assess the applicability of the test to natural waters, six chloraminated LAW samples from Task la were analyzed by LC-KI-UV.
The LC-PB-MS work utilized a VG model TS-250 medium-resolution MS (Manchester, England) equipped with a modified VG Line particle beam interface (Lieu and West 1993; modified further for this work). The MS was operated in the electron impact (El) mode, resolution 0.5K, scanning from a 45 to 650 mass-to-charge ratio (m/z) at a rate of 1.0 sec/scan. The PB-LC-MS interface provided a means to introduce LC eluant into the MS and to produce El mass spectra of the eluting compounds. El spectra provide structural information and can be compared with the National Institutes of Standards and Testing (MIST) library of 62,000 compounds. The PB interface consisted of a nebulizer, a heated desolvation chamber, a set of skimmer lenses, and a probe inlet (see Figure 9.2). The solvent must be removed from the LC eluant prior to ionization of the sample compounds in the MS source. Inefficient removal of the solvent results in poor mass transport through the PB interface. This poor mass transport leads to low recoveries and poor sensitivities. Further degradation of sensitivity and reduction of instrument operation time result from use of highly aqueous mobile phases and inorganic buffers.
The system used for the ESI-MS work was the VG Autospec-OATOF high-resolution magnetic sector MS (Manchester, England). Effluent from a microbore LC system was connected through the ESI interface to the MS. The mass assignment was calibrated using the instrument's hall probe. The instrument was set up to collect low resolution (1,000 resolution, 10 percent valley definition) ESI data with a single point photomultiplier detector, at a scan rate of 4 sec/decade, over a mass range between 75 and 1,000 m/z. The LC flow rate into the ESI
was set to 20 ul/min. The LC column was a Waters NOVA-PAK microbore Cig column (2 mm ID x 150 mm, 5-um particles). The mobile phase was 75 percent methanol, 25 percent water,
202

operated under isocratic conditions. Sample volumes of 50 jaL were used to flush and fill a 10
pL injector loop.
Concentration Systems
An on-line enrichment system similar to that of Jersey and Johnson (1992) was used (see
Figure 9.3 a and b). A 2- or 5-mL loop in the LC injector enabled concentration of the sample by
a factor of 100 or 250 times, respectively. To accommodate a larger sample volume, the sample
was pumped into the enrichment column instead of into the injector. Both configurations had the benefit of backflushing the enrichment column (Waters dg NOVA-PAK) as opposed to the more commonly used forward-flushing technique. Backflushing of the enrichment column focused the sample more effectively than the forward-flushing technique and produced narrower
LC peaks. A separate LC pump (Model 100A, Altex) was used to load the sample onto the enrichment column with a 100 percent water mobile phase. After the sample had been
completely loaded onto the enrichment column, a 6-port valve (7125, Rheodyne, Cotati, Calif.)
was switched to allow the mobile phase (water and acetonitrile, or water and methanol) from the LC pumps to backflush the enrichment column and to move the organic compounds to the analytical column, where the chromatographic separation took place.
Direct sample loading of 30 mL of sample onto the enrichment column with a sample addition pump could theoretically provide a 3,000-fold sample concentration factor. Reagent
water spiked with early eluting inorganic chloramines and with the mid-range eluting N-chlorophenylalanine at pH 4, 6, and 8 was used to investigate breakthrough and recovery. The effects of pH on enrichment loading efficiency were also investigated. Because the polarity of the model compounds is strongly affected by pH, it was thought that the enrichment efficiency possibly could be improved by optimizing the pH in an attempt to maximize enrichment column,
retention.In addition, an off-line solid phase extraction concentration method was explored to
provide a higher concentration factor and allow more flexibility in flow rates and type of elution solvent. Graphitized carbon (carbopak-B) was selected as the solid phase because of its similarity of trapping mode to the DOX method and because it can retain a wide range of
203

Load Mode
Figure 9.3a Enrichment system valve configuration, load mode (dashmarked injector 9000
position) and inject mode (position shown)
Switching Valve 7125
Analysis Mode
Figure 9.3b Enrichment system valve configuration, analysis mode
204

compounds without pH adjustment. The method of Di Corcia and Marchetti (1991) for pesticide analyses was utilized in this study as follows. Sample (2 to 4 L) was passed through the washed carbon (250 mg or 350 mg) column. The adsorbed organic compounds were first eluted with 1 mL of methanol followed by 6 mL of a methylene chloride/methanol (80/20 percent on a volume basis) solution for the base/neutral compounds and then 6 mL of a methylene chloride/methanol (60/40) solution basified with 0.016 mol/L of potassium hydroxide for the acidic fraction. The acidic-fraction eluant was acidifed with 0.2 percent trifluoroacetic acid (on a volume basis), and then both eluants were individually concentrated with gentle warming and a stream of nitrogen to 0.5 mL and 0.3 mL, respectively. The theoretical concentration factor for a 4-L sample was 8,000 for the base/neutral fraction and 13,000 for the acidic fraction.
The SPEB concentration technique was intended to be a sample preparation mode for the LC-UV-PB-MS system. Preliminary evaluation was made using UV detection at 205 nm without KI derivatization and, at times, in series with PB-MS. The N-chloro model compounds were not used for evaluation of the SPEB method because of their instability and lack of PB-MS response. Instead, (1) caffeine was used as a surrogate; (2) a synthetic sample containing phenylalanine, methyl glyoxal, decadienal, atrazine, pyruvic acid, and benzaldehyde was used to represent miscellaneous contaminant types; and (3) raw and chloraminated LHW (batch and pilot plant) and CSPW (pilot plant) samples were tested. The conditions for the batch-tested LHW were a Cb/N weight ratio of 3/1 and a pH of 8; and the pilot plant sample conditions were a Cb/N weight ratio of 3/1 and a pH of 6. The CSPW pilot plant sample conditions were a Cb/N weight ratio of 5/1 and a pH of 8.
Results and Discussion
Concentration Techniques
On-line enrichment. Enrichment columns can be used with LC to obtain trace-level
detection (|o.g/L range) of chloramine DBPs in water. The sample enrichment system works on the assumption that the compounds of interest do not move significantly along the enrichment column when loaded with 100 percent water. The compounds in the sample are trapped on the enrichment column as the water used to load the sample continues through the enrichment
205
column and into a waste container. The compounds will begin to migrate through the enrichment column as an organic solvent is introduced into the mobile phase. Based upon this assumption, the enrichment process has a focusing effect on the trapped compounds as they are removed with the introduction of an organic solvent. In practice, some compounds do move significantly along the enrichment column even when there is no organic solvent present in the mobile phase, especially when large amounts of water are used to load the sample. These compounds do not focus well and result in unacceptable recoveries. On-line concentration using either the 2-mL or 5-mL sample loop injector and a Cig enrichment column was acceptable. The recovery for chlorodimethylamine with the 2 mL loop was 112 percent compared to a direct
10-uL loop injection.
Experiments were also conducted to investigate whether larger sample volumes (up to 30 mL) could be used to increase the concentration factor when using the enrichment process. Evaluation of this enrichment system to ensure adequate concentration of the sample was necessary to increase the probability of detecting trace levels of chloramine DBFs using LC-KI- UV and LC-MS.
At pH 8, breakthrough occurred after 10 mL (10 min at a flow rate of 1 mL/min) for both the inorganic chloramines and N-chlorophenylalanine. At pH 4, the N-chlorophenylalanine behavior was similar to pH 8. At pH 6, N-chlorophenylalanine breakthrough occurred at a similar time but to a much lesser degree. These results indicated the need to look at another on- or off-line sample concentration technique with a higher concentration factor than possible with the 5-mL loop Cig on-line enrichment or the need to increase the LC-MS sensitivity.
Graphitized carbon solid phase extraction. The SPEB extracts were evaluated by LC- UV-PB-MS. Caffeine surrogate recoveries were approximately 50 percent based on UV response for the base/neutral extracts, and caffeine was detected with the PB-MS system. In the synthetic sample, phenylalanine and benzaldehyde were also detected by UV, but not by PB-MS. For the acidic extract of chloraminated LHW, no peaks of interest (i.e., not also in the blank) were observed, but a large column-bleed peak may have masked other peaks of interest. In the base/neutral fraction of the chloraminated LHW, the largest peak was caffeine; however, some small unidentified peaks were detected by UV but not by PB-MS. Further work with the SPEB was suspended for the duration of the project but may be pursued later in combination with a more sensitive ESI-MS system to be discussed later. Evaluation of the SPEB concentration
206

technique for chloramine DBFs concentration was inconclusive. From the work in this project,
the on-line concentration technique with an improved LC interface transport appears to be the
more promising combination.
LC System Modifications
LC gradient. Throughout the study, gradient LC techniques were used (see Table 9.1).
The LC mobile phases initially were 100 percent acetonitrile (mobile phase Al) and 100 percent 0.02 M phosphate buffer, pH 6.2 (mobile phase Bl), but they were changed to 50 percent
methanol/50 percent 0.002 M phosphate buffer, pH 6.2 (mobile phase B2), and 100 percent 0.002 M phosphate buffer, pH 6.2 (mobile phase A2). This ten-fold reduction in phosphate
concentration in the mobile phase provided improved LC separation and reduced the likelihood
of salt buildup in the PB-MS system. The sample was typically loaded onto the column with 100
percent buffer and programmed to 50 percent buffer, 50 percent solvent in two stages. The
specific programs are footnoted in Table 9.1.
PB-MS interface. The feasibility of using the LC-PB-MS technique to analyze for
chloramine DBFs and other previously unidentified DBPs was extensively evaluated. The use of
microbore and capillary LC columns improved PB performance by reducing the volume of solvent entering the PB interface. PB performance was improved because the mechanical pump
oil accumulated less solvent and was able to function more efficiently over a longer time period.
Mechanical pump oil was changed frequently as part of the normal PB maintenance.The PB nebulizer design must be able to accommodate high gas pressures without
introducing large volumes of gas into the source. Too much gas in the source will displace the
ion volume inside the source and prevent the sample from being ionized. Low nebulizer gas
pressures will not provide enough energy to form proper particle droplets or enough momentum
on the particles to pass through the skimmer lens. Optimization of gas pressure, gas volumes,
and LC flow rates was difficult to achieve and appeared to be highly dependent upon the
nebulizer design. No signal was obtained on the VG PB-MS with capillary LC flow rates. With
a modification to the PB, however, microbore flows were successfully coupled with the PB
interface. The modification consisted of adding a metallic insert to the nebulizer (see Figure 9.2
insert) to reduce the internal volume and channel the gas flow, thus permitting the use of higher
207

carrier gas pressures and velocity without significantly increasing the volume of carrier gas
going into the MS source. The higher carrier gas pressures provided additional kinetic energy
and velocity to the sample particles leaving the nebulizer orifice. This increased energy and
velocity compensated for the reduced flow of the microbore LC and helped the sample particles
travel across the skimmer region more effectively. The ability to accomplish this without
contributing additional carrier gas to the MS source was important. The metallic insert
modification and the use of the microbore column resulted in an increase in PB stability,
extended PB operation time, narrower, sharper peaks and an approximately two-fold increase in
sensitivity.
ESI-MS. When the PB results indicated possible loss of chlorine in the PB before entry
into the MS (see below) and UF data (to be discussed later) indicated the importance of higher
molecular-weight halogenated chloramine DBPs, ESI was investigated as the LC interface to the
MS. ESI is an emerging technique for LC-MS interfacing for many biomedical and
environmental applications, as indicated by the number of presentations on the topic at the 1995
American Society of MS conference in Atlanta, Georgia. ESI is superior to PB because it
provides much greater mass transfer through the ESI interface and yields greater sensitivity for
detecting compounds. Mass transfer through the ESI interface is enhanced because the sample is
ionized at atmospheric pressure. Once the compounds are charged, a lens with adjustable
potentials can be used to focus and guide the ions through the skimmer lens into the MS as the
remaining uncharged solvent is removed by the vacuum pumps. The optimal LC flow rate for
the VG ESI is between 10 to 40 uL/min (VG Analytical, Manchester, England).
The energies associated with ESI are much lower (i.e., softer) compared to the El
ionization energies associated with PB. This increases the likelihood of retaining the nitrogen-
chlorine bond during the ionization process. Results from an LC-ESI-MS experiment are
discussed in the model peptide section below.
LC Evaluation and Application
Model N-chloro organic compounds. The LC-KI-UV method was suitable for the
determination of inorganic mono- and dichloramine in drinking water (residuals in mg/L range)
without sample concentration. To determine the model N-chloro organic compounds at the
208
level, sample concentration was necessary. The LC conditions, however, were the same
regardless of concentration technique. The five model CLAMs could be detected at 50 |j,g/L
with the on-line enrichment column process and a 5-mL injection loop, post-column derivatization, and UV detection at 353 run.
Upon chlorination at a 1/1 molar Cla/N ratio, the amino acids tryptophan and phenylalanine each produced one LC/KI-UV peak within the time span monitored, whereas alanine, arginine, and valine produced two major peaks each (Table 9.1). CLAA peak responses were approximately ten times less than the peak responses for the CLAMs. This may be attributed, in part, to the formation of non-KI-reactive chlorine species in addition to the detectable chlorinated organic compounds. Using the more general PB-MS detector, under
excess chlorine conditions, spectra compatible with the corresponding aldehyde, nitrile, and N-chloroaldimine by-products were observed for valine, tryptophan and phenylalanine,
respectively. Conyers and Scully (1993) reported similar results for phenylalanine, and McCormick et al. (1993) reported similar results for valine. The detection limit (i.e., amount needed to obtain identifiable spectra), using the unmodified PB-MS, was approximately 50 to
100 ng for each amino acid with a 10 to 20 uL injection.
Mixtures of the model CLAMs produced LC responses comparable to separate injections of the individual compounds when injected within one hour of mixing. In contrast, mixtures of CLAAs and mixtures of CLPs (discussed below) produced LC chromatograms with peaks of different intensities. Furthermore, some new peaks were present that were not present for the individual CLAAs and CLPs. These results are consistent with those of Jersey (1991) and with a chlorine-exchange mechanism described by Isaac and Morris (1983a; 1983b) in which the more basic compounds have a greater tendency to bind the chlorine. The result of this competition in CLAA and CLP mixtures is the formation of unequal amounts of the chlorinated model compounds, with some peaks disappearing from the chromatogram. These results occurred when the compounds were combined either before or after chlorination. Similar chlorine transfer behavior was observed by Snyder and Margerum (1982) and by Yoon and Jensen (1993b).
Natural water samples. To evaluate the LC-KI-UV system as a screening method, six LAW samples (pH = 6, 8 and 10, Cb/N weight ratio = 3 and 7, ambient bromide, total chlorine residual = 2 mg/L) from the Task 1 batch chloramination experiments were analyzed using the
same LC conditions as for the CLPs (Table 9.1). Figure 9.4 shows the chromatograms for LAW
209

I 4 §
I 4 oii 3
<52S'l
0
as §I 3
I 4o
I 3
•« 2 v
Approximately 1.5 mg/L monochloramine and approximately 0.4 mg/L dichloramine
Products from the reaction of1.4 mg/L glycine and 1.3 mg/L chlorine
LAW chloraminated at pH 10, CI/N 7/1 total chlorine residual = 2 mg/L
LAW chloraminated at pH 8, CI/N 7/1 total chlorine residual = 2 mg/L
10 15 Time (min)
20 25 30
Figure 9.4 Chromatograms for LC-KI-UV analyses of LAW Task la samples and reference
solutions
210

tests at the 7/1 Ch/N weight ratio and pH 8 and 10, as well as a chloramine solution and a chlorinated glycine solution. The inorganic monochloramine peak and one or more small additional peaks were present in all LAW samples. A large dichloramine peak was observed in
the pH 6 samples and a small one in the pH 8 sample with the 7/1 C12/N weight ratio, as
expected. An early eluting peak present in all the LAW samples had a retention time similar to
that of the chlorination by-products of glycine, glycylalanine and glycylglycylglycine (Figure 9.4
and Table 9.1). The early eluting peak was largest (one-tenth to one-twentieth the area of the
inorganic monochloramine peak area) in the three 7/1 Cb/N weight ratio samples (pH 6, 8, and 10), with-the largest peak at pH 8. The peak area was approximately ten-fold less at the 3/1 Cb/N weight ratio. The baseline and chromatography of the LC-KI-UV method were not
impacted by the LAW matrix, and the technique appeared to be applicable to natural waters.Chlorination and chloramination of model peptides. The chromatographic retention
times exhibited by the by-products formed upon chloramination (5/1 Cb/N weight ratio) and chlorination of the model peptides using the LC-KI-UV system are given in Table 9.3. Equal
molar amounts of peptide and disinfectant were used. Chlorination of the peptide nitrogen is
reported to occur at the terminal amine nitrogen and not at the amide linkages (Pereira et al.
1973); therefore, for these calculations, each peptide molecule was considered to contain a single active nitrogen. Because the parent peptides do not react with the KI, no LC peaks were detected
for the unreacted peptides by this method. Free chlorine reacted with the peptides to form two, and in the case of glycylglycylglycine three, chlorinated by-products (as detected by LC-KI-UV). These compounds may be the mono and dichloro peptides (see ESI results below and Pereira et
al. 1973). Chloramination (5/1 Cb/N weight ratio, pH 6.2) of the peptides, however, yielded only one product. For glycylalanine and glycylglycylglycine, the chloramination DBF had a similar retention time to the earliest eluting compound as found after chlorination of the same peptide. The retention time of this early eluting peak was very close to that observed in the
chromatogram of the chlorinated glycine described above. For the leucylalanine and glycylphenylalanine, however, chloramination yielded different DBPs than chlorination.
Chlorination of glycylalanine rapidly yielded two products as shown in the
chromatogram (Figure 9.5D, peaks 1 and 2). Chloramination initially produced peak 1 (Figure
211

Table 9.3
Retention times for chlorination and chloramination
by-products of model peptides
Parent Peptide C12 DBF Chloramine DBP
Retention Time (min)* Retention Time (min)*
Leucylalanine 12.4,26.5 10.8
Glycylalanine 3.9,6.2 4.1
Glycylphenylalanine 18.2,25.2 15.1
Glycylglycylglycine 4.0,20.2,31.6 4.0
*LC gradient: 100% Solvent A; 0-20% solvent B in 10 min; 20-70% Solvent B in 10 min, hold
10 min; 70-100% solvent B in 5 min, hold 5 min.
Solvent A = 0.002 M phosphate buffer, pH 6.2.
Solvent B = 50% A and 50% methanol.
For comparison, the retention times for monochloramine and dichloramine are 5.4 and
9.9 min, respectively
9.5B) and inorganic mono- and dichloramine, and after 16 hours it showed the loss of the
monochloramine and the appearance of another very small peak between 6 and 7 minutes (Figure
9.5C). Peak 2 from the chlorine reaction had a slightly longer retention time than the second
product peak from the 16-hour chloramine reaction and, therefore, was assumed to be a different
compound. This experiment and another one with glycylphenylalanine showed that at pH 6.2,
the monochloramine rather than the dichloramine reacted with the peptides.
Task la data showed that pH strongly affects the DOX formation. Therefore,
chloramination of glycylalanine and glycylphenylalanine was studied at pH 6 and 8 by LC-KI-
UV. The chloramine DBFs detected had the same retention times at pH 8 as at pH 6; however,
the amounts formed were larger at pH 8. At pH 6, dichloramine was present but did not appear
to react. Because the total disinfectant residual was kept constant for both pH's, the reacting
monochloramine concentration was higher at pH 8 and may account for the difference in the
amount of DBPs formed. This relationship for the model peptides was consistent with the
212

9«f8I 7~ 6I5"to 4I 3
10 9
J7l g6
109
£8§7
IB« 4c _«3
1 09
£8I 7
1!f4is-2
1
.--_"-- ^
_1 I ^
-
^
-
'-^ V- v.
i I
.A
, , ,
--"
„-
-
I" , ,
v^.,,-..)
--•
—»•
J v**i , , . 1 . i°o ———— § ——
(D) Glycylalanine + chlorine (100 ppm)(several minutes)
^ __
. , ( , . , , i . , . . i , , , . i , , , ,
^ ————————————————————————— |
(C) Glycylalanine + chloramines(16-hr reaction time)
^
. , i . , . . i , , , . i . , , , i , , , ,
~~J
(B) Glycylalanine + chloramines (100 ppm)(1.5-min reaction time)
^iiltiiiliiiilfitilitfi
—^
(A) Monochloramine and dichloramine
V^> i i j . . i i i , i . i , , , , i , , , ,
10 15 20 25 3(Time (min)
Figure 9.5 Chromatograms for LC-KI-UV analyses of the chlorination and chloramination of glycylalanine (1/1 molar ratio, pH 6)
213

increased concentration of DOX formed in LAW at pH 8 versus pH 6 (at a 5/1 Cla/N weight
ratio) in the Task la batch studies (Figure 5.12).Identification of the chlorinated and chloraminated peptides by PB-MS was investigated.
Each of the model peptides was individually injected through the PB (no LC column) before and
after chlorination, and, in addition, glycylphenylalanine was studied after chloramination. The
mass spectra of the parent and chlorinated model peptide pairs were essentially the same for
reactions carried out under a 1/1 chlorine-to-peptide molar ratio. In order to verify that the
chlorination process with the peptides actually did occur, chlorine residual measurements and
LC-KI-UV injections were performed. In each case, the residual chlorine measurements
confirmed the absence of free chlorine. The LC-KI-UV injections of the chlorinated peptides
produced Kl-derived chromatographic peaks different from free chlorine, suggesting the
presence of N-chloro organic compounds. Under the operating conditions of the VG PB-MS (El
mode), however, the N-chloro mass spectra were not observed.
Identification of the chlorinated glycylalanine by-products by PB-MS was inconclusive.
Utilizing LC-ESI-MS for the analysis of the chlorinated glycylalanine, however, yielded two LC
chromatographic peaks (Figure 9.6) whose spectra (Figure 9.7) were consistent with sodium and
solvent adducts of the chlorinated glycylalanines: chloroglycylalanine at scan 76 and dichloro-
glycylalanine at scan 87. An interpretation of theses spectra appears in Tables 9.4 and 9.5,
respectively. Isotopic masses (181 and 183, 203 and 205, 221 and 222, 235 and 237, and 244
and 245 in Figure 9.7, scan 76) that were two mass units apart at an intensity ratio of 3:1 were
indicative of a compound containing one chlorine atom, and the masses matched those of
chloroglycylalanine (M) products. The isotopic cluster at 383, 385, and 387 m/z at an intensity
ratio of approximately 10:6:1, in addition, was consistent with the sodium adduct of the dimer
(2M). The compound at scan 87 produced mainly two chlorine-containing ions (i.e., those at
237, 255, 269 and 278 m/z) and a four chlorine cluster at 451 m/z (intensity ratios of
approximately 8:10:5:1 for 451:453:455:457 m/z) from the dimer. This spectrum was consistent
with dichloroglycylalanine. These results demonstrate the superior performance of ESI over PB
for coupling LC to MS for the analysis of this type of polar N-chloro DBF.
Microbore or capillary LC coupled with ESI to a high-resolution MS/MS system is the
recommended technique to further pursue chloramine DBP identification. An initial broadscreen
LC-ESI-MS analysis can provide preliminary halogen content and molecular weight information
214

Rel
ativ
e In
tens
ity (%
)R
elat
ive
Inte
nsity
(%)
Rel
ativ
e In
tens
ity (%
)
,2
o N> 3 ^
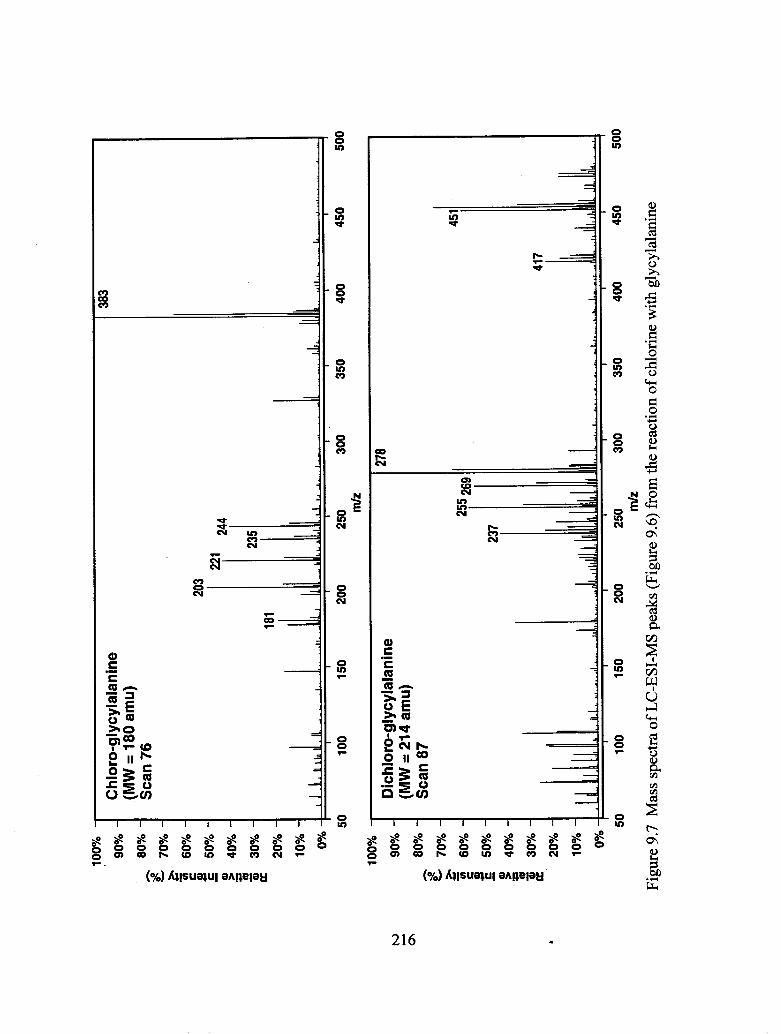
911
sa,
^ cn^ ° "
gCfli/i
0 -tp o •o
W _LC/a Ln HH g -
oa
1/3 o
t
>oOS 1°-S fQ5 N"
3f3 §-1ooi-b
& s-§. g
TO_ 0 '
O
£
§' i - CD ^^
cno .
Relative Intensity (%)
i i i i i i i i i
— w^o
L ——— 00 » 0
^J W ^
1 0) «<"
K*~> 0) OJ5'
p-
^~ w
S = — in• cS =. CO
r=— 10
-
p- ft=~—
"~
J,
BNcn
o o
s-
10o o
10S-
§.
CO§-
CO8-
g. o
so
S.
Relative Intensity (%)
i i i i i i i i i
- CD<SO§ ^f
r ^j II o
^afflox:|Sc SL *-* a>
3
(D
^ 00
i ro_ tn ro
S
.
-
E= ——————
8
r

Table 9.4
Electrospray mass spectrum interpretation for a reaction
product of chlorine with glycylalanine
(scan no. 76 in Figure 9.7, monochlorinated product, M)
m/z
181203221235244
383
Cluster
M + HM + Na
M + Na + H2OM + Na + MeOHM + Na + ACN
2M + Na
Number of Cl atoms
11111
2
ACN = acetonitrileM = chloroglycylalanine (180 Daltons)MeOH = methanol
Table 9.5
Electrospray mass spectrum interpretation
for a reaction product of chlorine with glycylalanine
(scan no. 87 in Figure 9.7, dichlorinated product, M')
m/z
237255269278
417451
Cluster
M'+NaM' + Na + H2O
M'+Na + MeOHM' + Na + ACN
2M' - Cl + H + Na2M'+Na
Number of Cl atoms
2222
34
ACN = acetonitrileM'= dichloroglycylalanine (214 Daltons)MeOH = methanol
217

for selection of possible DBFs for continued study. Subsequently, high-resolution MS and
MS/MS tests focused on a few peaks could be run to accurately determine the chemical composition and structure to aid in compound identification.
Conclusions
From these data, the following conclusions can be reached:
1. LC is a technique to separate polar N-chloro compounds.
2. Products formed by chloramination of peptides can be detected by postcolumn KJ dervatization with subsequent UV detection at 353 nm.
3. Chloramination of the small model peptides at pH 6 produced some but not all of the same Kl-reactive by-products formed by chlorination. Chloramination at pH
8 produced a higher concentration of the by-products than at pH 6 at a 1/1 molar Cb/peptide ratio. Analysis of a natural water appeared to indicate that
monochloramine, not dichloramine, reacted with small peptides to yield a KI-UV
detectable compound.
4. The PB-EI ionization MS system initially used for this study is not suitable for
determining the structure of N-chloro organic compounds because the chlorine is
often lost before detection.
5. The soft ionization technique of the ESI-MS system subsequently used for this study appears to be applicable to the LC-MS determination of polar N-chloro
compounds that are chloramination by-products.
This work provides guidelines for the continued study of chloramine by-products. An initial full-scan, low resolution LC-ESI-MS run can provide preliminary halogen-content and
molecular weight information. Subsequently, high resolution MS and MS-MS runs could focus
218

on several peaks of interest and accurately determine the chemical composition and structure for
DBF identification.
ANALYSIS OF DBFs BY SDE GC-MS
Overview
SDE was selected as part of the analytical scheme (1) because it selectively isolates
compounds of moderate volatility and polarity and (2) because of its high concentration factor
(theoretically 30,000 to 40,000 times). Determination of organic compounds at the ng/L to ug/L
concentration level has been reported by a number of researchers. The technique was originally
developed by Lickens and Nickerson (1964) for the analysis of hops in beverages. Researchers
have found that the SDE technique is an efficient method for the isolation of specific
compounds. Richard and Junk (1984) reported a high recovery for acidic, basic and neutral
compounds with the exception of acetic acid. Godefroot et al. (1982) reported a high recovery of
organochlorine pesticides and polychlorinated biphenyls at |ag/L levels. Onuska and Terry
(1985) found that the method was more efficient for the quantification of polychlorobenzene
isomers not only "time wise," but also by the simplicity of the method. During the extraction of
fatty acids from water, Janda and Pehal (1984) found that SDE gave recoveries close to 100
percent for €4 to Cn fatty acids. Those results agree with Richard and Junk (1984), in which
lower recoveries were only obtained for acetic and propionic acids. SDE provides good
recoveries for polar semivolatile organic compounds such as phenols and fatty acids, in addition
to offering some sample cleanup and salt removal. SDE in conjunction with GC-MS is well
suited to complement LC techniques and to help elucidate the low molecular-weight compounds
(i.e., < 0.5K daltons).
219

Analytical Methods
Sampling
Pilot-plant samples were incubated for 48 hours to simulate distribution system detention times, whereas utility full-scale samples were collected from locations with an approximate 48- hour detention time in the distribution system. Nonchloraminated control samples were also collected for each location. These controls were usually the source waters at the plant influent. Both samples were shipped iced by overnight delivery service to Metropolitan. No preservative or dechlorinating agent (except cooling to 4°C to minimize further DBF formation) was used. Samples were filtered through glass-fiber and 0.45-um pore-diameter nylon filters, and SDE analysis of the chloraminated sample was begun within 24 hours of receipt.
SDE
Four liters of the water sample and 50 mL of methylene chloride (E.M. Science, Gibbstown, N.J.) were simultaneously distilled from separate flasks (see Figure 9.8a). The steam and steam-distillable organic compounds generated from the water sample were mixed with the solvent vapors and extracted. Condensation and phase separation occurred along the water- cooled separation tube. The lower density liquid (water) returned to reservoir A, whereas the higher density methylene chloride—containing the extracted organic compounds—went to reservoir B. After three hours of continuous extraction, steam generation was stopped and the system was flushed with methylene chloride for another twenty minutes. Then the methylene chloride extract was collected, dried over anhydrous sodium sulfate, and further concentrated. The final concentration method used was the evaporative concentration system (Figure 9.8b) (Ibrahim and Suffet 1987a) followed by nitrogen blowdown to a final volume of 100 uL. The aqueous concentration factor for a 4 L sample concentrated to a final volume of 100 uL of methylene chloride is 40,000 times, presuming 100 percent efficiency.
1-Chloroalkanes were used as surrogates and internal standard (I.S.) compounds (Chem Services, Inc. West Chester, Pa.). 1-Chlorodecane (1 jag) was added to the water sample,
220

DryIce
Condenser
Mixing Chamber
Thermometer
Reservoir B (Water Sample)
Separation Chamber
Reservoir A (Solvent)
Heating Mantles
Figure 9.8a Simultaneous distillation extraction (SDE) apparatus
221

Recovery Condenser
Figure 9.8b Evaporative concentration system
222

1-chlorododecane (1 |^g) was added to the starting methylene chloride solvent prior to extraction,
and 1 -chlorooctane (1 jag) was added to the final concentrated methylene chloride extract prior to injection on the GC-MS.
Reagents, Blanks, and Controls
Methylene chloride was selected over pentane, hexane, diethyl ether, and Freon® as the extraction solvent. Because of its polarity, methylene chloride is better than pentane and hexane for extracting polar halogenated DBFs. It is less hazardous to reflux than diethyl ether and less environmentally damaging than Freon®. Methylene chloride is available with either cyclohexene or amylene as a preservative. Halogenated artifacts have been observed for both preservatives during extraction of samples with a free chlorine residual. With cyclohexene as the preservative, halogenated six-carbon cyclic compounds were found as artifacts following liquid-liquid extractions (LLE) of acidified brines (Campbell et al. 1987) and of chlorinated tap water (Dietrich et al. 1988). With amylene as the preservative, halogenated, non-cyclic, one-to-seven carbon compounds were found as artifacts (Fayad 1988). Cyclohexene was selected as the preservative because the artifacts from cyclohexene and chlorine were expected to be more easily distinguished from DBFs. Dechlorination of samples before SDE was not used because common dechlorinating reagents such as sulfur-reducing agents are known to degrade some DBFs (Croue and Reckhow 1989). Moreover, conversion of free chlorine residuals to chloramines by use of ammonium chloride addition minimized reactions to form such artifacts (Ibrahim et al. 1987b). Thus, extraction of chloraminated samples was believed to be manageable. A chloraminated water blank (pH = 8.4, monochloramine residual = 1.7 mg/L, total chlorine residual =1.9 mg/L) and source water (or a treated water sample before chloramination used as a control sample) for each test were analyzed to act as a blank and control, respectively.
GC-MS Analysis
The extracts were analyzed by GC-MS on either a Finnigan model 4023 quadrupole MS (Sunnyvale, Calif.) or a VG TS-250 magnetic sector MS. A 30-m, 0.25-mm ID DB-5 fused silica capillary column (J&W Scientific, Folsom, Calif.) was used with a temperature program
223

starting at 10°C (if cryogenic cooling was available) or 34°C, ramping initially to 70°C at 2°C/min, then to 150°C at 4 or 7°C/min, and finally to 250°C at 12°C/min, at which the GC was held for 10 min. The MS was scanned from 45 to 650 m/z at low resolution in the El mode at an electron energy of 70 eV. The scan rate was initially set at 0.6 sec/scan and was later changed to 1.0 sec/scan. Compounds were tentatively identified by comparison of their El MS spectra with the NIST library spectra or, in some cases, by manual spectra interpretation.
Samples Evaluated
The method was used to evaluate natural water samples covering a variety of matrices and treatment conditions. Samples representing five different water qualities—LAW, LHW, and CSPW (the three primary waters in Tasks 1 and 2); a Pacific Northwest water and a midsouth water (two waters from Task 3)—were selected. The midsouth water was tested because of its high bromide concentration (1.5 mg/L) and the Pacific Northwest water because of its low bromide and DOC. The general source water characteristics of these waters are given in Table 9.6.
The pilot-plant tests of Task 2 selected for the analysis of chloramine DBFs by SDE GC-MS included prechloramination followed by coagulation for each of the three primary waters. In addition, enhanced coagulation with postchloramination was monitored for the LHW pilot plant. The sampling was done in parallel with Task 2 runs, and the reference run numbers and sample dates are given in Table 9.6.
The SDE method was also used to evaluate drinking water from the full-scale distribution systems of three utilities utilizing chloramines as the final disinfectant (see Table 9.6). The midsouth water samples were collected with the Task 3 samples, whereas the Pacific Northwest water samples for SDE were collected from the same location as the Task 3 samples but were collected 13 days later. In addition, CSPW was sampled from the Henry J. Mills Filtration Plant. Furthermore, the latter three waters were fractionated by UF to determine the molecular weight distribution of the DOX and DOC, which is discussed in the UF section below.
Plant influent samples were also analyzed as controls. For the LHW pilot-plant analysis, the control sample was collected just prior to chloramination (i.e., after enhanced coagulation,
224

Tabl
e 9.
6 Sa
mpl
es fo
r SD
E an
alys
isPi
lot-P
lant
Sam
ples
C12/N
ratio
Disi
nfec
tion
scen
ario
*
Tota
l C12
resid
ual
(mg/
L)
PH Brom
ide
(mg/
L)
Trea
tmen
t con
ditio
ns*
Sam
ple
date
LHW
, Ru
n 1
3/1
Prec
hlor
a-m
inat
ion
2.6
7.5
0.05
Alu
mco
agul
atio
n
10/1
5/94
LHW
, R
un4A
3/1
Postc
hlor
a-m
inat
ion
2.6
7.8
0.05
Enha
nced
alu
mco
agul
atio
n
3/13
/95
LAW
, Ru
n 3
5/1
Prec
hlor
a-m
inat
ion
1.7 8.0
0.3*
*
Dire
ct fi
ltrat
ion
with
alu
m
11/1
4/94
CSPW
, Ru
n 1
5/1
Prec
hlor
am-
inat
ion
1.5 7.8
0.23
Alu
mco
agul
atio
n
9/28
/94
CSPW
, M
ills P
lant
Ef
fluen
t5/1
Prec
hlor
inat
ion,
posta
mm
onia
tion
1.6 8.3 0.13
FeCl
3co
agul
atio
n
5/10
/95
Full-
Scal
e Pl
ants
Paci
fic N
orth
wes
t W
ater
Dist
ribut
ion
Syste
m5/1
Prec
hlor
inat
ion,
posta
mm
onia
tion
1.2 6.8
0.00
7
Unfil
tered
5/30
/95
Mid
sout
h W
ater
D
istrib
utio
n Sy
ste
3.75
/1
Prec
hlor
a-m
i nat
ion
0.1 7.6 1.5 A
lum
coag
ulati
on
5/15
/95
* Se
e ch
apte
rs 7
and
8 fo
r mor
e de
taile
d di
scus
sions
of d
isinf
ectio
n sc
enar
ios a
nd tr
eatm
ent c
ondi
tions
.**
Bro
mid
e no
t mea
sure
d on
sam
ple
date;
val
ue ta
ken
from
pre
viou
s sa
mpl
ing
perio
d.
sedimentation and filtration). For the two waters in which chlorine and ammonia were added sequentially (i.e., at the Mills plant and in the Pacific Northwest water), SDE analysis of the chloraminated waters represented DBFs produced by the combination of chlorination and chloramination.
Results and Discussion
SDE combined with GC-MS was a very sensitive way to detect and identify the low levels of DBFs expected from chloramination of natural waters. The SDE method achieved a concentration factor of approximately 33,000 based on the recovery of surrogates, enabling GC- MS detection of chloramine DBFs at ng/L levels. More than 50 chemicals total were detected among the five varied chloraminated waters described above (Table 9.7). Although the
• chemicals detected in the Mills and Pacific Northwest samples may reflect the prechlorination, numerous chemicals in the other samples may be a result of chloramination. The most prevalent class of compounds detected consisted of the mixed halogenated THMs containing various combinations of iodine, chlorine, and bromine atoms. Dihalomethanes, halonitriles and other nitriles, and, possibly, small amounts of oxygenated organic compounds were also detected in the chloraminated waters.
Because quantitative standards were not run, these results are qualitative. Compounds detected in both the source and chloraminated waters were not included as possible chloramine DBPs unless they were present at significantly greater intensities in the chloraminated water (greater than two times the response in the corresponding source water or control). A representative chromatogram for the SDE analysis of a chloraminated water (midsouth water), along with its control (plant influent) and the chloraminated blank, is shown in Figure 9.9.
Bromide concentration was the parameter with the most direct impact on the type of DBPs formed in this limited test matrix (other parameters were not studied as in Task 1). Bromide levels ranged from less than 0.01 mg/L in the Pacific Northwest water to 1.5 mg/L in the midsouth water, greater than two orders of magnitude difference. The effect of source-water
226

Table 9.7 Results of SDE GC-MS analyses for DBFs
Possible DBFs*
NH2C1SDE
Blank
CSPW(Mills
Effluent)5/10/95
PacificCSPW Northwest Midsouth LHWRun 1 Dist. Syst. Dist. Syst. Run 4A
9/28/94 5/30/95 5/15/95 3/13/95
LHWRun 1
10/15/94
LAWRun 3
1 1/14/94Dihalomethams:
DibromomethaneBromoiodomethaneDiiodomethane
XXX
Trihalomethanes:Chloroform! XBromodichloromethaneDibromochloromethaneDichloroiodomethaneBromoformBromochloroiodomethaneDibromoiodomethaneChlorodiiodomethanelodoform (triiodomethane)
XXXXXXX
X XX XXX
XXX
XXXXXXXXX
XXXX
XXXX
X
XXXX
XXX
Halonitriles and Other Nitriles:
ChloroacetonitrileDichloroacetonitrileBromochloroacetonitrileBenzonitrilePhenylacetonirrile
XX X
XX
XXX
Other Nitrogen-Containing CompoundsChloropicrin
Halo-Oxy Compounds:Chloroacetic acid + vinyl
chlorideDichloropropanone X
Other Halo Compounds:1,1,1 -TrichloroethaneCarbon tetrachloride1,1,1,2-Tetrachloro-2,2-difluoroethane1,1,2-TrichloroethaneTetrachloroetheneTrichloropropene
227
(continues)

Table 9.7 (continued)
CSPWNH2C1 (Mills SDE Effluent)
PacificCSPW Northwest Midsouth LHW Run 1 Dist. Syst. Dist. Syst. Run 4A
LHW LAW Run 1 Run 3
Possible DBPs* Blank 5/10/95 9/28/94 5/30/95 5/15/95 3/13/95 10/15/94 11/14/94Other Halo Compounds (cont.)
Hexachlorohexadiene X XHexachlorocyclopentadieneBi-(hexachloropentadiene) X XUnknown (halogenated) X
Other Oxy-Compounds:Ethyl acetateMethylbutanal2,3-Dihydro-4-methyl furanToluenef X XXMethylcyclopentanone X4-Hydroxy-4-methoxy- X X
pentanonef
XX
XXXX
XX X
Methylcyclopentene-1-one XBenzaldehydef X X X XPhenolf XX X
X X X XX X
n-Nonanal X
Other Compounds :%Unknown XDimethylheptaneXylene X XXylene (different isomer) XUnknowns (hydrocarbon) XUnknown X X
XXX X
XX
X
Esters:Phosphoric acid, trioctyl ester X(Methyl phenyl) ethylhexylester X
propionic acidHexanedioic acid, dioctyl ester X
Dist. Syst. = Distribution System"These compounds—denoted by an "X"— were found in the samples at more than twice the concentrations found in
the blanks and controls and, thus, may represent DBPs of the disinfection scenario employed. tAlso detected in the blank or control at lower levels. $"Unknown" denotes the presence of a potential DBP compound; however, the identification was not obtained at the
time of this report. Chemical functionality present in the unknown compound is specified inside parentheseswhenever possible.
228
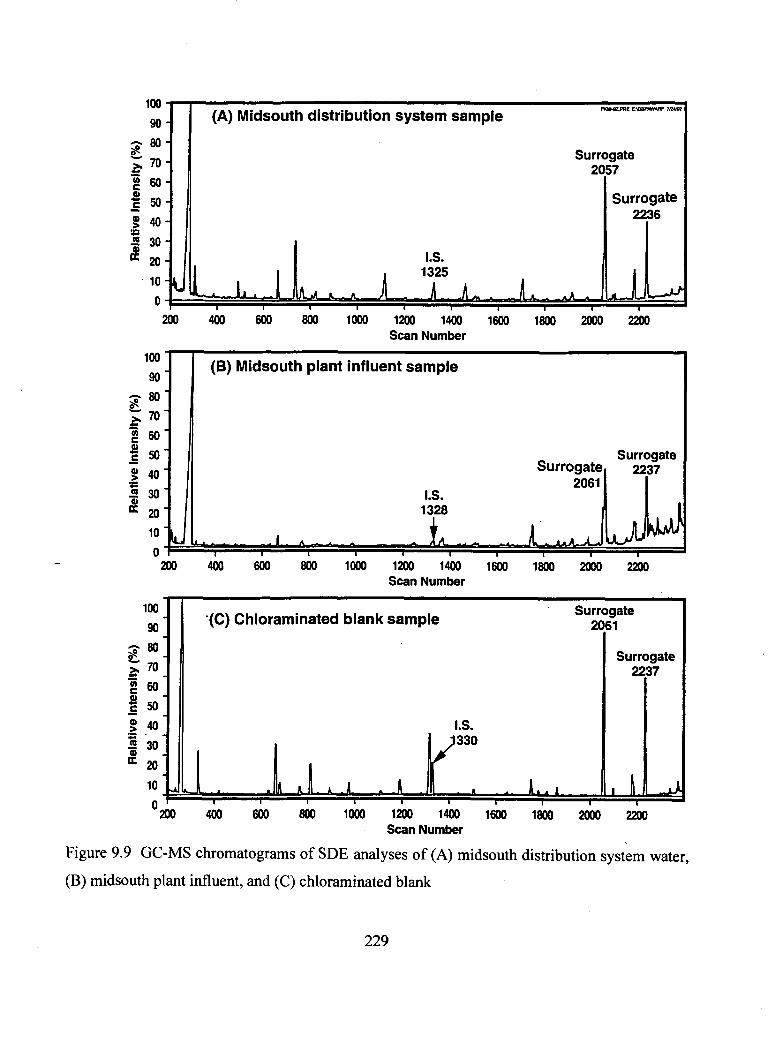
90-^80-£70-
1 60-| 50-
§ *l\ 40 -+32 30-= 20-
10-o-
(A) Midsouth distribution system sample R-M^™-.-"*.
Surrogate1 2057
J I.S., 1325
JU_« « Jl ^ A* I*. ,,>__
Surrogate2236
J200 400 600 800 1000 1200 1400 1600 1800 2000 2200
Scan Number100" 90"
1 60".g .
4) An ~ 5 40*s" 30K 20'
10"
01
(B) Midsouth plant influent sample
Surrogate Surrogate, 2237
2061I.S.
1328 J
U ..... 1 ... . L ....... L.jujuJhuM
\KW
200 400 600 800 1000 1200 1400 1600 1800 2000 2200Scan Number
100 90
-7- 80
S" ^i 60 -1 50§ 40« 30
* 2010"
0^ ,
200
'(C) Chloraminated blank sample "^o&f &
I.S.I ^330l>
I 1.flu J A J . J III . . 1.. •
Surrogate2237
. L wJ400 600 800 1000 1200 1400 1600 1800 2000 2200
Scan Number
Figure 9.9 GC-MS chromatograms of SDE analyses of (A) midsouth distribution system water, (B) midsouth plant influent, and (C) chloraminated blank
229

bromide (and iodide) content on THM speciation in the seven SDE samples is shown in Table 9.8 and is an extension of reported bromide effects on the four bromo-, chloro-, and mixed bromochloro-THMs (Symons et al. 1993). The waters are listed from left to right in order of increasing bromide concentration of the source water in Table 9.8. The low-bromide Pacific Northwest sample contained only chloroform and bromodichloromethane, whereas the bromo- and iodo- species predominated in the high bromide midsouth sample including the fully iodinated THM iodoform. SDE recoveries of-68 percent for diiodomethane and -56 percent for iodoform have been reported (Bruchet et al. 1995). Five of the nine chloro-, bromo-, and iodo- THMs found contained iodine; and at least one iodo-THM was found in all samples except the Pacific Northwest sample, indicating the presence of iodide in most of the samples.
The bromide in source waters typically comes from seawater—either recent intrusion or from ancient (connate) seawater—which in current geologic time contains about 67 mg/L bromide and 0.060 mg/L iodide (Spotte 1979). (Industrial and oil field brines are another source of bromide.) In times of drought and high seawater intrusion, CSPW at the Mills plant has had bromide levels as high as 0.5 mg/L and, thus, most likely an iodide concentration of 0.005 mg/L. In this study, a number of iodinated DBFs that may cause a medicinal taste and odor were identified. For iodoform the odor threshold level is 20 ng/L (Bruchet et al. 1989) and the taste threshold concentration is 5 |ig/L (Hansson et al. 1987). Previous research has shown that iodine incorporation during chloramination is different than that observed for bromide incorporation during chlorination (Hansson et al. 1987). The SDE data also show that the sum of the four bromo-, chloro-, and mixed bromochloro-THMs does not always equal the true total THMs.
In addition to the THMs, the SDE method recovered other halogenated organic compounds. The dihalomethanes dibromomethane, bromoiodomethane and diiodomethane were found in the midsouth water sample. The historical data for this utility (Table 8.3) showed the
presence of dibromomethane (up to 15 ng/L) and bromochloromethane (up to 3 |ig/L), but the
two iodinated compounds were not analyzed for. Carbon tetrachloride was detected in the Pacific Northwest water and LAW, but additional research is required to assess the significance (or lack of) for this compound. A number of other chlorinated alkanes were detected in both
230

Table 9.8 Effect of bromide (and iodide) on THM speciation
Parameter
Sample
Pacific LHW LHW CSPWNorthwest Run 4A Run 1 (MillsDist. Syst. 3/13/95 10/15/94 Effluent)
5/30/95 5/10/94
CSPW LAW MidsouthRun 1 Run 3 Dist. Syst.
9/28/94 11/14/94 5/15/95
Bromide (mg/L) 0.01 0.05 0.05 0.13 0.23 0.30 1.5
Trihalomethanes
Chloroform + + +
Bromodichloromethane + + +
Dibromochloromethane + +
Dichloroiodomethane + +
Bromochloriodomethane +Chlorodiiodomethane -
Dibromoiodomethane -
Bromoform -
Triiodomethane -
Dist. Syst. = Distribution System
+ = found
- = not found
+ + +
+ + + +
+ + + +
+ + + +
+ + + +
4- + + +
+ + + +
+ +
+
source and chloraminated waters and were therefore not considered DBFs. A group of four- and six-chlorine, cyclic and noncyclic, five- and six- carbon dienes were found in the Mills plant
effluent.Organic compounds containing different nitrogen-containing functional groups were also
recovered by SDE. These included the nitro compound chloropicrin, nitriles ranging from
231
chloroacetonitrile to benzonitrile, and the amide N,N-dibutylformamide. Dichloroacetonitrile has been found to be produced during chloramination (Young et al. 1995). The amide in this case was not a DBF (present in raw and treated waters), but its presence showed that this type of compound is recoverable by SDE. Phenylacetonitrile can be formed by the chlorination of the amino acid phenylalanine (Conyers and Scully 1993) and was only detected in the prechlorinated Mills plant effluent.
Oxygenated organic compounds such as aldehydes and ketones are common ozone DBFs (Weinberg et al. 1993). Small amounts of n-nonanal, benzaldehyde, methybutanal, and ethyl acetate, however, were detected in chloraminated waters that were not ozonated. The aldehydes may be DBFs from the reaction of chlorine or chloramines with amino acids (Bruchet et al. 1992;Hrudeyetal. 1988).
In recent years, the SDE technique has mainly been used in drinking-water applications to study taste- and odor-causing compounds in raw water and in ozonated water (Mallevialle et al. 1985). It has not previously been employed in the study of chloramine DBFs. The SDE concentration procedure provided the sensitivity necessary for GC-MS identification of a wide class of compounds at ng/L to ug/L levels. The reaction of the chloramine residual with organic matter in the samples and with solvent components during the heated SDE, however, is of continuing concern.
A number of compounds found in the chloraminated waters (including the chloraminated blank) in this study were not reported as chloramine DBFs. Because this study was only qualitative, compounds that were found in both source and chloraminated waters were generally not reported. Halogenated six-carbon, cyclic compounds (such as chlorocyclohexene—scan #661, cyclohexane—#811, and dichlorocyclohexane isomers—#974 and #1317) were detected only in chloraminated waters (see Figure 9.9C), but they were not reported as chloramine DBFs. These compounds were suspected to be products of the reaction of chloramines with the cyclohexene preservative in the methylene chloride. In fact, the wide range in relative signal responses for the halogenated, six-carbon, cyclic compounds as a function of water sources suggested the presence of matrix or disinfectant residual effects. These results suggest that if halogenated, six-carbon, cyclic compounds are expected to be natural chloramine DBFs for a particular water, another solvent preservative in place of cyclohexene should be used.
232

Conclusions
The SDE technique combined with GC-MS was successfully adapted to detect low level
chloramine DBFs. This concentration procedure provided the sensitivity needed for GC-MS
identification of a wide class of by-products at ng/L to low ug/L levels that would be expected
from chloramination. These compounds constituted the low molecular weight, volatile and
semivolatile compounds that are within the range of applicability of conventional GC-MS
(probably through a molecular weight of 650 daltons). The SDE GC-MS method (1) was
applicable to study a variety of water qualities, including samples after different chloramination
treatments, as exhibited by Task 2 pilot-plant and Task 3 full-scale samples and (2) showed the
influence of source water quality on DBF formation, especially the effect of bromide and iodide.
UF DETERMINATION OF AMW DISTRIBUTIONS
Overview
The UF technique has been used to characterize natural organic matter (NOM) in source
and treated waters, focusing on the molecular size/weight distribution of the organic compounds.
UF is used to fractionate a water sample based on the matrix components' molecular sizes, which
are approximately equal to their molecular weights. (For the rest of this report, the term apparent
molecular weight (AMW) will refer to the unit of size separation achieved by UF.) Analysis of
the fractions obtained produces an AMW profile or fingerprint. The evaluation of the UF
technique was undertaken as a screening procedure to aid in the selection of analytical
techniques for identification of specific DBFs and to describe changes in the AMW caused by
chloramination. UF can also be used as a concentration and isolation technique for MS and other
analytical methods. DOX was used as a surrogate for halogenated DBFs. The fingerprints
obtained from source waters (based on the DOC distributions) were compared to the ones
obtained from the corresponding chloraminated waters. Comparisons between representative
waters from different origins or different treatment conditions or both were made. UF
fractionation was used to characterize the NOM, to monitor changes occurring during treatment,
233

and to attempt to relate these changes to the production of DOX, as well as identified DBFs. Moreover, chloraminated water was fractionated by UF in order to determine the AMW
distribution of the halogenated DBFs.
Analytical Methods
UF Fractionation
Membranes of different molecular weight cutoff (MWC) were used. For a particular
membrane with a predefined MWC, the water sample was fractionated, resulting in two separate fractions. The water that was collected after passing through the membrane (permeate) should contain compounds with lower molecular weight than the nominal MWC, and the water remaining in the reservoir (retentate) should contain compounds with higher molecular weight than the MWC used. In this study, a direct filtration (also called parallel filtration) procedure was used. It consisted of a group of discrete filtrations where a separate aliquot of the
unfractionated sample was passed through each of the membranes.
A stirred UF cell (Amicon Model 2000M, Beverly, Mass.) was used. The UF apparatus
included a 2,000 mL pressurized reservoir. The nitrogen pressure was maintained at 50 to 55 psi
(3.5 to 3.9 kg/cm2) during the whole experiment. The water in the unit was stirred at a constant
rate to reduce concentration polarization. Cellulose acetate (YC) and regenerated cellulose (YM) UF membranes were used. These membranes are considered to be hydrophilic. Four MWCs
were selected for this study: 10,000 (i.e., 10K) (membrane YM10), 3,000 (membrane YM3), 1,000 (membrane YM1), and 500 (i.e., 0.5K) (membrane YC05) daltons.
The unfractionated sample was first filtered through a 0.45 um membrane to remove
particulates and colloids and then was fed to the UF cell. The permeate and retentate were both collected for analysis so that the mass balance for the DOC, UV-254, and DOX concentrations
could be calculated. For an initial sample volume of one liter, the filtration was stopped after
800 mL of permeate (P) was collected. To avoid a dilution effect from the rinse water, the first
100 mL of the permeate was discarded. The 200 mL of retentate (R) remaining in the reservoir
was then collected and combined with an equal volume of deionized water that was used to rinse
234

the reservoir. The permeates and the retentates were analyzed for DOC, DOX and/or UV-254, and these results were used to calculate the mass balance and AMW distribution. The permeate concentrations for the individual fractions were normalized to the concentration of the unfractionated sample based on the mass balance (recovery) before calculation of the AMW distribution. A sample calculation is given in Appendix A. Selected permeates were also analyzed for targeted DBFs.
Surrogate Parameters
Surrogate parameters were used to determine the general characteristics of samples and to provide a means of comparison between samples. Surrogate parameters used in this study were DOC, UV-254, and DOX. These parameters are used as a measure of organic precursors in source water (i.e., DOC and UV-254) or as a measure of DBF formation in treated water (i.e., DOX).
TOC/DOC. TOC is a measure of the total organic carbon in the sample, whereas DOC is the fraction of the TOC that passes through a 0.45-um pore diameter filter. The DOC/TOC is frequently used as a surrogate parameter for DBF precursors (Owen et al. 1993). In this study, all water samples were filtered through 0.45-um pore diameter filters, so the measurements represent DOC values. A Dohrmann DC-180 organic carbon analyzer (Santa Clara, Calif.) was used in this study following the UV-persulfate oxidation standard method 5310C (Standard Methods; APHA et al. 1992).
UV-254. UV-254 provides a measure of the degree of unsaturation/aromaticity of the NOM in the water sample. A Perkin Elmer Lambda 5 UV/VIS spectrophotometer (Norwalk, Conn.) was used following the draft standard method 5910 (USEPA 1994a).
DOX. DOX provides a measure of the total amount of chlorinated, brominated, and iodinated organic compounds that are present in a water sample. A Mitsubishi MCI DOX-10 analyzer (Cosa Instrument Co., Norwood, N.J.) was used following the adsorption-pyrolysis- titrimetric steps (USEPA 1986).
SUVA. The specific UV absorbance (SUVA) was also used to interpret the data. SUVA is defined as UV-254 expressed as absorbance per meter (i.e., m" 1 ) (normally reported in cm" 1 ) divided by the DOC concentration in mg/L; thus, the unit is expressed as (m'^mg/L) or
235

L/(m-mg). Details and guidelines for the evaluation of SUVA can be found in Edzwald and Van
Benschoten (1990). Typically, SUVA at <3 m"V(mg/L) contains largely nonhumic material, whereas SUVA in the range of 4 to 5 m"'/(mg/L) contains mainly humic material.
DBFs
In addition to these general surrogate parameters, specific target DBFs were measured
(for selected samples): neutral-extractable DBFs, HAAs, CNC1 and CNBr (see Chapter 4 for HAA and CNX methods). The neutral-extractable DBFs include the THMs, haloacetonitriles
(HANs), chloropicrin, 1,1-dichloropropanone, and 1,1,1-trichloro-propanone, and they were
determined using a pentane liquid-liquid extraction GC-ECD method that is a modification of
USEPA method 501.2 (Koch et al. 1989).
Experimental Plan
Overview
The UF experimental plan consisted of three major parts: UF method development and validation, UF analysis of bench-scale disinfection scenario studies, and UF analysis of full-scale
studies of diverse waters that paralleled some of the work done in Tasks 1, 2, and 3 of this project. The bench-scale experiments included comparisons of chlorine and chloramination
disinfection, as well as a total of three diverse chloramination conditions. Table 9.9 presents a
complete list of the UF experiments performed.
Method Development, Validation, and QA/QC
Part of the study consisted of the development and optimization of the UF technique for DOX fractionation in chloraminated water, as well as confirmation of DOC and UV-254 fractionation. A series of quality assurance/quality control (QA/QC) experiments were done to
determine interference or contamination, reproducibility, and membrane rejection.
236

Table 9.9
List of UF experiments
Description Surrogate Parameters and DBF Analyses
OtherAnalyses
OPWOPW—SDS A*OPW—Chloraminest
Chlorine/Chloramine Bench-Scale Study CSPW— Chloraminest CSPW—Chlorine§
Chloramine Bench-Scale Study LHWLHW—SDS B** LHW—SDS A*
Pilot-Plant StudyLHW Effluent—run #4A LHW Filter Effluent—run #4A
(influent to chloramination)
Mills-Full-Scale Study CSPW Effluent CSPW Influent
Midsouth Water Effluent Influent
Pacific Northwest Water Effluent Influent
TOC, UVTOC, UV, TOX, THM, HAATOC, UV, TOX, THM, HAA SDE
TOC, UV, TOX, DBPJ, HAA, CNX TOC, UV, TOX, DBF, HAA, CNX
TOC, UVTOC, UV, TOX, DBP, HAATOC, UV, TOX, DBP, HAA
TOC, UV, TOX, DBP, HAA SDE TOC, UV SDE
TOC, UV, TOX, DBP, HAA SDE TOC, UV SDE
TOC, UV, TOX, DBP, HAA SDE TOC, UV SDE
TOC, UV, TOX, DBP, HAA SDE TOC, UV SDE
OPW = organic-pure water.*SDS A = chloramination at pH 6, C12/N =5/1, and 48-hr residual = 4 mg/L. fChloramination at pH 8, C12/N = 5/1, and 48-hr residual = 2 mg/L. JDBP = neutral-extractable DBFs. §Chlorination at pH 8 and 48-hr residual = 2 mg/L.**SDS B = chloramination at pH 8, C12/N = 7/1, and 48-hr residual = 4 mg/L.
237

Method blanks. A laboratory reagent water, with and without chloramines and with and without dechloramination, was studied. First, 4 L of organic pure water (OPW) (Milli-Q UVplus, Waters Assoc., Milford, Mass.) was fractionated through the four membranes, and the resulting permeates and retentates were analyzed for DOC and UV-254. (OPW is a low DOC water with <0.2 mg/L DOC.) Second, 6 L of OPW was chloraminated using the following SDS conditions: pH 6, 5/1 Cla/N weight ratio, and nominal 4 mg/L (actual 5 mg/L) total residual chlorine. These conditions were selected because they were the conditions used in the UF bench-scale experiments. After a 48-hour incubation time, the sample was dechloraminated with 1.2 mL of 5 percent sodium sulfite solution and UF fractionated. Each UF fraction was then analyzed for DOC, UV-254, DOX, THMs and HAAs. The third blank was OPW that was SDS chloraminated (pH 8, 5/1 Ch/N, and 2 mg/L total chlorine residual) but not dechloraminated before UF to parallel the UF full-scale studies.
Reproducibility. To evaluate the reproducibility of the entire UF process, three UF experiments were performed in duplicate: CSPW source water, chloraminated water, and chlorinated water. The CSPW was chloraminated at a 5/1 Cb/N weight ratio. Both the chloramination and chlorination were performed at pH 8 and were dosed to achieve total chlorine and free chlorine residuals of approximately 2 mg/L at the end of 48 hours. The permeates and retentates from the duplicate runs of the source, chloraminated and chlorinated waters were analyzed for DOC and UV-254, resulting in six pairs of DOC and six pairs of UV-254 measurements for each membrane. The permeates and retentates from the duplicate runs of the chloraminated and chlorinated waters were also analyzed for DOX. To evaluate the precision of the DOX measurements on UF-fractionated samples as well as to evaluate the reproducibility of the UF method, the permeates from the duplicate chloraminated water UF runs were sampled twice for DOX analysis. This produced a total of eight pairs (i.e., two UF runs for four membranes each).
Evaluation of membrane rejection. As mentioned above, a permeate sample was collected and aliquots were taken for the various analyses. This approach does not take into consideration membrane rejection of compounds with a lower molecular weight than the MWC (i.e., the non-ideality of UF). Determination of the coefficient of permeation (or correction factor) for each individual membrane used makes possible a more accurate determination of the
238
permeate concentration. For the Mills plant (CSPW) influent and effluent samples, a model developed by Logan and Jiang (1990) was used to determine the permeation coefficients for the surrogate parameters evaluated in this study (DOC, DOX, and UV-254). During the Mills plant testing, the 800 mL of permeate was collected as a series of successive 200 mL fractions, and the TOC, UV and DOX were measured for each individual fraction. Results were processed using the mathematical model developed by Logan and Jiang (1990). The permeation coefficient (p) is equal to one plus the slope of a linear plot of In Cp versus In F, where F is the fractional reduction in retentate volume at time t and Cp is the measured permeate concentration at time t.
To further evaluate the membrane rejection, LHW was fractionated and 500 mL of permeate was refiltered through the same membrane, thus producing a second permeate of 300 mL and a second retentate of 200 mL. Permeate and retentate from the first fractionation, as well as permeate and retentate from the second fractionation, were analyzed for DOC and UV-254.
Applications of UF Fractionation
Comparison of disinfection scenarios. Many utilities have switched from chlorine to chloramines as an alternative disinfectant totally or at least within the distribution system in order to reduce DBF formation. To look at the effect such a change might have on AMW distribution of the halogenated DBFs (e.g., DOX), CSPW was chloraminated and chlorinated under SDS conditions. A 40-L batch sample of CSPW source water was collected so that all three experiments could be compared. These samples were also used in the reproducibility study discussed above. Ten liters of the sample was chloraminated and another ten liters was chlorinated using the SDS conditions given in the reproducibility study (see above). In addition to DOX measurements, unfractionated chlorinated and chloraminated samples and permeates from the 0.5K dalton membranes were analyzed for neutral-extractable DBFs, HAAs, and CNXs as these specific DBFs all have molecular weights below 500 daltons.
The objective of this experiment was to compare the effect of two different disinfection scenarios (chloramination versus chlorination) on the production of DOX (and by inference halogenated DBFs) and on the molecular weight distribution of the organic matrix. All data presented for these three sets of experiments were based on averages obtained from the duplicate
239
runs or, in the case of the DOX formed during chloramination, on averages of four values (duplicate DOX analyses of duplicate UF runs). As mentioned in the methods section, the results were also normalized based on mass balance before calculation of the AMW distribution.
The next disinfection scenario study focused on the organic matrix changes on LHW for two very different chloramination conditions. The conditions were selected because they produced the highest amounts of DOX in the Task la LHW batch studies. Enough LHW for the three UF experiments was collected on January 26, 1995. This sample was submitted to a complete set of experiments that included:
1. UF fractionation of the source water2. Chloramination of the sample using two different SDS conditions:
Parameter Condition A Condition B
pH 68Cla/N weight ratio 5/1 7/1Total C12 Residual(mg/L) 4 4
In each case, the source water sample and the fractions were analyzed for DOC and UV- 254, and the chloraminated samples were analyzed for DOC, UV-254, and DOX. In addition, neutral-extractable DBF and HAA analyses were performed on the chloraminated samples before fractionation and on the <0.5K dalton fractions (permeate and retentate).
Study of geographically diverse waters. Chloraminated samples and non-chloraminated controls from four diverse waters were fractionated by UF and evaluated for DOC, UV-254, DOX, neutral-extractable DBFs, and HAAs. In addition, the samples were analyzed by SDE GC-MS, as discussed earlier in this chapter. Samples were shipped by next day air freight and kept refrigerated until the time of analysis.
The LHW was evaluated at pilot-scale operating under conditions described for Task 2, LHW run 4A (Table 7.15), which represented enhanced coagulation and postchloramination treatment conditions being considered for the proposed Disinfectants/DBF Rule. A set of filter
240

effluent samples before and after chloramination was collected on March 13, 1995, with coagulated/settled water acting as the control sample.
CSPW as currently treated in a full-scale plant (i.e., Mills plant) to meet current regulations was sampled. The water was treated with prechlorination, ferric chloride coagulation (to remove turbidity and not DOC), dual media filtration, and postammoniation. Plant influent and effluent samples were collected for UF.
A source water sample and a distribution sample from the Pacific Northwest water system described in Chapter 8 were collected and shipped on May 30, 1995. They were collected at the same locations as the waters reported in Task 3, Table 8.12 but were sampled 14 days later.
The midsouth location with a high bromide level studied in Task 3, Chapter 8, was also studied by UF. The plant influent and distribution system (representing a 48-hour detention time after chloramination) were sampled on May 15, 1995, concurrently with the Task 3 samples. Table 8.2 describes this.
Method Development
Method Blank Study
For the three types of blanks (OPW, chloraminated OPW, and chloraminated OPW which was dechloraminated), analyses of the fractions obtained by UF fractionation indicated that there was no significant (<0.2 mg/L) contribution of TOC from the membranes or the equipment. All DOC, UV-254, DOX, and THM results were near or below the detection limits of the methods. This confirmed that no contamination or possible reaction of chloramines with the membranes to form THMs or DBFs as measured by surrogate parameters was occurring. Thus, no interferences from the equipment or the membranes created a problem for the study.
Reproducibility
The results obtained from the duplicate runs of chloraminated and chlorinated CSPW were compiled in order to determine the reproducibility between UF runs for the DOC, UV-254,
241

and DOX analyses. The percent average deviation for the UV-254 analyses ranged from 0 to 18 percent, with the smallest deviation for the 3,000 and 10,000 dalton membranes (0 to 1.9 percent), followed by the 0.5K dalton membrane (0 to 4 percent). The 1,000 dalton membrane had the highest deviation for the UV-254 measurements. In terms of DOC, the UF reproducibility paralleled the UV-254 reproducibility, with the best reproducibility for the 10,000 dalton membrane (0.75 to 1.9 percent) and the highest deviation for the 1,000 dalton membrane (10 percent). The 1,000 dalton membrane demonstrated an erratic behavior throughout the study and was changed more frequently than the other membranes. No explanation could be found as that membrane was made from the same material as the 3,000 and 10,000 dalton membranes. Determination of the role of the water matrix on this loss of integrity was not investigated. The reproducibility of the UF fractionation in terms of DOX measurements ranged from 3.3 to 13 percent.
In addition, because duplicate DOX analyses were performed on the duplicate runs of the chloraminated sample, it was possible to determine the reproducibility of the DOX analyses. For all membranes within the same run, the DOX analysis precision was determined to be between 0.34 percent and 9.5 percent average deviation, with a mean and standard deviation of 3.1 percent ± 0.03 percent for n = 10.
Membrane Rejection
The permeation coefficients, which are a measure of the membrane rejection of compounds below the MWC of the membrane, were obtained for CSPW using Mills plant influent and effluent samples. Table 9.10 shows that the 0.5K membrane generally had the highest permeation coefficient of all the membranes (where 1.0 corresponds to 100 percent permeation). This could be due to the slight differences in the manufacturing process of the 0.5K membrane (YC) and the remaining membranes (YM). The IK membrane coefficients of permeation for the source water (DOC and UV-254) and treated water DOX were the lowest values (-0.4). The coefficients as measured by DOX, except for the IK membrane, were similar to those from DOC and UV-254 measurements. For CSPW, the membrane rejection was always higher for the raw water than the treated water as measured by DOC and UV-254. The
242

Table 9.10 Summary of coefficients of permeation
Membrane Influent Effluent
UV-254 DOC UV-254 DOC DOX
0.5K 0.703 NR 0.923 0.911 0.915
IK 0.434 0.410 0.817 0.912 0.465
3K 0.661 0.650 0.870 0.860 0.782
10K 0.645 0.708 0.751 0.818 0.979
NR = not reported
permeation coefficients observed for CSPW for UV-254 and DOC are in the range of those reported by Owen et al. (1993) for Ohio River water and Salt River Project water and provide a general indication of membrane retention. Permeation coefficients reported here, however, were not used in the calculation of AMW distributions, and coefficients were not determined for the other waters evaluated. The UF procedure as used in this study (i.e., collecting permeate fractions of 800 niL) generated "apparent" MW distributions that were used for relative comparisons and to elicit broad trends.
Results for the LHW refiltration study (Table 9.11) indicated that some compounds of O.5K daltons appeared to pass through the 0.5K dalton membrane during the first filtration but, that they were retained during the second filtration. The same phenomenon seemed to occur for the 1,000 dalton membrane. This did not appear to be the case for the larger MWC membranes (3,000 and 10,000 daltons). As discussed above, the degree of rejection can be determined by
243

the permeation coefficient. Aiken (1984) reported that the reliability of the UF fractionation does not exceed 90 percent. Because the general trends rather than the true values were needed for this study, this reliability was considered acceptable for the study.
For the rest of the discussion, the results from the IK dalton membrane are not reported. As mentioned earlier, the results from this MWC membrane were erratic and the permeation coefficients low. The fractions reported in this study are less than 0.5K, 0.5K to 3K, 3K to 10 K and>10Kdaltons.
Table 9.11 Refiltration experiment—LHW
Fraction (MWC)
Whole sample
500 P-l500 R-l
1,000 P-l
1,000 R-l
3,000 P-l
3, 000 R-l
10,000 P-l
10,000 R-l
DOC Initial Mass Balance Fraction DOC Mass Mass Filtration (mg/L) (MWC) Refiltration Balance * Balance (mg/L) (mg/L) (mg/L) Recovery
(%)t6.86
1.01 4.11
11.35
1.14 6.98
20.59
3.00 4.41
7.70
3.60 4.32
6.00
500 P-2500 R-2
1,000 P-2
1,000 R-2
3,000 P-2
3,000 R-2
10,000 P-2
10,000 R-2
0.64 0.970 98.61.47
0.65 1.37 125.4
2.47
2.45 2.92 98.3
3.62
3.64 3.62 100.6
3.60
Permeate Recovery
(%tt
63.1
56.9
81.7
101.0
*Mass balance of second filtration.
fMass balance recovery of DOC from initial filtration for each membrane.
^Recovery of DOC in second filtration from initial filtration for each membrane.
244
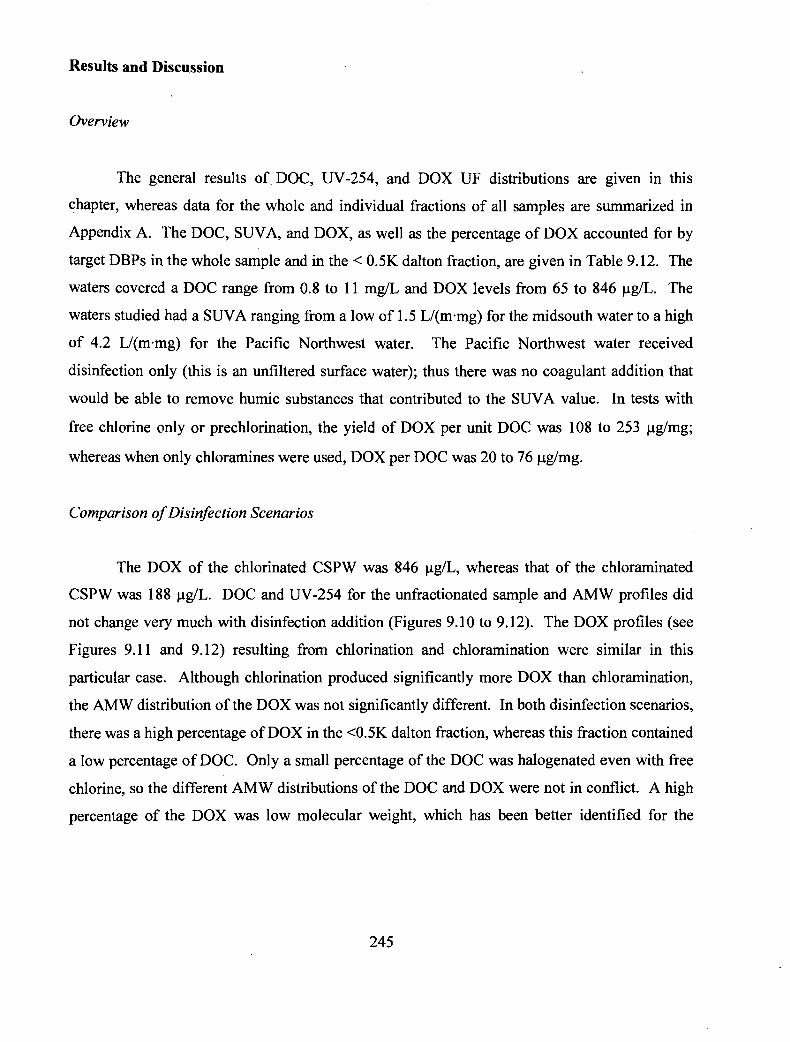
Results and Discussion
Overview
The general results of DOC, UV-254, and DOX UF distributions are given in this
chapter, whereas data for the whole and individual fractions of all samples are summarized in
Appendix A. The DOC, SUVA, and DOX, as well as the percentage of DOX accounted for by
target DBFs in the whole sample and in the < 0.5K dalton fraction, are given in Table 9.12. The waters covered a DOC range from 0.8 to 11 mg/L and DOX levels from 65 to 846 ug/L. The
waters studied had a SUVA ranging from a low of 1.5 L/(m-mg) for the midsouth water to a high
of 4.2 L/(m-mg) for the Pacific Northwest water. The Pacific Northwest water received
disinfection only (this is an unfiltered surface water); thus there was no coagulant addition that
would be able to remove humic substances that contributed to the SUVA value. In tests with
free chlorine only or prechlorination, the yield of DOX per unit DOC was 108 to 253 ng/mg;
whereas when only chloramines were used, DOX per DOC was 20 to 76 ug/mg.
Comparison of Disinfection Scenarios
The DOX of the chlorinated CSPW was 846 ug/L, whereas that of the chloraminated CSPW was 188 ug/L. DOC and UV-254 for the unfractionated sample and AMW profiles did
not change very much with disinfection addition (Figures 9.10 to 9.12). The DOX profiles (see
Figures 9.11 and 9.12) resulting from chlorination and chloramination were similar in this
particular case. Although chlorination produced significantly more DOX than chloramination,
the AMW distribution of the DOX was not significantly different. In both disinfection scenarios,
there was a high percentage of DOX in the <0.5K dalton fraction, whereas this fraction contained
a low percentage of DOC. Only a small percentage of the DOC was halogenated even with free
chlorine, so the different AMW distributions of the DOC and DOX were not in conflict. A high percentage of the DOX was low molecular weight, which has been better identified for the
245
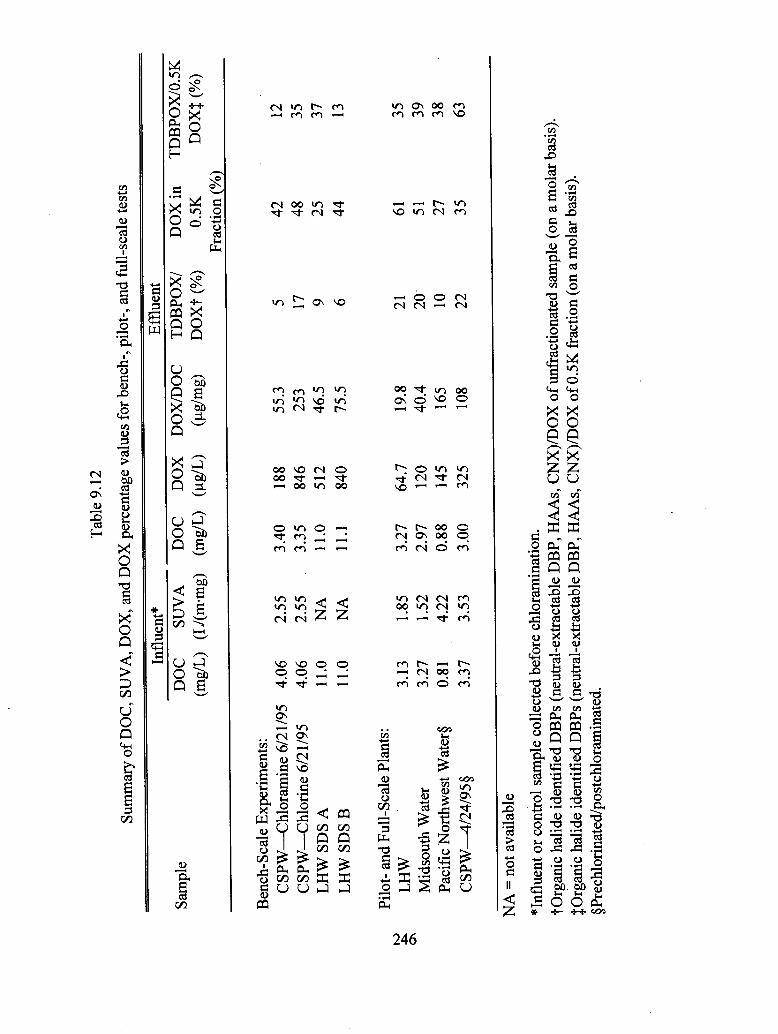
to -c*.
Tabl
e 9.
12
Sum
mar
y of
DOC
, SUV
A, D
OX, a
nd D
OX
per
cent
age
valu
es fo
r ben
ch-,
pilo
t-, a
nd fu
ll-sc
ale
tests
Influ
ent*
Sam
ple
Benc
h-Sc
ale
Expe
rimen
ts:CS
PW—
Chlo
ram
ine
6/21
/95
CSPW
— Ch
lorin
e 6/
21/9
5LH
W S
DS A
LHW
SDS
B
Pilo
t- an
d Fu
ll-Sc
ale
Plan
ts:LH
WM
idso
uth
Wat
erPa
cific
Nor
thw
est W
ater§
CSPW
--4/2
4/95
§
DOC
(mg/
L)
4.06
4.06 11.0
11.0
3.13
3.27 0.81
3.37
SUV
A
DO
C (L
/(m-m
g)
(mg/
L)
2.55 2.55 NA
NA
1.85
1.52
4.22 3.53
3.40
. 3.
35 11.0
11.1
3.27
2.97 0.88
3.00
DO
X(u
g/L)
188
846
512
840
64.7
120
145
325
DOX/
DOC
(ug/
mg)
55.3
253
46.5
75.5
19.8
40.4
165
108
Efflu
ent
TDBP
OX
/ D
OX
t (%
)
5 17 9 6 21 20 10 22
DO
X in
0.
5K
Frac
tion
(%)
42 48 25 44 61 51 27 35
TDBP
OX
/0.5
K
DO
XJ
(%)
12 35 37 13 35 39 38 63
NA
= n
ot a
vaila
ble
* Inf
luen
t or c
ontro
l sam
ple
colle
cted
bef
ore
chlo
ram
inat
ion.
tOrg
anic
hal
ide
iden
tifie
d D
BFs (
neut
ral-e
xtra
ctab
le D
BF, H
AAs,
CNX
)/DO
X o
f unf
ract
iona
ted
sam
ple
(on
a mol
ar b
asis)
.^O
rgan
ic h
alid
e id
entif
ied
DBF
s (ne
utra
l-ext
ract
able
DBF
, HAA
s, CN
X)/D
OX
of 0
.5K
frac
tion
(on
a mol
ar b
asis)
.§P
rech
lorin
ated
/pos
tchl
oram
inat
ed.
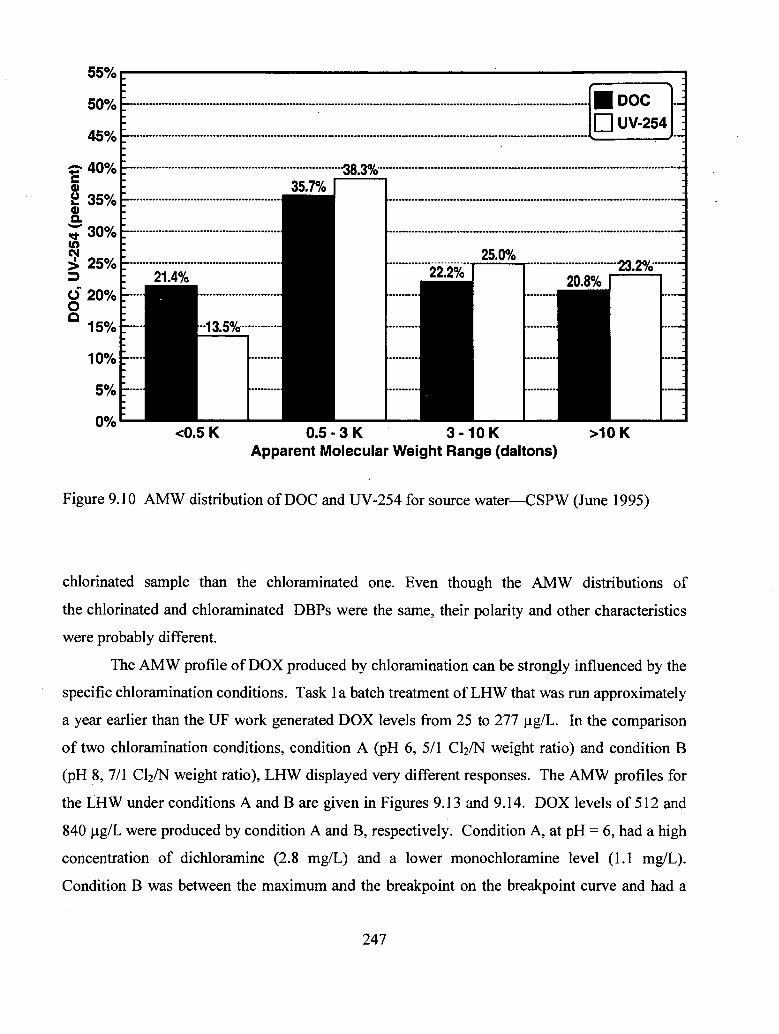
<0.5K 0.5- 3 K 3-10K Apparent Molecular Weight Range (daltons)
>10K
Figure 9.10 AMW distribution of DOC and UV-254 for source water—CSPW (June 1995)
chlorinated sample than the chloraminated one. Even though the AMW distributions of
the chlorinated and chloraminated DBFs were the same, their polarity and other characteristics were probably different.
The AMW profile of DOX produced by chloramination can be strongly influenced by the specific chloramination conditions. Task la batch treatment of LHW that was run approximately a year earlier than the UF work generated DOX levels from 25 to 277 (ag/L. In the comparison of two chloramination conditions, condition A (pH 6, 5/1 Cb/N weight ratio) and condition B (pH 8, 7/1 Cfe/N weight ratio), LHW displayed very different responses. The AMW profiles for
the LHW under conditions A and B are given in Figures 9.13 and 9.14. DOX levels of 512 and
840 |ag/L were produced by condition A and B, respectively. Condition A, at pH = 6, had a high concentration of dichloramine (2.8 mg/L) and a lower monochloramine level (1.1 mg/L).
Condition B was between the maximum and the breakpoint on the breakpoint curve and had a
247

<500 500-3,000 3,000-10,000 >10,000 Apparent Molecular Weight Range (daltons)
Figure 9.11 AMW distribution of DOC, UV, and DOX for chlorinated CSPW (June 1995)
<500 500-3,000 3,000-10,000 >10,000 Apparent Molecular Weight Range (daltons)
Figure 9.12 AMW distribution of DOC, UV, and DOX for chloraminated CSPW (June 1995)
248

DOC-Source
DOC-SDS A
DOX-SDS A
<500 500 - 3,000 3,000 - 10,000 >10,000 Apparent Molecular Weight Range (daltons)
Figure 9.13 AMW distribution of source water DOC and of DOC and DOX of chloraminated LHW, SDS condition A (pH - 6, C12/N = 5/1, with 48-hr residual of 4 mg/L)
DOC-Source
DOC-SDS A
DOX-SDS A
500 - 3,000 3,000 -10,000 >10,000 Apparent Molecular Weight Range (daltons)
Figure 9.14 AMW distribution of source water DOC and of DOC and DOX of chloraminated LHW, SDS condition B (pH = 8, C12/N = 7/1, with 48-hr residual of 4 mg/L)
249

concentration of 3.8 mg/L monochloramine and no dichloramine; it produced a very high DOX level. The percent DOX in the <0.5K fraction was also high (44 percent) (Figure 9.14). Compounds in this low molecular weight range should be amenable to GC-MS analytical techniques unless they are too polar. Because only a small percentage of the DOX was accounted for by target DBFs, condition B may have produced more polar, low molecular weight DBFs. Condition A was at the maximum of the breakpoint curve, but at a pH producing a chloramine mixture of mono- and dichloramine, 1.1 and 2.80 mg/L, respectively, in this sample. Under these conditions, less DOX was formed and only 25 percent was in the <0.5K fraction (the DOX was more evenly distributed among the AMW fractions). Under these conditions, the humic (large molecular weight) substances were probably halogenated but were not broken down to relatively low molecular weight DBFs (e.g., as free chlorine does). Thus, techniques that can analyze for high molecular weight DBFs (e.g., LC-MS) are needed for such a sample. These results point out that DOX formation and AMW distribution of the halogenated DBFs can be strongly influenced by specific disinfection conditions.
Study of Geographically Diverse Waters
The data in Figure 9.15 show that the four diverse waters gave very different DOC profiles, even though three of the four waters had very similar DOC concentrations. Most of the DOC from the Pacific Northwest water (DOC = 0.81 mg/L)—which came from a facility that did not coagulate the water—had a molecular weight >10K daltons whereas all of the DOC from LHW after enhanced coagulation—a process that is efficient at removing humic substances— was <10K daltons. These AMW distributions are also consistent with the SUVA values of these waters. The distribution of DOC, however, did not change greatly after chloramination for any of these waters (Figure 9.16).
The DOX concentrations for the unfractionated samples used for UF were a low of 65 ug/L for the enhanced coagulation treated LHW, moderate values for the midsouth water (120 Hg/L) and the Pacific Northwest water (145 ug/L), and a high of 325 ng/L for full-scale treated CSPW (which was prechlorinated). As indicated by the low overall DOX for the LHW, enhanced coagulation removed many of the DBF precursors (Figure 9.17). The DOX yield per unit DOC was lower than previously observed for chloraminated raw LHW (see Table 9.12).
250

LH-Pilot Plant, DOC = 3.13 mg/L
Midsouth, Pacific Northwest, DOC = 3.27 mg/L DOC = 0.806 mg/L
Source Waters
CSPW,April 1995,
DOC = 3.22 mg/L
Figure 9.15 Comparison of AMW distribution of DOC for four source waters
LH-Pilot Plant, Midsouth, Pacific Northwest, DOC = 3.27 mg/L DOC = 2.97 mg/L DOC = 0.88 mg/L
Treated Waters
CSPW,April 1995,
DOC = 3.0 mg/L
Figure 9.16 Comparison of AMW distribution of DOC for four chloraminated waters
251

<0.5K 0.5K-3K 3K-10K Apparent Molecular Weight Range (daltons)
>10K
Figure 9.17 AMW distribution of DOC, UV, and DOX for LHW pilot plant effluent (enhanced coagulation)
The majority of the DOX (61 percent) was in the <0.5K dalton fraction, and a relatively high amount of the DOX was accounted for by target DBF analyses (24 percent). For the Pacific Northwest water, a large fraction of the DOC was in the >10K dalton range (Figures 9.15 and 9.16) and the DOC AMW distribution did not change much with disinfection. Forty-four percent of the DOX had an AMW greater than 10K daltons, and this water demonstrated that halogenated DBFs can have a very high molecular weight. Only 13 percent of the DOX could be accounted for by the target DBFs, as much of the DOX was probably not amenable to GC analyses. The UV-254 and DOX levels were much greater in the >10K fraction than in the other fractions for the Pacific Northwest water (Figure 9.18). These results show the need for an analytical method like LC-ESI-MS to identify high molecular weight DBFs.
The midsouth water had a moderate DOX production, which might have been higher due to the high bromide level (1.5 mg/L) but was consistent with the relatively low SUVA (1.5 L/(nvmg) of the source water. Approximately 50 percent of the DOX was in the <0.5K dalton fraction (Figure 9.19). Twenty-four percent of the DOX was accounted for by the selected DBFs
252

<0.5K 0.5K-3K 3K-10K >10K Apparent Molecular Weight Range (daltons)
Figure 9.18 AMW distribution of DOC, UV, and DOX for chloraminated water from Pacific
Northwest
<0.5K 0.5K-3K 3K-10K Apparent Molecular Weight Range (daltons)
>10K
Figure 9.19 AMW distribution of DOC, UV, and DOX for chloraminated water from the
midsouth
253
analyzed for, and another large fraction of DBFs was identified by SDK GC-MS, as reported earlier in this chapter. The remainder of the DOX was distributed among the other fractions, with 31 percent of the DOX in the 0.5K to 3K dalton range.
The full-scale, prechlorinated/postchloraminated CSPW results are shown in Figure 9.20. As with the chlorinated and chloraminated bench-scale tests of CSPW (Figures 9.11 and 9.12), a moderate amount of the DOX was low molecular weight. In either case where free chlorine was used (alone or as predisinfectant), 21 to 26 percent of the DOX was accounted for by target DBF analyses, whereas only 5 percent of the DOX was accounted for in the chloraminated only CSPW (Table 9.12). Figure 9.21 shows how different the percentage of DOX is for each chloraminated water in each of the various fractions.
Conclusions
UF was used as an analytical tool for the characterization of the AMW distribution of chloramine DBF as measured by DOX. An understanding of the AMW distributions of the DOX and DOC after chloramination can direct further analyses for specific DBFs. The DOC profiles did not change dramatically upon chloramination. In addition, UF can serve as an isolation, desalting and concentration technique for specific analyses such as LC-MS (e.g., one can isolate a fraction with a high percentage of the DOX).
No matter which source was chloraminated, the percentage of DOX in the <0.5K dalton fraction was typically the highest (see Figure 9.21). Thus, a large percentage of halogenated compounds should be amenable to GC-MS techniques unless they are too polar.
As demonstrated by the variety of waters studied, DOX can be of any molecular weight, even greater than 10K daltons (for an uncoagulated water, this may even be a large part of the DOX). These results point to the need for analytical methods such as LC-ESI-MS that can detect high molecular weight compounds with the specificity of MS and MS-MS.
Chlorination produces more DOX than chloramination, but the AMW distributions of the chloramine DOX were not necessarily very different. The chloramine DOX profile was dependent upon the specific conditions of chloramination (i.e., pH, Cb/N ratio), as well as treatment plant operations (use of conventional or enhanced coagulation).
254

<0.5K 0.5K-3K 3K-10K >10 K Apparent Molecular Weight Range (daltons)
Figure 9.20 AMW distribution of DOC, UV, and DOX for prechlorinated/postchloraminated CSPW (April 1995)
Pacific NorthwestDOX=145M9/LMidsouth
= 120pg/L LHW-Pilot-Plant treated DOX = 64.7 M9/L CSPW, April 1995 DOX = 325 M9/L
<0.5K 0.5 K-3 K 3K-10K Apparent Molecular Weight Range (daltons)
>10K
Figure 9.21 AMW distribution of DOX for four chloraminated waters
255

SUMMARY AND CONCLUSIONS
Task 4 investigated several analytical approaches suitable for determining chloramine DBFs and used the various approaches to characterize halogenated DBFs in chloraminated waters. The analytical approaches evaluated were LC-KI-UV and LC-MS; SDE GC-MS; and UF (DOX AMW distribution).
The LC methods focused on polar by-products, particularly those formed from amines and ammo acids. LC with on-line enrichment was found to be suitable for separating polar N-chloro compounds. KI-UV detection was found to be an easy way to monitor compounds prior to using a more exact detector for identification. Analysis of a natural water appeared to indicate that monochloramine, not dichloramine, reacted with small peptides to yield a KI-UV detectable compound. Limited work with LC-ESI-MS demonstrated its potential for identification of chloramine DBFs, in particular for N-chloro compounds. The PB-MS system used, however, was not adequate for determination of the N-chloro compounds.
The SDE, coupled with high performance capillary GC-MS, allowed detection of volatile
and semivolatile chloramine DBFs at low concentrations (ng/L to ug/L). SDE GC-MS results showed the influence of source water quality on chloramine DBF formation, especially the effect of bromide and iodide.
UF was an analytical tool used for the characterization of the AMW distribution of chloramine DBFs as measured by DOX. Specific disinfection conditions were found to strongly influence the AMW distribution of the halogenated DBFs. Generally, the DOX from the chloramination of all source waters studied had a high percentage of low molecular weight (<0.5 K dalton) compounds.
A better understanding of the nature of the DBFs formed by chloramination of diverse waters was gained by application of the LC-KI-UV, LC-ESI-MS, SDE-GC-MS and UF techniques to the analysis of solutions of chloraminated model compounds and natural waters.
256

CHAPTER 10
CONCLUSIONS
Based on the data collected in this investigation, the following are the key findings in each task.
TASK la
• Total disinfectant residual concentration (monochloramine+dichloramine+free chlorine) after 48 hr of incubation had little influence on the concentration of disinfection by-products (DBFs) formed.
• DBF formation followed the general trend of decreasing with increasing pH and decreasing Cb/N ratio. Exceptions to the trend were noted in some instances at pH 8, where the complexity of haloamine chemistry may cause water-specific responses.
• Dichloramine was present after 48-hr simulated distribution system (SDS) tests only at pH 6, and its relative fraction of the total residual increased as the Cla/N ratio increased.
• The production of significant concentrations of DBFs at pH 6 is consistent with the premise that dichloramine, or a decomposition product (i.e., free chlorine), is the active halogenating agent.
• The production of significant concentrations of DBFs in some instances at pH 8 implicates a chemical other than dichloramine as the active halogenating agent. Most probably, acid catalyzed reactions with monochloramine were producing the DBFs. Such reactions would also be expected to occur at pH 6, but not to a very great extent at pH 10 because of the low proton concentration.
• At pH 6, the addition of bromide to the water decreased the dichloramine fraction and increased the total chlorine demand, both of which suggest the increased formation of free and combined bromine. Interestingly, Lake Houston Water (LHW) was the water least susceptible to changes in dichloramine fraction,
257

possibly because the low alkalinity (-70 mg CaCOa/L) decreased the rate ofdichloramine decomposition.For the specific DBFs measured [trihalomethanes (THMs), haloacetic acids(HAAs), cyanogen halide (CNX)], bromide addition increased the concentrationof bromine-substituted DBFs. The dissolved organic halogen (DOX) analysiscannot differentiate between chlorine and bromine-substituted DBFs; however,the increased production of DOX observed with bromide addition implies anincrease in the degree of halogen substitution during chloramination of bromideion-containing waters.In all three waters studied, the dihalogen-substituted species [dichloroacetic acid(DCAA), dibromoacetic acid (DBAA), bromochloroacetic acid (BCAA)] were thedominant HAAs. This suggests that the trihalogen-substituted [e.g.,trichloroacetic acid (TCAA)] and dihalogen-substituted (DXAA) species havedifferent precursor materials and that the use of chloramines preferentiallycontrols the production of some HAA species.Only THMs and HAAs face current or near-term future regulation. Littledifficulty should be expected in meeting expected THM regulations withchloramines. Some difficulty is possible in certain waters with HAAs because ofthe production of DXAA species.
The 12 specific DBFs measured in this task accounted for no more than 35% ofthe DOX concentration on a molar basis, usually much less; therefore, utilitiesmay want to consider both specific DBFs and DOX in selecting appropriatechloramination conditions.
Relatively high concentrations of 2-d SDS DOX were formed in some watersunder some conditions. The maximum concentration found in this task was 258Hg C17L in LHW at pH 6 and a C12/N ratio of 5/1, ambient bromide ionconcentration, 2 mg/L total chlorine residual.
DBF production is quite sensitive to both pH and the Ch/N ratio; therefore,utilities should test both these variables to find operating conditions that meetdisinfection needs while minimizing DBF production. Unfortunately, the 3/1Clz/N ratio, which produced the smallest DBF concentrations in this study, may
258
TASK Ib
not be compatible with the maintenance of acceptable microbial water quality in
some distribution systems because at this ratio, free ammonia may be present, and
this may stimulate the growth of nitrifying bacteria.
Taken as a whole, the experiments on the three water sources indicate that mixing
conditions do not significantly affect the DBF concentration and speciation based
on 48-hr simulated distribution system tests; rather, system chemistry is the
controlling factor.
Considering that the experimental conditions covered a broad range of mixing
intensities and included delayed addition of ammonia, and considering that the
objective was to simulate the impact of mixing at the point of disinfectant
addition on distribution system DBF concentrations, the mixing experiments
should provide a reasonable estimate of the relative impact of mixing on DBF
formation at full scale.
Generally, the THM concentrations varied within a factor of two across the range
of mixing conditions for a given chemistry condition. Therefore, utilities may
achieve some decrease in THM and DOX formation through improved mixing
and simultaneous addition of chlorine and ammonia.
Mixing conditions had no discernible impact on HAA or CNX production.
The 12 specific DBFs measured in this task accounted for no more than 32% of
the DOX concentration on a molar basis, usually much less; therefore, utilities
may want to consider both specific DBFs and DOX in selecting appropriate
chloramination conditions.
Relatively high concentrations of 2-d SDS DOX were formed in some waters
under some conditions. The maximum concentration found in this task was 320
ug C17L in LHW at pH 8, Cli/N ratio of 7/1, low mixing intensity, ambient
bromide ion concentration, 2 mg/L total chlorine residual.
259

TASK 2
The pilot plant data for the three primary water sources agreed fairly well with the Task 1 bench-scale experiments, thus indicating that bench-scale testing is a useful first step to evaluate chloramination DBFs quickly and economically.
The 2-day SDS THM concentrations in all the pilot plant effluents met the proposed Stage 1 MCL; the THM concentrations in the effluents from the pilot plants also met the proposed Stage 2 MCL, with the exception of two runs at extreme conditions (high bromide, low pH; delayed addition of ammonia). In Lake Austin Water (LAW), a higher incubation pH sometimes produced a larger 2-day SDS HAA6 concentration, while little dependence on pH occurred in LHW. Therefore, a water-specific dependence of HAA6 formation on pH may be observed.
Except for one run, the ratio of the total dihalogen-substituted haloacetic acid concentrations to the HAA6 concentration in the 2-day SDS samples was from 0.7 to 1.0 (mostly 1.0). This indicates that chloramination does not control the formation of this group of DBFs very well.
Where source water chloramination and postfilter chloramination were compared (LAW and LHW), the point of adding the chloramines in the treatment train had little influence on the resulting 2-day SDS DBF concentrations. Apparently these waters contained "slow-reacting" precursors.
Ozonation in LAW and California State Project Water (CSPW) altered the HAA6 precursor material so that significantly lower 2-day SDS HAA6 concentrations resulted. This finding is important because it provides an option for utilities that are not able to meet the proposed Stage 2 MCL through chloramination alone.
Lower incubation pH always produced more 2-day SDS CNX. Note that base- catalyzed hydrolysis destroys CNX at pH 10, so even if CNX were formed, it would not be present after 48 hours. Postchloramination sometimes produced more 2-day SDS CNX than prechloramination.
In LAW and LHW, a lower incubation pH always produced more 2-day SDS DOX. Variation of pH was not studied in CSPW in this task.
260
Ozonation, when practiced (LAW, CSPW), followed by chloramination decreased
2-day SDS DOX concentrations relative to chloramination alone.
In LAW, the 2-day SDS DOX concentrations were larger when operating in direct
filtration mode, in comparison to conventional lime softening. Perhaps more
organic matter was removed in lime softening, or perhaps the lower alkalinity
resulting from lime softening decreased the reaction rate for acid-catalyzed
reactions of monochloramine with background organics. The role of alkalinity in
DBF formation may be worth considering in waters with moderate to high
alkalinity.
The 12 specific DBFs measured in this task accounted for no more than 45.4% of
the DOX concentration on a molar basis, usually much less; therefore, utilities
may want to consider both specific DBFs and DOX in selecting appropriate
chloramination conditions.
Relatively high concentrations of 2-d SDS DOX were formed in some waters
under some conditions. The maximum concentration found in this task was 203
ug C17L in LHW with prechloramination, conventional coagulation, incubation
pH 6, Cb/N ratio of 3/1, 0.32 mg/L bromide ion added, 2 mg/L total chlorine
residual.
Overall, practicing conventional coagulation, adding well mixed chlorine and
ammonia solutions simultaneously in the appropriate ratio, and keeping the pH in
the distribution system (as represented by incubation pH in this study) as high as
possible after chloramination at as low a Cb/N ratio as possible should minimize
overall DBF formation. Where needed, preozonation before chloramine addition
should further decrease DBF formation.
261

TASK 3
• Although several of the geographically diverse water sources have more
complicated chemical matrices, the full-scale sampling and bench-scale testing of
these waters largely mirrored the findings in the three primary water sources, thus
providing added confidence that the results of this research can be generalized to
utilities across the country (Table 10.1).
• Confirmation of the following points is of particular note.
— As has also been shown elsewhere, low pH and high Cb/N ratios cause the production of dichloramine.
— Bromine-substituted DBFs can be formed during the chloramination of
waters containing high concentrations of bromide.
— Dihalogen-substituted HAAs are preferentially formed over TCAA in
chloraminated waters; DCAA will be the dominant HAA in the absence of
significant bromide concentrations.
— Some waters may have difficulty meeting the proposed Stage 2 MCL for HAAS (0.030 mg/L) using chloramines.
— As long as a significant period of free chlorination does not occur, THM production during chloramination should not be a problem.
— Thus, chloramination is more effective in controlling the production of
THMs and TCAA than the production of DCAA and its bromine-
substituted analogues (DXAA).
• The 12 specific DBFs measured in this task accounted for no more than 23.7% of
the DOX concentration on a molar basis, usually much less; therefore, utilities
may want to consider both specific DBFs and DOX in selecting appropriate chloramination conditions.
262

Table 10.1
Summary of 2-d SDS disinfection by-product data
Lake AustinMedianMinimumMaximum
TTHM Hg/L
Amb.BrWater, Task
3.2ND15.2
TTHM Hg/L + Br
HAA6 Mg/L
Amb.Brla, Total chlorine residual =
8.5ND40.2
Lake Houston Water, Task la, TotalMedianMinimumMaximum
3.9ND17.7
4.7ND38.2
10.73.2
20.1
chlorine residual33.519.549.9
HAA6Hg/L + Br
2mg/L
N/A
= 2mg/L41.738.644.7
CNXHg/L
Amb.Br
4.9ND10.3
'5.4
1.116.9
CNXHg/L + Br
N/A
6.41.2
18.7
California State Project Water, Task la, Total chlorine residual = 2 mg/L Median 3.2 10.9 9.8 3.8 Minimum ND ND 4.9 N/A ND N/A Maximum 10.3 30.7 17.7 17.4
Midsouth Water, Task 3Minimum 9.8Maximum 37.0
Mississippi River Water, TaskMinimum 5.5Maximum 5.8
Biscayne Aquifer Water, TaskMinimum NDMaximum 0.8
N/A
3N/A
3N/A
9.0 N/A28.7
15.4 N/A19.9
9.9 N/A20.5
ND18.0
ND8.7
0.53.6
N/A
N/A
N/A
Northeastern Creek Water, Task 3Minimum 2.5Maximum 6.8
Northwest Water, Task 3Minimum NDMaximum ND
N/A
N/A
5.1 N/A18.0
8.0 N/A16.1
2.68.8
2.87.0
N/A
N/A
Note: All preformed chloramines applied to source waters
Amb. = Ambient N/A = Not applicable ND = None Detected
263

TASK 4
Relatively high concentrations of 2-d SDS DOX were formed in some waters
under some conditions. The maximum concentration found in this task was 162
ug C17L in the midsouth water, at incubation pH 6, Cb/N ratio 5/1, 3.3 mg/L total chlorine residual. In the full-scale sampling, 431 ug C17L of DOX was found in
the prechlorinated/postchloraminated Biscayne Aquifer water.
Chloramination of small model peptides showed that monochloramine, not
dichloramine, reacted with these chemicals, providing further evidence of
monochloramine's role in DBF formation.
Although most of the compounds identified in this study have been reported by
others as chlorination by-products, the dihalomethanes found upon
chloramination of the midsouth water may be specific to chloramination.
In some chloraminated water, the <500 dalton ultrafiltration (UF) fraction
represented approximately 43 to 61 percent of the DOX.
In some of the other chloraminated waters, the two highest molecular weight
fractions (the 3K to 10K and >10K) together represented approximately 39 to 55
percent of the DOX. Thus, significant concentrations of halogen-substituted DBFs
with very high molecular weight also are possible.
Thus, UF provides a unique analytical tool to preliminarily ascertain which
molecular weight fraction is most significant for a site specific chloramination.
Simultaneous distillation extraction, gas chromatography-mass spectrometry
(SDE GC-MS) was applicable to a variety of water qualities and provided thesensitivity needed for GC-MS identification of by-products at the ng/L to low
fig/L levels expected from chloramination.
SDE GC-MS measures low molecular weight [<650 daltons, MS scanned from 45
to 650 daltons], volatile and semivolatile compounds of low and moderate
polarity.
264

The particle beam-electron impact (PB-EI) ionization MS system used in this
study was not suitable for determining the structure of N-chloro organic
compounds.
The electrospray ionization (ESI)-MS system is applicable to the liquid
chromatography (LC)-MS determination of polar N-chloro organic compounds
that are chloramination by-products.
This work provides guidelines for the study of chloramine by-products. For future
DBF work, UF is recommended for use to separate and concentrate fractions of
compounds that currently have not been identified.
An initial full-scan, low resolution LC-ESI-MS run can provide preliminary
halogen content and molecular weight information. Subsequent high resolution
MS and MS-MS runs could focus on peaks of interest to determine chemical
composition and structure for DBF identification.
265

CHAPTER 11 RECOMMENDATIONS TO WATER UTILITIES
The results of this study confirm that DBF formation during chloramination generally
does not pose a regulatory concern based on current drinking water regulations and probably will
not cause a concern with the proposed Stage 1 regulations. Some problems may arise in meeting
the proposed Stage 2 regulations for HAAs. Even though chloramines generally do not produce
concentrations of regulated chemicals that are of concern, formation of unregulated and
uncharacterized halogenated chemicals, as measured by the DOX analysis, is significant under
some conditions. Therefore, water utilities may want to consider concentrations of both specific
regulated chemicals and DOX in selecting operating conditions for chloramination.
Some decrease in DBF formation may be observed through improved mixing at the point
of chemical addition. Also, simultaneous addition of chlorine and ammonia, in comparison to
delayed addition of ammonia, should reduce DBF formation, especially formation of THMs. In
bench scale mixing tests, the decrease in DBF formation through improved mixing and
simultaneous chemical addition did not exceed 50 percent in 48-hr simulated distribution system
tests; therefore, this approach to DBF control is most applicable to situations where modest
decreases in DBF formation are sought. The possible benefits from this approach also are a
function of the quality of the mixing and chemical addition schemes in current use.
System chemistry affects DBF formation far more than mixing. In general, the formation
of DBFs decreases with increasing pH and decreasing Cb/N ratio. Therefore, manipulation of
these two major operating variables can significantly impact DBF formation. Unfortunately, the
general observations of the effect of pH and Cb/N ratio on DBF formation may not hold for all
waters near neutral pH (7 to 8.5), because of the complexity of haloamine chemistry over this pH
range. Therefore, bench scale testing like that performed in Task la of this research is
recommended as an initial step in investigating the impact of operating conditions on DBF
formation. Further investigation at pilot scale also may be warranted if substantial changes in
operating conditions are contemplated.As noted above, decreasing the Cla/N ratio, especially to low values such as 3/1,
decreases DBF formation. Unfortunately, some water utilities have experienced problems in
maintaining adequate microbiological quality in distribution systems at low C^/N ratios.
267

Growth of nitrifying bacteria is a particular problem. Therefore, minimizing DBF formation and maintaining acceptable microbiological water quality in the distribution system may conflict with one another. Possible adverse water quality impacts should be considered in conjunction with a decrease in the C12/N ratio to low levels.
In addition to pH and the Cla/N ratio, two other system chemistry parameters may be important in DBF formation: bromide and alkalinity. This research shows that, as the bromide concentration increases, DBF formation likewise increases and the speciation within the individual classes of DBFs (e.g., THMs) shifts toward the bromine substituted chemicals. Therefore, water utilities that experience cyclical changes .in the bromide concentration of their source water can expect a positive correlation between DBF formation and bromide concentration.
Monochloramine can react with organics via an acid-catalyzed mechanism to yield halogen substituted organics. This reaction mechanism is catalyzed by proton donors such as carbonic acid and bicarbonate, the latter of which is a component of alkalinity and a common constituent of natural waters. Thus, as alkalinity increases, the rate of DBF formation also may increase. Utilities that have significant alkalinity, especially those practicing or considering lime softening, may want to examine the effect of alkalinity removal on DBF formation. The effect of alkalinity on DBF formation was not formally part of this research; however, some very limited data from several pilot plant runs suggest that alkalinity may impact DBF formation.
Any strategy aimed at controlling DBF formation through modification of pH and the Cb/N ratio will have practical ranges of workable values that are specific to each situation. In some cases, the workable ranges may be inadequate to satisfactorily control DBF formation. In particular, significant concentrations of dihalogenated acetic acids can be formed during chloramination. Conceivably, the HAA concentration in some waters could exceed the proposed Stage II regulations. Under these circumstances, preozonation followed by chloramination should be considered. This research showed that ozonation prior to chloramination decreased the formation of both HAAs and DOX.
Specific DBFs (e.g., THMs, HAAs, CNX) may comprise a very small percentage of the DOX concentration. Under such circumstances, water utilities may want to investigate their water in more detail to identify additional chemicals. This research examined a number of new analytical approaches for identifying additional chloramination DBFs. Uitrafiltration (UF) using
268

DOX and TOC surrogates and liquid chromatography (LC) are methods that could be adopted by a research laboratory to provide general information about halogen-substituted DBFs. As with other MS investigations into the identification of chlorination DBFs, the ultimate goal is to develop analytical methods using more readily available instrumentation once unknown DBFs have been identified. The actual practice of this approach cannot be instituted, however, until more of the chloramine DBFs are identified and their health significance evaluated. This study has shown that an initial full-scan, low resolution LC-electrospray ionization (ESI)-mass spectrometry (MS) run can provide preliminary halogen content and molecular weight information. Subsequent, high resolution MS and MS-MS runs could then focus on peaks of interest to determine chemical composition and structure for DBF identification.
269


APPENDIX A
ULTRAFILTRATION CALCULATIONS AND DATA
The equations used to generate the ultrafiltration AMW distributions shown in Chapter 9
are given here along with sample calculations. The raw DOC, UV-254, and DOX data used in
the calculations are summarized in Tables A.2 through A.7 (second, fourth, and sixth columns),
and the calculated mass balances (MB) — in the same units as the raw data — are summarized in
the third, fifth, and seventh columns.
UF Calculations
Example: Table A.I shows the DOC calculation for the analysis of a UF fractionation of a water sample (three membranes are used in this example). Column 1 describes the fractions in
terms of the AMW cutoff for each of the three membranes (3 permeates and 3 retentates).
Column 2 lists the corresponding DOC levels obtained. Column 3 shows the mass balances
calculated for each individual membrane. For each individual membrane, the mass balance was
obtained using the following equation:
MB = (Vp-DOCp) + VR-DOCR
Where: Vp: Volume of permeate
VR: Volume of retentate
DOCp: Concentration of permeate
R: Concentration of retentate (after dilution correction)
Mass balances were calculated in order to evaluate losses (organics), such as from
evaporation and adsorption. The DOCs obtained from the mass balances (for each individual
membrane) should be the same as the DOC of the unfractionated (whole) sample. If these values differed, a correction factor was determined. To distribute systematic losses (organics) occurring
during all filtrations over all the fractions, the permeate concentrations were normalized, based
on the recovery shown by the mass balance, to the unfractionated sample. A correction factor
271

was calculated which equaled the DOC of the unfractionated sample divided by the mass balance DOC. The corrected DOC for each permeate was obtained by multiplying the original permeate DOC value by that fraction's correction factor, as shown below for the 0.5K AMW fraction:
Correction Factor0.sK = DOCunfractipnated sample/ MBo.s K.
DOCo.sK, P corrected = DOC0.sK, P ' Correction Factor
To determine the AMW distribution of, for example, DOC, the percent DOC of each
molecular weight range fraction was calculated by (1) subtracting the permeate DOC concentration of one membrane from the DOC concentration of the permeate obtained from the
next larger pore sized (i.e., higher MW) membrane and (2) dividing by the DOC of the unfractionated sample.
For example, for the AMW range less than 0.5K (<0.5K) daltons, the percent DOC equals the DOC of the permeate for the 0.5K AMW fraction times 100 divided by the unfractionated sample DOC. For the range greater than 0.5K and less than 3K daltons (0.5K < AMW < 3K), the percent DOC is calculated by subtracting the DOC of the permeate for the 0.5K AMW cutoff fraction from the permeate DOC for the 3K AMW cutoff fraction, multiplying by 100, and dividing by the DOC of the unfractionated sample. For the range of
AMW greater than 10,000 (>10K daltons), the percent DOC is calculated by substracting the
DOC of the permeate for the 10K AMW cutoff from the unfractionated sample DOC,
multiplying by 100, and dividing by the unfractionated sample DOC. For the example in Table
A.I, the percent DOC in the 0.5K to 3K AMW range equals (1.81 - 0.302) • 100/2.96 = 50.9
percent.
272

Table A.I
Example of UF calculations
Fraction (MWC)
Whole Sample
1 OK PermeatelOKRetentate
3K Permeate
3K Retentate0.5K Permeate
0.5K Retentate
DOC(mg/L)
2.972.455.22
1.96
8.21
0.33
14.68
Mass Balance**
3.01
3.21
3.20
Correction Factor
0.986
0.924
0.928
Corrected DOC (mg/L)
2.972.42
1.81
0.30
Fraction (Daltons)
>10K
3K-10K
0.5K-3K
<0.5K
Percent DOC
18.4
20.5
50.9
10.2
*DOC concentrations of retentates have been corrected for dilution with rinse water.** Permeate and retentate volumes were 800 and 200 mL, respectively.
273

Table A.2
UF comparison of chloramination and chlorination—CSPW
Fraction (MWC)
DOC(mg/L)
DOCMass
Balance
UV-254 (cm-1 ) UVMass Balance
DOX DOXMass
BalanceInfluent
WholeSample
10KP10KR3KP3KR0.5KP0.5KR
4.06
2.916.712.069.810.7614.63
3.67
3.61
3.53
0.104
0.0810.2020.0540.3050.0140.462
0.105
0.104
0.104
SDS— ChloramineWholeSample
10KP10KR3KP3KR0.5KP0.5KR
3.40
2.776.951.969.660.6815.56
3.61
3.50
3.66
0.108
0.0840.1910.0550.2890.0250.416
0.105
0.102
0.103
188
19731913642071
541
222
193
165
SDS— ChlorineWholeSample
10KP10KR3KP3KR0.5KP0.5KRP = permeateR = retentate
3.35
2.656.382.009.130.8814.22
3.40
3.42
3.54
0.064
0.0510.1120.0340.1740.0130.264
0.063
0.062
0.063
846
66697251112322991893
727
655
617
274
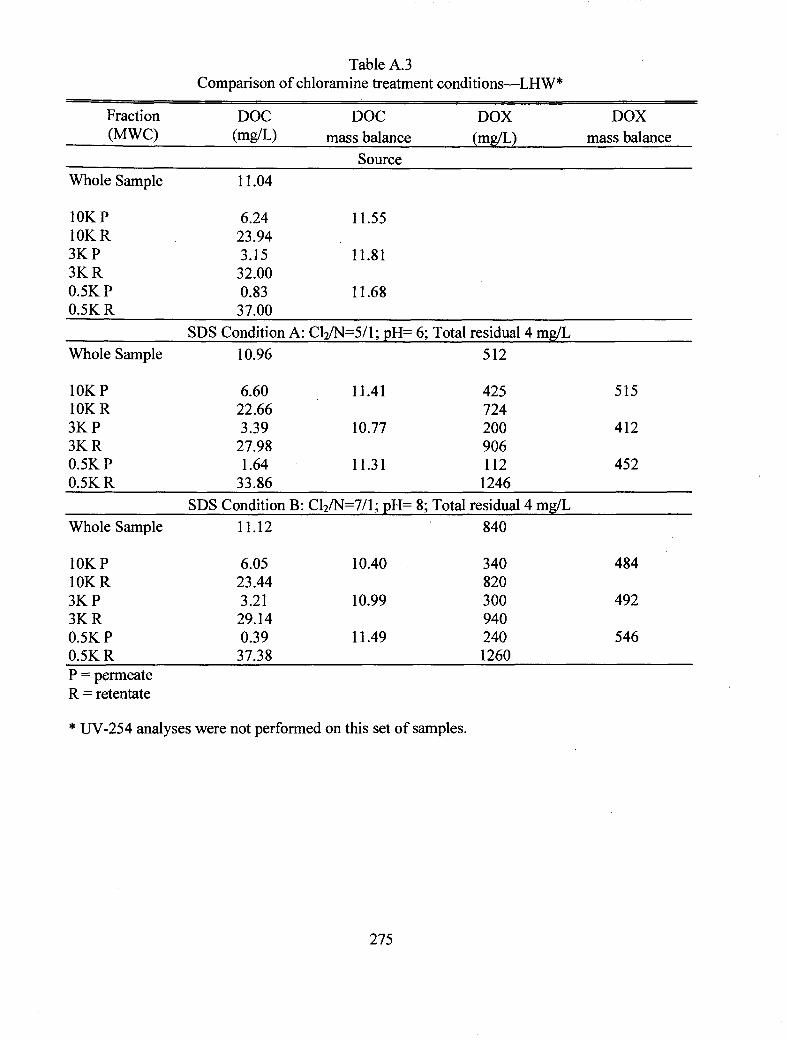
Table A.3 Comparison of chloramine treatment conditions—LHW*
Fraction(MWC)
DOC(mg/L)
DOCmass balance
DOX(mg/L)
DOXmass balance
SourceWhole Sample
10KP10KR3KP3KR0.5KP0.5KR
Whole Sample
10KP10KR3KP3KR0.5KP0.5KR
Whole Sample
10KP10KR3KP3KR0.5KP0.5KRP = permeateR = retentate
11.04
6.2423.943.1532.000.8337.00
SDS Condition A:10.96
6.6022.663.39
27.981.64
33.86SDS Condition B:
11.12
6.0523.443.2129.140.39
37.38
11.55
11.81
11.68
Cl2/N=5/l;pH=
11.41
10.77
11.31
Cl2/N=7/l;pH=
10.40
10.99
11.49
6; Total residual 4 mg/L512
425724200906112
12468; Total residual 4 mg/L
840
3408203009402401260
515
412
452
484
492
546
1 UV-254 analyses were not performed on this set of samples.
275

Table A.4 UF data for LHW pilot plant (enhanced coagulation)
Fraction(MWC)
DOC DOC Mass(mg/L) Balance
UV-254(cm' 1 )
UV Mass DOX DOX MassBalance (mg/L) Balance
Influent
Whole Sample10KP10KR3KP3KR0.5KP0.5KR
3.133.14 3.102.962.29 3.317.380.48 3.5215.66
0.0580.0470.0900.0350.1280.0250.294
0.056
0.054
0.079
Effluent
Whole Sample10KP10KR3KP3KR0.5KP0.5KR
P = permeateR = retentate
3.272.89 3.154.192.11 3.177.420.77 3.5314.56
0.0520.0430.0920.0330.1340.0070.242
650.053 56 58
670.053 39 49
860.054 39 63
163
276

Table A.5
UF data for CSPW full-scale plant*
Fraction
(MWC)DOC DOC Mass
(mg/L) BalanceUV-254(cm' 1 )
UV Mass DOX DOX MassBalance (mg/L) Balance
Influent
Whole Sample10KP10KR3KP3KR0.5KP0.5KR
3.37
1.88 3.097.921.88 3.479.840.84 4.1417.32
0.1190.0830.2360.0540.3600.0060.590
0.114
0.115
0.123
Effluent
Whole Sample10KP10KR3KP3KR0.5KP0.5KR
P = permeateR = retentate
3.002.53 3.205.882.08 3.097.101.04 3.53
13.50
0.0700.0580.1240.0490.1540.0140.288
3250.071 297 279
18500.070 249 299
5020.069 113 251
804
*pH = 8.3, C12 /N = 5/1, total residual = 1.6 mg/L
277

Table A.6 UF data for midsouth water
Fraction(MWC)
DOC(mg/L)
DOC UV-254 UVMass DOX
Mass Balance (cm" 1 ) Balance (mg/L)DOX Mass
Balance
Influent
Whole Sample10KP10KR3KP3KR0.5KP0.5KR
3.272.825.972.008.210.16
15.89
0.050
3.45 0.047 0.0520.070
3.24 0.037 0.0500.104
3.30 0.004 0.0490.230
Effluent
Whole Sample10KP10KR3KP3KR0.5KP0.5KR
P = permeate
R = retentate
2.972.455.221.968.210.3314.68
0.046 120
3.01 0.039 0.044 96
0.066 137
3.21 0.034 0.044 1050.086 216
3.20 0.008 0.044 43
0.190 246
105
127
83
278
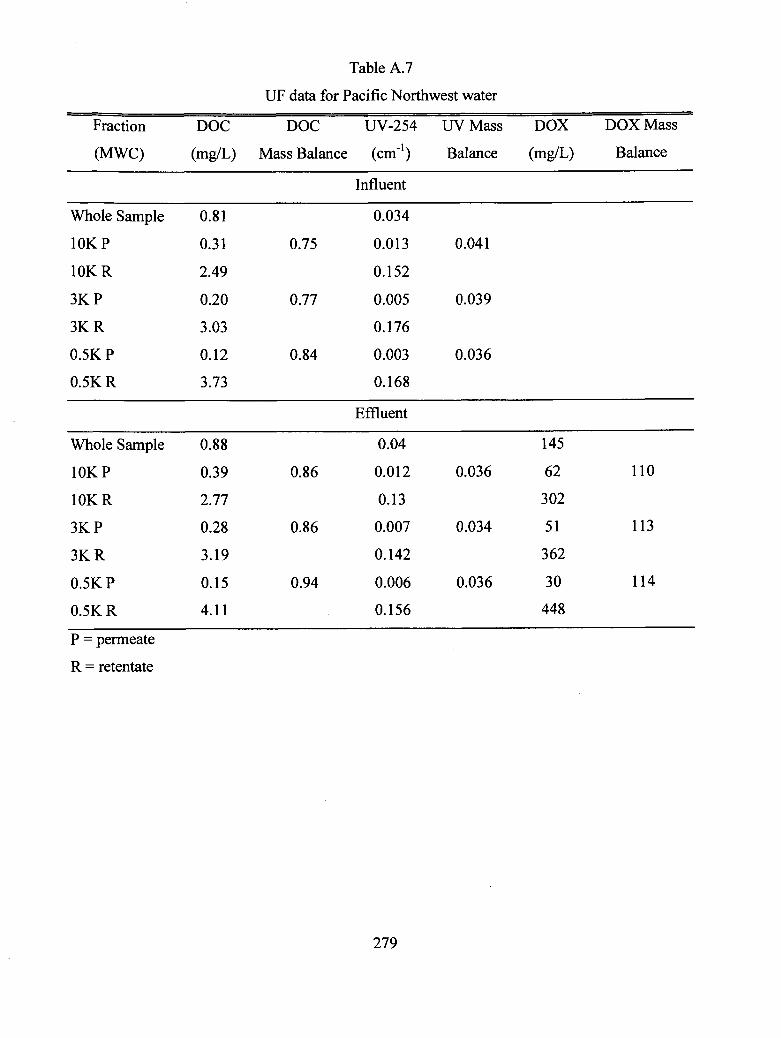
Table A.7
UF data for Pacific Northwest water
Fraction
(MWC)
DOC
(mg/L)
DOC UV-254 UVMass DOX
Mass Balance (cm" 1 ) Balance (mg/L)
DOX Mass
Balance
Influent
Whole Sample
10KP
10KR
3KP
3KR
0.5KP
0.5KR
0.81
0.31
2.49
0.20
3.03
0.12
3.73
0.034
0.75 0.013 0.041
0.152
0.77 0.005 0.039
0.176
0.84 0.003 0.036
0.168
Effluent
Whole Sample
10KP
10KR
3KP
3KR
0.5KP
0.5KR
P = permeate
R = retentate
0.88
0.39
2.77
0.28
3.19
0.154.11
0.04 145
0.86 0.012 0.036 62
0.13 302
0.86 0.007 0.034 51
0.142 362
0.94 0.006 0.036 30
0.156 448
110
113
114
279


APPENDIX B
DATA FROM INDIVIDUAL TASK 2 PILOT PLANT TESTS
281

Table B.I Lake Austin water pilot plant test — run 1A
Description of Conditions: C12 to N Ratio — 3 to 1 Mode of Operation: Ambient bromide (0.30 mg/L), Lime Softening, Prechloramination,
SDS at pH 10, Residual Target 2 mg/L
Date/Time
Run DayCl2 DoseNH4CI-N Dose*TurbidityAlkalinityTOCtpHBrfNorn. Incub. pHAct. Incub. pH, 2dFree C12 Res., 2dNH2C1 Res., 2dNHC12 Res., 2dTotal Res., IdCHC13, 2dCHBrCl2, 2dCHBr2Cl, 2dCHBr3, 2dTTHM, 2dMCAA, 2dDCAA, 2dTCAA, 2dMBAA, 2dDBAA, 2dBCAA, 2dHAA6, 2dC1MC1, 2dCNBr, 2dTCNX, 2dDOX, 2d% DOX Rec.J
Units
mg/Lmg/Lntu
mg CaCO3/Lmg/LNA
mg/LNANA
mg/Lmg/Lmg/Lmg/L«g/LHg/LHg/LHg/Lpga>Hg/L"g/Lug/LHg/LHg/LHg/LA»fcug/LHg/LMg/L
vgcn
Source
7/25/94
NANA2.721522.57.780.3NANANANANANANANANANANANANANANANANANANANANANANA
Sample 1
7/25/94,am
12.8
0.930.0970NR8.89NR10
9.810
2.280
2.280000000
3.73.84.912.625000
19.945.1%
Sample 1
7/25/94,pm
12.8
0.93NRNRNRNRNR10
9.810
2.040
2.0400000
NRNRNRNRNRNR
-0.50
0.518.6
Sample2
7/27/94,am
32.9
0.970.164NR9.30NR10
9.980
2.290
2.291.1000
J.JO00
1.82.13.48.275.5NRNR
-NR
Sample 2
7/27/94,pm
32.9
0.970.0964NR9.43NR10
10.010
2.360
2.3600000
NRNRNRNRNRNR
-NRNR
-NR
Sample 3
7/28/94,am4
2.80.930.1260NR9.97NR10
9.940
2.570
2.570000000
2.72.33.910.719.6NRNR
-22.7
Sample 3
7/28/94,pm4
2.80.930.1156NR9.68NR10
9.950
2.440
2.4400000
NRNRNRNRNRNR
-NRNR
-NR
Mean Std. Value Dev.
2.83 0.050.94 0.02
2.33 0.180.18
000
0.18 0.4500
2.732.734.0710.5020.03 4.760.25
00.25 0.3520.4 2.1
Task la Data
0.24
2.08
0.70
3.20
00
45.1% NANote: Values below detection limit reported as zeroact. = actualincub. = incubationNA = not applicablenom. = nominalNR = not runrec. = recoveryres. = residualstd. dev. = standard deviation- = does not apply
* This value, forNH4CL-N dose, is a multiple of the measured chlorine dose and the C12/N ratiot Sample collected in early July 1994{ Reported only where all of the target DBFs were measured
282

Table B.2 Lake Austin water pilot plant test — run IB
Description of Conditions: C12 to N Ratio — 3 to 1 Mode of Operation — Ambient bromide (0.30 mg/L), Lime Softening, Prechloramination,
SDS at pH 8, Residual Target 2 mg/L
Date/Time
Run DayC12 DoseNH4C1-N Dose*TurbidityAlkalinity
TOCfPHBrtNom. Incub. pHAct. Incub. pH, 2dFree C12 Res., 2dNH2C1 Res., 2dNHC12 Res., 2dTotal Res., 2dCHC13 , 2dCHBrCl2, 2dCHBr2Cl, 2dCHBr3, 2dTTHM, 2dMCAA, 2dDCAA, 2dTCAA,2dMBAA, 2dDBAA, 2dBCAA, 2dHAA6, 2dCNC1, 2dCNBr, 2dTCNX, 2dDOX,2d%DOXRec.J
Units
mg/Lmg/Lntumg
CaCOj/Lmg/LNA
mg/LNANA
mg/Lmg/Lmg/Lmg/LHg/LHg/Lug/L"g/Llig/L.ug/Lug/LHg/Lug/Lug/Lug/Lpg/Lug/Lug/Lt&L
t*gcr/L
Source
7/25/94
NANA2.72152
2.57.780.3NANANANANANANANANANANANANANANANANANANANANANANA
Sample 1
7/25/94,am
12.8
0.930.0970
NR8.89NR
88.30
02.27
02.27
2000
2.00000
1.50
14.5161.40
1.427.7
25.2%
Sample 1
7/25/94,pm
12.8
0.93NRNR
NRNRNR
88.31
02.04
02.04
00000
NRNRNRNRNRNR
-1.26
01.2631.2
-
Sample 2
7/27/94,am
32.9
0.970.164
NR9.30NR
88.19
02.31
02.31
00000000001111NRNR
-NR-
Sample 2
7/27/94,pm
32.9
0.970.0964
NR9.43NR
88.24
02.40
02.40
00000
NRNRNRNRNRNR
-NRNR
-NR-
Sample 3
7/28/94,am4
2.80.930.1260
NR9.97NR
88.15
02.57
02.57
0000000000
4.34.3NRNR
-26.2
-
Sample 3
7/28/94,pm4
2.80.930.1156
NR9.68NR
88.11
02.54
02.54
00000
NRNRNRNRNRNR
-NRNR
-NR
-
Mean Std. Value Dev.
2.83 0.050.94 0.02
2.36 0.200.33
000
0.33 0.82000
0.500
9.9310.43 5.871.33
01.33 0.1028.3 2.525.2% NA
Task la Data
0.24
2.26
0.50
6.20 .
4.3031.5
13.5%Note: Values below detection limit reported as zeroact. = actualincub = incubationNA = not applicablenom = nominalNR = not runrec. = recoveryres. = residualstd. dev. = standard deviation— = does not apply* This value, for NKUCL-N dose, is a multiple of the measured chlorine dose and the CVN ratiot Sample collected in early July 1994| Reported only where all of the target DBFs were measured
283

Table B.3 Lake Austin water pilot plant test — run 2 A
Description of Conditions: C12 to N Ratio — 5 to 1 Mode of Operation — Ambient bromide (0.30 mg/L), Lime Softening, Prechloramination,
SDS at pH 1 0, Residual Target 2 mg/L
Date/Time
Run DayC12 DoseNH4C1-N Dose*TurbidityAlkalinity
TOCtPHBrtNom. Incub. pHAct. Incub. pH, 2dFree C12 Res., 2dNH2C1 Res., 2dNHC12 Res., 2dTotal Res., 2dCHC1 3 , 2dCHBrCl2, 2dCHBr2Cl, 2dCHBr3, 2dTTHM, 2dMCAA, 2dDCAA, 2dTCAA, 2dMBAA, 2dDBAA, 2dBCAA, 2dHAA6, 2dCNC1, 2dCNBr, 2dTCNX, 2dDOX, 2d% DOX Rec.}
Units
mg/Lmg/Lntumg
CaCO3/Lmg/LNA
mg/LNANA
mg/Lmg/Lmg/Lmg/LHg/L"g/LHg/Lug/Lfg/LHg/LHg/LHg/LHg/Lug/Lug/Lfig/LHg/Lug/LVg/L
tig cr/L
Source
8/1/94
NANA2.98153
2.57.710.3NANANANANANANANANANANANANANANANANANANANANANANA
Sample 1
8/1/94,am
12.930.590.3153
NR9.82NR10
10.190
2.540
2.540000
0.00000
1.1011
12.1NRNR
-31.9
-
Sample 1
8/1/94,pm
12.930.590.0750
NR9.76NR10
10.110
2.610
2.61000
1.21.20NRNRNRNRNRNR
-NRNR
-NR
-
Sample 2
8/3/94,am
32.930.590.1270
NR9.07NR10
9.330
2.160
2.162.41.2.01.2
4.8000000
11.577.5NRNR
-31.7
-
Sample 2
8/3/94,pm
32.990.600.2265
NR9.57NR10
9.700
2.520
2.523.1000
3.10NRNRNRNRNRNR
-NRNR
-NR
-
Sample 3
8/4/94,am4
2.990.600.0960
NR9.59NR10
10.010
2.490
2.49000
1.11.10
00000
12.912.9NRNR
-33. 4
-
Sample 4
8/5/94,am5
2.930.590.0553
NR9.53NR10
10.110
2.380
2.38000
1.21.20NRNRNRNRNRNR
-000
NR-
Mean Std. Value Dev.
2.95 0.030.59 0.01
2. 45 0.160.920.20
00.781.90 1.74
000
0.370
11.8072.77 0.42
000
32.3 0.916.6%§
Task la Data
0.24
7.92
0
NR
NR44.5
-Note: Values below detection limit reported as zeroact. = actualincub. = incubationNA = not applicablenom. = nominalNR = not runrec. = recoveryres. = residualstd. dev. = standard deviation- = does not apply
* This value, for NH4CL-N dose, is a multiple of the measured chlorine dose and the C12/N ratiot Sample collected in early July 1994} Reported only where all of the target DBFs were measured§ Based on information in Mean Value column
284

Table B.4 Lake Austin water pilot plant test — run 2B
Description of Conditions: C12 to N Ratio — 5 to 1 Mode of Operation — Ambient bromide (0.30 mg/L), Lime Softening, Prechloramination,
SDS at pH 8, Residual Target 2 mg/L
Date/Time
Run DayCl2 DoseNH^Cl-N Dose*TurbidityAlkalinity
TOCtPHBr'tNom. Incub. pHAct Incub. pH, 2dFree C12 Res., 2dNH2C1 Res., 2dNHCl2 Res.,2dTotal Res., 2dCHCl3,2dCHBrCl2,2dCHBr2Cl, 2dCHBr3, 2dTTHM, 2dMCAA,2dDCAA,2dTCAA,2dMBAA,2dDBAA,2dBCAA,2dHAA6,2dCNCL2dCNBr,2dTCNX, 2dDOX,2d%DOXRec.t
Units
mg/Lmg/Lntumg
CaCOj/Lmg/LNA
mg/LNANA
mg/Lmg/Lmg/Lmg/Lug/Lug/Lug/Lug/Lpg/Lug/Lug/Lug/Lug/Lug/Lug/LPSS/Lug/Lug/LA*#X
tigcr/L
Source
8/1/94
NANA2.98153
2.57.710.3NANANANANANANANANANANANANANANANANANANANANANANA
Sample 1
8/1/94, am
12.930.570.3153
NR9.82NR
88.12
02.54
02.541.5000
1.5000000
8.58.5NRNR
-44.6
-
Sample1
8/1/94, pm
12.930.570.0750
NR9.76NR8
8340
2.610
2.671000
1.00NRNRNRNRNRNR
-NRNR
-NR-
Sample 2
8/3/94, am3
2.930.490.1270
NR9.07NR8
8.000
2.160
2.162.51.400
3.9000000
10.610.6NRNR
-44.3
-
Sample 2
8/3/94, pm3
2.990.500.2265
NR9.57NR8
8.120
2.520
2.5200000
NRNRNRNRNRNR
-NRNR
-NR-
Sample 3
8/4/94, am4
2.990.570.0960
NR9.59NR8
8.040
2.490
2.490000000000
9.69.6NRNR
-43.4
-
Sample 4
Mean Std. Task la Value Dev. Data
8/5/94, am
52.930.570.0553
NR9.53NR8
7.940
2.380
2.384.8000
4.80NRNRNRNRNRNR
-L540
1.54NR'
2.95 0.030.55 0.04
2.45 0.161.630.23
00
1.87 2.0300000
9.579.57 1.051.540
1.5444.1 0.6
11.1% 5
0.24
2.12
15.50
NR
NR160.0
-Note: Values below detection limit reported as zeroact = actualincub. = incubationNA = not applicablenom. = nominalNR = notnm ;rec. = recoveryres. = residualstd. dev. = standard deviation- = does not apply*Thisvalue,forNH4Cl^Ndose,kaniultipleofthenieasuredchkMTnedo«anduKClj/Nrttt»t Sample collected in early July 1994J Reported only where all of the target DBFs Were measured -,§ Based on information in Mean Value:cohimn
285

Table B. 5 Lake Austin water pilot plant test — run 3
Description of Conditions: CI2 to N Ratio — 5 to 1 Mode of Operation — Direct filtration with Alum, Ambient bromide (NR), Prechloramination,
. SDS at pH 8, Residual Target 2 mg/L
Date/Time
Run DayCl2 DoseNH|CI-N Dose*TurbidityAlkalinity
TOCtPHBr'tNom. Incub. pHAct. Incub. pH, 2dFree C12 Res., 2dNH2Cl Res., 2dNHC12 Res., 2dTotal Res., 2dCHC13 , 2dCHBrCl2, 2dCHBr2Cl, 2dCHBrj, 2dTTHM, 2dMCAA,2dDCAA,2dTCAA,2dMBAA,2dDBAA,2dBCAA,2dHAA6, 2dCNC1, 2dCNBr, 2dTCNX, 2dDOX, 2d%DOXRec.J
Units
mg/Lmg/Lntumg
CaCOs/Lmg/LNA
mg/LNANA
mg/Lmg/Lmg/Lmg/Lug/L"g/L"g/LHg/Lmft-Hg/LHg/Lug/L"g/Lug/L"g/L«0£Hg/LHg/LWft
ttgcr/L
Source
1 1/1 1/94
NANA2.91166
4.617.78NRNANANANANANANANANANANANANANANANANANANANANANRNA
Sample 1
11/12/94,am
13.650.730.17162
3.07.65NR
87.97
02.00
02.002.12
1.10
5.200
5.200
1.65.111.9NRNR
-60.6
-
Sample 1
11/12/94,pm
13.650.730.22165
NR7.48NR
87.94
01.51
01.511.91.91.10
4.90NRNRNRNRNRNR.
NRNR
-70.6
-
Sample2
1 1/13/94,am2
3.70.740.13163
NR7.70NR
88.07
01.55
01.552.12.11.20
5.40NRNRNRNRNRNR.
NRNR
-67.0
-
Sample 2
11/13/94,pm2
3.70.740.12164
NR7.58NR
88.47
02.06
02.064.24.42.90
11.50NRNRNRNRNRNR
-NRNR
-61.6
-
Sample 3
11/14/94,am3
3.630.73NRNR
NRNRNR
88.06
01.720
1.726.61.91.10
9.600
4.200
2.33.910.42.80
2.871.0
19.5%
Sample 3
11/14/94,pm3
3.630.730.12161
NR7.90NR
88.10
01.76
01.763.61.71.10
6.400
5.600
2.74.1
12.403.70
3.761.9
12.9%
Mean Value
3.660.73
1.773.422.331.42
07.17
05.00
00
2.204.3711.573.25
03.2565.4
16.2%
Std. Task la Dev. Data
0.030.01
0.24
0.77 2.12
2.74 15.50
1.04 NR
0.64 NR4.7 160.0
4.7% NANote: Values below detection limit reported as zeroact. = actualincub. = incubationNA = not applicablenom. = nominalNR = not runstd. dev. = standard deviation- = does not apply rec. = recovery res. = residual
* This value, for NH,CL-N dose, is a multiple of the measured chlorine dose and the C12/N ratiot Sample collected 11/14/94I Reported only where all of the target DBFs were measured
286

Table B.6 Lake Austin water pilot plant test — run 4
Mode of Operation —
Date/Time
Run DayC12 DoseNH4C1-N Dose*TurbidityAlkalinity
TOCpHBrNom. Incub. pHAct. Incub. pH, 2dFree C12 Res., 2dNH2C1 Res., 2dNHC12 Res., 2dTotal Res., 2dCHC13, 2dCHBrCl2, 2dCHBr2Cl, 2dCHBr3, 2dTTHM, 2dMCAA,2dDCAA, 2dTCAA, 2dMBAA,2dDBAA, 2dBCAA, 2dHAA6, 2dCNC1, 2dCNBr, 2dTCNX, 2dDOX, 2d% DOX Rec.J
Units
mg/Lmg/Lntumg
CaCO3/Lmg/LNA
mg/LNANA
mg/Lmg/Lmg/Lmg/Lug/Lug/Lug/Lug/Lt>g/Lug/Lug/Lug/Lug/Lug/Lug/Lfg/Lug/Lug/L/<g/i
pgCr/L
Source
11/18/94
NANA2.72152
3.647.78NRNANANANANANANANANANANANANANANANANANANANANANANA
Description of Conditions: C12 to N Ratio — 5 to 1 Direct Filtration with Alum, Ambient bromide (NR), Postchloramination,
SDS at pH 8, Residual Target 2 mg/LSample
111/18/94,
am1
2.30.460.16160
2.87.83NR
88.10
01.02
07.02
0000
0.000
2.500
3.43
8.9NRNR
-60.5
-
Sample 1
11/18/94,pm
12.30.460.12164
NR7.81NR
88.00
01.23
01.23
01.100
1.10NRNRNRNRNRNR
-NRNR
-52.0
-
Sample2
11/19/94,am2
2.40.480.32165
NR7.72NR
88.19
02.07
02.07
01.400
1.400
5.200
2.73.511.4NRNR
-59.7
-
Sample2
11/19/94,pm2
2.40.480.3166
NR7.77NR
88.01
01.78
01.78
01.500
1.50NRNRNRNRNRNR
-NRNR
-61.6
-
Sample 3
1 1/20/94,am
32.70.540.14162
NR7.71NR
88.07
02.00
02.00
01.300
1.30NRNRNRNRNRNR
- .4.99
04.9963.9
-
Sample 3
1 1/20/94,pm3
2.70.540.10168
NR7.88NR
88.07
02.09
02.0P
01.400
1.40NRNRNRNRNRNR
-3.20
3.255.0
-
Mean Std. Task la Value Dev. Data
2.47 0.190.49 0.04
0.24
7.70 0.46 NA0
1.1200
1.12 0.56 NA0
3.8500
3.053.2570.75 7.77 NA4.10
0470 7.27 NA58.8 4.5 NA
6.2%JNote: Values below detection limit reported as zero
act. = actualincub. = incubationNA = not applicablenom. = nominalNR = not runrec. = recoveryres. = residualstd. dev. = standard deviation- = does not apply* This value, for NHjCL-N dose, is a multiple of the measured chlorine dose and the C12/N ratio t Reported only where all of the target DBFs were measured t Based on information in the Mean Value column •
287

Table B.7 Lake Austin water pilot plant test — run 5 A
Description of Conditions: C12 to N Ratio — 5 to 1 Mode of Operation — Ambient bromide (NR), Lime Softening, Ozonation, Postchloramination,
SDS at pH 10, Residual Target 2 mg/L
Date/Time
Run DayC12 DoseNH4C1-N DoseTurbidityAlkalinity
TOCPHBfNom. Incub. pHAct. Incub. pH, 2dFree C12 Res., 2dNH2C1 Res., 2dNHC12 Res., 2dTotal Res., 2dCHC1 3 , 2dCHBrCl2, 2dCHBr2Cl, 2dCHBr3 , 2dTTHM, 2dMCAA, 2dDCAA, 2dTCAA, 2dMBAA, 2dDBAA, 2dBCAA,2dHAA6, 2dCNC1, 2dCNBr, 2dTCNX, 2dDOX, 2d%DOXRec.*
Units
mg/Lmg/Lntumg
CaCO3/Lmg/LNA
mg/LNANA
mg/Lrng/Lmg/Lmg/Lug/Lug/Lug/Lug/Lfg/Lug/Lug/L"g/Lug/Lug/Lug/Lfg/Lug/Lug/Lfg/L
fg Cr/L
Source
12/9/94
NANA2.2168
NR7.74NRNANANANANANANANANANANANANANANANANANANANANANANA
Sample1
12/9/94,am
1NANA0.1671
NR9.53NR
10.009.83
01.81
01.81
0000
0.000000000
1.40
1.422.50.3%
Sample 1
12/9/94,pm
1NANA
19.0071
NR9.26NR
10.009.97
02.08
02.08
0000
0.000
NRNRNRNRNR
-NRNR
-NR
-
Sample 2
12/10/94am2
NANA0.2169
NR9.7NR
10.009.93
02.00
02.00
0000
0.000
1.100000
1.101.00
1.028.40.9%
Sample 2
12/10/94,pm2
NANA0.1069
NR9.52NR
10.009.99
02.00
02.00
0000
0.00NRNRNRNRNRNR
-NRNR
-NR
-
Sample 3
12/11/94,am3
NANA0.2170
NR9.59NR
10.009.89
01.98
01.98
0000
0.0000000
1.41.40NRNR
-33.6
-
Sample 3
12/11/94,am3
NANA0.1774
NR9.38NR
10.009.91
02.00
02.22
0000
0.00NRNRNRNRNRNR
-•NRNR
-NR
-
Mean Std. Task la Value Dev. Data
0.24
2.02 0.13 NA00000 0 NA0
0.37000
0.470.83 0.74 NA1.20
01.20 0.28 NA28.2 5.55 NA0.6% 0.4% NA
Note: Values below detection limit reported as zeroact. = actualincub. = incubationNA = not applicablenom. = nominalNR = not runrec. = recoveryres. = residualstd. dev. = standard deviation- = does not apply* Reported only where all of the target DBFs were measured
288

Table B.8 Lake Austin water pilot plant test — run 5B
Description of Conditions: Cl2 to N Ratio — 5 to 1 Mode of Operation — Ambient bromide (NR), Lime Softening, Ozonation, Postchloramination,
SDS at pH 8, Residual Target 2 mg/L
Date/Time
Run DayC12 DoseNH,C1-N DoseTurbidityAlkalinity
TOCpHBr-
Nom. Incub. pHAct. Incub. pH, 2dFree C12 Res., 2dNH2C1 Res., 2dNHC12 Res., 2dTotal Res., 2dCHC13 , 2dCHBrCl2 , 2dCHBr2Cl, 2dCHBr3 , 2dTTHM, 2dMCAA, 2dDCAA, 2dTCAA, 2dMBAA, 2dDBAA, 2dBCAA, 2dHAA6, 2dCNC1, 2dCNBr, 2dTCNX, 2dDOX, 2d% DOX Rec.*
Units
mg/Lmg/Lntumg
CaCOj/Lmg/LNA
mg/LNANA
mg/Lmg/Lmg/Lmg/LHg/Lug/Lug/Lug/LMg/LHg/Lug/LHg/Lug/Lug/Lug/Lfg/Lug/Lug/LMg/L
ftgCr/L
Source
12/9/94
NANA2.2168
NR7.74NRNANANANANANANANANANANANANANANANANANANANANANANA
Sample1
12/9/94, am
1NANA0.1671
NR9.53NR
87.73
02.35
02.35
0000
0.000
1.40000
1.44.50.75.2
25.72.9%
Sample 1
12/9/94, pm
1NANA0.1971
NR9.26NR
88.17
02.14
02.14
0000
0.00NRNRNRNRNRNR
-NRNR
-NR
-
Sample 2
12/10/94, am2
NANA0.2169
NR9.70NR
87.63
01.830
1.830
1.11.20
2.3000000
1.41.44.32.87.1
31.59.3%
Sample2
12/10/94, pm
2NA
. NA0.169
NR9.52NR
88.02
02.08
02.08
00'
00
0.00NRNRNRNRNRNR
-NRNR
-NR
-
Sample 3
12/11/94, am3
NANA0.2170
NR9.59NR
88.05
02.03
02.03
0000
0.000
1.50000
1.5NRNR
-317
-
Sample 3
12/11/94 am3
NANA0.1774
NR9.38NR
88.00
01.98
01.98
02
2.42.36.70NRNRNRNRNRNR
-NRNR
-NR
-
Mean Std. Task la Value Dev. Data
2.07 0.1 70
0.520.600.387.50 2.77
01.0000
0.51.4 0.06
4.401.756.15 1.3430.3 4.136.1% 4.5%
NA
NA
NA
NA
NANANA-
Note: Values below detection limit reported as zeroact. = actualincub. = incubationNA = not applicablenom.= nominalNR = not runrec. = recoveryres. = residualstd. dev. = standard deviation- = does not apply* Reported only where all of the target DBFs were measured
289

Table B.9 Lake Houston water pilot plant test — run 1
Description of Conditions: C12 to N Ratio — 3 to 1 Mode of Operation — Ambient bromide (0.05 mg/L), Prechloramination, Conventional Coagulation, SDS at pH 8,
Residual Target 2 mg/L
Date/Time
Run DayAlum DoseC12 DoseNH4C1-N Dose*TurbidityAlkalinity
TOCpHBr'
Nom. Incub. pHAct. Incub. pH,2dFree C12 Res.,2dNH2C1 Res., 2dNHC12 Res., 2dTotal Res., 2dCHC13 , 2dCHBrCl2 , 2dCHBr2Cl, 2dCHBr3 , 2dTTHM, 2dMCAA, 2dDCAA, 2dTCAA, 2dMBAA, 2dDBAA, 2dBCAA, 2dHAA6, 2dCNC1, 2dCNBr, 2dTCNX, 2dDOX, 2d% DOX Rec.t
Units
mg/Lmg/Lmg/Lntumg
CaCO3/Lmg/LNA
mg/LNANA
mg/L
mg/Lmg/Lmg/LHg/LHg/LHg/LHg/Lfg/LHg/LHg/LHg/LHg/LHg/LHg/Lt&L"g/L"g/Lfg/L
fgCVL
Source
10/15/95
NANANA3457
4.56.470.05NANA
NA
NANANANANANANANANANANANANANANANANANANA
NA
Sample 1
10/15/95,am
1669.03.00.12NR
NR6.00NR
87.50
0.30
2.350
2.650
3.11.40
4.501.4
12.800
1.83.279.2
000
103.06.4%
Sample 1
10/15/95,pm
1669.03.0
0.15NR
NR5.90NR
87.40
0.10
2.800
2.900
3.51.50
5.00NRNRNRNRNRNR
-0.50
0.599.1
-
Sample 2
10/16/95,am2
669.03.0
0.1331
2.216.24NR
87.90
0.25
2.550
2.8002
0.60
2.600
16.2000
3.619.8NRNR
-105.6
-
Sample2
10/16/95,pm2
669.03.0
0.11NR
NR6.17NR
88.30
0
2.700
2.7002
0.60
2.60NRNRNRNRNRNR
-NRNR
-102.5
-
Sample 3
10/17/95,am3
669.03.0
0.15NR
1.95.80NR
88.00
0
3.200
3.200
2.31.10
3.400
13.82.60
1.13.1
20. 6NRNR
-110.7
-
Sample 3
10/17/94,am3
669.03.0
0.22NR
NR5.55NR
88.00
0
2.800
2.800
2.410
3.40NRNRNRNRNRNR
-NRNR
-104.1
-
Mean Value
669.03.0
2.840
2.551.03
03.580.4714.270.87
00.973.3019.870.25
00.25104.26.4%
Std. Task la Dev. Data
0.08
0.20 7.57
0.98 2.10
0.70 28.40
0.35 2.503.86 65.5NA 12.8%
Note: Values below detection limit reported as zeroact. = actualincub. = incubationNA = not applicablenom. = nominalNR = not runrec. = recoveryres. = residualstd. dev. = standard deviation- = does not apply
* This value, forNH4CL-N dose, is a multiple of the measured chlorine dose and the C12/N ratio t Reported only where all of the target DBFs were measured
290

Table B. 10 Lake Houston water pilot plant test — run 2
Description of Conditions: Cl2 to N Ratio — 3 to 1 Mode of Operation — Ambient bromide (0.05 mg/L), Conventional Coagulation, Postchloramination,
SDS at pH 8, Residual Target 2 mg/L
Date/Time
Run DayAlum DoseC1 2 DoseNH4C1-N Dose*TurbidityAlkalinity
TOCpHBr-Nom. Incub. pHAct. Incub. pH, 2dFree C12 Res., 2dNH2C1 Res., 2dNHC12 Res., 2dTotal Res., 2dCHC13 , 2dCHBrCl2, 2dCHBr2Cl, 2dCHBr3 , 2dTTHM, 2dMCAA, 2dDCAA, 2dTCAA, 2dMBAA, 2dDBAA, 2dBCAA, 2dHAA6, 2dCNC1, 2dCNBr, 2dTCNX, 2dDOX, 2d% DOX Rec.f
Units
mg/Lmg/Lmg/Lntumg
CaCOj/Lmg/LNA
mg/LNANA
mg/Lmg/Lmg/Lmg/LHg/LHg/LHg/LHg/Lfg/LHg/LHg/LHg/LHg/LHg/LHg/LPg/L"g/LHg/Lfg/L
ngcr/iNA
Source
2/27/95
NANANA62
21.3
12.36.220.05NANANANANANANANANANANANANANANANANANANANANANA
6.5%
Sample 1
2/25/95,am
1668.02.7
0.15NR
NR4.51NR
87.00
02.40
02.403.2
100
4.200
12.41.1000
13.512.91.2
14.1108.2
-
Sample 1
2/25/95,pm
1668.02.7
0.12NR
NR4.60NR
87.12
02.50
02.503.31.400
4.70NRNRNRNRNRNR
-13.21.2
14.4102.76.5%
Sample 2
2/26/95,am2
668.02.70.141.9
3.954.65NR
87.47
03.10
03.102.71.100
3.800
11.32.100
1.314.76.90
6.9105.6
-
Sample2
2/26/95,pm2
668.02.70.2NR
NR4.67NR
87.36
03.00
03.002.8
100
3.80NRNRNRNRNRNR
-6.90
6.9110.9
-
Sample 3
2/27/95,am3
668.02.7
0.22NR
NR4.720.01
87.15
02.90
02.902.81.400
4.20NRNRNRNRNRNR
-NRNR
-113.5
-
Sample 3
2/27/95,am3
668.02.70.25NR
NR4.70NR
87.31
02.80
03.003.2000
3.20NRNRNRNRNRNR
-NRNR
-106.3
-
Mean Std. Value Dev.
668.02.7
2.82 0.293.000.98
00
3. 98 0.510
11.851.60
00
0.6514.10 0.859.980.6010.58 5.99108.1 3.886.5% 0.0%
Task la Data
0.08
1.51
2.10
28.40
2.5065.5
12.8%Note: Values below detection limit reported as zeroact. = actualincub. = incubation ,NA = not applicablenom. = nominalNR = not runrec. = recoveryres. = residualstd. dev. = standard deviation- = does not apply* This value, for NH4CL-N dose, is a multiple of the measured chlorine dose and the C12/N ratio t Reported only where all of the target DBFs were measured
291

Table B. 11 Lake Houston water pilot plant test — run 3 A
Description of Conditions: Cl2 to N Ratio — 3 to 1 Mode of Operation — Ambient bromide (NR), Prechloramination, Enhanced Coagulation, SDS at pH 8, Residual Target 2 mg/L
Date/Time
Run DayAlum DoseC12 DoseNH4C1-N Dose*TurbidityAlkalinity
TOCpHBfNom. Incub. pHAct. Incub. pH,2dFree C12 Res., 2dNH2C1 Res., 2dNHC12 Res., 2dTotal Res., 2dCHC13 , 2dfCHBrCl2 2dfCHBr2cC 2dfCHBr3 , 2dfTTHM, 2dfMCAA, 2dDCAA, 2dTCAA, 2dMBAA, 2dDBAA, 2dBCAA, 2dHAA6, 2dCNC1, 2dCNBr, 2dTCNX, 2dDOX, 2d% DOX Rec.J
Units
mg/Lmg/Lmg/Lntumg
CaCO3/Lmg/LNA
mg/LNANA
mg/Lmg/Lmg/Lmg/Lug/Lug/Lug/Lug/LPg/Lug/Lug/Lug/Lug/Lug/Lug/LI&Lug/Lug/LPg/L
fgCr/L
Source
11/28/94
NANANA5433
10.16.95NRNANA
NANANANANANANANANANANANANANANANANANANANA
NA
Sample1
1 1/28/94,am
1887.22.4
0.12NR
NR4.73NR
87.20
01.50
01.503.5210
6.500
18.82.500
2.523.86.84
06.8499.1
10.7%.
Sample1
11/28/94,pm
1887.22.4NRNR
NRNRNR
8NR
NRNRNR
-NRNRNRNR
-NRNRNR
•NRNRNR
-NRNR
-NR
-
Sample 2
1 1/29/94,am2
887.22.4
0.220
3.13NRNR
8NR
NRNRNR
-NRNRNRNR
-NRNRNRNRNRNR
-NRNR
-NR
-
Sample 2
1 1/29/94,pm2
887.22.4NRNR
NRNRNR
8NR
NRNRNR
-NRNRNRNR
-NRNRNRNRNRNR
-NRNR
-NR
-
Sample 3
11/30/94,am3
887.22.4
0.17NR
NR4.800.02
87.22
01.50
01.504.11.900
6.000
19.31.700
2.223.2NRNR
-104.1
-
Sample 3
1 1/30/94,am3
887.22.4NRNR
NRNRNR
8NR
NRNRNR
-NRNRNRNR0.00NRNRNRNRNRNR
-NRNR
-NR
-
Mean Std. Value Dev.
887.22.4
7.50 0.003.801.950.50
06.25 OJ5
019.052.10
00
2.3523.5 0.426.84
06.84 0.0101.6 3.5410.7% NA
Task la
Data
0.08
7.57
2.70
28.40
2.5065.5
12.8%Note: Values below detection limit reported as zeroact. = actualincub. = incubationNA = not applicablenom. = nominalNR = not runrec. = recoveryres. = residualstd. dev. = standard deviation- = does not apply* This value, for NH4CL-N dose, is a multiple of the measured chlorine dose and the C12/N ratiot Sample time (am or pm) was not indicated on label} Reported only where all of the target DBFs were measured
292

Table B.I2 Lake Houston water pilot plant test — run 3B
Mode of Operation
Date/Time
Run DayAlum DoseC12 DoseNH4C1-N Dose*TurbidityAlkalinity
TOCPHBr"Norn. Incub. pHAct. Incub. pH, 2dFree C1 2 Res., 2dNH2C1 Res., 2dNHC12 Res., 2dTotal Res., IdCHC13 , 2dCHBrCl2, 2dCHBr2Cl, 2dCHBr3 , 2dTTHM, 2dMCAA, 2dDCAA,2dTCAA, 2dMBAA,2dDBAA, 2dBCAA, 2dHAA6, 2dCNC1, 2dCNBr, 2dTCNX, 2dDOX, 2d% DOX Rec.f
Description of Conditions: C12 to N Ratio — 3 to 1 — Ambient bromide (NR), Prechloramination, Enhanced Coagulation, SDS
Units
mg/Lmg/Lmg/Lntumg
CaCOj/Lmg/LNA
mg/LNANA
mg/Lmg/Lmg/Lmg/LHg/LHg/LHg/LHg/LPg/LHg/LHg/LHg/Lug/L"g/LHg/Lfg/LHg/Lug/LVg/L
fgCVL
Source
1 1/28/94
NANANA5433
10.16.95NRNANANANANANANANANANANANANANANANANANANANANANANA
Sample 1
11/28/94,am
1887.22.4
0.12NR
NA4.67NR
65.73
01.100.601.702.21.900
4.100
19.3200
2.824.10
7.62.510.1109.68.8%
Sample 1
11/28/94,pm
1887.22.4NRNR
NANRNR
6NRNRNRNR
-NRNRNRNR
-NRNRNRNRNRNR
-NRNR
-NR
-
Sample 2
1 1/29/94,am2887.22.40.22
0
3.134.78NR6
5.740
1.000.901.904.71.700
6.400
20.62.100
2.825.50
7.02.49.4
115.810.2%
Sample2
1 1/29/94,pm2
887.22.4NRNR
NANRNR
6NRNRNRNR
-NRNRNRNR
-NRNRNRNRNRNR
-NRNR
-NR
-
Sample 3
1 1/30/94,am3887.22.40.37NR
NA4.85NR
65.70
01.100.701.805.21.700
6.900
21.72.300
3.427.40NRNR
-111.5
-
at pH 6, ResidualSample
31 1/30/94,
am3887.22.4NRNR
NANRNR
6NRNRNRNR
-NRNRNRNR
-NRNRNRNRNRNR
-NRNR
-NR
-
Mean Value
887.22.4
1.804.031.77
00 ,
5.800
20.532.13
00
3.0025.<57
7.32.59.8
112.39.5%
Target 2 mg/LStd. Task la Dev. Data
0.08
0.10 2.26
1.49 5.30
1.66 38.50
0.49 8.603.18 174.11.0% 4.0%
Note: Values below detection limit reported as zeroact. = actualincub. = incubationNA = not applicablenom. = nominalNR = not runrec. = recoveryres. = residualstd. dev. = standard deviation- = does not apply* This value, for NH4CL-N dose, is a multiple of the measured chlorine dose and the C12/N ratio t Reported only where all of the target DBFs were measured
293

Table B.I3 Lake Houston water pilot plant test — run 4A
Mode of Operation
Date/Time
Run DayAlum DoseC12 DoseNH4C1-N Dose*TurbidityAlkalinity
TOCpHEfNom. Incub. pHAct. Incub. pH, 2dFree C12 Res., 2dNH2C1 Res., 2dNHC12 Res., 2dTotal Res., 2dCHC13 , 2dCHBrCl2, 2dCHBr2Cl, 2dCHBr3, 2dTTHM, 2dMCAA, 2dDCAA, 2dTCAA, 2dMBAA, 2dDBAA, 2dBCAA, 2dHAA6, 2dCNC1, 2dCNBr, 2dTCNX, 2dDOX, 2d% DOX Rec.t
Units
mg/Lmg/Lmg/Lntumg
CaCOj/Lmg/LNA
mg/LNANA
mg/Lmg/Lmg/Lmg/Lug/Lug/Lug/Lug/Lfg/Lug/Lug/Lug/Lug/Lug/Lug/Lfg/Lug/Lug/Lpga*
ngcr/L
Description of Conditions: C12 to N Ratio — 3 to 1 — Ambient bromide (0.05 mg/L), Enhanced coagulation, Postchloramination, SDS at pH 8,
Residual Target 2 mg/LSource
3/11/95
NANANA4235
10.36.800.05NANANANANANANANANANANANANANANANANANANANANANANA
Sample1
3/11/95,am
1887.72.60.13NR
NR4.65NR
88.44
03.10
03.105.11.800
6.901.3
11.73.40
1.94.9
23.21.90
1.982.3
14.4%
Sample1
3/11/95,pm
1887.72.6
0.11NR
NR4.70NR
88.40
02.94
02.945.11.800
6.90NRNRNRNRNRNR
-NRNR
-85.0
-
Sample 2
3/1 1/95,am2
887.72.60.12
3
3.374.820.01
88.45
02.80
02.80
6200
8.001.1
12.23.20
1.95.5
23.9NRNR
-75.9
-
Sample 2
3/1/95,pm2
887.72.6
0.13NR
NR4.80NR
88.42
02.36
02.365.81.900
7.70NRNRNRNRNRNR
-NRNR
-80.6
-
Sample 3
3/1 1/95,am3887.72.60.15NR
NR4.90NR
87.80
02.57
02.57
51.900
6.901.0
11.23.20
2.05.5
22.9NRNR
-82.9
-
Sample 3
3/1 1/95,am3
887.72.6NRNR
NRNRNR
8NRNRNRNRNRNRNRNRNRNRNRNRNRNRNRNR
-NRNR
-84.8
-
Mean Std. Value Dev.
887.72.6
2.75 0.295.401.88
00
7.28 0.531.13
11.703.27
01.935.30
23.33 0.571.90
0/.90 NA81.9 3.4
14.4% NA
Task la Data
0.08
1.51
2.10
28.40
2.5065.5
12.8%Note: Values below detection limit reported as zeroact. = actualincub. = incubationNA = not applicablenom. = nominalNR = not runrec. = recoveryres. = residualstd. dev. = standard deviation- = does not apply
* This value, for NH4CL-N dose, is a multiple of the measured chlorine dose and the C12/N ratio t Reported only where all of the target DBFs were measured
294

Table B.I4 Lake Houston water pilot plant test — run 4B
Description of Conditions: C12 to N Ratio — 3 to 1 Mode of Operation — Ambient bromide (0.05 mg/L), Enhanced Coagulation, Postchloramination,
SDS at pH 6, Residual Target 2 mg/L
Date/Time
Run DayAlum DoseC12 DoseNH4C1-N Dose*TurbidityAlkalinity
TOCPHBr-
Nom. Incub. pHAct. Incub. pH, 2dFree C12 Res., 2dNH2 C1 Res., 2dNHC12 Res., 2dTotal Res., 2dCHC13 , 2dCHBrC!2 , 2dCHBr2Cl, 2dCHBr3 , 2dTTHM, 2dMCAA, 2dDCAA, 2dTCAA, 2dMBAA, 2dDBAA, 2dBCAA, 2dHAA6, 2dCNC1, 2dCNBr, 2dTCNX, 2dDOX, 2d% DOX Rec.f
Units
mg/Lmg/Lmg/Lntumg
CaCO3/Lmg/LNA
mg/LNANA
mg/Lmg/Lmg/Lmg/LHg/LHg/LHg/Lug/Lfg/LHg/Lug/LHg/Lug/LHg/LHg/LPg/LHg/L"g/Lfg/L
ngcr/i
Source
3/1 1/95
NANA4235
10.36.800.05NANANANANANANANANANANANANANANANANANANANANANANA
Sample 1
3/11/95,am
1887.72.6
0.13NR
NR4.75NR
65.98
02.400.502.906.12.300
8.400
6.51.70
1.73.813.712.210.422.6111.813.3%
Sample 1
3/1 1/95,pm
1887.72.6
0.11NR
NR4.70NR6
6.100
2.300.602.906.3200
8.30NRNRNRNRNRNR
-NRNR
-115.5
-
Sample2
3/1 1/95,am2
887.72.6
0.123
3.374.820.01
66.30
02.800.403.207.22.200
9.4000000
1.01.012.36.418.7116.78.5%
Sample 2
3/1/95,pm2
887.72.6
0.13NR
NR4.80NR
66.25
02.700.403.105.5200
7.50NRNRNRNRNRNR
-NRNR
-707.9
-
Sample 3
3/1 1/95,am3
887.72.6
0.15NR
NR4.88NR6
6.220
2.600.302.905.62.300
7.9000000
1.01.0NRNR
-109.2
-
Sample 3
3/1 1/95,am3
887.72.6NRNR
NR4.85NR
6NRNRNRNRNRNRNRNRNR
-NRNRNRNRNRNR
-NRNR
-110.7
-
Mean Value
887.72.6
3.006.142.16
00
8.300
2.170.57
00
1.935.2312.258.40
20.65112.010.9%
Std. Task la Dev. Data
0.08
0.15 2.26
0.78 5.30
7.33 38.50
2.76 8.603.5 174.13.4% 4.0%
Note: Values below detection limit reported as zeroact. = actualincub. = incubationNA = not applicablenom. = nominalNR = not runrec. = recoveryres. = residualstd. dev. = standard deviation- = does not apply* This value, for NH4CL-N dose, is a multiple of the measured chlorine dose and the C12/N ratio t Reported only where all of the target DBPs were measured
295

Table B.I5 Lake Houston water pilot plant test — run 5A
Mode of Operation —
Date/Time
Run DayAlum DoseC12 DoseNH4CI-N Dose*TurbidityAlkalinity
TOCpHBrNom. Incub. pHAct. Incub. pH, 2dFree C12 Res., 2dNH2C1 Res., 2dNHC12 Res., 2d .,Total Res., 2dCHC13, 2dCHBrCl2, 2dCHBr2Cl, 2dCHBr3 , 2dTTHM, 2dMCAA, 2dDCAA, 2dTCAA, 2dMBAA, 2dDBAA, 2dBCAA, 2dHAA6, 2dCNC1, 2dCNBr, 2dTCNX, 2dDOX, 2d% DOX Rec.f
Units
mg/Lmg/Lmg/Lntumg
CaCO3/Lmg/LNA
mg/LNANA
mg/Lmg/Lmg/Lmg/LHg/L"g/LHg/LHg/LP&LHg/LHg/LHg/LHg/LHg/LHg/LP8/L"g/LHg/Lfg/L
fgCr/L
Source
3/11/95
NANANA5535
9.16.87NRNANANANANANANANANANANANANANANANANANANANANANANA
Description of Conditions: C12 to N Ratio — 3 to 1 0.3 mg/L Bromide Added, Prechloramination, Conventional
SDS at pH 8, Residual Target 2 mg/LSample
13/1 1/95,
am1
667.92.6
0.13NR
NR4.600.38
87.40
01.80
01.806.43.913.918.8
43.000
10.52
3.911.314
41.7NRNR
-189.6
-
Sample 1
3/11/95,pm
1667.92.6NRNR
NR4.63NR
87.350.101.80
01.904.33.913.117.739.0NRNRNRNRNRNR
-NRNR
-185.7
-
Sample 2
3/11/95,am2
667.92.6
0.150
3.144.65NR
87.30
01.60
01.606.21.2
14.219.240.8
08
1.84
10.212.436.4
216.118.1190.619.1%
Sample 2
3/1/95,pm2
667.92.6NRNR
NR4.68NR
87.32
01.75
07.754.66.112
16.739. 4NRNRNRNRNRNR
-NRNR
-79*2
-
Sample 3
3/11/95,am3667.92.6
0.17NR
NR4.66NR
87.24
01.500
1.505.79.712.817.9
46.100
9.51.9411
13.239.6NRNR
-188.5
-
Sample 3
3/11/95,am
3667.92.6NRNR
NR4.67NR
87.30
01.60
01.604.67.911.216.139.8NRNRNRNRNRNR
-NRNR
-179.4
-
Coagulation,
Mean Std. Value Dev.
667.92.6
7.69 0.755.305.4512.8717.7341.4 2.73
09.31.94.010.813.239.2 2.72.0016.1078.70 NA188.0 5.0419.1% NA
Task la Data
0.58
1.42
0.00
NR
NR84.3NA
Note: Values below detection limit reported as zeroact. = actualincub. = incubationNA = not applicablenom. = nominalNR = not runrec. = recoveryres. = residualstd. dev. = standard deviation- = does not apply* This value, for NH4CL-N dose, is a multiple of the measured chlorine dose and the C12/N ratio t Reported only where all of the target DBFs were measured
296

Table B.I6 Lake Houston water pilot plant test — run 5B
Mode of Operation — 0.3
Date/Time
Run DayAlum DoseC12 DoseNH4C1-N Dose*TurbidityAlkalinity
TOCPHBr-
Nom. Incub. pHAct. Incub. pH, 2dFree C12 Res., 2dNH2C1 Res., 2dNHC12 Res., 2dTotal Res., 2dCHC13 , 2dCHBrCl2, 2dCHBr2Cl, 2dCHBr3 , 2dTTHM, 2dMCAA, 2dDCAA, 2dTCAA, 2dMBAA, 2dDBAA, 2dBCAA, 2dHAA6. 2dCNC1, 2dCNBr, 2dTCNX, 2dDOX, 2d% DOX Rec.f
Units
mg/Lmg/Lmg/Lntumg
CaCO3/Lmg/LNA
mg/LNANA
mg/Lmg/Lmg/Lmg/L"g/LHg/LHg/LHg/Lfg/Lug/Lug/Lug/Lug/Lug/Lug/LVg/Lug/Lug/LA«fc
itgcr/L
Source
3/1 1/95
NANANA5535
9.16.87NRNANANANANANANANANANANANANANANANANANANANANANANA
Description of Conditions: C12 to N Ratio — 3 to 1 mg/L Bromide Added, Prechloramination, Conventional Coagulation, SDS at
pH 6, Residual Target 2 mg/LSample
13/1 1/95,
am1
667.92.6
0.13NR
NR4.600.38
65.790.101.000.601.704.73.112
15.735.50
08
1.63.98.811.333.66.614.927.5200.016.4%
Sample 1
3/1 1/95,pm
1667.92.6NRNR
NR4.63NR
65.810.101.000.701.805.34.911.114.4
35.70NRNRNRNRNRNR
-NRNR
-205.6
-
Sample 2
3/1 1/95,am2
667.92.6
0.150
3.144.65NR
65.85
01.200.601.804.96
9.612.7
33.200
8.41.93.88.911.334.3NRNR
-205.8
-
Sample 2
3/1/95,pm2
667.92.6NRNR
NR4.68NR
65.90
01.200.802.004.59.312.516.8
43.10NRNRNRNRNRNR
-NRNR
-797.5
-
Sample 3
3/11/95,am3
667.92.60.17NR
NR4.66NR6
5.910
1.100.701.804.56.610.413
34.500
8.61.74
9.311.835.4NRNR
-206.3
-
Sample 3
3/11/95,am
3667.92.6NRNR
NR4.67NR
65.870.101.000.601.704.66.910.412.8
34.70NRNRNRNRNRNR
-NRNR
-200.8
-
Mean Std. Value Dev.
667.92.6
1.80 0.114.756.1311.0014.2336.1
08.31.73.99.011.534.4 0.96.614.927.5 NA202.7 3.7116.4% NA
Task la Data
0.58
1.60
19.10
NR
NR205.8NA
Note: Values below detection limit reported as zeroact. = actualincub. = incubationNA = not applicablenom. = nominalNR = not runrec. = recoveryres. = residualstd. dev. = standard deviation- = does not apply* This value, for NH4CL-N dose, is a multiple of the measured chlorine dose and the C12/N ratio t Reported only where all of the target DBFs were measured
297
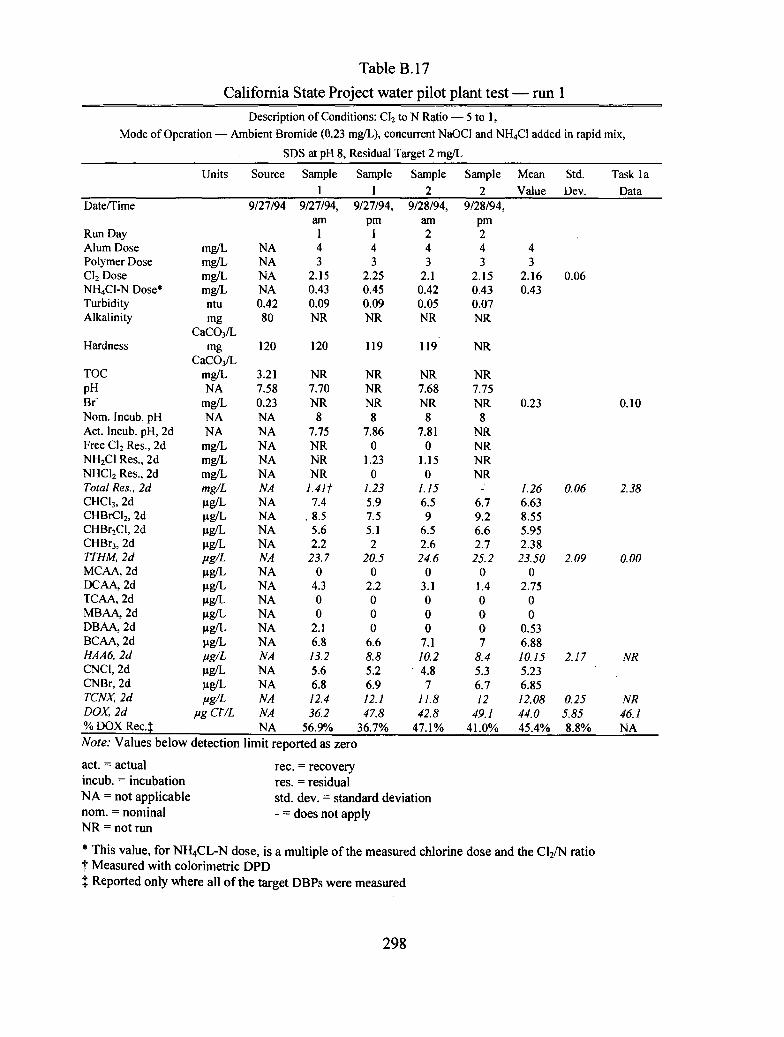
Table B.I7 California State Project water pilot plant test — run 1
Description of Conditions: C12 to N Ratio — 5 to 1, Mode of Operation — Ambient Bromide (0.23 mg/L), concurrent NaOCl and NH4C1 added in rapid mix,
SDS at pH 8, Residual Target 2 mg/L
Date/Time
Run DayAlum DosePolymer DoseC12 DoseNH4C1-N Dose*TurbidityAlkalinity
Hardness
TOCPHBr'Nom. Incub. pHAct. Incub. pH, 2dFree C12 Res., 2dNH2C1 Res., 2dNHC12 Res., 2dTotal Res., 2dCHC13, 2dCHBrCl2, 2dCHBr2Cl, 2dCHBr3 , 2dTTHM, 2dMCAA, 2dDCAA, 2dTCAA, 2dMBAA, 2dDBAA, 2dBCAA, 2dHA A 6, 2dCNC1, 2dCNBr, 2dTCNX, 2dDOX, 2d% DOX Rec.J
Units
mg/Lmg/Lmg/Lmg/Lntumg
CaCO3/Lmg
CaCOj/Lmg/LNA
mg/LNANA
mg/Lmg/Lmg/Lmg/LHg/LHg/LHg/LHg/LI&LHg/LMg/Lug/L"g/L"g/LHg/Lfg/LHg/LHg/LPgSL
ngcr/L
Source
9/27/94
NANANANA0.4280
120
3.217.580.23NANANANANANANANANANANANANANANANANANANANANANANA
Sample1
9/27/94,am
143
2.150.430.09NR
120
NR7.70NR
87.75NRNRNR
1.41-f7.4
.8.55.62.2
23.70
4.300
2.16.813.25.66.812.436.2
56.9%
Sample 1
9/27/94,pm
143
2.250.450.09NR
119
NRNRNR
87.86
01.23
01.235.97.55.12
20.50
2.2000
6.68.85.26.912.147.8
36.7%
Sample 2
9/28/94,am243
2.10.420.05NR
119
NR7.68NR
87.81
01.15
01.156.59
6.52.624.6
03.1000
7.110.24.87
11.842.8
47.1%
Sample 2
9/28/94,pm243
2.150.430.07NR
NR
NR7.75NR
8NRNRNRNR
-6.79.26.62.7
25.20
1.40007
8.45.36.712
49.141.0%
Mean Std. Value Dev.
43
2.16 0.060.43
0.23
1.26 0.066.638.555.952.3823.50 2.09
02.75
00
0.536.8870.75 2.775.236.8572.08 0.2544.0 5.8545.4% 8.8%
Task la Data
0.10
2.58
0.00
NR
NR46.1NA
Note: Values below detection limit reported as zeroact. = actual incub. = incubation NA = not applicable nom. = nominal NR = not run
rec. = recoveryres. = residualstd. dev. = standard deviation- = does not apply
* This value, for NH4CL-N dose, is a multiple of the measured chlorine dose and the C12/N ratiot Measured with colorimetric DPD% Reported only where all of the target DBFs were measured
298

Table B.I8 California State Project water pilot plant test — run 1 (repeat)
Description of Conditions: C12 to N Ratio — 5 to 1 Mode of Operation: Ambient Bromide (0.23 mg/L), concurrent NaOCI and NH4C1 added
SDS at pH 8, Residual Target 2 mg/L
Date/Time
Run DayAlum DosePolymer DoseC12 DoseNH4C1-N Dose*TurbidityAlkalinity
Hardness
TOCPHBr'Nom. Incub. pHAct. Incub. pH, 2dFree C12 Res., 2dNH2C1 Res., 2dNHC12 Res., 2dTotal Res., 2dCHC13 , 2dCHBrCl2, 2dCHBr2Cl, 2dCHBr3 2dTTHM. 2dMCAA, 2dDCAA, 2dTCAA, 2dMBAA, 2dDBAA, 2dBCAA, 2dHAA6, 2dCNC1, 2dCNBr, 2dTCNX, 2dDOX, 2d% DOX Rec.J
Units
mg/Lmg/Lmg/Lmg/Lntumg
CaCO3/Lmg
CaCO3/Lmg/LNA
mg/LNANA
mg/Lmg/Lmg/Lmg/Lug/Lug/Lug/Lug/Lt»g/Lug/LUg/Lug/Lug/Lug/LUg/Lfg/Lug/LUg/LI&L
ItgCT/L
Source
10/1/94
NANANANA0.5481
116
2.938.150.23NANANANANANANANANANANANANANANANANANANANANANA
NA
Sample 1
10/10/94,am
143
2.920.580.07NR
112
NR8.11NR
87.970.001.600.001.6010.613.811.75.8
41.90
3.9001
7.812.7NRNR
-69.8
-
Sample 1
10/10/94,pm
1433
0.600.09NR
117
NR8.15NR
87.970.001.780.001.7810.413.811.25.4
40.8NRNRNRNRNRNR
-NRNR
-77.9
-
Sample 2
10/11/94,am243
2.80.560.07NR
118
NR8.18NR
87.97NRNRNR
1.64f10
12.510.75.2
38.40
4.9003
8.916.84.67.972.573. 441.1%
Sample 2
10/11/94,pm243
2.90.580.09NR
NR
NR8.15NR
87.97NRNRNR
1.64f10.614.712.45.8
43.5NRNRNRNRNRNR
-NRNR
-79.4
-
Sample 3
10/12/94,am343
3.070.610.06NR
NR
NR8.00NR
87.970.001.480.001.487.412.111.45.9
36. 80400
2.88.775.5
411.115.1NR
-
Sample 3
10/12/94,pm343
3.020.600.07NR
NR
NR8.04NR
87.970.001.610.001.618.712.210.64.6
36.1NRNRNRNRNRNRNRNRNR
-NR
-
in rapid mix,
Mean Value
43
2.950.59
0.23
1.639.6213.1811.335.45
39.580
4.2700
2.278.4775.004.309.5073.8073.6341.1%
Std. Task la Dev. Data
0.10
0.10
0.72 2.38
2.95 0.00
2.10 NR
8.84 HR4.12 46.10
NA NANote: Values below detection limit reported as zeroact. = actual incub. = incubation NA = not applicable nom. = nominal NR = not run
rec. = recoveryres. = residualstd. dev. = standard deviation- = does not apply
* This value, for NH4CL-N dose, is a multiple of the measured chlorine dose and the C12/N ratiot Measured with colorimetric DPD% Reported only where all of the target DBFs were measured
299

Table B.I9 California State Project water pilot plant test — run 2
Mode of Operation -
Date/Time
Run DayAlum DosePolymer DoseC12 DoseNH,CI-N Dose*TurbidityAlkalinity
Hardness
TOCpHBr-Nom. Incub. pHAct. Incub. pH, 2dFree C12 Res., 2dNH2C1 Res., 2dNHC12 Res., 2dTotal Res., 2dCHClj, 2dCHBrCl2, 2dCHBr2Cl, 2dCHBr3 , 2dTTHM, 2dMCAA, 2dDCAA, 2dTCAA, 2dMBAA, 2dDBAA, 2dBCAA, 2dHAA6, 2ctCNC1, 2dCNBr, 2dTCNX, 2dDOX, 2d% DOX Rec.t
Units
mg/Lmg/Lmg/Lmg/L
ntumg
CaCOj/Lmg
CaCOj/Lmg/LNA
mg/LNANA
mg/Lmg/Lmg/Lmg/LHg/LHg/L
•ug/LHg/LPg/LHg/LHg/LHg/LHg/L"g/LHg/Lfg/LHg/LHg/LHg/L
fgcr/L
Description of Conditions: C12 to N Ratio — 5 to 1 — Ambient Bromide (0.25 mg/L), Postchloramination, 1 Minute. Delay NH4C1,
SDS at pH 8, Target Residual 2 mg/LSource
10/19/94
NANANANA0.578
114
3.28.060.25NANANANANANANANANANANANANANANANANANANANANANANA
Sample 1
10/18/94,am
143
NRNR0.07NR
111
NR7.94NR
87.85
01.51
01.51
1216.611.6
545.2
03.3
10
2.15.912.314.09.5
23.49103.733.2%
Sample 1
10/18/94,pm
143
NRNR0.08NR
NR
NR7.86NR
87.69
01.66
07.5613.217.211.34.946.6NRNRNRNRNRNRNR17.510.7
28.19110.0
-
Sample 2
10/19/94,am243
NRNR0.06NR
114
NR7.90NR
87.77
01.61
01.6111.715.610.8
543.1
03.4
10
1.65.711.75.49.7
15.06118.227.6%
Sample 2
10/19/94,pm243
NRNR0.07
NR
116
NR7.83NR
87.77
01.63
01.6311.616.210.94.843.5NRNRNRNRNRNRNR5.69.9
75.52106.6
-
Mean Value
43
NRNR
0.25
1.6012.1316.4011.154.9344.60
03.351.00
01.855.8012.0010.669.9120.57109.6330.4%
Std. Task la Dev. Data
0.10
7.67 NA
0.35 NA
0.42 NA
6.39 NA6.27 NA4.0% NA
Note: Values below detection limit reported as zeroact. = actual incub. = incubation NA = not applicable nom. = nominal NR = not run
rec. = recoveryres. = residualstd. dev. = standard deviation- = does not apply
* This value, for NH4CL-N dose, is a multiple of the measured chlorine dose and the C12/N ratio t Reported only where all of the target DBFs were measured
300

Table B.20 California State Project water pilot plant test — run 3A
Description of Conditions: C12 to N Ratio — 5 to 1 Mode of Operation — Ambient Bromide (0.23 mg/L), Preozonation (Target Residual 0.35 mg/L), biofiltration
(GAC/sand), postchloramination, SDS at pH 8, Target Residual 2 mg/L
Date/Time
Run DayO3 doseO3 res.Alum DosePolymer DoseC12 Dose*NH4C1-N Dose*fTurbidityAlkalinity
Hardness
TOCpHBr'Nom. Incub. pHAct. Incub. pH, 2dFree C12 Res., 2dNH2C1 Res., 2dNHC12 Res., 2dTotal Res., 2dCHC13 , 2dCHBrCl2, 2dCHBr2Cl, 2dCHBr3 , 2dTTHM, 2dMCAA, 2dDCAA, 2dTCAA, 2dMBAA, 2dDBAA, 2dBCAA, 2dHAA6, 2dCNC1, 2dCNBr, 2dTCNX, 2dDOX, 2d% DOX Rec.§
Units
mg/Lmg/Lmg/Lmg/Lmg/Lmg/Lntumg
CaCO3/Lmg
CaCOj/Lmg/LNA
mg/LNANA
mg/Lmg/Lmg/Lmg/L"g/Lug/LHg/Lug/LK/LMg/LHg/LHg/LHg/LHg/Lfig/LP&L"g/Lug/Lfg/L
fgcr/L
Source
10/4/94
NANANANANANA0.6282
119
3.28.050.23NANANANANANANANANANANANANANANANANANANANANANANA
Sample 1
10/4/94,am
10.750.41
43
2.50.500.1NR
119
NR7.59NR
88.15
01.39
07.39
01.71.50
3.200000
2.02.06.01.37.3
46.56.6%
Sample 1
10/4/94,pm
10.750.38
43
2.50.500.07NR
119
NR7.50NR
88.17
01.45
01.45
01.61.40
3.000000
2.22.25.61.36.8
41.77.2%
Sample2
10/5/94,am2
0.750.31
43
2.50.500.08NR
120
NR7.61NR
88.24
01.79
01.79
01.51.30
2.81.30000
2.43.78.21.39.5
61.75.1%
Sample2
10/5/94,pm2
0.750.43
43
2.50.500.09NR
NR
NR7.91NR
88.19
01.55
07.55
01.51.30
2.8t0000
1.81.8NRNR
-67.6
-
Mean Value
0.750.38
43
2.50.50
0.23
7.550
1.581.38
02.950.43
0000
2.102. 436.601.277.86
54.386.3%
Std. Task la Dev. Data
0.000.05
NA
0.78 NA
0.19 NA
0.87 NA
1.43 NA12.26 NA1.1% NA
Note: Values below detection limit reported as zeroact. = actual incub. = incubation NA = not applicable nom. = nominal NR = not run
rec. = recoveryres. = residualstd. dev. = standard deviation- = does not apply
* Batch chloraminated in laboratoryfThis value, for NH4CL-N dose, is a multiple of the measured chlorine dose and the C12/N ratio{Interference in chromatogram§Reported only where all of the target DBFs were measured
301

Table B.21 California State Project water pilot plant test — run 3B
Description of Conditions: C12 to N Ratio — 5 to 1 Mode of Operation — Ambient Bromide (0.23 mg/L), Preozonation (Target Residual 0.35 mg/L), no biofiltration
(laboratory filtration), postchloramination, SDS at pH 8, Target Residual 2 mg/L
Date/Time
Run DayO3 doseO3 res.Alum DosePolymer DoseC12 Dose*NH4C1-N Dose*tTurbidityAlkalinity
Hardness
TOCPHBr'Nom. Incub. pHAct. Incub. pH, 2dFree C12 Res., 2dNH2C1 Res., 2dNHC12 Res, 2dTotal Res., 2dCHC13 , 2dCHBrCl2, 2dCHBr2Cl, 2dCHBr3 , 2dTTHM, 2dMCAA, 2dDCAA, 2dTCAA, 2dMBAA, 2dDBAA, 2dBCAA, 2dHAA6. 2dCNC1, 2dCNBr, 2dTCNX, 2dDOX, 2d% DOX Rec.§
Units
mg/Lmg/Lmg/Lmg/Lmg/Lmg/Lntumg
CaCOj/Lmg
CaCO3/Lmg/LNAmg/LNANA
mg/Lmg/Lmg/Lmg/Lug/LHg/Lug/LHg/Lfg/Lug/Lug/Lug/Lng/Lug/Lug/Lrg/Lug/Lug/LP&L
fgcr/L
Source
10/4/94
NANANANANANA0.6282
119
3.280460.23NANANANANANANANANANANANANANANANANANANANANANANA
Sample1
10/4/94,am
10.750.41
43
2.50.500.1NR
119
NR7.59NR
88.19
01.63
01.63
01.61.40
3.02.30000
2.24.55.90.76.5338.2
7.6%
Sample 1
10/4/94,pm
10.750.38
43
2.50.500.07NR
119
NR7.50NR
88.22
01.72
01.72
01.51.30
2.8t0000
1.61.66.90.57.4
55.05.0%
Sample 2
10/5/94,am2
0.750.31
43
2.50.500.08NR
120
NR7.61NR
88.22
01.59
01.59
01.51.20
2.72.70000
1.94.614.11.0
15.1366.04.9%
Sample2
10/5/94,pm2
0.750.43
43
2.50.500.09NR
NR
NR7.91NR
88.23
01.79
01.79
01.51.30
2.82.20000
1.53.7NRNR
.67.5
-
Mean Std. Task la Value Dev. Data
0.75 0.000.38 0.05
43
2.50.50
0.23 NA
1.68 0.09 NA0
1.531.30
02.83 0.13 NA2.40
0000
1.803.60 1.39 NA8.950.739.69 4.73 NA
56.68 13.52 NA5.8% 1.5% NA
Note: Values below detection limit reported as zerorec. = recoveryres. = residualstd. dev. = standard deviation- = does not apply
act. = actualincub. = incubationNA = not applicablenom. = nominalNR = not run* Batch chloraminated in laboratorytThis value, for NH4CL-N dose, is a multiple of the measured chlorine dose and the C12/N ratio{Interference in chromatogram§Reported only where all of the target DBFs were measured
302
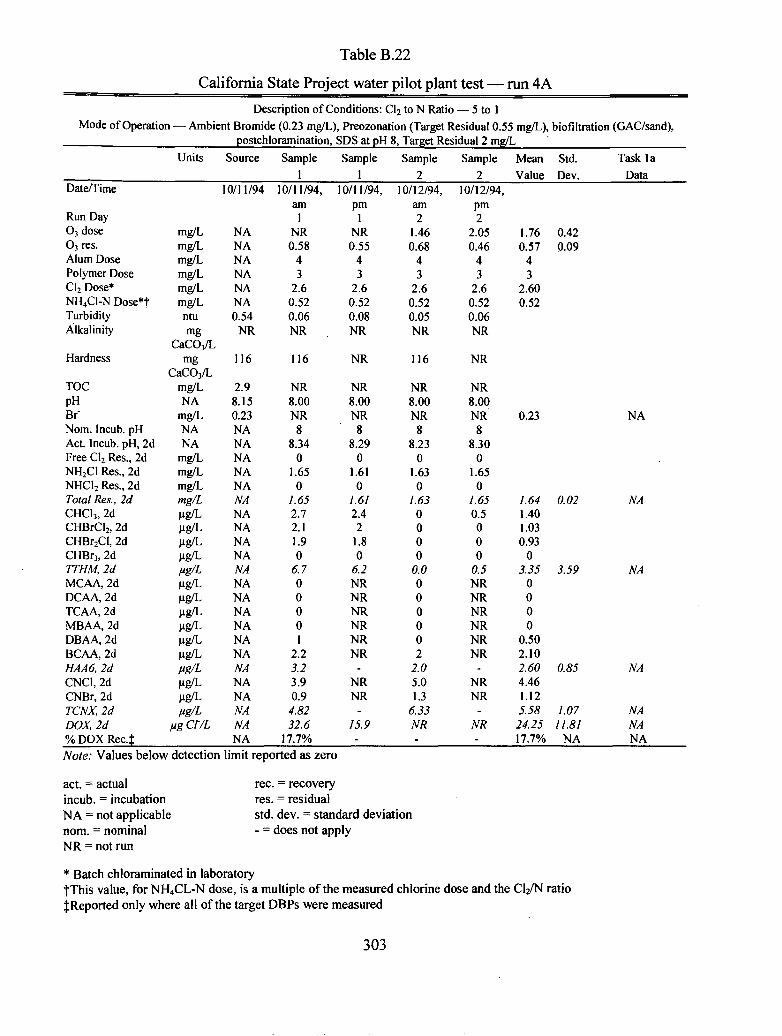
Table B.22
California State Project water pilot plant test — run 4ADescription of Conditions: C12 to N Ratio — 5 to 1
Mode of Operation — Ambient Bromide (0.23 mg/L), Preozonation (Target Residual 0.55 mg/L), biofiltration (GAC/sand), postchloramination, SDS at pH 8, Target Residual 2 mg/L
Date/Time
Run DayO3 doseO3 res.Alum DosePolymer DoseCI2 Dose*NH4CI-N Dose*tTurbidityAlkalinity
Hardness
TOCPHBfNom. Incub. pHAct. Incub. pH, 2dFree C12 Res., 2dNH2C1 Res., 2dNHC12 Res., 2dTotal Res., 2dCHC13 , 2dCHBrCl2, 2dCHBr2Cl, 2dCHBr3 , 2dTTHM, 2dMCAA, 2dDCAA, 2dTCAA, 2dMBAA, 2dDBAA, 2dBCAA, 2dHAA6, 2dCNCI, 2dCNBr, 2dTCNX, 2dDOX, 2d% DOX Rec.J
Units
mg/Lmg/Lmg/Lmg/Lmg/Lmg/Lntumg
CaCOj/Lmg
CaCO3/Lmg/LNA
mg/LNANA
mg/Lmg/Lmg/Lmg/Lug/Lug/Lug/Lug/L(•&!>ug/Lug/Lug/Lug/Lug/LUg/Lfg/Lug/Lug/LPg/L
ngcr/L
Source
10/11/94
NANANANANANA0.54
NR
116
2.98.150.23NANANANANANANANANANANANANANANANANANANANANANANA
Sample 1
10/11/94,am
1NR0.58
43
2.60.520.06NR
116
NR8.00NR
88.34
01.65
01.652.72.11.90
6.700001
2.23.23.90.9
4.8232.6
17.7%
Sample1
10/11/94,pm
1NR0.55
43
2.60.520.08NR
NR
NR8.00NR
88.29
01.61
01.612.42
1.80
6.2NRNRNRNRNRNR
-NRNR
-15.9
-
Sample2
10/12/94,am2
1.460.68
43
2.60.520.05NR
116
NR8.00NR
88.23
01.63
01.63
0000
0.0000002
2.05.01.3
6.33NR-
Sample2
10/12/94,pm2
2.050.46
43
2.60.520.06NR
NR
NR8.00NR
88.30
01.65
01.650.5000
0.5NRNRNRNRNRNR
-NRNR
-NR-
Mean Std. Task la Value Dev. Data
1.76 0.420.57 0.09
43
2.600.52
0.23 NA
1.64 0.02 NA1.401.030.93
03.35 3.59 NA
0000
0.502.102.60 0.85 NA4.461.125.58 1.07 NA24.25 11.81 NA17.7% NA NA
Note: Values below detection limit reported as zero
act. = actual incub. = incubation NA = not applicable nom. = nominal NR = not run
rec. = recoveryres. = residualstd. dev. = standard deviation- = does not apply
* Batch chloraminated in laboratoryf This value, for NH4CL-N dose, is a multiple of the measured chlorine dose and the C12/N ratio^Reported only where all of the target DBFs were measured
303

Table B.23 California State Project water pilot plant test — run 4A (repeat)
Mode of Operation — Ambient
Date/TimeRun DayO3 doseO3 res.Alum DosePolymer DoseC12 Dose*NH4C1-N Dose'tTurbidityAlkalinity
HardnessTOCPHBr"Nom. Incub. pHAct. Incub. pH, 2dFree C12 Res., 2dNH2C1 Res., 2dNHC12 Res., 2dTotal Res., 2dCHC1 3 , 2dCHBrCl2, 2dCHBr2Cl, 2dCHBr3 , 2dTTHM, 2dMCAA, 2dDCAA, 2dTCAA, 2dMBAA, 2dDBAA, 2dBCAA, 2dHAA6, 2dCNC1, 2dCNBr, 2dTCNX, 2dDOX, 2d% DOX Rec.J
Units
mg/Lmg/Lmg/Lmg/Lmg/Lmg/Lntumg
CaCO3/Lmg CaCO3/L
mg/LNA
mg/LNANA
mg/Lmg/Lmg/Lmg/Lug/Lug/Lug/Lug/Lfg/Lug/Lug/Lug/Lug/Lug/Lug/LPB/Lug/Lug/LPgSL
vg cr/L
Description of Conditions: C12 to N Ratio — 5 to 1 Bromide (0.25 mg/L), Preozonation (Target Residual 0.55 mg/L), bioflltration (GAC/sand), postchloramination, SDS at pH 8, Target Residual 2 mg/LSource
10/24/94
NANANANANANA0.54NR
109
7.850.25NANANANANANANANANANANANANANANANANANANANANANA
NA
Sample1
10/24/94, am1
1.20.643
2.60.520.05NR
109NR7.79NR
88.22
01.62
07.620.81.51.40
3.700000
1.87.84.10.44.5547.06.8%
Sample 1
10/24/94, pm1
1.680.48
43
2.60.520.09NR
NRNR7.83NR
88.21
01.70
01.701.71.31.10
4.1NRNRNRNRNRNR
-NRNR
-52.8
-
Sample 2
10/25/94, am2
1.830.48
43
2.60.520.05NR
115NR7.70NR
88.21
01.35
01.351.91.31.20
4.402001
1.74.74.81.1
5.9423.6
19.3%
Sample 2
10/25/94, pm2
1.83NR43
2.60.520.07NR
NRNR7.76NR
88.16
01.40
01.402.71.31.20
5.2NRNRNRNRNRNR
-NRNR
-47.0
-
Mean Value
1.640.52
43
2.600.52
0.25
7.521.781.351.23
04.35
01.00
00
0.501.753.254.470.785.25
42.6013.1%
Std. Task la Dev. Data
0.300.07
NA
0.77 NA
0.64 NA
2.05 NA
0.98 NA12.96 NA8.8% NA
Note: Values below detection limit reported as zeroact. = actual incub. = incubation NA = not applicable nom. = nominal NR = not run
rec. = recoveryres. = residualstd. dev. = standard deviation- = does not apply
* Batch chloraminated in laboratoryfThis value, for NH4CL-N dose, is a multiple of the measured chlorine dose and the C12/N ratioJ Reported only where all of the target DBPs were measured
304

Table B.24 California State Project water pilot plant test — run
Description of Conditions: Water - Mode of Operation — Ambient Bromide (0.23 mg/L),
4BC12 to N Ratio — 5 to 1 Preozonation (Target Residual 0.55 mg/L),
no biofiltration (laboratory filtration), postchloramination, SDS at pH 8, Target
Date/Time
Run DayO3 doseO3 res.Alum DosePolymer DoseC12 Dose*NH4C1-N Dose*fTurbidityAlkalinity
Hardness
TOCpHBr'Nom. Incub. pHAct. Incub. pH, 2dFree C12 Res., 2dNH2C1 Res., 2dNHC12 Res., 2dTotal Res., 2dCHC13 , 2dCHBrCl2, 2dCHBr2Cl, 2dCHBr3 , 2dTTHM, 2dMCAA, 2dDCAA, 2dTCAA, 2dMBAA, 2dDBAA, 2dBCAA, 2dHAA6, 2dCNC1, 2dCNBr, 2dTCNX, 2dDOX, 2d%DOX rec.J
Units
mg/Lmg/Lmg/Lmg/Lmg/Lmg/Lntumg
CaC03/Lmg
CaCO3/Lmg/LNA
mg/LNANA
mg/Lmg/Lmg/Lmg/LHg/LHg/Lug/Lug/Lfg/Lug/Lug/Lug/Lug/Lug/Lug/Lfg/Lug/Lug/Lfg/L
fgCr/L
Source
10/11/94
NANANANANANA0.5481
116
2.98.150.23NANANANANANANANANANANANANANANANANANANANANANANA
Sample1
10/11/94,am
1NR0.58
43
2.60.520.06NR
116
NR8.00NR
88.36
01.81
01.812.92
1.80
6.7000002
2.04.80.3
5.1342.0
12.6%
Sample1
10/11/94,pm
1NR0.55
43
2.60.520.08NR
NR
NR8.10NR
88.30
01.83
01.832.91.91.70
6.5 .NRNRNRNRNRNR
-NRNR
-47.7
-
Sample2
10/12/94,am2
1.460.68
43
2.60.520.05NR
116
NR7.95NR
88.24
01.81
01.81
1000
1.000000
2.12.14.01.1
5.04NR-
Sample2
10/12/94,pm2
2.050.46
43
2.60.520.06NR
NR
NR7.94NR
88.31
01.79
01.791.1000
1.1NRNRNRNRNRNR
-NRNR
-:NR
-
Residual 2 mg/LMean Std.Value Dev.
1.76 0.420.57 0.09
43
2.600.52
0.23
1.81 0.021.980.980.88
03.83 3.21
00000
2.052.05 0.074.400.695.09 0.0644.85 4.0312.6% NA
Task laData
NA
NA
NA
NA
NANANA
Note: Values below detection limit reported as zeroact. = actual incub. = incubation NA = not applicable
nom. = nominal NR = not run rec. = recovery
res. = residualstd. dev. = standard deviation- = does not apply
* Batch chloraminated in laboratorytThis value, for NH4CL-N dose, is a multiple of the measured chlorine dose and the C12/N ratio{Reported only where all of the target DBFs were measured
305

Table B.25 California State Project water pilot plant test — run 4B (repeat)
Description of Conditions: C12 to N Ratio — 5 to 1 Mode of Operation: Ambient Bromide (0.28 mg/L), Preozonation (Target Residual 0.55 mg/L),no biofiltration (laboratory filtration), postchloramination, SDS at pH 8, Target Residual 2 mg/L
Date/Time
Run DayO3 doseO3 res.Alum DosePolymer DoseC12 Dose*NH4C1-N Dose*fTurbidityAlkalinity
Hardness
TOCPHBr"Nom. Incub. pHAct. Incub. pH, 2dFree C12 Res., 2dNH2C1 Res., 2dNHC12 Res., 2dTotal Res., 2dCHC13 , 2dCHBrCl2, 2dCHBr2Cl, 2dCHBr3, 2dTTHM, 2dMCAA,2dDCAA, 2dTCAA, 2dMBAA,2dDBAA, 2dBCAA, 2dHAA6, 2dCNC1, 2dCNBr, 2dTCNX, 2dDOX, 2d% DOX Rec.tNote: Values belowact. = actualincub. = incubationNA = not applicable
Units
mg/Lmg/Lmg/Lmg/Lmg/Lmg/Lntumg
CaCO3/Lmg
CaC03/Lmg/LNA
mg/LNANA
mg/Lmg/Lmg/Lmg/Lug/Lug/Lug/Lug/Lfig/Lug/Lug/Lug/Lug/Lug/LHg/Lftg/Lug/Lug/Lftg/L
iig cr/Ldetection
Source
10/24/94
NANANANANANA0.5477
109
3.07.850.28NANANANANANANANANANANANANANANANANANANANANANANA
Sample1
10/24/94,am
11.20.643
2.60.520.05NR
109
NR7.79NR
88.23
01.83
07.831.051.31.20
3.60
2.400
1.31.85.54.40.65.07NR-
Sample1
10/24/94,pm
11.680.48
43
2.60.520.09NR
NR
NR7.83NR
88.21
01.78
07.784.31.200
5.5NRNRNRNRNRNR
-NRNR
.37.7
-
Sample2
10/25/94,am2
1.830.48
43
2.60.520.05NR
115
NR7.70NR
88.22
01.65
01.655.91.31.10
8.31
3.1000
1.85.96.31.17.4150.2
15.3%
Sample2
10/25/94,pm2
1.83NR
43
2.60.520.07NR
NR
NR7.76NR
88.14
01.71
07.77
0100
7.0NRNRNRNRNRNR
.NRNR
.29.7
-
Mean Std.Value Dev.
1.64 0.300.52 0.07
43
2.600.52
0.28
1.74 0.082.811.200.58
04.59 3.090.502.75
00
0.651.805.70 0.285.350.876.27 7.70
39.00 70.3815.3% NA
Task laData
NA
NA
NA
NA
NANANA
limit reported as zeronomNRrec.
. = nominal= no run= recovery
resstd
. = residual
. dev. = standard deviation- = does not apply
* Batch chloraminated in laboratoryfThis value, for NH4CL-N dose, is a multiple of the measured chlorine dose and the C12/N ratio{Reported only where all of the target DBFs were measured
306

Table B.26 California State Project water pilot plant test — run 5
Mode of Operation —
Date/Time
Run DayAlum DosePolymer DoseC12 DoseNH4C1-N Dose*TurbidityAlkalinity
Hardness
TOCPHBr"Nom. Incub. pHAct. Incub. pH, 2dFree C12 Res., 2dNH2 C1 Res., 2dNHCl2 Res.,2dTotal Res., 2dCHC13 , 2dCHBrCl2, 2dCHBr2Cl, 2dCHBr3 , 2dTTHM, 2dMCAA, 2dDCAA, 2dTCAA, 2dMBAA, 2dDBAA, 2dBCAA, 2dHAA6, 2dCNC1, 2dCNBr, 2dTCNX, 2dDOX, 2d% DOX Rec.f
Units
mg/Lmg/Lmg/Lmg/Lntumg
CaCO3/Lmg
CaCOj/Lmg/LNA
mg/LNANA
mg/Lmg/Lmg/Lmg/Lug/Lug/Lug/Lug/Lfg/Lug/Lug/Lug/Lug/Lug/Lug/LUg/Lug/Lug/Lfg/L
pgcr/L
Description of Conditions: C12 to N Ratio — 3 to 1 - Ambient Bromide (0.28 mg/L), Conventional Alum Treatment, Prechloramination,
SDS at pH 8, Target Residual 2 mg/LSource
10/25/94
NANANANA0.5477
109
NR7.850.28NANANANANANANANANANANANANANANANANANANANANANANA
Sample 1
10/25/94,am
143
3.21.140.06NR
115
NR7.82NR
87.80
02.79
02.79
01.300
1.31.95.100
1.93.512.43.01.0
3.9865.56.2%
Sample1
10/25/94,pm
143
3.31.040.07NR
NR
NR7.81NR
87.67
02.78
02.78
01.600
1.6NRNRNRNRNRNR
-NRNR
-33.7
-
Sample 2
10/26/94,am243
3.41.040.06NR
NR
NR7.81NR
87.91
02.81
02.81
01.300
1.31
5.200
2.74
12.9NRNR
-31.1
-
Sample 2
10/26/94,pm243
2.880.990.07NR
NR
NR7.85NR
87.77
02.55
02.55
01.200
1.2NRNRNRNRNRNR
-NRNR
-47.5
-
Mean Std. Value Dev.
43
3.20 1.061.05 0.50
0.28
2.73 0.120
1.3500
1.35 0.171.455.15
00
2.303.7572.<55 0:353.020.963.98 NA
44.44 15.786.2% NA
Task la Data
0.10
2.48
0.70
4.90
2.8042.54.3%
Note: Values below detection limit reported as zeroact. - actualincub. = incubationNA = not applicablenom. = nominalNR = not runrec. = recoveryres. = residualstd. dev. = standard deviation- = does not apply* This value, for NH4CL-N dose, is a multiple of the measured chlorine dose and the C12/N ratio t Reported only where all of the target DBPs were measured
307


REFERENCES
Aiken, G.R. 1984. Evaluation of Ultrafiltration for Determining Molecular Weight of Fulvic
Acid. Environ. Sci. & Technol, 18(12):978-981.
Amy, G.L., J.H. Greenfield, and W.J. Cooper. 1990. Organic Halide Formation During Water
Treatment Under Free Chlorine Versus Chloramination Conditions. In Water
Chlorination Chemistry, Environmental Impact and Health Effects. Vol. 6. Edited by
R.L. Jolley, L.W. Condie, J.D. Jonson, S. Katz, R.A. Minear, J.S. Mattice, and V.A.
Jacobs. Chelsea, Mich.: Lewis Publishers.
APHA, AWWA, and WEF (American Public Health Association, American Water Works
Association, and Water Environment Federation). 1992. Standard Methods for the
Examination of Water and Wastewater. 18th ed. Washington, D.C.: APHA.
APHA, AWWA, and WPCF (American Public Health Association, American Water Works
Association, and Water Pollution Control Federation). 1989. Standard Methods for the Examination of Water and Wastewater. 17th ed. Washington, D.C.: APHA.
Barrett, S.E., M.K. Davis, and M.J. McGuire. 1985. Blending of Chloraminated and Chlorinated
Waters. Jour. AWWA, 77(1):50-61.
Barth, R.C., and P.S. Fair. 1992. Comparison of the Microextraction Procedure and Method 552
for the Analysis of HAAs and Chlorophenol. Jour. AWWA, 84(11):94.
Bruchet, A., K. N'Guyen, J. Mallevialle, and C. Anselme. 1989. Identification and Behavior of
lodinated Haloform Medicinal Odor. In Proc. 1989 AWWA Sunday Seminar. Denver,
Colo.: AWWA.
309

Bruchet, A., E. Costentin, M.F. Legrand, and J. Mallevialle. 1992. Influence of the Chlorination
of Natural Nitrogenous Organic Compounds on Tastes and Odors in Finished Drinking
Waters. Wat. Sci. Tech., 25(2):323-333.
Bruchet, A., D. Khiari, and I.H. Suffet. 1995. Monitoring and Analysis. In Advances in Taste- and-Odor, Treatment and Control. Edited by I.H. Suffet, J. Mallevialle, E. Kawczynski.
Denver, Colo.: AWWA.
Budde, W.L., T.D. Behymer, T.A. Bellar, and J.S. Ho. 1990. Liquid Chromatography-Mass
Spectrometry: An Emerging Technology for Novolative Compounds. Jour. AWWA, 82(9):60-65.
Bull, R.L., and L.J. McCabe. 1985. Risk Assessment Issues in Evaluating the Health Effects of
Alternate Means of Drinking Water Disinfection. In Water Chlorination Chemistry, Environmental Impact and Health Effects. Vol. 5. Edited by R. Jolley, R.J. Bull, W.P.
Davis, S. Katz, M.H. Roberts, and V.A. Jacobs. Chelsea, Mich.: Lewis Publishers.
Burttshell, R.H., A.S. Rosen, P.M. Middleton, and M.B. Ettinger. 1959. Chlorine Derivative of Phenol Causing Taste and Odor. Jour. AWWA, 51(2):205-214.
Campbell, J.A., M.A. LaPack, T.L. Peters, and T.A. Smock. 1987. Gas Chromatography/Mass
Spectrometry Identification of Cyclohexene Artifacts Formed During Extraction of Brine Samples. Environ. Sci. & Technol, 21(1):110-112.
Clark, M.M., and P. Fiessinger. 1991. Mixing and Scaleup. In Coagulation and Flocculation. Edited by A. Amirtharajah, M.M. Clark, and R.R. Trussell. Denver, Colo.: American
Water Works Association.
310

Coffey, B.M., S.W. Krasner, M.J. Sclimenti, P.A. Hacker, and J.T. Gramith. 1996. The Effects of Filtration Media Type and Water Temperature on the Removal of Ozone By-Products. Paper presented at the Third International Slow Sand/Advanced Biological Filtration Conference, April 22-24 at London, U.K.
Conyers, B., and F.E. Scully Jr. 1993. N-Chloraldimines, 3: Chlorination of Phenylalanine in Model Solutions and in Wastewater. Environ. Sci. & Technol., 27(2):261-266.
Cornwell, D.A., and M.M. Bishop. 1983. Determining Velocity Gradients in Laboratory and Full-Scale Systems. Jour. AWWA, 75(9):470-475.
Coughlan, J., and M.H. Davis. 1983. Effect of Chlorination on Entrained Plankton at Several United Kingdom Coastal Power Stations. In Water Chlorination: Environmental Impacts and Health Effects. Vol. 4. Edited by R.L. Jolley, W.A. Brungs, J.A. Cotruvo, R.B. dimming, J.S. Mattice, and V.A. Jacobs. Ann Arbor, Midi.: Ann Arbor Science Publishers.
Cowman, G.A., and P.C. Singer. 1996. Effect of Pre-Ozonation on Haloacetic Acid Speciation in Chlorinated Waters Containing Bromide. In Proc. of the 1994 AWWA Water Quality Technology Conference. Denver, Colo.: AWWA.
Crochet, R.A., and P. Kovacic. 1973. Conversion of 0-Hydroxyaldehydes and Ketones Into 0-Hydroxyanilides by Monochloramine. J. Am. Chem. Soc. Commun., 19:716-717.
Croue, J.-P., and D.A. Reckhow. 1989. Determination of Chlorination Byproducts With Sulfite. Environ. Sci. & Technol., 23(11):1412-1419.
Di Corcia, A., and M. Marchetti. 1991. Multiresidue Method for Pesticides in Drinking Water Using a Graphitized Carbon Black Cartridge Extraction and Liquid Chromatography Analysis. Anal. Chem., 63:580.
311

Dietrich, A.M., R.F. Christman, and G.S. Dwell. 1988. Gas Chromatographic/Mass Spectrometric Identification of Chlorinated and Oxygenated Cyclohexene Artifacts Formed During the Analysis of Chlorinated Waters. Biomed. & Enviro. Mass Spec., 15:453-458.
Dunkelberger, G., N. Grace, E.M. Aieta, and B. Eskuchen. 1992. Water Quality Performance of a Full Scale Ozonation Facility. In Proc. 1992 Pan American Com. Conf. Pasadena, Calif.: International Ozone Association.
Edzwald, J.K., and I.E. Van Benschoten. 1990. Aluminum Coagulation of Natural Organic Matter. In Chemical Water and Wastewater Treatment. Edited by H.H. Hahn and R. Klute. Heidelberg, Germany: Springer-Verlag.
Fayad, N.M. 1988. Gas Chromatography/Mass Spectroscopy Identification of Artifacts Formed in Methylene Chloride Extracts of Saline Water. Enviro. Sci. & Technol, 22(11): 1347- 1348.
Fleischacker, S.J., and S.J. Randtke. 1983. Formation of Organic Chlorine in Public Water Supplies. Jour. AWWA, 75(3):132-138.
Fujioka, R.S., K.M. Tenno, and P.C. Loh. 1983. Mechanism of Chloramine Inactivation of Poliovirus: A Concern for Regulators? In Water Chlorination: Environmental Impacts and Health Effects. Vol. 4. Edited by R.L. Jolley, W.A. Brungs, J.A. Contruvo, R.B. Gumming, J.S. Mattice, and V.A. Jacobs. Ann Arbor, Mich.: Ann Arbor Science Publishers.
Gazda, M., L.E. Dejarmi, T.K. Choudhury, R.G. Cooks, and D.E. Margerum. 1993. Mass Spectrometric Evidence for the Formation of Bromochloramine and N-Bromo-N- Chloromethylamine in Aqueous Solution. Environ. Sci. Technol., 27(3):557-561.
312

Glaze, W.H., and H.S. Weinberg. 1993. Identification and Occurrence of Ozonation By-Products in Drinking Water. Denver, Colo.: AWWARF and AWWA.
Godefroot, M., M. Stechele, P. Sandra, and M. Verzele. 1982. A New Method for the Quantitative Analysis of Organochlorine Pesticides and Polychlorinated Biphenyls. Jour. High Resol. Chrom. Commun., 5(2):75-79.
Gordon, G., W.J. Cooper, R.G. Rice, and G.E. Pacey. 1987. Disinfectant Residual Measurement Methods. Denver, Colo.: AWWARF and AWWA.
Gould, J.P., L.E. Fitchhorn, and E. Urheim. 1983. Formation of Brominated Trihalomethanes: Extent and Kinetics. In Water Chlorination: Environmental Impact and Health Effects. Vol. 4. Edited by R.L. Jolley, W.A. Brungs, R.B. Gumming, and V.A. Jacobs. Ann Arbor, Mich.: Ann Arbor Science Publishers.
Haag, W.R. 1980. Formation of N-Bromo-N-Chloramines in Chlorinated Saline Waters. In Water Chlorination: Environmental Impacts and Health Effects. Vol. 3. Edited by R.L. Jolley, W.A. Brungs, R.B. Gumming, and V.A. Jacobs. Ann Arbor, Mich.: Ann Arbor Science Publishers.
Hand, V.C., and D.W. Margerum. 1983. Inorganic Chemistry, 12:1449-1456.
Hansson, C.R., M.J. Henderson, P. Jack, and R.D. Taylor. 1987. lodoform Taste Complaints in Chloramination. Wat. Res., 21 (10): 1265-1271.
Henderson, J.E., G.R. Peyton, and W.H. Glaze. 1976. Identification and Analysis of Organic Pollutants in Water. Edited by L.H. Keith. Ann Arbor, Mich.: Ann Arbor Science Publishers.
Hrudey, S.E., A. Gac, and S.A. Daignault. 1988. Potent Odour-Causing Chemicals Arising From Drinking Water Disinfection. Wat. Sci. & Techol., 20(8/9):55-61.
313
Hudson, H.E., Jr. 1981. Water Clarification Processes: Practical Design and Evaluation. New
York: Van Nostrand Reinhold.
Hureiki, L., J.P. Croue, and B. Legube. 1994. Chlorination Studies of Free and Combined Amino
Acids. Wat. Res., 28(12):2521-2531.
Ibrahim, E.A., and I.H. Suffet. 1987a. Evaporative Concentration System for Trace Organic
Analysis. Anal. Chem, 59(17): 2091-2098.
Ibrahim, E.A., R.L. Lippincott, L. Brenner, I. Suffet, and R.E. Hannah. 1987b. The Effect of
Cyclohexene, a Preservative in Dichloromethane, on the Liquid-Liquid Extraction and
Analysis of Chlorinated Drinking Water. Jour. ofChrom., 393:237-253.
Ingols, R.S., H.A. Wyckoff, T.W. Kethley, H.W. Hodgden, E.L. Fincher, J.C. Hildebrand, and
J.E. Mandel. 1953. Bactericidal Studies on Chlorine. Ind Eng. Chem., 45(5):996-1000.
Isaac, R.A., and J.C. Morris. 1983a. Transfer of Active Chlorine and Chloramine to Nitrogenous
Organic Compounds, 1: Kinetics. Environ. Sci. & TechnoL, 17(12):738-742.
-. 1983b. Modeling of Reactions Between Aqueous Chlorine and Nitrogenous
Compounds. In Water Chlorination:Environmental Impact and Health Effects. Vol. 4.
Edited by R.L. Jolley, W.A. Brungs, J.A. Cotruvo, R.B. Gumming, J.S. Mattice, and V.A.
Jacobs. Ann Arbor, Mich.: Ann Arbor Science Publishers.
-. 1985. Transfer of Active Chlorine From Chloramine to Nitrogenous Organic
Compounds, 2: Mechanism. Environ. Sci. TechnoL, 9(9):810-814.
Jacangelo, J.G., N.L. Patania, K.M. Reagan, E.M. Aieta, S.W. Krasner, and M.J. McGuire. 1989.
Ozonation: Assessing Its Role in the Formation and Control of Disinfection By-Products.
Jour. AWWA,
314

Jafvert, C.T., and R.L. Valentine. 1992. Reaction Scheme for the Chlorination of Ammoniacal
Water. Environ. Sci. & Technol., 26:577-586.
Janda, V., and F. Pehal. 1984. Isolation, Concentration and Gas-Chromatographic Determination of C4-C12 Fatty Acids in Water and Sludge. Jour. High Resol. Chrom. Commun., 7:540.
Jensen, J.N., J.J. St. Aubin, R.F. Christman, and J.D. Johnson. 1985. Characterization of the
Reaction Between Monochloramines and Isolated Fulvic Acid. In Water Chlorination Chemistry, Environmental Impact and Health Effects. Vol. 5. Edited by R.L. Jolley, R.J.
Bull, W.P. Davis, S. Katz, M.H. Roberts, and V.A. Jacobs. Chelsea, Midi.: Lewis
Publishers.
Jersey, J.A. 1991. Development and Application of a Method for Analysis of N-Chloramines.
Ph.D. diss., University of North Carolina at Chapel Hill, Chapel Hill, N.C.
Jersey, J.A., and J.D. Johnson. 1992. Analysis of N-Chloramines in Chlorinated Wastewater and Surface Water by On-Line Enrichment HPLC With Post-Column Reaction Electrochemical Detection. In Proc. of the Nineteenth Annual A WWA Water Quality Technology Conference. Denver, Colo.: AWWA.
Johnson, J.D., and W. Sun. 1975. Bromine Disinfection of Wastewater. In Disinfection of Water and Wastewater. Edited by J.D. Johnson. Ann Arbor, Mich.: Ann Arbor Science Publishers.
Jolley, R.L., and J.H. Carpenter. 1983. A Review of the Chemistry and Environmental Fate of Reactant Oxidant Species in Chlorinated Water. In Water Chlorination: Environmental Impacts and Health Effects. Vol. 4. Book 1. Edited by R.L. Jolley, W.A. Brungs, J.A.
Cotruvo, R.B. Gumming, J.S. Mattice, and V.A. Jacobs. Ann Arbor, Mich.: Ann Arbor
Science Publishers.
315

Kanniganti, R., J.D. Johnson, L.M. Ball, and M.J. Charles. 1992. Identification of Compounds in
Mutagenic Extracts of Aqueous Monochloraminated Fulvic Acid. Environ. Sci. Technol,
26(10): 1998-2004.
Koch, B., E.W. Crofts, W.K. Schimpff, and M.K. Davis. 1989. Analysis of Halogenated
Disinfection By-Products by Capillary Chromatography. In Proc. of the Seventeenth
Annual AWWA Water Quality Technology Conference. Denver, Colo.: AWWA.
Kotiaho, T., M.J. Hayward, and R.G. Cooks. 1991. Direct Determination of Chlorination
Products of Organic Amines Using Membrane Introduction Mass Spectrometry. Anal.
Chem., 63:1794-1801.
Kotiaho, T., J.M. Wood, P.L. Wick Jr., L.E. Dejarme, A. Ranasingh, R.G. Cook, and H.P.
Ringhand. 1992. Time Persistence of Monochloramine in Human Saliva and Stomach
Fluid. Environ. Sci. Technol., 26(2):302-306.
Krasner, S.W., M.J. McGuire, J.G. Jacangelo, N.L. Patania, K.M. Reagan, and E.M. Aieta.
1989a. The Occurrence of Disinfection By-Products in US Drinking Water. Jour. AWWA,
Krasner, S.W., M.J. Sclimenti, and C.J. Hwang. 1989b. Experiences With Implementing a
Laboratory Program to Sample and Analyze for Disinfection By-Products in National
Study. In Disinfection By-Products: Current Perspectives. Denver, Colo.: AWWA.
Krasner, S.W., R. Chinn, C.J. Hwang, and S.E. Barrett. 1990. Analytical Methods for
Brominated Organic Disinfection By-Products. In Proc. of the Eighteenth Annual A WWA
Water Quality Technology Conference. Denver, Colo.: AWWA.
Krasner, S.W., G.T. Gramith, E.G. Means, N.L. Patania, I.N. Najm, and E.M. Aieta. 199 la.
Formation and Control of Brominated Ozone By-Products. In Proc. of the Twentieth-
Annual AWWA Water Quality Technology Conference. Denver, Colo.: AWWA.
316

Krasner, S.W., C.J. Hwang, T.K. Lieu, and M.J. West. 1991b. Development of a Bench-Scale
Method to Investigate the Factors That Impact Cyanogen Chloride Production in
Chloraminated Waters. In Proc. of the Twentieth Annual AWWA Water Quality
Technology Conference. Denver, Colo.: AWWA.
Krasner, S.W., H.S. Weinberg, W.H. Glaze, and M.J. Sclimenti. 1993. Formation and Removal
of Aldehydes in Plants That Use Ozonation. Jour. AWWA, 85(5):72-85.
Kuo, C.Y., S.W. Krasner, G.A. Stalker, and H.S. Weinberg. 1990. Analysis of Inorganic
Disinfection By-Products in Ozonated Drinking Water by Ion Chromatography. In Proc. AWWA Water Quality Technology Conference. Denver, Colo.: AWWA.
Lai, R.J., H.E. Hudson Jr., and J.E. Singley. 1975. Velocity Gradient Calibration of Jar-Test
Equipment. Jour. AWWA, 67(10):553-557.
Le Cloirec, C.P. Le Cloirec, J. Morvan, and G. Martin. 1983. Forms of Organic Nitrogen in
Surface Waters: Crude Waters or in Drinking Water Treatment Steps. Rev. Fr. Sci. Eau., 2:25-39.
Le Cloirec, C., and G. Martin. 1985. Evolution of Amino Acids in Water Treatment Plants and
the Effect of Chlorination on Amino Acids. In Water Chlorination: Environmental Impact and Health Effects. Vol. 5. Edited by R.L. Jolley, R.J. Bull, W.P. Davis, S. Katz,
M.H. Roberts Jr., and V.A. Jacobs. Chelsea, Mich.:Lewis Publishers.
Lickens, S.T., and G.B. Nickerson. 1964. Detection of Certain Hop Oil Constituents in Brewing
Products. In Proc. Am. Soc. Brew. Chem. St. Paul, Minn.: Am. Soc. Brew. Chem.
Lieu, T.K., and M.J. West. 1993. Low Nanogram LC/MS Performance Through Innovative
Modifications to Particle Beam Probe Inlet Assembly. Paper presented at the 1993 Pittsburgh Conference on Analytical Chemistry and Applied Spectroscopy, March 10 at
Atlanta, Ga.
317

Logan, B.E., and Q. Jiang. 1990. Molecular Size Distributions of Dissolved Organic Matter.
Jour. ofEnv. Eng., 116(6): 1046-1063.
Lykins, B.W., W.E. Koffsey, and K.S. Patterson. 1994. Alternative Disinfectants for Drinking
Water Treatment. Jour. ofEnv. Eng., 120(4):745-758.
Mallevialle, J., C. Anselme, and S.W. Maloney. 1985. Identification of Taste and Odor
Compounds in the Drinking Waters of France. In Proc. of the Twelfth Annual AWWA
Water Quality Technology Conference. Denver, Colo.: AWWA.
McCormick, E.F., B. Conyers, and F.E. Scully Jr. 1993. N-Chloraldimines, 2: Chlorination of
Valine in Model Solutions and in a Wastewater. Environ. Sci. & Technol, 27(2):255-260.
Metropolitan Water District of Southern California (MWDSC) and James M. Montgomery
(JMM), Consulting Engineers, Inc. 1989. Disinfection By-Products in United States
Drinking Waters. Final Report for United States Environmental Protection Agency and
Association of Metropolitan Water Agencies. La Veme, Calif.: MWDSC Water Quality Division.
Miltner, R.J., H.M. Shukairy, and R.S. Summers. 1992. Disinfection By-Product Formation and
Control and Biotreatment. Jour. AWWA, 84(11):53-62.
Minisci, F., and R. Galli. 1965. A New, Highly Selective, Type of Aromatic Substitution,
Homolytic Amination of Phenolic Ethers. Tetrahedron Lett., 8:433-436.
Morris, J.C., and R.A. Issac. 1983. A Critical Review of Kinetic and Thermodynamic Constants
for the Aqueous Chlorine-Ammonia System. In Water Chlorination: Environmental
Impacts and Health Effects. Vol. 4. Edited by R.L. Jolley, W.A. Brungs, J.A. Cotruvo,
R.B. Gumming, J.S. Mattice, and V.A. Jacobs. Ann Arbor, Mich.: Ann Arbor Science
Publishers.
318

Ohya, T., and S. Kanno. 1985. Formation of Cyanide Ion or Cyanogen Chloride Through the
Cleavage of Aromatic Rings by Nitrous Acid or Chlorine, VIII: On the Reaction of
Humic Acid With Hypochlorous Acid in the Presence of Ammonium Ion. Chemosphere,
Onuska, F.I., and K.A. Terry. 1985. Determination of Chlorinated Benzenes in Bottom
Sediment Samples by WCOT Column Gas Chromatography. Anal. Chem., 57(4):801.
Owen, D.M., G.L. Amy, and Z.K. Chowdhury. 1993. Characterization of Natural Organic
Matter and Its Relationship to Treatability. Denver, Colo.: AWWARF and AWWA.
Palin, A.T. 1975. Current DPD Methods for Residual Halogen Compounds and Ozone in Water.
Jour. AWWA, 67(l):32-33.
Pederson, E.J., III, E.T. Urbansky, B.J. Marinas, and D.W. Margerum. 1995. Formation of
Cyanogen Chloride From the Reaction of Monochloramine and Formaldehyde. In
Preprints of Papers Presented at 210th ACS Nat'1 Mtg. Milwaukee, Wis.: University of
Wisconsin-Milwaukee.
Pereira, W.E., Y. Hoyano, R.E. Summons, V.A. Bacon, and A.M. Duffield. 1973. Chlorination
Studies II: The Reaction of Aqueous Hypochlorous Acid With a Amino Acids and
Dipeptides. Biochimica et Biophysica Acta, 313:1 70- 1 80.
Reckhow, D.A., and P.C. Singer. 1984. The Removal of Organic Halide Precursors by
Preozonation and Alum Coagulation. Jour. AWWA, 76(4): 151.
Richard, J.J., and G.A. Junk. 1984. Steam Distillation, Solvent Extraction, and Ion Exchange for
Determining Polar Organics in Shale Process Waters. Anal. Chem., 56(9): 1625- 1628.
319
Rook, J.J. 1980. Possible Pathways for the Formation of Chlorinated Degradation Products During Chlorination of Humic Acids and Resorcinol. In Water Chlorination: Chemistry, Environmental Impacts and Health Effects. Vol. 3. Edited by R.L. Jolley, W.A. Brungs, R.B. Gumming, and V.A. Jacobs. Ann Arbor, Mich.: Ann Arbor Science Publishers.
Schroder, H., Jr. 1991. Polar, Hydrophilic Compounds in Drinking Water Produced From Surface Water. J. Chromat., 554:251-266
Sclimenti, M.J., C.J. Hwand, G.E. Speitel Jr., and A.C. Deihl. 1994. The Simultaneous Determination of Cyanogen Chloride and Cyanogen Bromide in Chloraminated Waters by a Simplified Microextraction GC/ECD Technique. In Proc. AWWA Water Quality Technology Conference. Denver, Colo.: AWWA.
Shukairy, H.M., and R.S. Summers. 1992. The Impact of Preozonation and Biodegradation on Disinfection By-Product Formation. Water Research, 26(9): 1217-1227.
Shukairy, H.M., R.J. Miltner, and R.S. Summers. 1994. Bromide's Effect on DBP Formation, Speciation, and Control: Part 1, Ozonation. Jour. AWWA, 86(6):72
Singer, P.C., A. Acolenshy, and A. Greiner. 1992. Relationships Among Disinfection By- Products in Chlorinated Drinking Waters. In Proc. of the Twentieth Annual A WWA Water Quality Technology Conference. Denver, Colo.: AWWA.
Smith, M.E., G.A. Cowman, and P.C. Singer. 1993. The Impact of Ozonation and Coagulation on Disinfection By-Product Formation. In Proc. 1993 AWWA Ann. Conf. (Water Research). Denver, Colo.: AWWA.
Snyder, M.P., and D.W. Margerum. 1982. Kinetics of Chlorine Transfer From Chloramine to Amines, Amino Acids, and Peptides. Inorganic Chemistry, 21(7):2545-2550.
320

Spotte, Stephen. 1979. Seawater Aquariums: The Captive Environment. New York: Wiley- Interscience.
Stevens, A.A., L.A. Moore, and R.J. Miltner. 1989. Formation and Control of Non- Trihalomethane Disinfection By-Products. Jour. AWWA, 81(8): 54-60.
Sugam, R., and M.H. Helz. 1980. Seawater Chlorination: A Description of Chemical Speciation. In Water Chlorination: Chemistry, Environmental Impacts and Health Effects. Vol. 3. Edited by R.L. Jolley, W.A. Brungs, R.B. Gumming, and V.A. Jacobs. Chelsea, Mich.: Lewis Publishers.
Symons, J.M., A.A. Stevens, R.M. Clark, E.E. Geldreich, O.T. Love Jr., and J. DeMarco. 1981. Treatment Techniques for Controlling Trihalomethanes in Drinking Water. EPA-600/2- 81/156. September. Cincinnati, Ohio: USEPA.
Symons, J.M., S.W. Krasner, L.A. Simms, and M.J. Sclimenti. 1993. Measurement of THM and Precursor Concentrations Revisited: The Effect of Bromide Ion. Jour. AWWA, 85(1)51- 62.
Symons, J.M., G.E. Speitel Jr., A.C. Diehl, and H.W. Sorensen Jr. 1994. Precursor Control in Waters Containing Bromide. Jour. AWWA, 86(6):48.
USEPA (US Environmental Protection Agency). 1986. Method 9020. Total Organic Halides (TOX). In Test Methods for Evaluating Solid Waste, Vol. 1C: Laboratory Manual Physical/Chemical Methods. Washington, D.C.: USEPA, Office of Solid Waste and Emergency Response.
-. 1993. Determination of Inorganic Anions by Ion Chromatography. Methods for the Determination of Inorganic Substances in Environmental Samples. EPA/600/R-93,August 1993, P894-121811. Cincinnati, Ohio: USEPA.
321

-. 1994a. DBP/ICR Analytical Methods Guidance Manual: Public Comment Draft. EPA 814/P-94-001. Washington, D.C.: U.S. Environmental Protection Agency, Office of
Water.
-. 1994b. National Primary Drinking Water Regulations. Disinfectants and Disinfection Byproducts; Proposed Rule. Fed. Reg., 59(145):38668.
Valentine, R.L. 1986. Bromochloramine Oxidation of N,N-Diethyl-p-Phenylenediamine in the Presence of Monochloramine. Environ. Sci. & Technol, 20(2):166-170.
Valentine, R.L., and C.T. Jafvert. 1988. General Acid Catalysis of Monochloramine Disproportionation. Environ. Sci. & Technol, 22(6):691-696.
Wajon, I.E., and J.C. Morris. 1980. Bromamination Chemistry: Rates of Formation of NF^Br and Some N-Bromamino Acids. In Water Chlorination: Chemistry, Environmental Impacts and Health Effects. Vol. 3. Edited by R.L. Jolley, W.A. Brungs, R.B. Gumming, and V.A. Jacobs. Ann Arbor, Mich.: Ann Arbor Science Publishers.
Weinberg, H.S., W.H. Glaze, S.W. Krasner, and M.J. Sclimenti. 1993. Formation and Removal of Aldehydes in Plants That Use Ozonation. Jour. AWWA, 85(5):72-85.
White, G.C. 1992. Handbook of Chlorination and Alternative Disinfectants. 3rd ed. New York: Van Nostrand Reinhold.
Wolfe, R.L., N.R. Ward, and B.H. Olson. 1985. Interference in the Bactericidal Properties of Inorganic Chloramines by Organic Nitrogen Compounds. Environ. Sci. & Technol., 19(12):! 192-1195.
Yoon., J., and J.N. Jensen. 1993a. Analysis of Organic and Inorganic Monochloramine by HPLC. In Proceedings of the 1992 AWWA Water Quality Technology Conference. Sunday Seminar. Denver, Colo.: AWWA.
322

-. 1993b. Analysis of Organic and Inorganic Monochloramines by HPLC. Environ. Sci. & Technol, 27(2):403-409.
Young, M.S., D.M. Mauro, P.C. Uden, and D.A. Reckhow. 1995. The Formation of Nitriles and Related Halogenated Disinfection By-Products in Chlorinated and Chloraminated Water: Application of Microscale Analytical Procedures. In Preprints of Papers Presented at 210th ACS Nat'I Mtg. Milwaukee, Wis.: University of Wisconsin-Milwaukee.
323


ABBREVIATIONS
AC
ACS
ADJ
amu
AMW
AWWA
AWWARF
BAA
BCAA
BDL
CAA
carbopak-BCH2Br2
CH2ClBrCLAAs
CLAMs
CLPs
cm
CNX
CNX-Br
CNX-C1
CNXOX
cone.
CP CSPW
CT °C
d DAM
analytical columnAmerican Chemical Societyadjustment
atomic mass unitapparent molecular weight
American Water Works Association
American Water Works Association Research Foundation
bromoacetic acid
bromochloroacetic acid
below detection limit
chloroacetic acidgraphitized carbondibromomethanebromochloromethanechlorinated amino acidschlorinated alkylamineschlorinated peptides
centimeter
cyanogen halide
molar concentration of bromine in cyanogen halidemolar concentration of chlorine in cyanogen halideorganic halogen contributed by CNXconcentrationpermeate concentrationCalifornia State Project water
concentration times timedegrees Celsius
daydiazomethane
325

DBAA
1,2-DBP
DBF
DBPFP
DBPOX
DBPOXFPDCAA
DCAN
DIDOC
DOX
DOX2
DOXFP
DOXFP4
DPD
DXAA
ECBCDEl
ESI
eV
F
FP
ft
g G
GAC
GC
gpm
dibromoacetic acid
1,2-dibromopropane
disinfection by-product
disinfection by-product formation potential
organic halogen contributed by DBFsdisinfection by-product organic halogen formation potentialdichloroacetic acid
dichloroacetonitriledeionizeddissolved organic carbon
dissolved organic halogen
dissolved organic halogen concentration after 2 daysdissolved organic halogen formation potential
4-day dissolved organic halide formation potential
JVJV-diethyl-p-phenylenediamine
dihalogen-substituted acetic acidenrichment columnelectron capture detectorelectron impact
electrospray ionizationelectron volt
fractional reduction in retentate volumeformation potential
foot
gram
mean velocity gradientgranular activated carbon
gas chromatograph; gas chromatographygallons per minute
326
hHAA
HAAFP4
HAAS
HAA6
HAA6-Br
HAA6-C1
HAA6OXHAN
HPLC
hr
1C
ID
I.D.
in.
INJ
I.S.
K
kg
KI
L
LAW
LC
LH
LHW
LLElow/delay
m
hour
haloacetic acid
4-day haloacetic acid formation potential
sum of the mass concentrations of five commonly
measured haloacetic acids
sum of the mass concentrations of the six commonly measured
haloacetic acids (MCAA, MBAA, DCAA, DBAA, BCAA, TCAA)
total HAA6 bromine molar concetration
total HAA6 chlorine molar concentration
organic halogen contributed by HAA6haloacetonitrile
high pressure liquid chromatographyhour
ion chromatograph; ion chromatography
inner diameter
inner diameterinch
injector
internal standard
1,000
kilogram
potassium iodide; potassium iodide method
liter
Lake Austin water
liquid chromatograph; liquid chromatography
Lake Houston
Lake Houston water
liquid-liquid extractionlow with delay
meter
327
M
MBMBAA
MCAA
MCL
MDL
med./delay
mg
min
min.
mmmM
mmole
mL
MS
MTBE
MW
MWC
MWDSC
MXAA
m/zn
n
n' (3/6)
N
NA
ND
ng
molar
mass balance
monobromoacetic acid
monochloroacetic acid
maximum contaminant level
method detection limit
medium with delay
milligram
minute
minute
millimeter
millimolar
millimole
milliliter
mass spectrometer; mass spectrometrymethyl ter/-butyl ether
molecular weight
molecular weight cut off
Metropolitan Water District of Southern Californiamonohalogen-substituted acetic acid
mass-to-charge ratio
degree of bromination; sample size
bromine incorporation factor
bromine incorporation factor for the three brominated
haloacetic acids
normal
not analyzed or not available
not detected
nanogram
328

NIST
nm
NOM
NPOXNQ
NTUntu
OPW
P P
PAC
PB
pH
ppm
psi
QA/QCr
randr2
RR2
sec
SDE
SDS
SPEB
std. dev.sur.
SUVASW
SWTR
t
National Institutes of Standards and Testingnanometernatural organic matternon-purgeable organic halogennot quantitatednephelometric turbidity unitnephelometric turbidity unitorganic-pure waterpermeation coefficientpermeate
Project Advisory Committeeparticle beamnegative logarithm of the effective hydrogen-ion
concentration parts per million pounds per square inch quality assurance/quality control correlation coefficient correlation coefficients retentatecoefficient of determination secondsimultaneous distillation extraction simulated distribution system solid phase extraction standard deviation surrogatespecific ultraviolet absorbance switching valve Surface Water Treatment Rule time
329

TCAA
TCE
TCNX
THAAX
THM
TTHM
TTHM2
TTHM-Br
TTHM-C1
THMFP4
TTHMOX
TTHMX
TOC
UF
UH
USEPA
UT
uvUV-VIS
UV-254
V
vocw/
YC
YM
X
jjmol
utnole
trichloroacetic acid
trichloroethene
total cyanogen halide
total haloacetic acid halogen
trihalomethane
total trihalomethanes
total trihalomethanes concentration after 2 days
total trihalomethane bromine molar concentration
total trihalomethane chlorine molar concentration
4-day trihalomethane formation potential
organic halogen contributed by TTHMtotal trihalomethane halogen molar concentration
total organic carbon
ultrafiltration
University of Houston
United States Environmental Protection Agency
University of Texasultraviolet
ultraviolet-visible irradiation
ultraviolet radiation at 254 nanometers
volume
volatile organic compoundwith
cellulose acetateregenerated cellulose
wavelength
microgram
microliter
micron
micromole
micromole
330


American Water Works Association
6666 W.Quincy Avenue, Denver, CO 80235
(303)347-6100
1P-3C-90728-5/98-CM ISBN 0-89867-906-0