factors affecting performance of adults in …12)-2490-2504.pdf · factors affecting performance of...
TRANSCRIPT

International Journal of Asian Social Science, 2013, 3(12): 2490-2504
† Corresponding author
ISSN(e): 2224-4441/ISSN(p): 2226-5139
© 2013 AESS Publications. All Rights Reserved.
2490
FACTORS AFFECTING PERFORMANCE OF ADULTS IN ADULT AND
CONTINUING EDUCATION IN NKULUMANE-EMGANWINI AREA
Precious Ndlovu
Zimbabwe Open University, Bulawayo, Zimbabwe
Wisdom Moyo†
Zimbabwe Open University, Bulawayo, Zimbabwe
ABSTRACT
The purpose of this study was to determine the correlation of the factors affecting academic
performance with the performance levels of adults in adult and continuing education in
Nkulumane-Emganwini area. These factors were arbitrarily selected from the literature review.
The research design selected was the empirical approach .A sample of 40 students was randomly
selected from a population of 420 in Nkulumane –Emganwini in the four schools Questionnaires
were used as the research instrument. Other instruments used were adult learning style inventory,
attendance registers and mid-year mark sheet record. The research findings indicate that
attendance and academic self-concept have a strong positive correlation with performance.
Learning styles and Age were also found to affect performance while marital status and income did
not significantly affect performance. It is recommended that school administrators should
adequately monitor lesson attendance. The Ministry of Education Sport and Culture should carry
out refresher courses in teaching styles as part of the continuing professional development
teachers.
© 2013 AESS Publications. All Rights Reserved.
Keywords: Adult learner, Performance, Education, Academic, Attendance, Literacy.
1. INTRODUCTION
The aim of the research was to determine how well the factors affecting adult education
correlate with academic performance in adult and continuing education. Six factors were arbitrarily
selected from literature review.
International Journal of Asian Social Science ISSN(e): 2224-4441/ISSN(p): 2226-5139
journal homepage: http://www.aessweb.com/journal-detail.php?id=5007

International Journal of Asian Social Science, 2013, 3(12): 2490-2504
© 2013 AESS Publications. All Rights Reserved.
2491
1.1. Background of the Study
Zimbabwe has an adult literacy rate of approximately 89% which is among the highest in
Africa (EFA Global Monitoring Report, 2007). However, this has been declining considering it
was once 92% in the early 90‟s. This makes Zimbabweans insightful when it comes to issues
concerning education. The recent years has many adults pursuing further education to improve
different productive skills and credentials that are needed in the shrinking job market. In an
attempt to acquire these skills many adults attend evening classes. Some want to acquire basic
education, for example, General Certificate Education Ordinary level. The General Certificate
Education Ordinary Level has the grading A, B, C, D, E, with C being the lowest pass and A being
the highest pass. The Zimbabwean requirements for a full certificate is five ‟O‟ Levels, which
include English Language. The recent years have seen a pass in Mathematics also made
compulsory. This has led to many adults who do not have a full certificate going back to school.
In order to cater for these needs the Ministry of Education Sports and Culture in Zimbabwe has
set a programme in public schools where „O‟ Level is being taught after normal working hours.
These students are called private candidates. It has been observed that the pass rate of private
candidates is low compared to those attending conventional school. Their results show that some
candidates register but do not write the examination.
1.2. Statement of the Problem
Adults are faced with varying difficulties in their learning. This research intends to determine
how different factors correlate with academic performance of adult learners in adult and continuing
education.
1.3. Purpose of the Study
The purpose of the study is to determine how well the six arbitrarily selected factors correlates
with performance in adult and continuing education. The focus was in the Nkulumane –
Emganwini area.
1.4. Significance of the Study
The study will assist the teachers of adult learners to identify and encourage factors with
positive correlation with academic performance and discourage those factors with negative
correlation with academic performance.
1.5. Research Questions
To arrive at the required data the following questions needed to be answered.
Does demographic profile affect adult academic performance?
Does access to instructional material contribute towards academic performance of
adult learners?
Do learning styles of adult learners affect academic performance?
Does self-concept influence academic performance?
To what extent does lesson attendance affect academic performance?

International Journal of Asian Social Science, 2013, 3(12): 2490-2504
© 2013 AESS Publications. All Rights Reserved.
2492
1.6. Limitations of the Study
Time to distribute questionnaire was one of the problems faced in the study as the learners
were only available after 5pm when their lessons start.
2. LITERATURE REVIEW
A body of literature on the adult learners and performance was reviewed with the aim of
establishing factors that affect adult learners in adult continuing education.
2.1 Effects of Demographic Profile on Performance
Much of the early work in adult learning focused on intelligence, examining whether
intelligence declined with age (Merriam et al., 1993). Studies were conducted in artificial settings,
and timed educational tests were used to compare younger learners with older learners. Findings of
these studies were that intelligence is not reduced through the aging process. According to Hassett
(1983) one intelligence test, the Wechsler Adult Intelligence Scale, takes this into account by
testing two very different sorts of abilities, the verbal and performance abilities, where verbal
portion measures competence with words and store of information, older people show little decline.
On the other hand, which measures speed of reaction, adults have low scores. The researchers
concluded that overall decline in abilities is not great.
Hallam (1996) noted that the ability to comprehend new information and to think flexibly
improves with age. One researcher studied over seven hundred individuals who were engaged in
scholarship, science or the arts. Although the patterns varied from profession to profession, most
of these subjects reached their peaks of creativity and productivity in their forties. Alhassan (2012)
found that significant findings in the brain research of the 1990s indicated that the more the brain is
used, the less likely cognitive function will be lost.
In the same light Rawlins et al. (1993) say that cognitive functioning remains high during early
adult hood. They also points out that during this stage there is decreased egocentrism which results
in a more balanced idealism. Emotionally, the ability to function in a stressful environment is
critical for young adults to achieve success in work or school. However, stress can serve a useful
purpose in motivating the adult to strive for greater achievements (Rawlins et al., 1993).
With regards to marital status, Jarvis (1987) found that family commitments could indicate
stability that may enhance academic focus. In studying an intermediate university accounting
course at two universities in the USA, marital status was used as an indicator of maturity, and it
was found that it contributes significantly to success in academic performance. One of the most
frequently cited reason for returning to school is divorce (Glass and Rose, 1994). They noted that
in 1992 in America more than 30% of the families were headed by single parents. 86% of which
were females who had enrolled at a college or university. However these females experienced both
institutional and personal factors that made their ability to learn and complete their education more
difficult.

International Journal of Asian Social Science, 2013, 3(12): 2490-2504
© 2013 AESS Publications. All Rights Reserved.
2493
2.2. Effect of Self-Concept on Academic Performance
Lemmer and Dekker (1993) clearly state that no factor is more important for positive school
outcomes than the children‟s perception of the teacher‟s attitude toward them and expectations.
They claim that when students believe that their teachers care about them, see them as competent,
respect their views and desire their success, they tend to work toward fulfilling those high
expectations. Teachers‟ expectations of pupils‟ performance and abilities can operate as a self-
fulfilling prophecy within a classroom (Lemmer and Dekker, 1993). There are tendencies for the
performance of the pupils to conform to the expectations declared by the teacher.
According to Shalveson and Marsh (1986), students‟ attitude towards their ability to influence
their academic outcome does affect their performance. Schneider et al. (2012) argues that students‟
feelings, attitudes, and perceptions they hold about their academic ability that is, academic self-
concept, does affect their performance. When students have low academic self-concept they shift
to self-handicapping. This method shifts blame away from the individual, and allows them to have
excuses for failure. Students are more likely to achieve high marks when they believe in their own
capacities and do not feel anxious about the learning process, (Schneider et al., 2012).
Shalveson and Marsh (1986) also states that Self-efficacy in mathematics affects students‟
willingness to take on challenging tasks and the amount of effort and persistence. Bandura (1994)
cites that students were asked to what extent they believe in their own ability to handle learning
situations in mathematics effectively, overcoming difficulties tackling them. Results showed that
self-efficacy and self-concept did affect performance and was also a key impact on motivation.
3. RESEARCH DESIGN AND METHODOLOGY
3.1. Research Design
An empirical research design was used as it was convenient. It uses direct or indirect
observation or experience to gain knowledge. Empirical evidence (the record of one‟s direct
observations or experiences) can be analysed quantitatively or qualitatively. That is why this
research design was suitable for this study.
3.2. Population
The population for the study comprised of male and female black adults aged 21 years and
above. These were mainly from the Ndebele and Shona cultures who reside in the western part of
the city of Bulawayo, called Nkulumane – Emganwini area .The targeted population were those
adults doing adult and continuing education in four secondary schools in Emganwini - Nkulumane
area, namely Nketa High school, Nkulumane, Mandwandwe and Emganwini High school. Most
of them have written O level and failed it at one point in time.There were 420 adult learners in
these 4 secondary schools. According to Isaac and Michael (1984) the recommended sample size
for a population of 420 should be 201. However, due to constraints a sample of 40 students was
selected. This is in line with Bless et al. (2006) who said that the size of the sample depends on the
kind of data analysis the researcher plans to use.
The random sampling procedure was followed by making 100 identical blank pieces of and
paper 10 pieces written “yes” put in a hat. Students were asked to pick one paper and those who

International Journal of Asian Social Science, 2013, 3(12): 2490-2504
© 2013 AESS Publications. All Rights Reserved.
2494
picked “yes” qualified for the sample. The process was repeated in each school that is 10 students
from each school which makes a total of 40 students.
3.3. Research Instruments
Questionnaires were used to elicit the factors affecting adult learners in adult and continuing
education. According to Bless et al. (2006) questionnaires reduce bias by the interviewer and
encourage honesty by respondents as they require anonymity. The first questionnaire had two
sections, section A and section B. Section A was on demographic data and section B on self-
concept and access to learning material. The second questionnaire was on adult learning styles
(Honey and Munford, 2006). It was used to determine the preferred learning style of learners.
Honey and Mumford identified four distinct learning styles, the Activist, Theorist, Pragmatist and
Reflector. The activists are people who learn by doing, have an open- minded approach to learning
and involve themselves fully and without bias in new experiences. The theorists are learners who
like to understand the theory behind the actions. They need models, concepts, and facts in order to
engage in the learning process. The pragmatists are those learners who need to see how to put the
learning into practice in the real world. They are experimenters, they try-out new ideas, theories
and techniques to see how they work. The reflectors are learners who learn by observing and
thinking about what happened. They may avoid leaping in and prefer to watch from the side lines.
To check attendance by learners, daily attendance registers were collected from class teachers
and the total attendances for the term for each learner was compiled. Mid-year marks for English
and Maths were provided by the subject teachers for Maths and English. Their averages were
calculated and used to determine the performance of learners. The questionnaires were distributed
to the respondents and were collected soon after they had had been filled in.
4. DATA PRESENTATION AND ANALYSIS
Data collected was presented in tables and bar graphs. The response rate to the questionnaire was
an impressive 100%. All the respondents were cooperative.
4.1. Demographic Profile of the Subjects Who Participated
The first table in this chapter reflects the age group and gender of the subjects who participated
in this research. The purpose of this is to identify the gender and age groups which are most
affected by negative and positive factors in their academic performance.
Table-4.1. Showing demographic profile of subjects who participated
Age Males Females Total Percentages
20 -25 2 8 10 25
26 -30 8 8 16 40
31 -35 3 5 8 20
36 -40 1 3 4 10
41+ 2 0 2 5
Total 16 24 40 100

International Journal of Asian Social Science, 2013, 3(12): 2490-2504
© 2013 AESS Publications. All Rights Reserved.
2495
The table shows that there were more female respondents than males in all age groups except the
40+ years. The majority of the adult learners are in the age group 20 – 36 year. They constitute
65% of the population. The results also show that after the age of 30, the number of participants
diminishes as age increases.To show how these age groups are affected in their learning, their mid
year average marks were plotted against their performance. The bar graph below shows
performance by age of participants.
Figure-4.1. showing performance by age and sex
From the above graph males aged 41+have an average performance of 54% which is better than those aged below 41
years. It can also be seen that females within the age group 31 – 35 and those aged 36 – 40 have a similar performance.
Their average performance is 12.8% and 12% respectively.
4.2. Financial Status of Participants
Literature claims that financial instability has been seen to be contributing significantly to
problems faced by adults. The Consumer Price Index (C.P.I) in Zimbabwe 2013 is at 100.94.
C.P.I shows changes in the cost to the average consumer of acquiring a basket of goods and
services that maybe fixed or changed at specific intervals. Respondents were asked about their
financial status so as to determine if academic performance of adult learners is affected by the
income group they fall under. Results of the financial status of respondents are shown in table 4.2.
The table below 58.33% females earn an income which is below the C.P.I. and none of the females
earn an income more than $500 per month. 56% of the males earn more than $200 as compared to
29% of the females. To show income earnings affect performance, mid year average marks were
plotted against income the data in table 4. 2.
8.5 12.8 13.5
23
54
29
34.4
12.8 12%
0 0
10
20
30
40
50
60
20-25 yrs 26-30 yrs 31-35 yrs 35-40 yrs 41+ yrs
Ave
rage
%
Perfomance by age and sex
Male
Female
International Journal of Asian Social Science, 2013, 3(12): 2490-2504
© 2013 AESS Publications. All Rights Reserved.
2496
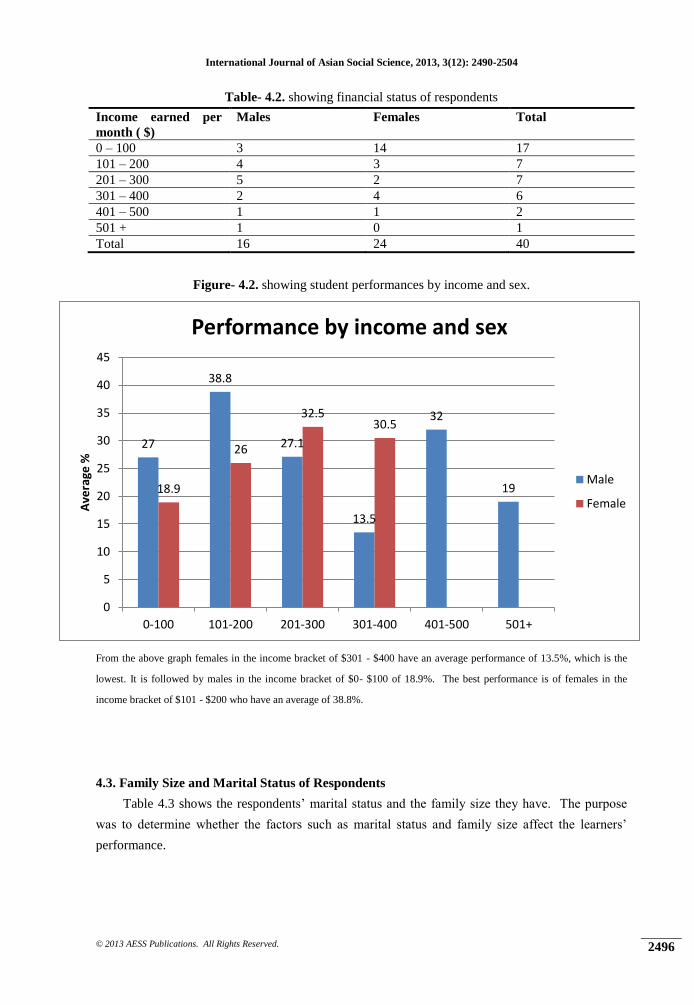
Table- 4.2. showing financial status of respondents
Income earned per
month ( $)
Males Females Total
0 – 100 3 14 17
101 – 200 4 3 7
201 – 300 5 2 7
301 – 400 2 4 6
401 – 500 1 1 2
501 + 1 0 1
Total 16 24 40
Figure- 4.2. showing student performances by income and sex.
From the above graph females in the income bracket of $301 - $400 have an average performance of 13.5%, which is the
lowest. It is followed by males in the income bracket of $0- $100 of 18.9%. The best performance is of females in the
income bracket of $101 - $200 who have an average of 38.8%.
4.3. Family Size and Marital Status of Respondents
Table 4.3 shows the respondents‟ marital status and the family size they have. The purpose
was to determine whether the factors such as marital status and family size affect the learners‟
performance.
27
38.8
27.1
13.5
32
19 18.9
26
32.5 30.5
0
5
10
15
20
25
30
35
40
45
0-100 101-200 201-300 301-400 401-500 501+
Ave
rage
%
Performance by income and sex
Male
Female

International Journal of Asian Social Science, 2013, 3(12): 2490-2504
© 2013 AESS Publications. All Rights Reserved.
2497
Table- 4.3. Showing marital statuses and number of children of respondents
No. of
children
Marital status
Single Married Divorced Total
0 11 3 0 14
1 – 3 6 10 2 18
4 – 6 0 4 1 5
7+ 0 3 0 3
Total 17 20 3 40
The table shows that 50% of the respondents were married, 42.5% were single and only 7.5% were divorced. 45% had 1 – 3
children, followed by those who had no children at all who were 35%. Those with 4- 6 children were 12.5% and only 7.5 %
had 7+ children. It can also be seen that none of the learners who are single had more than 4 children.
The respondents‟ average marks were plotted against their marital status and the results are shown
in figure4. 3
Figure-4.3. showing performance by marital status
Learners who are married had the least performance, followed by those that are divorced. The learners who are single had
the highest performance of 33.9%
4.4. Access to Instructional Material
To determine if access to instructional material contributed to performance of adult learners,
respondents were asked if they had access to the library and the internet in the last three weeks.
33.9
20.52
28.5
0
5
10
15
20
25
30
35
40
Single Married Divorced
Ave
rage
%
Performance by marital status
International Journal of Asian Social Science, 2013, 3(12): 2490-2504
© 2013 AESS Publications. All Rights Reserved.
2498
Students were given a question with three options where they had to tick the statement they agree
with. The results are tabulated in table 4.4
Table-4.4. showing access to library and internet
Males Females Total
Do you have to the access
library
7 8 15
Do you have access to the
Internet
8 10 18
No access to library and
internet
1 6 7
Total 16 24 40
From table 4.4 six females had no access to either the library or the internet as compared to
one male.15 Respondents had access to the library and 18 respondents had access to the internet.
Respondents were asked to comment about their responses and they stated that there were only two
libraries within the Nkulumane- Emganwini area. 55% of the respondents indicated that libraries
were too far from where they stay. 90% of those who had access to the library stated that the library
had out dated textbooks. 32.5% stated that the library operates during normal working hours but
they are able to access it after normal working hours due to other commitments. 30% of the
respondents could not access the internet because they lacked the skills to do so. 40% of the
respondents had no funds to access the internet and only 30% respondents had the access to the
internet.
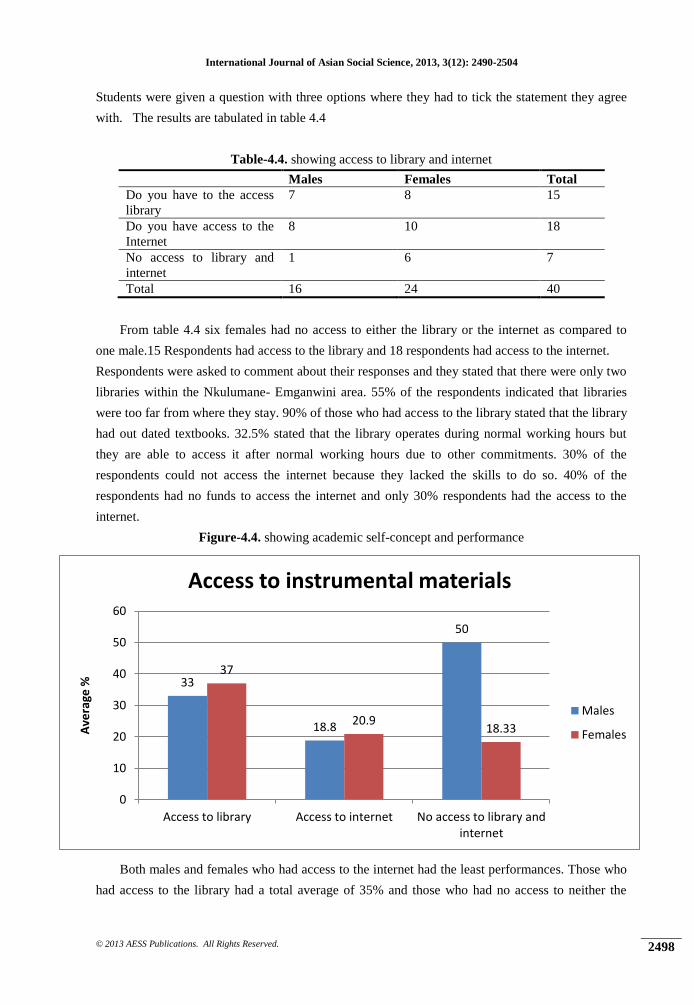
Figure-4.4. showing academic self-concept and performance
Both males and females who had access to the internet had the least performances. Those who
had access to the library had a total average of 35% and those who had no access to neither the
33
18.8
50
37
20.9 18.33
0
10
20
30
40
50
60
Access to library Access to internet No access to library andinternet
Ave
rage
%
Access to instrumental materials
Males
Females

International Journal of Asian Social Science, 2013, 3(12): 2490-2504
© 2013 AESS Publications. All Rights Reserved.
2499
library nor internet had an average of 34%.It is interesting to note that males who had no access to
either the library nor the internet had an average of 50%.
4.5. Learners’ Preferred Learning Style
In the learning process, the learners‟ preferences have become very important in determining
the learning out comes. As individuals, learners apply the learning styles they prefer. The learning
styles determine how much information can be retained, which will in turn determine the final
performance. To find out the preferred learning styles students were asked to complete the Honey
and Munford questionnaire on adult learning styles. They had to tick the statement they agreed
with and place an “x”on the statement they disagree with. The results were then scored according to
the scoring formula provided by the instrument. The results are shown in table 4.5
Table-4.5. showing respondents preferred learning styles by age
Age Activist Theorist Reflector Pragmatists Total
20 – 25 1 1 2 6 10
26 – 30 2 3 2 9 16
31 – 35 5 1 1 1 8
36 – 40 0 1 3 0 4
40+ 0 2 0 0 2
Total 8 8 8 16 40
From table 4.5 forty percent of the students prefer the pragmatist learning style, with the
majority of them being in the ages 20 – 25 and between 26- 30. Those in the 31–35 age group
prefer the theorist learning style and those between 36 – 40 prefer the reflector .Finally those above
40 years prefer the theorist learning style.
4.6. Academic Self-Concept of Respondents
To determine if academic self concept affects academic performance. Respondents were asked
about their academic self-concept, whether they believed that they were academically good.
Respondents had 4 options to choose from, namely strongly disagreed, disagreed, agreed or
strongly agreed. Their responses are tabulated below.
Table-4.6. showing personal factors of respondents
Rating Academic self-concept
Male Female Total
Strongly disagree 1 4 5
Disagree 3 12 15
Agree 5 5 10
Strongly agree 7 3 10
Total 16 24 40
The above table shows that only 1 male student and 4 female students strongly disagreed with
the statement that they were academically good. 12 females and 3 males disagreed with the
statement that they are good academically. 7 males believed that they are very good academically
but only 3 female believe they are academically good.

International Journal of Asian Social Science, 2013, 3(12): 2490-2504
© 2013 AESS Publications. All Rights Reserved.
2500
The students‟ self-concept was then measured against their performance to check if self-
concept had an effect on performance. The results are shown in figure4.6
In figure 4.6 the average performance of students who strongly disagreed that they were
academically good was 4.2% and for those who agreed that they were academically good was 31.6.
It is of great interest to note that those with high self -concept also had a high average mark.
Figure-6. showing academic self-concept and performance
4.7. Lesson Attendance
To determine whether lesson attendance had an effect on performance of adults in learning, the
attendance registers were collected. The attendances of students were presented in the table below.
Those who scored Very good – attended all lessons, good – absent less than 5 days in a term,
average – absent less than 20 days in a term. Low – absent more than 20 days in a term
Table- 4.7. showing attendance of learners.
Rating Attendance
Male Female Total
Low attendance 2 2 4
Average 1 13 14
Good 8 5 13
Very good 5 4 9
Total 16 24 40
On attendance, 50% of the males have a good attendance and only 20.8% of the females have a good attendance. 54.2% of
the females were absent more than 20 days. 54% of the females had an average attendance 6.25% of the males had an
average attendance.
4.2
18.7
31.6
42.15
0
5
10
15
20
25
30
35
40
45
Strongly disagree Disagree Agree Strongly agree
Ave
rage
%
Academic self concept

International Journal of Asian Social Science, 2013, 3(12): 2490-2504
© 2013 AESS Publications. All Rights Reserved.
2501
The students‟ attendance was then plotted against the performance to see if attendance had an
effect on performance. Midyear average marks were used for performance. The results were
presented in figure 7.
Figure-7. showing attendance by performance
From the figure 7 students with low attendance also performed the least and those with high attendance performed well,
Those with high attendance had an average performance of 44.7%,followed by those with a good attendance with 28%.the
least was those with low attendance ,they had an average performance of 4.5%.
5. DISCUSSION
The purpose of the study was to determine the correlation of the factors that affect performance
with performance of adults in adult and continuing education. The focus was in the Nkulumane –
Emganwini area. A sample of 40 students in a population of 420 was used. This study was
prompted by the low pass rate of adult learners in the Nkulumane – Emganwini area.
The findings from this study indicate that age does affect learning performance. Older students
did perform better than the younger ones. From the mid-year averages those aged 40+ had the best
performance as compared to the age groups less than 40 years. This confirms the findings by
Merriam et al. (1993) that intelligence is not reduced through the aging process. This is also
supported by Hassett (1983) who found that competence with words and store of information is not
reduced as age increases. The results used were from the Mathematics and English examinations.
Maybe the results would have been different if they had been taken from the practical subjects like
wood work because Hassett (1983) cited that speed of reaction is reduced as age increases.
The second question in the questionnaire looked at sex of the respondents. The findings from
this study were that there were more female students than male students. They constituted 65% of
4.5
17.3
28
44.7
0
5
10
15
20
25
30
35
40
45
50
Low Average Good High
Ave
rage
%
Attendance

International Journal of Asian Social Science, 2013, 3(12): 2490-2504
© 2013 AESS Publications. All Rights Reserved.
2502
the population used in this study. The possible explanation is that in Zimbabwe females are 52% of
the population. From this study it was noted that females perform better between the age groups
20 – 30 years then there is a gradual decline in performance as they approach the age of forty. The
researcher suspects that it may be caused by the increase in responsibilities for women as they grow
older. The overall average for females was lower than that of females.
In this study the results show that those students who are married do not perform better than
those either single or divorced, which is inconsistent with Jarvis (1987) who found that family
commitments indicate stability, maturity and contribute significantly to academic success .
Figure 3 shows that the best performance was from those who are single, followed by those who
are divorced and the least was those who were married. This could have been caused by the fact
that those who are single have more time to themselves as compared to those who are married who
have to attend to their spouses and children. Furthermore those who are divorced performed better
than those are married. This confirms findings by Rawlins et al. (1993) who suggested that stress
may serve as motivation to adults to strive for greater achievements. Those students who are
divorced may have been stressed by the breaking of their marriages hence seek to improve their
academic status or want to seek employment which needs better educational qualifications.
The research findings on income indicate that ones‟ financial status does not affect ones‟
academic performance. Males who had an income of $ 500+ per month had a performance less
than those with an income of less than $500 per month. This in contrast with Duke (2000) findings
that students‟ achievements has a positive correlation with their socio economic status. This may
have been caused by the fact that students used by Duke were younger students and the students
used in this study are adults. However there is quite a significant difference in achievements
between those with an average income of 0 – 100 and those with an income of 100 – 200. The
researcher is of the opinion that those with an income more than $100 are better off financially and
can afford to buy a few learning materials than those with an income less than $100.On
instructional material, those with an internet access did not perform well as compared to those who
had access to the library. The researcher suspects that since most students use an internet for social
networking than educational research some of the time meant for research was used by learners for
socialising. The findings of this research may have been affected by the fact that marks used were
from subjects where less research is needed. For example in mathematics, more practise is needed
than research. However the overall performance of those who used the library was generally
higher than those who do not use the library. So access to instructional materials has an effect on
performance. The third research question was on the effect of attendance on academic performance.
The findings of this research indicate that attendance had a positive correlation on performance
was lesson attendance. Those with a low attendance scored less marks as compared to those with
high attendance. More males had a high attendance than females. The researcher suspects that
since females have other duties at home, like child caring that is why their attendance is lower than
their male counterparts. Results in this study indicate that self-concept does affect performance.
Those students with low self-image scored low marks. This matches findings by (Shalveson and
Marsh, 1986), who found that self-concept in mathematics affects students‟ willingness to take on
challenging tasks and the amount of effort and persistence.

International Journal of Asian Social Science, 2013, 3(12): 2490-2504
© 2013 AESS Publications. All Rights Reserved.
2503
Results in table 4.7 indicate that only half of the students in the sample had the same preferred
style that is pragmatist. Within the same sample 20% preferred theorist, another 20% preferred
reflector and the last 20% preferred activist. This is in line with findings by Candy (1990) that
each learner has his own preferred learning style. The overall performance average was 26.7 which
is too low. This could be an indication that not all learning styles were used.
6. CONCLUSION
Based on the outcome of this research, the researcher can safely say that there are many factors
that affect adult learners in adult and continuing education
It can be concluded that
Age does affect academic performance
Students marital status does affect the time they allocate to their studies
Financial status does not affect their academic achievements
Attendance and self-concept have a positive correlation with academic achievement
Learning styles have a significant effect on academic performance
7. RECOMMENDATIONS
From the above conclusions it is recommended that:
School administrators should supervise adequately and monitor the daily attendance of
students.
Libraries consider opening for longer hours after 5pm because most of the adult learners
would be occupied during the day
The ministry of Education should facilitate the training of teachers on learning and
teaching styles and other assessment instruments as part of the continuing professional
development.
Further research studies should be done on factors outside the school environment that
affect student‟s performance.
REFERENCES
Alhassan, A.M., 2012. Factors affecting adult learning and their persistence: A theoretical approach.
(Accessed 7 October 2013). European Journal of Business and Social Science, 1(6): 150-168.
Available from http://www.ejbss.com/Data/Sites/1/septemberissue/ejbss-12-1156-
factorsaffectingadultlearning.pdf.
Bandura, A., 1994. Self-efficacy,in Ramachaudran (Ed.), Encyclpedia of human behavoiour. New York:
Academic press, 4(1):71-81.
Bless, C., C. Higson-Smith and A. Kagee, 2006. Foundations of social research methods: An African
perspective. Cape Town: Juta and Co.
Candy, P.C., 1990. How people learn, in Smith, R.M. (Ed) Learning to learn across the life-Span. San
Francisco: Jossey-Bass.

International Journal of Asian Social Science, 2013, 3(12): 2490-2504
© 2013 AESS Publications. All Rights Reserved.
2504
Duke, N., 2000. For the rich it‟s richer: Print environments and experiences offered to first-grade students in
very low- and very high-SES school districts. American Educational Research Journal, 37(2): 456–
457.
EFA Global Monitoring Report, 2007. Education for all by 2015 –will make it? , Oxford: Oxford University.
Glass, J.C. and A.R. Rose, 1994. Reentry women: A growing and unique college population. NASPA Journal,
32(1): 110-119.
Hallam, S., 1996. Improving school attendance. Oxford: Heinemann Publishers.
Hassett, J., 1983. Understanding psychology. New York: Random House Division.
Honey and Munford, 2006. The learning style helper‟s guide. (Accessed 26 November 2013). Available from
http://www.peterhoney.com/documents/Learning-Styles-Questionnaire-80-item_QuickPeek.pdf.
Isaac, S. and W.B. Michael, 1984. Handbook in research and evaluation. 2nd Edn., California: Edits
Publishers.
Jarvis, P., 1987. Adult learning in the social context. Beckenham: Croom Helm.
Lemmer, E. and E. Dekker, 1993. Critical issues in modern education. Durban: Butterworth.
Merriam, S.B., R.S. Caffarella and L.M. Baumgartner, 1993. Learning in adulthood. San Francisco: John
Wiley & Sons.
Rawlins, C.K., S.R. William and C.K. Beck, 1993. Mental health psychachiatric nursing: A holistic approach.
St Loius: Mosby.
Schneider, F.W., J.A. Gruman and L.M. Coutts, 2012. Applied social psychology: Understanding and
addressing social and practical problems. Thousand Oaks, CA: Sage Publications, Inc.
Shalveson, R.J. and H.W. Marsh, 1986. On the structure of self-concept in Sehwarzer (ed.), Anxiety and
cognitions. Hillside N.J.: Erlbaum.
Views and opinions expressed in this article are the views and opinions of the authors, International Journal of Asian
Social Science shall not be responsible or answerable for any loss, damage or liability etc. caused in relation
to/arising out of the use of the content.