factors affecting vehicle skids: a basis for wet weather ... · factors affecting vehicle skids: a...
TRANSCRIPT

D FACTORS AFFECTING VEHICLE SKIDS: A BASIS
FOR WET WEATHER SPEED ZONING
SUMMARY REPORT of
Research Report 135-2 Study 1-8-70-135
WET X/)
WEATHER SPEED LIMIT
50 Cooperati.ve Research Program of the
Texas Transportation, In,sti.tute and the Texas Highway Department In Cooperation with the
U. S. Department of Transportation, Federal Highway Administration
February, 1973
TEXAS TRANSPQJ:iTATION INSTITUTE • 8> 6 ..,.. q.,
Texas A&M University College Station, Texas
9
Factors Affecting Vehicle Skids: a Basis for Wet Weather Speed Zoning
by
G. D. Weaver, K. D. Hankins, and D. L. Ivey
Tl"' 1:1111dmc11/ of T<:rns Sr 1111/e Uill No. !S1, Ser/ion 167 !,as /J/({(cd 11j,011. lf"' S/11/e f-liglrn'll)' Co111111i.1.1im1 il,e 1111//l(ni/y (llld u:.1/)()nsibilily
lo t:.1la/,Lis/1 /'l'/11(11111/,/c /Ill(/ s11f1· sj//'{'{/ li/1/ils when co11dilio11s mused /J\'
wet or i11c!cn1c1tl 11 1r:allu:r n'quiu: ,\11c/1 adion. T/1is u:/J<rrl s'!nn111ari~:.cs
Nesc1irc/1 1/c}!orl !l'i-'.l, Study !-S-70-/15, 11•!1ir/1 /n1·.11:11/.1 a lll('//1od, /,a.1('{(
011 l/11• fl.\.1i111iflllio11 of //'1'11i/11/;/e i11forn111/io11 frn111, ,111-iious skid-u,fllteil
tt'sr:rnch, by 1u/1ich ·11·cl t.1't'a/J1cr .\f,ced --:,nni11g 111ny lJr: imfJftnnc11/er( in "f'cx11s.
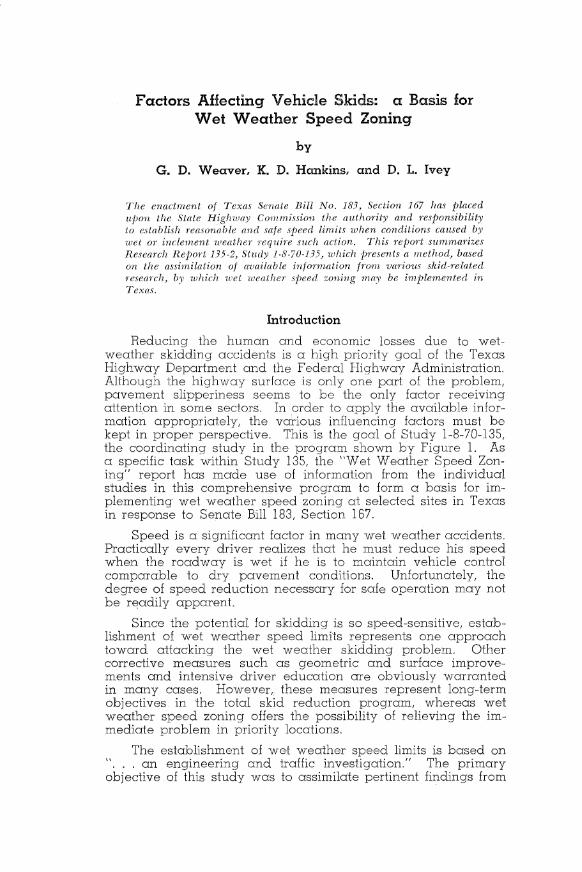
Introduction
Reducinq tho hurnan and economic losses duc: to wet-weather skiddinq accidents is a of lhe Texas Highway Department cmd the Fc,dc:ral Administration. Allhouc1h the hic1hway surfm:p is only one o/ LhP problem, pavement slipperiness seems to be the factor receivinq attention in some sectors. In order to available infor-mation the various factors must bo kept in proper This is 1-8-70-135, tho coordinatinq in the by re 1. As
task within 1 Weather Zon-report has made use of inforrnotion from the individual
in this proqram to form a basis for im-plementing- wet weather speed zoning at selected sites in Texos in response to Senate Bill 183, Section 167.
factor in many wet weather accidents. realizes that he must reduce his
when the is wot if he is to maintain vehicle control conditions. Unfortunately, tho
for safe rnay not be apparent.
Since the potential for skiddinq is so speed-sensitive, establishment of wet weather limits represents one approach toward attackinq the wet weather skiddin9 problem. Other corrective measures such as geometric and surface improve-ments and intensive driver education are obviously warranted in many cases. However, these measures represent long-term objectives in the total skid reduction program, whereas wet weather speed zoning offers the possibility of relieving the immediate problem in priority locations.
The establishment of wot weather speed limits is based on . an engineering and traffic investiqation." The primary
objective of this study was to assimilate pertinent findings from

Figure I. Vehicle-roadway interaction pro,gram in Texas.
various skid-related research efforts to provide an objective basis on which potential wet weather accident sites can be analyzed and hence, safe wet weather speed limits may be determined.
Friction Availability Versus Friction Demand
The performance of desired maneuvers is dependent upon the existence of tire/road friction. It is well known that the friction required (demand) by a vehicle to perform a given maneuver increases with speed. On the other hand, the friction available to the vehicle (skid resistance) at the tire-pavement interface normally decreases with increased speed. Loss of control usually occurs when the friction demand exceeds the friction available. The friction at the point where availability and demand are equal is defined as "critical friction," and the speed at which this occurs is termed the "critical speed," The critical friction concept is used throughout this report as a basis for evaluating the individual factors that influence friction demand.
Available Friction
The skid number (SN) determined by the locked wheel skid trailer at 40 mph is a widely accepted measure of pavement friction. Friction measurement by this method, however, is

100
80
z en
i 0 60 ;: 0 ii: .._ w ..l al
" 40 ..l
~ "
20
0
0 10 · 20 30
rEXTURE: 0.050 IN. OR LESS TIRE TRE~D, 2/32 IN. OR LESS
AVAILABLE FRICTION FOR 85th PERCENTIL~ RAINFALL CONDITIONS
40 50 60
SPEED, MPH
70 80
Figure 2. Available friction as predicted by skid number (2).
usually obtained at the one speed, 40 mph, and as mentioned previously, friction decreases as vehicle speed increases. Since the speeds in question here are usually in excess of 40 mph, the change in available friction with respect to speed must be considered. Figure 2 presents friction/speed relationships and is based on the 85th percentile rainfall intensity of 0.14 inches/ hour, pavement texture of 0.05 inches and tire tread depth of 2/32 inch. The research report contains general nomographs by which similar curves can be developed for various parameter combinations.
It should be noted that in Figure 2, the intersection of a vertical line at 40 mph with the SN40 = 40 mph curve does not yield a skid number of 40 when projected horizontally to the available friction ordinate. Although this, at first, may appear questionable, the reason lies in the fact that the curves were developed from skid data obtained under external watering conditions (rain machine) rather than the standard ASTM internal trailer watering system. The curves in Figure 2 more closely reflect pavement characteristics under actual wet weather conditions.
Demand Friction
Having determined the relationship of available friction with speed, the other part of the problem involves equating the demand friction for traffic maneuvers to this from which the critical speed may be determined. Demand friction relationships are provided for the maneuvers listed below. The development of

100 FN = V2 5 0.3 (d-3.67V)
~
ci 80 w <D :, ::, z
z 0 ;:: 60 u ii: IL
z U)
40 -0: w <D :, ::, z
0 20
"' "'
faample 2
0 0 10 20 30 40 50 60 70
SPEED, MPH
Figure 3. Critical speed for emergency stop imposed by sight distance and available friction (3).
these relationships is discussed in considerable detail in the research report.
l. Stopping maneuvers (Figure 3).
2. Cornering maneuvers (Figures 4 and 5).
3. Passing maneuvers (Figure 6).
4. Hydroplaning (Figure 7).
5. Emergency path-correction maneuvers (Figures 8, 9, and 10).
The critical speed is determined by the intersection of the demand friction curve and the appropriate skid number curve.
Rather than developinci a series of curves for selected degrees of superelevation, the curves in Figures 4 and 5 are developed on a zero-superelevation basis to which appropriate correction factors may be easily applied for a desired superelevation rate. To include the effect of superelevation, the given demand curve, FNc, is translated vertically by the amount of the superolevation expressed in percent. As an examplo, if a 15-degree curve contained 0.0:i positive superelevation, the 15-degree curve would be lowered 5 units of FN as shown by the dashed curve in Figure 4. Similarly, the curve would be translated upward an equal amount if the superelevation were negative.

100 20•
FNc _ v2
z e + Tcio -ISR 15°
lL_
.ffi 80 <D ::;; :::, z
w z a:
~ 60 :::,
t !.2 10° ii: a: lL :::,
u
lL
7• 0 40
s• w z w (J) a:
5• <.!) er w w 4• Cl <D
~20 3• z Cl 2• ,2 (J) 1•
0.5° 0
0 10 20 30 40 50 60 70
SPEED, MPH
Figure 4. Critical speed on horizontal curves (smooth transition, zero superelevation) ( 4).
Figure 4 should be used for spiral transitions or at locations within a curve. Figure 5 should be used for determination of critical speeds on curves having abrupt transition regions at either end (situations normally found when spiral or compound curve transitions are not provided).
Wet Weather Speed Zoning Design Process
The design process involves equating the available friction at the selected site to the friction demand for traffic operational maneuvers expected at that site. To do this, certain engineering characteristics of the site must be known from which the available friction may be determined. Similarly, certain traffic operating characteristics must be determined. Engineering and traffic ch.aracteristics necessary for site evaluation are discussed in the research report.
A critical speed is determined for each expected maneuver. The wet weather speed limit will be governed by the expected maneuver producing tho lowest critical speed. Examples are presented in this report to illustrate the design procedure for selecting the wet weather speed limit.
The design process may be accomplished by the following procedure:
1. Determine engineering characteristics of the site. 2. Identify the expected traffic operating characteristics and
expected maneuvers.

100
z tL
ci ~ 80 :;; ::, z z 0
t 60 ii tL
40
2 <J)
ci w CD ::;, 20 :, z 9 "' <J)
0
0 10 20 30 40
SPEED, MPH
50 60
10•
.,. e• 5•
4• tL
3• 0
2• w w 0:: (!) w 0
0.5°
70
Figure 5. Critical speed on horizontal curves ( abrupt transition, zero superelevation) ( 4).
3. Determine the available friction at the site including the eHods 0£ spood by: (a) conducting standard skid trailer measurements at 40 mph and tho of SN and speed from Figure 2, and (b) conducting tests with a skid trailer at 20, 40 and GD rnph using an external watering system such as a water truck and developing friction relationships.
4. Delermine the critical speed for the maneuvers from the applicable speed-friction relationships shown in Figures 4 through 10
5. I! combination maneuvers are expected at a site, determine the critical speed for the combined maneuver by the pro-cedure discussed in 1 of this report.
6. Select the lowest critical dclerrnined from Steps 4 or 5. The wet weather speed limit is established as this value. The posted speed would be tlw wet weather speed rounded to the nearest 5-mph increment.
Site Selection Criteria
The followinq criteria aro sugcicstcd for site selection:
l. Any Control-Section exhibitincJ two or less wet weather accidents annually should not be considered.
2. All Conlrol Sections exhibitinq 20 or more wet weather accidents annually should be considered.

3. For Control-Sections having 3 to 19 wet weather accidents annually, the Control-Section or sites within the ControlSection should be considered if:
Daily Vehicle Miles a. No. of Wet Weather Accidents ~ 3,000
b. The Control-Section length is 0.30-mile or more.
Examples of Wet Weather Speed Determination Several examples are presented to illustrate the design
process for establishing the wet weather speed limits at sites exhibiting different engineering and expected traffic operating characteristics.
Example I: Critical Speed for Combined Man.euvers Many common maneuvers include some combination of
acceleration, braking, and cornering. The total friction demand may be determined by vector summation of the friction demand for the individual maneuvers. The following example illustrates the manner in which the critical speed may be determined for a combination maneuver. This example illustrates the procedure to determine the critical speed for a maneuver involving combined braking and cornering such as might be experienced at an exit ramp to a stop-controlled service road.
Given: Engineering studies revealed the following site characteristics:
I. Available friction, FN = 30.
2. Available stopping sight distance, SD 400 ft.
100
ii' cc ., m
" ~ 80
z 0
t; °' "- 60
40
~ cc ., ~ 20
~ 0 E111mple3
~ E~ample 2
0
0 10 20 30 40 50 60 70 80
SPEED, MPH
Figure 6. Critical speed for passin.g maneuvers (5, 6).
3. Ramp contains spiral transition curve to a 20-degree maximum curvature with no superelevation.
Procedure: 1. Make an initial assumption of critical speed. V0 = 30
mph.
2. From Figure 4 (Use Figure 5 for an abrupt transition.) and the friction demand curves, determine the friction number demand for cornering, FNc, using the assumed speed, V 0. As shown by the dashed line in Figure 4, FNc = 22.
3. From Figure 3, determine the friction number demand for stopping, FN., using the assumed speed, V0 • As shown by the dashed line in Figure 3, FN2 = 10.
4. Compute the total friction number demand for the combined maneuver, FNt. The total friction demand is the vector sum of the cornering demand, FNc, and the stopping demand, FN •.
FNt y FNc2 + FN.2
v (22)2 + 00)2
24.2
5. Since FNc, FN., and hence, FNt, are dependent on the assumed speed, the resultant interaction point (point having coordinates V0 , FNt) must be located in Figure 2. If the point lies above the available friction curve applicable to the site (in this case, the SN40 = 30 curve), a lower initial speed, V0 , must be assumed, and the above process (steps 1 through 4) repeated. Similarly, if the point lies below the applicable available friction
:c 0.. ~
60
50
fi 40 ... 0..
"'
30
0
TEXTURE =0.15
TEXTURE =0.10
________________ T!_!E:_!X~TU~R!!:E_:=~0_:!.05!!_ ___ _
0.1 0.2 0.3
TEXTURE ,,; 0. 02
TIRE TREAD: 2/ 32 IN. OR LESS TIRE PRESSURE: 27 PSI
0.4 0.5 0.6
WATER DEPTH, INCHES
0.7
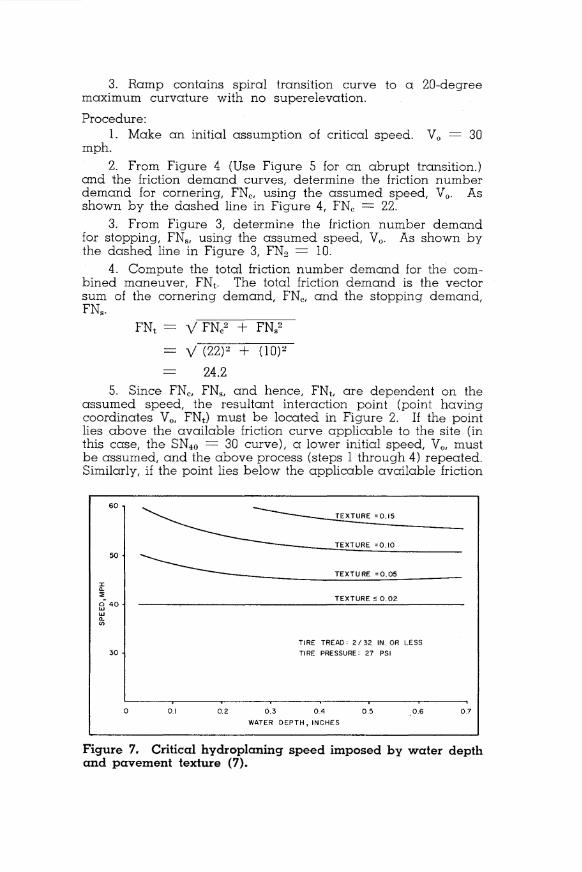
Figure 7. Critical hydroplaning speed imposed by water depth and pavement texture (7).

curve, a higher speed, V0 , must be ossumed, and the process repeated. The critical speed (the speed at which the point falls on the applicable SN-versus-speed curve) may be closely approximated in twq or three ~rials.
6. Plotting the interaction point having coordinates V0 = 30 and FNt = 24.2 on Figure 2 reveals that the point lies sl~ghtly below the applicable SN40 = 30 curve (Point A, Figure 2). Therefore, a higher ::;peed, V0 = 35 mp'.1 ·was assumed, and the process repeated. For V0 = 35 mph, FN0 = 30 (Figure 4), FNs = 15 (Figure 3), and FNt = 33.5. The interaction point (coordinates 35, 33.5) is plotted as Point Bin Figure 2 which lies slightly above the SN40 = 30 curve. A straight line between Points A and B indicates a critical speed for the combination maneuver of approximately 32 mph (speed at Point C).
Example 2: Critical Speed on Tangent Section
The following site characteristics are assumed for illustra-tive purposes:
1. SN40 = 40. 2. Sight distance, SD = 700 ft.
3. Level tangent highway section having no paved shoulders.
4. Pavement texture = 0.05. 5. Pavement exhibits good drainage with no evidence of
rutting or ponding.
Procedure: l. Identify the traffic maneuvers that would be expected
at the site. The expected maneuvers would include: (a) stopping maneuvers, (b) passing maneuvers, and (c) emergency correction maneuvers.
2. Since the site is a level tangent section, cornering or combination maneuvers would not be expected. Therefore, critical speeds for these maneuvers would not be applicable at this site. Similarly, since there is no evidence of rutting or ponding, and good drainage is provided, critical speed to produce .hydroplaning is not applicable at this site.
3. From Figure 3, the critical speed for a stopping maneuver (SN40 = 40, SD = 700 ft) is 59 mph.
4. From Figure 6, the critical speed for a passing maneuver (SN40 = 40, SD = 700 ft) is 59 mph.
4. From Figure 6, the critical speed for a passing maneuver (SN40 = 40) is 51 mph.
5. From Figure 8, the critical speed for an emergency path correction (SN40 = 40, no paved shoulders) is 52 mph.
6. The lowest critical speed from steps 3 through 5 -is 51 mph, governed by friction demand for a passing maneuver.

7. Rounding off to the nearest 5-mph increment, the wet weather speed limit would be 50 mph.
Example 3: Critical Speed on Horizontal Curve
The following site characteristics are assumed for illustrative purposes:
1. SN40 - 35. 2. Horizontal curvature - 3 degrees with an abrupt transi
tion from tangent section to the circular curve (that is, no spiral was used at the transition).
3. Superelevation, e, = 0.05 percent.
4. Seal course pavement surface is slightly flushed in the wheel paths. The texture in the wheel paths is 0.020 as compared to 0.065 at other locations. The flushed wheel path is considerably wider throughout the curve than on the tangent approach.
5. The pavement grade is 0.4 percent.
70
NO PAVED SHOULDERS
60
50
FRICTION DEMAND FOR EMERGENCY
PATH CORRECTION
z 40 Cl)
z 2 1--~ 30 a:: u..
20
10
20 30 40 50 60 70 SPEED,MPH
Figure 8. Critical speed for emergency path corrections (3) (two-lane highways, no shoulders).

6. The pavement surface is slightly rutted in transition area from normal crown to superelevo1ed section. Based on stringline measurements of rut depth, obsei·valion of a flat area in the superelevation transition, and the differential texture between the wheel path and surrounding SlJrface, expected water depth 1s approximately 0.160 inches.
7. Sight distance, SD, is in excess of 1000 ft.
Procedure:
1. Identify the traffic manc-,uvers that would be exi::;ected at the site. These would include: (a) passimJ maneuvers and (b) cornering maneuvers.
7.. Since appreciable water depths are expected and rutting is evident, the critical speed for hydroplaning should be determined.
3. Since adequate sight distance is available, stopping maneuvers are not critical.
70
60
50
Z 40 (/)
z 0 f--2 a:: 30 LI..
20
10
0
20 30
I - 6' PAVED SHOULDERS
40 50
SPEED,MPH
FRICTION DEMAND FOR EMERGENCY PATH CORRECTIONS
60 "TO
Figure 9. Critical speed for emergency path corrections (3) (two-lane highways, 1-6 ft. shoulders).

70
60
50
~40
20
10
0
20 30
6·10' PAVED SHOULDERS
40 50
SPEED , MPH 60 70
Figure 10. Critical speed for emergency path corrections (3) (two-lane highways, 6-10 ft. shoulders).
4. From Figure 5, the critical speed for cornering (SN40 = 35, D = 3°, e = 0.05), is 68 mph.
5. From Figure 7, the critical speed for hydroplaning (texture = 0.02, water depth = 0.160 in.) is 40 mph.
6. From Figure 6, the critical speed for a passing maneuver (SN40 = 35) is 45 mph.
7. The lowest critical speed determined in steps 4 through 6 above is 40 mph, governed by hydroplaning.
8. The wet weather speed limit would be 40 mph.
References
1. Weaver, G. D., Hankins, K. D., and Ivey, D. L. "Factors Affecting Vehicle Skids: A Basis for Wet Weather Speed Zoning." Res. Rept. 135-2F, Texas Transportation Institute, February 1973.

2. Hankins, K. D. Unpublished Texas Highway Department inhouse working documents.
3. Glennon, J. C. "A Determination Framework for Wet Weather Speed Limits." Res. Rept. 134-8F, Texas Transportation Institute, August 1971.
4. Glennon, J. C. and Weaver, G. D. "The Relationship of Vehicle Paths to Highway Curve Design." Res. Rept. 134-5, Texas Transportation Ins ti tu te, May 1971.
5. Glennon, J. C. "Friction Requirements for High-Speed Passing Maneuvers." Res Rept. 134-7, Texas Transportation Institute, July 1971.
6. Weaver, G. D. and Glennon, J. C. "Passing Performance Measurements Related to Sight Distance Design." Res. Rept. 134-6, Texas Transportation Institute, June 1971.
7. Martinez, J. E., Lewis, J. M., and Stocker, A. J. "A Study of Variables Associated with Wheel Spin-Down and Hydroplaning." Res. Rept. 147-1, Texas Transportation Institute, March
1972.
The published version of this report may be obtained by addressing your request as follows:
R. L. Lewis, Chairman Research and Development Committee Texas Highway Department-File D-8 11th and Brazos Austin, Texas 78701 (Phone 512/475-2971)