factors contributing to non-value factors contributing
TRANSCRIPT
Factors contributing to non-valueadding activities in South African
constructionFidelis Emuze
Department of Built Environment,Faculty of Engineering and Information Technology,
Central University of Technology, Bloemfontein, South Africa
John SmallwoodDepartment of Construction Management,
Nelson Mandela Metropolitan University, Port Elizabeth, South Africa, and
Sangwon HanDepartment of Architectural Engineering, University of Seoul, Seoul, Korea
Abstract
Purpose – Non-value adding activities (NVAAs) are considered to be problematic in the managementof projects. Reported research findings suggest that these NVAAs consume resources withoutnecessarily adding value to completed tasks. The main aim of the research is to provide insights andplausible explanations concerning how NVAAs can propagate poor performance in South Africa.
Design/methodology/approach – The paper reports on a quantitative survey conducted amongpublic sector clients, consulting engineers, and civil engineering contractors in South Africa. Using aframework that was developed from the literature reviewed, the study proposed three conceptualqualitative models that were based on system dynamics.
Findings – The study suggests that NVAAs that are prevalent in South African construction canimpact project performance negatively in the form of cost and time overruns. It can also be argued thatalthough there is commonality between NVAAs that are identified in South Africa and other countries,their frequency and effects on project performance differ.
Research limitations/implications – The findings provide further insights about NVAAs that arerelated to the South African infrastructure sector only.
Originality/value – The study, which is the first of such in South Africa, could lead to increasedawareness among South African project stakeholders that are concerned about performanceimprovement from the lean construction perspective.
Keywords Performance, South Africa, System dynamics, Construction, Non-value adding activities
Paper type Case study
1. The background of the studyA comparative study that focused on two apartment complexes in South Africa showsthat on the average, variation orders accounted for 8 and 4 per cent of the total contractsum of the two apartments, respectively, (Ndihokubwayo and Haupt, 2008). The findingsnoted that variation orders on both projects occurred mainly due to design relatedproblems. These problems in turn contribute to non-value adding activities (NVAAs), andthe attendant cost and time overruns that marginalised the performance of both projects.The sub-optimal performance recorded on these projects is not an isolated case. Accordingto the Construction Industry Development Board (CIDB), the need to improve project
The current issue and full text archive of this journal is available at
www.emeraldinsight.com/1726-0531.htm
Journal of Engineering, Design andTechnology
Vol. 12 No. 2, 2014pp. 223-243
q Emerald Group Publishing Limited1726-0531
DOI 10.1108/JEDT-07-2011-0048
Factorscontributing
to NVAAs
223
performance in South Africa exists. A recent Construction Industry Indicators (CII) reportindicates that clients were neutral or dissatisfied with the performance of contractors on15 per cent of the projects surveyed in 2010 as health and safety (H&S), quality and otherperformance issues remain a concern in South Africa (CIDB, 2011).
Problematic construction projects are not peculiar to South African constructionalone. For instance, examples of problematic construction projects in the USA includethe Boston Big Dig project and the Kennedy Centre Parking Lot project that witnessed460 and 210 per cent cost growth, respectively, at project completion (Forbes andAhmed, 2011). It is the attempt to address similar issues that led to the introduction ofperformance improvement philosophies such as lean construction into the industry.According to Forbes and Ahmed (2011), lean design and construction involve theapplication of lean methods and/or techniques to the design and construction processso as to derive benefits that have been clearly established in manufacturing operations.Such benefits include lower costs, fewer delays, less uncertainty, less waste (NVAAs),more efficient buildings/facilities, and higher user satisfaction.
As an illustration, Forbes and Ahmed (2011) described a systems perspective of lean.Their description of the impact of value-added against non-value added time in a typicalconstruction process revealed that move time, wait time, and setup time constitutenon-value added time, while process time constitute value-added time. Theirexplanations show that “process time” represents the value-added phase in aconstruction process since it is the only time that a product is actually undergoingtransformation. According to Koskela (1992), NVAAs can be defined as activities thattake time, resources or space but do not add value. This definition, which is adopted inthis study, indicates that NVAAs are wasted efforts that consume time and/or resourceswithout directly or indirectly adding value to project requirements. Meanwhile, VAAsare operational efforts that realise project requirements that are defined in the contractand value supporting activities (VSAs) are supportive efforts that do not directly addvalue, though, they indirectly support other VAAs (Han, 2008).
In effect, the elimination or reduction of NVAAs is a key lean construction principle asthey can occur in the handoff from one task to another or from one trade to another in theform of delays and defects that must be corrected (Forbes and Ahmed, 2011). Such NVAAsinclude work not done, rework, unnecessary work, errors, stoppages, waste of materials,deterioration of materials, loss of labour, excessive supervision, additional space,abnormal wear and tear of equipment, delays to schedule, lack of supervision, and loss ofmaterial on site (Alancon, 1997; Alwi et al., 2002b). These NVAAs and certain VSAs (suchas housing keep tasks that must be carried out on site after a heavy rainfall), may in turn becaused by defects, overproduction, unnecessary processing, unnecessary materialmovement, unnecessary people movement, waiting periods, inventories, design changes,lack of trade’s skill, slow decision-making, poor coordination between project partners,poor planning and scheduling, delay in material delivery, poor construction methods, poorquality of site documentation, slow drawing revisions, unclear site design information,and inclement weather conditions (Koskela, 1992; Alwi et al., 2002a). These causes can becategorised with respect to design and documentation, procurement, material handling,professional management, and physical factors (Alwi et al., 2002a; Polat and Ballard,2004). Hence, the argument proposed as the research problem statement contends that theprevalence of NVAAs may be contributing to reported poor performance in South Africanconstruction. The argument is supported by the fact that NVAAs are reportedly
JEDT12,2
224
detrimental to project performance in the form of cost overruns, rework and poorproductivity (Ndihokubwayo and Haupt, 2008; Alwi et al., 2002a, b; Hwang et al., 2009;Horman and Kenley, 2005; Abdel-Razek et al., 2007; Han, 2008). It is notable that if theseNVAAs are left unrestrained they can negate the intentions of organisations in theindustry in terms of competitiveness (Alwi et al., 2002a; Koskenvesa et al., 2010).
The primary objective of the research is therefore underpinned by the need toinvestigate the dynamics that have seemingly engendered poor project performancedue to the menace of NVAAs in construction (Han, 2008). The objective is predicatedon the assumption that the traditional project parameters of cost, H&S, quality, andtime have continued to perform poorly in South Africa (Manthe, 2008).
2. The research methodThe theme for the proposed models is anchored on the importance of providingcompelling explanations for how performance differences arise, persist, and disappearover time in South African construction. Due to the desire to identify NVAAs that aresignificant in the South African construction context, the causes of these NVAAs andtheir effects, a mixed-mode quantitative survey was conducted among key projectstakeholders in the South African infrastructure sector. Specifically, a total number of122 clients, 117 consulting engineers, and 108 civil engineering contractors weresurveyed with a structured questionnaire that was initially sent by post and then sent bye-mail as reminders. Although a pilot survey was conducted four months before the startof the actual field work, valid responses that were received were limited to 88 at the endof the survey period. This equates to a 25.4 per cent response rate.
The clarity, understanding and interpretation of the questions were enhanced basedon the feedback provided by the respondents to the pilot survey. Empirical publicationssuch as Koskela (1992), Alancon (1997), Alwi et al. (2002b), Arbulu et al. (2003) and Polatand Ballard (2004) provided the basis for the questionnaire that was compiled for thesurvey. A total number of 40 NVAAs, 40 causes of NVAAs and 14 consequences ofNVAAs were identified and used for the empirical study. Given that a number of thesepublications relied on data generated through quantitative surveys, the postal ande-mail survey method was used for collecting the primary data for the study. Themethod was deemed useful as one of the key heuristic principles of lean constructionsuggests that NVAAs can be reduced through identification, measurement, andredesign (Forbes and Ahmed, 2011). In particular, the 40 variables relative to NVAAsthat contribute to poor project performance were separated into five classifications witheight variables assigned to each category. The classifications include NVAAs that occurdue to rework, waiting periods, material, movement, and human resources. Similarly,the 40 variables relative to causes of NVAAs were separated into five classificationswith eight variables assigned to each category. The classifications include the causes ofNVAAs related to human resources, designers, information and documentation,material/equipment, and site operations. The survey questionnaire was designed byasking respondents to identify NVAAs that contribute to poor project performance,construction related activities that lead to NVAAs (causes of NVAAs), and the issuesthat occurs as a result of NVAAs (consequences of NVAAs) in construction.
At the end of the data collection and analysis phase of the study, system dynamics (SD)concepts were used for model development based on the debate that SD models provideexcellent platforms for eliciting information required for identifying important
Factorscontributing
to NVAAs
225
managerial problems and their solutions (Gary et al., 2008). Sterman (2000) suggests thatSD, which is partly a method for developing management flight simulators in the form ofsimulation models, is a method for enhancing learning in complex systems. Sterman(2000) emphasized that SD models are developed to enhance learning about complexsystems, understand the sources of policy resistance, and also to facilitate the design ofmore effective policies. In specific terms, Forrester (2007) is of the opinion that SDmodelling can organise the descriptive information, retain the richness of the realprocesses, build on the experiential knowledge of managers, and also reveal the variety ofdynamic behaviours that flow from different choices of policies. Therefore, the modelsproposed in this paper, which were developed with “Vensimw software”, relied on datagenerated through empirical investigations, and the researchers’ mental models based onconstruction site management experiences gained in developing countries such as Nigeriaand South Africa. It can be argued therefore that the two basic sources of information usedfor the models are well known within the SD research community as SD researchers havealways drawn on numerical, written, and mental databases to identify system structuresthat are responsible for a dynamic behaviour of interest (Gary et al., 2008).
3. Results and discussionIn view of the fact that this paper forms an aspect of a larger research project, the use ofhierarchy noted with ordinal data is considered appropriate for presenting the results.The measurement scales indicated in Table I are thus central to the discussion of thefindings. In order to present the validity and reliability of the data, the Cronbach’s aand Spearman’s correlations were computed. The Spearman’s correlations related toclients and consultants, clients and contractors, and consultants and contractors werecomputed and presented alongside the findings of the survey. Cronbach’s a presentedalongside the Spearman’s correlations show that the individual mean scores (MS)recorded in a question can be reliably combined into a single mean, that is, it is used forcombing items in Likert-type scale question that used each individual item to measurea phenomenon that has an underlying quantitative measurement continuum(Gliem and Gliem, 2003). Though, there is actually no lower limit to the coefficient,Cronbach’s a reliability coefficient normally range between 0.0 and 1.0. In brief, Georgeand Mallery (2003) provide the following rules of thumb: .0.9 ¼ excellent;.0.8 ¼ good; .0.7 ¼ acceptable; .0.6 ¼ questionable; .0.5 ¼ poor, and,0.5 ¼ unacceptable, for interpreting Cronbach’s a coefficient.
In terms of the Spearman’s coefficient, the value ranges from 21 to þ1, with þ1indicating a perfect positive relationship, 21 indicating a perfect negative relationship,and 0 indicating perfect independence (Agresti and Franklin, 2007). In addition, it isinstructive to note that all the inferential statistics computed were based on the 5 per centlevel of significance.
Scale Meaning
5 Major extent – always4 Near major extent – often3 Some extent – sometimes2 Near minor extent – rarely1 Near minor extent – never
Table I.Terms used to discussfindings
JEDT12,2
226

3.1 Causes of NVAAS in South African constructionThis section presents the perceptions of the respondents pertaining to tasks that couldlead to the manifestation of NVAAs in construction. Tables II and III present theCronbach’s a and the correlation statistics associated with the causes of NVAAs thatwere evaluated in the study. It can be observed that the Cronbach’s a ranged fromgood to excellent (Table II) and the correlations ranged from fair to good (Table III).However, the correlations between the responses of clients and consultants as well asthe one between clients and contractors are better than the correlations betweenconsultants and contractors (Table III).
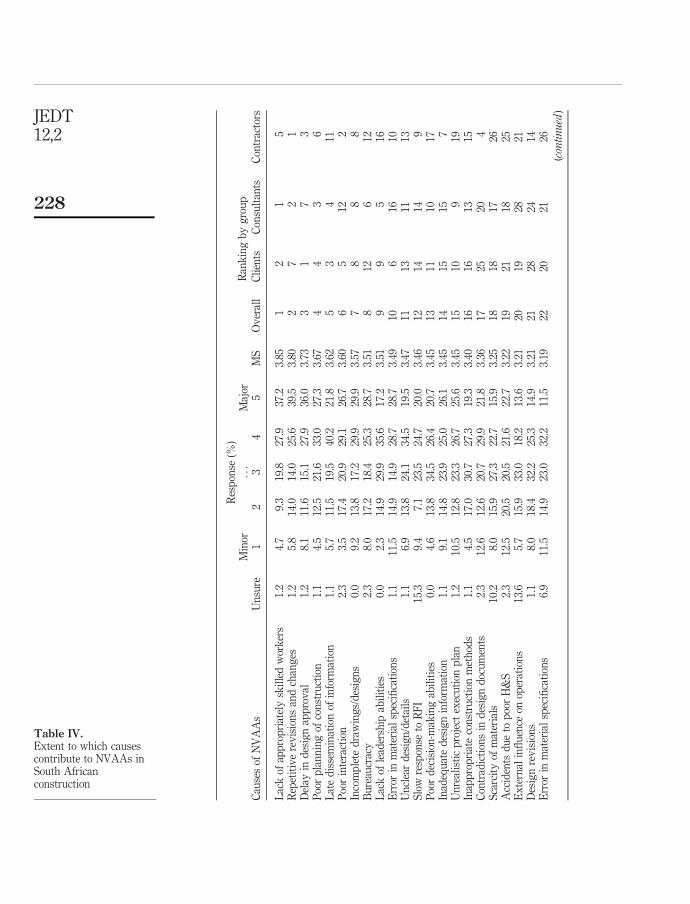
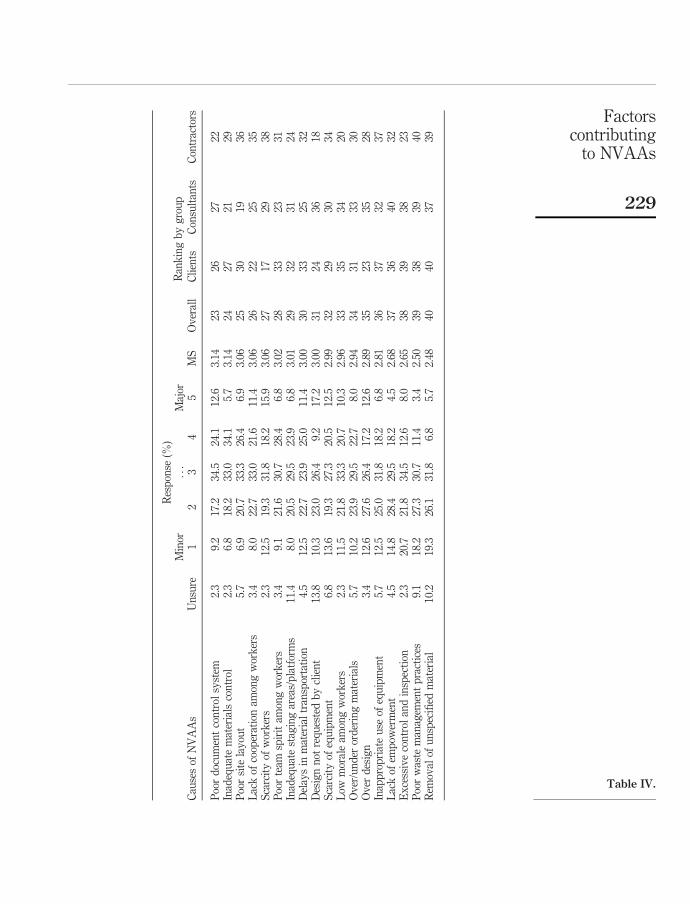
In addition, Table IV indicates the respondents’ perceptions of the extent to whichcauses contribute to NVAAs in South African construction in terms of percentageresponses to a scale of 1 (minor) to 5 (major), and a MS ranging between 1.00 and 5.00.Given that the causes of NVAAs are ranked from first to fortieth based on responsesreceived, the survey respondents can be deemed to perceive that 15 of these causescontribute more of a major than a minor extent to the occurrence of NVAAs in SouthAfrican construction (Table IV).
These suggest that the respondents perceive that lack of appropriately skilledworkers and repetitive revisions and changes contribute the most to the occurrence ofNVAAs in South Africa (Table IV). The respondents further observed that delay indesign approval, poor planning of construction, late dissemination of information, poorinteraction (presumably among consultants), incomplete drawings/designs,bureaucracy, lack of leadership abilities, error in material specifications, uncleardesign/details, slow response to requests for information (RFI), poor decision-makingabilities, inadequate design information (that leads to design revisions), and unrealisticproject execution plan also contribute significantly to the malaise.
The findings suggest that at the very least on a project, the likelihood of occurrenceof any of the top 15 causes of NVAAs in Table IV may be major. Therefore, relying onthe data and common construction processes, a conceptual model is herein proposed.The variables identified in Table IV enabled the development of a qualitative causalloop diagram (Figure 1) for a hypothetical project A. In construction, it is normally
Classification Cronbach’s a Number of items
Causes of NVAAs related to human resources 0.878 8Causes of NVAAs related to designers (consultants) 0.923 8Causes of NVAAs related to information anddocumentation 0.942 8Causes of NVAAs related to materials/equipment 0.920 8Causes of NVAAs related to site operations 0.918 8
Table II.Reliability statistics
related to the causes ofNVAAs in South African
construction
Classification Clients Consultants Contractors
Clients 1.0000 0.5397 0.4932Consultants 0.5397 1.0000 0.2250Contractors 0.4933 0.2250 1.0000
Table III.Correlations related to
causes of NVAAs inSouth African
construction
Factorscontributing
to NVAAs
227
Res
pon
se(%
)R
ank
ing
by
gro
up
Min
or...
Maj
orC
ause
sof
NV
AA
sU
nsu
re1
23
45
MS
Ov
eral
lC
lien
tsC
onsu
ltan
tsC
ontr
acto
rs
Lac
kof
app
rop
riat
ely
skil
led
wor
ker
s1.
24.
79.
319
.827
.937
.23.
851
21
5R
epet
itiv
ere
vis
ion
san
dch
ang
es1.
25.
814
.014
.025
.639
.53.
802
72
1D
elay
ind
esig
nap
pro
val
1.2
8.1
11.6
15.1
27.9
36.0
3.73
31
73
Poo
rp
lan
nin
gof
con
stru
ctio
n1.
14.
512
.521
.633
.027
.33.
674
43
6L
ate
dis
sem
inat
ion
ofin
form
atio
n1.
15.
711
.519
.540
.221
.83.
625
34
11P
oor
inte
ract
ion
2.3
3.5
17.4
20.9
29.1
26.7
3.60
65
122
Inco
mp
lete
dra
win
gs/
des
ign
s0.
09.
213
.817
.229
.929
.93.
577
88
8B
ure
aucr
acy
2.3
8.0
17.2
18.4
25.3
28.7
3.51
812
612
Lac
kof
lead
ersh
ipab
ilit
ies
0.0
2.3
14.9
29.9
35.6
17.2
3.51
99
516
Err
orin
mat
eria
lsp
ecifi
cati
ons
1.1
11.5
14.9
14.9
28.7
28.7
3.49
106
1610
Un
clea
rd
esig
n/d
etai
ls1.
16.
913
.824
.134
.519
.53.
4711
1311
13S
low
resp
onse
toR
FI
15.3
9.4
7.1
23.5
24.7
20.0
3.46
1214
149
Poo
rd
ecis
ion
-mak
ing
abil
itie
s0.
04.
613
.834
.526
.420
.73.
4513
1110
17In
adeq
uat
ed
esig
nin
form
atio
n1.
19.
114
.823
.925
.026
.13.
4514
1515
7U
nre
alis
tic
pro
ject
exec
uti
onp
lan
1.2
10.5
12.8
23.3
26.7
25.6
3.45
1510
919
Inap
pro
pri
ate
con
stru
ctio
nm
eth
ods
1.1
4.5
17.0
30.7
27.3
19.3
3.40
1616
1315
Con
trad
icti
ons
ind
esig
nd
ocu
men
ts2.
312
.612
.620
.729
.921
.83.
3617
2520
4S
carc
ity
ofm
ater
ials
10.2
8.0
15.9
27.3
22.7
15.9
3.25
1818
1726
Acc
iden
tsd
ue
top
oor
H&
S2.
312
.520
.520
.521
.622
.73.
2219
2118
25E
xte
rnal
infl
uen
ceon
oper
atio
ns
13.6
5.7
15.9
33.0
18.2
13.6
3.21
2019
2821
Des
ign
rev
isio
ns
1.1
8.0
18.4
32.2
25.3
14.9
3.21
2128
2414
Err
orin
mat
eria
lsp
ecifi
cati
ons
6.9
11.5
14.9
23.0
32.2
11.5
3.19
2220
2126
(continued
)
Table IV.Extent to which causescontribute to NVAAs inSouth Africanconstruction
JEDT12,2
228
Res
pon
se(%
)R
ank
ing
by
gro
up
Min
or...
Maj
orC
ause
sof
NV
AA
sU
nsu
re1
23
45
MS
Ov
eral
lC
lien
tsC
onsu
ltan
tsC
ontr
acto
rs
Poo
rd
ocu
men
tco
ntr
olsy
stem
2.3
9.2
17.2
34.5
24.1
12.6
3.14
2326
2722
Inad
equ
ate
mat
eria
lsco
ntr
ol2.
36.
818
.233
.034
.15.
73.
1424
2721
29P
oor
site
lay
out
5.7
6.9
20.7
33.3
26.4
6.9
3.06
2530
1936
Lac
kof
coop
erat
ion
amon
gw
ork
ers
3.4
8.0
22.7
33.0
21.6
11.4
3.06
2622
2535
Sca
rcit
yof
wor
ker
s2.
312
.519
.331
.818
.215
.93.
0627
1729
38P
oor
team
spir
itam
ong
wor
ker
s3.
49.
121
.630
.728
.46.
83.
0228
3323
31In
adeq
uat
est
agin
gar
eas/
pla
tfor
ms
11.4
8.0
20.5
29.5
23.9
6.8
3.01
2932
3124
Del
ays
inm
ater
ial
tran
spor
tati
on4.
512
.522
.723
.925
.011
.43.
0030
3325
32D
esig
nn
otre
qu
este
db
ycl
ien
t13
.810
.323
.026
.49.
217
.23.
0031
2436
18S
carc
ity
ofeq
uip
men
t6.
813
.619
.327
.320
.512
.52.
9932
2930
34L
owm
oral
eam
ong
wor
ker
s2.
311
.521
.833
.320
.710
.32.
9633
3534
20O
ver
/un
der
ord
erin
gm
ater
ials
5.7
10.2
23.9
29.5
22.7
8.0
2.94
3431
3330
Ov
erd
esig
n3.
412
.627
.626
.417
.212
.62.
8935
2335
28In
app
rop
riat
eu
seof
equ
ipm
ent
5.7
12.5
25.0
31.8
18.2
6.8
2.81
3637
3237
Lac
kof
emp
ower
men
t4.
514
.828
.429
.518
.24.
52.
6837
3640
32E
xce
ssiv
eco
ntr
olan
din
spec
tion
2.3
20.7
21.8
34.5
12.6
8.0
2.65
3839
3823
Poo
rw
aste
man
agem
ent
pra
ctic
es9.
118
.227
.330
.711
.43.
42.
5039
3839
40R
emov
alof
un
spec
ified
mat
eria
l10
.219
.326
.131
.86.
85.
72.
4840
4037
39
Table IV.
Factorscontributing
to NVAAs
229

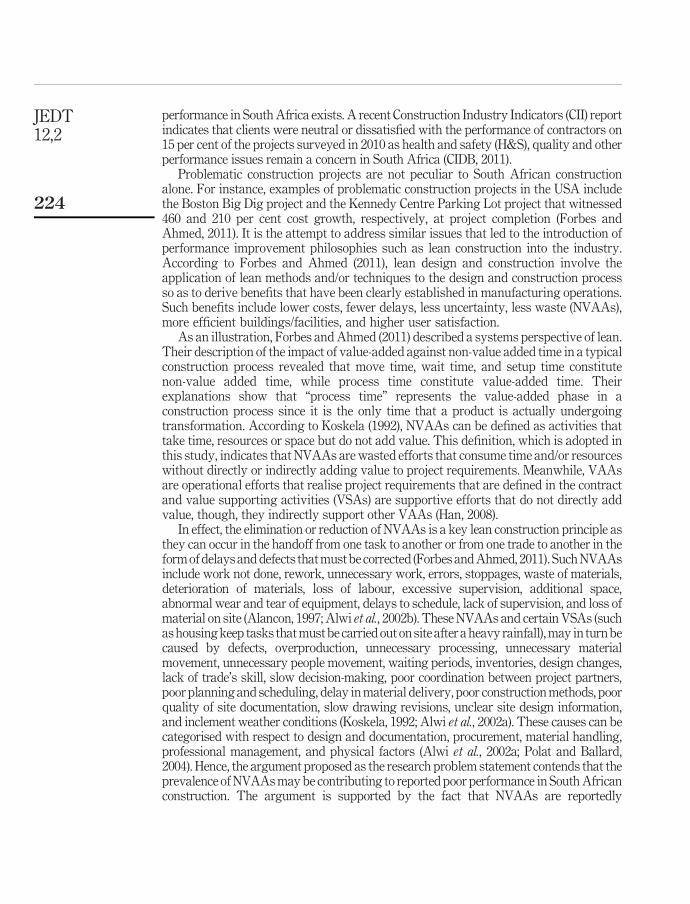
assumed that the skills of designers determine the standard of designs andspecifications compiled for project activities, albeit at varying degrees due toskill/performance-based errors in the form of lapses and slips (Lopez et al., 2010).Skill-based errors relative to lapses and slips that normally arise due to carelessnessand/or neglect may lead to unanticipated outcomes when diligence is not observed inthe execution of tasks (Love et al., 2008). However, when the disruptive tendencies oferrors are removed from the execution process, the skills of designers will significantlyinfluence the adequacy of design information (1-4 in Figure 1).
When the design information provided to contractors is deemed to be adequate by theusers, design related NVAAs may become minimal on the project (9 in Figure 1).However, as demonstrated in the construction management literature, designinformation is often inadequate (Love et al., 2008). Whenever this inadequacy occurs,it can lead to increases in design changes, coordination problems, rework, and in extremecases, fatalities may occur too (Lopez et al., 2010). This perceived inadequacy can alsolead to RFI that originate mostly from site management to designers (5 in Figure 1). Thegenerated RFIs will unsurprisingly lead to revision of information (6 in Figure 1), whichmay be delayed by bureaucracy and/or approval of the design (17 and 18 in Figure 1).However, when the revised information is ready after the design processes haveundergone proper quality assurance procedures in order to weed out errors, the designinformation may be deemed adequate (7 in Figure 1). According to Love et al. (2008),a significant factor that contributes to the production of poor quality design informationis related to the reluctance of designers to diligently check for errors because of their high
Figure 1.Dynamics of the causes ofNVAAs in South Africanconstruction
skills of workers
specification ofmaterials
compilation ofdesigns
adequacy of designinformation
Non-value addingactivities
planning ofconstruction
robustness ofdecision-making
ability to leadworkers
RFIsapproval of design
bureaucracy
revision ofinformation
+
+
+
– –
++
–+
+
–
+
+
– –
+
–
+
1
2
3
45
6
7
89
10
11
12
13
14
15
16
17
18
JEDT12,2
230
job demands. As a result of these shortcomings, revision of information that oftenincreases the likelihood of NVAAs may occur on the project (8 in Figure 1).
Furthermore, the more time project participants spend on NVAAs, the less chancethey have to improve their skills (10 in Figure 1), that is, it is only by engaging inmeaningful activities that can add to the progress of the works (project) and also evolverelevant experiences that translate to skills gained by project participants. Similarly, thelevel of skills of construction professionals affects their ability to plan assigned work.It should be noted that proper planning of construction decreases NVAAs in a project(15 and 16 in Figure 1). Still within the same analogy, the levels of skills offoremen/supervisors could influence the robustness of their decision-making abilities aswell as their ability to lead other workers, which may in turn diminish the frequency ofNVAAs in a project (11-14 in Figure 1). To be succinct, this dynamic explains why thelevel of skills of workers, designers, and construction managers are considered importantfor project execution. For example, insufficient knowledge and the lack of necessary skillsare factors that contribute to errors in design documentation (Sunyoto and Minato, 2003).
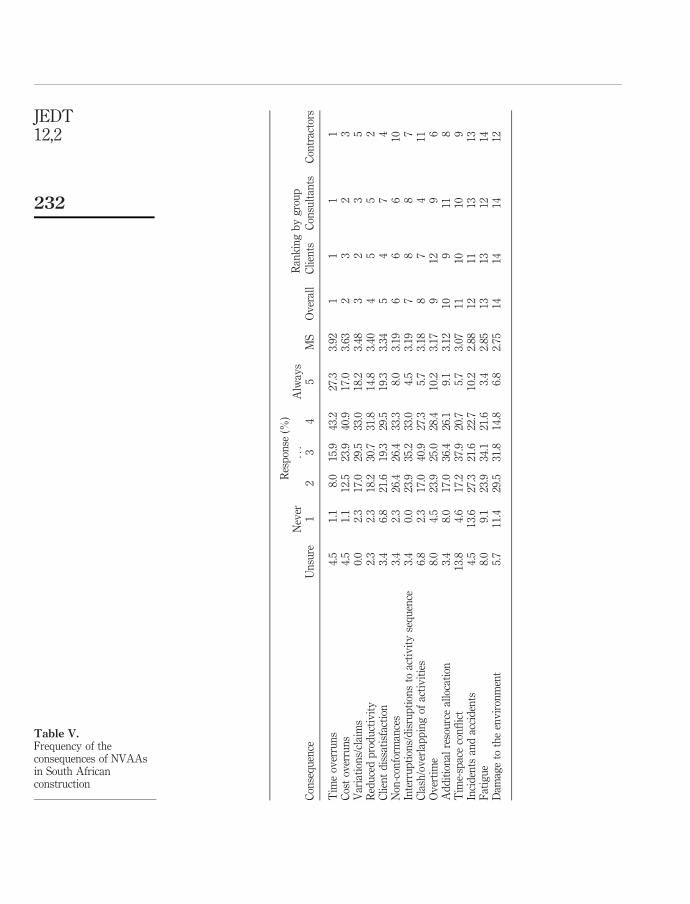
3.2 Consequences of NVAAs in South African constructionThe consequences of NVAAs that are presented in this section amplify the need toaddress the causes of NVAAs that were presented in the previous section because oftheir far reaching implications in a project environment. To this end, Table V indicatesthe respondents’ perception of the frequency that certain consequences of NVAAsoccur in South African construction in terms of percentage responses to a scale of1 (never) to 5 (always), and a MS ranging between 1.00 and 5.00. It is notable that 11 ofthe 14 consequences of NVAAs have MSs above the midpoint of 3.00, which indicatesthat in general these consequences of NVAAs can be deemed to occur in South Africaand possibly, the global construction industry.
It can also be observed that the Cronbach’s a related to the 14 consequences ofNVAAs examined can be considered as excellent, while the correlations ranged fromvery good to excellent (Table VI). The correlations between the responses of clients andconsultants as well as the one between clients and contractors are better than thecorrelations between consultants and contractors (Table VI). The findings suggest thatthe respondents can be deemed to perceive that time overruns, cost overruns, andvariations/claims may be taking place often in South African construction.
The ranking in the table suggests that the respondents were of the opinion that reducedproductivity, client dissatisfaction, non-conformances, interruptions/disruptions toactivity sequence, clash/overlapping of activities, overtime, additional resourceallocation, time-space conflict, incidents and accidents, fatigue, and damage to theenvironment occur rarely or sometimes as a result of NVAAs in South Africanconstruction. It is instructive to note that despite the fact that the variables documented inFigure 1 may be significant in the South African context, due to different industrycharacteristics, they may not be significant in other countries. Specifically, the literaturehas extensively demonstrated the contributions of interruptions, rework, errors, and othervariables to the occurrence of NVAAs in construction (Han, 2008; Park and Pena-Mora,2003; Lee et al., 2005). Therefore, Figure 1 is herein merged with the feedback processmodel proposed by Han (2008) as indicated in Figure 2. The figure is complemented withthe consequences of NVAAs that are perceived to be significant in South Africa asindicated in Table V.
Factorscontributing
to NVAAs
231
Res
pon
se(%
)R
ank
ing
by
gro
up
Nev
er...
Alw
ays
Con
seq
uen
ceU
nsu
re1
23
45
MS
Ov
eral
lC
lien
tsC
onsu
ltan
tsC
ontr
acto
rs
Tim
eov
erru
ns
4.5
1.1
8.0
15.9
43.2
27.3
3.92
11
11
Cos
tov
erru
ns
4.5
1.1
12.5
23.9
40.9
17.0
3.63
23
23
Var
iati
ons/
clai
ms
0.0
2.3
17.0
29.5
33.0
18.2
3.48
32
35
Red
uce
dp
rod
uct
ivit
y2.
32.
318
.230
.731
.814
.83.
404
55
2C
lien
td
issa
tisf
acti
on3.
46.
821
.619
.329
.519
.33.
345
47
4N
on-c
onfo
rman
ces
3.4
2.3
26.4
26.4
33.3
8.0
3.19
66
610
Inte
rru
pti
ons/
dis
rup
tion
sto
acti
vit
yse
qu
ence
3.4
0.0
23.9
35.2
33.0
4.5
3.19
78
87
Cla
sh/o
ver
lap
pin
gof
acti
vit
ies
6.8
2.3
17.0
40.9
27.3
5.7
3.18
87
411
Ov
erti
me
8.0
4.5
23.9
25.0
28.4
10.2
3.17
912
96
Ad
dit
ion
alre
sou
rce
allo
cati
on3.
48.
017
.036
.426
.19.
13.
1210
911
8T
ime-
spac
eco
nfl
ict
13.8
4.6
17.2
37.9
20.7
5.7
3.07
1110
109
Inci
den
tsan
dac
cid
ents
4.5
13.6
27.3
21.6
22.7
10.2
2.88
1211
1313
Fat
igu
e8.
09.
123
.934
.121
.63.
42.
8513
1312
14D
amag
eto
the
env
iron
men
t5.
711
.429
.531
.814
.86.
82.
7514
1414
12
Table V.Frequency of theconsequences of NVAAsin South Africanconstruction
JEDT12,2
232

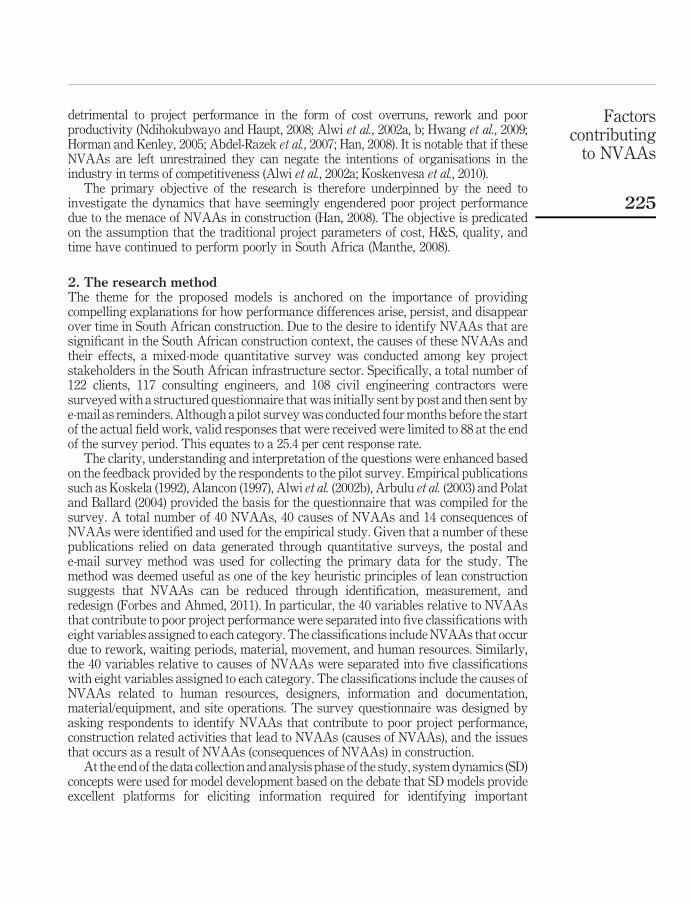
Essentially, the table reveals that quality issues (changes, interruption and rework inFigure 2) as well as productivity issues (fatigue, overtime and overlapping in Figure 2)may arise due to NVAAs in South African construction. Using the same hypotheticalproject A as an example, and the illustration of Han (2008), the proposed extendedfeedback process model is herein explained. In the proposed model (Figure 2), it isimportant to note that revision of information, bureaucracy, and approval of design thatwere part of Figure 1 were subsumed by changes and rework in Figure 2. The redcoloured arrows, which were the new additions to the model proposed by Han (2008),suggest that the occurrence of NVAAs may decline when their causes are adequatelyaddressed. As an illustration, if in project A design information is inadequate,construction is poorly planned, decision-making is inappropriate and constructionworkers in the form of foremen/or supervisors cannot lead when they are supposed to doso, then it will not be a surprise if problems associated with cost, time, quality, and H&Sbegin to consume resources, slow down the progress of work, and in worst casescenarios, marginalise the realisation of project objectives.
Classification Clients Consultants Contractors
Clients 1.0000 0.9165 0.7846Consultants 0.9165 1.0000 0.7451Contractors 0.7846 0.7451 1.0000Cronbach’s a 0.903Number of items 14
Table VI.Reliability statistics and
correlations related toconsequences of NVAAs
in South Africanconstruction
Figure 2.NVAAs in constructionfeedback process model
Value AddingActivities
Total RequiredEfforts
Extra Work
Changes
Interruption
Non-Value AddingActivities
Rework
Errors
Latency
Fatigue
Productivity
Morale
Overtime
Required Duration
Overlapping
Interdependency
Sensitivity
Value SupportingActivities
+
+
+
+
+
+
+
+
+
–
–
+
–
+
+
–
+
+
+
–
–
–
+
+
+
–
+
–
+
Skills of workers
Specification ofmaterials
Compilation ofdesigns
Adequacy of designinformation
Planning ofconstruction
Robustness ofdecision-making
Abilility to leadworkers
RFIs
+
+
+
–
+
+
+
+
––
– –
+
–
+
30
1
2
3
25
8
5
7
4
28
6
10
9
27
26
14
15
1718
1613
11
21
19
20
22
23
24
29
31
32
33
34 35
36
37
38
39
40
4142
4344
45
Factorscontributing
to NVAAs
233
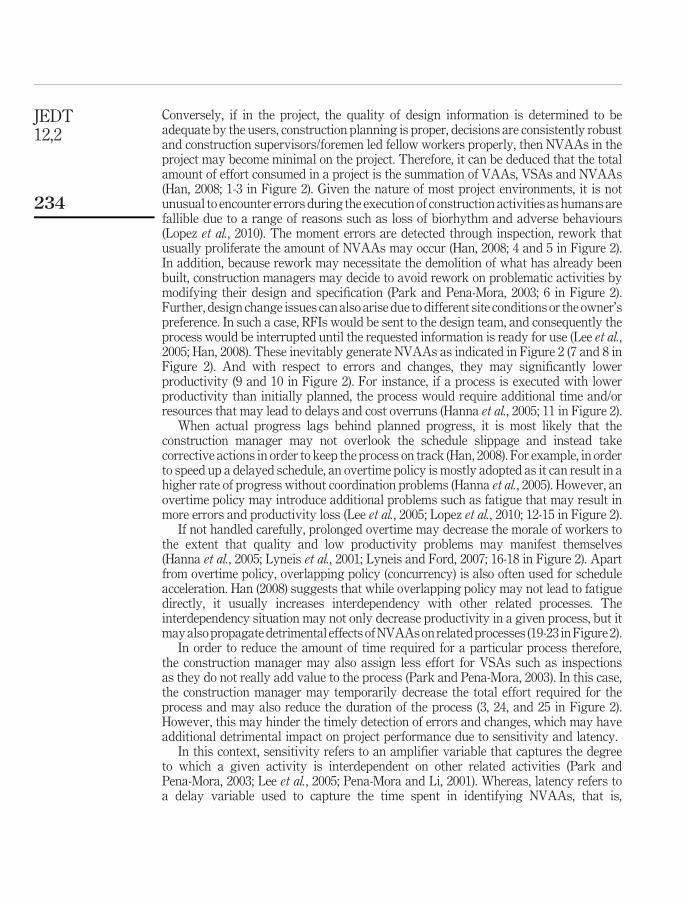
Conversely, if in the project, the quality of design information is determined to beadequate by the users, construction planning is proper, decisions are consistently robustand construction supervisors/foremen led fellow workers properly, then NVAAs in theproject may become minimal on the project. Therefore, it can be deduced that the totalamount of effort consumed in a project is the summation of VAAs, VSAs and NVAAs(Han, 2008; 1-3 in Figure 2). Given the nature of most project environments, it is notunusual to encounter errors during the execution of construction activities as humans arefallible due to a range of reasons such as loss of biorhythm and adverse behaviours(Lopez et al., 2010). The moment errors are detected through inspection, rework thatusually proliferate the amount of NVAAs may occur (Han, 2008; 4 and 5 in Figure 2).In addition, because rework may necessitate the demolition of what has already beenbuilt, construction managers may decide to avoid rework on problematic activities bymodifying their design and specification (Park and Pena-Mora, 2003; 6 in Figure 2).Further, design change issues can also arise due to different site conditions or the owner’spreference. In such a case, RFIs would be sent to the design team, and consequently theprocess would be interrupted until the requested information is ready for use (Lee et al.,2005; Han, 2008). These inevitably generate NVAAs as indicated in Figure 2 (7 and 8 inFigure 2). And with respect to errors and changes, they may significantly lowerproductivity (9 and 10 in Figure 2). For instance, if a process is executed with lowerproductivity than initially planned, the process would require additional time and/orresources that may lead to delays and cost overruns (Hanna et al., 2005; 11 in Figure 2).
When actual progress lags behind planned progress, it is most likely that theconstruction manager may not overlook the schedule slippage and instead takecorrective actions in order to keep the process on track (Han, 2008). For example, in orderto speed up a delayed schedule, an overtime policy is mostly adopted as it can result in ahigher rate of progress without coordination problems (Hanna et al., 2005). However, anovertime policy may introduce additional problems such as fatigue that may result inmore errors and productivity loss (Lee et al., 2005; Lopez et al., 2010; 12-15 in Figure 2).
If not handled carefully, prolonged overtime may decrease the morale of workers tothe extent that quality and low productivity problems may manifest themselves(Hanna et al., 2005; Lyneis et al., 2001; Lyneis and Ford, 2007; 16-18 in Figure 2). Apartfrom overtime policy, overlapping policy (concurrency) is also often used for scheduleacceleration. Han (2008) suggests that while overlapping policy may not lead to fatiguedirectly, it usually increases interdependency with other related processes. Theinterdependency situation may not only decrease productivity in a given process, but itmay also propagate detrimental effects of NVAAs on related processes (19-23 in Figure 2).
In order to reduce the amount of time required for a particular process therefore,the construction manager may also assign less effort for VSAs such as inspectionsas they do not really add value to the process (Park and Pena-Mora, 2003). In this case,the construction manager may temporarily decrease the total effort required for theprocess and may also reduce the duration of the process (3, 24, and 25 in Figure 2).However, this may hinder the timely detection of errors and changes, which may haveadditional detrimental impact on project performance due to sensitivity and latency.
In this context, sensitivity refers to an amplifier variable that captures the degreeto which a given activity is interdependent on other related activities (Park andPena-Mora, 2003; Lee et al., 2005; Pena-Mora and Li, 2001). Whereas, latency refers toa delay variable used to capture the time spent in identifying NVAAs, that is,
JEDT12,2
234
the difference in time between the occurrence of NVAAs and when they are addressed(Lee et al., 2005). The reason for the increase due to the explained “sensitivity andlatency” is that the longer it takes to identify errors and changes, the more serious isthe potential damage (Lee et al., 2005; Han, 2008). Therefore, a more complex and costlycorrective actions may become necessary in order to remedy the situation (26-28 inFigure 2). Explained in this manner, it can be argued that such feedback mechanismsuggests that the amount of NVAAs can be dramatically compounded by error andchanges if they are not timely and thoroughly resolved (Han, 2008). Moreover, theamount of VAAs (work scope) may be creeping during execution, while scheduledelays and cost overruns could be on the upswing (29 and 30 in Figure 2).
Though, these feedback mechanisms that Han (2008) proposed had identifiedvariables that increases NVAAs, the model is arguably extendable since SD models aremostly developed in a robust manner so as to accommodate future considerations.Variables coloured in red dash arrows were thus incorporated into the model in orderto explicitly include the influences that “competence” has on NVAAs. As aforesaid, inconstruction it is not unusual to assume that the skills of designers such as architectsor engineers affect the standard of designs and specifications (design information)compiled for project activities to some extent (31-34 in Figure 2).
If the design information is deemed adequate, then design related NVAAs will beminimal on the project (37 in Figure 2). However, design information is often inadequate(Love et al., 2008). This perceived inadequacy eventually leads to RFIs from constructionsites (35 in Figure 2). The generated RFIs will unsurprisingly lead to changes (36 inFigure 2), which could necessitate rework (45 in Figure 2). It is notable that when duediligence is not observed in the execution of tasks, skills of designers will often not beenough to ensure the realisation of anticipated outcomes (Lopez et al., 2010). But if thedesign information is adequate, the need for an RFI may not arise (37 in Figure 2).
Furthermore, the more time project participants expend on NVAAs decreases theirchances of partaking in VAAs that could improve their skills (38 in Figure 2), that is, it isthe engagement in meaningful activities (VAAs) that adds to relevant experiences andknowledge, which potentially translates to improved skills. Similarly, the level of skills ofconstruction professionals determines their ability to plan assigned construction worksince proper planning of construction decreases NVAAs in projects (43 and 44 in Figure 2).
The level of skills of workers also influences the robustness of their decision-makingabilities as well as their ability to lead other workers, a situation which may in turndiminish/or increase NVAAs in the project (39-42 in Figure 2). The added variables mayeither increase the amount of NVAAs or decrease its amount in construction. Theimportance of the additional variables (31-45 in Figure 2) is underpinned by the assumptionthat the construction process is still largely human resource driven as in developing nations,and by implication the competence of everyone involved in project execution (clients,designers, contractors, and possibly suppliers) is critical to successful completion of projectsregardless of type and/or size. In particular, this is important to the strategic management ofprojects as astute decisions based on the dynamics influencing performance may assistmanagers in making sure that construction tasks are completed successfully.
3.3 NVAAs in South African constructionThis section shows the NVAAs that can engender poor project performance in theconstruction industry. The NVAAs, which may be caused by the anomalies that were
Factorscontributing
to NVAAs
235
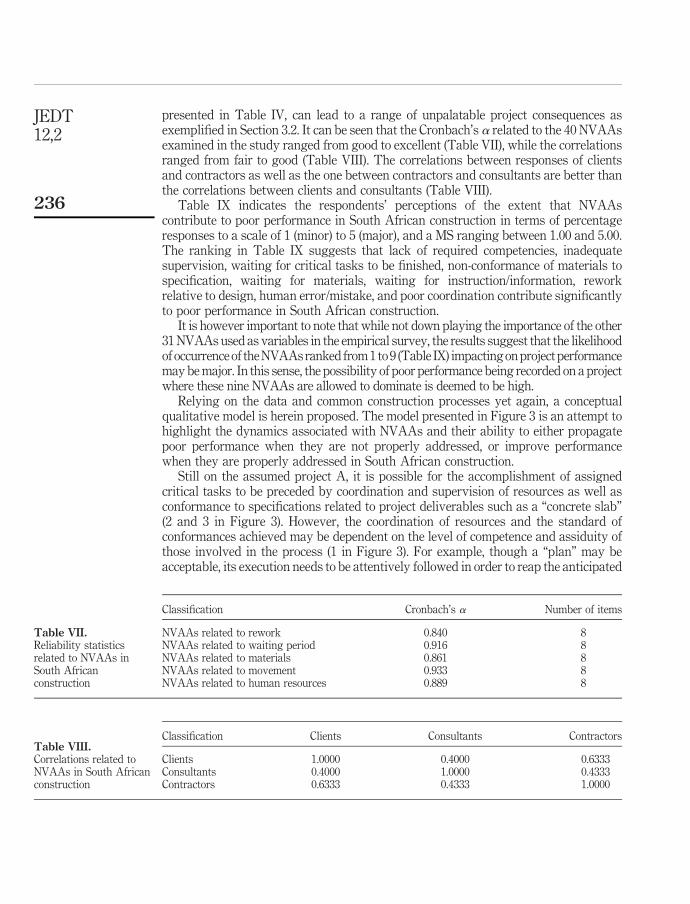
presented in Table IV, can lead to a range of unpalatable project consequences asexemplified in Section 3.2. It can be seen that the Cronbach’s a related to the 40 NVAAsexamined in the study ranged from good to excellent (Table VII), while the correlationsranged from fair to good (Table VIII). The correlations between responses of clientsand contractors as well as the one between contractors and consultants are better thanthe correlations between clients and consultants (Table VIII).
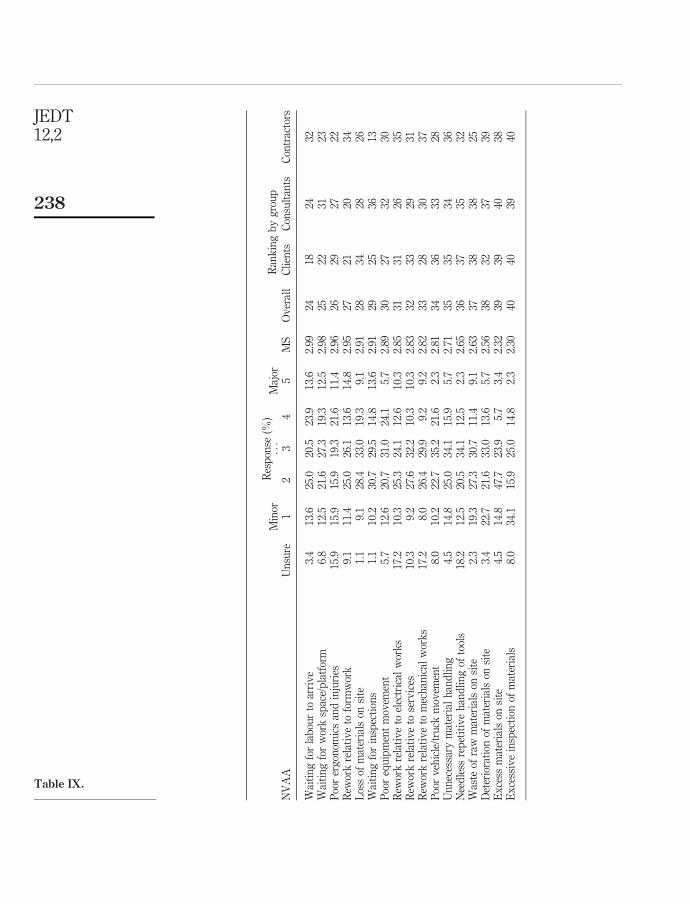
Table IX indicates the respondents’ perceptions of the extent that NVAAscontribute to poor performance in South African construction in terms of percentageresponses to a scale of 1 (minor) to 5 (major), and a MS ranging between 1.00 and 5.00.The ranking in Table IX suggests that lack of required competencies, inadequatesupervision, waiting for critical tasks to be finished, non-conformance of materials tospecification, waiting for materials, waiting for instruction/information, reworkrelative to design, human error/mistake, and poor coordination contribute significantlyto poor performance in South African construction.
It is however important to note that while not down playing the importance of the other31 NVAAs used as variables in the empirical survey, the results suggest that the likelihoodof occurrence of the NVAAs ranked from 1 to 9 (Table IX) impacting on project performancemay be major. In this sense, the possibility of poor performance being recorded on a projectwhere these nine NVAAs are allowed to dominate is deemed to be high.
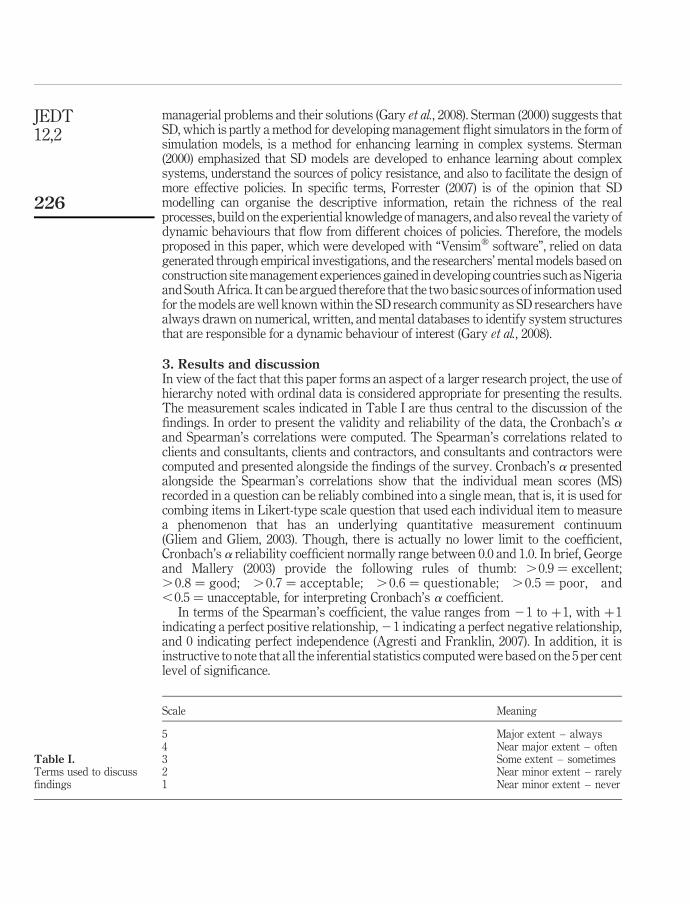
Relying on the data and common construction processes yet again, a conceptualqualitative model is herein proposed. The model presented in Figure 3 is an attempt tohighlight the dynamics associated with NVAAs and their ability to either propagatepoor performance when they are not properly addressed, or improve performancewhen they are properly addressed in South African construction.
Still on the assumed project A, it is possible for the accomplishment of assignedcritical tasks to be preceded by coordination and supervision of resources as well asconformance to specifications related to project deliverables such as a “concrete slab”(2 and 3 in Figure 3). However, the coordination of resources and the standard ofconformances achieved may be dependent on the level of competence and assiduity ofthose involved in the process (1 in Figure 3). For example, though a “plan” may beacceptable, its execution needs to be attentively followed in order to reap the anticipated
Classification Cronbach’s a Number of items
NVAAs related to rework 0.840 8NVAAs related to waiting period 0.916 8NVAAs related to materials 0.861 8NVAAs related to movement 0.933 8NVAAs related to human resources 0.889 8
Table VII.Reliability statisticsrelated to NVAAs inSouth Africanconstruction
Classification Clients Consultants Contractors
Clients 1.0000 0.4000 0.6333Consultants 0.4000 1.0000 0.4333Contractors 0.6333 0.4333 1.0000
Table VIII.Correlations related toNVAAs in South Africanconstruction
JEDT12,2
236

Res
pon
se(%
)R
ank
ing
by
gro
up
Min
or...
Maj
orN
VA
AU
nsu
re1
23
45
MS
Ov
eral
lC
lien
tsC
onsu
ltan
tsC
ontr
acto
rs
Lac
kof
req
uir
edco
mp
eten
cies
0.0
2.3
8.0
18.4
31.0
40.2
3.99
13
11
Inad
equ
ate
sup
erv
isio
n0.
00.
010
.321
.832
.235
.63.
932
12
2W
aiti
ng
for
crit
ical
task
sto
be
fin
ish
ed1.
16.
813
.619
.326
.133
.03.
663
83
9N
on-c
onfo
rman
ceof
mat
eria
lsto
spec
ifica
tion
1.1
3.4
15.9
17.0
38.6
23.9
3.64
44
46
Wai
tin
gfo
rm
ater
ials
0.0
3.4
19.3
19.3
29.5
28.4
3.60
56
95
Wai
tin
gfo
rin
stru
ctio
n/i
nfo
rmat
ion
0.0
6.8
17.0
20.5
21.6
34.1
3.59
65
153
Rew
ork
rela
tiv
eto
des
ign
1.1
13.6
11.4
15.9
23.9
34.1
3.54
72
108
Hu
man
erro
r/m
ista
ke
3.4
4.6
16.1
26.4
29.9
19.5
3.45
810
67
Poo
rco
ord
inat
ion
ofre
sou
rces
2.3
5.7
15.9
25.0
33.0
18.2
3.43
914
1111
Rew
ork
rela
tiv
eto
fou
nd
atio
nw
ork
s5.
78.
021
.618
.218
.228
.43.
4010
98
16P
oor
seq
uen
cin
gof
task
s4.
54.
519
.326
.127
.318
.23.
3711
167
17Ig
nor
ance
1.1
6.9
20.7
21.8
28.7
20.7
3.36
1225
122
Rew
ork
rela
tiv
eto
stru
ctu
ral
wor
ks
8.0
10.2
12.5
26.1
21.6
21.6
3.35
137
1324
Rew
ork
rela
tiv
eto
fin
ish
ing
wor
ks
9.2
9.2
14.9
24.1
21.8
20.7
3.33
1412
1021
Str
ikes
3.5
16.3
18.6
15.1
15.1
31.4
3.28
1510
1427
Wai
tin
gfo
req
uip
men
t2.
35.
727
.321
.623
.919
.33.
2416
1516
20L
owem
plo
yee
mor
ale
1.1
11.5
10.3
35.6
27.6
13.8
3.22
1712
2515
Un
reli
able
/def
ecti
ve
equ
ipm
ent
1.1
11.4
19.3
26.1
26.1
15.9
3.16
1819
1819
Wai
tin
gfo
rsp
ecia
list
toar
riv
e3.
413
.817
.227
.617
.220
.73.
1419
1919
18D
efec
tiv
em
ater
ials
onsi
te3.
411
.421
.625
.019
.319
.33.
1420
1717
28Id
len
ess
onsi
te2.
39.
221
.831
.019
.516
.13.
1221
2222
11U
nn
eces
sary
wor
k4.
64.
627
.627
.624
.111
.53.
1122
2421
13In
app
rop
riat
ep
osit
ion
ing
ofcr
anes
20.7
17.2
6.9
21.8
23.0
10.3
3.03
2330
2210
(continued
)
Table IX.Primary NVAAs in South
African construction
Factorscontributing
to NVAAs
237
Res
pon
se(%
)R
ank
ing
by
gro
up
Min
or...
Maj
orN
VA
AU
nsu
re1
23
45
MS
Ov
eral
lC
lien
tsC
onsu
ltan
tsC
ontr
acto
rs
Wai
tin
gfo
rla
bou
rto
arri
ve
3.4
13.6
25.0
20.5
23.9
13.6
2.99
2418
2432
Wai
tin
gfo
rw
ork
spac
e/p
latf
orm
6.8
12.5
21.6
27.3
19.3
12.5
2.98
2522
3123
Poo
rer
gon
omic
san
din
juri
es15
.915
.915
.919
.321
.611
.42.
9626
2927
22R
ewor
kre
lati
ve
tofo
rmw
ork
9.1
11.4
25.0
26.1
13.6
14.8
2.95
2721
2034
Los
sof
mat
eria
lson
site
1.1
9.1
28.4
33.0
19.3
9.1
2.91
2834
2826
Wai
tin
gfo
rin
spec
tion
s1.
110
.230
.729
.514
.813
.62.
9129
2536
13P
oor
equ
ipm
ent
mov
emen
t5.
712
.620
.731
.024
.15.
72.
8930
2732
30R
ewor
kre
lati
ve
toel
ectr
ical
wor
ks
17.2
10.3
25.3
24.1
12.6
10.3
2.85
3131
2635
Rew
ork
rela
tiv
eto
serv
ices
10.3
9.2
27.6
32.2
10.3
10.3
2.83
3233
2931
Rew
ork
rela
tiv
eto
mec
han
ical
wor
ks
17.2
8.0
26.4
29.9
9.2
9.2
2.82
3328
3037
Poo
rv
ehic
le/t
ruck
mov
emen
t8.
010
.222
.735
.221
.62.
32.
8134
3633
28U
nn
eces
sary
mat
eria
lh
and
lin
g4.
514
.825
.034
.115
.95.
72.
7135
3534
36N
eed
less
rep
etit
ive
han
dli
ng
ofto
ols
18.2
12.5
20.5
34.1
12.5
2.3
2.65
3637
3532
Was
teof
raw
mat
eria
lson
site
2.3
19.3
27.3
30.7
11.4
9.1
2.63
3738
3825
Det
erio
rati
onof
mat
eria
lson
site
3.4
22.7
21.6
33.0
13.6
5.7
2.56
3832
3739
Ex
cess
mat
eria
lson
site
4.5
14.8
47.7
23.9
5.7
3.4
2.32
3939
4038
Ex
cess
ive
insp
ecti
onof
mat
eria
ls8.
034
.115
.925
.014
.82.
32.
3040
4039
40
Table IX.
JEDT12,2
238
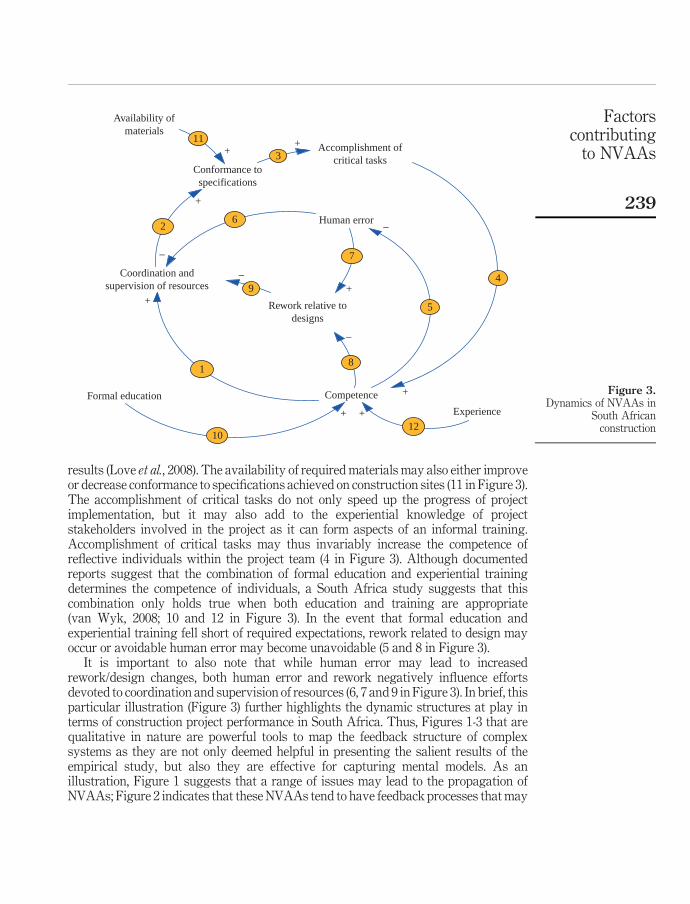
results (Love et al., 2008). The availability of required materials may also either improveor decrease conformance to specifications achieved on construction sites (11 in Figure 3).The accomplishment of critical tasks do not only speed up the progress of projectimplementation, but it may also add to the experiential knowledge of projectstakeholders involved in the project as it can form aspects of an informal training.Accomplishment of critical tasks may thus invariably increase the competence ofreflective individuals within the project team (4 in Figure 3). Although documentedreports suggest that the combination of formal education and experiential trainingdetermines the competence of individuals, a South Africa study suggests that thiscombination only holds true when both education and training are appropriate(van Wyk, 2008; 10 and 12 in Figure 3). In the event that formal education andexperiential training fell short of required expectations, rework related to design mayoccur or avoidable human error may become unavoidable (5 and 8 in Figure 3).
It is important to also note that while human error may lead to increasedrework/design changes, both human error and rework negatively influence effortsdevoted to coordination and supervision of resources (6, 7 and 9 in Figure 3). In brief, thisparticular illustration (Figure 3) further highlights the dynamic structures at play interms of construction project performance in South Africa. Thus, Figures 1-3 that arequalitative in nature are powerful tools to map the feedback structure of complexsystems as they are not only deemed helpful in presenting the salient results of theempirical study, but also they are effective for capturing mental models. As anillustration, Figure 1 suggests that a range of issues may lead to the propagation ofNVAAs; Figure 2 indicates that these NVAAs tend to have feedback processes that may
Figure 3.Dynamics of NVAAs in
South Africanconstruction
Formal education Competence
Human error
Coordination andsupervision of resources
Conformance tospecifications
Availability ofmaterials
Accomplishment ofcritical tasks
Rework relative todesigns
+
–
+
+
++
–
–
–+
+
1
2
3
4
5
6
7
8
9
10
11
Experience+12
Factorscontributing
to NVAAs
239
reinforce their intensity and frequency in the construction process; and Figure 3demonstrated the dynamics of NVAAs with respect to project performance through theaccomplishment of stated project critical tasks (milestones).
The quantitative survey findings, though limited by the response rate of25.4 per cent, nevertheless corroborate previous NVAAs related research findings. TheNVAAs, their causes, and impact that are deemed to be major support the findings ofAlwi et al. (2002a, b), Koskela (1992), Alancon (1997) and the South African CIDB(2011). The findings suggest that the lack of required competencies and shortage ofskills necessary for supervision constitute a problem in South African construction asearlier mentioned through the work done by Lawless (2005, 2007); repetitive revisionsand changes as well as other design related problems such as delay in design approvalmarginalises the construction process (Love et al., 2008); and time overruns, costoverruns, and variation/claims eventuate as notable consequences of anomalies inconstruction (Ndihokubwayo and Haupt, 2008; Han, 2008; Love et al., 2008).
4. Conclusions and recommendationsNVAAs are fundamental tasks to be weeded out of construction as they exhibitpersistent ability to engender poor performance. Every construction task consists ofVAAs, VSAs and NVAAs. Of these three types of activities, the literature suggeststhat the reduction of VSAs and the elimination of NVAAs could lead to performanceimprovement. This can be done through redesigning and/or restructuring howconstruction tasks are carried out. New ways/work processes could therefore benefitfrom the evaluation of existing processes through their identification and analysis.
Using the South African infrastructure sector as a case study, NVAAs and theircauses that could significantly contribute to poor performance were identified. Theexplanations that were provided suggest that unless these NVAAs are addressed, theytend to proliferate in construction. Notable NVAAs such as lack of requiredcompetencies have to be addressed in South Africa. Perhaps, the elimination of majorcauses of NVAAs such as lack of appropriately skilled workers provides a wayforward. The findings of the study emphasise the need to implement lean constructionprinciples in South Africa in order to address certain consequences of NVAAs.
The implications of the findings for the management of construction projects inSouth Africa are threefold. First, public sector clients should promote objectiveassignment of construction project management responsibilities to appropriatelyskilled and/or competent in-house experts. Given that employers (mostly public sector)were deemed to have contributed to project failure in South Africa (Valentin andVorster, 2012), it is imperative that those vested with project delivery responsibilitiesare experts or specialist in their chosen field. It is important to emphasise this advice asa recent South African study contends that in order to improve the performance ofexisting municipal infrastructure, and also ensure favourable delivery of new ones,critical intelligence (soft and hard skills) should be found among public sector clients(Emuze and Smallwood, 2011). According to the study, public sector clients mustrecruit qualified built environment/engineering graduates into responsible governmentpositions that have decision-making authorities so that the appointees cannot be easilyoverruled based on political considerations. In other words, critical technical positionsshould not be made subservient to political positions in matters of technical nature(Macleod, 2007).
JEDT12,2
240
Second, consultants should avoid the use of fresh graduates without the requisite“know-how” to sign-off jobs on construction sites as instead of being viewed as experts,their input may be considered immature or not practicable by site managementprofessionals. This recommendation is necessary in order to address design andinformation related NVAAs and their causes. Third, contractors should place emphasison both academic and professional development of their existing employees, and alsoensure that new recruits are armed with appropriate built environment qualifications sothat they are sure of their suitability for challenging roles in the industry. Since Valentinand Vorster (2012) observed that project failures due to factors under the control ofcontractors are low in frequency in comparison to other members of the project team, buthigh in intensity with severe direct consequences; and the fact that NVAAs have thepropensity to propagate into other activities when they are not adequately addressed,it is vital for contractors to improve the competencies of their site managementemployees in South Africa.
However, because of the limitations of qualitative models, a quantitative model shallbe developed in a future research endeavour. The dynamics explained in Figure 3 willbe expanded further to develop a simulation model for analysing the effects thatcompetence has on the accomplishment of critical tasks. The “stock and flow” diagramto be developed shall endeavour to detail salient parameters that contribute to theprocess of assigning critical tasks to competent specialist within the South Africanconstruction industry context. Attempts shall be made to derive estimates for themodel parameters from site experiences of researchers, and subsequently, validation ofthe estimates shall be done through a focus group that will be made up of principalconstruction industry stakeholders. Thereafter, it is envisaged that the simulationmodel will be applied to selected projects in South Africa so as to assess its usefulnessfor the management of construction projects.
References
Abdel-Razek, R.H., Abd Elshakour, M.H. and Abdel-Hamid, M. (2007), “Labour productivity:benchmarking and variability in Egyptian projects”, International Journal of ProjectManagement, Vol. 25 No. 2, pp. 189-197.
Agresti, A. and Franklin, C. (2007), Statistics: The Art and Science of Learning from Data,Pearson Prentice-Hall, Upper Saddle River, NJ.
Alancon, L.F. (1997), “Tools for the identification and reduction of waste in constructionprojects”, in Alarcon, L. (Ed.), Lean Construction, Balkema, Rotterdam, pp. 365-377.
Alwi, S., Hampson, K. and Mohamed, S.C. (2002a), “Factors influencing contractor performancein Indonesia: a study of non-value adding activities”, International Conference onAdvancement in Design, Construction, Construction Management, and Maintenance ofBuilding Structure, Bali, pp. 20-34.
Alwi, S., Hampson, K. and Mohamed, S.C. (2002b), “Non-value adding activities: a comparativestudy of Indonesian and Australian construction projects”, 10th Annual Conference of theInternational Group for Lean Construction Proceedings, Granmado, August, pp. 1-12.
Arbulu, R.J., Tommelein, I.D., Walsh, K.D. and Hershauer, J.C. (2003), “Value stream analysis of are-engineered construction supply chain”, Building Research and Information, Vol. 31No. 2, pp. 161-171.
CIDB (2011), The CIDB Construction Industry Indicators Summary Results: 2010, ConstructionIndustry Development Board, Pretoria.
Factorscontributing
to NVAAs
241
Emuze, F.A. and Smallwood, J.J. (2011), “Criticality of intelligent clients in the infrastructuresector”, Proceedings of the Institution of Civil Engineers – Municipal Engineer, Vol. 164No. 4, pp. 251-257.
Forbes, L.H. and Ahmed, S.M. (2011), Modern Construction: Lean Project Delivery and IntegratedPractices, CRC Press, Boca Raton, FL.
Forrester, J.W. (2007), “System dynamics – a personal view of the first fifty years”, SystemDynamics Review, Vol. 23 Nos 2/3, pp. 345-358.
Gary, M.S., Kunc, M., Morecroft, J.D.W. and Rockart, S.F. (2008), “System dynamics andstrategy”, System Dynamics Review, Vol. 24 No. 4, pp. 407-429.
George, D. and Mallery, P. (2003), SPSS for Windows Step by Step: A Simple Guide andReference-11.0 Update, 4th ed., Allyn & Bacon, Boston, MA.
Gliem, J.A. and Gliem, R.R. (2003), “Calculating, interpreting, and reporting Cronbach’s Alphareliability coefficient for Likert-type scales”, paper presented at 21st Annual MidwestResearch-to-Practice Conference on Adult, Continuing, and Community Education,Columbus, OH, 8-10 October.
Han, S. (2008), “A hybrid simulation model for understanding and managing non-value addingactivities in large-scale design and construction projects”, unpublished PhD thesis,University of Illinois at Urbana-Champaign, Champaign, IL.
Hanna, A.S., Taylor, C.S. and Sullivan, K.T. (2005), “Impact of extended overtime on constructionlabour productivity”, Journal of Construction Engineering andManagement, Vol. 131 No. 6,pp. 734-739.
Horman, M.J. and Kenley, R. (2005), “Quantifying levels of wasted time in construction withmeta-analysis”, Journal of Construction Engineering and Management, Vol. 131 No. 1,pp. 52-61.
Hwang, B., Thomas, S.R., Haas, C.T. and Caldas, C. (2009), “Measuring the impact of rework onconstruction cost performance”, Journal of Construction Engineering and Management,Vol. 135 No. 3, pp. 187-198.
Koskela, L. (1992), “Application of the new production philosophy to construction”, TechnicalReport No. 72, Center for Integrated Facility Engineering (CIFE), Stanford University,Stanford, CA.
Koskenvesa, A., Koskela, L., Tolonen, T. and Sahlstedt, S. (2010), “Waste and labour productivityin production planning: case Finnish construction industry”, 18th Annual Conference ofthe International Group for Lean Construction Proceedings, Haifa, July, pp. 477-486.
Lawless, A. (2005), Numbers & Needs: Addressing Imbalances in the Civil Engineering Profession,SAICE, Midrand.
Lawless, A. (2007), Numbers & Needs in Local Government: Addressing Civil Engineering – TheCritical Profession for Service Delivery, SAICE, Midrand.
Lee, S.H., Pena-Mora, F. and Park, M. (2005), “Quality and change management for large scaleconcurrent design and construction projects”, Journal of Construction Engineering andManagement, Vol. 131 No. 8, pp. 890-902.
Lopez, R., Love, P.E.D., Edwards, D.J. and Davis, P.R. (2010), “Design error classification,causation, and prevention in construction engineering”, Journal of Performance ofConstructed Facilities, Vol. 24 No. 4, pp. 399-408.
Love, P.E.D., Edwards, D.J. and Irani, Z. (2008), “Forensic project management: an exploratoryexamination of the causal behaviour of design-induced rework”, IEEE Transaction onEngineering Management, Vol. 55 No. 2, pp. 234-247.
JEDT12,2
242
Lyneis, J.M. and Ford, D.N. (2007), “System dynamics applied to project management: a survey,assessment, and directions for future research”, System Dynamics Review, Vol. 23 Nos 2/3,pp. 157-189.
Lyneis, J.M., Cooper, K.G. and Els, S.A. (2001), “Strategic management of complex projects: a casestudy using system dynamics”, Systems Dynamics Review, Vol. 17 No. 3, pp. 237-260.
Macleod, N. (2007), A Time of Opportunity for Civil Engineering in South Africa, South AfricanInstitution of Civil Engineering, Midrand.
Manthe, M.F. (2008), “The appropriateness of tertiary built environment education”, unpublishedPhD thesis, Nelson Mandela Metropolitan University, Port Elizabeth.
Ndihokubwayo, R. and Haupt, T.C. (2008), “Origin-cause matrix: a practical approach foridentification of waste associated with variation orders”, Acta Structilia, Vol. 15 No. 2,pp. 126-142.
Park, M. and Pena-Mora, F. (2003), “Dynamic change management for construction: introducingthe change cycle into model-based project management”, System Dynamics Review, Vol. 19No. 3, pp. 213-242.
Pena-Mora, F. and Li, M. (2001), “Dynamic planning and control methodology for design/buildfast track construction projects”, Journal of Construction Engineering and Management,Vol. 127 No. 1, pp. 1-17.
Polat, G. and Ballard, G. (2004), “Waste in Turkish construction: need for lean constructiontechniques”, Proceedings of International Group of Lean Construction, 12th AnnualConference, Copenhagen, August, pp. 1-14.
Sterman, J.D. (2000), Business Dynamics: Systems Thinking and Modelling for a Complex World,Irwin/McGraw-Hill, Chicago, IL.
Sunyoto, A. and Minato, T. (2003), “Representing causal mechanism of defective designs:a system approach considering human errors”, Construction Management and Economics,Vol. 21 No. 3, pp. 297-305.
Valentin, W.S. and Vorster, F.S. (2012), “Understanding construction project failure in SouthernAfrica”, Proceedings of the Institution of Civil Engineering – Management, Procurementand Law, Vol. 165 No. 1, pp. 19-26.
van Wyk, L. (2008), “The South African built environment professionals skills supply pipeline:is it blocked or broken”, Journal of Construction, Vol. 2 No. 1, pp. 21-23.
Corresponding authorFidelis Emuze can be contacted at: [email protected]
Factorscontributing
to NVAAs
243
To purchase reprints of this article please e-mail: [email protected] visit our web site for further details: www.emeraldinsight.com/reprints

Reproduced with permission of the copyright owner. Further reproduction prohibited withoutpermission.