factors impact on tourist destination loyalty: a case
TRANSCRIPT
African Journal of Hospitality, Tourism and Leisure, Volume 8 (3) - (2019) ISSN: 2223-814X
Copyright: © 2019 AJHTL /Author/s- Open Access- Online @ http//: www.ajhtl.com
1
Factors Impact on Tourist Destination Loyalty: A Case Study in Ho Chi Minh City
Dr. Bang Nguyen Viet* University of Economics Ho Chi Minh City
Ho Chi Minh City, Vietnam Email: [email protected]
Orcid ID https://orcid.org/0000-0001-9395-1937
and
Hai Ho Nguyen (PhD Student)
Hong Bang International University Vietnam
Corresponding author*
Abstract The purpose of this paper is to define and measure key factors regarding to tourist destination loyalty in Ho Chi Minh city (Viet Nam).This study has used qualitative and quantitative research approaches: (i) qualitative research was carried out through focus group discussions with 10 tourists, and (ii) quantitative research was conducted through direct interviews with 305 tourist in Ho Chi Minh city (Vietnam). The results show that: (i) tourist destination loyalty is affected by service quality, destination image, tourist satisfaction; and (ii) tourist satisfaction is affected by service quality and a destination’s image. However, the research has certain limitations: (i) Due to limited resources in conducting research, the sample size consisted of 305 tourist, (ii) This study conducted a sampling technique method of using direct interview methods from tourists in Ho Chi Minh city, Viet Nam, but the sample may not have been representative enough. Keywords: service quality, tourist satisfaction, tourist destination loyalty, destination image.
Introduction Vietnam is one of the countries which has potential for tourism due to its many special features such as for example, its beautiful landscapes, pure white sand and crystal clear blue water, and delicious local food. it also enjoys a stable politico-economic life that attracts international and local tourists. Ho Chi Minh city is the biggest city in Vietnam and it has increasing volumes of tourist inflows both international and domestic, who select it as a preferred destination for travelling. From 2013 to 2017, total tourism receipts in Ho Chi Minh city increased steadily from 83.19 VND trillion (around 3.97 USD billion) in 2013 to 115.98 VND trillion (around 5.18 USD billion) in 2017. Tourists arrival in Ho Chi Minh city have continued to rise in recent years: international tourists to the city increased slightly from 4.19 million arrivals in 2010 to 6.39 million arrivals in 2017, and local tourists to Ho Chi Minh city also rose from 15.60 million arrivals in 2010 to 24.98 million arrivals in 2017. The results are presented in Table 1, Table 2, and Table 3.
Table 1. Tourism receipts
Tourism receipts/Year 2013 2014 2015 2016 2017
Total tourism receipts in Vietnam (VND trillion) 200.00 230.00 337.83 400.00 510.90
Total tourism receipts in Ho Chi Minh city (VND trillion) 83.19 85.00 94.67 103.00 115.98
Foreign Exchange (VND/USD) 20933 21148 21697 21935 22370
Rate (%) 41.60 36.96 28.02 25.75 22.70
(Source: Vietnam National Administration of Tourism, 2018)
African Journal of Hospitality, Tourism and Leisure, Volume 8 (3) - (2019) ISSN: 2223-814X
Copyright: © 2019 AJHTL /Author/s- Open Access- Online @ http//: www.ajhtl.com
2
Table 2. Total International tourists to Vietnam and Ho Chi Minh City
International tourists/year 2013 2014 2015 2016 2017
International tourists to Ho Chi Minh city (million arrivals)
4.19 4.40 4.60 5.20 6.39
International tourists to Vietnam (million arrivals) 7.57 7.87 7.94 10.01 12.92
Rate (%) 55.33 55.88 57.91 51.95 49.45
(Source: Vietnam National Administration of Tourism, 2018)
Table 3. Total local tourists to Vietnam and Ho Chi Minh City
International tourists/year 2013 2014 2015 2016 2017
International tourists to Ho Chi Minh city (million arrivals)
15.60 17.60 19.30 21.80 24.98
International tourists to Vietnam (million arrivals) 35.0 38.5 57.5 62.0 73.2
Rate (%) 44.57 45.71 33.57 35.16 34.13
(Source: Vietnam National Administration of Tourism, 2018)
According to research, tourists are generally more demanding, pay more attention to values and service quality, and are also better informed than ever before. What can business travel managers do to adapt to these very specific needs? There are many answers to this question but most business travel managers need to seriously examine what tourists need and want, if they expect them to change from being one-time customers to repeat visitors. This means that business travel managers should identify factors affecting tourists’ destination loyalty and concentrate on these aspects. Literature review Tourist Destination Loyalty Repeat purchases or recommendations to other people are most usually referred to as consumer loyalty in the marketing literature. In a tourism context, studies borrowed the concept of customer loyalty from the general marketing literature and incorporated it into studies explaining tourist loyalty towards tourism products, destinations and leisure/recreation activities since loyalty is perceived as an issue of a major importance for the overcrowded and increasingly competitive tourism market (Iordanova, 2016). The findings presented in this study should contribute to the development of tourism strategies which are intended to empower the city to better recognize and respond to the dynamic demand patterns of tourists and potential visitors from both the domestic and foreign market as in a study by Grobler and Nicolaides (2016). Destination loyalty has been highlighted by many researchers as an important driver to the future stability and growth of any organization and any tourism destination (Akroush et al, 2016). The success of a destination strongly depends on a thorough environmental analysis of tourist motivations and on levels of customer satisfaction and loyalty (Yoon & Uysal, 2005; Akroush et al, 2016). Travel destinations can be considered as products, and tourists may revisit or recommend travel destinations to other potential tourists such as friends or relatives (Yoon & Uysal, 2005). Loyalty is defined as a deep commitment to buying a product or service again in the future, which causes repetitions of the same brand purchase, despite situational influences and marketing efforts that have the potential to provoke a change in behavior (Oliver, 1999). So developing customer loyalty has become an important marketing strategy because of the benefits associated with retaining existing customers: loyal customers represent not only a stable source
African Journal of Hospitality, Tourism and Leisure, Volume 8 (3) - (2019) ISSN: 2223-814X
Copyright: © 2019 AJHTL /Author/s- Open Access- Online @ http//: www.ajhtl.com
3
of income but also act as channels of information that informally connect networks of friends and other potential travellers to a destination; they are less sensitive to prices, showing a greater willingness to pay; and also the cost of serving this type of tourist is lower (Almeida-Santana & Moreno-Gil, 2018) There are three ways of measuring customer loyalty (Backman & Crompton, 1991; Yoon & Uysal, 2005; Moore et al, 2015; Almeida-Santana & Moreno-Gil, 2018): the behavioral approach, the attitudinal approach; and the composite approach. Behavioral loyalty refers to the frequency of repeat brand purchase. Attitudinal loyalty describes a person's favorable feeling about a destination. The composite or combination approach is an integration of the behavioral and attitudinal approaches (Backman & Crompton, 1991; Yoon & Uysal, 2005; Iordanova, 2016). The first studies of loyalty already analysed this behavioural approach and loyalty is usually measured as the number of times a product is purchased, or a destination is visited (Almeida-Santana & Moreno-Gil, 2018). However, the loyalty behavior approach may not be an adequate assessment of repeated visitation for tourism destinations because many consumers undertake their holiday only on an annual basis, and these approaches remain unclear with respect to their conceptual framework and inability to explain the factors that influence customer loyalty (Yoon & Uysal, 2005; Wu, 2016). So the attitudinal approach is best suited for assessing the tourist’s loyalty because tourism destination experiences are different from other consumption objects (Ekinci et al., 2013). Therefore, the attitudinal approach was used in this study. The attitude exuded in marketing is intrinsically linked to a variety of ethical issues that require serious consideration and a sense of moral idealism in which universal consumer rights are not flouted, and utilitarianism in which consequences of actions are careful mapped out so that ‘the greatest good for the greatest number’ can be realized after assessment of the costs and benefits of the desired ethical marketing. Hotel operations cannot forever hide behind the concept caveat emptor or ‘buyer beware’ and are called upon to be proactively ethical as matter of course in all dealings but especially in marketing (Nicolaides, 2018). Tourist satisfaction Customer satisfaction is defined as an overall post-purchase evaluation (Fornell, 1992); as the consumer’s fulfillment response (Oliver, 1997); as a person's feelings of pleasure or disappointment that results from comparing a product's perceived performance or outcome with his/her expectations (Kotler & Keller, 2009), as the feeling of commitment or affection for a particular product or service (Lee et al., 2011); as the overall level of contentment with a service/product experience (Orel & Kara, 2014); as the perceived differences between early consumption expectation, and perceived performance after consumption (Altunel & Erkurtb, 2015). In short, satisfaction is a consumer’s overall evaluation of a product or service, which is based on the total purchase and consumption experience (Akhoondnejad, 2016). In tourism contexts, satisfaction is primarily referred to as a function of pre-travel expectations and post-travel experiences. It means that when experiences compared to expectations result in feelings of gratification, the tourist is satisfied; and when they result in feelings of displeasure, the tourist is dissatisfied (Chen & Chen, 2010). The results of Yoon & Uysal (2005), Lee et al. (2011), Orel & Kara (2014), Ramseook-Munhurrun et al. (2015), Chiu et al. (2016), Wu (2016), Akhoondnejad (2016), Kasiri et al. (2017) show that tourist satisfaction impacts on tourist destination loyalty. This means that a high level of tourist satisfaction increases tourist loyalty. Therefore, the authors have proposed H1 as follows:
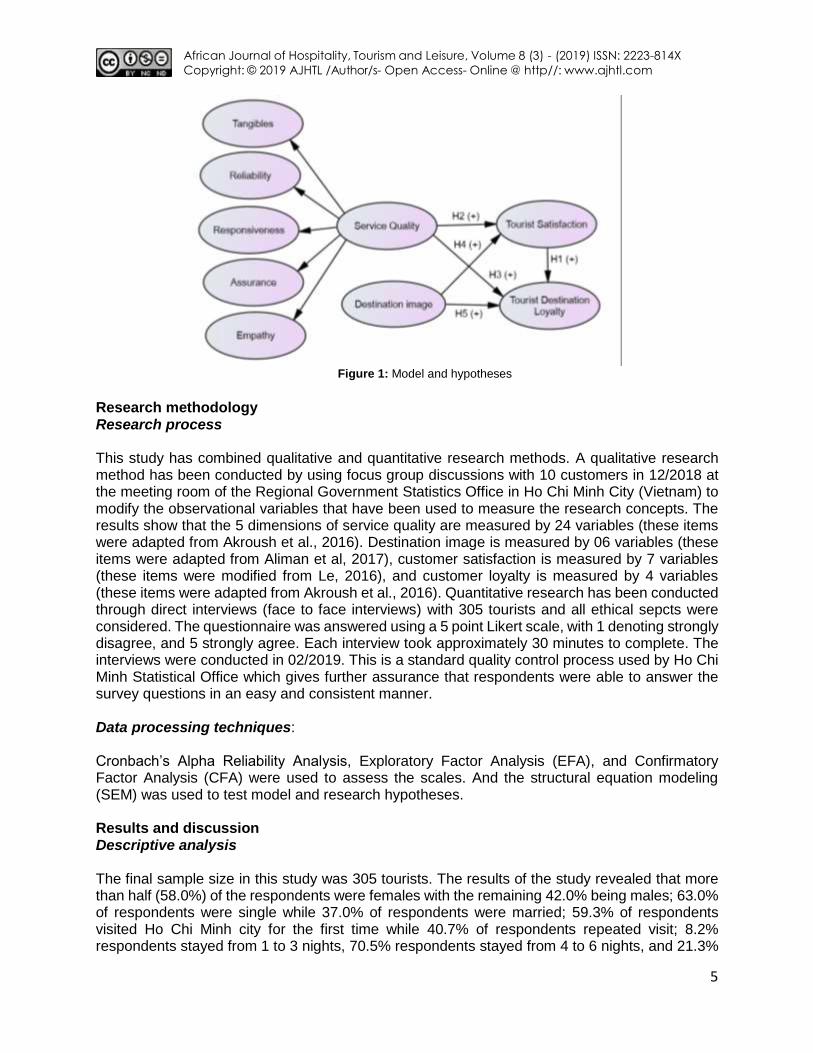
H1: tourist satisfaction impact on tourist destination loyalty (+)
African Journal of Hospitality, Tourism and Leisure, Volume 8 (3) - (2019) ISSN: 2223-814X
Copyright: © 2019 AJHTL /Author/s- Open Access- Online @ http//: www.ajhtl.com
4
Service Quality Service quality is defined as a function of the difference between service expected and customers’ perceptions of the actual service delivered to those customers (Parasuraman et al., 1988). In the tourism sector, service quality is defined as the tourist’s judgement about a product or service’s overall excellence or superiority (Fuchs & Weiermair, 2003); as the result of comparing customer expectations and perceptions (Albacete-Saez et al., 2007). However, measuring service quality is complex due to the multi-dimensional and subjective nature of services (Akroush et al., 2016). Several publications have already put proposed frameworks for service quality such as such as SERVQUAL (Parasuraman et al., 1988); RECQUAL (Fakeye & Crompton, 1991); SERVICESCAPE (Bitner, 1992); SERVPERF (Cronin & Taylor, 1992); QUESC (Kim & Kim, 1995); TEAMQUAL (McDonald et al., 1995) and CERM-CSQ (Howart et al., 1995). Amongst all these frameworks, SERVQUAL is the most successful assessment tool of service quality (Parasuraman et al., 1988) and it has been extensively used to measure perceived service quality across many service sectors including tourism (Albacete-Saez et al., 2007). The results of studies show that service quality impacts on tourist satisfaction (Ekinci et al., 2003; Chen et al., 2011; Lee et al., 2011; Ivyanno & Nila, 2013; Orel & Kara, 2014; Rajaratnam et al., 2014; Akhoondnejad, 2016) and tourist loyalty (Ekinci et al., 2003; Chen et al., 2011; Orel & Kara, 2014; Akhoondnejad, 2016). This means that excellent service quality will increase tourist satisfaction and tourist loyalty. Therefore, the authors have proposed H2, H3 as follows:
H2: Service quality impact on tourist satisfaction loyalty (+) H3: Service quality impact on tourist destination loyalty (+)
Destination image Destination image is presented as a vital and influential factor in various conceptual frameworks elucidating the tourists decision making process since it is believed that tourists make their buying decisions based on the mental images they have of places (Iordanova, 2016). “Understanding what drives tourists is an important issue which can make or break a destination. Since tourists consume products and services and return visit/s and sustainability is desired by destinations, it is important to identify variables that influence the motivation, behaviour and satisfaction levels of tourists.” (Grobler & Nicolaides, 2016). Destination image is defined as an individual’s mental representation of knowledge (beliefs), feelings and overall perception of a particular destination (Fakeye & Crompton, 1991); as an individual’s overall perception or the total set of impressions of a place (Chen & Tsai, 2007); as an individual’s mental representation of the knowledge, feelings, and overall perception of a particular destination (Chi & Qu, 2008); as a compilation of beliefs and impressions based on information processing from various sources over time that result in a mental representation of the attributes, benefits, and distinct influence sought of a destination (Zhang et al., 2014). The result of studies show that destination image is one of the factors which impacts on tourist satisfaction (Chi & Qu, 2008; Aunalal et al., 2014; Ramseook-Munhurrun et al., 2015), and tourist destination loyalty (Chi & Qu, 2008; Zhang et al., 2014; Akroush et al., 2016). Therefore, the authors have proposed H4, H5 as follows:
H4: Destination image impact on tourist satisfaction (+) H5: Destination image impact on tourist destination loyalty (+)
African Journal of Hospitality, Tourism and Leisure, Volume 8 (3) - (2019) ISSN: 2223-814X
Copyright: © 2019 AJHTL /Author/s- Open Access- Online @ http//: www.ajhtl.com
5
Figure 1: Model and hypotheses
Research methodology Research process This study has combined qualitative and quantitative research methods. A qualitative research method has been conducted by using focus group discussions with 10 customers in 12/2018 at the meeting room of the Regional Government Statistics Office in Ho Chi Minh City (Vietnam) to modify the observational variables that have been used to measure the research concepts. The results show that the 5 dimensions of service quality are measured by 24 variables (these items were adapted from Akroush et al., 2016). Destination image is measured by 06 variables (these items were adapted from Aliman et al, 2017), customer satisfaction is measured by 7 variables (these items were modified from Le, 2016), and customer loyalty is measured by 4 variables (these items were adapted from Akroush et al., 2016). Quantitative research has been conducted through direct interviews (face to face interviews) with 305 tourists and all ethical sepcts were considered. The questionnaire was answered using a 5 point Likert scale, with 1 denoting strongly disagree, and 5 strongly agree. Each interview took approximately 30 minutes to complete. The interviews were conducted in 02/2019. This is a standard quality control process used by Ho Chi Minh Statistical Office which gives further assurance that respondents were able to answer the survey questions in an easy and consistent manner.
Data processing techniques: Cronbach’s Alpha Reliability Analysis, Exploratory Factor Analysis (EFA), and Confirmatory Factor Analysis (CFA) were used to assess the scales. And the structural equation modeling (SEM) was used to test model and research hypotheses. Results and discussion Descriptive analysis The final sample size in this study was 305 tourists. The results of the study revealed that more than half (58.0%) of the respondents were females with the remaining 42.0% being males; 63.0% of respondents were single while 37.0% of respondents were married; 59.3% of respondents visited Ho Chi Minh city for the first time while 40.7% of respondents repeated visit; 8.2% respondents stayed from 1 to 3 nights, 70.5% respondents stayed from 4 to 6 nights, and 21.3%
African Journal of Hospitality, Tourism and Leisure, Volume 8 (3) - (2019) ISSN: 2223-814X
Copyright: © 2019 AJHTL /Author/s- Open Access- Online @ http//: www.ajhtl.com
6
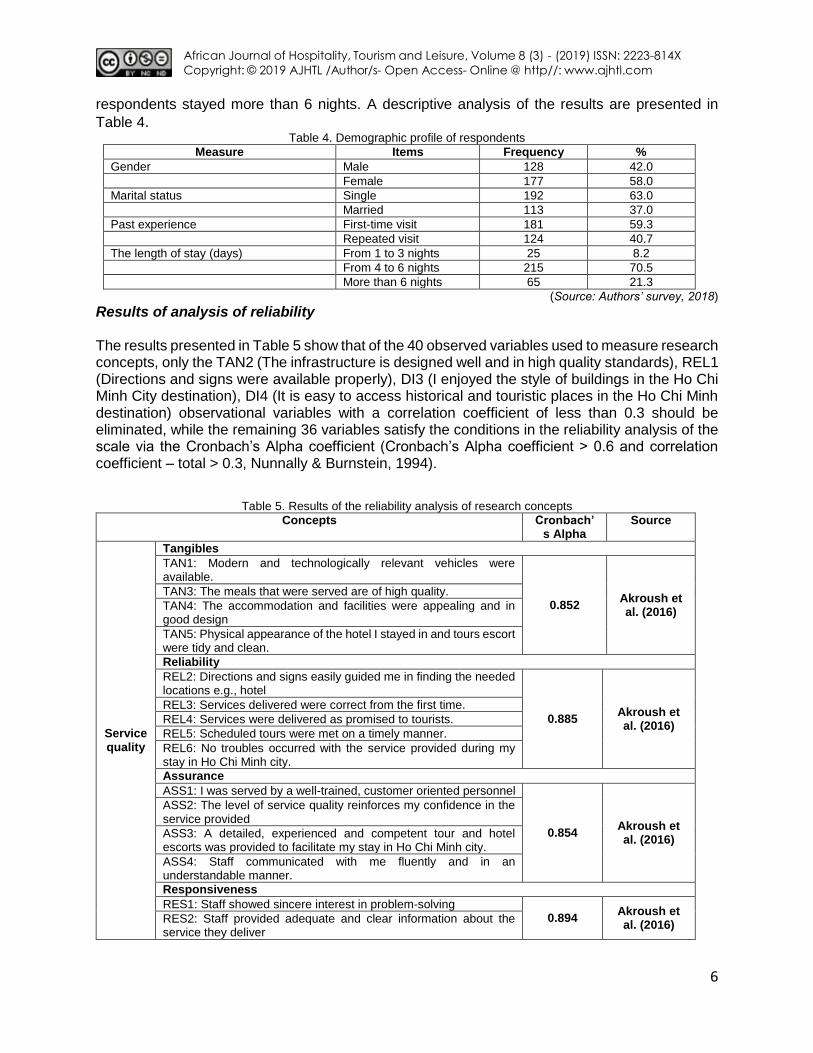
respondents stayed more than 6 nights. A descriptive analysis of the results are presented in
Table 4. Table 4. Demographic profile of respondents
Measure Items Frequency %
Gender Male 128 42.0
Female 177 58.0
Marital status Single 192 63.0
Married 113 37.0
Past experience First-time visit 181 59.3
Repeated visit 124 40.7
The length of stay (days) From 1 to 3 nights 25 8.2
From 4 to 6 nights 215 70.5
More than 6 nights 65 21.3
(Source: Authors’ survey, 2018)
Results of analysis of reliability
The results presented in Table 5 show that of the 40 observed variables used to measure research concepts, only the TAN2 (The infrastructure is designed well and in high quality standards), REL1 (Directions and signs were available properly), DI3 (I enjoyed the style of buildings in the Ho Chi Minh City destination), DI4 (It is easy to access historical and touristic places in the Ho Chi Minh destination) observational variables with a correlation coefficient of less than 0.3 should be eliminated, while the remaining 36 variables satisfy the conditions in the reliability analysis of the scale via the Cronbach’s Alpha coefficient (Cronbach’s Alpha coefficient > 0.6 and correlation coefficient – total > 0.3, Nunnally & Burnstein, 1994).
Table 5. Results of the reliability analysis of research concepts
Concepts Cronbach’s Alpha
Source
Service quality
Tangibles
TAN1: Modern and technologically relevant vehicles were available.
0.852 Akroush et al. (2016)
TAN3: The meals that were served are of high quality.
TAN4: The accommodation and facilities were appealing and in good design
TAN5: Physical appearance of the hotel I stayed in and tours escort were tidy and clean.
Reliability
REL2: Directions and signs easily guided me in finding the needed locations e.g., hotel
0.885 Akroush et al. (2016)
REL3: Services delivered were correct from the first time.
REL4: Services were delivered as promised to tourists.
REL5: Scheduled tours were met on a timely manner.
REL6: No troubles occurred with the service provided during my stay in Ho Chi Minh city.
Assurance
ASS1: I was served by a well-trained, customer oriented personnel
0.854 Akroush et al. (2016)
ASS2: The level of service quality reinforces my confidence in the service provided
ASS3: A detailed, experienced and competent tour and hotel escorts was provided to facilitate my stay in Ho Chi Minh city.
ASS4: Staff communicated with me fluently and in an understandable manner.
Responsiveness
RES1: Staff showed sincere interest in problem-solving 0.894
Akroush et al. (2016)
RES2: Staff provided adequate and clear information about the service they deliver
African Journal of Hospitality, Tourism and Leisure, Volume 8 (3) - (2019) ISSN: 2223-814X
Copyright: © 2019 AJHTL /Author/s- Open Access- Online @ http//: www.ajhtl.com
7
RES3: Staff were able to fulfill my requests promptly in a timely manner.
RES4: Staff provided me with full information regarding the entertainment offered.
RES5: Staff showed sincere willingness and interest in helping and assisting me.
RES6: Staff provided me with advice on how to best utilise my free time.
Empathy
EMP1: Services offered were provided by pleasant and friendly personnel
0.759 Akroush et al. (2016)
EMP2: My exceptions and special needs were met as expected.
EMP3: Personal safety was considered as a major aspect in every service provided.
Destination image
DI1: The Ho Chi Minh city destination environment is attractive
0.841 Akroush et al. (2016)
DI2: It is easy to access historical and touristic places in Ho Chi Minh city destination.
DI5: The residents of Ho Chi Minh city destination are friendly.
DI6: The residents of Ho Chi Minh city destination are good and welcoming to tourists.
Tourist satisfaction
SAT1: I really enjoyed the visit Ho Chi Minh city
0.896 Le (2016)
SAT2: I am satisfied with my decision to visit Ho Chi Minh city
SAT3: I prefer this destination
SAT4: I have positive feelings regarding Ho Chi Minh city
SAT5: This experience is exactly what I need
SAT6: This was a pleasant visit
Tourist Destination Loyalty
LO1: I intend on visiting the Ho Chi Minh destination in the future.
0.870 Akroush et al. (2016)
LO2: The Ho Chi Minh destination would be my first choice for a vacation in the region.
LO3: The Ho Chi Minh destination provides more benefits than other destinations in the region.
LO4: I would advise/recommend other people to visit Ho Chi Minh city destination.
(Source: Authors’ survey, 2018)
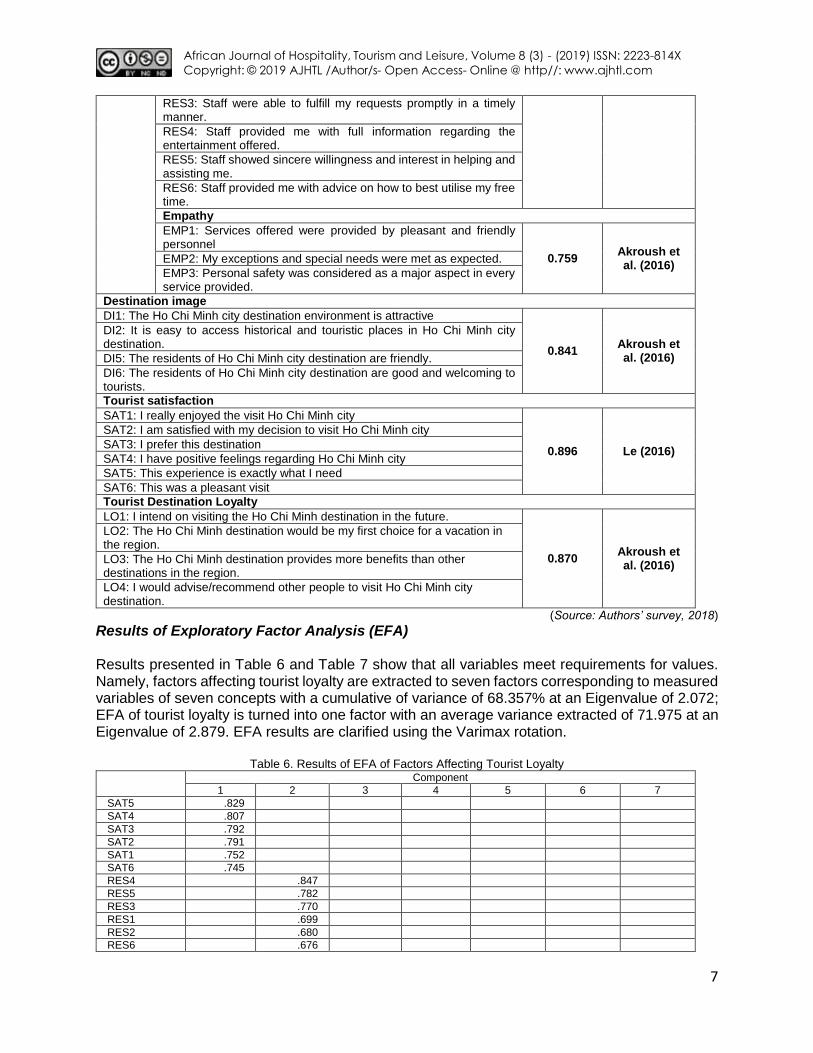
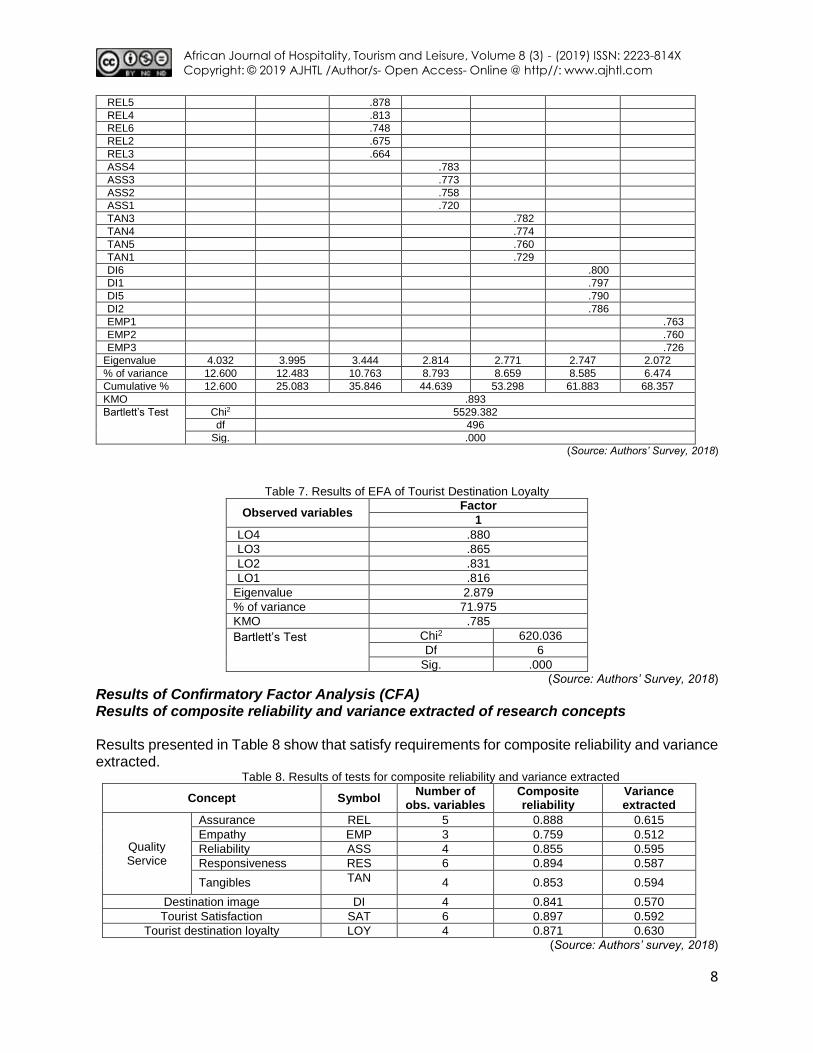
Results of Exploratory Factor Analysis (EFA) Results presented in Table 6 and Table 7 show that all variables meet requirements for values. Namely, factors affecting tourist loyalty are extracted to seven factors corresponding to measured variables of seven concepts with a cumulative of variance of 68.357% at an Eigenvalue of 2.072; EFA of tourist loyalty is turned into one factor with an average variance extracted of 71.975 at an Eigenvalue of 2.879. EFA results are clarified using the Varimax rotation.
Table 6. Results of EFA of Factors Affecting Tourist Loyalty
Component
1 2 3 4 5 6 7
SAT5 .829
SAT4 .807
SAT3 .792
SAT2 .791
SAT1 .752
SAT6 .745
RES4 .847
RES5 .782
RES3 .770
RES1 .699
RES2 .680
RES6 .676
African Journal of Hospitality, Tourism and Leisure, Volume 8 (3) - (2019) ISSN: 2223-814X
Copyright: © 2019 AJHTL /Author/s- Open Access- Online @ http//: www.ajhtl.com
8
REL5 .878
REL4 .813
REL6 .748
REL2 .675
REL3 .664
ASS4 .783
ASS3 .773
ASS2 .758
ASS1 .720
TAN3 .782
TAN4 .774
TAN5 .760
TAN1 .729
DI6 .800
DI1 .797
DI5 .790
DI2 .786
EMP1 .763
EMP2 .760
EMP3 .726
Eigenvalue 4.032 3.995 3.444 2.814 2.771 2.747 2.072
% of variance 12.600 12.483 10.763 8.793 8.659 8.585 6.474
Cumulative % 12.600 25.083 35.846 44.639 53.298 61.883 68.357
KMO .893
Bartlett’s Test
Chi2 5529.382
df 496
Sig. .000
(Source: Authors’ Survey, 2018)
Table 7. Results of EFA of Tourist Destination Loyalty
Observed variables Factor
1
LO4 .880
LO3 .865
LO2 .831
LO1 .816
Eigenvalue 2.879
% of variance 71.975
KMO .785
Bartlett’s Test
Chi2 620.036
Df 6
Sig. .000
(Source: Authors’ Survey, 2018)
Results of Confirmatory Factor Analysis (CFA) Results of composite reliability and variance extracted of research concepts Results presented in Table 8 show that satisfy requirements for composite reliability and variance extracted.
Table 8. Results of tests for composite reliability and variance extracted
Concept Symbol Number of
obs. variables Composite reliability
Variance extracted
Quality Service
Assurance REL 5 0.888 0.615
Empathy EMP 3 0.759 0.512
Reliability ASS 4 0.855 0.595
Responsiveness RES 6 0.894 0.587
Tangibles TAN 4 0.853 0.594
Destination image DI 4 0.841 0.570
Tourist Satisfaction SAT 6 0.897 0.592
Tourist destination loyalty LOY 4 0.871 0.630
(Source: Authors’ survey, 2018)
African Journal of Hospitality, Tourism and Leisure, Volume 8 (3) - (2019) ISSN: 2223-814X
Copyright: © 2019 AJHTL /Author/s- Open Access- Online @ http//: www.ajhtl.com
9
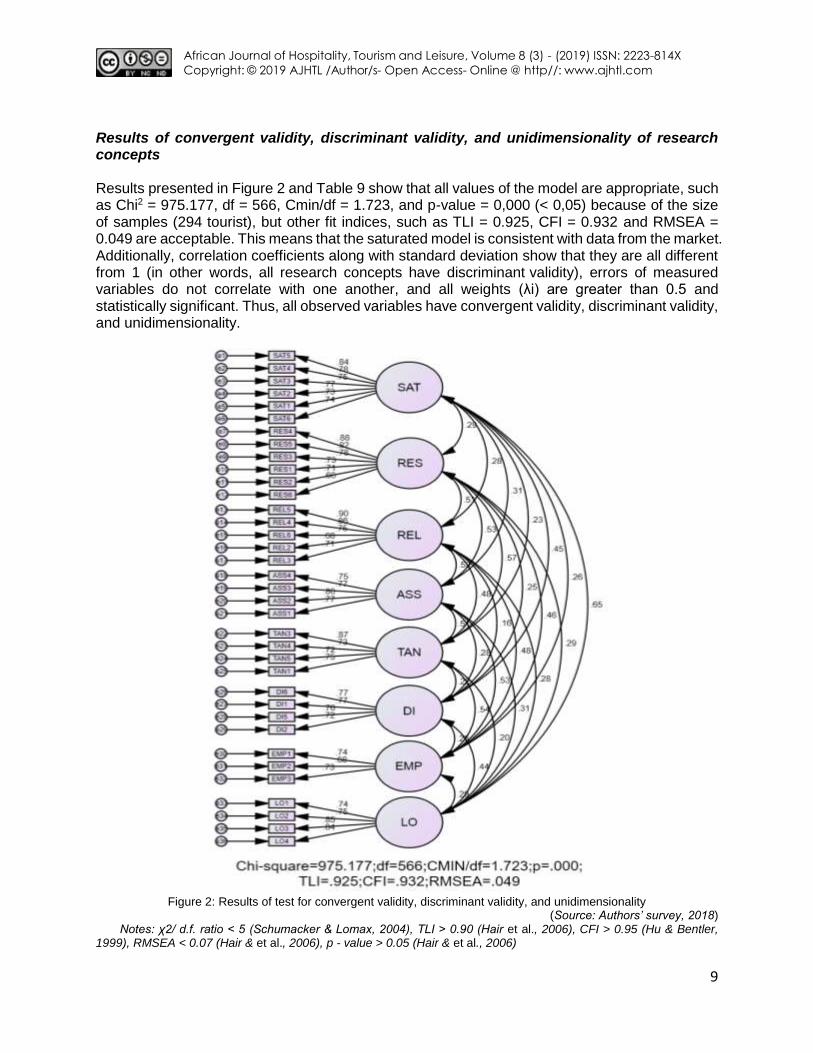
Results of convergent validity, discriminant validity, and unidimensionality of research concepts Results presented in Figure 2 and Table 9 show that all values of the model are appropriate, such as Chi2 = 975.177, df = 566, Cmin/df = 1.723, and p-value = 0,000 (< 0,05) because of the size of samples (294 tourist), but other fit indices, such as TLI = 0.925, CFI = 0.932 and RMSEA = 0.049 are acceptable. This means that the saturated model is consistent with data from the market. Additionally, correlation coefficients along with standard deviation show that they are all different from 1 (in other words, all research concepts have discriminant validity), errors of measured variables do not correlate with one another, and all weights (λi) are greater than 0.5 and statistically significant. Thus, all observed variables have convergent validity, discriminant validity, and unidimensionality.
Figure 2: Results of test for convergent validity, discriminant validity, and unidimensionality
(Source: Authors’ survey, 2018) Notes: χ2/ d.f. ratio < 5 (Schumacker & Lomax, 2004), TLI > 0.90 (Hair et al., 2006), CFI > 0.95 (Hu & Bentler,
1999), RMSEA < 0.07 (Hair & et al., 2006), p - value > 0.05 (Hair & et al., 2006)
African Journal of Hospitality, Tourism and Leisure, Volume 8 (3) - (2019) ISSN: 2223-814X
Copyright: © 2019 AJHTL /Author/s- Open Access- Online @ http//: www.ajhtl.com
10
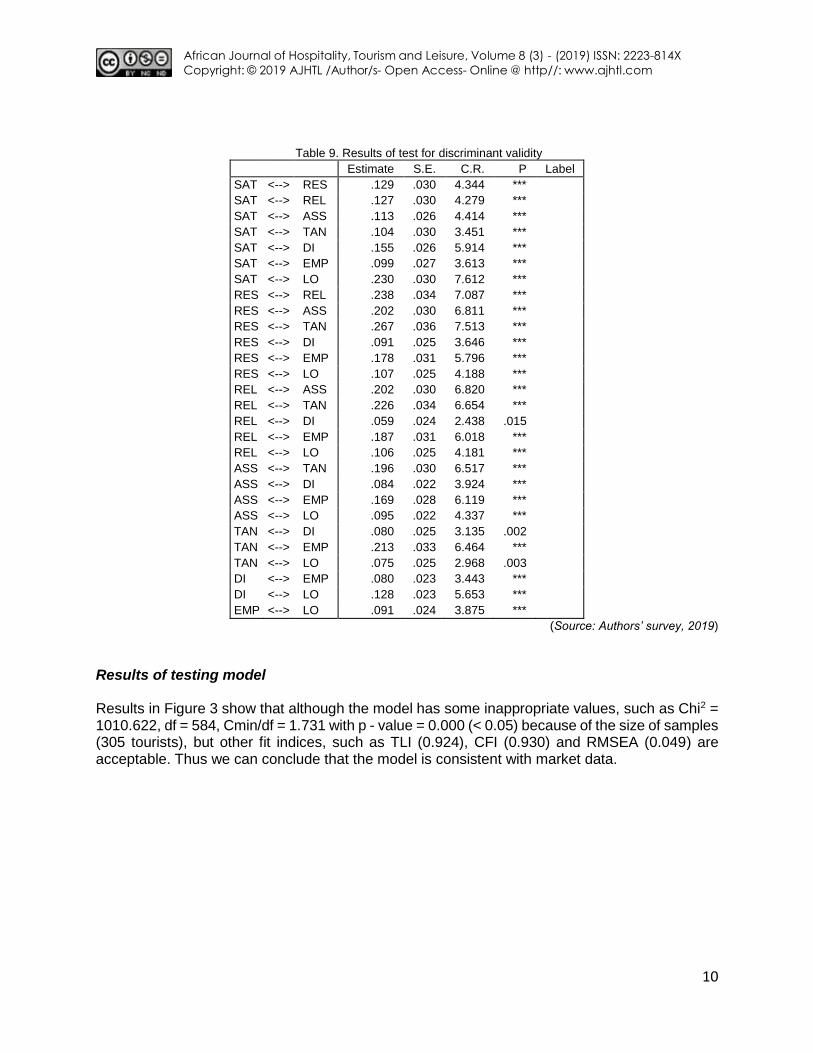
Table 9. Results of test for discriminant validity Estimate S.E. C.R. P Label
SAT <--> RES .129 .030 4.344 ***
SAT <--> REL .127 .030 4.279 ***
SAT <--> ASS .113 .026 4.414 ***
SAT <--> TAN .104 .030 3.451 ***
SAT <--> DI .155 .026 5.914 ***
SAT <--> EMP .099 .027 3.613 ***
SAT <--> LO .230 .030 7.612 ***
RES <--> REL .238 .034 7.087 ***
RES <--> ASS .202 .030 6.811 ***
RES <--> TAN .267 .036 7.513 ***
RES <--> DI .091 .025 3.646 ***
RES <--> EMP .178 .031 5.796 ***
RES <--> LO .107 .025 4.188 ***
REL <--> ASS .202 .030 6.820 ***
REL <--> TAN .226 .034 6.654 ***
REL <--> DI .059 .024 2.438 .015
REL <--> EMP .187 .031 6.018 ***
REL <--> LO .106 .025 4.181 ***
ASS <--> TAN .196 .030 6.517 ***
ASS <--> DI .084 .022 3.924 ***
ASS <--> EMP .169 .028 6.119 ***
ASS <--> LO .095 .022 4.337 ***
TAN <--> DI .080 .025 3.135 .002
TAN <--> EMP .213 .033 6.464 ***
TAN <--> LO .075 .025 2.968 .003
DI <--> EMP .080 .023 3.443 ***
DI <--> LO .128 .023 5.653 ***
EMP <--> LO .091 .024 3.875 ***
(Source: Authors’ survey, 2019)
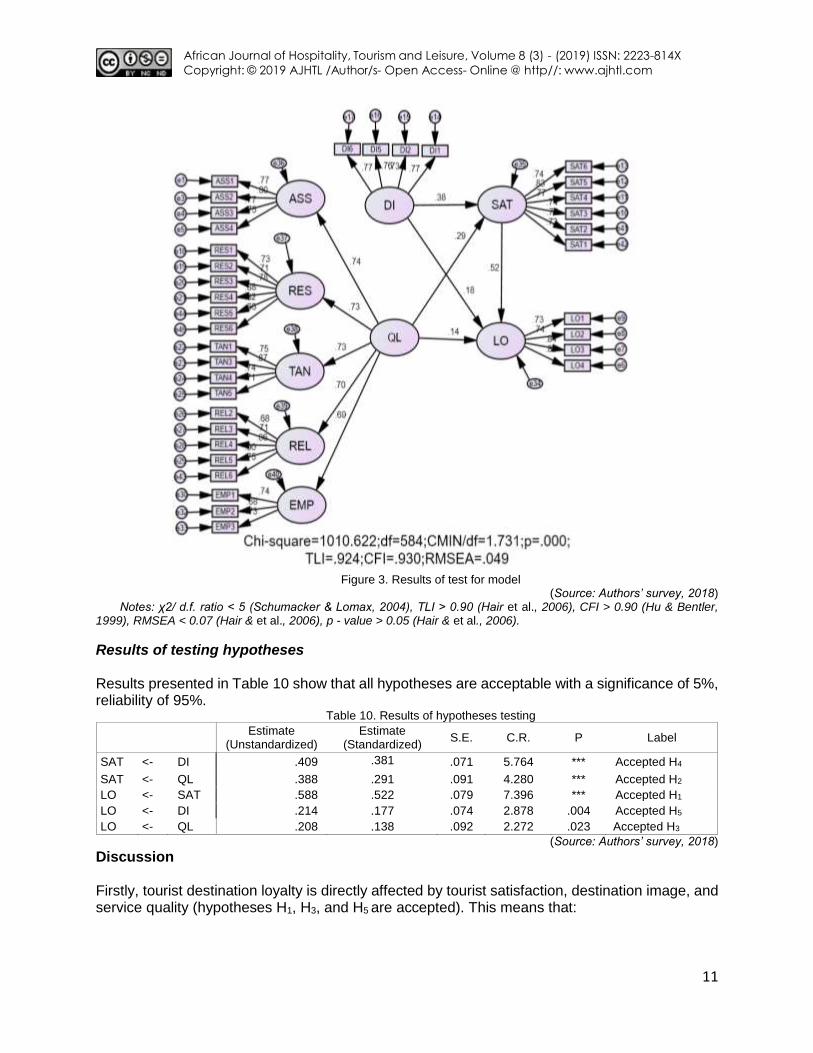
Results of testing model Results in Figure 3 show that although the model has some inappropriate values, such as Chi2 = 1010.622, df = 584, Cmin/df = 1.731 with p - value = 0.000 (< 0.05) because of the size of samples (305 tourists), but other fit indices, such as TLI (0.924), CFI (0.930) and RMSEA (0.049) are acceptable. Thus we can conclude that the model is consistent with market data.
African Journal of Hospitality, Tourism and Leisure, Volume 8 (3) - (2019) ISSN: 2223-814X
Copyright: © 2019 AJHTL /Author/s- Open Access- Online @ http//: www.ajhtl.com
11
Figure 3. Results of test for model
(Source: Authors’ survey, 2018) Notes: χ2/ d.f. ratio < 5 (Schumacker & Lomax, 2004), TLI > 0.90 (Hair et al., 2006), CFI > 0.90 (Hu & Bentler,
1999), RMSEA < 0.07 (Hair & et al., 2006), p - value > 0.05 (Hair & et al., 2006).
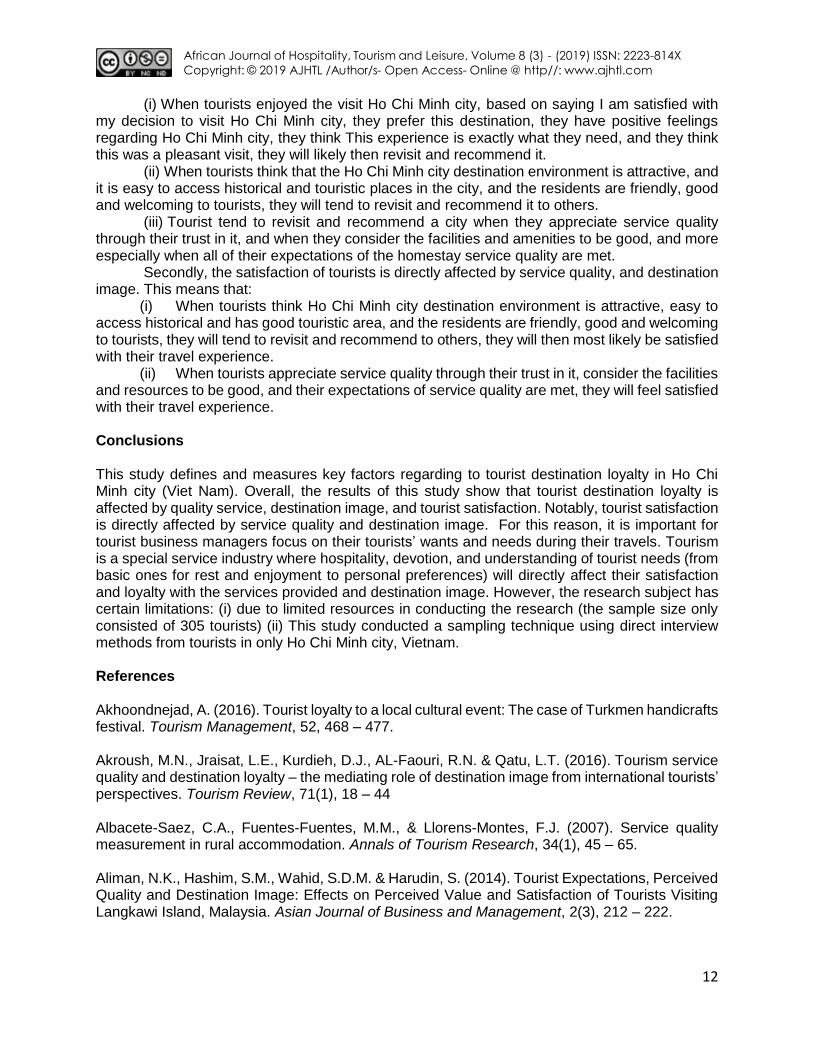
Results of testing hypotheses Results presented in Table 10 show that all hypotheses are acceptable with a significance of 5%, reliability of 95%.
Table 10. Results of hypotheses testing
Estimate
(Unstandardized) Estimate
(Standardized) S.E. C.R. P Label
SAT <- DI .409 .381 .071 5.764 *** Accepted H4
SAT <- QL .388 .291 .091 4.280 *** Accepted H2
LO <- SAT .588 .522 .079 7.396 *** Accepted H1
LO <- DI .214 .177 .074 2.878 .004 Accepted H5
LO <- QL .208 .138 .092 2.272 .023 Accepted H3
(Source: Authors’ survey, 2018)
Discussion Firstly, tourist destination loyalty is directly affected by tourist satisfaction, destination image, and service quality (hypotheses H1, H3, and H5 are accepted). This means that:
African Journal of Hospitality, Tourism and Leisure, Volume 8 (3) - (2019) ISSN: 2223-814X
Copyright: © 2019 AJHTL /Author/s- Open Access- Online @ http//: www.ajhtl.com
12
(i) When tourists enjoyed the visit Ho Chi Minh city, based on saying I am satisfied with my decision to visit Ho Chi Minh city, they prefer this destination, they have positive feelings regarding Ho Chi Minh city, they think This experience is exactly what they need, and they think this was a pleasant visit, they will likely then revisit and recommend it.
(ii) When tourists think that the Ho Chi Minh city destination environment is attractive, and it is easy to access historical and touristic places in the city, and the residents are friendly, good and welcoming to tourists, they will tend to revisit and recommend it to others.
(iii) Tourist tend to revisit and recommend a city when they appreciate service quality through their trust in it, and when they consider the facilities and amenities to be good, and more especially when all of their expectations of the homestay service quality are met.
Secondly, the satisfaction of tourists is directly affected by service quality, and destination image. This means that:
(i) When tourists think Ho Chi Minh city destination environment is attractive, easy to access historical and has good touristic area, and the residents are friendly, good and welcoming to tourists, they will tend to revisit and recommend to others, they will then most likely be satisfied with their travel experience.
(ii) When tourists appreciate service quality through their trust in it, consider the facilities and resources to be good, and their expectations of service quality are met, they will feel satisfied with their travel experience. Conclusions This study defines and measures key factors regarding to tourist destination loyalty in Ho Chi Minh city (Viet Nam). Overall, the results of this study show that tourist destination loyalty is affected by quality service, destination image, and tourist satisfaction. Notably, tourist satisfaction is directly affected by service quality and destination image. For this reason, it is important for tourist business managers focus on their tourists’ wants and needs during their travels. Tourism is a special service industry where hospitality, devotion, and understanding of tourist needs (from basic ones for rest and enjoyment to personal preferences) will directly affect their satisfaction and loyalty with the services provided and destination image. However, the research subject has certain limitations: (i) due to limited resources in conducting the research (the sample size only consisted of 305 tourists) (ii) This study conducted a sampling technique using direct interview methods from tourists in only Ho Chi Minh city, Vietnam. References Akhoondnejad, A. (2016). Tourist loyalty to a local cultural event: The case of Turkmen handicrafts festival. Tourism Management, 52, 468 – 477. Akroush, M.N., Jraisat, L.E., Kurdieh, D.J., AL-Faouri, R.N. & Qatu, L.T. (2016). Tourism service quality and destination loyalty – the mediating role of destination image from international tourists’ perspectives. Tourism Review, 71(1), 18 – 44 Albacete-Saez, C.A., Fuentes-Fuentes, M.M., & Llorens-Montes, F.J. (2007). Service quality measurement in rural accommodation. Annals of Tourism Research, 34(1), 45 – 65. Aliman, N.K., Hashim, S.M., Wahid, S.D.M. & Harudin, S. (2014). Tourist Expectations, Perceived Quality and Destination Image: Effects on Perceived Value and Satisfaction of Tourists Visiting Langkawi Island, Malaysia. Asian Journal of Business and Management, 2(3), 212 – 222.
African Journal of Hospitality, Tourism and Leisure, Volume 8 (3) - (2019) ISSN: 2223-814X
Copyright: © 2019 AJHTL /Author/s- Open Access- Online @ http//: www.ajhtl.com
13
Almeida-Santana, A. & Moreno-Gil, S. (2018). Understanding tourism loyalty: Horizontal vs. destination loyalty, Tourism Management, 65, 245 – 255.
Altunel, M.C. & Erkurtb, B. (2015). Cultural tourism in Istanbul: The mediation effect of tourist experience and satisfaction on the relationship between involvement and recommendation intention. Journal of Destination Marketing & Management, 4(4), 213 – 221. Anderson, J.C. & Gerbing, D.W. (1988). Structural equation modeling in practice: A review and recommended two-step approach. Journal of Psychological Bulletin, 103(3), 411 – 423. Backman, S.J. & Crompton, J.L. (1991). The usefulness of selected variables for predicting activity loyalty, Leisure Sciences. An Interdisciplinary Journal, 13(3), 205 – 220. Bitner, M.J. (1992). Servicescapes: The impact of physical surroundings on customers and employees. Journal of Marketing, 56(2), 57 – 71. Chen, C.M., Lee, H.T., Chen, S.H. & Huang, T.H. (2011). Tourist behavioural intentions in relation to service quality and customer satisfaction in Kinmen National Park, Taiwan. International Journal of Tourism Research, 13, 416 – 432. Chiu, W., Zeng, S. & Cheng, P.S.T. (2016). The influence of destination image and tourist satisfaction on tourist loyalty: a case study of Chinese tourists in Korea. International Journal of Culture, Tourism and Hospitality Research, 10(2), 223 – 234. Chen, C.F. & Tsai, D. (2007). How destination image and evaluative factors affect behavioral intentions?. Tourism Management, 28(4), 1115 – 1122. Chen, C.F. & Chen, F.S. (2010). Experience quality, perceived value, satisfaction and behavioral intentions for heritage tourists. Tourism Management, 31, 29 – 35. Cronin, J.J. & Taylor, S.A. (1992). Measuring Service Quality: A Reexamination and Extension, Journal of Marketing, 56 (July), 55 – 68. Ekinci, Y., Prokopaki, P. & Cobanoglu, C. (2003). Service quality in Cretan accommodations: marketing strategies for the UK holiday market. International Journal of Hospitality Management, 22(1), 47 – 66. Ekinci, Y., Sirakaya-Turk, E. & Preciado, S. (2013). Symbolic consumption of tourism destination brands. Journal of Business Research, 30(2), 10–15. Fakeye, P. & Crompton, J. (1991). Image differences between prospective, first-time, and repeat visitors to the lower Rio Grande valley. Journal of Travel Research, 30(2), 10–16. Fornell, C. (1992). A National Customer Satisfaction Barometer: The Swedish Experience. Journal of Marketing, 56(January), 6–21. Fuchs, M. & Weiermair, K. (2003). New perspectives of satisfaction research in tourism destinations. Tourism Review, 58(3), 6 – 14.
African Journal of Hospitality, Tourism and Leisure, Volume 8 (3) - (2019) ISSN: 2223-814X
Copyright: © 2019 AJHTL /Author/s- Open Access- Online @ http//: www.ajhtl.com
14
Grobler, S. & Nicolaides, A. (2016). Sustainable Tourism Development for Clarens in the Free State Province of South Africa. African Journal of Hospitality, Tourism and Leisure, 5(2), 1 – 18. Hair, J., Aderson, R., Tatham, P. & Black, W. (2006). Multivariate data analysis, 6th ed. Prentice- Hall, Upper Saddle River, N.J. Hansemark, O.C. & Albinsson, M. (2004). Customer satisfaction and retention: the experiences of individual with employees. Managing Service Quality, 14(1), 40 – 57. Howat, G., Absher, J., Crilley, G. & Milne, I. (1995). Measuring Customer Service Quality in Sports and Leisure Centres. Managing Leisure, 1(2), 77-89. Hu, L.T. & Bentler, P.M. (1995). Evaluating model fit. In R. H. Hoyle (Ed.), Structural equation modeling: Concepts, issues, and applications (76 – 99). Thousand Oaks, CA: Sage. Iordanova, E. (2016). Tourisum destination image as an antecedent of destination loyalty: The case of Linz, Austria. European Journal of Tourism Research, 16, 214 – 232. Ivyanno, C. & Hidayat, N (2012). The Influence of Service Quality and Tourist Satisfaction on Future Behavioral Intentions: The Case Study of Borobudur Temple as a UNESCO World Culture Heritage Destination. IPEDR, 50(19), 89 – 97. Kang, G. & James, J. (2004). Service Quality Dimensions: an Examination of Grönroos’s Service Quality Model. Managing Service Quality, 14(4), 266 – 277. Kasiria, L.A., Cheng, K.T.G., Sambasivan, M. &, Sidin, S.M. (2017). Integration of standardization and customization: Impact on service quality, customer satisfaction, and loyalty. Journal of Retailing and Consumer Services, 35, 91 – 97. Kim, D. & Kim, S. (1995). QUESC: an instrument for assessing the service quality of sport centers in Korea. Journal of Sport Management, 9(2), 208 – 220. Kotler, P. & Keller, K.L. (2009). Marketing management (13th end). New Jersey: Pearson Education Inc, Upper Saddle River: NJ. Kozak, M. & Rimmington, M. (2000). Tourist satisfaction with Mallorca, Spain, as an off-season holiday destination. Journal of Travel Research, 38(3), 260 – 269. Lee, S., Jeon, S. & Kim, D. (2011). The impact of tour quality and tourist satisfaction on tourist loyalty: The case of Chinese tourists in Korea. Tourism Management, 32, 1115 – 1124. McDonald, M. A., Sutton, W. A. & Milne, G. R. (1995). TEAMQUAL: Measuring service quality in professional sports. Sport Marketing Quarterly, 4(2), 9-15 Moore, S. A., Rodger, K. & Taplin, R. (2013). Moving beyond visitor satisfaction to loyalty in nature-based tourism: a review and research agenda. Current Issues in Tourism, 1 – 17. Nicolaides, A. (2018) Ethical Hospitality Marketing, Brand- Boosting and Business Sustainability . African Journal of Hospitality, Tourism and Leisure, 7 (1). Oliver, R. L. (1999). Whence consumer loyalty?. The Journal of Marketing, 63, 33 – 44.
African Journal of Hospitality, Tourism and Leisure, Volume 8 (3) - (2019) ISSN: 2223-814X
Copyright: © 2019 AJHTL /Author/s- Open Access- Online @ http//: www.ajhtl.com
15
Oliver, R.L. (1997). Satisfaction: A Behavioral Perspective on the consumer. New York: McGraw Hill. Orel, F.D. & Kara, A. (2014). Supermarket self-checkout service quality, customer satisfaction, and loyalty: empirical evidence from an emerging market. Journal of Retailing and Consumer Services, 21(2), 118 – 129. Parasuraman, A., Zeithaml, V.A. & Berry, L.L. (1988). SERVQUAL: A multiple item scale for measuring consumer perception of service quality. Journal of Retailing, 64(1), 12 – 37. Rajaratnam, S.D., Munikrishnan, U.T., Sharif, S.P. & Nair, V. (2014). Service quality and previous experience as a moderator in determining tourists’ satisfaction with rural tourism destinations in Malaysia: A partial least squares approach. Procedia - Social and Behavioral Sciences, 144, 203 – 211. Ramseook-Munhurruna, P., Seebalucka, V.N. & Naidooa, P. (2015). Examining the structural relationships of destination image, perceived value, tourist satisfaction and loyalty: case of Mauritius. Procedia - Social and Behavioral Sciences, 175, 252 – 259. VietNam National Administration of Tourism. (2018). Tourism Statistics. http://vietnamtourism.gov.vn/english/index.php/items/10260. Wu, C.W. (2016). Destination loyalty modeling of the global tourism. Journal of Business Research, 69(6), 2213 – 2219 Yoon, Y. & Uysal, M. (2005). An examination of the effects of motivation and satisfaction on destination loyalty: a structural model. Tourism Management, 26, 45 – 56.