factors influencing african american high school students
TRANSCRIPT
Utah State University Utah State University
DigitalCommons@USU DigitalCommons@USU
Dissertations Research
2009
Factors Influencing African American High School Students in Factors Influencing African American High School Students in
Career Decision-Making Self-Efficacy and Engineering-Related Career Decision-Making Self-Efficacy and Engineering-Related
Goal Intentions Goal Intentions
Chandra Yvette Austin University of Minnesota
Follow this and additional works at: https://digitalcommons.usu.edu/ncete_dissertations
Part of the Education Commons
Recommended Citation Recommended Citation Austin, C. (2009). Factors influencing African-American high school students in career decision self-efficacy and engineering-related goal intentions. Unpublished doctoral dissertation, University of Minnesota.
This Dissertation is brought to you for free and open access by the Research at DigitalCommons@USU. It has been accepted for inclusion in Dissertations by an authorized administrator of DigitalCommons@USU. For more information, please contact [email protected].
Factors Influencing African American High School Students in Career Decision-Making Self-Efficacy and Engineering Related Goal Intentions
A DISSERTATION SUBMITTED TO THE FACULTY OF THE GRADUATE SCHOOL
OF THE UNIVERSITY OF MINNESOTA BY
Chandra Yvette Austin
IN PARTIAL FULFILLMENT OF THE REQUIREMENTS FOR THE DEGREE OF
DOCTOR OF PHILOSOPHY
DR. THEODORE LEWIS, Ph.D, Advisor
September 2009

© Chandra Yvette Austin, September 2009
i
Acknowledgments
First and foremost I would like to thank my Lord and Savior Jesus Christ whom
without him, nothing would be possible.
I would like to acknowledge my adviser, Dr. Theodore Lewis. Thank you for
always keeping me on track, even when I didn’t want to be. Thank you for the time you
have taken to work with me and for giving me the inspiration to always stay ahead of the
task that you have given me. You truly are a brilliant and talented man and I am so
grateful you continued with me throughout this process. I would like to offer a heartfelt
appreciation to the other members of my committee: Dr. Rosemarie Park, Dr. Shari
Peterson, and Dr. Ernest Davenport. I would also like to thank Dr. Kenneth Bartlett who
made sure I stayed on track in my adviser’s absence.
To my mentor Dr. Mauvalyn Bowen, thank you so much for always encouraging
me, sometimes when I didn’t even believe I was capable of accomplishing tasks. Thank
you for always letting me come to you when I know you could have been doing
something else. To Mrs. Venoreen Browne-Boatswain, thank you for first allowing me
the opportunity to come Minnesota but also for making sure I had everything I needed
while I adapted. Thank you also for being available when I needed a second thought on
my studies.
I would like to express gratitude to the principals Dr. Steve Wilson and Dr. Sean
Alford for allowing me into your schools to conduct this survey. To all of the teachers
especially Dr. Pat Hall, thank you for helping recruit, distribute, and everything else. To

ii
the students who never believed they could get a doctorate or even go to college know
that it is possible with hard work and perseverance.
Next I would like to thank my parents Charles and Ava Austin who have
supported me both spiritually, mentally, and sometimes financially throughout my entire
academic career. I never would have made it to this point without your guidance and
love. I would also like to send a special thanks to my sister, Charnequa, who I have and
continue to look up too because of her strength and dedication in life. You were described
best when you were called the “standard setter”. To my brother, Charles Jr., who has kept
me excited throughout this whole process with a smile and kind words. To my
grandfather, who was always there for me, encouraging me to keep studying. I love you
all.
Finally, thank you to all of my family and friends each of you always encouraged
me to pursue my dreams and I am grateful to have you in my life.
iii
Abstract
A current challenge in the United States is to increase African American pursuit
of engineering careers. Minority students generally tend to be under-represented in such
careers, as indicated by the National Academy of Engineering, in The Engineer of 2020-
Visions of Engineering in the New Century. This study explores the career decision self-
efficacy (Lent, Brown & Hackett, 1993) and Engineering related goal intentions of
African American high school students. There are a variety of reasons explaining the lack
of choice of engineering as a career, and these were investigated. This study assessed the
effect of specific influences (ethnic identity, demographic factors, ability, school factors,
Math/Science confidence, Math/Science self-efficacy, Math/Science interest, and family
support) on career decision self-efficacy and engineering related goal-intentions. Data
from a survey of 396 African American students’ grades 9-12, low-middle income level,
in a southeastern school were used in the study. Results show that career decision self-
efficacy among students studied is influenced by: Math/science confidence, ethnic
identity, family relations, school factors, and socioeconomic status. Factors influencing
engineering related goal intentions were very similar but each variable did not contribute
the same amount of variance. Results also show that gender was not significant in either
dependent variable. Other implications and recommendations relating to the variables are
presented.

iv
Table of Contents
LIST OF TABLES ............................................................................................................ vii
LIST OF FIGURES ......................................................................................................... viii
CHAPTER I INTRODUCTION ..........................................................................................1
African Americans and Engineering ............................................................................3 Vocational Ideals ..........................................................................................................5
Rationale ...........................................................................................................................8 Statement of the Problem .................................................................................................9 Purpose of the Study ........................................................................................................9
Theories ......................................................................................................................10 Important Studies........................................................................................................11
Research Question ..........................................................................................................13 Research Approach ........................................................................................................13 Significance of the Study ...............................................................................................13 Variables and their measurements ..................................................................................14 Definition of Terms ........................................................................................................16 Summary ........................................................................................................................17
CHAPTER II REVIEW OF LITERATURE .....................................................................19
Ethnic Identity ................................................................................................................19 Social Identity Theory ................................................................................................20 Ego Identity Theory ....................................................................................................21
School Factors ................................................................................................................24 Family Relationship .......................................................................................................28 Interest ............................................................................................................................33 Self-efficacy ...................................................................................................................36 Math/Science self-efficacy .............................................................................................37 Math/Science related goal intentions .............................................................................40 Career decision self-efficacy ..........................................................................................41 School-To-Work transition ............................................................................................44 Career development ........................................................................................................48 Summary ........................................................................................................................50
v
CHAPTER III METHOD AND PROCEDURE ................................................................52
Design of the Study ........................................................................................................52 Population and Sample ...................................................................................................53
District ........................................................................................................................53 School One .................................................................................................................53 School Two .................................................................................................................56
Instrumentation ...............................................................................................................57 Demographic data .......................................................................................................59 School factors .............................................................................................................62 Ethnic identity ............................................................................................................63 Math/Science ..............................................................................................................64 Career decision self-efficacy ......................................................................................66 Family relationships ...................................................................................................67
Institutional Review Board .............................................................................................67 Pilot Test ........................................................................................................................68 Data collection ................................................................................................................69 Data analysis ..................................................................................................................70 Summary ........................................................................................................................71
CHAPTER IV DATA ANALYSIS ...................................................................................72
Demographic Factors .....................................................................................................72 Living situation ...........................................................................................................72 Parent/Guardians education level ...............................................................................75 Socio-economic status ................................................................................................76 Eighth grade math/science scores ...............................................................................77 Current GPA ...............................................................................................................78
Mean ranks .....................................................................................................................81 School factors .............................................................................................................81 Ethnic identity ............................................................................................................83 Math/Science expectations .........................................................................................84 Math/Science confidence............................................................................................86 Math/Science interest .................................................................................................87 Career decision self-efficacy ......................................................................................88 Family relationships ...................................................................................................90
vi
Correlations ....................................................................................................................91 Dependent variable breakdown ......................................................................................95
CDSE subscale ...........................................................................................................95 Factor Analysis ...........................................................................................................97 MSE scale ...................................................................................................................99
Research Question One ................................................................................................100 Research Question Two ...............................................................................................102 Summary ......................................................................................................................106
CHAPTER V DISCUSSION ...........................................................................................107
Summary of Findings ...................................................................................................108 Discussion of Findings .................................................................................................108
Career decision self-efficacy ....................................................................................109 Math/Science related goal intentions ........................................................................112
Conclusions ..................................................................................................................115 Recommendations and Implications ............................................................................116 Limitations ...................................................................................................................117 Summary ......................................................................................................................117
REFERENCES ................................................................................................................119
APPENDICES .................................................................................................................152
A. IRB Notice
B. Permission to Use Instrument
C. Permission to Use Instrument
D. Permission to Use Instrument
E. Parent Consent for Pilot
F. High School Student Letter for Pilot
G. Parent Consent
H. High School Letter
I. Letters to Teachers
J. Script for Administration of Survey
K. Survey Instrument

vii
List of Tables
Table 3.1: Components of Survey Instrument ...................................................................58
Table 3.2: Reliability of Questionnaire (Cronbach’s Alpha) .............................................59
Table 3.3: Descriptive Statistics ........................................................................................62
Table 4.1: Student’s Living Situation ................................................................................73
Table 4.2: Student’s Living Situation by GPA ..................................................................74
Table 4.3: Parent’s Education ............................................................................................75
Table 4.4: Hollingshead Socioeconomic Score .................................................................77
Table 4.5: 8th grade Math and Science Scores ...................................................................78
Table 4.6: Reported overall GPA.......................................................................................79
Table 4.7: Reported overall GPA by gender ......................................................................80
Table 4.8: Responses to school influences ........................................................................82
Table 4.9: Ethnic identity ...................................................................................................84
Table 4.10: Math/Science expectations .............................................................................85
Table 4.11: Math/Science confidence ................................................................................86
Table 4.12: Math/Science interest......................................................................................87
Table 4.13: Career decision ......................................................................................... 88-89
Table 4.14: Family relationships.................................................................................. 90-91
Table 4.15: Inter-correlation of selected variables ...................................................... 93-94
Table 4.16: Career decision self-efficacy subscale breakdown ................................... 95-96
Table 4.17: Career decision self-efficacy factor table ................................................. 97-98
Table 4.18: MS Expectations by gender ............................................................................99
Table 4.19: CDSE Model Summary ................................................................................101
Table 4.20: CDSE model showing contribution of each variable ...................................102
Table 4.21: MSE Model Summary ..................................................................................104
Table 4.22: MSE model showing contribution of each variable .....................................105

viii
List of Figures
Figure 4.1: Reported GPA .................................................................................................80
1
Chapter I
Introduction
The idea of disproportionate education is not a recent phenomenon. This concept
has been around for decades, stemming from what some call involuntary citizenship as a
result of the African slave trade. “In the past, black Americans, for example were given
inferior education by formal statutes in the South and by informal practices in the North”
(Ogbu, 1987, p.318). Parents were taught by oppressors to say to their children that there
were certain spheres into which they should not go, because they would have no chance
for development (Woodson, 1933). However, during an era of segregation came a well-
known case, Brown vs. Board of Education. Ideally this legislation was supposed to be
the solution that ended inequality in education, but that has not been the case. Inequality
in education along racial lines persists (Oakes, 2005). Although schools have become
integrated, the content students learn and achievement outcomes are still differentiated by
race and class (Braddock 1990; Gamoran, 2001; Lucas & Berends, 2002; Oakes &
Guiton, 1995). This differentiation follows students into the labor market, influencing the
choices they make.
Institutional racism, a relic of slavery, has affected the educational system. It
features a hierarchical conception of intellectual ability (Denbo and Beaulieu, 2002),
resulting in practices such as academic tracking. When tracking is done it is often as a
result of individual and cultural characteristics (Oakes, 2005). Shaffer, Ortman, and
Denbo (2002) state that to fully understand African American student achievement, it is

2
essential to take into consideration the historical context of racial oppression and also
consider the current conditions of schools. Longstreet (1978) notes that ethnic groups
vary in several ways some of which include; verbal and non verbal communication,
social value patterns, and intellectual modes. Thus education must be created to include
cultural diversity (Davenport, 1981). But even within ethnic groups there exists
educational disparity. For example, urban students have less access to a variety of
educationally important resources, such as small class sizes, highly qualified teachers,
computers, advanced level courses, and other curriculum supports (Darling-Hammond,
1997). Middle-class African American students are an example of students who, although
they are equipped with more resources, may feel that excelling in school while their
lower income counterparts are not, is betraying their true identity (Shaffer, Ortman, and
Denbo, 2002). Regardless of what the disparity may be Apple (2004) agrees that schools
contribute to the imbalance of power in society by communicating society’s economic,
political and cultural knowledge to students.
African Americans have participated in vocational education since the times they
were slaves (Gordon, 2008; Moody, 1980). Some may say this has created a hazardous
cycle particularly because this reinforces the idea that they are better suited to manual
rather than academic pursuits. The United States is becoming more diverse (Phinney &
Alipura, 1996), and globalization has made it disadvantageous for there to be inequality
of educational opportunity along ethnic lines. The National Academy of Engineers
(2004), an organization of engineers that advises the government on issues concerning
engineering stated that if the U.S is to maintain economic leadership and be able to
3
sustain its share of high-technology jobs, it must prepare for a new wave of change. This
new wave of change refers to the education of more minorities as the minority population
increases, in order to ensure global competition (NAE, 2004). One notable field where
countries compete is engineering. There historically has been widespread shortages of
minorities, especially African Americans in the various engineering fields (George,
Neale, Van Horne, & Malcom , 2001; Lam, Srivatsan,,Doverspike, Vesalo, 2005).
African Americans and Engineering
It is important here to reflect on the post Civil War period and the views of
Booker T. Washington and William E.B. DuBois. It is informative to study these two
particular authors because their debate about education, pre-dated the exchanges between
Dewey (1916) and Snedden (1910), but related specifically to African Americans. Both
Washington and Du Bois recognized the value of education and of the necessity of black
participation in skilled trades (Wharton, 1992). The controversy came in the differences
of philosophies regarding black higher education.
Booker T. Washington was born a slave and did not begin his formal education
until after the Civil War when he was freed. He thought in order for people to gain
satisfaction in education that they must give service to others. One way he implemented
this belief was while president of Tuskegee Institute he required that students do some
form of manual labor as a part of the curricula. Unfortunately many believed that
Washington’s views forestalled the involvement of African Americans in engineering by
almost three decades, because it was felt he condemned bright young minds to vocations
4
beneath their ability, thus reinforcing inferiority (Wharton, 1992; Hinman, 2005; Moore,
2003). Washington’s educational philosophy was not designed to produce individuals
who would be able to compete with whites for jobs, which is one of the reasons Du Bois
denounced his work. He did this by promoting black worth and giving inspiration to
those who wanted to pursue engineering as well as other academic careers. Du Bois
created a notion referred to as the “talented tenth”--the percentage of blacks he felt were
endowed with talents and brains to lead the race to self-sufficiency. He insisted that the
college-trained elite could lift the lower class. He felt success would come from the
development of mental faculties.
Despite their debate, both Washington and DuBois can be viewed to have
enhanced the African American population in their own way. Engineering is believed to
be a vocation which combines the characteristics of science, art, and business. It involves
knowledge of the forces and materials of nature, an understanding of men, and a
understanding of economic and social relations (Dowing, 1935). But the early curriculum
in American colleges of engineering was still considered an alternative to what was
viewed as the traditional classical discipline. In early America, unlike the fields of
medical and legal, engineering education was never under the exclusive domination of a
professional group, the curriculum was created strictly by educators (Grayson, 1980).
Therefore those who were not engineers and knew little to nothing of the content it
entailed had enormous input to shaping the field of engineering. As a result, the early
engineering curriculum contained little technique of engineering practice. Prior to WWI
few opportunities existed for African Americans to work in engineering fields. But some
5
Historically Black schools (such as Howard University, North Carolina Agricultural &
Technical State University, and Hampton University) began offering engineering majors.
These schools continue to be at the forefront of the education of African American
engineers.
The importance of educating all Americans including African Americans was
identified in the 1930’s and is still being restated here in the 21st century. The US has
lost some technological ground and will continue to do so if everyone is not provided an
equal opportunity to advance in all areas. Some have gone so far as to say that African
Americans are not well educated in the field of engineering because the information they
are obtaining is not relevant. Woodson (1933) concurs by stating that since African
Americans were told what to learn by another race for so long, they must now be taught
to think and develop something for themselves. Or some may go further back to say that
during slavery African Americans developed a negative identity and now it is their
responsibility to interpret, and come to terms with, their collective traumatic past and
their relationship to that past (Eyerman, 2001). In doing this they can make strides to
change their present identity. Regardless of what the source of this disparity in education
all would agree that it is something that needs to be reconciled.
Vocational Ideals
In an attempt to further evaluate the vocational ideals that have existed in
Americans thus far, we are led to examine the educational works of John Dewey and
David Snedden. Dewey coming from an anthropological background believed that the
6
individual is only a meaningful concept when regarded as an intricate part of his or her
society, and the society has no meaning apart from its realization in the lives of its
individual members. “Dewey believes the environment in the school and classroom
should promote such a mode of life by enabling teachers and students to enact it day by
day, even moment by moment” (Hansen, 2002, p.267). One way he concluded that an
individual could be important in society is through vocational education. Dewey also
believed that one of the primary purposes for learning was so that one could in turn use
that knowledge to survive and better society. In vocational education the learning of
various subjects often includes community influence as well as a construction of one’s
own knowledge. Brown (1984) asserted that within the community when reference is
made about community support; parents, the business community, and the nation as a
whole are concerned with the quality and contribution of vocational education to society.
The idea that humans have a tendency to become what they do is something that
Dewey believed in. When people become a part of their work he believed that they would
inherently learn things better and absorb the knowledge they obtain better. Oftentimes
people think that when you become a part of something you have to sacrifice a piece of
you to truly conform especially when one works in a group. Dewey was opposed to this
thought rationalizing that an “intelligence created by all people” was indeed the answer.
Lawrence Cremin a well known historian also agreed saying, “It takes a whole culture of
people to put together the narrow curriculum and made expectations that present-day
Americans use to stage, worry about, and interpret what happens in schools” (McDermott
& Raley, 2007). Not only did Dewey believe in community contribution to education he

7
also believed in the structure of education. He contended that without structure no
intelligent connection could be made between liberal subjects such as history, English,
and math. To help provide structure teachers had to be mindful of the environment in
which the child learns. Thus “the only way in which adults consciously control the kind
of education which the immature get is by controlling the environment in which they act,
and hence think and feel. We never educate directly, but indirectly by means of the
environment” (Dewey, 1916).
Although Snedden agreed vocational education to be a good thing, he also
believed that academic and vocational instruction should be taught in separate
environments (Gordon, 2008). Vocational education was viewed as having a societal, not
just an individual impact. Historically vocational education has not included liberal
subjects but purely apprenticeships and learning of a specific trade, but historical
methods of apprenticeship came to be viewed by Dewey and others as inappropriate for
new industry. Knowledge of some liberal subjects (for instance mathematics) appeared to
be needed in order to practice particular vocations. Still some do not agree that a
mechanic should take an English class when he/she will be working on automotives, but
basic skills are still necessary regardless of profession.
One may ask how does the Dewey/Snedden debate relate to African Americans.
More so, how does the historical context of vocational education and engineering affect
the current status quo. The answer is that Dewey and Snedden engaged in an academic
discourse that originated with their predecessors Washington and DuBois. Dewey held
8
the belief that education should be universal, aimed at citizenship. He was of the view
that Snedden’s conception of vocational education would deny the under-classes the right
to education so conceived. For Dewey vocational education should be offered only if it
was liberally conceived.
Rationale
The National Science Foundation (NSF) in 2006 reported that 5.2% of
engineering degrees were awarded to African Americans. Although schools today are
not deliberately designed to achieve classist or racist ends, research finds that there is a
contradiction in reality (Apple, 2004).Research shows that the current education of
African Americans is unequal to that of White students (Norman et al., 2001). However,
there is an absence of literature focusing specifically on the field of engineering. The
career decision self-efficacy and engineering related goal intentions of African American
students are not well understood. I hoped to gain insight on why African American
students are absent in the field of engineering. From this insight the educational field will
be able to gain a better understanding of how to enhance educational efforts intended to
prepare African Americans for the field of engineering. In addition some motivational
factors may be gleaned based on what the students view as their perceived needs in order
to prepare for careers in this field. Lastly, if the factors that influence engineering career
decisions are identified then educators will better understand how to foster and develop a
culturally responsive environment for African American students. In such environment
students may be more inclined to engage in the study of engineering. Knowing the
9
variables that enhance career decision efficacy and engineering-related goal intentions
among African American students can lead to interventions that enhance their choice of
engineering as a career.
Statement of the Problem
This study intends to fill a gap in knowledge as to why African American students
are not entering engineering. Little is known about the career decision self-efficacy and
engineering related goal intentions among African American students. Specifically,
predictors of career decision self-efficacy and engineering related goal intentions are not
well researched amongst African Americans. Currently there is a lack of studies that
examine African American students’ perspectives on factors impacting their choosing of
engineering careers. Underutilization of minorities in science and engineering is a
problem of national scope (Leslie et al, 1998). If the United States is striving to maintain
its global competiveness in the world, the country must try to remove the barriers that
prevent minorities from choosing engineering as a career.
Purpose of the Study
The purpose of this study was to understand how African American students
perceive their ability to successfully enter engineering careers. Due to the current
challenge in the United States to increase the number of African Americans pursuing
engineering, research must be further on factors that are perceived to foster and to hinder
the entrance of minorities into this field.
10
Theories
There are a number of theories explaining adolescent career decision making. The
first is the Self-Efficacy Theory developed by Albert Bandura. Bandura’s (1977) theory
makes the assumption that personal self-efficacy is based on four major sources of
information: performance accomplishments, vicarious experiences, verbal persuasions,
and physiological states. This theory is viewed important because a number of studies
have found a link between self-efficacy and the ability of adolescents to make decisions
about careers (Lent et al., 1986; Lent & Hackett, 1987; Taylor & Betz, 1983). A second
and equally important theory that will be used-- a by-product of the Self-Efficacy Theory
(Bandura, 1986) is the Social Cognitive Career Theory (SCCT) developed by Lent,
Brown, and Hackett (1987). This theory is deemed essential because its main purpose is
to construct connections between variables that may influence career development
(Brown & Lent, 1996).
A third theory employed in this study was Super’s developmental Self-Concept
Theory of Vocational Behavior. In this theory Super (1953) asserts that people attempt to
apply their self-concept by choosing a career that permits self-expression. He goes on to
make the claim that a person’s career behavior reflects his/her life stage (Osipow, 1983).
Super’s theory is vital because self-concept and vocational development have proved to
be important factors and could enhance the creation of more compatible curriculum for
African American students. A fourth theory is Holland’s (1959) Career Typology Theory
of Vocational Behavior. In it Holland contends that career choices represent an extension

11
of an individual’s personality (Osipow, 1983; Sauermann, 2005). He states that people
identify their views of themselves by an occupational title. Holland’s theory is influential
to this study particularly because of his suggestion on how people choose careers. If in
fact people choose careers where they believe they will be surrounded by people like
themselves, then the education field needs to develop a strategy to intrigue African
American students about engineering. The conclusion could be easily drawn that African
American students do not enter engineering because they cannot identify with the field.
Although these theories are regarded as important, few of them have been applied to
minority populations. This study sought to do this by examining African American
student’s orientation to engineering careers.
Important Studies
Some of the important studies that were drawn upon to develop variables for this
research study are reviewed in this section. Navarro, Flores, and Worthington (2007)
used a modified version of the Social Cognitive Career Theory to examine whether socio-
cognitive variables explained math/science goals in Mexican American middle school
students. Although this study was done at the middle school level, it is still beneficial to
the current study in that it observes an underrepresented minority group. Also Navarro et
al.(2007), found that within this population math/science interest and goals could be
predicted by math/science self-efficacy and outcome expectations. Fouad and Smith
(1996) also conducted a study using middle school students and found interest had a
relationship with self-efficacy, outcome expectations, and intentions. At the end of their

12
study they note that more research is needed to test the influence of race and ethnicity as
an influence on self-efficacy. Gushue (2006) examined the relationship between ethnic
identity, career interest and outcome expectations among Latino/a students. This was
identified as a key study because it involved minority students and it studied career
decision self-efficacy as a key variable. He found that ethnic identity had a direct and
positive relationship with career decision self-efficacy. A connection between
race/ethnicity and career aspirations/decision making was also found by Flores et. al,
(2006) and Kenny et al.( 2007).
Hargrove et al. (2002) explored the relationship between family interaction
patterns, vocational identity and career decision self-efficacy. The researchers found that
family interaction patterns play a significant role in the promotion of self-confidence as it
relates to career planning. The study also found that family interaction patterns play a
role in the formulation of career goals. Lent, Lopez, & Bieschke (1991) and Betz &
Hackett (1983) are long time researchers using socio-cognitive variables. Their studies
examined the relationship between math self-efficacy and science-based college majors.
From the results they were able to conclude that math self-efficacy was significantly
related to choosing a science based major. They then went on to assert that the selection
of this major directly resulted in the career choice within the same field.
13
Research Questions
There are two dominating research questions that guide this study. They are:
1) To what extent do exogenous factors (school, math/science interest, ethnic
identity, math/science confidence, family relations) and endogenous factors
(demographic and ability) influence career decision self-efficacy?
2) To what extent do exogenous factors (school, math/science interest, ethnic
identity, math/science confidence, family relations) and endogenous factors
(demographic and ability) influence math/science related goal intentions?
Research Approach
This study uses a quantatitive approach, specifically a survey instrument, to
accurately describe variables that influence career choice. The survey technique allowed
the researcher to examine the factors individually and their correlations with each other.
Multiple regression was used to answer the two overarching research questions fot this
study. A more detailed explanation of the survey instrument and statistical methods will
follow in Chapter 3.
Significance of the Study
The problem of inequality in education will continue to persist if we do not find
ways to reach out to underrepresented populations. To date many studies have examined
career decision self-efficacy using predominately white students (Germeijs and
Verscherren, 2007; Peterson, 1993; Taylor and Betz,1983; Taylor and Pompa, 1990;

14
Gloria and Hird, 1999; Luzzo,1993; Blustein, 1989;) and very few researchers have
studied this same variable among minority students (Brown et al., 1999; Tang et al.,
1999; O’Brien et al. 2000).This study is an attempt to find knowledge and make further
progress in order to serve African American youth. The findings of this study will
provide information that could be used in a number of ways to resolve current
inequalities. Schools would be able to provide intervention strategies to improve the
factors that are found to have a relationship with career decision self-efficacy and
math/science related goal intentions. The results may also serve as a voice for African
American students to express their felt needs and perceived barriers in relation to career
decision self-efficacy and math/science related goal intentions.
Variables and their measurements
The researcher after examining previous studies accumulated a small number of
factors believed to have a relationship with career decision self-efficacy and math/science
related goal intentions. The first factors that will be discussed are the independent
variables. One of these factors is ethnic identity. Ethnic identity is not a trait that is
frequently accommodated in school. Baker (2005) notes that students are usually
presented with school programs where their cultural identities are not supported and their
personal qualities disregarded because they don’t fit the traditional curriculum. The lack
of support for one’s identity may prove to have a negative impact on career decision self-
efficacy. In this study this variable was measured using the Racial Ethnic Identity Scale
by Oyserman, Bybee, and Terry (2007). Researchers also believe that school factors such
15
as teacher expectations and student’s attitude towards school are highly influential in
career choice. Studies show that teachers’ expectations have a more powerful influence
on African American students than they do on white students (Ferguson, 1998; Winfield,
1986). The school factors research variable was measured using questions developed by
the researcher as well as questions used by Ford & Harris (1996) and Masters & Hyde
(1984). A third factor is interest. Basu & Barton (2007) make the assertion that in low-
income urban communities in particular, students do not like science because it is not
connected to their interests or experiences. Since mathematics and science are believed to
relate this assertion is also assumed to hold true about mathematics. Interest was
measured by the Math Science Interest Scale developed by Fouad and Smith (1996). A
fourth independent variable is math/science self-efficacy. Gainor and Lent (1998)
indicate that African Americans are statistically underrepresented in the Mathematics
career field. This underrepresentation is a result of low self-efficacy in this subject area.
Math/science self-efficacy was measured by the Math/Science self-efficacy (MSSE) scale
developed by Fouad, Smith, & Enchos (1997).The fifth independent variable is family
relations. Lopez and Andrews (1987) state there are certain family interactions that
enhance certain behaviors and discourage others. This study attempts to identify some of
those interactions and their relationship with the dependent variables if any. Family
relations was measured using a combination of researcher developed items, and items
developed by Donna Ford (Ford, 1991).The last two independent variables are ability and
demographic factors. Demographic factors were measured using researcher question
pertaining to background information on the student such as grade level, gender, SES,
16
etc. Ability was measured using questions pertaining to GPA of the student, performance
in math class, and performance in science class.
The two dependent variables are career decision self-efficacy and math/science
related goal intentions. Ojeda et al. (2006) make a claim that career decision-making self-
efficacy can be predicted by the confidence level of a person. This variable was measured
using the Career Decision Self-Efficacy Short from (CDSE-SF) developed by Betz, Klein
and Taylor(1996). Math/science related goal intentions will be used in this study as a
proxy for engineering related goals intentions, because math and science are the core
underpinning disciplines of education and since they are the subjects in which high
school students must excel if they are to enter engineering careers. The Math/Science
Goal Intentions Scale developed by Fouad, Smith, and Enchos (1997) was employed for
this. A more detailed connection between these proposed variables will be outlined in the
next chapter.
Definition of Terms
Ability: The performance level in math and science classes as measured by grades.
Career decision self-efficacy (formally career decision-making self-efficacy): Confidence
in the capability to engage in educational planning and career decision-making (Taylor &
Betz, 1983; Peterson & DelMas, 1998).
Math/science related goal intentions: The intent to pursue or persist in engineering relates
courses and future careers.
17
Ethnic Identity: One’s sense of belonging or association to an ethnic group that involves
one’s cultural heritage including values, traditions, and often language ( Phinney,
1990,1996; Phinney & Alpuria,1996; Phinney & Ong, 2007; Tajfel, 1981).
Family Relations: The relationship between family influences/factors and a student’s
ability to make appropriate vocational decisions (Blustein et al., 1991; Hargrove et al.,
2002; Lopez, 1989).
Interest: The inner state of a student that relates to the characteristics of a learning
situation (Hansen, 1999).
Math/Science self-efficacy: Confidence in the capability to successfully perform math or
science related problems (Hackett & Betz, 1989).
School Factors: Teacher and curriculum influences upon student confidence and career
decision making.
Summary
This study builds on the literature which asserts that a relationship exists between
career decision self-efficacy and a variety of socio-cognitive variables among high school
students. Additionally the intent of this research is to go a step further and examine
factors related to Math/science related goal intentions among African American high
school students. Few prior studies have evaluated variables such as math/science self-
efficacy in specific relation to African American students (Betz & Hackett, 1983).
18
A review of the literature is conducted in the next chapter. This review consists of
an exploration into variables that influence career decision self-efficacy and Math/science
related goal intentions. Chapter Three will describe methods employed in the design and
conduct of the study. Chapter four presents the data analysis and findings. Chapter five
presents conclusions and recommendations.
19
Chapter II
Review of Literature
This chapter will examine the relationship between career decision self-efficacy,
math/science related goal intentions, and a number of independent variables that may
affect them. Within the review, theory and issues relating to career decision making
among high school students, particularly minority students will be explored.
Ethnic identity
Identity is not something a person is born with but yet a set of characteristics and
values that are formulated over time (Phinney & Ong, 2007). Erikson (1968) says that the
formation of identity is a developmental process. However, there is much argument
between researchers about when identity is formed. Some researchers assert that the
critical time when identity is formed is specifically during the adolescent years and
identity continues to increase in development through the adult years (Chavira &
Phinney, 1991; Erikson, 1968; Phinney, 1989; Phinney & Chavira, 1992; Phinney &
Alipura, 1990; Spencer, Swanson, & Cunningham, 1991). Umaña-Taylor, Yazedjian, and
Bámaca-Gómez (2004) maintain that since the U.S. is an ethnically conscious society it is
imperative issues surrounding ethnic identity be addressed. Ethnic identity is known to be
an integral part of one’s overall identity. Furthermore, membership in an ethnic minority
group may result in increased sensitivity to identity issues among minority adolescents
and a higher overall level of identity development (Phinney & Alpuria, 1990). When
evaluating the methods or models which focus on ethnic identity there are two that are

20
widely used to describe its importance and basis, they are social identity theory and ego
identity theory.
Social Identity Theory
Tajfel (1981) argues that ethnic identity is an aspect of social identity. Thus, in
short, he defines social identity as the part of the individual’s self concept which derives
from his/her knowledge of his/her membership of a social group. The sense of identity is
heightened when one considers in-group membership compared to outer groups.
Comparison with other groups can affect how a particular social group identifies with
society as a whole and their place in this society. It has been proposed that persons with a
strong sense of ethnic identity, particularly when they belong to a minority group, may
see barriers to career development as challenges to be overcome (Leong & Chou, 1994).
Social identity is based on the simple motivational assumption that individuals prefer a
positive to a negative self-image. Tajfel & Turner (1986) state this theory is concerned
with individual’s identification with social groups and the affective processes associated
with membership. In a study by Clark and Clark (1947) African American children were
shown two dolls and asked questions about them. These children often preferred to play
with white dolls than black, and to identify these dolls as being pretty and good, where
they identified black dolls as black or ugly. Clearly African American identity is a
complex issue, especially because societal conceptions of blacks have tended to be
negative.

21
Ego Identity Theory
Perron, Vondracek, Skorikov, and et. al. (1998) joined the argument that ethnic
identity is related to ego-identity development, psychological adjustment, ego
development, and self-esteem. The formation of ethnic identity is often compared to ego
identity in that it takes place as people make decisions about the role ethnicity plays in
their lives (Phinney, 1990). Erik Erikson (1968) describes ego identity as a subjective
feeling of sameness and continuity that provides individuals with a stable sense of self
and serves as a guide to choices in key areas of their lives. Erikson goes on to say that
ego identity is focused on the development of personal identity, and the central crisis of
development comes in adolescence when individuals have to resolve the conflict between
developing an identity and identity confusion. After Erikson, a study by James Marcia
(1980) put forward the concept that identity formation takes place through two processes,
namely exploration and commitment. These processes are used to define four identity
statuses: identity diffusion, foreclosure, moratorium, and identity achievement. The four
statuses are based on the presence or absence of identity search or commitment (Phinney
& Chavira, 1992). Marcia’s theory is relevant though it does not specifically speak to
ethnic identity (Phinney & Ong, 2007). Drawing on Marcia’s theory, Phinney and
Chavira (1992) contend that ethnic identity development occurs in a progression from
diffusion/foreclosure, through exploration to ethnic identity achievement.
One of the dynamics that helps to form a person’s identity is their specific
ethnicity. Ethnic identity is only meaningful in situations in which two or more ethnic
22
groups are in contact over a period of time. Fouad, Kantamneni, Smothers, et al. (2008)
found when studying Asian American students ethnic identity that their view of the host
or dominant culture may strongly affect career choice processes and outcomes, but more
research is needed to understand these factors. For this reason the concept of ethnic
identity is very important to schools since it is rare that American schools are entirely
homogeneous. The idea of ethnic identity is important in student education because it
contributes to a student’s belief in themselves and the career choices they make. Research
found that adolescents with high ethnic identity had higher self-esteem than those with a
low ethnic identity (Chavira & Phinney,1991; Phinney, 1996). Low ethnic identity comes
about when students are unable to associate themselves as a member of a particular group
with similar characteristics. When students feel that their particular identity is not being
incorporated into school they may become detached in that environment. Detachment
among even a slight number of students in one ethnic minority may result in increased
detachment of students of that same ethnicity.
Phinney (1990) notes that if the dominant group in a society holds the traits or
characteristics of a minority ethnic group in low regard, then the ethnic group members
are potentially faced with a negative social identity. In the United States, African
Americans tend to be viewed stereotypically. As indicated earlier in this study, African
American children tend to be discouraged from enrollment in high academic classes and
pushed into low status classes. This sort of action by schools could lead African
American children believing that as a group they are incapable of pursuing careers that
require high academics. If African American students surround themselves with ethnic
23
peers who do not believe they are capable of academic accomplishment, that belief can
contributes to lower individual self-efficacy.
One undertaking in school in which ethnic identity may play a part is the area of
vocational choice. Many students participate in vocational training in school but their
vocational maturity varies. Vocational maturity is defined by the extent to which an
individual succeeds in mastering the tasks appropriate to his/her stage of career
development (Super & Thompson, 1979). It is measured using the variable of self-
knowledge, occupational information, involvement in decision making, and
independence in decision making. Thus far little is known about the combined
development of vocational maturity and ethnic identity during the adolescent years
(Perron et. al.,1998).However, Phinney (1990) and Supple et al. (2006) did assert ethnic
identity is comprised of different components, including self-labeling, a sense of
belonging, positive evaluation, preference for the group of ethnic interest and knowledge,
and involvement in activities associated with the group. Any of these components or
combinations may contribute to the development of vocational maturity.
A number of studies state that attitudes toward one’s group membership tended to
be derived from parents or from society rather than reached independently (Phinney,
1989; Phinney & Chavira, 1992).There have also been questions to whether in addition to
parents influence, ethnic identity is related to acculturation especially in a group that is
not dominant (Phinney, 1990). The results on the effects of ethnic identity have been
rather mixed. Clark, Kaufman, and Pierce (1976) found that within Mexican and Asian-
24
Americans it was a variety of factors including but not exclusive to ethnic identity that
contributed to acculturation. Conversely, Ting-Toomey (1981) found that among ethnic
identity appeared to affect the acculturation of Chinese-American students into America.
Regardless of how ethnic group membership is formed there are factors that have shown
themselves consistent within each ethnic minority. For example, Phinney (1989) says that
virtually all ethnic minority groups have been subjected to discrimination, and negative in
-group attitudes, leading to the desire to belong to the dominant group.
Although a number of emotional and social characteristics have been found to
have varying affects on ethnic identity in adolescence some of the contributing factors
seem to be demographic. Garcia and Lega, (1979) say this demographic difference does
not extend to neighborhoods, but they agree that adolescents within the same
neighborhood most often have the same ethnic identity. In relation to the importance of
ethnic identity, Hackett, Betz, Casas, and Rocha-Singh (1992) found that ethnicity was a
significant predictor of both occupational and academic self efficacy. Ethnic identity
among African American students as a factor in their career orientation clearly requires
further examination.
School factors
Teacher and curriculum influence are important because both can provide insight
into the problem of inequality in education. Crano and Mellon (1978) asserted that
teacher assessment and child achievement are related. There has been debate as to
whether teacher expectations can actually cause student achievement or if student

25
achievement causes what a teacher will expect from students. In the 1978 study done by
Crano and Mellon.(1978),they found that teacher expectations are causal factors of
achievement rather than vice versa. Good (1981) and Payne (1994) go on to say that
students need to feel that teacher expectations are positive in order to have successful
achievement results. If negative attitudes and stereotypes are demonstrated to the student,
then the student may become resistant personally and educationally. Furthermore, if
teachers strongly believe that students can learn they are less likely to engage in negative
instructional practices (Payne, 1994). Some of the characteristics teacher’s exhibit that
can be viewed as negative are, seating students further from the teacher, criticizing them
more often, providing them with less feedback, and overall paying less attention to them
(Good, 1981; Rist 1970).
When looking at the teaching of minority students, Cabello and Burstien (1995)
state that teaching is challenging for those who have no familiarity with the background
of students. Winfield (1986) notes that some research does indicate that a teacher’s
expectation of student performance may be a result of the student’s race or social class.
Regrettably there is a trend of minority students especially those of a lower socio
economic status becoming the victims of misperceptions about achievement levels, being
subject to negative attitudes, and getting less encouragement than other students
(Diamond, Randolph, & Spillane 2004; Good, 1981; Payne, 1994; Roscigno &
Ainsworth-Darnell, 1999). When lower encouragement levels are received from teachers’
often times the students exert less effort in school (Rist, 1970).
26
At other times teachers and administrators choose to handle behavioral or social
problems by placing minority children, especially African Americans, in non-college
bound tracks (Gamoran & Mare, 1989; Lewis & Cheng, 2006; Payne, 1994).
Unfortunately the most common trend is for students who have become low achievers in
school to be discounted and ignored. These students are most often discounted by being
placed in vocational rather than academic tracks.
Teachers of African American students need to reflect upon the beliefs and
attitudes that influence the decisions they make about these students, since their actions
could possibly contribute to the educational gap between minorities and their white
counterparts. Diamond et al. (2004) and Roscigno & Ainsworth-Darnell (1999) say that
African American students are often times rewarded less for their cultural capital than
their white counterparts because of low teacher expectations and race-based tracking.
This means that teachers need to ignore stereotypes and prior beliefs about minority
students if they ever want to effectively educate them. These beliefs and stereotypes have
been known to affect the level of expectation teachers hold. Although studies have shown
that teachers have a strong influence on educating minorities little is known about the
actual experiences they have encountered when educating minority students. When
teachers do not come into the classroom with preconceptions or stereotypes the way they
teach will reflect this. The attention they provide to students will be greater than when
they hold stereotypes. Also, students often respond better to the respect and rapport
teachers show them when preconceptions are not involved (Payne, 1994).
27
Brookover, Schweitzer, Schneider, and Beady (1978) concluded that school
climate makes a difference is school achievement. Variables that are most often used to
describe school social systems are the school’s academic norms, expectations, and
beliefs. The researchers hypothesized that students would likely have trouble thriving
within schools where the climate is not consistent with their identities (Brookover et al,
1978). Another aspect of the school that has been shown to affect adolescents is the
curriculum. Curriculum is a fundamental part of schooling (Page & Valli, 1990).
Perceptions of relationships between ability, socioeconomic status, and ethnicity continue
to play a part in curriculum assignment (Alexander, 2002; Kershaw, 1992). But, school
context should not play a role in the type of curriculum students are offered (Alexander,
2002). A history of racism and discrimination has led to distrust of school systems by
African American parents (Gamoran, 2001; Lareau & Horvat, 1999).
Another school factor that has presented itself in a few research studies is the
relationship between students and role models or mentors (Bell, 1970; Gibson, 2004;
Linnehan, Weer, & Uhl, 2005; Zeldin & Pajares, 2000). Gibson (2004) defines a role
model as the “construction based on the attributes of people in social roles an individual
perceives to be similar to him or herself to some extent and desires to increase those
similarities by emulating those attributes” (p.136). Role models and mentors are believed
to be important because they help strengthen individual growth. Zeldin & Pajares (2000)
found that when women were asked about significant factors in their lives, they
consistently recalled an influential person who helped them develop their beliefs about
their capabilities. When African American students’ relationship with mentors was
28
studied the findings suggested that in early stages of ethnic identity development they
prefer to be affiliated with the white community (Linnehan, Weer, & Uhl, 2005). Mentors
are also important when talking about types of classes African American students take.
Grantham and Ford (2003) note in relation to African American students in gifted
programs that mentors are important because they help empower students by causing
them to improve their decision-making skills and their ability to clarify goals for the
future in a way that provides a sense of direction and purpose. Linnehan (2001) found
that students who participated in a mentorship program for more than half the academic
year showed a significant, positive improvement in their grade point averages and
attendance rates. Research on mentoring suggests that a mentoring relationship can be
especially useful to minorities because when looking at higher education or employment
mentors can provide access to the informal power structure, which currently excludes
minorities (Hall & Allen, 1982).
Family relationships
Research has demonstrated that family background is critical to students’
achievement (Mehan, 1992; Roscigno & Ainsworth-Darnell, 1999). Reasons for the
family’s importance is that the family background is more likely to affect the school a
child attends, the curriculum track in which the child is placed, expectations the teacher
holds for that child, and resources that child will be provided (Gamoran & Berends, 1987;
Rist, 1970; Roscigno, 1998; Roscigno & Ainsworth-Darnell, 1999). Families can be
highly instrumental to the science and math related aspirations and commitment of their
29
children (Leslie et al., 1998). Parsons, Alder, and Kaczala (1982) argue an important
point in their research of parental influence when they assert that parents exhibit
behaviors which children imitate and later adopt as part of their own repertoire. They go
on to contend that as a result parents beliefs are causally related to children’s self-
concept.
Schulenberg, Vondracek, and Couter (1984) found that parents tend to reinforce
certain behaviors in males that they do not reinforce in females. Parents may convey
these expectations in messages relating to beliefs about their children’s abilities,
difficulty of task achievement, and importance of activities. Parents may think that a
subject such as math is hard for their children and that their children are not good at it. As
a result these children begin to possess a low concept of their ability equivalent with their
parents (Parsons et al., 1982). Lopez (1989) and Whiston (1996) go on to state that the
family is regarded as a dynamic network that at any given moment exerts functional
constraints on the behavior of individual members. Therefore, Parsons et al. (1982) stress
that it is imperative for parents to establish a positive relationship and provide
encouraging expectations for their children’s achievement in order for their children to
reflect actual positive behaviors.
When examining the relationship of family and careers, researchers found that the
quality of relationships in the family of origin is associated with career development in
college (Kenny, 1990; Kinner, Brigman, & Noble, 1990; Penik & Jepsen, 1992). Lopez
and Andrews (1987) also speculated that vocational development and career indecision
30
may be enhanced or affected by a dysfunctional family relationship. Eigen, Hartman, and
Hartman (1987) found that chronically undecided students were more likely to describe
their family situations as too tight or too loose, there was no pattern of a middle ground.
However, in school settings Palmer and Cochran (1988) demonstrated that when parents
were instructed to be supportive in the career development process, this proved to be
positive in enhancing vocational maturity of high-school aged adolescents.
Middleton & Loughead (1993) state that parents can have a significant influence
on student career direction as they move from adolescence to adulthood. The effect could
be positive or negative. Schulenberg et al. (1984) state that within research relating to
females and careers it is especially likely that if their mother was employed outside the
home, they will be also. It should also be noted that having a parent who has a science or
engineering occupation adds to the likelihood that one will major in science or
engineering (Leslie et al., 1998). Hargrove, Creagh and Burgess (2002) suggest that the
ability to make appropriate vocational decisions for young adults may be directly
influenced by the quality of family interactions, boundaries, and emotional
interdependencies perpetuated within the family. Blustein et al. (1991) found that as it
relates to vocational identity the most prominent family predictors for males were
different from predictors for females. Lopez (1989) found that for males conflictual
independence from their mother and the absence of marital conflict were important
factors whereas for females it was conflictual independence from the father that was
deemed important in deciding about careers.
31
Bratcher (1982) developed the Family Systems Theory which reinforces the
crucial role that family plays on students’ decisions. Whiston, (1996) describes the family
systems theory as the family operating as a unit where patterns of interacting evolve and
are maintained. She went on to find that there are family dimensions related to career
indecision and career decision-making self-efficacy. She also found that career decision-
making self-efficacy was related to the personal growth dimension of the Family
Environment Scale. This dimension is made up of the independence, achievement
orientation, intellectual-cultural orientation, active recreational orientation, and moral-
religious emphasis subscales.
There have long been arguments over the effect that parents and families have on
adolescents. Blustein et. al (1991) point out that adolescent-parent relationships are
especially important in late adolescent development. Regardless of the support given it is
well recognized that at least some degree of support is needed to provide a secure
foundation from which the adolescent chooses to engage in the task of committing to a
career choice (Kenny, 1990). Roe (1956) described family interaction patterns as the
primary determinants of occupational behavior. Fouad et al. (2008) confirmed in their
findings that parental expectations were salient influences on adolescents choosing a
particular career or attaining an advanced education. Research has been particularly
widespread when covering the influence that the family has on adolescents educational
and career goals. It is believed that there are certain family interactions that specifically
encourage career decision making, and others that promote career indecision (Lopez
&Andrews, 1987). Penick & Jensen (2002) looked at the type of family system in which
32
an adolescent lives as a predictor of how a student views vocations. Whiston (1996) says
that since family interactions have an influence on socialization, including school,
examining the family interaction of people and their career decision self-efficacy might
offer additional theoretical insight.
From a parent’s perspective there are several factors that may mitigate against
productive involvement in school such as; lack of time and minimal opportunities for
involvement (Hoover-Dempsy, Bassler, & Brissie, 1987; Lightfoot, 1981; Moles, 1982).
Hoover- Dempsy et al. (1987) stress the need to improve parent-teacher relationships to
enhance the education abilities of the children that are involved. Herman and Yeh (1983)
found that parental participation was positively related to the relationship between parent
and teacher. Regardless, studies have long shown that parental belief systems,
expectations, styles, and behavior patterns are related to academic success (Grolnick &
Ryan, 1989; Parsons, Adler, & Kaczala, 1982). Stevenson and Baker (1987) reported a
positive association between parental involvement in school activities and student’s
school performance. Thus it may be assumed that students with highly involved parents
have more academic motivation. For this reason, Herman and Yeh (1983) assert that
parental involvement has become a focal concern of American schools. Some of these
reasons could be because parental involvement may help schools formulate programs
more suited to their children or parents in general could just become more familiar with
the formal education setting.
33
Interest
Bandura (1986) suggested that perceived efficacy in people fostered the growth of
intrinsic interest which would remain consistent as long as those interests engaged their
personal feelings and offered satisfaction. Previous research has shown a pattern of
minorities being placed in lower academic tracks, based on the inadequate estimations of
career guidance personnel (Boyer, 1983). These are not conditions that foster intrinsic
interest, and they may help account for shortages of the minority population in fields such
as science and mathematics (Babco, 2001). Hansen (1999) describes interest as the inner
state of a student that relates to the characteristics of a learning situation. A lack of
interest in learning science and engineering may come about if one is not seeing science
or math as fields into which members of one’s community enter. In the Parsons (1997)
study of African American females she found that 11 of the 20 interviewees saw a
scientist as a white, unattractive, nerdy male. Their image described the male as having a
secondary social life with a perfect family. The image they described did not represent
what most African American students see on a daily basis. According to Super’s theory
(1953) individuals search for congruency between how they view themselves and the
image they have of persons of a particular occupation when making a career choice. Post,
Stewart, and Smith (1991) found that the academic interest level for African American
males and females is approximately equal. He also found that the inhibition of interest
within African Americans may be attributable to lack of encouragement and poor
academic preparation.
34
It should be noted that the interest students hold may be different across
demographic areas for a variety of reasons. Basu and Barton (2007) asserted one reason
students from low income communities are not interested in science is that there exists a
disconnection between school and home. They also noted that currently little research
offers solutions on how to sustain these students’ interest. However in their study there
appeared a strong relationship between sustained interest in science and science learning
environments in which students were able to cultivate relationships with people reflecting
their same values. In some cases the relationship was with a family member such as a
mother, in other cases the relationship was with a peer. Such a finding may indicate that
even if there is disparity between school and home a positive role model may be a link to
sustaining interest. Another finding by Basu and Barton(2007) was that sustained interest
in science was related to whether their identity, beliefs, experiences, and conceptions of
the future were built in the science they studied. For example if the science was
pertaining to biology and the student was interested in helping find a cure for a disease
that affects a family member, he or she may sustain that interest because it has a greater
meaning. Carlone and Johnson (2007) found that in their study the interest in science
and/or science-related fields had less to do with the subject of science than with the effect
that their scientific competence would have on the world. The participants in their study
were interested in humanitarian work such as health care-- things that would change the
world in a positive way.
Hansen (1999) theorized that there are three aspects that may have an impact on
the interest in science education: the topic or theme to be learned, learning context, and

35
type of learning activity. Topic or theme refers to a single subject such as chemistry or an
area as big as Newtonian Laws, but they are believed to embody characteristics, such as
simplicity or relative difficulty that can stimulate interest. Learning contexts refer to the
aspects that make science topics meaningful to the student’s everyday life. Learning
activities refer to the levels or types of learning, types of recognition involved, or
teaching methods. Results in the study done by Fouad & Smith (1996) suggest that there
is a relationship between math/science interest and (age and gender). A prime time to
influence the development of interest in minority youth and girls is during the middle
school years. Interests along with self-efficacy and outcome expectations predict
intentions which in turn lead to choice behaviors including those about careers (Lent et
al. 1994; Waller, 2006). Waller (2006) also found that non-traditional African American
students’ math self-efficacy and outcome expectations, directly predicted their math
interest.
But, there are still few studies that look at interest as it relates to vocational
careers and African American students. Expressed vocational interest was assessed by
Lease (2006) in 166 African American high school students. She noted that barriers
related to family or discrimination decreased interest in schooling, directly affecting the
attainment of goals. Lent, Hackett and Brown (1999) added to this by showing that even
if there is a strong interest in something, if another option is viewed as more attainable
that will be the one to which a student will strive. In addition to these findings Fouad &
Smith (1996) found that self-efficacy has a large influence on students’ interest. Math and

36
science self-efficacy are included in those factors that influence students’ interest as it
relates to engineering.
Self-efficacy
Self-Efficacy as defined by Bandura (1977) refers to the beliefs about one’s
ability to successfully perform a given task or behavior. Various studies have struggled to
ascertain which efficacy beliefs of Bandura’s theory contribute to career development
and to what extent. The four major components of self-efficacy are: performance
accomplishments, vicarious experiments, verbal persuasions, and physiological states.
Personal performance accomplishments, include one’s pattern of successes and failures at
particular tasks or activities; Vicarious learning, refers to the observation of other
peoples’ performance attainments; Social persuasion, involves the encouragement or
discouragement that one receives from significant others for engaging in particular
activities; and physiological states and reactions, include the pleasant or unpleasant
emotional and physical sensations (Bandura, 1986).
Lent, Brown, and Larkin (1986) state that expectations of personal efficacy are
hypothesized to influence one’s choice of behavioral settings and activities. Bores-Rangel
et al. (1990) go on to say that self-efficacy is likely to influence people's choice, effort,
persistence, and achievement, assuming they have sufficient abilities and incentives to
choose or perform the relevant activities. Lent, Brown, and Larkin (1984) assert that
student’s beliefs about their educational ability to complete the educational requirements
of various science and engineering fields are predictive of academic performance.
37
Hackett & Betz (1981) recommended that self-efficacy could assist in the understanding
of career development. Tang, Fouad, & Smith (1999) found that self-efficacy was a
considerable determinant in career choice. In relation to self-efficacy Ginakos (1999)
claims that when past behaviors lead to successful and desirable outcomes, a person
develops strong self-efficacy insights for the behaviors and persists in them.
Math-science self-efficacy
Math and Science are two important foundational subjects that have quite a bit of
overlap with the field of engineering (Lent, Larkin, & Brown, 1989; Meece, Parsons,
Kaczala, et al., 1982 ). Both subjects provide information that is included in the field of
engineering, therefore they are considered very vital if one wants to enter engineering.
Gainor and Lent (1998) assert that math course enrollment patterns help determine one’s
range of career options. Zeldin, Britner, and Pajares (2007) observe that individuals from
ethnic and racial minorities continue to be underrepresented in science and math related
fields, and self-efficacy researchers should focus on this issue. Schunk (1984) found that
the rich avenue of inquiry into educational attainment and career development has been
opened by the self-efficacy perspective on achievement behavior. As the self-efficacy
perspective was originated by Bandura and has since provided understanding to certain
career developmental aspects.
What influences mathematics self-efficacy? A study done by Betz & Hackett
(1983) indicated that mathematics self-efficacy is significantly correlated with attitudes
toward mathematics and the extent in which it was chosen as a major. A key aspect that
38
influences students to go into a field is motivation. Schunk (1991) says that motivation is
enhanced when a student senses progress in a subject, thus he or she attempts to become
more skillful, enhancing self-efficacy for performing well. Bandura (1989) postulated
that the best predictor of behavior in a specific situation is the self-perception individuals
hold. Therefore when evaluating subjects such as math and science, it is important to
remember that even though the two are intrinsically related an individual may hold a self-
concept for one that may not be consistent with the self-concept they hold for the other
(Schunk, 1991). The variance in self-concepts may also contribute to the
underrepresentation in careers related to either subject.
When exploring the subjects of math and science the effect of gender has to be
considered. Research has hypothesized that women and men differ not only in subjects
they take in school, but also in performance in the subjects. Ernest (1976), Fennema
(1974) and Meece et al.(1982) found that not only do female students take significantly
fewer mathematics courses than male students; they also choose classes that are less
rigorous. Betz & Hackett (1983) found that math self-efficacy expectations of college
females were lower and weaker than those of college males. Zeldin et al.(2007)
considered the notion that derogatory statements about one’s competence in a particular
area have detrimental effect on those who already lack confidence in their capabilities.
Other causes for these gender differences in subjects also include identity formation,
math anxiety, ability, and lack of role models (Erikson, 1968; Ernest, 1976; Betz &
Hackett, 1983; Zeldin et al., 2007). Lau & Roeser (2002) found that among high school
students, science self-efficacy predicted science related career interest. If this finding
39
holds true across ethnicities, it could be validly argued that the next step in career
development for science is to begin fostering science self-efficacy. The importance of
this finding comes at a time when our nation is dependent on science and technological
fields more than ever.
Along with gender as a variable for math/science self-efficacy beliefs is ethnicity.
Carlone and Johnson (2007) used science identity to examine the experiences of women
of color. Their model of science identity is based on the assumption that one’s ethnic
identity affects one’s science identity. Carlone and Johnson (2007) found that some
participants’ chances for recognition were disrupted because they were qualified by their
race rather than their ability as science students. Their finding also suggest that because
some scientists have difficulties in recognizing darker-skinned or more ethnically
different students as capable science students it may deter minority students. Research
has stated that African American students are underrepresented in math career fields
(Gainor & Lent, 1998). However, more African Americans enroll in courses involving
different content in mathematics and science than do white students (Davenport, Davison,
Kuang, et al., 1998; Reyes & Stanic, 1985;Jones, 1984; & Powell, 1990). One reason
may be the lack of role models (Gibson, 2002) in those specific fields resulting in
minority children not being able to see themselves in such career roles. Another causal
factor that has surfaced in research is fear .In Shiber (1999) students reported fear of the
subjects prevented math and science participation and enrollment. A fear often results in
missed career opportunities where math and science are the dominant requirements. Betz
and Hackett (1983) concluded that a low math self-efficacy will result in more students

40
wandering away from career choices that include math. Research shows that African
American students receive poor preparation in these subjects and therefore experience
repeated failure to master basic mathematical and scientific concepts early in their school
careers (Hall and Post-Kramer, 1987). Low mathematics self-efficacy and avoidance of
math-related coursework may explain the underrepresentation of women and minority
students in science-based careers (Betz & Hackett, 1983; Gibson 2002). By gaining a
better understanding of influences on math and science self-efficacy, counseling
psychologists will be able to develop and provide effective interventions that promote the
subjects to adolescents (Fouad & Smith, 1996).
Math/science related goal intentions
Math/science related goal intentions refer to the strong probability that a student
has of entering the engineering field or some aspect of it. No existing studies were found
that examined engineering goal intentions. However a few studies were found using Math
and Science goal intentions so that and outcome expectations will be used synonymously.
Gainor and Lent (1998) found a significant correlation between self-efficacy, interests,
and outcome expectations to aspects of goal intentions. However their findings showed
interest mediated the relationship between intentions and the other variables. Navarro,
Flores, & Worthington (2007) found that math/science self-efficacy and math/science
outcome expectations were positive predictors of math goal intentions. Furthermore, they
found that among Mexican American students perceived social support from parent and
teachers did not significantly predict math/science goal intentions.

41
The Social Cognitive Career Theory (SCCT) was the first to propose a
relationship between outcome expectations and other behavior factors such as self-
efficacy and interest. A number of studies have made a correlational connection between
outcome expectations and self-efficacy (Fouad & Smith, 1996; Gainor & Lent, 1998).
Hackett et al. (1992) found that outcome expectations were more positive when self-
efficacy was high. Thus, it can be concluded that the more a person feels that he/she is
capable of performing a task, the more likely they will be successful at it. There have
been few studies that have looked at this correlation with a predominantly minority
population. Gushue (2006) studied the relationship between outcome expectations,
identity, and self-efficacy within minority students. His findings were consistent with
prior studies in that a direct effect between identity and outcome expectations was not
established. But the study did show that identity associated with a particular ethnic group
did influence their beliefs to engage in career exploration.
Since there is a dearth of studies on goal intentions specifically related to the field
of engineering and African American students this study will attempt to find specific
answers to questions relating to this population and content area.
Career decision self-efficacy
Career decision self-efficacy (previously named career decision-making self-
efficacy) refers to the extent in which a student has confidence in his/her ability to engage
in occupational and educational decision making (Peterson & DelMas, 2001). Originally
defined by Taylor and Betz (1983), career decision self-efficacy is measured using the
42
task domains of accurate self-appraisal, gathering occupational information, goal
selection, planning, and problem-solving (Chaney, Hammond, Betz, & Multon, 2007).
Quality exploration of career development is the basis for career decision self-efficacy
(Gianakos, 1999). Research has taken the Social Cognitive Theory (SCCT) and outcome
expectations in order to better predict behavioral influences on careers. Ojeda et al.
(2006) found that career decision self-efficacy research reveals that high levels of
confidence are related to positive career behaviors and outcomes. Thus, there is no debate
that behavior strongly influences career decision self-efficacy. The interest comes when
one measures the transferability among ethnicities. Gloria and Hird (1999) state that
minority students experience lower career decision self-efficacy than their white
counterparts. When specifically looking at African American students little research
shows what causes this negative level of career decision self-efficacy. However, O’Brien
et al. (2000) and Bores-Rangel et al. (1990) note that for students of color, low career
self-efficacy has been associated with students being limited to vocational alternatives.
Existing studies suggest that firmly held career goals, characterized by choice
certainty, decidedness, and commitment, may promote the likelihood of choice entry
behavior (Germeijs & Verschueren, 2007; Lent et al, 1994). Germeijs and Verscheren
(2006) postulated that there were six core aspects of the career decision making process:
orientation of choice (awareness of the need to make a decision and motivation to engage
in the decision making process), self exploration (gathering information about oneself),
broad exploration of the environment (gathering general information about career
alternatives), in depth exploration of the environment (gathering detailed information
43
about a reduced set of career alternatives, and commitment (strength of confidence in the
attachment to a particular career alternative). They studied if all or some of the stages in
this process affected the decision of choice. Stages were shown to affect decision making
but they did not explore the confidence about the choice the students made. O’Brien et al.
(2000) found that students who lack career decision self-efficacy may avoid exploratory
activities, give up easily, and fail to reach their occupational potential. From this
Germeijs and Verscheren (2007) show that in depth exploration during the decision
making process is strongly correlated with the commitment of career choice.
In Brown, Darden, Shelton, et al. (1999) the findings suggest that rather than
ethnicity strictly determining career decision self-efficacy their participants seemed to
show different levels of career decision self-efficacy based on their minority group status.
By this the authors mean that students who were shown to be in the numeric minority
group (i.e. having fewer African Americans in class than Whites) exhibited lower levels
of career decision self-efficacy. From this research and preexisting studies Brown et al.
(1999) and O’Brien et al. (1999) suggested that interventions for numeric minorities and
students in at-risk environments may result in increasing levels of career decision self-
efficacy. When research was done in relation to vocational decisions interesting findings
arose. In a study examining vocational indecision Taylor & Pompa (1990) found that
career decision self-efficacy predicted vocational indecision in college students.
Alternatively Blustein (1989) found that career decision self-efficacy plays a prominent
role in career exploration.
44
School-To-Work Transition
School-to-work (STW) refers to the period of time between completion of general
education and the beginning of vocational education or of gainful employment
(Barabasch & Lakes, 2005; Ng & Feldman, 2007; Phillips, Bustein, Jobin-Davis, et al,
2001). One reason the school-to-work transition is important especially in youth is that it
helps develop youth who are at different stages. The school-to-work programs are
focused on skill development and formation. Researchers have struggled first to define
skill then to focus on teaching skill. When looking at different ways skills are taught we
find specific models that are often referred to, especially in the realm of vocational
education. Ashton, Sung, and Turbin (2000) state that there are currently three
educational models; the schooling model which incorporates most forms of the formal
educational system, currently in the US, Canada and Japan; the dual model which is
distinguished by a highly developed apprenticeship area associated with West Germany,
Switzerland, and Austria; and the mixed model where greater importance is assigned to
the non-formal sector, associated with the UK.
History shows that despite progress there is still an inequality between members
of society according to social status. Owens (1992) noted that individuals from the upper
social classes were more likely to attend college, whereas members of the lower social
classes were more likely to transition directly to work. Findings suggest that students
were being tracked into certain programs according to their position in society based on
their parents’ socioeconomic status. “It is argued that tracking actively reproduces
45
inequality across generations, with lower-class children being placed in tracks that inhibit
their already slim chances of going to college and entering socially desirable
occupations” (Arum and Shavit, 1995). Most often students who do not perform well in
liberal education are steered along a vocational track. What Dewey suggested was if you
provide individuals with social settings that are conducive to their particular style of
learning, there will be no inequality among people. He stressed that workers regardless of
race or religion need to be educated in a broader setting, more liberal subjects, so that
they will perform better at whatever it is they do.
Fortunately the current status of school-to-work contains ideas held by both
Dewey and Snedden. So the current status of school-to-work transition has not come far
from its origins. The major sub-population that participates in the school-to-work
programs in the United State are those students of the lower socioeconomic status. These
are students that teachers don’t ever foresee going to college and therefore do not
encourage higher education. The United States has offered some “mediators” to improve
the school to work transition. Within the high schools the curriculum offers a tech prep
program. Within this program students are still taking some regular high school classes
but their electives are focused on a specific vocation or training. Again these classes are
mainly populated with minority students of low socioeconomic status. But, the core of
this program is to try and get students out of school with at least some technical skills so
that they will become productive citizens. Bragg and Layton (1995) believe that tech prep
and the related idea of academic and vocational integration may help overcome the racial
and class separation currently existing in the American school system.
46
The U.S. attempted to address the concerns relating to school-to-work transition
through the School-to-Work Opportunities Act of 1994. This legislation established a
national framework for the development of school-to-work systems in all 50 states. The
legislation provides funding for these particular programs to assist in the transition and
offering of vocational skills. It also enhances the relationship between high schools,
community, educational institutions, and families (Worthington & Juntunen, 1997).
Another one of the ideas that the U.S. has tried is the creation of Technical or Community
Colleges. Unlike the traditional four year college these colleges focus heavily on specific
career preparation, though focus is not so specified that it excludes general education
programs. Students are required to take English and Math courses , though not as
intensely as in four year college. A third idea is the middle college notion. This idea
involves allowing high school students who have possibly dropped out of the traditional
high school or been kicked out of school to still have a chance at education. Not all
students fit the mold of the "traditional high school student". Although these students
may be just as capable of succeeding, they have become disinterested in education. The
students are typically based on a college campus. Some of them take classes taught by
college professors. The middle college program tries to promote the idea that regardless
of past or present circumstances, college is still an option and is still accessible.
Regardless of the perceived benefits there are some current problems with the
school-to-work transition. First there is a high unemployment rate among youth that the
current school-to-work program misses. Second, with young students not going into four
year colleges there is an increasing chance of youth going into poor jobs increasing the
47
poverty level. “Under the conditions of the risk society certification and the skills
acquired through kinds of employment experience become increasingly important in
maintaining a position in the adult labor market” (Bynner and Parsons, 2002). Currently
there are 36.5 million people in poverty and over half of this number are those who do
not graduate high school or who do not go on after high school. The school-to-work
program does not always offer the best opportunity for students. For those who enter the
transition program some of the jobs they find are low-wage that do not allow them to
adequately provide for themselves or family. People are going into school-to-work
programs with instability in their lives. Some people enter the program out of pure
necessity and this is not always a good thing. A current trend is that females are starting
to have babies at earlier ages with no sustainable way to take care of them. Thus a cause
and effect relationship develops where early motherhood disrupts the educational
progress, which limits their future educational and employment opportunities due to lack
of preparedness (Fergusson & Woodward, 2000).
High school graduates who do not go on to college face more challenges when
looking for jobs and also trying to change jobs (Blustein, Chaves, Diemer, et al., 2002).
When comparing the effect of school-to-work between students of different
socioeconomic statuses there is also a variation. These variations range from differences
in their motivation to work, support received from their parents, and relationship between
their job and vocational interest. Swanson and Fouad (1999) state that school -to -work
could have positive or negative results depending on the quality of the program. One
suggestion for students who enter work directly from high school is to find a way to
48
obtain the knowledge of self and work then develop a strategy for fitting the two together.
This trial and error technique is usually a skill that is learned in post secondary education
but is valuable to all students.
In summary, although school-to-work has proven to be beneficial to some it still
provides a hindrance for others. By pushing this program the odds of increasing equality
in a field such as engineering decreases. School-to-work may be viewed as a cyclical way
to continue not to encourage students of African American descent and lower
socioeconomic status not to push themselves in rigorous courses. Thus students who are
at a stage where they believe engineering is possible may give up and take an alternative
route.
Career Development
Concerns have been addressed that traditional career theories tend to minimize the
role of culture and structural barriers in the career experiences of people from
racial/ethnic minority groups (Gainor & Lent, 1998; Hackett & Lent, 1992). Lent et al.
(1994) argue that career interest and intentions develop partially as a result of self-
efficacy and outcome expectations. Times have greatly changed in the area of students
making a decision about their future career. There was a time when students did not have
as much opportunity to change majors or to prolong their education once started. Now
education affords students many more career options, which is the reason some
researchers believe that career decision making should be put off until the post secondary
level.
49
Tang et al. (2007) found that for Asian American students acculturation, family
background, and self-efficacy were factors affecting occupational choice. The factors
that play a role in determining students’ career choices cannot be understood solely in
terms of their effect on academic choices (Dick and Rallis, 1991). Meece et al. (1982)
developed a model where a student’s career goal shapes his/her perception of both the
intrinsic and extrinsic value of academic tasks. From the model he concluded that the
value of a certain task reflected the academic choice, performance, and persistence of that
student in a particular subject. Mortimer, Zimmer-Gembeck, and Holmes (2002) state
that the choices students make about school and work take place within the context of
institutions, organizations, and structured labor markets. Unfortunately, many students
lack basic information about how much education is needed for the occupations they are
considering. When students do choose to enter vocational fields their influence stems
from parents, teachers, coaches, friends, or personal experience in employment.
What range of career exploration do adolescents even experience? A study by
Grotevant, Cooper, & Kramer, (1986) found that adolescents who explore a breadth of
career possibilities will choose careers that are similar to their personality. Fouad &
Bingham (1995) say that within this exploration of career development cultural
awareness and societal influence must be included. In addition to societal and cultural
arguments there have been discussions about the difference among genders as it relates to
career development. Osipow (1983) and Betz &Hackett (1981) note that there exists a
significant difference in career development patterns among men and women. More
specifically the career development of women warrants further study and most theories
50
are dominantly based upon men. There is evidence that students still pursue occupations
based on sex typing or traditional gender occupations (Betz & Hackett, 1981). Indirectly
these findings result from personal expectations and self-efficacy these students hold.
Similar to this idea is the effect parent’s relationships have on males and females career
development. The idea that the closeness of students to parents affects career formation
and commitment for the most part is to be noted (Lucas,1997; Schulthesis &
Blustein,1994) and needs to be further explored.
Summary
A richer theoretical lens is needed as it relates to African American students and
their relationship to engineering. It has been found that the attitudes of teachers and
parents often reflect cultural stereotypes regarding the alleged ability of children (Leslie
et al, 1998; Meece et al., 1982). Landis (1976) postulates that adequate preparation for
engineering study involves course selection patterns that begin in the eighth or ninth
grade. Backman (1972) found that the relationship between socioeconomic status and
patterns of mental abilities showed a very moderate level of statistical significance. When
looking at ability, Leslie et al.(1998), found that mathematical performance declines
earlier and steeper among girls despite initial high capability in these subjects. Another
notion is that African American students may not be entering math and science fields
because of lack of role models (Waller, 2006; Post et al., 1991; Powell, 1990). Matthews
(1984) considered environmental factors to be a determinant of black students entering
math courses. Studies have suggested that if students of color are made aware of social
injustices that may serve as an empowerment tool to reject stereotypes and achieve

51
academically (Diemer & Blustein, 2006; Fine et al., 2004). The study to be reported here
is informed by complex issues. The aim is to understand better why African American
high school students shy away from considering engineering-related careers.
52
Chapter III
Methods and Procedure
This chapter reports on the methods and procedures used to address the two
research questions that have guided this study of engineering as a career choice among
African American high school students. These questions were:
1) To what extent do exogenous factors (school, math/science interest, ethnic
identity, math/science confidence, family relations) and endogenous factors
(demographic and ability) influence career decision self-efficacy?
2) To what extent do exogenous factors (school, math/science interest, ethnic
identity, math/science confidence, family relations) and endogenous factors
(demographic and ability) influence math/science related goal intentions?
The chapter includes a description of the research design, population and sample,
instrumentation, the Institutional Review Board process, pilot testing the survey, data
collection, and data analysis.
Design of the Study
The design of this study was quantitative using correlational methods. A survey
instrument was developed that reflected the variables of the study. Using research
surveys in a quantitative design has a number of advantages (Boyer, Olson, Calatone, &
Jackson; 2002) especially within schools and large populations. Surveys are viewed as
reliable instruments that are easy to administer. They are also more familiar to high
school students in that most of the tests they are administered are in this form. Survey

53
research also allows the researcher to investigate relationships between multiple variables
(Lin, 2006).
Population and sample
District
The population for this study were students enrolled in two schools within
Richland County School District One in South Carolina. Richland County School District
One serves one of the largest African American student populations in the City of
Columbia. It is South Carolina’s sixth-largest school district, and they educate more than
24,000 students at 28 elementary schools, nine middle schools, and seven high schools.
None of the schools has an open enrollment system so the populations within the schools
are formed by neighborhoods and zones. The schools in Richland One stretch over more
than 480 square miles encircling urban, suburban and rural communities. The students
within the school district represent over 30 countries and languages. Due to modern
advancement in technology students have access to high-school and college courses
through a video-conferencing center located on the campus of each high school. The
researcher has a personal link to this population in that she attended a school within the
district, however she did not attend either participating schools.
School One- W.J. Keenan
A portion of the population for this study is students who attend W.J. Keenan
High School in Columbia, S.C. This is one of seven high schools in the metropolitan area
of Columbia. It meets many necessary requirements the researcher viewed to be

54
invaluable for this study. The first criterion was that Keenan has an almost completely
African American population (at 99%). This is based on the 2007-2008 9th grade
enrollment report. Second, Keenan is a good match because the researcher is concerned
with having a diverse level in socioeconomic status. The school reports having a little
over 50% of the students who receive free/reduced price lunches. The enrollment for the
year 2008 was 843 students. This number is based on grades 9-12.
Keenan has become known for its commitment to improving and furthering
education. The school reports that more than ninety-five percent of the freshmen arrive at
basic or below-basic achievement levels, as indicated on their eighth grade PACT test
results. After just one year of high school at Keenan, a number of the students pass their
High School Achievement Program (HSAP), which South Carolina requires every
student in the state pass before graduation. As first-time takers of the exam, students pass
with an almost eighty percent grade in English/Language Arts and sixty-five percent in
math. Following graduation approximately sixty-five percent of Keenan graduates further
their education through the colleges and universities of their choice, to include West
Point and Harvard University. This number is above the average graduation for the state
of South Carolina, which is about fifty-six percent (Education Week, 2008).
In addition to demonstrating district excellence, Keenan received good and
excellent ratings on the state’s report card and has met Annual Yearly Progress (AYP) for
the past two years, as defined by No Child Left Behind (NCLB). During the 2004-05
school-year, Keenan High School won the Palmettos Finest High School Award. The

55
S.C. Association of School Administrators (SCASA) and Carolina First Bank present the
award each year to two elementary schools, one middle school and one high school that
offer the best in innovative, effective educational programs. The Carolina First Palmetto's
Finest Award, is one of the most coveted and respected awards among educators in South
Carolina. The award selections are based on extensive evaluations by fellow educators.
The application process includes elements on student achievement, faculty training,
program goals and delivery systems, office practices, and community involvement. The
school has received the Palmetto Silver and Palmetto Gold Awards in subsequent years
for increased student achievement.
Although there are numerous reasons why Keenan has received many awards, a
primary one is their advancement of innovative projects. One of these is the Raider
Engineering and Academic Leadership (REAL) Project. This project stems from a
partnership between Keenan and the Engineering School at the University of South
Carolina (USC). The REAL project is designed for students who want to challenge
themselves through technology, math, and science. The curriculum consists of AP and
honors level courses, along with college courses in engineering. The project is designed
in such a way that at least one certified engineer teaches courses with the Project Lead the
Way certified teachers. The number of students from this school that participated in this
study was 222, 56.1% of the sample.
56
School Two- Columbia High
Columbia High School is the second school in the study. Similar to W.J. Keenan
this school has a high population of African American students. The 2007-2008 9th grade
enrollment report shows this population to be 94%. Columbia High school reports
indicate that 54% of students receive free/reduced price lunch. The enrollment in grades
9-12 for the year 2008 was 879 students. The researcher had access to grades 9-12.
Columbia High has been a multiple recipient of the Palmetto Gold Award for
academic achievement. Beginning in the 2008-09 year it school became a STEM
(Science, Technology, Engineering and Math) theme school. It implemented new
Academies to complement existing components of study. Each of the Academies is a
four-year program that provides students with extensive real-world experience. Students
begin coursework as 9th graders. Five credits must be earned for successful completion
including a 160-hour summer internship between the Junior and Senior years. The
specific Academies are: the Academy of Biomedical and Health Science, the Academy of
Information Technology, the Academy of Engineering, the Academy of Mathematics and
the Academy of Finance.
Columbia High exposes students to advancing technology. During the 2009-2010
school year the school will add an Aerospace Engineering program to their Engineering
academy. Currently programs such as Computer Aided Drafting (CAD), Project Lead the
Way (PLTW), general technology, and pre-nursing are offered. The courses within the
PLTW curriculum that are offered are: Principles of Engineering (POE); Introduction to

57
Engineering Design (IED); Digital Electronics (DE); and Engineering Design and
Development (EDD). Students participating in the Engineering Academy must complete
the prescribed curriculum with an overall GPA of 3.0 and pass a mandated test each year
to receive college credit and a special diploma. In addition, they must also complete a
community service class or approved project. The number of students from this school
that participated in this study was 174, 43.9% of the total sample.
Instrumentation
A six page survey containing 135 items within eight sections was developed for
this study. The items were drawn primarily from existing instruments used in prior
research studies (see Table 3.1). The school factors and family relations subscales were
modified by the author to be of relevance to the current study. Where necessary
permission from the original developers to use their scales was obtained (see Appendix
B-D). The Cronbach’s alpha for each of the original scales are outlined in Table 3.2.

58
Table 3.1 Components of Survey Instrument
Variable Instrument Author/s # of Items
# of Items (after
adaption)
Demographic Factors
Background 15 15
School Factors (SF) SF (named by researcher)
Ford & Harris (1996); Masters & Hyde (1984)
79 19
Ethnic Identity (EI) Racial Ethnic Identity
Oyserman, Harrison, Bybee (2007)
12 12
Math/Science Expectations(MSE)
Math/Science Goal Intentions
Fouad, Smith, Enochs (1997)
15 12
Math/Science Confidence(MSC)
Math/Science Self-Efficacy
Betz & Hackett (1983); Fouad, Smith (1996)
12 10
Math/Science Interest(MSI)
Math/Science Interest
Fouad, Smith (1996)
20 20
Career Decision-making Self-efficacy(CDSE)
Career Decision Self-Efficacy
Betz short form 25 25
Family Relations (FR)
Family Relations
Ford (1991) 22 22
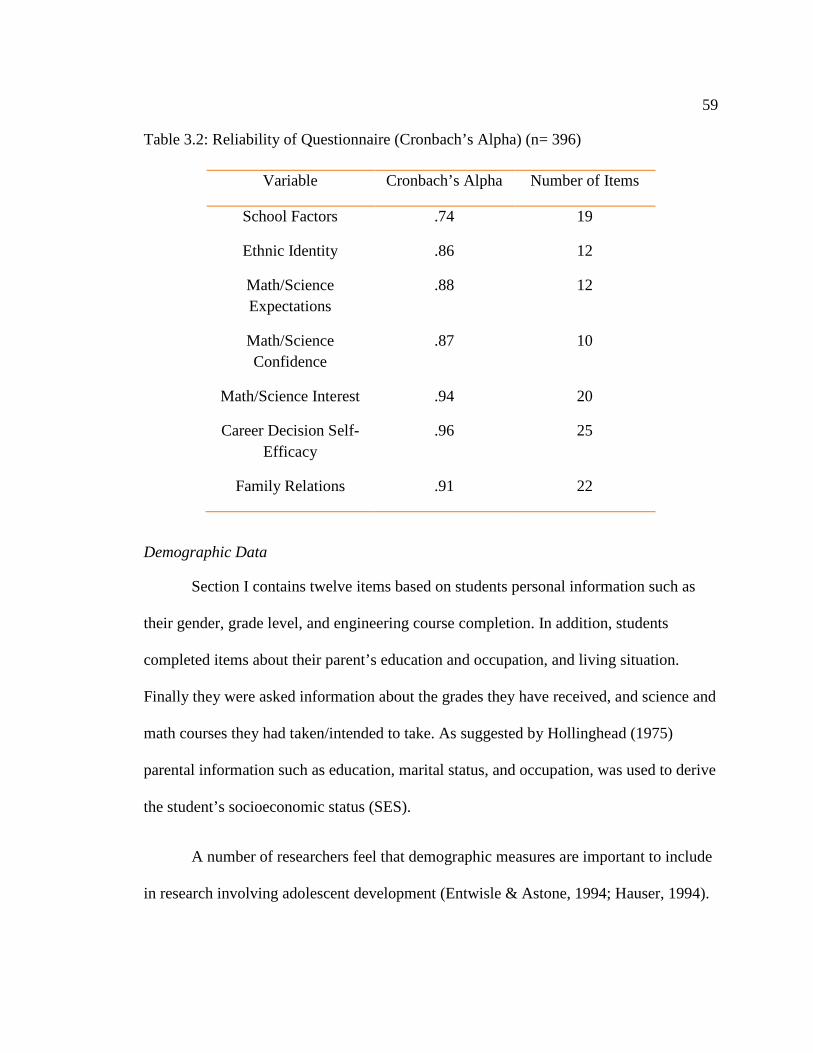
59
Table 3.2: Reliability of Questionnaire (Cronbach’s Alpha) (n= 396)
Demographic Data
Section I contains twelve items based on students personal information such as
their gender, grade level, and engineering course completion. In addition, students
completed items about their parent’s education and occupation, and living situation.
Finally they were asked information about the grades they have received, and science and
math courses they had taken/intended to take. As suggested by Hollinghead (1975)
parental information such as education, marital status, and occupation, was used to derive
the student’s socioeconomic status (SES).
A number of researchers feel that demographic measures are important to include
in research involving adolescent development (Entwisle & Astone, 1994; Hauser, 1994).
Variable Cronbach’s Alpha Number of Items
School Factors .74 19
Ethnic Identity .86 12
Math/Science Expectations
.88 12
Math/Science Confidence
.87 10
Math/Science Interest .94 20
Career Decision Self-Efficacy
.96 25
Family Relations .91 22
60
Social constructs such as race, ethnicity, gender, and socioeconomic status (SES) are
important when looking at social processes within families and schools, since they may
influence students overall persona. Entwisle & Astone (1994) and Hauser (1994) state
that there are three factors that are optimal in determining socioeconomic status in youth,
namely, parental education, parental income, and the extent to which children are
connected to the larger world by people with whom they share a household. To this
Hauser, 1994 added parental occupation. Hollingshead (1975) suggests that people who
possess different levels of education tend to exhibit different behavior patterns. Sirin
(2005) adds that parental education is an indicator of parent’s income because in the U.S.
they are highly correlated. Parents are the basis for the financial capital the children
receive; most children are not independent therefore where their finances come from will
help explain their SES (Entwisle & Astone, 1994). For this study, a four-factor index
suggested by Hollingshead (1975) was used to measure SES.
The survey was distributed to a total of 500 students among the two schools. Of
those 396 (79%) were used is the analysis and 104 (21%) of the surveys were omitted
from the analysis because they were incomplete (missing over 50% of data) or student’s
were shown to have an ethnicity other than African American. These students were
identified by the lack of completion of section two (ethnic identity), which non-African
American students were explicitly told to skip. The participants consisted of 46% males
and 54% females. Twenty-five percent of the students were in 9th grade, while 19% of the
students were in the tenth grade. Within the higher grades 18% of the students were in the
eleventh grade, while 38% reported being in the 12th grade. (Table 3.3)
61
Since the study wanted to focus specifically on factors that influence entrance into
engineering careers the researcher thought it was appropriate to evaluate the number of
students that enter engineering programs at the high school level. The question focused
on students who had completed a minimum of one engineering course. The engineering
program was also the basis for the particular schools being chosen. Although both
schools had engineering focused programs in the school only about 21% of the students
between the two schools took advantage of this program (Table 3.3).

62
Table 3.3: Descriptive Statistics (Gender, Year in high school, and Completion of an engineering course).
Characteristic N %
Gender
Male 182 46
Female 214 54
Total 396 100
Year in High School
9th 100 25.4
10th 76 19.3
11th 69 17.6
12th 148 37.7
Total 393 100
Completed Engineering Course
No 297 79.2
Yes 78 20.8
375 100
School Factors
The second section of the instrument related to school factors and contained
nineteen questions. As stated previously school factors pertain to teacher expectation,
curriculum, and achievement. Questions in this section (Appendix K) are formed using

63
interview questions from two different instruments, the Attitude-to-School questionnaire
developed by the Research Branch of the Education Department of Western Australia
(Masters & Hyde, 1984), and a questionnaire developed by Donna Ford in 1981 as a part
of her doctoral dissertation, and that is the basis of a study by Ford & Harris (1996). As
stated previously questions in these instruments that were not specifically related to
school were not used. Ford & Harris (1996) included an instrument consisting of seven
subscales that totaled 54 Likert-type items related to students’ perceptions of school,
achievement, and other educational variables. Internal consistency for the seven subscales
ranged from .42 to .80.
Ethnic Identity
The third section measured the student’s sense of ethnic identity. This section
contains previously validated subscales within the Racial Ethnic Identity (REI) scale that
pertain to students’ social identities (Oyserman, Harrison, & Bybee, 2001). For
consistency in this study the researcher changed “Black” to “African American”.
Oyserman expresses REI as connectedness, awareness of racism, and embedded
achievement using a twelve item scale. The three subscales each contain 4 items that are
designed to measure the correlation between social identity and group behavior
(Oyserman, Brickman, & Rhodes, 2007). Oyserman uses this scale under the assumption
that ethnic group behavior influences individual student behavior. Oyserman, Gant and
Ager (1995) sample items include “I feel a part of the African American Community”
(connectedness), “Because I am African American, others may have negative

64
expectations of me” (awareness to racism), “I have a lot of pride in what members of my
community have done and achieved” (embedded achievement).
The Cronbach alpha for each sub-scale is as follows: connectedness = .74;
awareness of racism = .62; and embedded achievement = .65 (Oyserman et al., 2001).
Validity has already been found using Confirmatory Factor Analysis (CFA). Results
prove that the scale structure was in fact similar across different ethnic groups
(Oyserman, Brickman, & Rhodes, 2007).
Math/Science
The Math/Science Self-Efficacy scale (MSSES) was developed to study ethnic
minority group attitudes to math and science careers. It drew upon the math self-efficacy
scale developed by Betz and Hackett (1983), and its reliability and validity were shown
by Fouad and Smith (1996), and Fouad, Smith, & Echnos, (1997). The scale contains 12-
items on a 5-point Likert type scale; 1=very low ability, 2=low ability, 3=uncertain,
4=high ability, 5=very high ability. An example question is, “I am confident in my ability
to earn an A in Math”. In two studies with predominately Hispanic middle school
samples, researchers obtained a Cronbach alpha of .84 for scores on the MSSES (Fouad
& Smith, 1996; Fouad et al., 1997; Navarro et. al, 2007). Fouad and her colleagues also
provided criterion-related validity evidence by demonstrating the scale’s ability to detect
changes in students’ mathematics/science self-efficacy due to intervention.
The Math/Science Outcome Expectations (MSOE) and Math/Science Intentions
(MSIGS) scale were developed by Fouad and Bingham (1995). The MSOE and MSIG
65
scale scores were correlated with the Career Decision Making Outcome expectancies
subscale resulting in a discriminant validity coefficient of .71 and .66 respectively (Fouad
et al. 1995). Fouad and Smith found Cronbach alphas of .80 and .81 for both the MSOE
and MSIG (Navarro et al., 2007). For both, Lent et al. (1991) found an internal
consistency of .90 for their 10 item scale with college sample and a 2 week retest
reliability of .91. Fouad and her colleagues provided concurrent validity evidence for the
MSOE by demonstrating the scale’s power in predicting math and science related interest
and intentions. The scale consists of 13 items on a 5-point Likert type scale; 1= strongly
disagree, 2=disagree, 3= uncertain, 4=agree, 5= strongly agree. Sample question, “If I
learn math well, then I will be able to do lots of different types of careers.” They also
provided evidence of construct validity for the MSIGS by finding a moderate relationship
between the MSIGS and intentions and goals for career decision making. The scale
consist of six items on a 5-point Likert type scale 1=strongly agree, 2=agree, 3=
uncertain, 4=disagree, 5= strongly disagree sample, “I intend to enter a career that uses
science”. For this particular study Math/Science Outcome Expectations and Intentions is
abbreviated as Math/Science Expectations (MSE).
The Math/Science Interest scale (MSIS) was developed by Fouad and middle
school teachers (Fouad, Smith, & Enchos, 1997). The reliability of this scale was .90.
Fouad and Smith (1996) supported the MSIS’s validity by demonstrating its predictive
power of math/science intentions. Navarro et al. (2007) found a Cronbach alpha of .91
using this scale. The MSIS consists of 20 items on a 3-point Likert type scale; 1=like, 2=
66
not sure, 3=dislike. A sample question would be to indicate the degree to which you like
or dislike a particular activity (i.e. solve math problems).
Career Decision Self-Efficacy
Section seven of the questionnaire is the career decision self efficacy (CDSE)
short form (Betz & Taylor, 2006). This section contains 25 items measured on a 5-point
Likert type scale, with questions ranging from 1= no confidence at all, 2=very little
confidence, 3= moderate confidence, 4=much confidence, 5=complete confidence. The
CDSE was developed by Taylor and Betz (1983) and the original 50 item scale was based
on a 10-point Likert scale. The purpose of the scale is to measure an individual’s belief
that he or she is capable of making successful career decisions. The scale is based on five
career maturity competencies developed by Crites (1978). In keeping with those
competencies the short form is based on five sub-scales, namely 1) accurate self
appraisal; 2) gathering occupational information; 3) goal selection; 4) making plans for
the future; and 5) problem solving (Betz & Taylor, 2006).
Brown et al., (1999) state that the CDSES was originally validated on 346
students in a private liberal arts college and 193 students in a large public college. Taylor
and Pompa (1990) reported an alpha coefficient of .97. Congruently, a prior study using a
sample of high school students indicated a Cronbach alpha of .97 (Carns et al. 1995;
Flores, Ojeda, et al., 2006). Additionally, Luzzo’s (1993) comprehensive review of the
CDSES’s psychometric properties provides evidence of its reliability and validity. Taylor
and Betz (1983) also reported a Cronbach alpha of .97. Reliabilities calculated for the
67
five subscales of goal setting, occupational information, problem-solving, planning, and
self-appraisal yielded respective values of .87, .89, .86, .89, and .88. Validity estimates
were provided by Taylor and Pompa (1990). Robbins (1985) found that validity
estimates for CDSE scores were moderately related to scores on measures of self-esteem,
career decidedness, and vocational identity.
Family Relationship
The final section, section eight, pertained to questions about the relationship
between the students and their family. These questions derived from two different
sources, namely the work of Donna Ford reported in Ford & Harris (1996), and items
developed by the author. Examples of questions from Ford & Harris (1996) were;
“People in my family have been treated mean or unfairly by other people” and “My
parent(s) think being in a gifted program is important”. Examples of the questions
developed by the author were: “My parent(s) encourage me to do well in mathematics”
and “My parent(s) take me to the public library to obtain math/science related materials”.
Items in the Family relationship scale were measured on a 5-point Likert type scale (1=
strongly disagree, 2= disagree, 3= uncertain, 4=agree, 5= strongly agree).
IRB
As a requirement for the University of Minnesota this study was reviewed and
approved by the Institutional Review Board. Thus a Social and Behavioral Science
application form was submitted for expedited review in August 2008. See Appendix A
for a copy of the form that was be submitted. Due to the nature of the study, involving
68
minors, a consent and assent form was used (See Appendix H and I). Letters informed
both the students and parents about the nature of the study and benefits of being involved
in it. No potential risks were anticipated, and student anonymity was preserved. In
addition to the survey instrument, the proposal for the study was submitted to the IRB.
Prior to the application for IRB consent, the researcher received a letter of approval to
conduct research in one the schools. Approval from the second school followed.
Pilot test
The instrument was pilot tested in Minneapolis, MN among African American
students of the same age groups as the intended South Carolina sample. In 2007 the
selected school reported having 86.1% students of color (44.6% AA) and 73.9% of the
students received free and/or reduced price lunch (Minneapolis Public Schools). A small
sample of 13 students was solicited containing both engineering and non-engineering
students. In the days prior to the distribution of the survey, parental consent letters were
sent home with students who wished to participate in the study. The letter explained the
survey and gave parents the ability to restrict their child’s participation.
Through this pilot test students helped identify questions that were confusing or
poorly worded. In addition, the pilot test allowed the researcher to gauge the length of
time students required to complete the survey. A classroom teacher was asked to pass out
consent forms and surveys during their homeroom period to those students with parental
consent. The teacher was asked to time how long the students took to complete the
survey. After completion of the surveys the teacher collected them, placed them in a
69
sealed envelope, and passed them on to the researcher. The teacher also asked
participants their opinion of the wording to check for understandability of the questions.
Those questions were also passed on to the researcher.
Data Collection
Data collection began in October 2008. Prior to data collection the final survey
instrument was sent to the principals as agreed for their review. The survey was also sent
with a recruitment letter in effort to solicit teacher’s participation. The letter to the
teachers’ explained the study and asked for their cooperation in the distribution of the
surveys. A copy of the letter is included in Appendix F. In order to obtain the proposed
number of surveys 8 teachers were asked to have their classes participate at each site in
addition to a lead teacher recruited. The teachers were able to pick the day of the week
they wished to hand out the surveys.
Survey packets were assembled, each containing 30 surveys, based on the average
class size. The lead teacher was given extra surveys should they be needed. The survey
packets included parental consent and child consent/assent forms, along with a script
explaining the survey. In the script explaining the survey, the teacher was instructed to
first explain the child consent/assent form to the participants. This was done by reading
the form aloud to the student, or letting the students read silently and then pose questions
for clarification. A separate package included gift cards for the participating students and
teachers.

70
Data Analysis
This study sought to examine the relationship between selected variables and
career decision self-efficacy and Math/science related goal intentions among African
American high school students. Two research questions were set forth as follows:
1) To what extent do exogenous factors (school, math/science interest, ethnic
identity, math/science confidence, family relations) and endogenous factors
(demographic and ability) influence career decision self-efficacy?
2) To what extent do exogenous factors (school, math/science interest, ethnic
identity, math/science confidence, family relations) and endogenous factors
(demographic and ability) influence math/science related goal intentions?
The researcher used SPSS 17.0 to analyze the data after the necessary coding was
performed. Although some of the students did not complete all of the questions on the
survey, missing values were replaced with mean values for dependent and independent
variables. The researcher understood that in some instances replacing missing data for
dependent variables does have the potential to produce questionable data. However the
researcher is assuming that data were missing at random (MR) (Rubin, 1976). Batista and
Monard (2003) showed that replacing data with the mean still obtained good results and
showed a low error rate. Descriptive data were generated for all variables, and further,
relationships between variables were explored. The researcher questions were explored
through stepwise multiple regression analysis.

71
Summary
This chapter began by reiterating the purpose of the study which is to evaluate
variables that may influence career decision self efficacy and Math/science related goal
intentions among African American High school students. A description of the two
schools from which the sample was drawn was provided. Scales that were used in the
researchers’ instrument were explained, and their psychometric properties discussed. The
IRB process was next outlined, which is required for all university research. A
description of the purpose and implementation of the pilot test then followed. Next, a
synopsis of the procedures that were followed throughout the distribution of the study
was explained. In the chapter that follows data analysis procedures are set forth and
findings are presented.

72
Chapter IV
Data Analysis
The purpose of this chapter is to present the findings of this study. Descriptive
results are set forth first, followed by analysis of the research questions. The latent
structures of scales used in the study are also examined.
Demographic Factors
Living situation
Table 4.1 presents data on demographic variables. It shows that a high percentage of
students live with their mother only (43%). Although 43% of students lived with their
mother only, when living situation was compared to scholastic achievement categories
(such as overall GPA, grade received in math, and grade received in science) the results
showed that these students had no higher percentage than any of the other students. As it
relates to cumulative G.P.A however, of students who were shown to live with both
parents, 49% of them had a 3.5 or better. This is significantly different from any other
living situation except those who lived with a father and female. Of these students 50%
of them were shown to have 3.5 overall G.P.A. or better. A detailed summary of the
student’s overall G.P.A based on their living situation is located in Table 4.2. The
student’s G.P.A. was compared based on living situation because some prior research
reports a difference academically in those students raised in nuclear homes rather than
single parent homes.

73
Table 4.1: Student’s Living Situation
With Whom do you live n %
Mother and Father 114 29.0
Mother and Male Guardian 35 8.9
Father and Female Guardian
8 2.0
Mother only 169 43.0
Father only 14 3.6
Mother and sometimes father
14 3.6
Other relatives 36 9.2
Other adults 3 .8
Total 396 100

74
Table 4.2: Student’s Living Situation by G.P.A
Current G.P.A.
Mother and Father
Mother only Father only Mother and some father
Mother and Male
Father and Female
Other relatives
Other adults
N % N % N % N % N % N % N % N %
>4.0 10 11.8 4 3.6 0 0 0 0 1 4 0 0 0 0 0 0
3.5- 4.0 32 37.6 25 22.3 1 20 1 12.5 1 4 3 50 3 12.5 0 0
3.0 -3.49 18 21.2 39 34.8 2 40 2 25 10 40 0 0 6 25 0 0
2.5- 2.9 15 17.6 21 18.8 1 20 0 0 8 32 2 33.3 5 20.8 0 0
2.0 - 2.49 9 10.6 15 13.4 1 20 5 62.5 3 12 0 0 7 29.2 0 0
1.5- 1.9 1 1.2 5 4.5 0 0 0 0 2 8 1 16.7 2 8.3 0 0
1.0 -1.49 0 0 3 2.7 0 0 0 0 0 0 0 0 1 4.2 1 100
Total 85 100 112 100 5 100 8 100 25 100 6 100 24 100 1 100
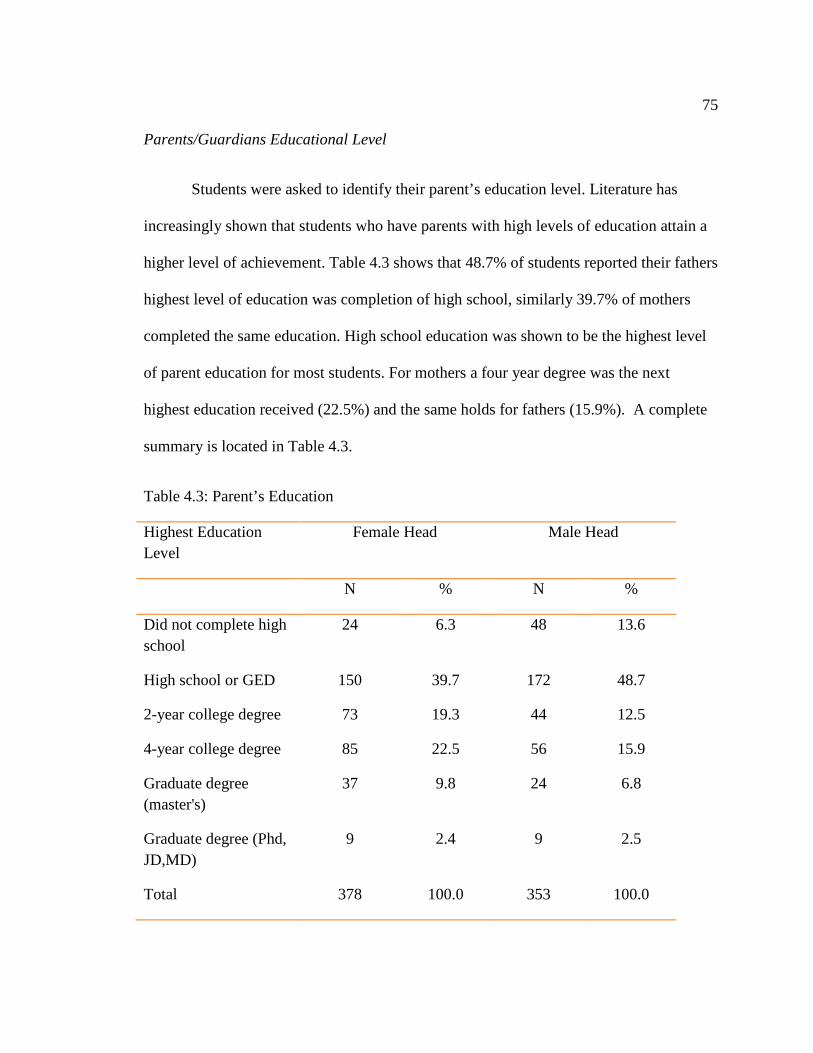
75
Parents/Guardians Educational Level
Students were asked to identify their parent’s education level. Literature has
increasingly shown that students who have parents with high levels of education attain a
higher level of achievement. Table 4.3 shows that 48.7% of students reported their fathers
highest level of education was completion of high school, similarly 39.7% of mothers
completed the same education. High school education was shown to be the highest level
of parent education for most students. For mothers a four year degree was the next
highest education received (22.5%) and the same holds for fathers (15.9%). A complete
summary is located in Table 4.3.
Table 4.3: Parent’s Education
Highest Education Level
Female Head Male Head
N % N %
Did not complete high school
24 6.3 48 13.6
High school or GED 150 39.7 172 48.7
2-year college degree 73 19.3 44 12.5
4-year college degree 85 22.5 56 15.9
Graduate degree (master's)
37 9.8 24 6.8
Graduate degree (Phd, JD,MD)
9 2.4 9 2.5
Total 378 100.0 353 100.0
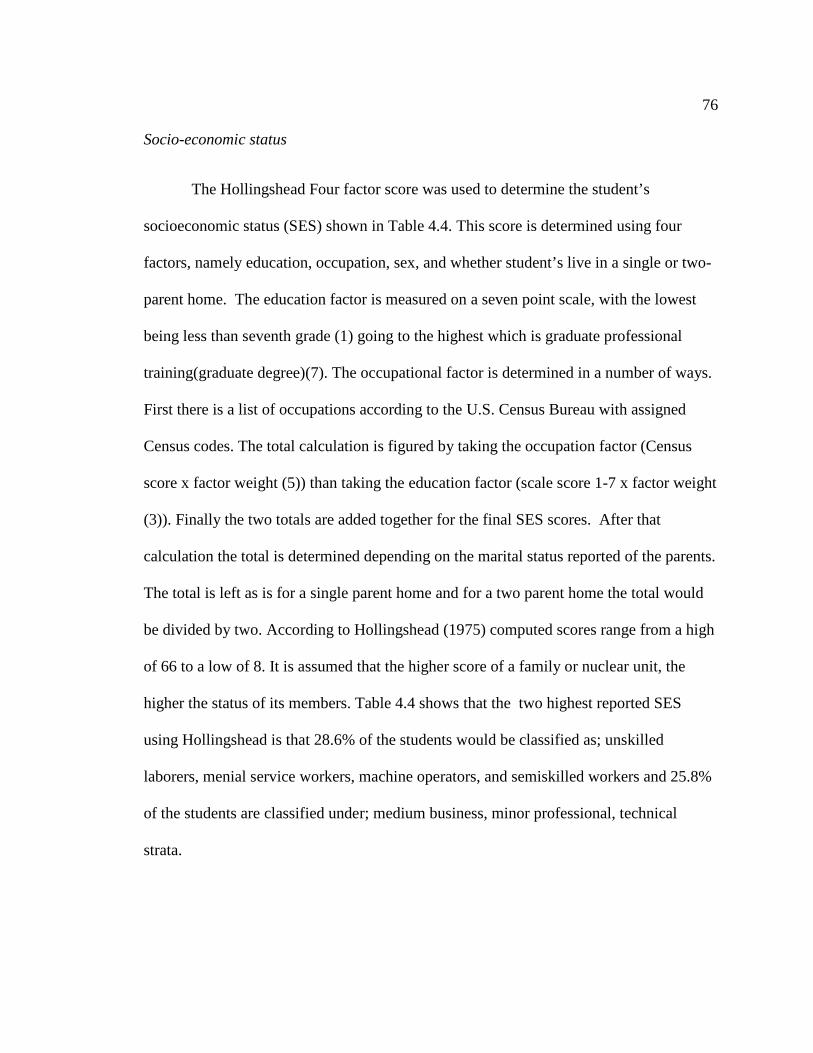
76
Socio-economic status
The Hollingshead Four factor score was used to determine the student’s
socioeconomic status (SES) shown in Table 4.4. This score is determined using four
factors, namely education, occupation, sex, and whether student’s live in a single or two-
parent home. The education factor is measured on a seven point scale, with the lowest
being less than seventh grade (1) going to the highest which is graduate professional
training(graduate degree)(7). The occupational factor is determined in a number of ways.
First there is a list of occupations according to the U.S. Census Bureau with assigned
Census codes. The total calculation is figured by taking the occupation factor (Census
score x factor weight (5)) than taking the education factor (scale score 1-7 x factor weight
(3)). Finally the two totals are added together for the final SES scores. After that
calculation the total is determined depending on the marital status reported of the parents.
The total is left as is for a single parent home and for a two parent home the total would
be divided by two. According to Hollingshead (1975) computed scores range from a high
of 66 to a low of 8. It is assumed that the higher score of a family or nuclear unit, the
higher the status of its members. Table 4.4 shows that the two highest reported SES
using Hollingshead is that 28.6% of the students would be classified as; unskilled
laborers, menial service workers, machine operators, and semiskilled workers and 25.8%
of the students are classified under; medium business, minor professional, technical
strata.

77
Table 4.4: Hollingshead Socioeconomic Scores
Score N %
55 – 66 31 9.4
40 – 54 85 25.8
30 – 39 70 21.3
20 – 29 49 14.9
0 – 19 94 28.6
Total 340 100
Eighth Grade Math/Science Scores
Table 4.5 shows that among 8th graders a majority of students reported receiving
the grade of “C” or higher in math or science. More importantly ~ 44% of them received
a “B” in math and almost 50% of students received a “B” in science. This is important
signifying that students were above average in these core courses.
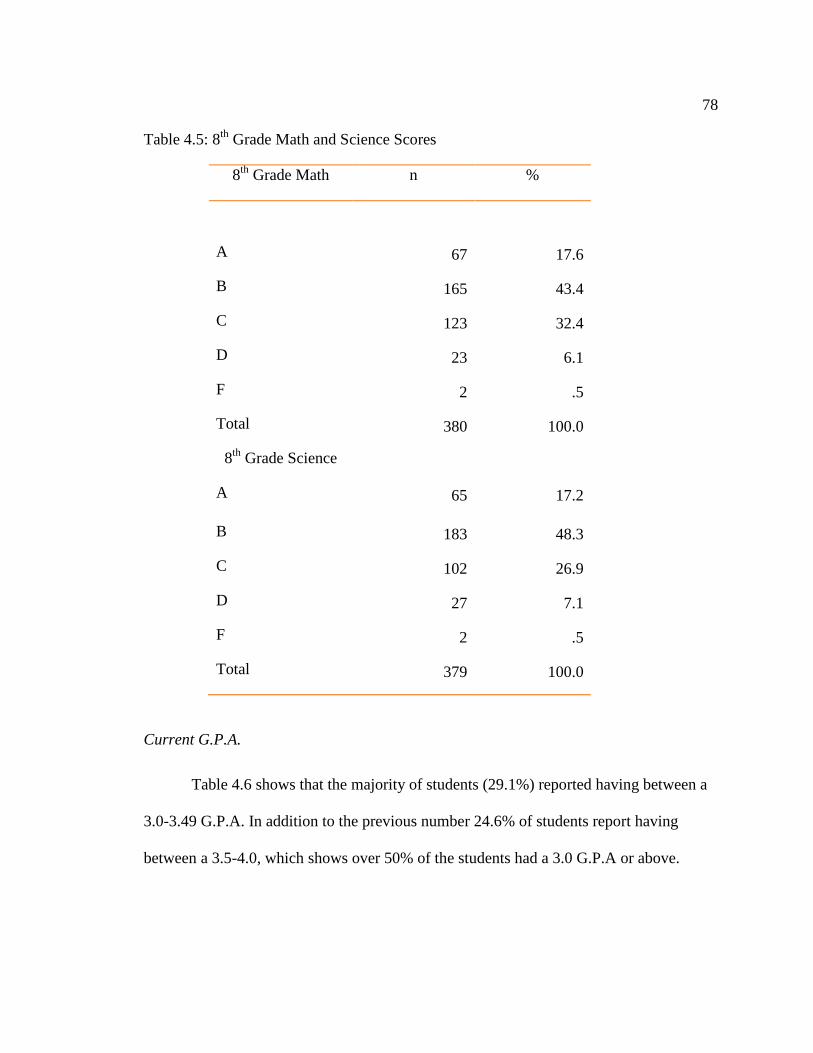
78
Table 4.5: 8th Grade Math and Science Scores
8th Grade Math n %
A 67 17.6
B 165 43.4
C 123 32.4
D 23 6.1
F 2 .5
Total 380 100.0
8th Grade Science
A 65 17.2
B 183 48.3
C 102 26.9
D 27 7.1
F 2 .5
Total 379 100.0
Current G.P.A.
Table 4.6 shows that the majority of students (29.1%) reported having between a
3.0-3.49 G.P.A. In addition to the previous number 24.6% of students report having
between a 3.5-4.0, which shows over 50% of the students had a 3.0 G.P.A or above.
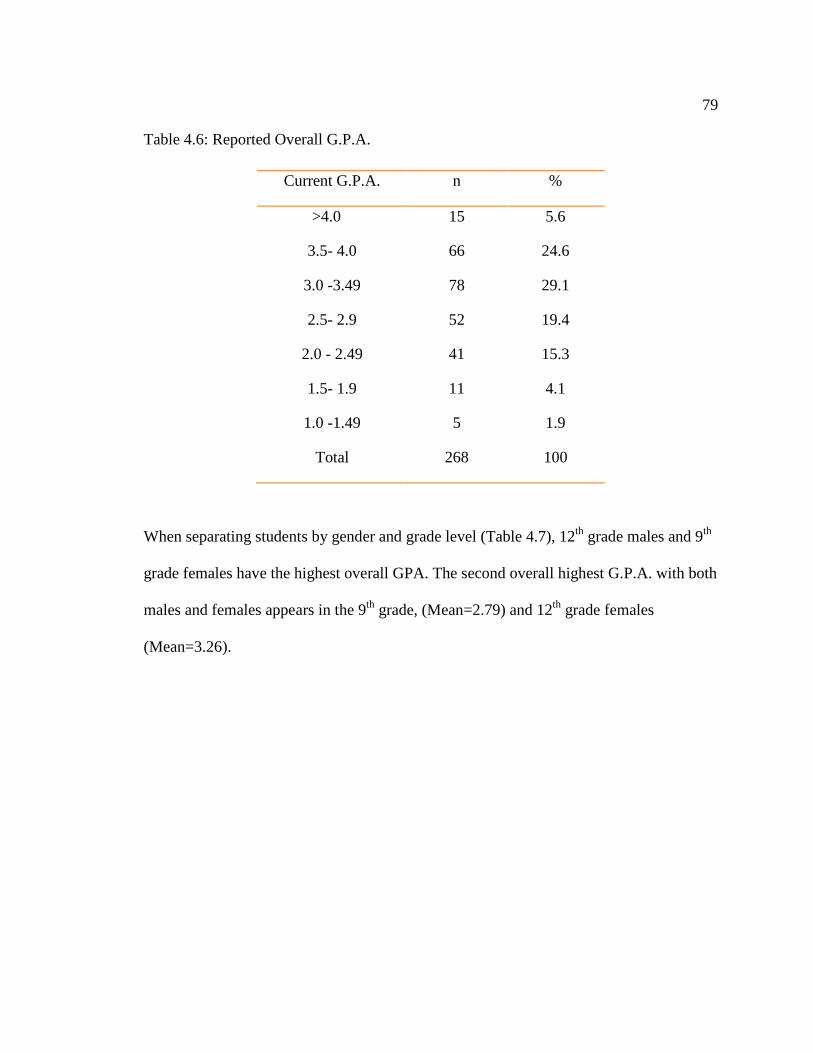
79
Table 4.6: Reported Overall G.P.A.
When separating students by gender and grade level (Table 4.7), 12th grade males and 9th
grade females have the highest overall GPA. The second overall highest G.P.A. with both
males and females appears in the 9th grade, (Mean=2.79) and 12th grade females
(Mean=3.26).
Current G.P.A. n %
>4.0 15 5.6
3.5- 4.0 66 24.6
3.0 -3.49 78 29.1
2.5- 2.9 52 19.4
2.0 - 2.49 41 15.3
1.5- 1.9 11 4.1
1.0 -1.49 5 1.9
Total 268 100

80
Table 4.7: Reported Overall G.P.A. by Gender
Figure 4.1 is a graphic representation of the range of current GPA’s for the
students within the study. As demonstrated earlier in the Table 4.6 this figure shows that
most of the students earn an overall G.P.A. between 3.0 and 4.0. The mean G.P.A. is
shown as being 3.0 for the 268 students who answered this question in the survey.
Figure 4.1: Reported G.P.A.
GRADE Male Female
Mean SD N Mean SD N
9 2.79 .93 16 3.38 .38 17
10 2.71 .66 19 2.96 .90 29
11 2.70 .71 20 3.08 .60 32
12 2.87 .64 66 3.26 .67 67
81
Mean Ranks
School Factors
Each independent variable was classified and ranked by the total mean score. The
mean ranking helps identify how students felt about the questions in each variable. Table
4.8 shows the results of School factors--what students viewed as most important to
contributing to their advancement in school. The factor that students agreed upon the
most was “School is important to me”. Second was, “I want to go to college when I
graduate”. The item receiving the least support was “If you are an African American,
going to school is a waste of time”. In general, the responses of students to school factors
were positive.
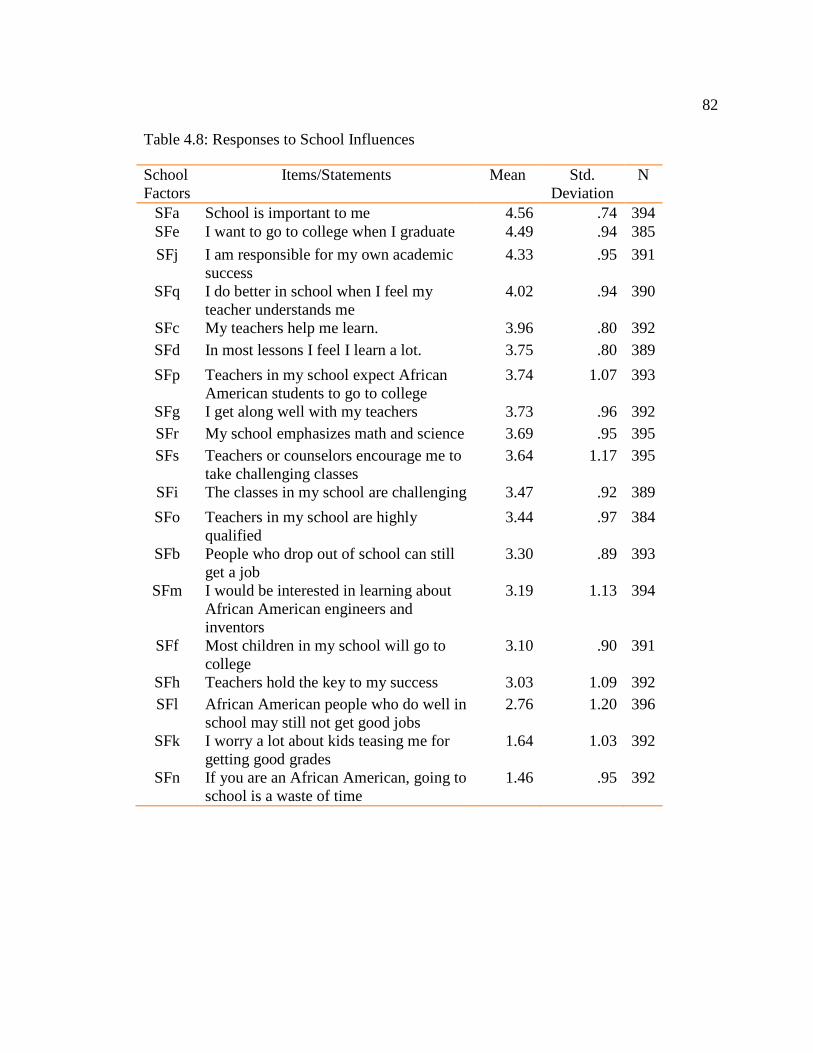
82
Table 4.8: Responses to School Influences
School Factors
Items/Statements Mean Std. Deviation
N
SFa School is important to me 4.56 .74 394 SFe I want to go to college when I graduate 4.49 .94 385 SFj I am responsible for my own academic
success 4.33 .95 391
SFq I do better in school when I feel my teacher understands me
4.02 .94 390
SFc My teachers help me learn. 3.96 .80 392 SFd In most lessons I feel I learn a lot. 3.75 .80 389 SFp Teachers in my school expect African
American students to go to college 3.74 1.07 393
SFg I get along well with my teachers 3.73 .96 392 SFr My school emphasizes math and science 3.69 .95 395 SFs Teachers or counselors encourage me to
take challenging classes 3.64 1.17 395
SFi The classes in my school are challenging 3.47 .92 389 SFo Teachers in my school are highly
qualified 3.44 .97 384
SFb People who drop out of school can still get a job
3.30 .89 393
SFm I would be interested in learning about African American engineers and inventors
3.19 1.13 394
SFf Most children in my school will go to college
3.10 .90 391
SFh Teachers hold the key to my success 3.03 1.09 392 SFl African American people who do well in
school may still not get good jobs 2.76 1.20 396
SFk I worry a lot about kids teasing me for getting good grades
1.64 1.03 392
SFn If you are an African American, going to school is a waste of time
1.46 .95 392
83
Ethnic Identity
Table 4.9 displays the ranking of the twelve items relating to ethnic identity. The
results show that students agreed most with the item “I have a lot of pride in what
members of the African American community have done and achieved”. There was a tie
in the next highest agreeable statement between, “I feel that I am part of the African
American community” and “It is important for my family and the African American
community that I succeed in school”. The least agreeable statement within this section
was “People might have negative ideas about my abilities because I am African
American”. Overall there was solidarity with ethnic identity items.

84
Table 4.9: Ethnic Identity
Ethnic Identity
Items/Statements Mean Std. Deviation
N
EIc I have a lot of pride in what members of the African American community have done and achieved
4.29 .92 394
EIb I feel that I am part of the African American community
4.23 .93 394
EIf It is important for my family and the African American community that I succeed in school
4.23 .92 391
EIa It is important to me to think of myself as African American
4.19 1.04 396
EIe If I am successful it will help the African American community
4.02 .98 390
EIh As an African American, the way I look and speak influences what others expect of me
3.89 1.03 391
EId I feel close to others in the African American community
3.83 1.01 389
EIj It helps me when others in the African American community are successful
3.78 1.03 394
EIl If I work hard and get good grades, other African Americans will respect me
3.66 1.06 395
EIi Things in the African American community are not as good as they could be because of lack of opportunity
3.56 1.01 395
EIg Some people will treat me differently because I am African American
3.45 1.13 386
EIk People might have negative ideas about my abilities because I am African American
3.43 1.13 386
Math/Science Expectations
Math/Science Expectations is one of the dependent variables. Table 4.10 displays
the ranking of the twelve items in order of importance. The results show that students
agreed most with the statement about their expectations in Math and Science, “If I get
good grades in math, then my parents will be pleased”. The next most agreeable
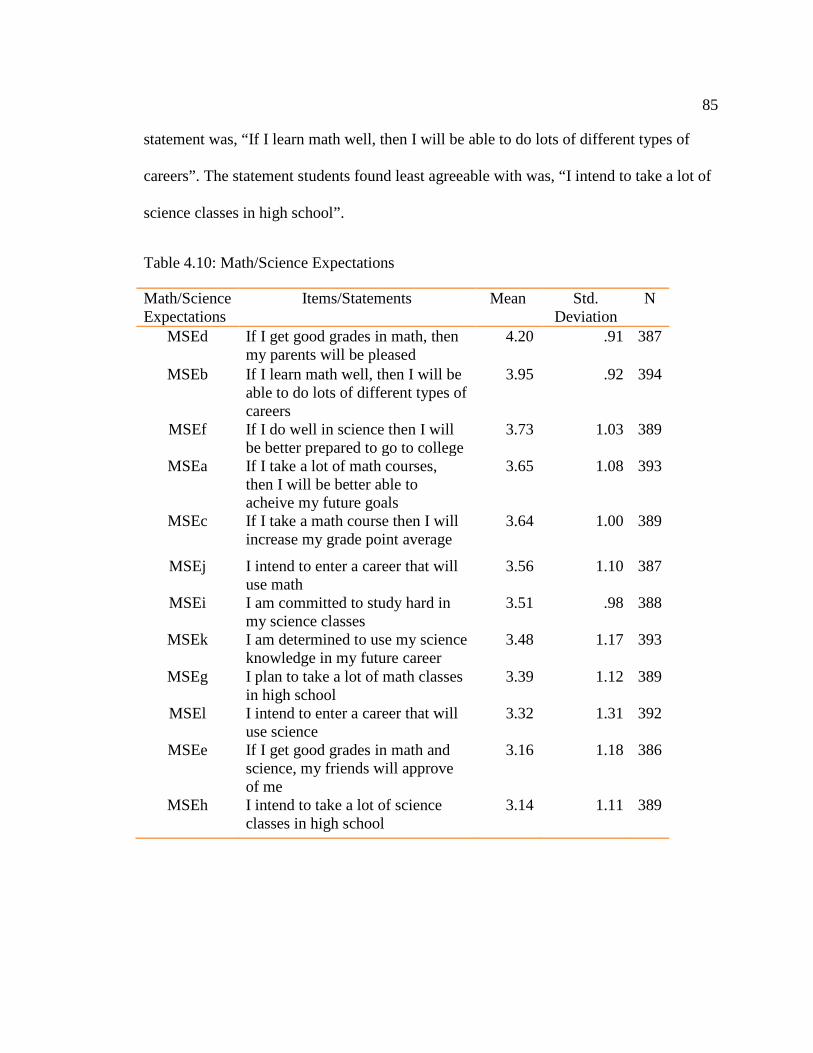
85
statement was, “If I learn math well, then I will be able to do lots of different types of
careers”. The statement students found least agreeable with was, “I intend to take a lot of
science classes in high school”.
Table 4.10: Math/Science Expectations
Math/Science Expectations
Items/Statements Mean Std. Deviation
N
MSEd If I get good grades in math, then my parents will be pleased
4.20 .91 387
MSEb If I learn math well, then I will be able to do lots of different types of careers
3.95 .92 394
MSEf If I do well in science then I will be better prepared to go to college
3.73 1.03 389
MSEa If I take a lot of math courses, then I will be better able to acheive my future goals
3.65 1.08 393
MSEc If I take a math course then I will increase my grade point average
3.64 1.00 389
MSEj I intend to enter a career that will use math
3.56 1.10 387
MSEi I am committed to study hard in my science classes
3.51 .98 388
MSEk I am determined to use my science knowledge in my future career
3.48 1.17 393
MSEg I plan to take a lot of math classes in high school
3.39 1.12 389
MSEl I intend to enter a career that will use science
3.32 1.31 392
MSEe If I get good grades in math and science, my friends will approve of me
3.16 1.18 386
MSEh I intend to take a lot of science classes in high school
3.14 1.11 389

86
Math/Science Confidence
Table 4.11 displays the ranking of the ten items in Section V of the survey by
order of importance. The results show that students agreed most with the statement “Get
an A in science in high school”. There was a tie between the second most agreeable
statements about their ability was, "Determine the amount of sales tax on clothes I want
to buy” and “Develop a hypothesis about why kids watch a particular TV show”. The
least agreeable statement about confidence was the ability to “Predict the weather from
weather maps”.
Table 4.11: Math/Science Confidence
Math/Science Confidence
Items/Statements Mean Std. Deviation
N
MSCb Get an A in science in high school
3.75 .99 391
MSCc Determine the amount of sales tax on clothes I want to buy
3.69 .99 386
MSCj Develop a hypothesis about why kids watch a particular TV show
3.69 1.13 390
MSCa Get an A in math in high school 3.64 1.03 391
MSCe Figure out how long it will take to travel from Columbia to Charlotte driving at 55 mph
3.57 1.10 390
MSCf Design and describe a science experiment that I want to do
3.53 1.09 389
MSCd Collect dues and determine how much to spend for a school club
3.52 1.05 384
MSCg Classify animals that I observe 3.51 1.08 386 MSCi Construct and interpret a graph
of rainfall amounts by state 3.27 1.17 388
MSCh Predict the weather from weather maps
3.16 1.15 391

87
Math/Science Interest
Table 4.12 displays the ranking of the twenty items in Section VI of the survey by
order of importance. The results show that the activity the students related to most about
a Math/Science activity was, “Using a calculator”, the second most agreeable statement
about their interest in an activity was, "Inventing”. The least agreeable statement about an
activity that interested them was in “Joining a science club”.
Table 4.12: Math/Science Interest
Math/Science Interest
Item/Statements Mean Std. Deviation
N
MSIh Using a calculator 3.81 1.03 390 MSIs Inventing 3.52 1.19 386 MSIg Creating a new technology 3.47 1.25 388 MSIq Taking classes in math 3.43 1.23 388 MSIc Solving computer problems 3.31 1.14 388 MSId Solving math puzzles 3.29 1.23 386 MSIk Working in a medical lab 3.28 1.22 385 MSIi Working with plants and animals 3.27 1.21 385 MSIr Working with a chemistry set 3.25 1.17 388 MSIn Working in a science laboratory 3.22 1.24 384 MSIa Visit a museum 3.21 1.14 394 MSIe Touring a science lab 3.19 1.21 387 MSIj Taking classes in science 3.14 1.14 390 MSIo Learning about energy and
electricity 3.09 1.19 389
MSIt Watching a science program on TV 2.99 1.24 392
MSIl Reading about science discoveries 2.98 1.21 388 MSIm Participating in a science fair 2.96 1.30 385 MSIp Working as an astronomer 2.78 1.23 385 MSIb Listening to a famous scientist talk 2.71 1.18 388 MSIf Joining a science club 2.65 1.19 391

88
Career decision self-efficacy
Table 4.13 displays the ranking of the twenty-five items on the questionnaire that
reflected career decision self efficacy, the second dependent variables in the study The
results show the amount of confidence a student has in his/her ability to make career
decisions. The statement where students reported having the highest confidence is, “Use
the internet to find information about an occupation that interests you”. The second
highest statement in which students had confidence was, “Define the type of lifestyle you
would like to live”. The statement reported where student had the least confidence was
the ability to, “Make a career decision and then not worry about whether it was right or
wrong”. Generally, the results show high confidence overall.
Table 4.13: Career Decision Self Efficacy
Career decision self-efficacy
Items/Statements Mean Std. Deviation
N
CDa Use the internet to find information about occupations that interest you
4.14 .97 392
CDv Define the type of lifestyle you would like to live
4.11 1.00 383
CDt Choose a major or career that will fit your interest
4.08 .99 384
CDj Choose a career that will fit your preferred lifestyle
4.07 .97 385
CDb Select one major from a list of potential majors you are considering
4.07 .94 388
Cdi Determine what your ideal job would be
4.03 .97 386
CDs Talk with a person already employed in a field you are interested in
4.00 .99 384
CDc Make a plan of your goals for the next five years
4.00 1.02 384
CDw Find information about graduate or professional schools
3.96 1.03 386

89
CDn Decide what you value most in an occupation
3.95 .98 386
CDg Determine the steps you need to take to successfully complete your chosen major
3.95 .94 383
CDf Select one occupation from a list of potential occupations you are considering
3.93 .90 387
CDo Find out about the average yearly earnings of people in an occupation
3.91 1.05 385
CDh Persistently work at your major or career goal even when you get frustrated
3.90 .1.00 387
CDx Successfully manage the job interview process
3.88 1.01 389
CDe Accurately assess your abilities 3.87 .91 390 CDy Identify some reasonable major or
career alternatives if you are unable to get your first choice
3.86 1.03 387
CDl Prepare a good resume 3.82 1.05 385 CDr Figure out what you are and are not
ready to sacrifice to achieve your career goals
3.81 .98 385
CDu Identify employers, firms, and institutions relevant to your career possibilities
3.79 1.02 386
CDd Determine the steps to take it you are having academic trouble with an aspect of your chosen major
3.77 1.00 390
CDq Change occupations if you are not satisfied with the one you enter
3.77 .99 383
CDm Change majors if you did not like your first choice
3.73 .99 385
CDk Find out what the employment trends for an occupation over the next ten years
3.72 1.04 384
CDp Make a career decision and then not worry whether it was right or wrong
3.51 1.10 385

90
Family Relations
Table 4.14 displays the ranking of the twenty-two items that reflected students’
family relations. The statement with which there was strongest agreement is, “My
parent(s) believe(s) that going to school is important. The second highest ranked
statement in which students agreed was, “My parent(s) tell me that if I want to be
successful, I must work hard in school”. Student’s often tended to disagree with the
statement that “In my family we believe science and math are not worthwhile subjects”.
Table 4.14: Family Relations
Family Relations
Items/Statements Mean Std. Deviation
N
FRd My parent(s) believe(s) that going to school is important
4.41 .94 373
FRb My parent(s) tell me that if I want to be successful, I must work hard in school
4.39 .92 382
FRk My family is proud of me when I do well in school
4.37 .92 376
FRl My parent(s) encourage me to do well in mathematics
4.16 .97 378
FRc My parent(s) and teachers get along well
3.88 .97 378
FRo My parent(s) think that math is one of the most important subjects to study
3.83 1.07 375
FRa My parents think being in a gifted program is important
3.80 1.12 379
FRm My parent(s) help me in any way they can to progress in science and math
3.75 1.09 381
FRs My parent(s) show great interest in math and science grades.
3.73 1.05 368
FRv My parent(s) is(are) happy with their job.
3.73 1.14 379
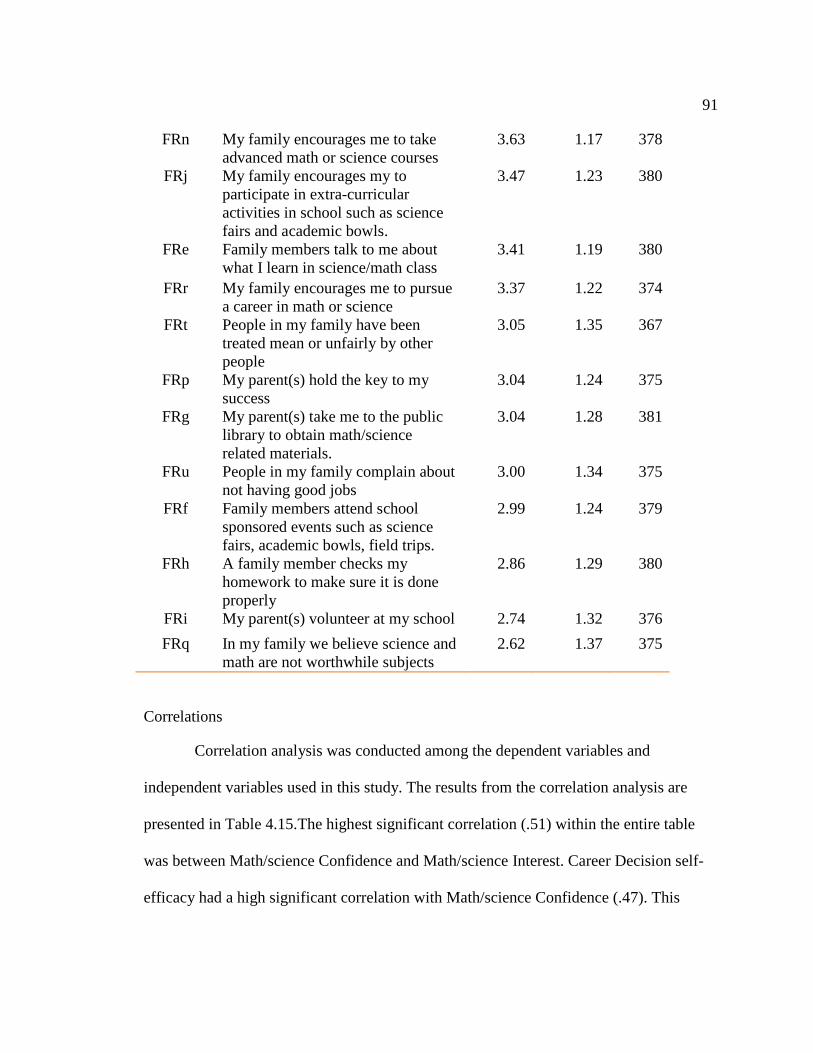
91
FRn My family encourages me to take advanced math or science courses
3.63 1.17 378
FRj My family encourages my to participate in extra-curricular activities in school such as science fairs and academic bowls.
3.47 1.23 380
FRe Family members talk to me about what I learn in science/math class
3.41 1.19 380
FRr My family encourages me to pursue a career in math or science
3.37 1.22 374
FRt People in my family have been treated mean or unfairly by other people
3.05 1.35 367
FRp My parent(s) hold the key to my success
3.04 1.24 375
FRg My parent(s) take me to the public library to obtain math/science related materials.
3.04 1.28 381
FRu People in my family complain about not having good jobs
3.00 1.34 375
FRf Family members attend school sponsored events such as science fairs, academic bowls, field trips.
2.99 1.24 379
FRh A family member checks my homework to make sure it is done properly
2.86 1.29 380
FRi My parent(s) volunteer at my school 2.74 1.32 376 FRq In my family we believe science and
math are not worthwhile subjects 2.62 1.37 375
Correlations
Correlation analysis was conducted among the dependent variables and
independent variables used in this study. The results from the correlation analysis are
presented in Table 4.15.The highest significant correlation (.51) within the entire table
was between Math/science Confidence and Math/science Interest. Career Decision self-
efficacy had a high significant correlation with Math/science Confidence (.47). This
92
finding suggests that as there was an increase in student’s self-efficacy to make a career
decision their confidence in Math and Science also increased. Another significant
correlation was between Career Decision self-efficacy and Ethnic Identity. These two
variables were correlated at (.45). Potentially this correlation implies that students with
high self-efficacy tended to have pride in and value their African American heritage.
Math/Science expectations correlate significantly with Family relationships (.45),
Math/science confidence (.43), Career Decision Making Self-Efficacy (.37), and
Math/science Interest (.47). The correlation table was done excluding pairwise cases
therefore the N differs because it is based on the number of each specific response.

93
Table 4.15: Inter-Correlation of Selected Variables Table
N 1 2 3 4 5 6 7 8 9 10
Items
1. Gender 396
2. Year in high school 393 .067 **
3. Completed an engineering course
375 .264 ** .213 **
4. Socioeconomic Status Code
340 .036 -.037 .080
5. Current GPA 268 -.261 ** .045 .070 .195 **
6. Grade received in 8th grade Mathematics
380 .066 .002 .019 -.026 ** -.264
7. Grade received in 8th grade Science
379 .072 -.147 -.096 -.044 ** -.351 .346 **
8. SchoolMean 396 .023 -.088 -.025 .026 .042 -.067 -.011
9. IdentityMean 396 .072 -.031 -.034 .161 ** .037 -.037 .038 .415 **
10.M/SExpectMean 396 .006 .049 -.022 .050 .069 .039 .032 .402 ** .388 **
11. M/SConMean 396 .062 .047 .018 .098 .025 -.057 .003 .296 ** .297 ** .429 **
12.M/SInterMean 396 -.028 -.057 -.038 ** .037 .019 -.021 .053 .282 ** .186 ** .467 **
13.CareerDMean 396 .057 -.002 .033 .197 ** .092 -.044 .063 .372 ** .447 ** .367 **
14.FamRelMean 396 -.074 -.058 .010 .130 * .004 -.022 .021 .387 ** .393 ** .446 **
** Correlation is significant at the 0.01 level (2-tailed)
* Correlation is significant at the 0.05 level (2-tailed)

94
Table 4.15: Inter-Correlation of Selected Variables Table (cont.)
N 11 12 13 14
Items
1. Gender 396
2. Year in high school 393
3. Completed an engineering course
375
4. Socioeconomic Status Code
340
5. Current GPA 268
6. Grade received in 8th grade Mathematics
380
7. Grade received in 8th grade Science
379
8. SchoolMean 396
9. IdentityMean 396
10.M/SExpectMean 396
11. M/SConMean 396
12.M/SInterMean 396 .510 **
13.CareerDMean 396 .474 ** .348 **
14.FamRelMean 396 .367 ** .463 ** .411 **
** Correlation is significant at the 0.01 level (2-tailed)
* Correlation is significant at the 0.05 level (2-tailed)

95
Dependent Variable Summary
CDSE Subscale
The Table 4.16 below breaks down the CDSE into its subscales as
originally suggested by Betz, Klein & Taylor (1996).
Table 4.16: Career Decision Self-Efficacy Subscale breakdown
Subscale-Title Mean Std. Dev
1-Self Appraisal (SA)
Accurately assess your abilities. 3.87 .91
Determine what your ideal job would be. 4.03 .97
Decide what you value most in an occupation. 3.95 .98
Figure out what you are and are not ready to sacrifice to achieve your career goals.
3.81 .98
Define the type of lifestyle you would like to live. 4.11 1.0
2-Occupational Information(OI)
Use the internet to find information about occupations that interest you.
4.14 .97
Find out the employment trends for an occupation over the next ten years.
3.72 1.04
Find out about the average yearly earnings of people in an occupation.
3.91 1.05
Talk with a person already employed in a field you are interested in.
4.00 .99
Find information about graduate or professional schools.
3.96 1.03

96
3-Goal Selection(GS)
Select one major from a list of potential majors you are considering.
4.07 .94
Select one occupation from a list of potential occupations you are considering
3.93 .90
Choose a career that will fit your preferred lifestyle 4.07 .97
Make a career decision and then not worry whether it was right or wrong.
3.51 1.10
Choose a major or career that will fit your interests. 4.08 .99
4-Planning (PL)
Make a plan of your goals for the next five years. 4.00 1.02
Determine the steps you need to take to successfully complete your chosen major.
3.95 .94
Prepare a good resume. 3.82 1.05
Identify employers, firms, and institutions relevant to your career possibilities.
3.79 1.02
Successfully manage the job interview process. 3.88 1.01
5-Problem Solving(PS)
Determine the steps to take if you are having academic trouble with an aspect of your chosen major.
3.77 1.00
Persistently work at your major or career goal even when you get frustrated
3.90 1.00
Change majors if you did not like your first choice 3.73 .99
Change occupations if you are not satisfied with the one you enter.
3.77 .99
Identify some reasonable major or career alternatives if you are unable to get your first choice.
3.86 1.03
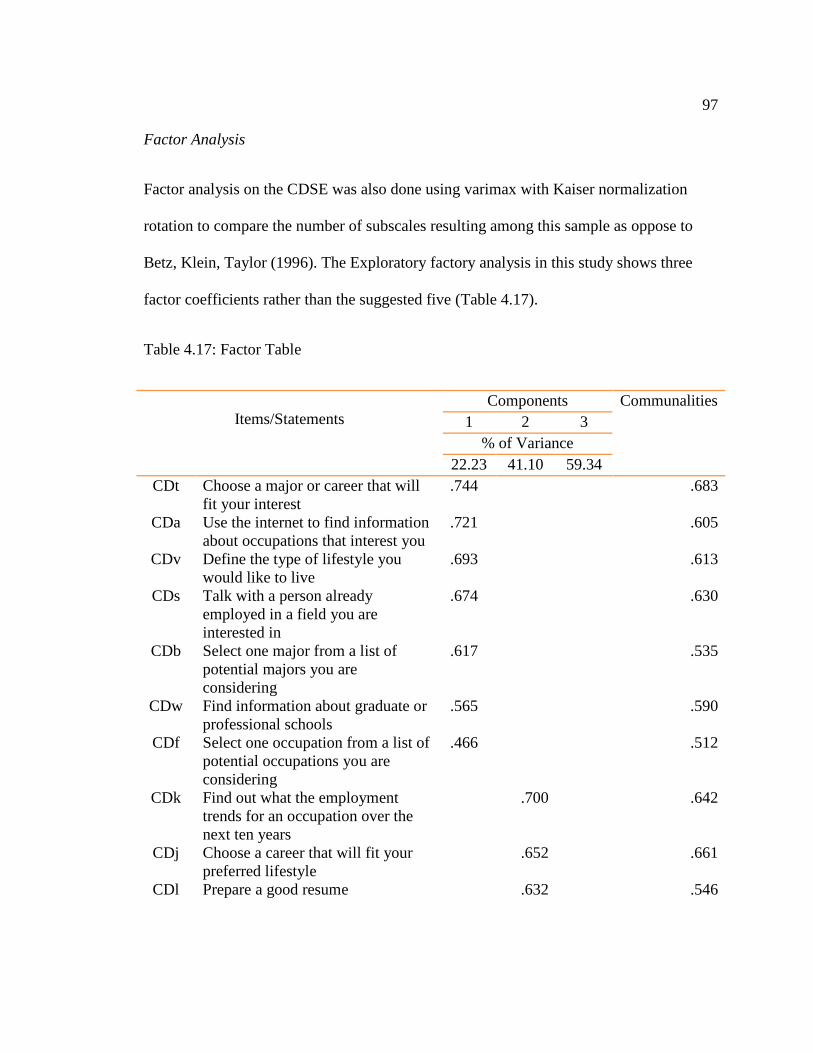
97
Factor Analysis
Factor analysis on the CDSE was also done using varimax with Kaiser normalization
rotation to compare the number of subscales resulting among this sample as oppose to
Betz, Klein, Taylor (1996). The Exploratory factory analysis in this study shows three
factor coefficients rather than the suggested five (Table 4.17).
Table 4.17: Factor Table
Items/Statements
Components Communalities 1 2 3
% of Variance 22.23 41.10 59.34
CDt Choose a major or career that will fit your interest
.744 .683
CDa Use the internet to find information about occupations that interest you
.721 .605
CDv Define the type of lifestyle you would like to live
.693 .613
CDs Talk with a person already employed in a field you are interested in
.674 .630
CDb Select one major from a list of potential majors you are considering
.617 .535
CDw Find information about graduate or professional schools
.565 .590
CDf Select one occupation from a list of potential occupations you are considering
.466 .512
CDk Find out what the employment trends for an occupation over the next ten years
.700 .642
CDj Choose a career that will fit your preferred lifestyle
.652 .661
CDl Prepare a good resume .632 .546
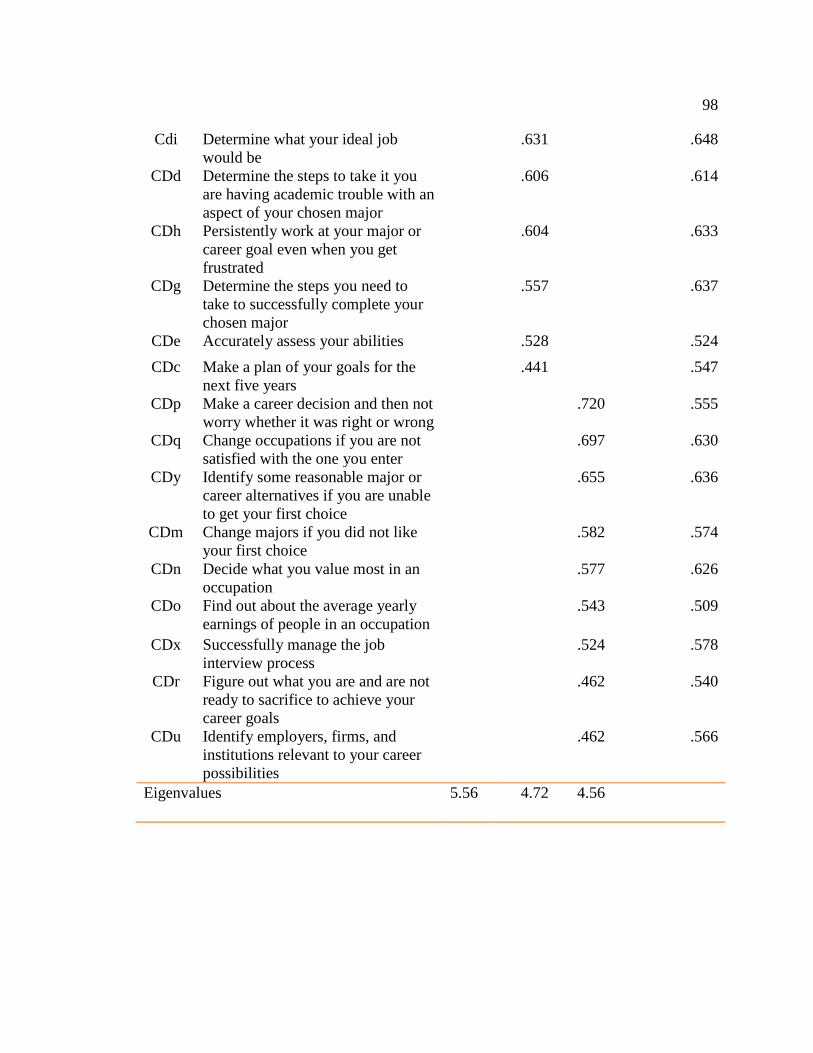
98
Cdi Determine what your ideal job would be
.631 .648
CDd Determine the steps to take it you are having academic trouble with an aspect of your chosen major
.606 .614
CDh Persistently work at your major or career goal even when you get frustrated
.604 .633
CDg Determine the steps you need to take to successfully complete your chosen major
.557 .637
CDe Accurately assess your abilities .528 .524 CDc Make a plan of your goals for the
next five years .441 .547
CDp Make a career decision and then not worry whether it was right or wrong
.720 .555
CDq Change occupations if you are not satisfied with the one you enter
.697 .630
CDy Identify some reasonable major or career alternatives if you are unable to get your first choice
.655 .636
CDm Change majors if you did not like your first choice
.582 .574
CDn Decide what you value most in an occupation
.577 .626
CDo Find out about the average yearly earnings of people in an occupation
.543 .509
CDx Successfully manage the job interview process
.524 .578
CDr Figure out what you are and are not ready to sacrifice to achieve your career goals
.462 .540
CDu Identify employers, firms, and institutions relevant to your career possibilities
.462 .566
Eigenvalues 5.56 4.72 4.56
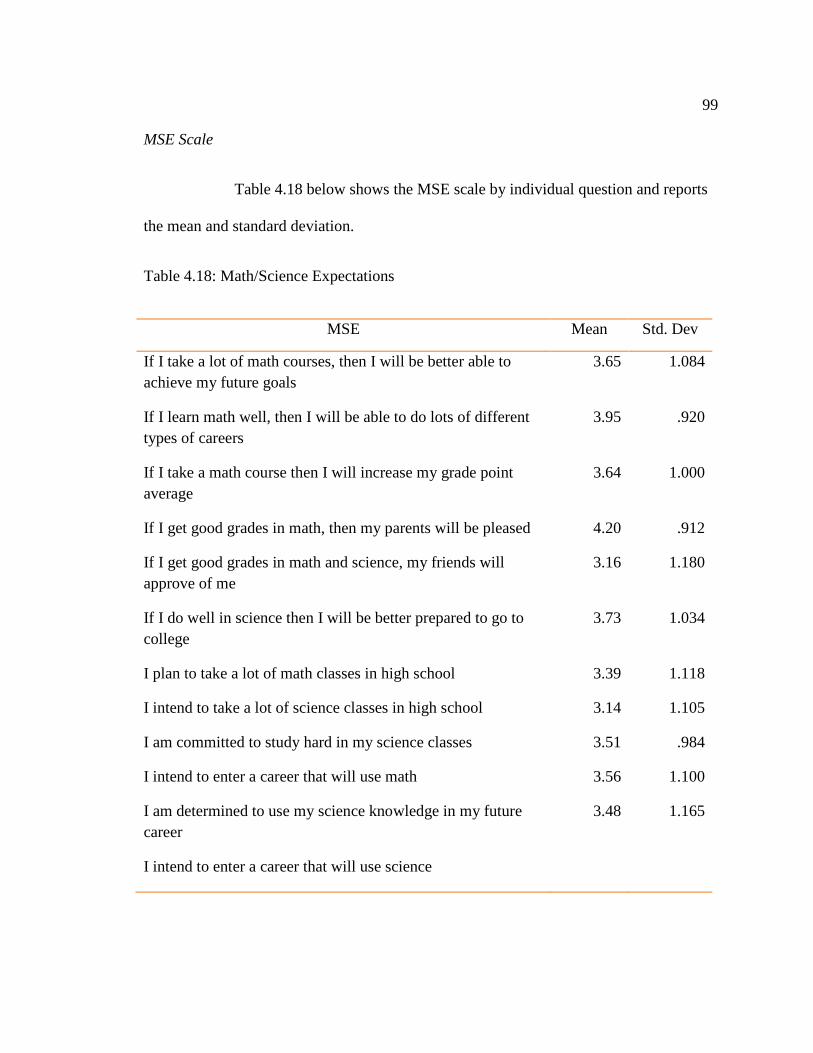
99
MSE Scale
Table 4.18 below shows the MSE scale by individual question and reports
the mean and standard deviation.
Table 4.18: Math/Science Expectations
MSE Mean Std. Dev
If I take a lot of math courses, then I will be better able to achieve my future goals
3.65 1.084
If I learn math well, then I will be able to do lots of different types of careers
3.95 .920
If I take a math course then I will increase my grade point average
3.64 1.000
If I get good grades in math, then my parents will be pleased 4.20 .912
If I get good grades in math and science, my friends will approve of me
3.16 1.180
If I do well in science then I will be better prepared to go to college
3.73 1.034
I plan to take a lot of math classes in high school 3.39 1.118
I intend to take a lot of science classes in high school 3.14 1.105
I am committed to study hard in my science classes 3.51 .984
I intend to enter a career that will use math 3.56 1.100
I am determined to use my science knowledge in my future career
3.48 1.165
I intend to enter a career that will use science
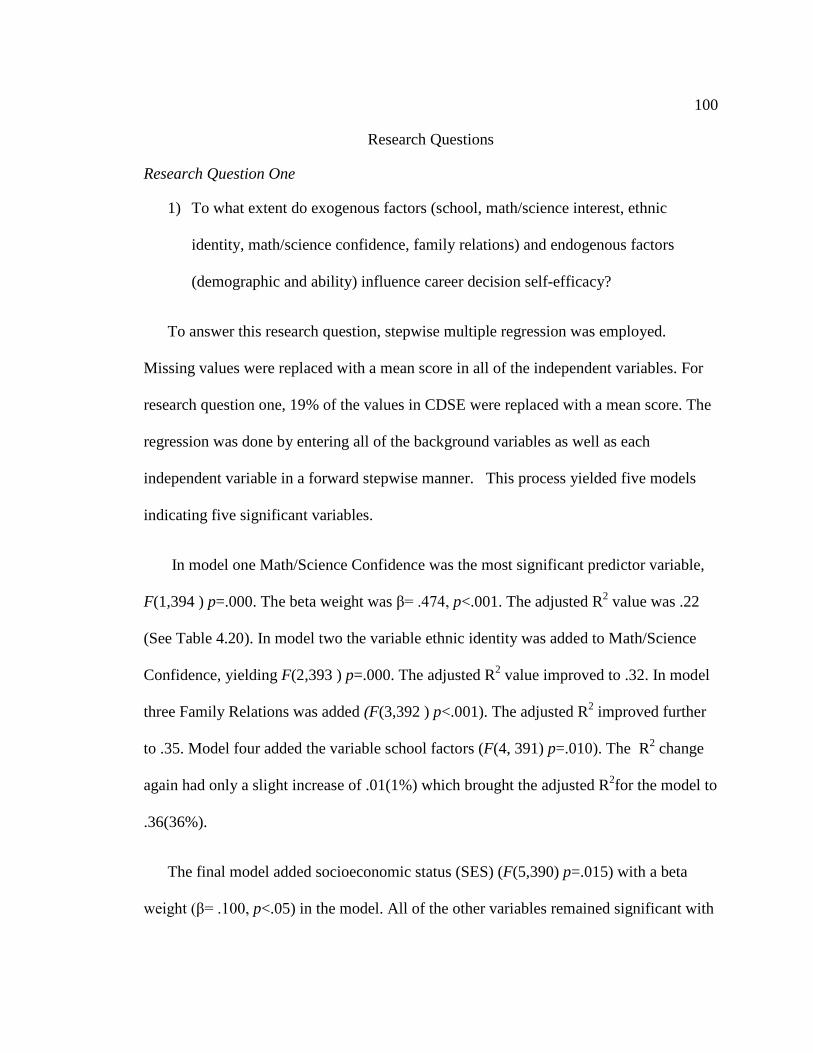
100
Research Questions
Research Question One
1) To what extent do exogenous factors (school, math/science interest, ethnic
identity, math/science confidence, family relations) and endogenous factors
(demographic and ability) influence career decision self-efficacy?
To answer this research question, stepwise multiple regression was employed.
Missing values were replaced with a mean score in all of the independent variables. For
research question one, 19% of the values in CDSE were replaced with a mean score. The
regression was done by entering all of the background variables as well as each
independent variable in a forward stepwise manner. This process yielded five models
indicating five significant variables.
In model one Math/Science Confidence was the most significant predictor variable,
F(1,394 ) p=.000. The beta weight was β= .474, p<.001. The adjusted R2 value was .22
(See Table 4.20). In model two the variable ethnic identity was added to Math/Science
Confidence, yielding F(2,393 ) p=.000. The adjusted R2 value improved to .32. In model
three Family Relations was added (F(3,392 ) p<.001). The adjusted R2 improved further
to .35. Model four added the variable school factors (F(4, 391) p=.010). The R2 change
again had only a slight increase of .01(1%) which brought the adjusted R2for the model to
.36(36%).
The final model added socioeconomic status (SES) (F(5,390) p=.015) with a beta
weight (β= .100, p<.05) in the model. All of the other variables remained significant with
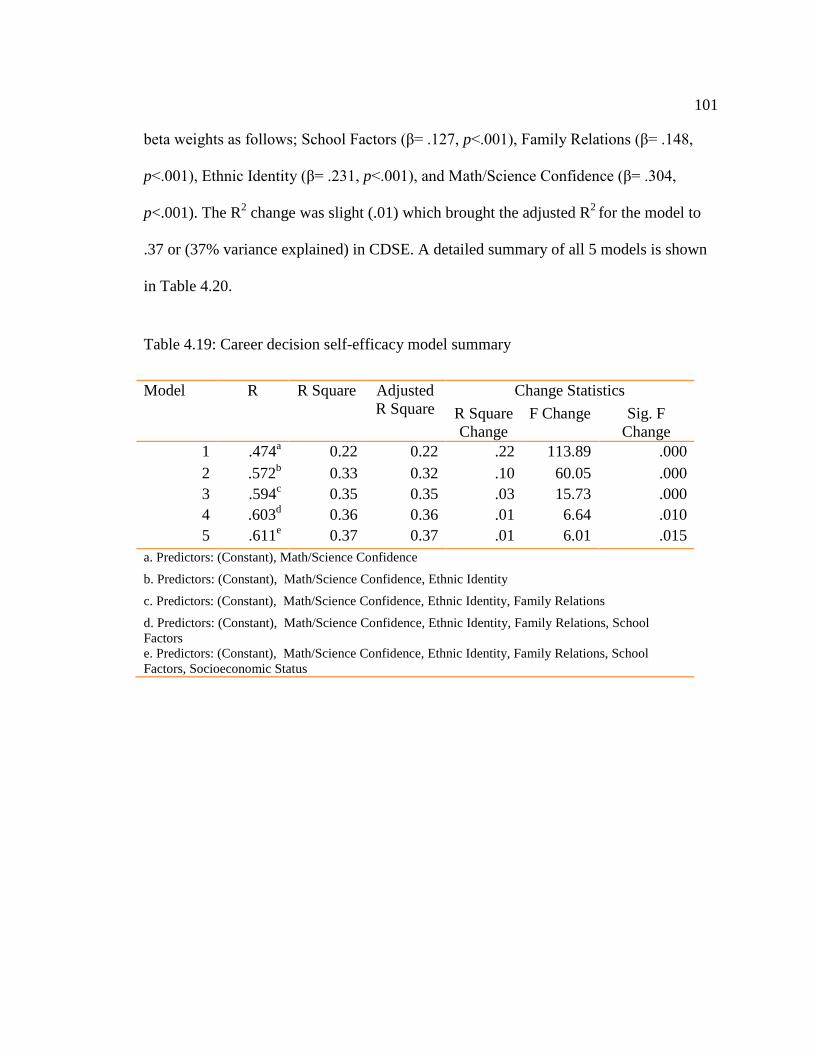
101
beta weights as follows; School Factors (β= .127, p<.001), Family Relations (β= .148,
p<.001), Ethnic Identity (β= .231, p<.001), and Math/Science Confidence (β= .304,
p<.001). The R2 change was slight (.01) which brought the adjusted R2 for the model to
.37 or (37% variance explained) in CDSE. A detailed summary of all 5 models is shown
in Table 4.20.
Table 4.19: Career decision self-efficacy model summary
Model R R Square Adjusted R Square
Change Statistics R Square Change
F Change Sig. F Change
1 .474a 0.22 0.22 .22 113.89 .000 2 .572b 0.33 0.32 .10 60.05 .000 3 .594c 0.35 0.35 .03 15.73 .000 4 .603d 0.36 0.36 .01 6.64 .010 5 .611e 0.37 0.37 .01 6.01 .015
a. Predictors: (Constant), Math/Science Confidence
b. Predictors: (Constant), Math/Science Confidence, Ethnic Identity
c. Predictors: (Constant), Math/Science Confidence, Ethnic Identity, Family Relations
d. Predictors: (Constant), Math/Science Confidence, Ethnic Identity, Family Relations, School Factors e. Predictors: (Constant), Math/Science Confidence, Ethnic Identity, Family Relations, School Factors, Socioeconomic Status

102
Table 4.20: Career decision self-efficacy model showing contribution of each variable
Research Question Two
2) To what extent do exogenous factors (school, math/science interest, ethnic
identity, math/science confidence, family relations) and endogenous factors
(demographic and ability) influence math/science related goal intentions?
Model Unstandardized Coefficients
Standardized Coefficients
T Sig.
B Std. Error Beta 1 (Constant) 2.279 .155 14.66 .000
Math/Science Confidence .460 .043 .474 10.67 .000 2 (Constant) 1.188 .202 5.88 .000
Math/Science Confidence .363 .042 .374 8.62 .000 Ethnic Identity .369 .048 .336 7.75 .000
3 (Constant) .920 .210 4.39 .000 Math/Science Confidence .314 .043 .324 7.29 .000 Ethnic Identity .307 .049 .279 6.21 .000 Family Relations .195 .049 .183 3.97 .000
4 (Constant) .531 .257 2.07 .000 Math/Science Confidence .300 .043 .308 6.94 .000 Ethnic Identity .269 .051 .244 5.25 .000 Family Relations .166 .050 .156 3.31 .001 School Factors .201 .078 .120 2.58 .010
5 (Constant) .440 .258 1.71 .018 Math/Science Confidence .295 .043 .304 6.88 .000 Ethnic Identity .254 .051 .231 4.96 .000 Family Relations .157 .050 .148 3.16 .002 School Factors .213 .078 .127 2.75 .006 Socioeconomic Status .005 .002 .100 2.45 .015

103
To answer the second research question another multiple regression analysis was
performed. This regression was done to determine the association between Math/Science
Expectations (MSE), the background information and five independent variables (school
factors, ethnic identity, Math/Science confidence, Math/Science Interest, and Family
relations). Missing values were replaced with a mean score for both the independent and
dependent variables. For the dependent variable 9% of the values were replaced. Similar
to research question one a forward stepwise approach was taken.
In model one Math/Science Interest entered as the most significant variable
(F(1,394 ) p=.000 ). Its beta weight was β= .467, p<.001, and the adjusted R2 value was
.22 (See Table 4.21). In model two ethnic identity was added to Math/Science interest,
yielding F(2,393) p=.000. The adjusted R2 value improved to .31. In model three the
variable school factors was added F(3,392) p=.000. The R2 change value showed a small
increase of .03 which brought the adjusted R2 to .34. In model four Math/Science
confidence was added (F(4,391) p=.001). The adjusted R2for the model improved to
.36(36%). In model five, family relations was added (F(5,390) p=.003). The R2 change
had only a slight increase of .01(1%) which brought the adjusted R2 to .37. In model 6-
the final model-Year in high school was added ( F(6,389) p=.000). Although year in high
school was shown to be statistically significant, it was not shown to be practically
significant because it contributed not other variance to the dependent variable
math/science expectations. This variable had a significant beta weight (β= .085, p<.05).
Other beta weights for the total analysis were as follows: Family Relations(β= .149,
p<.05), Math/Science Confidence (β= .141, p<.05), School Factors(β= .167, p<.001),
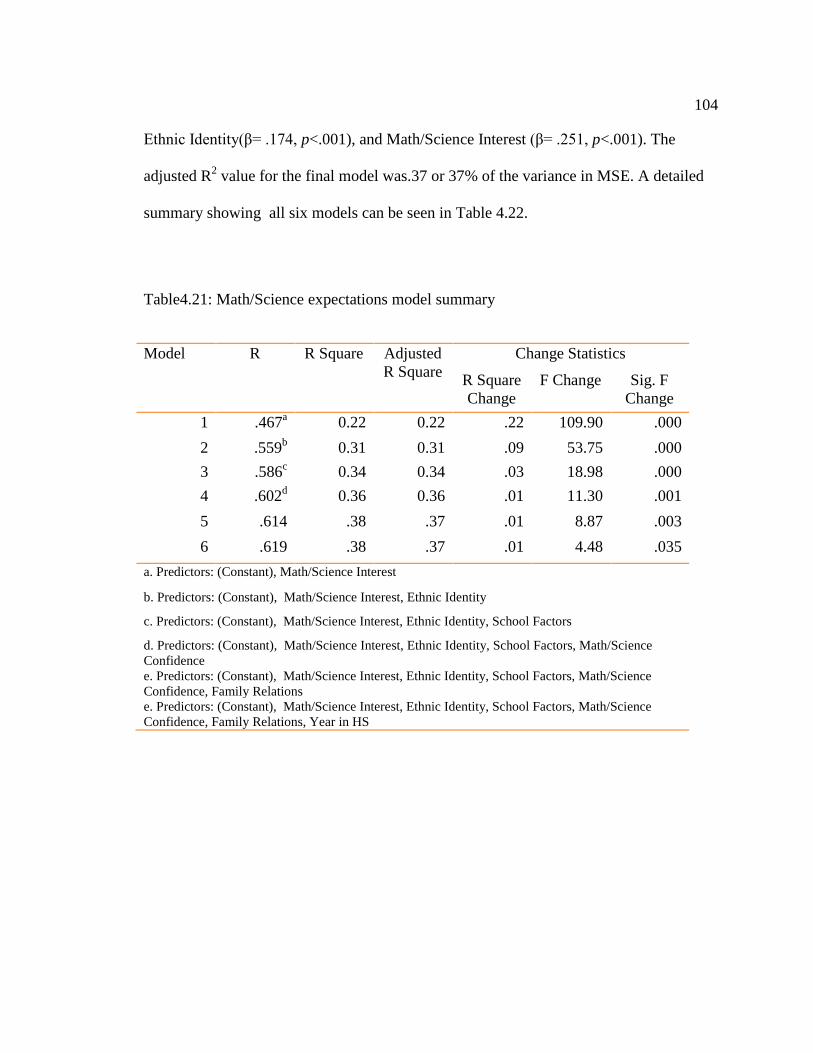
104
Ethnic Identity(β= .174, p<.001), and Math/Science Interest (β= .251, p<.001). The
adjusted R2 value for the final model was.37 or 37% of the variance in MSE. A detailed
summary showing all six models can be seen in Table 4.22.
Table4.21: Math/Science expectations model summary
Model R R Square Adjusted R Square
Change Statistics
R Square Change
F Change Sig. F Change
1 .467a 0.22 0.22 .22 109.90 .000 2 .559b 0.31 0.31 .09 53.75 .000 3 .586c 0.34 0.34 .03 18.98 .000 4 .602d 0.36 0.36 .01 11.30 .001 5 .614 .38 .37 .01 8.87 .003 6 .619 .38 .37 .01 4.48 .035
a. Predictors: (Constant), Math/Science Interest
b. Predictors: (Constant), Math/Science Interest, Ethnic Identity
c. Predictors: (Constant), Math/Science Interest, Ethnic Identity, School Factors
d. Predictors: (Constant), Math/Science Interest, Ethnic Identity, School Factors, Math/Science Confidence e. Predictors: (Constant), Math/Science Interest, Ethnic Identity, School Factors, Math/Science Confidence, Family Relations e. Predictors: (Constant), Math/Science Interest, Ethnic Identity, School Factors, Math/Science Confidence, Family Relations, Year in HS

105
Table 4.22: Math/Science expectations model showing contribution of each variable
Model Unstandardized Coefficients
Standardized Coefficients
T Sig.
B Std. Error Beta 1 (Constant) 2.278 .126 18.042 .000
Math/Science Interest .404 .038 .467 10.483 .000 2 (Constant) 1.094 .200 5.465 .000
Math/Science Interest .353 ..037 .409 9.601 .000 Ethnic Identity .346 .047 .312 7.331 .000
3 (Constant) .367 .257 1.428 .154 Math/Science Interest .316 .037 .366 8.562 .000 Ethnic Identity .262 .050 .237 5.248 .000 School Factors .340 .078 .201 4.357 .000
4 (Constant) .218 .258 .844 .399 Math/Science Interest .253 .041 .293 6.152 .000 Ethnic Identity .231 .050 .209 4.602 .000 School Factors .313 .077 .185 4.042 .000 Math/Science Conf .160 .048 .163 3.361 .001
5 (Constant) .133 .257 .520 .604 Math/Science Interest .211 .043 .244 4.894 .000 Ethnic Identity .193 .051 .174 3.749 .000 School Factors .270 .078 .160 3.463 .001 Math/Science Conf .149 .047 .152 3.152 .002 Family Relations .158 .053 .147 2.978 .003
6 (Constant) -.034 .268 -.126 .900 Math/Science Interest .217 .043 .251 5.045 .000 Ethnic Identity .193 .051 .174 3.775 .000 School Factors .283 .078 .167 3.631 .000 Math/Science Conf .138 .047 .141 2.924 .004 Family Relations .160 .053 .149 3.044 .002 Year in HS .049 .023 .085 2.117 .035
106
Summary
Research Question One
The first research question examined predictors of Career Decision-Making Self
Efficacy (CDSE). The finding is that five variables in combination significantly
influenced CDSE; they are math/science confidence (contributing the most variance),
socioeconomic status, ethnic identity, school factors, and family relations.
Research question Two
The second research question explored predictors of Math/Science related goal
Expectations (MSE)—a proxy for engineering-related goal intentions. The findings are
that six independent variables predict MSE, math/science interest, ethnic identity, school
factors, math/science confidence, family relations, and year in high school.
Shared Predictors
These findings show that a common set of factors predicted both dependent
variables. These were math/science confidence, ethnic identity, family relations, and
school factors.
107
Chapter V
Discussion
The purpose of this study was to gain knowledge about factors that influence
Career decision self-efficacy and Math/science related goal intentions among African
American high school students. A total of 396 students from two high schools in
Columbia, SC responded to the survey that was used in this study. Regression analysis
was used to answer the two research questions.
Chapter I established a framework for the study by describing the problem of
shortages of African American in engineering fields. Historical roots of this were
examined, along with the potential impact in a world of globalization. Chapter II
reviewed the literature concerning perceived factors of entrance into math/science and
engineering fields. Further, the views of theorists from the vocational and technical
community were discussed. The chapter also examined previous studies on students’
attitudes toward math/science related disciplines and engineering careers, and factors
influencing their choices of such careers. Literature relating to all variables in the study
was reviewed. Chapter III described the design of the research, and methods and
procedures employed in conducting the study. The chapter outlined the methodology
used in this study, including a discussion of the sampling procedures, IRB process, pilot
testing, research design, instrumentation, data collection, and data analysis. Chapter IV
reported the data analysis and its results. Descriptive statistics were first reported then the
results of the regression analyses were described. The findings were then organized

108
around the two research questions. The present chapter will summarize the findings then
provide discussion, conclusions, recommendations and implications.
Summary of Findings
The results of the stepwise regression model for question one indicated that five
variables were significant in explaining career decision self-efficacy among students in
the study. These five variables were found to contribute 37% of variance in CDSE:
math/science confidence, ethnic identity, family relations, school factors, and SES. Such
a finding suggests that those students who have a higher career decision self-efficacy
have higher math/science confidence, ethnic identity, positive family relations, SES, and
positive school factors. The results of the stepwise regression model for question two
indicated that 6 independent variables were significant. These six variables contributed
37% of the variance in Math/Science Expectations. They were: math/science interest,
ethnic identity, school factors, math/science confidence, family relations, and year in HS.
These findings suggest that those students who have higher math/science expectations
have higher math/science interest, ethnic identity, math/science confidence, stronger
family relations, along with more positive school factors.
Discussion of the Findings
Of the background variables in this study only two were significant. For the first
research question only socioeconomic status influenced career decision self-efficacy and
for the second research question only year in high school influenced math/science
expectations. The fact that the remaining demographic variables were not significant
109
within this study is not definitive proof that they are not contributors to the dependent
variables in other circumstances. The variables that were not shown to add any value to
the research questions were gender, completed an engineering course, current G.P.A.,
grade received in Math, and grade received in Science. These variables excluding the
completion of engineering will be discussed as they relate to previous research in the next
sections.
Career Decision Self-Efficacy
The results of the stepwise regression showed most background variables to have
little influence on career decision self-efficacy. Similar to what was found in Brown and
Lavish (2006) who studied another minority group, Native Americans, there was no
significant gender differences as it related to career decision self-efficacy. Although there
were no significant sex differences in this study consistent with Gianakos (2001) women
reported having stronger levels of career decision self-efficacy overall.
An interesting variable within this study that was found to be significant was
ethnic identity. Identity was used specifically for this study because previous studies led
the researcher to believe that there was some connection between academic achievement
and career decision with identity (Atlschul, Oyserman,& Bybee, 2006; Kerpelman,
Schoffner, & Ross-Griffin, 2002; Oyserman, Gant,& Ager,1995). The findings here are
also consistent with that of Nauta and Kahn (2007) who concluded that young adults’
identity status is associated with career decision self-efficacy.

110
As stated earlier the most significant factor predicting CDSE was Math/Science
confidence (self-efficacy). Consistent with the findings of the current study Gwilliam and
Betz (2001) also found that, math/science confidence had significant influence on career
decision making self-efficacy. The researchers go on to say that math/science self-
efficacy remains important because minorities continue to be underrepresented in math,
science, and technical occupations (Gainor & Lent, 1998; Gwilliam & Betz, 2001; Post,
Stewart & Smith, 1991).
The family relations variable was also significant. This finding suggests that, as
previously believed, family is important when students consider career related decisions.
School factors within this study were shown to be significant, which further confirms that
school is important when making career decisions. Interestingly there are a variety of the
factors within a school that students feel are valuable. These factors range from teachers,
counselors, peers, personal attitude, and the overall environment. Luzzo (1993) found a
significant relationship between student’s attitudes and CDSE which is similar to the top
rated questions pertaining to school within the current study. Consistent with this study
Bandura, Barbaranelli, and Caprara (2001) found that student’s self-efficacy was
influenced by their perception of what their teacher’s thought of their ability to do
something. These findings suggest that current practicing teachers and future teachers
should be made aware of this knowledge so they can prepare to enhance student’s self-
efficacy.
In this study socioeconomic status (SES) was a predictor of CDSE. Prior research
suggests that SES influences a number of aspects of a students’ life such as educational
111
opportunities and the chance of a quality education (Fouad & Brown, 2000; Gilbert &
Kahl, 1993; Maher & Kroska, 2002). Blustien et al. (2002) found that participants from
high socioeconomic backgrounds reported more interest in work, greater access to
resources, and more career adaptability than did lower social class participants. All of
these aspects are indirectly related to career decision self-efficacy in aspect that they are
all shown to be correlated with CDSE. Trusty, Robinson, Plata, and Ng (2000) found that
SES was an important predictor of type of college major (grouped together by Holland
codes) for adolescents. It is possible that if SES can predict a college major it indirectly
predicts future occupations. A finding not consistent with this study was the results by
Tang, Fouad, and Smith (1999) which found no significant relationship amongst career
self-efficacy and SES.
Betz, Klein, & Taylor (1996) reported an alpha of .94 for total CDSE-SF scale;
Self Appraisal (.73), Occupational Information (.78), Goal Selection (.83), Planning (.81),
and Problem Solving (.75). In Hampton (2005) which consisted of 220 African American
Students the reliability coefficients were as follows: (.91) for the total scale Self
Appraisal (.78), Occupational Information (.74), Goal Selection (.78), Planning (.70), and
Problem Solving (.70). This study found the following Cronbach Alphas for the five
original subscales; Self Appraisal (.81), Occupational Information (.79), Goal Selection
(.85), Planning (.83), and Problem Solving (.78). The alpha for each individual scale; Self
Appraisal (.84), Occupational Information (.81), Goal Selection (.80), Planning (.85), and
Problem Solving (.83) were higher in the present study for each scale except the GS scale
112
where it was found to be lower than those previously reported (Betz et al., 1996;
Hampton, 2005).
The factor analysis results showed that different from the CDSE-short form (Betz
& Klein, 1996; Betz, Hammond, & Multon,2005), which includes five subscales, the
current study shows three. Previous research on the CDSE short form instrument using
factor analysis suggests the existence of one or two broad factors rather than five (Betz &
Luzzo, 1996; Peterson & del Mas, 1998). Other researchers using the same instrument
found four-factor solutions in their sample (Chaney Hammond, Betz, & Multon, 2007;
Taylor & Betz, 1983). However in the present study a three factor solution was found to
initially work best. Hampton (2005) found consistent findings for Chinese students but
the results showed some inadequacy based on the results of CFA. For South Africans the
dominant factors (decision making) were Goal Selection and Planning (Creed, Patton,
and Watson, 2002).
Math/Science Related Goal Intentions
Consistent with the findings in this study math/science self-efficacy and interests
have been found to significantly predict math/science career-related behaviors (Byars-
Winston & Fouad, 2008; Post, Stewart, & Smith, 1991). Previous research has shown that
Math/science self-efficacy (confidence) related behaviors indirectly affect occupation
possibilities because mathematics has long been recognized as a critical filter for entry
into scientific and technical fields (Gwilliam & Betz, 2001;Sells, 1982). The current
study is in keeping with this, as, math/science confidence was found to not only have a

113
significant relationship with career decision self-efficacy but also Math/science related
goal intentions. In addition to career entry, Lent, Brown, and Larkin (1984,1986) reported
that self-efficacy with respect to scientific and technical careers was significantly related
both to performance and persistence in science and engineering majors.
This study looked at a variety of theories that contributed to development of
career decisions and self efficacy. One of these was Social Cognitive Career Theory
(SCCT) which asserted that when the outcomes expected of an action are tied to
individuals’ self-efficacy for the action, self-efficacy is presumed to be the stronger
determinant of behavior (Fouad & Guillen, 2006). This is consistent with findings in the
current study in that Math/science confidence significantly explained math/science
expectations. Similar to this study, Gore and Leuwerke (2000) also showed an overlap
between Holland’s theory of career choice and SCCT.
Interest was shown to be a significant factor within this study, aligning with Gore
& Leuwerke (2000) who found that in the absence of barriers, and in the presence of
environmental support, interest will be translated into academic or career goals and
ultimately, academic or career related behaviors. This finding is also consistent with prior
research. In addition a correlation between outcome expectations and interest was found
to be between .40 and.52 consistent with Lent, Brown, & Hackett,1994; Lent, Brown,
Brenner, Chopra, & Davis, 2001; Lopez, Lent, Brown, & Gore,1997; and Fouad &
Guillen, 2006. Also, Lent et al. (2001) using a different sample found a correlation
between math outcome expectancies and interests. Leuwerke et. al, (2004) concluded that
114
it is not gender or ethnicity specifically but interests that affect motivation to pursue an
engineering degree. In this case, it is important to examine factors that adversely affect
interests in these fields such as lack of preparation, low self-efficacy for science and
engineering, and lack of role models (Betz, 1997; Dunn & Veltman, 1989)
As the study relates to the family relation variable prior research found that
parental influences such as career expectations and support have been found to predict
career choice and outcome expectations for a diversity of populations (Byars-Winston &
Fouad 2008; Tang, Fouad, & Smith, 1999; Ferry, Fouad, & Smith, 2000). This was
consistent with the finding in this study as regards to stepwise regression and the family
relations variable showed a moderate correlation with math/science expectations. One
way this assertion maintains precedents is because it was found that parents communicate
their career-related beliefs, encouragement, and expectations, which influence their
children’s interest and goal formation, perceptions about the relative value of pursuing
given career pathways (Bandura, Barbaranelli, Caprar, & Pastorelli, 2001; Byars-Winston
& Fouad, 2008).
There is extensive literature demonstrating that achievement is a key determinant
of selection, grade performance, and success in the science and technology fields (Cross,
2001; Hackett, Betz, Casas, & Rocha-Singh, 1992; Lent Brown, and Larkin,1987;
Leuwerke, Robbins, Sawyer, & Hovland , 2004). Within this study some of the
measurements of achievement were GPA and scores in math and science. However, none
of the achievement variables were shown to predict or even highly correlate with
115
Math/science expectations. Leuwerke et. al, 2004 concluded those individuals with the
higher ACT Math (ACTM) scores were more likely to remain the major of engineering.
But within the study this conclusion could be disputed because there was a negative
correlation between Math score and Math/science expectations. However for future
teaching one could argue that if educators could increase students math scores that there
would be a higher probability of entrance into the field.
Conclusions
The goal of this study was to determine factors that influence both career decision self-
efficacy and Math/science related goal intention among African American high school
students. Based on the above findings, the conclusions are as follows:
(a) Among African high school students Math/science confidence has a relationship with
career decision self-efficacy.
(b) Ethnic Identity is an important factor in examining the relationship African American
high school students has in math/science related careers.
(c) Socioeconomic status is an important factor in shaping whether African students
show interest in math/science related careers.
(d) Family relations help establish whether African American students will become
interested in math/science related careers.
116
(e) Whether African American high school students have positive school experiences
such as supportive environment, peer support, and teacher encouragement, relates to
whether they will be interested in math/science related careers.
Recommendations and Implications
The findings and conclusions in this study lead to recommendations for educators,
career counselors, and the African American community. First the tested variables only
explained 37% of the variance in both CDSE and MSE so; other variables should be
explored such as the correlation of role models and/or mentors on African American
students. Second a larger sample of students actually participating in engineering
programs may add some explanation to both of the dependent variables. A second
recommendation surrounds the fact that 8th grade math scores was not significant and
should be observed to see if there was a specific math class that contributed to its
significance. The researcher recommends that in areas containing varying socioeconomic
statuses for African American students, a wide range of career programs be developed.
Specifically among those of lower SES who may not otherwise be exposed to or have
access to the same resources of those of higher SES.
In relation to MSE the researcher recommends that school and programs continue
to promote and foster programs that increase Math/science interest. The variable was
shown to be more important so researcher should continue to look at students with access
to those programs and some without for intervention ideas. Ethnic identity should
continue to be fostered in math and science subjects since it was shown to be vital.

117
The results in this study could imply that the type of school (whether it be math or
science focused) may result in positive responses to questions relating to math and/or
science. The results of this study should also be used to initiate dialog regarding more
correlative ways to contribute to career decision self-efficacy and allow ease of interest
into engineering and math/science related fields for minorities.
Limitations
The primary limitations of this study are that it was conducted in two schools that
were purposively chosen, and in which the curriculum deliberately promoted math and
science learning, and engineering as a career. While this was a limitation, the sample also
showed that when schools deliberately promote such studies among African American
students, the results can be positive.
Summary
This study contributed to the research literature by first examining a population
that has historically been absent in the field of engineering and related fields. The study
then looked at African American students in high school and attempted to measure
factors influencing those decisions. It also evaluated the relationship of career decision
self-efficacy and factors that are theorized to contribute to it. The results from the current
study indicated that Math/science confidence, school factors, and ethnic identity
significantly influence both CDSE and MSE. In addition SES and 8th grade math score
influenced CDSE and Interest influenced MSE. Although the variance accounted for was
small, (about 39% for both), researchers, educators, community members, and policy
118
makers should be aware of those contributing factors. Although gender and year in high
school had a low correlation with both of the dependent variables, they are still important
to consider.
Findings from this study may be useful for those in predominantly African
American schools, directors of Math and Science or Engineering afterschool or summer
programs, and parents to help strengthen initiatives promoting not only the subject but the
inclusion of the African American population. The results suggest that previously
theorized variables such as SES Math/Science confidence, Math/science interest, and
Ethnic Identity can significantly account for the variance in CDSE and MSE (Oyserman,
Gant,& Ager,1995; Oyserman & Harrison, 1998; Lent, Brown, Brenner, Chopra, &
Davis, 2001; Luzzo, Hasper, Albert, Bibby, & Martinelli, 1999).

119
References
Alexander, N.A. (2002). Race, poverty, and the student curriculum: Implications for
standards policy. American Educational Research Journal, 39(3), 675-693.
Altschul, I., Oyserman, D., & Bybee, D. (2006). Racial-ethnic Identity in Mid-
Adolescence: Content and Change as Predictors of Academic achievement. Child
Development, 77(5), 1155-1169.
Apple, M.W. (2004). Ideology and Curriculum. New York, NY: Routledge Falmer.
Arum,R. & Shavit,Y. (1995) Secondary vocational education and the transition from
school to work. Sociology of Education, 68, 187-204.
Ashton,D., Sung,J., & Turbin, J. (2000) Towards a framework for the comparative
analysis of national systems of skill formation. International Journal of Training
and Development, 4(1), 8-25.
Babco, E. (2001). Underrepresented minorities in Engineering: A progress report. The
American Association for the Advancement of Science Making Strides An NSF
Supported Initiative by the Alliances for Graduate Education and the Professoriate
Program (AGEP), 1-22.
Backman, M .E.(1972). Patterns of Mental Abilities: Ethnic, Socioeconomic, and Sex
Differences. American Educational Research Journal, 9(1), 1-12.
120
Baker, P. B. (2005). The impact of cultural biases on African American students’
education: A review of research literature regarding race based schooling.
Education and Urban Society, 37(3), 243-256.
Bandura, A. (1977). Self-efficacy: Toward a unifying theory of behavioral change.
Psychological Bulletin, 84(2), 191-215.
Bandura, A. (1986). Social foundations of thought and action: A social cognitive theory.
Englewood Cliffs, NJ: Prentice-Hall.
Bandura, A. (1989). Social cognitive theory. In R. Vasta (Ed.), Annals of child
development. Vol.6. Six theories of child development (pp. 1-60). Greenwich,
CT: JAI Press.
Bandura, A., Barbaranelli, C., Caprara, G.V. & Pastorelli, C. (2001). Self-efficacy beliefs
as shapers of children’s aspirations and career trajectories. Child Development,
72(1), 187-206.
Barabasch, A. & Lakes, R.D. (2005) School-to-work transition in East Germany:
Challenges of a Market Society. Career and Technical Education Research,
30(1), 3-24.
Basu, S.J. & Barton, A.C. (2007). Developing a sustained interest in science among urban
minority youth. Journal of Research in Science Teaching, 44(3) 466-489.
Batista, G.E., and Monard, M.C. (2003). An analysis of four missing data treatment
methods for supervised learning. Applied Artificial Intelligence, 17(5), 519-533.
121
Bell, A.P. (1970). Role modelship and interaction in adolescence and young adulthood.
Developmental Psychology, 2(1), 123-128.
Betz, N. (1997). What stop women and minorities from choosing and completing majors
in science and engineering? In D. Johnson (Ed.), Minorities and girls in school:
Effects on achievement and performance (105-140). Thousand Oaks, CA: Sage.
Betz, N.E. & Hackett, G. (1981). The relationship of Career-Related Self-Efficacy
Expectations to Perceived Career Options in college Women and Men. Journal of
Vocational Behavior, 23(3), 329-345.
Betz, N.E. & Hackett, G. (1983). The relationship of mathematics self-efficacy
expectations to the selection of science-based college majors. Journal of
Counseling Psychology, 28(5), 399-410.
Betz, N.E., Hammond, M.S., & Multon, K.D. (2005). Reliability and validity of five-
level response continua for the Career Decision Self-Efficacy Scale. Journal of
Career Assessment, 13(2), 131-149.
Betz, N.E., Klein, K.L., & Taylor, K.M. (1996). Evaluation of a short form of the Career
Decision-Making Self-Efficacy scale. Journal of Career Assessment, 4(1), 47-57.
Betz, N., & Luzzo, D.A. (1996). Career assessment and the Career Decision-Making
Self-efficacy Scale. Journal of Career Assessment, 4 (4), 413-428.
122
Betz, N. E. & Taylor, K. M. (2006). Manual for the career decision self-efficacy Scale
and CDSE – Short Form. Unpublished material.
Blustein, D. L. (1989). The role of goal instability and career self-efficacy in the career
exploration process. Journal of Vocational Behavior, 35(2), 194-203.
Blustein, D.L., Chaves, A.P., Diemer, M.A., Gallagher, L.A., Marshall, K.G., Sirin, S.,
Bhati, K.S. (2002) Voices of the forgotten half: The role of social class in the
school-to-work transition. Journal of Counseling Psychology, 49(3), 311-323.
Blustein, D.L., Walbridge, M.M., Friedlander, M.L. & Palladino, D.E. (1991). Journal of
Counseling Psychology, 38(1), 39-50.
Bores-Rangel,E., Church, A.T., Szendre, D., & Reeves, C. (1990). Self-efficacy in
relation to occupational consideration and academic performance in high school
equivalency students. Journal of Counseling Psychology, 37, 407-418.
Boyer, E.L. (1983). The American high school. American Educator, 3( ), 30-45.
Boyer, K.K., Olson, J.R., Calatone, R.J., & Jackson, E.C. (2002). Print versus electronic
survey: a comparison of two data collection methodologies. Journal of
Operations Management, 20, 357-373.
Braddock, J. H. (II). (1990). Tracking the middle grades: national patterns of grouping for
instruction. Phi Delta Kappan, 71(6), 445-449.
123
Bragg, D.D. & Layton, J.D. (1995) Tech Prep Implementation in the United States: The
once and future role of community colleges. Community College Review, 22(4),
3-16.
Bratcher, W.E. (1982). The influence of the family on career selection: A family systems
perspective. The Personnel and Guidance Journal, 61(2), 87-91
Brookover, W.B., Schweitzer, J.H., Schneider, J.M., & Beady, C.H. (1978). Elementary
school social climate and school achievement, 15(2), 301-318.
Brown, B. (1984). Crisis in secondary education. Englewood Cliffs, NJ: Prentice-Hall
Publishers.
Brown, C., Darden, E.E., Shelton, M.L., & Dipoto, M.C. (1999). Career exploration and
self-efficacy of high school students: Are there urban/suburban differences?
Journal of Career Assessment, 7(3), 227-237.
Brown, C. & Lavish, L.A. (2006). Career assessment Native Americans: Role salience
and career decision-making self-efficacy. Journal of Career Assessment, 14(1),
116-129.
Brown, S. and Lent, R. (1996).A Social Cognitive framework for career choice
counseling. Career Development Quarterly, 44(4),354-66
124
Byars-Winston, A.M. & Fouad, N.A. (2008). Math and science social cognitive variables
in college students: Contributions of contextual factors in predicting goals.
Journal of Career Assessment, 16(4), 425-440.
Bynner, J. and Parsons, S. (2002) Social exclusion and the transition from school-to-
work: the case of young people not in education, employment, or training
(NEET). Journal of Vocational Behavior, 60, 289-309.
Cabello, B., & Burstein, N.D. (1995). Examining teachers’ beliefs about teaching in
culturally diverse classrooms. Journal of Teacher Education, 46(4), 285-294.
Carlone, H.B. & Johnson, A. (2007). Understanding the Science experiences of
successful women of color: Science identity as an analytic lens. Journal of
Research in Science Teaching, 44(8), 1187-1218.
Carns, A. W., Carns, M. R., Wooten, H. R., Jones, L., Raffield, P., & Heitkamp, J.
(1995). Extracurricular activities: Are they beneficial? TCA Journal, 23, 37–45.
Chaney, D., Hammond, M.S., Betz, N.E., & Multon, K.D. (2007). The reliability and
factor structure of the career decision self-efficacy scale-sf with African
Americans. Journal of Career Assessment, 15(2), 194-205.
Chavira, V. & Phinney, J.S. (1991). Adolescents’ ethnic identity, self-esteem, and
strategies for dealing with ethnicity and minority status. Hispanic Journal of
Behavioral Science, 13(2), 226-227.

125
Clark, K.B. and Clark, M.P. (1947). Racial identification and preference in Negro
children. In T.M. Newcomb and E.K. Hartley (eds.): Readings in social
psychology. New York: Holt.
Clark, M., Kaufman, S., & Pierce, R.C. (1976). Explorations of acculturation: Toward a
model of ethnic identity. Human Organization, 35(3), 231-238.
Crano, W.D. & Mellon, P.M.(1978) Causal influence of teachers’ expectations on
children’s academic performance: A cross lagged panel analysis. Journal of
Educational Psychology, 70(1), 39-49.
Creed, P.A., Patton, W., & Watson, M.B. (2002) Cross-cultural equivalence of the Career
Decision-making Self-efficacy Scale-Short form: An Australian and South
African comparison. Journal of Career Assessment, 10(3), 327-342.
Crites, J.O. (1978). Career maturity inventory (1st ed.). Monterey, CA: CTB/McGraw-
Hill
Cross, S.E. (2001). Training the scientist and engineers of tomorrow: A person-situation
approach. Journal of Applied Social Psychology, 31(2), 296-323.
Darling-Hammond, L (1997). The right to learn. San Francisco, CA: Jossey-Bass.
Davenport, Doris (1981). The pathology of racism: a conversation with Third World
wimmin. In Cherrie Moraga and Gloria Anzaldua (Eds.), This bridgecalled my
126
back: Writings by radical women of color (pp. 85-90). Watertown, MA:
Persephone Press.
Davenport, E.C., Jr., Davison, M.L., Kuang, H., Ding, S., Kim,S., & Kwak,N. (1998).
High school mathematics course-taking by gender and ethnicity. American
Educational Research Journal, 35(3), 497-514.
Denbo, S.J. & Beaulieu, L.M. (2002), Improving schools for African American students:
A reader for educational leaders. Springfield, IL: Charles C. Thomas.
Dewey, J. (1916). Democracy and Education. New York: Free Press.
Diamond, J.B., Randolph, A., & Spillane, J.P.(2004). Teachers’ Expectations and sense
of responsibility for student learning: The importance of race, class, and
organizational habitus. Anthropology & Education Quarterly, 35(1), 75-89.
Dick, T.P. & Rallis, S.F. (1991). Factors and influences on high school students’ career
choices. Journal of Research in Mathematics Education, 22(4), 281-292.
Diemer, M.A. & Blustein, D.L. (2006). Critical consciousness and career development
among urban youth. Journal of Vocational Behavior, 68(2), 220-232.
Downing, L.K. (1935). The Negro in the professions of engineering and architecture.
Journal of Negro Education, 4(1), 60-70.
Dunn, C.W. & Veltman, G.C. (1989). Addressing the restrictive career maturity patterns
of minority youth: A program evaluation. Journal of Multicultural Counseling
and Development, 17(4), 156-164.
127
Eigen, C.A., Hartman, B.W., & Hartman, P.T. (1987). Relations between family
interaction patterns and career indecision. Psychological Reports, 60(1), 87-94.
Entwisle, D.R. & Astone, N.M. (1994). Some practical guidelines for measuring youth’s
race/ethnicity and socioeconomic status. Child Development, 65(6), 1521-1540.
Erikson, E.H.(1968). Identity, youth and crisis. New York: W.W. Norton & Company,
Inc.
Ernest, J. (1976). Mathematics and sex. The American Mathematical Monthly, 83(8),
595-614.
Eyerman, R. (2001). Cultural trauma: Slavery and the formation of African American
identity. United Kingdom: Cambridge Press
Fennema, E. (1974). Mathematics Learning and the Sexes: A Review. Journal for
Research in Mathematics Education, 5(3), 126-139.
Ferguson, R. (1998). Teachers' perceptions and expectations and the Black-White test
score gap. In C. Jencks and M. Phillips (Eds.), The Black-White test score gap
(pp. 273-317). Washington, DC: Brookings Institution Press.
Fergusson, D.M. & Woodward, L.J. (2000). Teenage pregnancy and female educational
underachievement: A prospective study of a New Zealand birth cohort. Journal of
Marriage and the Family, 62(1), 147-161.
128
Ferry, T.R., Fouad, N.A. & Smith, P.L. (2000). The role of family context in a social
cognitive model for career-related choice behavior: A math and science
perspective. Journal of Vocational Behavior, 57(3), 348-364.
Fine, M., Burns, A., Payne, Y., &Torre, M. (2004) Civic Lessons: The Color and Class of
Betrayal. Teachers College Record, 106(11), 2193–2223.
Flores, Y., Ojeda,L., Huang, Y., Gee, D, & Lee, S. (2006). The relation of acculturation,
problem-solving appraisal, and career decision-making self-efficacy to Mexican
American high school students’ educational goals. Journal of Counseling
Psychology, 53(2), 260-266.
Ford, D.Y. (1991). Self-perceptions of social, psychological, and cultural determinants of
achievement among gifted Black students: A paradox of underachievement.
Unpublished doctoral dissertation, Cleveland State University, Cleveland, OH.
Ford,D.Y., & Harris, J.J. II (1996). Perceptions and attitudes of black students toward
school, achievement, and other educational variables. Child Development, 67(3),
1141-1152.
Fouad, N.A., & Bingham, R.P. (1995). Career counseling with racial and ethnic
minorities. In B.W. Walsh and S.H. Osipow (Eds.) Handbook of Vocational
Psychology. Theory, Research, and Practice. (pp. 331-366). Mahwah, NJ:
Lawrence Erlbaum Associates.

129
Fouad, N.A. & Brown, M.T.(2000). Role of race and social class in development:
Implications for counseling psychology. In S.D. Brown & R.W. Lent (Eds.),
Handbook of counseling psychology (379-408). New York: john Wiley.
Fouad, N.A. & Guillen, A. (2006). Outcome expectations: Looking to the past and
potential future. Journal of Career Assessment, 14(1), 130-142.
Fouad, N.A., Kantamneni, N., Smothers, M.K., Chen, Y., Fitzpatrick, M., & Terry, S.
(2008). Asian American career development: A qualitative analysis. Journal of
Vocational Behavior, 72(1), 43-59.
Fouad, N.A. & Smith, P.L. (1996). A test of a social cognitive model for middle school
students: Math and science. Journal of Counseling Psychology, 43(3), 338-346.
Fouad, N.A., Smith, P.L., & Enchos, L. (1997). Reliability and validity evidence for the
middle school self-efficacy scale. Measurement & Evaluation in Counseling &
Development, 30(1), 15p.
Gainor,K.A. & Lent, R.W. (1998) Social cognitive expectations and racial identity
attitudes in predicting the math choice intentions of Black college students.
Journal of Counseling Psychology, 45, 403-413.
Gamoran, A. (2001). American Schooling and educational inequality: A forecast for the
21st century. Sociology of Education, 74(0), 135-153.

130
Gamoran, A., & Berends, M. (1987). The effects of stratification in secondary schools:
Synthesis of survey and ethnographic research. Review of Educational Research,
57 (4), 415-435.
Gamoran, A., & Mare, R.D. (1989). Secondary School Tracking and Educational
Inequality: Compensation, Reinforcement, or Neutrality? American Journal of
Sociology, 94(5), 1146-1183.
Garcia, M. & Lega, L.I. (1979). Development of a Cuban ethnic identity questionnaire.
Hispanic Journal of Behavioral Science, 1(3), 247-261.
George, Y.S., Neale, D.S., Van Horne, V., Malcom, S.M.(2001). In pursuit of a diverse
Science, Technology, Engineering, and Mathematics Workforce: Recommended
research priorities to enhance participation by underrepresented minorities.
American Association for the Advancement of Science: Washington, DC.
Germeijs, V. & Verscheren, K. (2006). High school students’ career decision-making
process: Development and validation of the study choice task inventory. Journal
of Career Assessment, 14(4), 449-471.
Germeijs, V. & Verscheren, K. (2007). High school students’ career decision-making
process: Consequences for choice implementation in higher education. Journal of
Vocational Behavior, 70(2 ), 223-241.
Gianakos, I. (1999). Patterns of career choice and career decision-making self-efficacy.
Journal of Vocational Behavior, 54(2), 244-258.
131
Gianakos, I.(2001). Predictors of career-decision-making self-efficacy. Journal of Career
Assessment, 9(2), 101-114.
Gibson, D. (2004). Role models in career development: New directions for theory and
research. Journal of Vocational Behavior, 65(1), 134-156.
Gilbert, D. & Kahl, J.A. (1993). The American class structure: A new synthesis (4th ed.).
Belmont, CA: Wadsworth.
Gloria,A.M. & Hird, J.S. (1999). Influences of ethnic and nonethnic variables on the
career decision-making self-efficacy of college students. Career Development
Quarterly, 48(2), 157-174.
Good, T.L. (1981). Teacher expectations and student perceptions: A decade of research.
Educational Leadership, 38(5), 415-422.
Gordon, H.R.D. (2008). The history and growth of career and technical education in
America. 3rd Edition. Long Grove, IL: Waveland Press, Inc.
Gore, P.A. & Leuwerke, W.C. (2000). Predicting occupational considerations: A
comparison of self-efficacy beliefs, outcome expectations, and person-
environment congruence. Journal of Career Assessment, 8(3), 237-250.
Graduation in the United States. (2008).[Electronic version]. Education Week, 27(40),
34-36.
132
Grantham, T. G., Ford, D.Y.(2003). Beyond self-concept and self-esteem: Racial identity
and gifted African American students. High School Journal, 87(1), 18-29.
Grayson, L.P.(1980) A brief history of engineering education in the United States. IEEE
Transactions on Aerospace and electronic systems, 16(3), 373-392.
Grolnick, W.S. & Ryan, R.M. (1989). Parent styles associated with children's self-
regulation and competence in school. Journal of Educational Psychology, 81(2),
143-154.
Grotevant, H.D., Cooper, C.R., & Kramer, K. (1986). Exploration as a predictor of
congruence in adolescents’ career choices. Journal of Vocational Behavior, 29,
201-215.
Gushue, G.V. (2006). The relationship of ethnic identity, career descion-making self-
efficacy and outcome expectations among Lation/a high school students. Journal
of Vocational Behavior, 68(1), 85-95.
Gwilliam, L.R. & Betz, N.E.(2001). Validity measures of math- and science-related self-
efficacy for African Americans and European Americans. Journal of Career
Assessment, 9(3), 261-281.
Hackett, G. & Betz,N.E (1981). A self-efficacy approach to the career development of
women. Journal of Vocational Behavior,18 (3), 326-39.
133
Hackett, G. & Betz,N.E (1989). An exploration of the mathematics self-
efficacy/mathematics performance correspondence. Journal for Research in
Mathematics Education, 20(3), 261-273.
Hackett, G. & Betz,N.E., Casas, J.M. & Rocha-Singh, I.A. (1992). Gender, ethnicity, and
social cognitive factors predicting the academic achievement of students in
engineering. Journal of Counseling Psychology, 39(4), 527-538.
Hackett, G. & Lent,R.W.(1992). Theoretical advances and current inquiry in career
psychology In S. D. Brown & R.W. Lent (eds.), Handbook of counseling
psychology (ed.), pp.419-451). New York: Wiley.
Hall, E. R. & Post-Krammer,P. (1987). Black mathematics and science majors: why so
few?. The Career Development Quarterly, 35(3), 206-19.
Hall, M. L., & Allen, W. R. (1982). Race consciousness and achievement: Two issues in
the study of Black graduate/professional students. Integrated Education, 20(1),
56–61.
Hampton, N.Z. (2005). Testing for the structure of the Career Decision Self-efficacy
Scale-Short form among Chinese college students. Journal of Career Assessment,
13(1), 98-113.
Hansen, D. T. (2002). Dewey's Conception of an Enviornment for Teaching and
Learning. Curriculum Inquiry , 267-280.
134
Hansen, K. (1999). A qualitative assessment of student interest in science education.
Studies in Educational Evaluation, 25(4), 399-414.
Hargrove, B.K., Creagh, M.G., & Burgess, B.L. (2002) Family interaction patterns as
predictors of vocational identity and career decision-making self-efficacy. Journal
of Vocational Behavior, 61(2), 185-201.
Hauser, R.M. (1994). Measuring socioeconomic status in studies of child development.
Child Development, 65(6), 1541-1545.
Herman, J. & Yeh, J. (1983). Some effects of parent involvement in schools. The Urban
Review, 15, 11-17.
Hinman, B. (2005). A stranger in my own house: The story of W.E.B. DuBois.
Greensboro, NC: Morgan Reynolds Publishing.
Holland, J. L. (1959). A theory of vocational choice. Journal of Counseling Psychology,
6(1), 35–45.
Hollingshead, A.B. (1975). Four factor index of social status. Unpublished paper.
Retrieved November 2008, from Department of Sociology, Yale University, New
Haven, CT website: http://www.yale.edu/sociology/faculty/
Hoover-Dempsey, K.V., Bassler, O.C., & Brissie, J.S. (1987). Parental involvement:
Contributions of teacher efficacy, school socioeconomic status, and other school
characteristics. American Educational Research Journal, 24(3), 417-435.
135
Jones, L.V. (1984). White-Black achievement differences: The narrowing gap. American
Psychologist, 39(11), 1207-1213.
Kenny, M.E., Gualdron, L., Scanlon, D., Sparks, E., Blustien, D.L., & Jernigan, M.
(2007). Urban adolescents’ constructions of supports and barriers to educational
and career attainment. Journal of Counseling Psychology, 54(3), 336-343.
Kerpelman, J., Schoffner, M.F., & Ross-Griffin, S. (2002). African American mothers’
and daughters’ beliefs about possible selves and their strategies for reaching the
adolescents’ future academic and career goals. Journal of Youth and Adolescence,
31(4), 289-302.
Kershaw, T. (1992). The effects of educational tracking on the social mobility of African
Americans. Journal of Black Studies, 23(1), 152-169.
Kinnier, R.T., Brigman, L., & Noble, F.C. (1990) Career Indecision and family
enmeshment. Journal of Counseling and Development, 68(3), 309-312.
Lam,P.C., Srivatsan,T., Doverspike,D.,Vesalo, J., & Mawasha, P.R. (2005). A Ten year
assessment of the pre-engineering program for under-represented, low income
and/or first generation college students at The University of Akron. Journal of
STEM Education, 6(3&4), 14-20.
Landis, R.B. (1976). Improving the retention of minority engineering students.
Engineering Education, 66(7), 737-739.
136
Lareau, A., & Horvat, E.M. (1999). Moments of Social Inclusion and Exclusion Race,
Class, and Cultural Capital in Family-School Relationships. Sociology of
Education, 72(1), 37-53.
Lau, S. & Roeser, R.W. (2002). Cognitive abilities and motivational processes in high
school students’ situational engagement and achievement in science. Educational
Assessment, 8(2), 139-162.
Lease, S.H. (2006). Factors predictive of the range of occupations considered by African
American Juniors and Seniors in High School. Journal of Career Development,
32(4), 333-350.
Lent, R.W., Brown, S.D., Brenner,B., Chopra, S.B., Davis, T., Talleyrand, R., et. al
(2001). The role of contextual supports and barriers in the choice of math/science
educational options: A test of social cognitive hypotheses. Journal of Counseling
Psychology, 48(4), 474-483.
Lent, R.W., Brown, S.D. & Hackett, G. (1994). Toward a unifying social cognitive
theory of career and academic interest, choice, and performance. Journal of
Vocational Behavior, 45(1), 79-122.
Lent,R.W., Brown,S.D., & Larkin,K.C. (1984). Relationship of self-efficacy expectations
to academic achievement and persistence. Journal of Counseling Psychology,
31(4), 356-362.

137
Lent, R.W., Brown, S.D., & Larkin, K.C. (1986). Self-efficacy in the prediction of
academic performance and perceived career options. Journal of Counseling
Psychology, 33(3), 265-269.
Lent, R.W., Brown, S.D., & Larkin, K.C. (1987). Comparison of three theoretically
derived variables in predicting career academic behavior: Self-efficacy, interest
congruence, and consequence thinking. Journal of Counseling Psychology, 34(3),
293-298.
Lent,R.W. & Hackett,G. (1987). Career self-efficacy: Empirical status and future
directions. Journal of Vocational Behavior, 30(3), 347-382.
Lent,R.W., Hackett,G. & Brown, S.D. (1999). A social cognitive view of school-to-work
transition. Career Development Quarterly, 47(4), 297-311.
Lent, R.W., Larkin, K.C., & Brown, S.D. (1989). Relation of self-efficacy to inventoried
vocational interests. Journal of Vocational Behavior, 34(3), 279-288.
Lent, R.W., Lopez, F.G., & Bieschke, K. (1991) Mathematics self-efficacy: Sources and
relation to science based career choice. Journal of Counseling Psychology, 38(4),
424-430.
Leong, F. T. L., & Chou, E. L. (1994). The role of ethnic identity and acculturation in the
vocational behavior of Asian Americans: An integrative review. Journal of
Vocational Behavior, 44(2), 155–172.

138
Leslie, L., McClure, G.T., & Oaxaca, R.L. (1998). Women and minorities in science and
engineering: A Life sequence analysis. The Journal of Higher Education, 69(3),
239-276.
Leuwerke, W.C., Robbins, S., Sawyer, R., & Hovland, M. (2004). Predicting Engineering
major status from Mathematics achievement and interest congruence. Journal of
Career Assessment, 12(2), 135-149.
Lewis, T., and Cheng, S. (2006). Tracking, expectations, and the transformation of
vocational education. American Journal of Education, 113 (1), 67-99.
Lightfoot, S.L. (1981). Toward conflict and resolution: Relationships between families
and schools. Theory Into Practice, 20(2), 97-103.
Lin, Y.Y. (2006). An examination of the relationships between organizational learning
culture, structure, organizational innovativeness and effectiveness: Evidence from
Taiwanese Organizations. Unpublished doctoral dissertation, University of
Minnesota.
Linnehan, F. (2001).The relation of a Work-Based mentoring program to the academic
performance and behavior of African American students. Journal of Vocational
Behavior,59(3), 310-325.
Linnehan, F., Weer, C., & Uhl, J.(2005). African-American students’ early trust beliefs in
work-based mentors. Journal of Vocational Behavior, 66(3), 501-515.
139
Longstreet, W.S. (1978) Aspects of ethnicity: Understanding differences in pluralistic
classroom. New York, NY: Teachers College Press.
Lopez, F.G. (1989). Current dynamics, trait anxiety, and academic adjustment: Test of a
family-based model of vocational identity. Journal of Vocational Behavior, 35(1),
76-87.
Lopez, F.G. & Andrews, S. (1987). Career Indecision: A family systems perspective.
Journal of Counseling and Development, 65(6), 304-307.
Lopez, F.G., Lent, R.W., Brown, S.D. & Gore,P.A., Jr. (1997). Role of social-cognitive
expectations in high school students’ mathematics related interest and
performance. Journal of Counseling Psychology, 44(1), 44-52.
Lucas, S..R. & Berends, M. (2002). Sociodemographic diversity, correlated
achievement, and De Facto tracking. Sociology of Education, 75, 328-348.
Luzzo, D. A. (1993). Reliability and validity testing of the career decision-making self-
efficacy scale. Measurement and Evaluation in Counseling and Development,
26(2), 137-142.
Luzzo, D.A., Hasper, P., Albert, K.A., Bibby, M.A, & Martinelli, E.A. (1999). Effects of
self-efficacy enhancing interventions on math/science self-efficacy and career
interest, goals, and actions of career undecided college students. Journal of
Counseling Psychology, 46(3), 233-243.
140
Maher, E. J., & Kroska, A. (2002). Social status determinants of control in individuals’
accounts of their mental illness. Social Science and Medicine, 55, 949-961.
Marcia, J. F. (1980). Identity in adolescence. In Adelson, J. (ed.), Handbook of
Adolescent Psychology. Wiley, New York.
Masters, G.N. & Hyde, N.H. (1984). Measuring attitude to school with a latent trait
model. Applied Psychological Measurement, 8(1), 39-48.
Matthews, W. (1984). Influences on the learning and participation of minorities in
mathematics. Journal for Research in Mathematics Education, 15(2), 84-95.
McDermott, R., & Raley, J. D. (2007). From John Dewey to an Anthropolgy of
Education. Teachers College Record , 1820-1835.
Meece, J.L., Parsons, J.E., Kaczala, C.M., Goff, S.B., & Futterman,R. (1982). Sex
differences in math achievement: Toward a model of academic choice.
Psychological Bulletin, 91(2), 324-348.
Mehan,H. (1992). Understanding inequality in schools: The contribution of interpretive
studies. Sociology of Education, 65(1), 1-20.
Middleton, E.B. & Loughead, T.A. (1993). Parental influence on career development: An
integrative framework for adolescent career counseling. Journal of Career
Development, 19(3), 161-173.
Moles, O.C. (1982).Synthesis of recent research on parent participation on children’s
education. Educational Leadership, 40(2), 44-47.
141
Moody, F.(1980). The history of Blacks in vocational education. Journal of VocEd,
55(1), 30-34.
Moore, J.M. (2003). Booker T. Washington, W.E.B. DuBois, and the struggle for racial
uplift. Wilmington, DE: Scholarly Resources, Inc.
Mortimer, J.T., Zimmer-Gembeck, M.J., & Holmes, M. (2002). The process of
occupational decision making: Patterns during the transition to adulthood. Journal
of Vocational Behavior, 61, 439-465.
National Science Foundation, Division of Science Resources Statistics. 2006. S&E
Degrees, by Race/Ethnicity of Recipients: 1995–2004. NSF 07-308. Susan T. Hill
and Maurya M. Green, project officers. Arlington, VA.
Nauta, M.M. & Kahn, J.H. (2007). Identity status, consistency and differentiation of
interests, and career decision self-efficacy. Journal of Career Assessment, 15(1),
55-65.
Navarro, R.L., Flores, L.Y., & Worthington, R.L. (2007). Mexican American middle
school students’ goal intentions in mathematics and science: A test of social
cognitive career theory. Journal of Counseling Psychology, 54(3), 320-335.
Ng, T.W. & Feldman, D.C. (2007) The school-to-work: A role identity perspective.
Journal of Vocational Behavior, 71 , 114-134.
Norman,O., Ault,C.R. Jr., Bentz, B., & Meskimen,L. (2001) The Black-White
“Achievemnet Gap” as a perennial challenge of urban science education: A

142
sociocultural and historical overview with implications for research and practice.
Journal of Research in Science Teaching, 38(10), 1101-1114.
Oakes, J. (2005). Keeping track: How schools structure inequality (2nd ed). New Haven,
CT: Yale University Press.
Oakes, J & Guiton, G. (1995). Matchmaking: The dynamics of high school
tracking decisions. American Educational Research Journal, 32 (1), 3-33.
O’Brien,K.M., Bikos, L.H., Epstein, K.L., Flores, L.Y., Dukstein, R.D., & Kamatuka,
N.A. (2000). Enhancing the career decision-making self-efficacy of upward
bound students. Journal of Career Development, 26(4), 277-293.
Ogbu, J. U. (1987). Variablity in Minority School Performance: A Problem in Search of
an Explanation. Anthropology & Education Quarterly, 18(4), 312-334.
Ojeda,L. Huang,Y., Gee,D., & Lee, S. (2006). The relation of acculturation, Problem-
solving appraisal, and career decision-making self-efficacy to Mexican American
high school students. Journal of Counseling Psychology, 53(2), 260-266.
Osipow, S.H. (1983). Theories of career development(3rd ed). Englewood Cliffs, NJ:
Prentice-Hall.
Owens, T.J. (1992) Where do we go from here? Post-high school choices of American
men. Youth & Society, 23, 452-477.

143
Oyserman, D. Brickman, D. & Rhodes, M. (2007). School success, possible selves, and
parent school involvement. Family Relations, 56(5), 479-489.
Oyserman, D. Bybee, D., & Terry, K. (2007). Racial-ethnic identity: Content and
consequences for African American, Latino, and Latina youth. In A. Fuligi (Ed.),
Contesting stereotypes and creating identities: Social categories, social identities,
and educational participation. New York: Russell Sage Foundation.
Oyserman, D., Gant,L., Ager, J. (1995). A socially contextualized model of African-
American identity: Possible selves and school persistence. Journal of Personality
and Social Psychology, 69(6), 1216-1232.
Oyserman, D. & Harrison, K. (1998). Implications of cultural context: African American
identity and possible selves. In Swim, J.K., and Stangor ,C. (eds.), Prejudice: The
Target’s Perspective. Academic Press, San Diego, CA, 281-300.
Oyserman, D., Harrison, K., Bybee, D. (2001). Can racial identity be promotive of
academic efficacy? International Journal of Behavioral Development, 25(4), 379-
385.
Page,R., & Valli, L. (Eds.). (1990). Curriculum differentiation: Interpretive studies in
U.S. secondary schools. Albany: State University of New York Press.
Palmer, S., & Cochran, L. (1988). Parents as agents of career development. Journal of
Counseling Psychology, 35, 71-76.

144
Parsons, E.C.(1997). Black high school females’ images of the scientist: expression of
culture. Journal of Research in Science Teaching, 34(7), 745-768.
Parsons, J.E., Alder, T.F., & Kaczala, C.M. (1982). Socialization of achievement
attitudes and beliefs: Parental influences. Child Development, 53(2), 310-321.
Payne, R.S.(1994). The relationship between teachers’ beliefs and sense of efficacy and
their significance to urban LSES minority students. The Journal of Negro
Education, 63(2), 181-196.
Penick, N.I. & Jepsen, D.A. (1992). Family functioning and adolescent career
development. Career Development Quarterly, 40(3), 1-15.
Perron, J., Vondracek, F.W., Skorikov, V.B., Tremblay, C., & Corbière, M. (1998). A
longitudinal study of vocational maturity and ethnic identity development.
Journal of Vocational Behavior, 52(3), 409-424.
Peterson, S.L. (1993). Career decision-making self-efficacy and institutional integration
of underprepared college students. Research in Higher Education 34(6), 659-685.
Peterson, S.L. & delMas, R.C. (1998). The component structure of career decision-
making self-efficacy for underprepared college students. Journal of Career
Development, 24 (3), 209-225.

145
Phillips, S.D., Blustein,D.L., Jobin-Davis, K., & White, S.F. (2001) Preparation for the
school-to-work transition: The views of high school students. Journal of
Vocational Behavior, 61, 202-216.
Phinney, J. (1989). Stages of ethnic identity in minority group adolescents. Journal of
Early Adolescence,9(1-2), 34-49.
Phinney, J.S.(1990). Ethnic Identity in Adolescents and Adults: Review of Research.
Psychological Bulletin, 108(3), 499-514.
Phinney, J.S.(1996). When we talk about American ethnic groups, what do we mean?.
American Psychologist, 51(9), 918-927.
Phinney, J.S. & Alpuria, L.L.(1996). At the interface of cultures: Multiethnic/multiracial
high school and college students. The Journal of Social Psychology, 136(2), 139-
158.
Phinney, J.S. & Chavira, V.(1992). Ethnic identity and self-esteem: an exploratory
longitudinal study. Journal of Adolescence, 15(3), 271-281.
Phinney, J.S. & Ong, A.D.(2007). Conceptualization and measurement of ethnic
identity:Current status and future directions. Journal of Counseling Psychology,
54(2), 271-281.
Post, P., Stewart, M.A., & Smith, P.L. (1991). Self-efficacy, interest, and consideration of
math/science and non-math/science occupations among black freshmen. Journal
of Vocational Behavior, 38, 179-186.
146
Powell, L. (1990). Factors associated with the underrepresentation of African American
in Mathematics and Science. The Journal of Negro Education, 59(3), 292-298.
Reyes, L.H., & Stanic, G. (1985). A review of the literature on Blacks and mathematics.
Paper presented at the Annual Meeting of the American Educational Research
Association, Chicago, IL.
Rist, R.C. (1970). Student social class and teacher expectations: The self-fulfilling
prophecy in ghetto education. Harvard Educational Review, 40(3), 411-451.
Robbins, S. (1985). Validity estimates for the Career Decision-Making Self-Efficacy
Scale. Measurement and Evaluation in Counseling and Development, 18(2),64-
71.
Roscigno, V.J. (1998). Race and the reproduction of educational disadvantage. Social
Forces, 76(3), 1033-1061.
Roscigno, V.J. & Ainsworth-Darnell, J.W. (1999). Race, cultural capital, and educational
resources: Persistent inequalities and achievement returns. Sociology of
Education, 72(3), 158-178.
Roe, A. (1956). The psychology of occupations. New York, NY: Wiley.
Rubin,D.B. (1976). Inference and missing data. Biometrika, 63(3), 581-592. Sauermann, H. (2005). Vocational choice: A decision making perspective. Journal of
Vocational Behavior, 66(2), 273-303.
147
Schulenberg, J.E., Vondracek, F.W., & Couter, A.C. (1984). The influence of the family
on vocational development. Journal of Marriage and the Family, 46(1), 129-143.
Schulthesis, D.P. & Blustein, D.L. (1994). Contributions of family relationship factors to
the identity formation process. Journal of Counseling and Development, 73(2),
159-166.
Schunk, D.H. (1984). Sequential attributional feedback and children's achievement
behaviors. Journal of Educational Psychologist, 76, 1159-1169.
Schunk, D.H. (1991). Self-efficacy and academic motivation. Educational Psychologist,
26(3&4), 207-231.
Sells, L.W. (1982). Leverage for equal opportunity through mastery of mathematics. In
S.M. Humphries (Ed.), Women and minorities in science (7-26). Boulder, CO:
Westview Press.
Shaffer, S., Ortman, P. E., & Denbo. S. J. (2002). The effects of racism, socioeconomic
class and gender on the academic achievement of African American students. In
S. J.Denbo & L. M. Beaulieu (Eds.), Improving schools for African American
students: A reader for educational leaders (pp. 19-29). Springfield, IL: Charles C.
Thomas.
Shiber, J.G. (1999). Teaching nontraditional students. Journal of Clinical Education,
76(12), 1615-1616.
Sirin, S.R. (2005). Socioeconomic status and academic achievement: A meta-analytic
review of research. Review of Educational Research, 75(3), 417-453.
148
Snedden, D. (1910). The problem of vocational education. Boston: Houghton Mifflin.
Snedden, D., & Dewey, J. (1977). Two Communications. Curriculum Inquiry , 33-39.
Spencer,M.B.,Swanson,D.P., & Cunningham,M. (1991). Ethnicity, ethnic identity, and
competence formation: Adolescent transition and cultural transformation. Journal
of Negro Education, 60(3), 366-387.
Stevenson, D.L. & Baker, D.P. (1987) The family-school relation and the child's school
performance. Child Development, 58(5), 1348-1358.
Super, D.E. (1953). A theory of vocational development. American Psychologist, 8(5),
185-190.
Super, D.E. & Thompson, A.S. (1979). A six-scale, two factor, measure of adolescent
career or vocational maturity. Vocational Guidance Quarterly, 28(1), 6-15.
Supple, A.J., Ghazarian, S.R., Frabutt, J.M., Plunkett, S.W., & Sands, T. (2006).
Contextual influences on Latino adolescent ethnic identity and academic
outcomes. Child Development, 77(5), 1427-1433.
Swanson, J.L.& Fouad, N.A.(1999). Applying theories of Person-Environment Fit to the
transition from school to work. Career Development Quarterly, 47(4), 337-347.
Tajfel, H. (1981). Human groups and social categories: Studies in social psychology.
New York, NY: Cambridge University Press.
149
Tajfel, H. & Turner, J.C. (1986). The social identity theory of intergroup behavior. New
York, NY : Cambridge University Press.
Tang, M., Fouad, N.A., & Smith, P.L. (1999). Asian Americans’ career choices: A path
model to examine factors influencing their career choices. Journal of Vocational
Behavior, 54(1), 142-157.
Taylor, K.M & Betz, N.E. (1983). Applications of self-efficacy theory to the
understanding and treatment of career indecision. Journal of Vocational Behavior,
22(1), 63-81.
Taylor, K. M., & Pompa, J. (1990). An examination of the relationships among career
decision-making self-efficacy, career salience, locus of control, and vocational
indecision. Journal of Vocational Behavior, 37(1), 17-31.
Ting-Toomey, S. (1981). Ethnic identity and close friendship in chinese-american college
students. International Journal of Intercultural Relations, 5(4), 383-406.
The National Academy of Engineering. (2004). The Engineering of 2020: Visions of
engineering in the new century. The National Academy Press.
Trusty, J., Robinson, C. R., Plata, M., & Ng, K. M. (2000). Effects of gender,
socioeconomic status, and early academic performance on post secondary
educational choice. Journal of Counseling and Development, 78, 463-472.
150
Umaña-Taylor, A.J., Yazedjian, A.,& Bámaca-Gómez, M. (2004). Developing the ethnic
identity scale using Erikson and Social identity perspectives. An International
Journal of Theory and Research, 4(1), 9-38.
Waller, B. (2006). Math interest and choice intentions of non-traditional African-
American college students. Journal of Vocational Behavior, 68(3), 538-547.
Wharton, D.E. (1992). A struggle worthy of note: The engineering and technological
education of Black Americans. Wesport, CN: Greenwood Press.
Whiston, S.C.(1996). The relationship among family interaction patterns and career-
indecision and career decision-making self-efficacy. Journal of Career
Development, 23(2), 137-149.
Winfield, L.F. (1986). Teacher beliefs toward academically at risk students in inner urban
schools. The Urban Review, 18(4), 253-268.
Woodson, C.G. (1933). The mis-education of the negro. Trenton,NJ: African World
Press, Inc.
Worthington, R.L. & Juntunen, C.L. (1997) The vocational development of non-college-
bound youth: Counseling psychology and the school-to-work transition
movement. The Counseling Psychologist, 25(3), 323-363.
151
Zeldin, A.L., Britner, S.L., & Pajares, F. (2007). A comparative study of the self-efficacy
beliefs of successful men and women in mathematics, science, and technology
careers. Journal of Research in Science Teaching, 1-27.
Zeldin, A.L.& Pajares, F. (2000). Against the odds: Self-efficacy beliefs of women in
mathematical, scientific, and technological careers. American Educational
Research Journal, 37(1), 215-246.
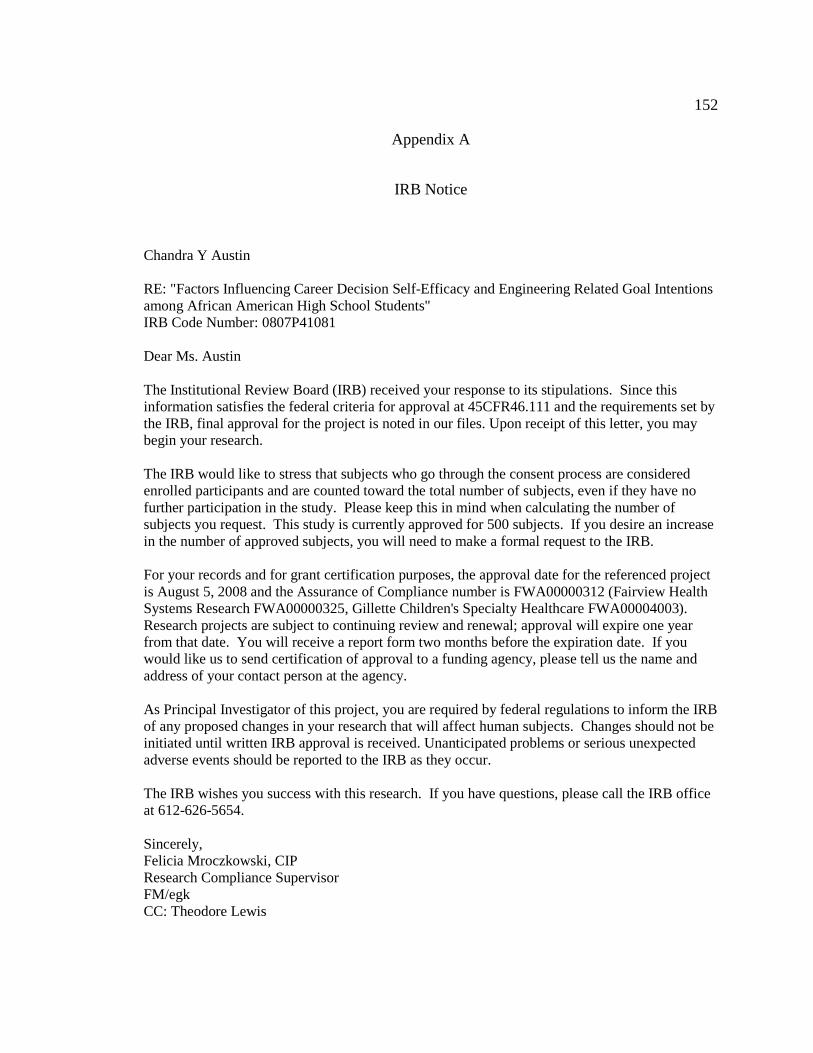
152
Appendix A
IRB Notice
Chandra Y Austin RE: "Factors Influencing Career Decision Self-Efficacy and Engineering Related Goal Intentions among African American High School Students" IRB Code Number: 0807P41081 Dear Ms. Austin The Institutional Review Board (IRB) received your response to its stipulations. Since this information satisfies the federal criteria for approval at 45CFR46.111 and the requirements set by the IRB, final approval for the project is noted in our files. Upon receipt of this letter, you may begin your research. The IRB would like to stress that subjects who go through the consent process are considered enrolled participants and are counted toward the total number of subjects, even if they have no further participation in the study. Please keep this in mind when calculating the number of subjects you request. This study is currently approved for 500 subjects. If you desire an increase in the number of approved subjects, you will need to make a formal request to the IRB. For your records and for grant certification purposes, the approval date for the referenced project is August 5, 2008 and the Assurance of Compliance number is FWA00000312 (Fairview Health Systems Research FWA00000325, Gillette Children's Specialty Healthcare FWA00004003). Research projects are subject to continuing review and renewal; approval will expire one year from that date. You will receive a report form two months before the expiration date. If you would like us to send certification of approval to a funding agency, please tell us the name and address of your contact person at the agency. As Principal Investigator of this project, you are required by federal regulations to inform the IRB of any proposed changes in your research that will affect human subjects. Changes should not be initiated until written IRB approval is received. Unanticipated problems or serious unexpected adverse events should be reported to the IRB as they occur. The IRB wishes you success with this research. If you have questions, please call the IRB office at 612-626-5654. Sincerely, Felicia Mroczkowski, CIP Research Compliance Supervisor FM/egk CC: Theodore Lewis
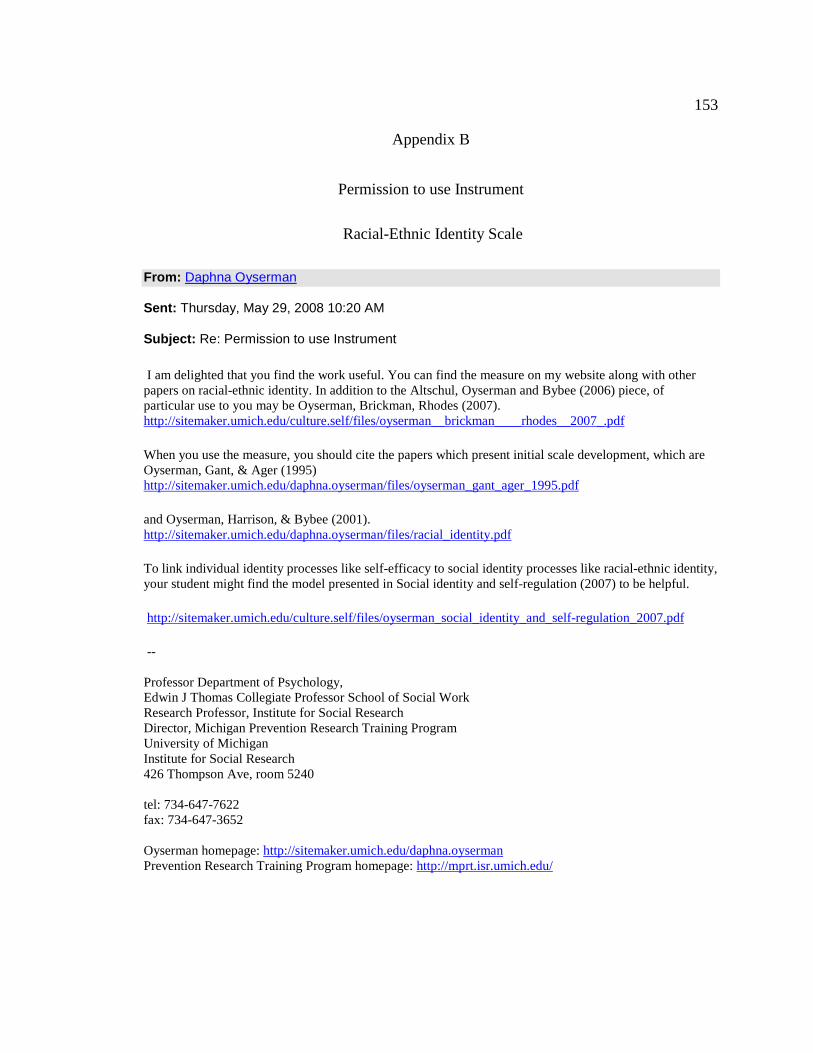
153
Appendix B
Permission to use Instrument
Racial-Ethnic Identity Scale
From: Daphna Oyserman
Sent: Thursday, May 29, 2008 10:20 AM
Subject: Re: Permission to use Instrument
I am delighted that you find the work useful. You can find the measure on my website along with other papers on racial-ethnic identity. In addition to the Altschul, Oyserman and Bybee (2006) piece, of particular use to you may be Oyserman, Brickman, Rhodes (2007). http://sitemaker.umich.edu/culture.self/files/oyserman__brickman____rhodes__2007_.pdf
When you use the measure, you should cite the papers which present initial scale development, which are Oyserman, Gant, & Ager (1995) http://sitemaker.umich.edu/daphna.oyserman/files/oyserman_gant_ager_1995.pdf
and Oyserman, Harrison, & Bybee (2001). http://sitemaker.umich.edu/daphna.oyserman/files/racial_identity.pdf
To link individual identity processes like self-efficacy to social identity processes like racial-ethnic identity, your student might find the model presented in Social identity and self-regulation (2007) to be helpful.
http://sitemaker.umich.edu/culture.self/files/oyserman_social_identity_and_self-regulation_2007.pdf
-- Professor Department of Psychology, Edwin J Thomas Collegiate Professor School of Social Work Research Professor, Institute for Social Research Director, Michigan Prevention Research Training Program University of Michigan Institute for Social Research 426 Thompson Ave, room 5240 tel: 734-647-7622 fax: 734-647-3652 Oyserman homepage: http://sitemaker.umich.edu/daphna.oyserman Prevention Research Training Program homepage: http://mprt.isr.umich.edu/

154
Appendix C
Permission to Use Instrument
Math/Science Self-Efficacy, Interest, and Expectations Scales
----- Original Message -----
From: "Nadya Fouad" <[email protected]> Sent: Thursday, May 29, 2008 8:54 AM Subject: Re: Permission to use instrument Certainly, but I have that file on an old floppy disk, and a new computer without a disk drive. So I'll need to get the copies scanned and put in a pdf. I'm heading out of town (actually to the Cities for the Accreditation Assembly) but can do it next week. Nadya Nadya A. Fouad Department of Educational Psychology PO 413 UW-Milwaukee Milwaukee, WI 53201-0413 414-229-6830 (phone) 414-229-4939 (fax)
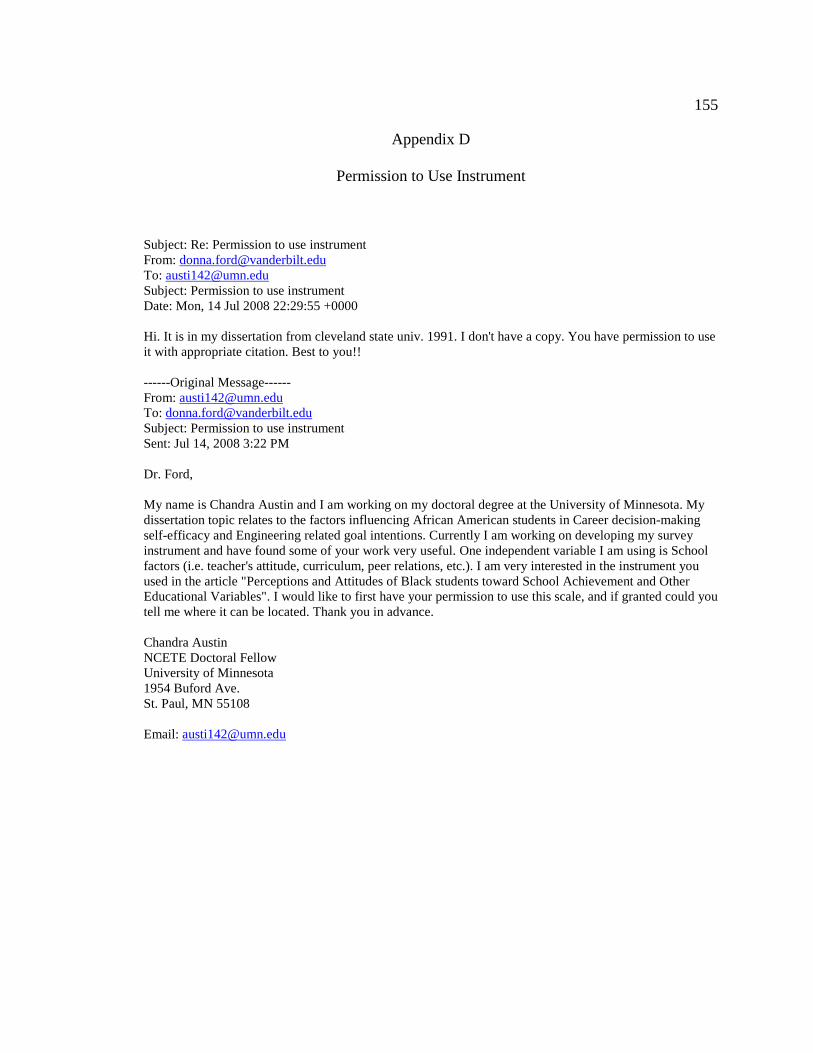
155
Appendix D
Permission to Use Instrument
Subject: Re: Permission to use instrument From: [email protected] To: [email protected] Subject: Permission to use instrument Date: Mon, 14 Jul 2008 22:29:55 +0000 Hi. It is in my dissertation from cleveland state univ. 1991. I don't have a copy. You have permission to use it with appropriate citation. Best to you!! ------Original Message------ From: [email protected] To: [email protected] Subject: Permission to use instrument Sent: Jul 14, 2008 3:22 PM Dr. Ford, My name is Chandra Austin and I am working on my doctoral degree at the University of Minnesota. My dissertation topic relates to the factors influencing African American students in Career decision-making self-efficacy and Engineering related goal intentions. Currently I am working on developing my survey instrument and have found some of your work very useful. One independent variable I am using is School factors (i.e. teacher's attitude, curriculum, peer relations, etc.). I am very interested in the instrument you used in the article "Perceptions and Attitudes of Black students toward School Achievement and Other Educational Variables". I would like to first have your permission to use this scale, and if granted could you tell me where it can be located. Thank you in advance. Chandra Austin NCETE Doctoral Fellow University of Minnesota 1954 Buford Ave. St. Paul, MN 55108 Email: [email protected]
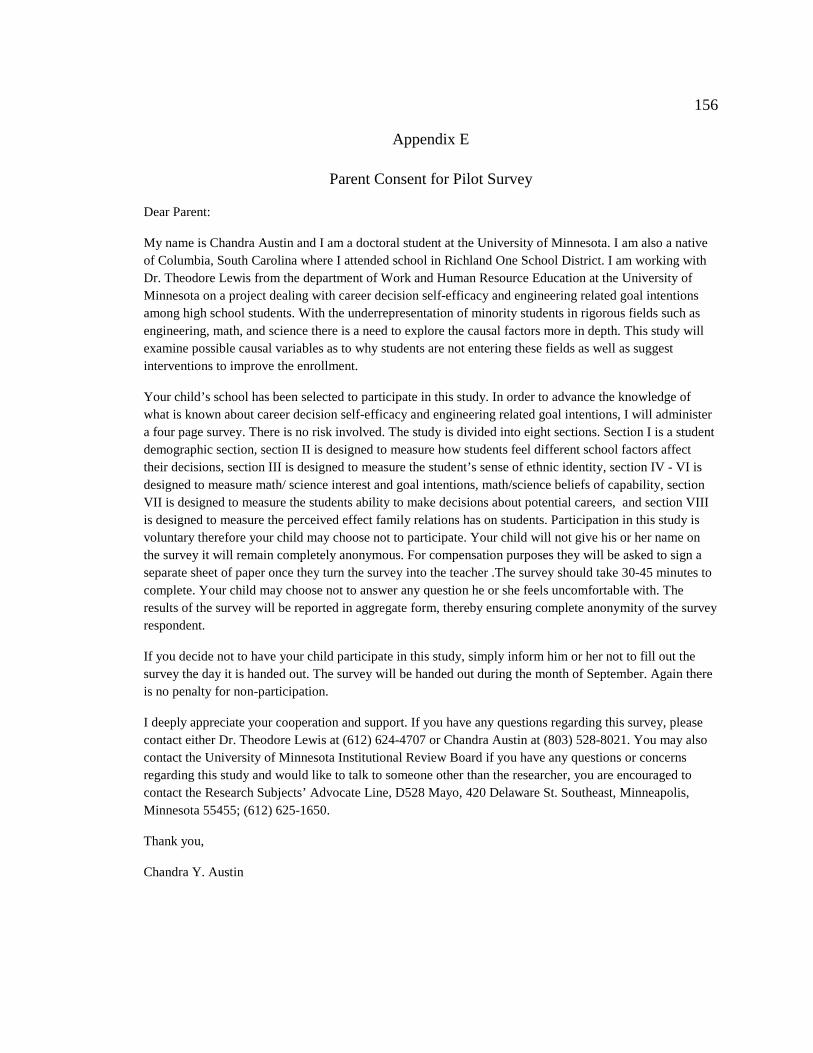
156
Appendix E
Parent Consent for Pilot Survey
Dear Parent:
My name is Chandra Austin and I am a doctoral student at the University of Minnesota. I am also a native of Columbia, South Carolina where I attended school in Richland One School District. I am working with Dr. Theodore Lewis from the department of Work and Human Resource Education at the University of Minnesota on a project dealing with career decision self-efficacy and engineering related goal intentions among high school students. With the underrepresentation of minority students in rigorous fields such as engineering, math, and science there is a need to explore the causal factors more in depth. This study will examine possible causal variables as to why students are not entering these fields as well as suggest interventions to improve the enrollment.
Your child’s school has been selected to participate in this study. In order to advance the knowledge of what is known about career decision self-efficacy and engineering related goal intentions, I will administer a four page survey. There is no risk involved. The study is divided into eight sections. Section I is a student demographic section, section II is designed to measure how students feel different school factors affect their decisions, section III is designed to measure the student’s sense of ethnic identity, section IV - VI is designed to measure math/ science interest and goal intentions, math/science beliefs of capability, section VII is designed to measure the students ability to make decisions about potential careers, and section VIII is designed to measure the perceived effect family relations has on students. Participation in this study is voluntary therefore your child may choose not to participate. Your child will not give his or her name on the survey it will remain completely anonymous. For compensation purposes they will be asked to sign a separate sheet of paper once they turn the survey into the teacher .The survey should take 30-45 minutes to complete. Your child may choose not to answer any question he or she feels uncomfortable with. The results of the survey will be reported in aggregate form, thereby ensuring complete anonymity of the survey respondent.
If you decide not to have your child participate in this study, simply inform him or her not to fill out the survey the day it is handed out. The survey will be handed out during the month of September. Again there is no penalty for non-participation.
I deeply appreciate your cooperation and support. If you have any questions regarding this survey, please contact either Dr. Theodore Lewis at (612) 624-4707 or Chandra Austin at (803) 528-8021. You may also contact the University of Minnesota Institutional Review Board if you have any questions or concerns regarding this study and would like to talk to someone other than the researcher, you are encouraged to contact the Research Subjects’ Advocate Line, D528 Mayo, 420 Delaware St. Southeast, Minneapolis, Minnesota 55455; (612) 625-1650.
Thank you,
Chandra Y. Austin
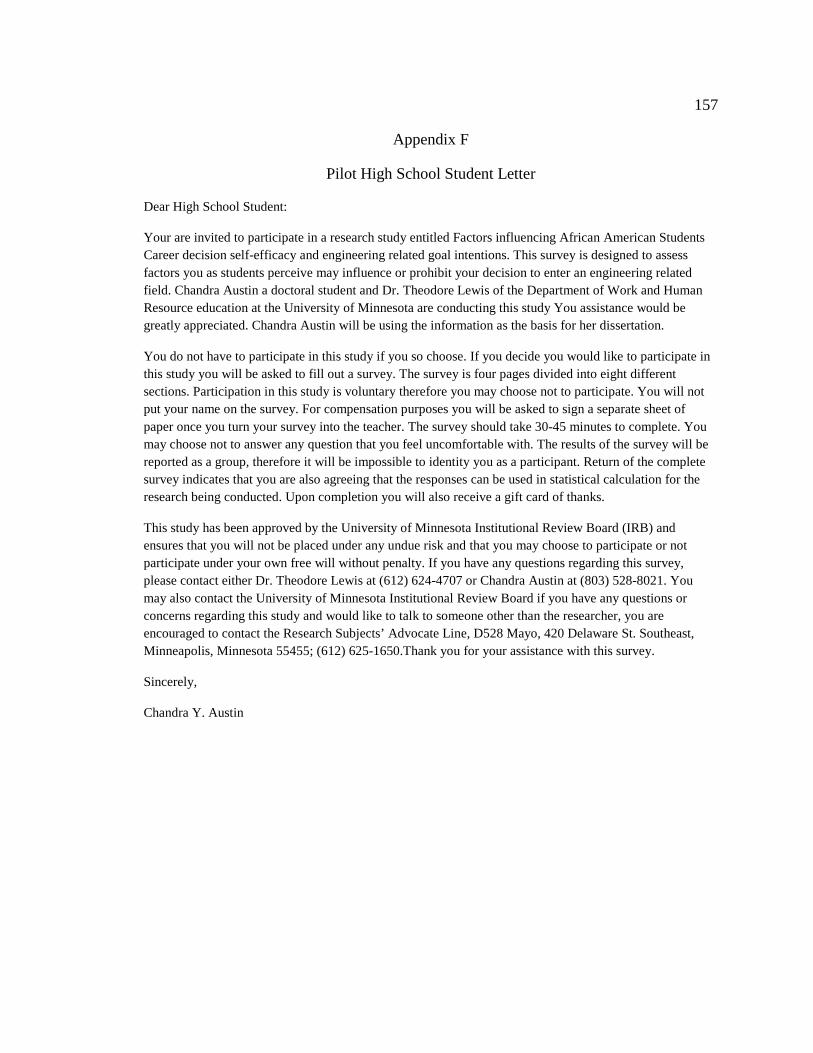
157
Appendix F
Pilot High School Student Letter
Dear High School Student:
Your are invited to participate in a research study entitled Factors influencing African American Students Career decision self-efficacy and engineering related goal intentions. This survey is designed to assess factors you as students perceive may influence or prohibit your decision to enter an engineering related field. Chandra Austin a doctoral student and Dr. Theodore Lewis of the Department of Work and Human Resource education at the University of Minnesota are conducting this study You assistance would be greatly appreciated. Chandra Austin will be using the information as the basis for her dissertation.
You do not have to participate in this study if you so choose. If you decide you would like to participate in this study you will be asked to fill out a survey. The survey is four pages divided into eight different sections. Participation in this study is voluntary therefore you may choose not to participate. You will not put your name on the survey. For compensation purposes you will be asked to sign a separate sheet of paper once you turn your survey into the teacher. The survey should take 30-45 minutes to complete. You may choose not to answer any question that you feel uncomfortable with. The results of the survey will be reported as a group, therefore it will be impossible to identity you as a participant. Return of the complete survey indicates that you are also agreeing that the responses can be used in statistical calculation for the research being conducted. Upon completion you will also receive a gift card of thanks.
This study has been approved by the University of Minnesota Institutional Review Board (IRB) and ensures that you will not be placed under any undue risk and that you may choose to participate or not participate under your own free will without penalty. If you have any questions regarding this survey, please contact either Dr. Theodore Lewis at (612) 624-4707 or Chandra Austin at (803) 528-8021. You may also contact the University of Minnesota Institutional Review Board if you have any questions or concerns regarding this study and would like to talk to someone other than the researcher, you are encouraged to contact the Research Subjects’ Advocate Line, D528 Mayo, 420 Delaware St. Southeast, Minneapolis, Minnesota 55455; (612) 625-1650.Thank you for your assistance with this survey.
Sincerely,
Chandra Y. Austin

158
Appendix G
Parent Consent
Dear Parent,
My name is Chandra Austin and I am a doctoral student at the University of Minnesota. I am also a native of Columbia, South Carolina where I attended school in Richland One School District. I am working with Dr. Theodore Lewis, a professor at the University of Minnesota, on my dissertation project dealing with career decision self-efficacy and engineering related goal intentions among high school students. With the underrepresentation of minority students in rigorous fields such as engineering, math, and science there is a need to explore the causal factors more in depth. This study will examine possible causal variables as to why students are not entering these fields as well as suggest interventions to improve the enrollment.
Your child’s school has been selected to participate in this study. A survey will be given during your child’s homeroom class. There is no risk involved. The survey is divided into eight sections. Section I is a student demographic section, section II is designed to measure how students feel different school factors affect their decisions, section III is designed to measure the student’s sense of ethnic identity, section IV - VI is designed to measure math/ science interest and goal intentions, math/science beliefs of capability, section VII is designed to measure the students ability to make decisions about potential careers, and section VIII is designed to measure the perceived effect family relations has on students. Participation in this study is voluntary. Therefore, your child may choose not to participate. Your child will not put his or her name on the survey. The survey should take 25-35 minutes to complete. The results of the survey will be reported in aggregate form, thereby ensuring complete anonymity of the survey respondent.
If you decide not to have your child participate in this study, simply inform him or her not to fill out the survey the day it is handed out. Those students who do not participate will be allowed to use their time in a way that is agreeable to the teacher. Again there is no penalty for non-participation. I deeply appreciate your cooperation and support. If you have any questions regarding this survey, please contact either Dr. Theodore Lewis at [email protected];or Chandra Austin at (803) 528-8021 or [email protected]. You may also contact the University of Minnesota Institutional Review Board if you have any questions or concerns regarding this study and would like to talk to someone other than the researcher, you are encouraged to contact the Research Subjects’ Advocate Line at (612) 625-1650.Thank you.
Chandra Y. Austin
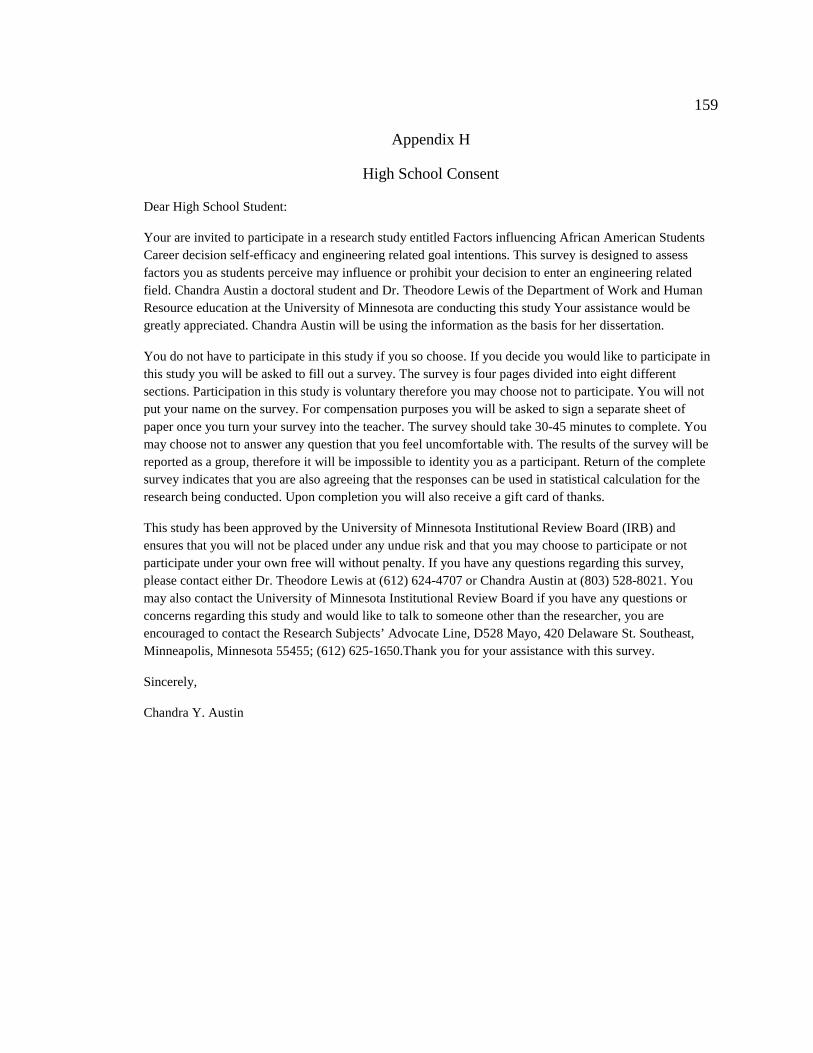
159
Appendix H
High School Consent
Dear High School Student:
Your are invited to participate in a research study entitled Factors influencing African American Students Career decision self-efficacy and engineering related goal intentions. This survey is designed to assess factors you as students perceive may influence or prohibit your decision to enter an engineering related field. Chandra Austin a doctoral student and Dr. Theodore Lewis of the Department of Work and Human Resource education at the University of Minnesota are conducting this study Your assistance would be greatly appreciated. Chandra Austin will be using the information as the basis for her dissertation.
You do not have to participate in this study if you so choose. If you decide you would like to participate in this study you will be asked to fill out a survey. The survey is four pages divided into eight different sections. Participation in this study is voluntary therefore you may choose not to participate. You will not put your name on the survey. For compensation purposes you will be asked to sign a separate sheet of paper once you turn your survey into the teacher. The survey should take 30-45 minutes to complete. You may choose not to answer any question that you feel uncomfortable with. The results of the survey will be reported as a group, therefore it will be impossible to identity you as a participant. Return of the complete survey indicates that you are also agreeing that the responses can be used in statistical calculation for the research being conducted. Upon completion you will also receive a gift card of thanks.
This study has been approved by the University of Minnesota Institutional Review Board (IRB) and ensures that you will not be placed under any undue risk and that you may choose to participate or not participate under your own free will without penalty. If you have any questions regarding this survey, please contact either Dr. Theodore Lewis at (612) 624-4707 or Chandra Austin at (803) 528-8021. You may also contact the University of Minnesota Institutional Review Board if you have any questions or concerns regarding this study and would like to talk to someone other than the researcher, you are encouraged to contact the Research Subjects’ Advocate Line, D528 Mayo, 420 Delaware St. Southeast, Minneapolis, Minnesota 55455; (612) 625-1650.Thank you for your assistance with this survey.
Sincerely,
Chandra Y. Austin

160
Appendix I
Letters to Teachers
Dear High School Teacher:
Your high school students are invited to participate in a research study that is designed to assess factors your students perceive may influence or prohibit their decision to enter an engineering related field. Students who complete this survey may benefit by identifying factors that could increase self-realization on how they perceive things and equip others such as parents or teachers with tools to help in areas they see as struggles. Chandra Austin a Columbia native and student at the University of Minnesota, and Dr. Theodore Lewis a professor in the Department of Work and Human Resource Education at the University of Minnesota are conducting this study. Your assistance in this study would be greatly appreciated. The information obtained will be used by Chandra Austin as the basis of her dissertation study on Factors influencing African American Students Career decision self-efficacy and engineering related goal intentions.
The survey that will be administered is four pages divided into eight different sections. Section I is a student demographic section, section II is designed to measure how students feel different school factors affect their decisions, section III is designed to measure the student’s sense of ethnic identity, section IV - VI is designed to measure math/ science interest and goal intentions, math/science beliefs of capability, and the students ability to make decisions about potential careers, section VII is designed to measure the students ability to make decisions about potential careers, and section VIII is designed to measure the perceived effect family relations has on students. The student will not put their name on the survey. For compensation purposes the student will be asked to sign a separate sheet of paper once they turn the survey into you .The survey should take 30-45 minutes to complete. The student may choose not to answer any question that they feel uncomfortable with. The results of the survey will be reported as a group, therefore it will be impossible to identity them individually as a participant.
Please administer in a way that ensures students complete only one survey in its entirety. Attached to this letter is a script to be followed when administering this survey. Thank you for your assistance with this survey. If you have any questions about this survey please feel free to contact me at 803-528-8021, or email me at [email protected].
Sincerely,
Chandra Y Austin
161
Appendix J
Script for Administration of Survey
Please distribute surveys to all students who have parental consent in your class. Once all of the surveys have been handed out, please read the following script aloud. This will serve as the student assent form.
Dear High School Student:
You are invited to participate in a research study that is designed to assess factors you may perceive influence or prohibit your decision to enter an engineering related field. The survey is for African American Students. A separate activity containing questions relating to careers is to be completed by those who are not African American. Students who complete this survey may benefit by identifying factors that could increase self-realization on how they perceive things and equip others such as parents or teachers with tools to help in areas they see as challenging. Chandra Austin a Columbia native and PhD student along with Dr. Theodore Lewis a professor at the University of Minnesota are conducting this study. Your assistance in this study would be greatly appreciated. The information obtained will be used by Chandra Austin as the basis of her dissertation study on Factors Influencing African American Students Career decision self-efficacy and engineering related goal intentions. You do not have to participate in this study if you so choose.
If you decide you would like to participate in this study you will be asked to fill out a survey. The survey is divided into eight different sections. Section I is a student demographic section, section II is designed to measure how students feel different school factors affect their decisions, section III is designed to measure the student’s sense of ethnic identity, section IV - VI is designed to measure math/ science interest and goal intentions, math/science beliefs of capability, and the students ability to make decisions about potential careers, section VII is designed to measure the students ability to make decisions about potential careers, and section VIII is designed to measure the perceived effect family relations has on students.
You will not put your name on the survey at all so that it will remain completely anonymous. The survey should take 25-35 minutes to complete. You may choose not to answer any question that you feel uncomfortable with. The results of the survey will be reported as a group, therefore it will be impossible to identity you as a participant. Return of the complete survey indicates that you are also agreeing that the responses can be used in statistical calculation for the research being conducted.
Each section has separate directions so please read all of the directions carefully. Please complete the survey on your own, and provide thoughtful responses to each question. When you are finished, kindly, wait quietly until all the surveys are collected and sealed in an envelope. If you finish early or decide not to participate please work on your school assignments. Neither I nor any other school official will have access to your completed surveys. Thank you very much for your assistance with this survey.

162
Appendix K
Survey Instrument
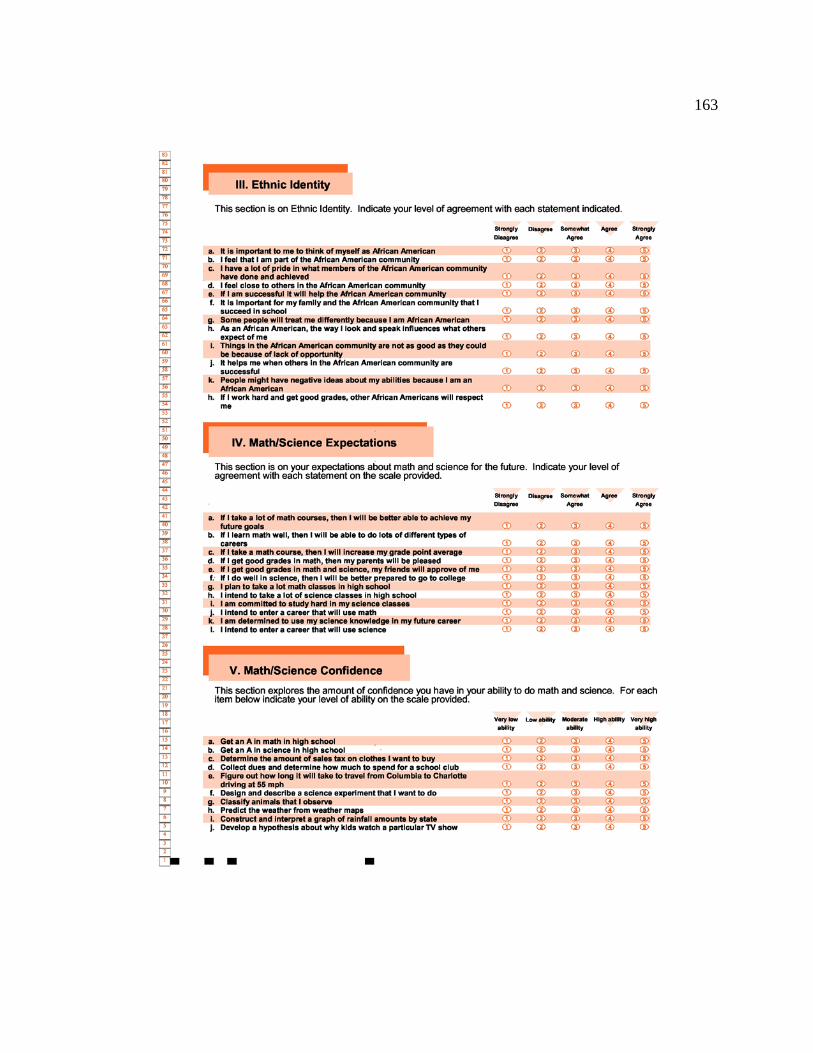
163
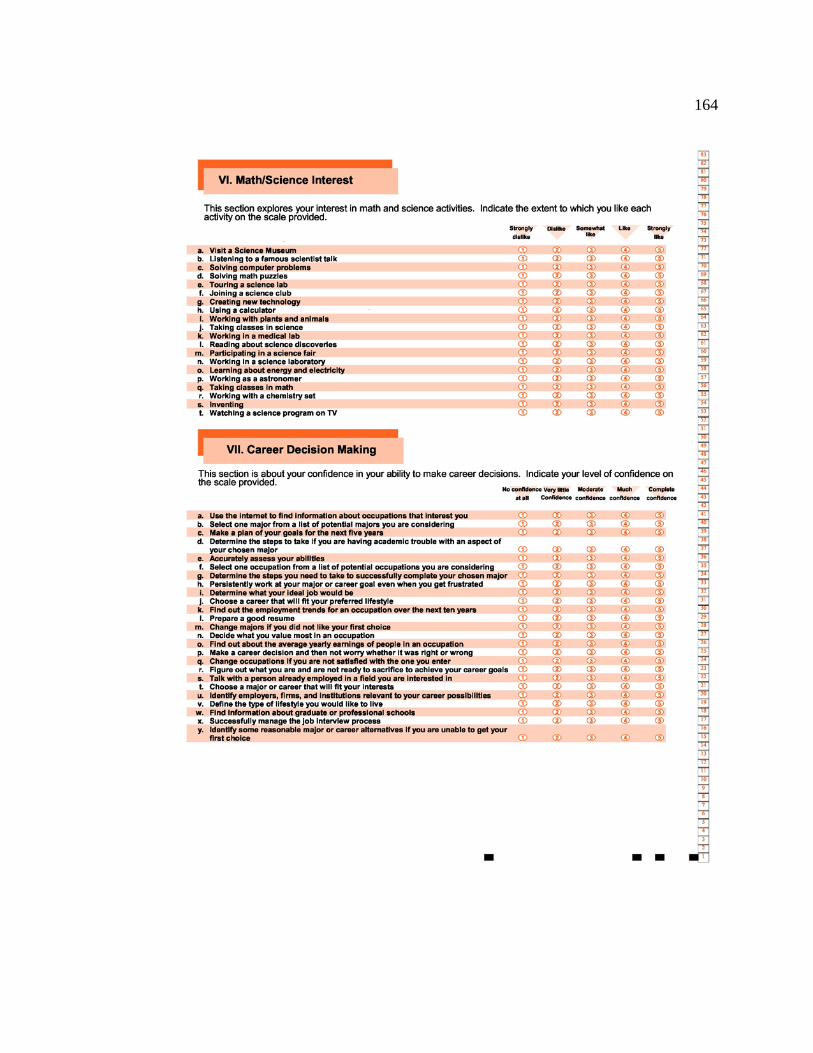
164

165