factors influencing geography grade 12 results: a …
TRANSCRIPT

FACTORS INFLUENCING GEOGRAPHY GRADE 12 RESULTS: A
CASE STUDY OF REHOBOTH HIGH SCHOOL.
A thesis submitted in partial fulfilment of the
Requirements for the degree of
Master of Education
Of
The University of Namibia
By
Christiaan Titus
March 2002
Supervisor: Dr. F.A. Phiri

i
APPROVAL PAGE
This thesis has been examined and is approved as meeting the required
standards for partial fulfilment of the requirements for the degree of Master of
Education.
1. …………………………………. …………………………….. Internal Examiner Date
2. …………………………………. …………………………….. Internal Examiner Date
3. …………………………………. …………………………….. Dean of the Faculty of Education Date
4. ………………………………….. …………….……………….. External Examiner Date

ii
ABSTRACT
This study introduces factors influencing Geography Grade 12 results at
Rehoboth High School. The study concentrates on six factors, namely:
Structure of the examination papers with special emphasis on the
August 2000 Geography mock examination;
Social-cultural factors;
Resources;
Teaching methods;
Attitude towards Geography as a subject;
School environment.
Sixty-six learners responded to a questionnaire and interviews were
conducted with 96 learners, two Geography teachers, library teacher,
principal, advisory teacher and the inspector and it addressed cooperation
and communication within the school. The responses from the interview and
questionnaires indicated that the school environment is conducive to
teaching and learning of Geography. The teaching approaches used by the
teacher are also viewed to be contributing positively to the results.
The resources and social-cultural factors are not very supportive of the
teaching and learning of Geography at the school. The education levels of
the parents are relatively low and resources scarce and this seems to have a
iii
negative influence on the performance of the learners. Analysis of the August
2000 mock examination answer sheets reveals that learners on average
performed better in the skill area analysis but that no significant difference is
recorded between male and female learners. It is only in Paper 2 that
females performed significantly better than males in the skill judgement and
decision-making sections.

iv
ACKNOWLEDGEMENT
The study would not have been possible without the cooperation of Rehoboth
High School. The principal, teachers, learners, inspector and advisory
teacher who spoke to the researcher have added a wider understanding of
the factors and practices operating in the school that affect Geography
performance. I do not thank these respondents by name in order to protect
their anonymity.
The enthusiastic support from Dr. F.A. Phiri, my thesis supervisor and the
late Dr. K. Legesse has been of tremendous value by providing advice and
motivational support.

v
DEDICATION
This thesis is dedicated to my wife Linde and daughter Stianlee who provided
a happy and supportive environment in which to work.
vi
STATEMENT OF ORIGINALITY
I declare that FACTORS INFLUENCING GEOGRAPHY GRADE 12
RESULTS: A CASE STUDY OF REHOBOTH HIGH SCHOOL is my own
work and that all the sources that I have used or quoted have been indicated
and acknowledged by means of complete references and neither has it been,
nor will it be, submitted for the award of any other degree.
………………………………………….
Signature of Student

vii
COPYRIGHT
No part of this thesis may be reproduced, stored in any retrieval system, or
transmitted in any or by any means (e.g. electronic, mechanical,
photocopying, recording or otherwise) without the prior written permission of
the author or the University of Namibia.

viii
TABLE OF CONTENTS
APPROVAL PAGE i
ABSTRACT ii
ACKNOWLEDGEMENT iv
DEDICATION v
STATEMENT OF ORIGINALITY vi
COPYRIGHT vii
TABLE OF CONTENTS viii
LIST OF TABLES x
LIST OF FIGURES xi
CHAPTER 1. INTRODUCTION 1
1.1 Background to the Study 1
1.2 Statement of the Problem 9
1.3 Objectives of the Study 12
1.4 Significance of the Study 12
1.5 Delimitation of the Study 13
1.6 Limitation of the Study 13
1.7 Definition of Terms 14
CHAPTER 2. LITERATURE REVIEW 17
2.1 The Structure of the Examination Papers 17
2.2 Social-Cultural Factors 21
2.3 Resources 25
2.4 Teaching Methods 25
2.5 Attitude towards Geography as a subject 28
2.6 School Environment 29
CHAPTER 3. METHODOLOGY 38
3.1 Introduction 38
3.2 Population 39
3.3 Sample and Sampling Procedure 39
3.4 Research Instruments 39
3.5 Data Collection Procedures 40
3.6 Data Analysis Procedures 42

ix
CHAPTER 4. PRESENTATION AND DISCUSSION
OF RESULTS 44
4.1 Background information on the research site 44
4.2 The Structure of the Examination Papers 45
4.3 Social-Cultural Factors 60
4.4 Resources 67
4.5 Teaching Methods 71
4.6 Attitude towards Geography as a subject 78
4.7 School Environment 80
CHAPTER 5. SUMMARY AND
RECOMMENDATIONS 83
5.1 Summary 83
5.2 Recommendations 86
REFERENCES. 91
APPENDICES. Annex A: Breakdown of Skills 97
Annex B: Learner Questionnaire 100
Annex C: Interview Schedule 105
Annex D: Observation Schedule 106
Annex E: August 2000 Mock
Examination Question Papers 108

x
LIST OF TABLES Table 1: Learner performance in Geography at Rehoboth High School
from 1997 – 1999 10
Table 2: Assessment Objectives 18
Table 3: Skill areas of the Grade 12 Geography Paper 1 August 2000
Mock Examination 48
Table 4: Marks distribution of learners in Paper 1 49
Table 5: Skill areas of the Grade 12 Geography Paper 2 August 2000
Mock Examination 51
Table 6: Marks distribution of learners in Paper 2 52
Table 7: Skill areas of the Grade 12 Geography Paper 3 August 2000
Mock Examination 54
Table 8: Marks distribution of learners in Paper 3 55
Table 9: Skill areas of the Grade 12 Geography Paper 5 August 2000
Mock Examination 57
Table 10: Marks distribution of learners in Paper 5 58
Table 11: Home languages of Grade 12 learners 61
Table 12: Places where learners stay during the school week 62
Table 13a: Education of Mother 63
Table 13b: Education of Father 64
Table 14: Factors learners considered to contribute to making it difficult
to be successful in Geography 66
Table 15: State of Materials in the Geography class 68
Table 16: How learners view their school library 69
Table 17: Verbatim responses of learners on teaching methods 71
Table 18a: Frequency of the use of identified teaching methods 73
Table 18b: Frequency of the use of selected teaching approaches 74
Table 19: The extent to which learner-centered education was
applied in the Geography class 75
Table 20: Rating of the teacher on certain traits 76
Table 21: Responses of Geography teachers on the role of the advisory
teacher and factors they considered most important and most
difficult for a Geography teacher 77
Table 22: Attitude of learners towards Geography 79
Table 23: Verbatim responses of learners on attitude towards subject 79
Table 24: Opportunities for peaceful study 80
Table 25: Verbatim responses on whether the school provides a chance
for peaceful study 80
Table 26: How learners perceive the condition of the school buildings 82
xi
LIST OF FIGURES
Figure 1: Learner achievement Model 7
Figure 2: Ages of the Geography learners as on October 16, 2000 45

1
CHAPTER ONE
INTRODUCTION
1.1 Background to the Problem
The educational system put in place by the colonial authority in Namibia, has
been described as inequitable and discriminatory (Statement by Hon. Nahas
Angula, Minister of Education, Culture, Youth and Sport, at the General
Conference of UNESCO 27th Session, Paris, November 1993). Because of
the differential provision of resources, some schools inefficient and ineffective
by the ministry. Because of the inefficiency and ineffectiveness of schools,
most schools experienced high drop out rates as well as high failure rates.
According to the Ministry of Education and Culture (1993) a few children went
to school before independence while most of those who attended did not go
far.
As a result of the above situation, the Government of the Republic of Namibia
has been engaged in major educational reform and development
programmes since independence. The new Ministry of Education, Culture,
Youth and Sport had to bring a certain measure of efficiency into the system
at Independence. According to Snyder and Voigts (1998) one of the biggest
challenges which faced the Ministry of Education, Culture, Youth and Sport in
its first years of existence was to centralise the eleven ethnically based

2
educational administrations into one. The Ministry also wanted to
democratise the system. It did so by establishing seven new education
regions (Ondangwa East, Ondangwa West, Rundu, Katima Mulilo,
Windhoek, Khorixas and Keetmanshoop Education Regions). The
delimitation of the regions was based on geographical as opposed to racial or
ethnic considerations. Another reform effort included the shift from the
curriculum offered by the Cape Education Department (CED) to a curriculum
more widely recognised across Namibian borders. The pedagogy of the CED
mainly consisted of rote learning of knowledge and facts while the progress
of learners was measured by their ability to recite what was heard or read.
Through consultation with the University of Cambridge Local Examinations
Syndicate (UCLES), a new Senior Secondary Curriculum was developed for
the Senior Secondary School Phase. The International General Certificate of
Secondary Education (IGCSE) and the Higher International General
Certificate of Secondary Education (HIGCSE) were introduced in 1994 to
replace the Cape Education Department (CED) system, as a response to the
latter’s apparent deficiency. The benefit of introducing the IGCSE and
HIGCSE included the provision of greater opportunity for flexibility in the
curriculum and the possibility of some certification even if educational
progress was uneven. (MEC & UCLES, 1993). The new (H)IGCSE system, in
its design, was geared at assessing a wide range of abilities. This system
emphasised another form of learning which was different from the CED
paradigm in that instruction had to be inquiry-oriented in which learners were

3
encouraged to be actively engaged in thinking about new ideas and applying
them in novel situations. According to Verspoor and associates (1991), mere
regurgitation, without a deep rooting in the reasoning behind such
information, is not sufficient for in-depth understanding. Furthermore,
(H)IGCSE allows the Ministry of Education and Culture to adapt the system
to Namibia's own needs within the curriculum framework (MEC & UCLES,
1993).
The assessment objectives that are proposed in the new (H)IGCSE system
create problems for teachers in carrying out assessment under the new
system (MEC & UCLES, 1993). In the new assessment thinking, it is evident
that in order to record the learner's achievement accurately, the performance
has to be standardised against agreed upon performance criteria. According
to Riding and Butterfield (1990), it is important that candidates be able to
show the clear relationships between the assessment objectives, the content
and the context of the learning experiences, the performance criteria, and
any marking scheme used to confirm the recorded achievement of the
learners. The IGCSE syllabus therefore enables learners to demonstrate
their actual achievements in subjects. The recording of positive achievement
of the learners in the IGCSE gives a totally different perspective from what
the Cape Education Department required. In the Cape Education Department
system there was a cut-off point, below which learners were regarded as
failures. It thus required the possession of a certain set of knowledge and

4
skills before the learner could pass the examination. The learners that could
not demonstrate the possession of these skills failed.
The (H)IGCSE curriculum is offered over a period of two years, starting in
Grade 11 and the evaluation of the learners' achievement is only measured
at the end of the second year or Grade 12 of the curriculum. In August of the
second year (Grade 12) the learners take a mock examination. The format of
the mock examination papers is presumably based on the format of the final
examinations of October/November of the second year (Grade 12).
The philosophy of the (H)IGCSE is based on differentiation. Learners are
provided with the curriculum and examination that correspond to the levels of
their ability. To cope with the wide range of ability there are three levels of
difficulty: IGCSE core, IGCSE extended and the HIGCSE. In Geography for
example, questions are targeted at different ability groups in different papers.
The Geography IGCSE core requires candidates to answer Paper 1, 3 and 5
while candidates taking the extended curriculum answer Paper 2, 3 and 5. A
detailed explanation of the papers is given on page 45 of this document.
Consequently, differentiation of the papers means that if a candidate
attempts a more difficult route and succeeds he or she will be awarded
higher grades (A* to E) than a candidate who enters for an easier set of
papers and succeeds. Grading (C to G) is awarded to those candidates that
succeed through the core level. At the IGCSE extended level a candidate
may receive grades A* (highest), A, B, C, D or E (lowest) while at the IGCSE

5
core level a candidate may receive grades C (highest), D, E, F or G (lowest).
At the HIGCSE level, the grades available are 1 (highest), 2, 3 and 4,
(lowest). (MEC & UCLES, 1993).
Positive achievement is thus a key feature of assessment in the (H)IGCSE
paradigm in that it provides learners with the opportunity to achieve a grade
in a subject from A to G, provided that they are entered at the appropriate
level. A candidate who does not succeed in obtaining at least a G grading at
core level, or an E grading at extended level, or grade 4 at HIGCSE level is
ungraded in the subject (MEC & UCLES, 1993).
According to a statement by the Minister of Education and Culture (MEC)
(Mr. N. Angula) on July 27, 1993 to parliament, a task force which was set up
used two criteria in evaluating schools that could offer the new (H)IGCSE
curriculum. The first criteria was to identify which schools can successfully
present the (H)IGCSE course in 1994 and included adequacy of physical
facilities. The second criteria was to look at the competence of teachers and
school management. According to the statement, particular attention was
paid to the presence of laboratories and other specialist rooms and suitably
stocked school libraries. According to these criteria, in 1994 there was only
provision of about 12000 places in Grade 11. Eligibility for admission was
based on the performance of the learners at the grade 10 level in the Junior
Secondary Certificate (JSC) examinations.

6
The results of the first cohort of candidates that wrote the examinations in
1995 were very poor. To this end, a ministerial task force was established to
identify and analyse factors affecting learners' performance in the 1995
IGCSE/HIGCSE examinations (Ministry of Basic Education and Culture,
1996). Some of the problems related to Geography that the task force
identified included language difficulties, problems with geographical
terminology and rubric errors. The selection of learners to undertake the core
or extended curriculum also created some problems (Ministry of Basic
Education and Culture, 1996).
There are many factors that effect how well a learner performs and whether
that performance will deteriorate or improve. Some of these may be more
important than others. In the researcher’s view, effective learning and
teaching depend on many factors which include what happens in the
classroom.
The learner achievement model (figure 1) provides a summary of the factors
that might be either favourable or unfavourable for effective learning to occur.

7
Figure 1: Learner Achievement Model
Explanatory Causes of Variation in Learner Performance
Learner Performance Indicators (Outcomes)
Source: MEC, 1994: How much do Namibia’s children learn in school? Findings from the 1992 National Learner Baseline Assessment [Modified].
Looking at the learner achievement model (figure 1) it seems that for
effective learning and teaching to occur, the following are conditions to be
met:
Learners should be motivated to learn;
Learners should acquire good study skills;
Learners should be well fed and healthy;
Community Context
[Explanatory Factor 1]
Language community
Urban/Rural setting
Community wealth & labour demand
Resources
School Qualities
[Explanatory Factor 3]
Teacher qualities and teaching methods
Classroom & instructional materials
Facilities & school-level organisation
Environment
Assessed Achievement Geography Grade 12
IGCSE August Examinations
Different skills
Individual Learner Characteristics & Family Background [Explanatory Factor 2]
Pupil gender
Age
Home language
Family social-class position
Child motivation and attitude

8
Learners should understand the purpose and relevance of their work;
Learners are given learning tasks in an orderly way;
Learners have textbooks and reference books to use;
Learners know where and when to ask for help;
Learners show consideration for one another and for the teachers;
Learners rise to the challenge of working and showing commitment to
their studies;
Learners revise and practise exercises to improve performance;
Learners work co-operatively in groups;
Learners present good work for others to see;
Learners are encouraged and receive feedback about their work from
teachers and parents; and
Learners read, write, listen and discuss the content of the Geography
syllabus in a variety of contexts.
In addition to the above, the model also implies the following:
Good attitudes of the learners and teachers are required towards their
work;
The teachers have to put the time at their disposal to optimum use so that
the time spent by learners on learning is high; and
Teacher experience, training and commitment to help learners learn are
also important ingredients in the teaching and learning process.

9
1.2 Statement of the Problem
According to the education statistics (Ministry of Basic Education and
Culture/Education Management Information Systems (EMIS), 1996)
Geography got the highest number of candidates that did not receive any
grading in the subject in the final examination in 1995.
In fact, 36.2% of the candidates in 1995 were ungraded in Geography which
represents even a higher figure than Mathematics, 34.2%. Geography ranked
last of the 43 subjects offered at the IGCSE level in 1995. In 1998,
Geography retained the last position of ungraded candidates with 25.4% and
Mathematics. 24.2% (Ministry of Basic Education and Culture/EMIS, 1998).
Geography still ranked last of the 45 subjects offered in 1998.
Likewise, although the number of ungraded Geography learners in 1998 final
examination at the IGCSE level at Rehoboth High School is relatively higher
than the national figure, the majority of the learners at the school received
low grades in the subject. The results of Rehoboth High School for three
years are illustrated in Table 1.

10
Table 1: Learner performance in Geography at Rehoboth High School from 1997-1999. Year No of
Candidates Distribution of symbols (% in italics)
A* A B C D E F G U X
1999 83 3 6 9 27 25 13
% 3.6 7.2 10.8 32.5 30.1 15.7
1998 59 1 4 9 20 18 5 2
% 1.7 6.8 15.3 33.9 30.5 8.5 3.4
1997 87 2 6 13 33 31 3
% 2.3 6.9 14.9 37.9 35.6 2.3
Results obtained from UCLES (Centre NA 021 Rehoboth SS)
In 1997, 84 of the 87 candidates were graded, representing 96.6% of the
total candidates. The candidates that achieved grading from A*-D
represented 9.2% and those achieving a grading of E-G represented 88.4%.
Considering the fact that at least a C average is required for entry to the
University of Namibia or Polytechnic of Namibia, the results are relatively
poor. In 1998, 52 of the 59 candidates were graded, representing 88.1% of
the candidates. Of these candidates, 8.5% obtained grades A*-D and 79.7%
of the candidates obtained grades E-G. This shows a lower achievement in
1998 in comparison to 1997. In 1999 all candidates were graded of which
21.6% of the candidates got grades A*-D and 78.3% of the candidates
received grades E-G. It was only in 1999 that nine candidates were offered
the extended curriculum in Geography for the first time unlike previous years
when only the core curriculum was offered. Using the University or
Polytechnic of Namibia requirement as a measure, the results have not been

11
satisfactory for the three years shown above. Furthermore, of the 10
subjects offered at the school in 1998 at the IGCSE level Geography
assumed the 7th place in the ranking from the top. In 1997, 11 subjects were
offered at the school and Geography was ranked the fourth (4th) (Information
obtained from the achievement records of the school for 1997-1999).
In view of the above, in the last three years, the performance of Geography
learners at Rehoboth High School has been poor. Because of this, the study
sets out to find out the factors which have contributed to the poor
performance of the learners in Geography at Rehoboth High School. More
specifically the study attempts to answer the following questions:
1. To what extent does the structure of the examination papers at IGCSE
level influence the learners’ performance?
2. What social-cultural (community and family) factors affect the
performance of learners in Geography?
3. Are there adequate material resources intended to enhance the teaching
and learning processes of Geography at the school?
4. To what extent do the teaching methods used in Geography affect
learner’s performance?
5. What are the attitudes of learners at Rehoboth High School towards
Geography?
6. To what extent does the school environment affect the learner’s
performance in Geography?

12
1.3 Objectives of the study
The objectives of the study are to;
1. Find out the differences of learners' performance in the mock examination
in different skill areas in Geography;
2. Find out the social-cultural (community and family) factors that influence
the performance of learners at Rehoboth High School;
3. Assess whether there are adequate material resources for teaching
Geography at the school;
4. Identify the teaching methods used by teachers and assess whether they
have an influence on learner’s performance;
5. Examine the attitudes of the learners towards Geography; and
6. Assess the extent to which the learner performance is influenced by the
school environment.
1.4 Significance of the Study
The (H)IGCSE paradigm has been in place since 1995 as a mode of national
examination. The teachers and the community members will benefit from the
results of the study in that critical areas of problems and opportunities can be
identified for example they can become aware of the level of parental and
community support and can through this develop interest in their children’s
schooling. The identified problems and opportunities can form the basis for
group dialogue and can assist the teachers to lose gender tags and

13
prejudices and biases towards certain learners. The study can also
encourage, support and create the communication that will help learners and
teachers from different backgrounds to interact with each other. Because of
this the study attempts to emphasise the importance of considering different
approaches to teaching and learning and the diverse viewpoints of people
from the different social backgrounds. It will also help learners and teachers
to appreciate the number of situations that can be understood by people of
different social backgrounds.
1.5 Delimitation of the Study
The study is confined to the 2000 IGCSE Grade 12 Geography learners and
teachers of Rehoboth High School.
1.6 Limitation of the Study
This study deals with six different factors. There may be other factors left out
in this study. However, the researcher felt that these ones most likely
influence learners’ performance in Geography at the specific school and at
the same time are the ones that could be measured more readily. Another
limitation concerns the information given by the respondents in response to
the questions and the number of learners present on the day when the
researcher administered the instruments. The learners had completed their
formal lesson periods and a number of the learners stayed at home to

14
prepare themselves for the final examinations. The interviews were
conducted on the day that the learners wrote their final Geography
examinations and this could have influenced their responses. The
examination stress could have influenced them emotionally. Not all the
respondents answered all the questions of the questionnaire. The study had
to be completed within a certain time limit that shortened the extent of the
study. The study was limited to one research site and inclusion of other sites
would have provided comparative advantages.
1.7 Definition of terms
The reader of this research work is likely to come across some terms used in
the study which may have different meanings in different contexts. The
researcher provides operational definitions of all terms used in the study.
The Structure of the examination papers: Refers to the different papers in
Geography and consist of different basic skill areas. The level of difficulty or
challenges of each question contained in the papers are examined.
Social-Cultural Factors: Connotes the existence of mutual understanding
between the teachers, learners, parents and other members of the
community and between school and home communities and between the
culture of the classroom and the cultures that the learners bring into the
classroom (Goodwin, 1997).

15
Resources: Schools vary considerably in the availability of resources. Well
resourced schools are able to transform their given inputs into learning. In
schools where material inputs are readily available, it enhances learning. The
learning materials that enhance learner achievement include textbooks and
other learning aids.
Teaching Methods: Refers to the method that the teacher uses to present
the subject matter to the learners. Learning is not the simple act of
accumulating new facts and skills (Goodwin, 1997). Teaching entails
assisting the learners to build bridges between what is already familiar to
them and the new content and skills to be learned. A salient characteristic of
an effective teacher, therefore, is the ability to help learners connect learning
in school to their everyday life experiences both within and outside the
school. Teachers must therefore be skilled in selecting from a repertoire
those instructional procedures that are appropriate to the learners and the
situation rather than rigidly following fixed methods.
Attitude towards Geography as a subject: Ford-Martin (2001) describes
attitude as a feeling, belief, or opinion of approval or disapproval towards
something. Behaviour is an action or reaction that occurs in response to an
event or internal stimuli (i.e. thought). Positive attitudes, according Ford-
Martin (2001) manifest well-adjusted behaviours. Behaviour towards
Geography can however be influenced by a number of factors beyond
attitude, including preconceptions about self and others, resources, teaching

16
and learning methods, social and cultural influences and the school
environment. Positive attitude towards Geography may influence
performance of learners in that it affords opportunities for learning.
School Environment: In order to help learners learn, one of the main tasks
of the teachers and the community is to create a good school environment.
Improving the school-learning environment requires more than the
implementation of get-tough disciplinary measures. It also means creating an
atmosphere of respect for students and sharing with them the responsibilities
of maintaining a high-quality learning environment. Staff and teachers need
to work to get to know their students and form caring relationships of mutual
respect. Good school environment therefore influences better performance of
learners.

17
CHAPTER TWO
LITERATURE REVIEW
There are several factors that may influence the academic performance of
learners. Amongst these are the structure of the examination papers, social-
cultural factors, resources, teaching methods, attitude and behaviour towards
Geography as a subject, and the school environment.
2.1 The Structure of the Examination Papers
As one of the subjects offered in the (H)IGCSE curriculum, the Geography
syllabus reveals a strong influence of some form of objective approach. In
this regard, every section in the Geography syllabus contains a section called
assessment objectives. The assessment objectives include skills such as:
A: Knowledge with Understanding.
B: Analysis.
C: Judgement and decision-making.
D: Investigation (enquiry skills, practical skills and presentation skills).
A total of 13 skills are listed in the Geography syllabus. A comprehensive
breakdown of the skills is given in Annex A. According to the syllabus the
following schemes of assessment should be incorporated in the papers:

18
Table 2: Assessment Objectives.
Paper Assessment Objectives
A Knowledge with
understanding B Analysis C Judgement and
decision making
D Investigation
1 or 2 40 % 30 % 30 % -
3 10 % 80 % 10 % -
5 20 % 20 % 20 % 40 % Adopted from Geography syllabus code: 0460:2000
The syllabus (Geography syllabus Code: 0460:2000) is also structured in
such a way that the following aims are supposed to be achieved:
To develop a sense of place and an understanding of relative location on
a local, regional and global scale;
To develop an awareness of the characteristics and distribution of a
selection of contrasting physical and human environments;
To develop an understanding of some of the processes affecting the
development of such environments;
To develop an understanding of the spatial effects of the ways in which
people interact with each other and with their environments;
To develop an understanding of different communities and cultures
throughout the world and an awareness of the contrasting opportunities
and constraints presented by different environments.
The performance of learners is also influenced during examination times. All
kinds of other pressures are also building up at the time of the examinations.
19
These include the requirements of Geography knowledge, memory, time,
writing skills, understanding the questions, etc. According to Phiri (1998),
learners usually experience seven problems when writing an examination:
These are:
1. Rubric errors. Phiri (1998) quoted Pickering et al (1993) that rubrics
are defined as sets of criteria that describe levels of performance or
understanding. The levels are indicated as the ability to understand
basic instructions contained in the examination papers and the ability
to recognise the demands of the IGCSE examination.
2. Failure to follow basic instructions stipulated in the papers.
3. Failure to recognise the demands of the examinations.
4. Difficulties in the interpretation of resources provided in a question.
5. Language and communication skills.
6. Limited knowledge of subject matter.
7. Difficulties associated with investigative and or research skills.
Some learners are faced with the difficulty of understanding what the
examiner requires. This includes lack of following basic instructions such as
the number of questions that should be attempted. According to Phiri (1998),
some learners simply answer all the questions. Some learners are not
acquainted with a comprehensive glossary of terms usually used in the
examination papers such as "discuss", ”describe”, “explain”, etc., some

20
learners also find it difficult to interpret sources that accompany examination
questions.
Namibian learners also present a special challenge to the teachers, namely
to find effective means of educating learners who do not speak English
fluently. The problem of educating learners that are not native speakers of
English has proved to be very demanding and challenging. In the Namibian
society with a population composed of diverse cultural and linguistic
backgrounds, the education system has a special role to play in the process.
The vast majority of learners and teachers in Namibia do not speak English
as their first language, or even as their second language. Coupled with this
critical situation is the scarcity of teaching materials in Geography. Equating
English with democracy, equality and national identity are the reasons for
using English only in teaching at the Upper Primary, Junior and Senior
Secondary Phases. Mother tongues, except Afrikaans, are generally
underdeveloped, particularly with regards to literature. Afrikaans however is
associated with oppression and colonialism and the Namibian ministry might
have considered it worthwhile to change to a neutral language of instruction.
Mother tongues are not useful for further studies and the people cannot go
beyond the borders of Namibia with the indigenous languages.
The Namibian Ministry of Basic Education and Culture was fully aware of the
importance of language in the affairs of men and women. Against this
background a language policy was designed. The Language Policy for

21
Schools 1992 - 1996 and beyond (Ministry of Education and Culture, 1991)
attempted to achieve the following goals:
The learners should be able to have a reasonable acquisition and
command of English during the seven years of Primary education to
prepare them for Secondary education.
Education should furthermore promote language and cultural identity of
children.
The entire population should be English competent so as to be able to
compete economically in an English dependent world.
To unite the various races and speech communities in Namibia into one
national entity (Ministry of Education and Culture, 1991).
2.2 Social-Cultural Factors
The fact that learners are from diverse cultural and social backgrounds leads
to learners having fewer shared experiences. It, therefore, requires the
teachers to explore different ways of how classrooms can be structured so
that there are many different situations that appeal to all learners in the
classroom. To be responsive to learners requires that the teacher must be
favourably predisposed towards diversity. This entails respecting individual
and cultural differences and believing that all learners are capable of
learning. Learners under achieve in school in general and in the Geography
classroom in particular as a result of problems beyond the school walls.
According to Bowman (1994) the explanation for the differences in school

22
performance lays in the difference in life experiences between groups. The
worlds in which children of different cultural and socio-economic groups live
do not encourage the same beliefs and attitudes nor do they emphasise the
same skills. The Geography classroom therefore should offer opportunities
for equitable participation. Unfortunately, however, performance of the
learners is, to a large extent, affected by conditions in society. Namibia’s vast
areas with the low population density and the uneven provision of resources
in the past has resulted in a great number of children not having a school
within walking distance from their parents’ and/or guardians’ homes. The
problem is further compounded by the fact that only a limited number of
schools in Namibia offer the IGCSE curriculum.
Many learners are subjected to the ills of poverty, and the low expectations
from the teachers, parents, other learners and themselves. These also
influence their chances for success. Living in poverty and sometimes alone,
has several educational implications. Children who are poor and living by
themselves may be malnourished and may not have adequate health care
and may live in a hostile environment and are unlikely to have access to
educational opportunities in the community (Ministry of Education and
Culture, 1994).
Favourable social-economic factors enhance academic performance which
may result in better grades. Poorer backgrounds and lifestyles on the other
hand lessen the children’s chances for academic success (Ministry of
23
Education and Culture, 1994). In today’s society the education attainment of
an individual contributes, to a large extent, to the type of job that a person
can get. The educational levels of the parents of the learners can also
contribute to the academic success or failure because it will be easier for a
better-educated (cultural capital) person to assist the learner in academic
endeavours. Many parents may wish to provide a better home life for their
children, but may not have the skills or support to be effective parents.
Having a nurturing home is an essential resource for learners. Thus, having a
nurturing network of parents, teachers, peers and community members that
are supportive of the learners can go a long way in improving performance in
the Geography classroom.
Poor academic achievement is also experienced among learners whose
cultures differ significantly from the main culture prevalent in the school
environment. Learners from different cultural backgrounds may learn to
communicate differently. According to Campbell, Campbell and Dickinson
(1996) teachers can be of great help to the Geography learner by:
a) Examining and recognising their perceptions and behaviour toward
learners from different cultural backgrounds. Teachers should therefore
see themselves as agents and transmitters of culture. This requires that
teachers observe themselves and the learners in the classroom.
Furthermore teachers should reflect on the ways in which they interact
with Geography learners from different linguistic and cultural groupings.
According to Campbell, Campbell and Dickinson (1996) educators who

24
model a distinction, who maintain high expectations for all the learners,
while appreciating and celebrating the diversity of ways the learners learn,
will teach more through their behaviour than through strategies.
b) Teaching should be organised in a way that promotes a conversational
tone between the teacher and the learner instead of the conventional
question-answer interchanges.
c) Teachers should also realise that not all the Geography learners are alike.
Learners come from different academic experiences and cultural
backgrounds and also have different expectations about the nature and
purpose of Geography as a subject (Campbell, Campbell and Dickinson,
1996).
The impact of socialisation has also an influence on the way boys and girls
perform in Geography. As children grow, they are often unconsciously
encouraged to adopt sex-stereotyped roles. According to Wadsworth and
Mennen (1997), boys are encouraged to play with action toys, learning about
Geographical concepts while girls are encouraged to express themselves
verbally. Girls are also encouraged to be passive, caring, to take no risks,
and to defer to male voices in the public discussion (Wadsworth and Mennen
1997). Such an orientation obviously has an impact on how males and
females learn and behave in school.

25
2.3 Resources
The provision of educational materials to schools, and particularly the
Geography classroom, is an issue of much interest to the researcher. The
lack of facilities and equipment has often been cited as a major reason for
low educational quality (Snyder and Voigts, 1998). Due to the fact that school
resources are related to learners' outcomes, parents attempt to place their
children in resource-rich schools. Parents from low-income backgrounds
value the educational opportunities provided to higher income backgrounds
more as the educational opportunities provided by the schools in their local
area. According to Snyder and Voigts (1998) there are sometimes sufficient
provisions of materials to schools and in some schools there are
commercially produced materials available but the materials are rarely
appropriate for the Namibian educational context. There is also the
contention of the actual availability of materials as opposed to having it
stored away at the school. At times, these materials demand a level well
beyond the learners. Teachers have therefore to decide whether to adapt
these materials to fit the background of the learners or develop their own
teaching materials.
2.4 Teaching Methods
Everyone has a learning style (Griggs, 1991). According to Griggs our style
of learning, if accommodated, can result in improved attitudes toward
26
learning and an increase in productivity, academic achievement, and
creativity. Many times the teacher will concentrate on presenting the lessons
in line with his or her preferred learning style. This practice can put learners
with a different preferred learning style at a real disadvantage. Learners that
grasp the instruction style of the teacher may be successful in Geography
and will be motivated to get good grades by competing with other learners.
The only way to ensure that learners with diverse learning styles are
successful in school is to offer a variety of teaching styles. McLeod (1994),
shows how this may be obtained through:
i. Co-operative learning. Teachers can make the learners realise that it is to
their advantage for other learners to do well. It is required that they learn
together and they receive a grade from a group activity.
ii. Mastery learning, i.e. learners learn at their own pace rather than being
bored by too slow or too fast a pace.
iii. Heterogeneous ability grouping can be used to give learners a chance to
learn from multiple “teachers”, In other words they teach each other.
The learning style of the learners, according to Riding and Butterfield (1990),
is related to the way in which the individual represents information in
memory. The authors found that learners whose memories relied highly on
imagery performed well on tasks that can be visualised and performed less
on those presented verbally. It is important that the teacher is aware of these
situations and models an appreciation for individual differences. Although the

27
basic understanding of the geographical concepts is required, the teacher
must be responsive to the fact that not all the learners learn and develop
competencies in the same way (Campbell, Campbell and Dickinson, 1996).
Learners need to be taught in the way that corresponds to the way in which
they preferred to learn. The teaching method of the teacher should be
appropriate to the task and fit the topic of the lesson as well as the varied
preferred learning styles of the learners.
The methods, according to Mobley (1986), should match the:
a) Subject material;
b) Learner's level of competence;
c) Skills developed by the learners;
d) Ability range of the learners; and
e) Type of assessment that will be administered.
Specific strategies can be used by the teacher and include acknowledging
the perceptions of the learners, understanding diverse points of view, and
reflecting on current views from several perspectives. Therefore, the teacher
also has to consider the relationship between lessons during preparation.
Learners must do more than just listen. They must read, discuss or be
engaged in problem solving. To be actively involved, learners must be
engaged in analysis, synthesis and evaluation activities. It thus calls for the
application of diverse methods which include group work, discussion in class,

28
peer-group learning, and practical activity. Use of these techniques in the
classroom is vital because of their powerful impact upon the learners'
learning. According to Bonwell and Eison (1991) several studies have shown
that learners prefer strategies promoting active learning to traditional
lectures.
2.5 Attitude towards Geography as a subject
Shinn (1981) is convinced that nothing can stop a person with the right
attitude toward achieving his or her personal goals in life. The right attitude
can direct a person to use abilities to gain the maximum for the person. A
positive attitude towards Geography then does make a difference in
performance. It makes the difference between success and failure in the
subject. A positive attitude towards the subject will help the learner to learn
from the teacher and can generate cooperation between the teacher and the
learner and will also inspire the other learners. The role of attitude to achieve
success in Geography cannot be underestimated. Shinn (1981) notes that
success without a positive attitude is unthinkable. Without a positive attitude
there is no way to overcome problems. Positive attitudes also create
enthusiasm in learners towards the subject. According to Shinn (1981) a
positive attitude opens the mind and expands it to search for new
opportunities and to grow to achieve success.

29
2.6 School Environment
An environment is considered to be a living and changing system. It is more
than the physical space since it includes the way time is structured and the
roles we are expected to play. It also conditions how we feel, think and
behave and dramatically affects the quality of our lives. The environment
either works for us or against us as we conduct our lives (Greenman, 1988).
Schools and classrooms are complex social environments. They consist of
different individuals with own identities, perceptions and values. The school
environment and the Geography classroom are interpreted and identified by
the learners in different ways. The classroom is very important. Lumsden
(1994), observes that if the learners experience the classroom as a caring
and supportive place, where there is a sense of belonging and everybody is
valued and respected, they will tend to participate more fully in the learning
process. The school environment will therefore, affect the learners'
perception of what is right or wrong and of an acceptable and an
unacceptable conduct. Many times the teachers assume that all learners
bring a similar socialisation to the classroom, one that corresponds closely to
the experiences of the dominant group in the society. The spatial
organisation of the school and the Geography classroom provides conditions
for learning in that the school buildings and the classroom themselves
express conceptions of teaching and learning. The learners and the teacher
have to cope and manage the physical arrangement of the school and the

30
classroom. The way in which the classroom is organised and arranged
reflects the kind of environment in which learning has to take place. The
organisation and layout also tells about the character and orientations of the
learners and the teacher. According to Hopkins and Antes (1979) some
learners have a difficult time becoming accustomed to a new climate or
different environment. They might therefore have a difficult time to adapt to
the new environment and might lose out on the material presented to the rest
of the learners. Different wall colours or materials on the walls might distract
some learners.
According to Hopkins and Antes (1979) the classroom and the school
environment should develop and create appropriate environments for
learning. An important fact should be considered in the atmosphere of the
Geography class. The classroom and the school environment are not only
about academic subject matter. The classroom experience also involves
learning to become self-reliant and self-evaluative as well as learning how to
work co-operatively and productively with others.
According to Hitchcock and Hughes (1995), the organisation of space in
schools and classrooms reflects the underlying pedagogic practice. The
Geography classroom should also be a place to help learners to sharpen
their sense of identity, understanding of culture and to explore and internalise
general issues of fairness and morality. For the Geography class to be
conducive to learning and teaching it should be clean, comfortable and make

31
learners feel welcome and at ease. Purkey and Novak (1984) quoted that
Berger and Luckman (1966) who indicated that people both create and are
created by their environments.
Classrooms and social environments are located in organised social worlds
where meanings are shared and values held. Classrooms also constitute
small communities with cumulative histories, shared beliefs and rights and
responsibilities of membership (Good and Brophy, 1997). Hitchcock and
Hughes (1995) quoted Sommer (1967) who studied the influence of the
seating arrangement, classroom arrangement and spatial organisation on the
levels of learners' participation. In a study of an introductory psychology
class, Sommer (1967) observed that the students directly opposite the
instructor participated more than those on the sides. In classrooms where
desks were arranged in straight rows students in front were found to
participate more than those in the rear, and students in the centre of each
row participated more than those on the sides.
Another aspect is that if teachers, educators and learners demonstrate that
they have low expectations of a certain school there will be a decrease in
motivation and interest in school activities. Hitchcock and Hughes (1995),
noted that the whole issue of teachers' expectations stems from research by
Rosenthal and Jacobson (1968). According to Hitchcock and Hughes these
authors designed an artificial situation in order to test the hypothesis that
individual learners' performances were significantly influenced by their

32
teachers' expectations of them. The behaviour of the Geography teacher is
critical since it reinforces both negative and positive attitudes or creates
hopes for a better and more satisfying school life for the learners.
Good and Brophy (1997), hold the view that teachers tend to call more
frequently on learners they believe to be most capable. The authors quoted
their study in 1970 and reported only minor differences in the frequency of
teacher contact with learners of different achievement levels but found
important variations in the quality of these contacts. The teachers were more
likely to praise high-achieving learners even when differences in correctness
of learners' answers were taken into account. The study further found that
high achievers were praised 12 percent of the time when they gave the right
answer, while low achievers were only praised 6 percent of the time. On the
other hand, low achievers were criticised more (18 percent of the time as
opposed to 6 percent for high achievers). Furthermore, teachers were twice
as likely to stay with high achievers than with low achievers (i.e. repeat the
question, provide a clue or ask a new question). Good and Brophy (1997)
also indicated that gender also affects the quantity and quality of learner
communication with teachers. They also claim that studies consistently show
that boys have more interactions with the teachers than girls do.
Another factor is that learners leave their different homes with different
situations and environmental circumstances. The task of the teacher is to
cater for the basic needs of the learners or at least try to let them feel at
33
home and safe. In order to succeed in Geography, parents and teachers
alike need to create a stable climate that will enable the child to develop fully.
There is a great need for the Geography teacher to create this secure
classroom environment emotionally and socially in which learners can feel
safe to express their feelings of fear and insecurity. In an environment where
learners feel anxious or insecure, there are likely to be psychological barriers
to learning. Learners are often asked to perform in a state of ignorance and
dependence which will ultimately instil feelings of helplessness. Learners
may want to talk with parents and other adults but are reluctant to do so,
fearing that no one will understand or care. In many households, the children
compete for the time and attention of the adults. Bey (1996) suggests that the
school can implement activities for the adults to learn to communicate
effectively with the children in order to provide them with a supportive
environment that is conducive to learning and to get them involved in the
learning process.
Bey (1996) identifies five qualities that are important and essential to a
positive classroom environment. These are;
a) Co-operation: Learners learn to work together and trust, help and
share with each other.
b) Communication: Learners learn to observe carefully, communicate
accurately and listen sensitively.
34
c) Tolerance: Learners learn to respect and appreciate people's
differences and understand prejudice and how it works.
d) Positive Emotional Expression: Learners learn to express feelings,
particularly anger and frustration in ways that are not aggressive or
destructive and they learn self-control.
e) Conflict Resolution: Learners learn those skills of responding
creatively to conflict in the context of a supportive environment.
Bey (1996) notes that, it is only when learners enjoy the cognitive
experiences provided in the classroom that they have a good chance to
thrive in their subjects. Many learners do poorly in Geography because what
is done in the Geography classes seems irrelevant to them and their world. It
is believed that in schools where the parents or other adults are involved in
the learners' education, learners achieve more than those whose parents do
not become involved and stay involved in the education of their children. The
school and the family thus ultimately share a major responsibility, in their
children’s education because both influence the educational success and
failure of the learners.
Bey (1996) indicates that much of the school environment is dependent on
the quality of the principal's leadership. The principal has to motivate and set
the tone and atmosphere for a purposeful climate. In such purposeful climate,
creativity is generated and teachers are encouraged to share their
uniqueness with each other and with the learners. The principal and the

35
teachers should be supportive, accessible, open to ideas and non-
judgemental in listening to the concerns of the other teachers and learners
(Bey, 1996). The principal should endeavour to learn the names of the
learners and teachers and workers and display a sense of humour.
Creemers (1989) indicated that the principal shapes the learning climate by:
a) maintaining high visibility in order to communicate priorities and model
expectations;
b) creating a reward system that reinforces academic achievement and
productive effort;
c) establishing clear, explicit standards for learners and staff that embody
the school’s expectations of learners;
d) protecting instructional time from interruptions and promoting the
effective use of instructional time in the classrooms;
e) selecting, supporting and participating in high-quality staff
development programmes consistent with the school’s annual
programme goals.
Similarly, Renchler (1992) noted that the principal could influence positive
learning environment by:
a) stressing goal setting and self-regulation management,
b) offering learners choices in instructional settings,
c) rewarding learners for attaining "personal best" goals,

36
d) fostering teamwork through group learning and problem-solving
experiences,
e) replacing social comparisons of achievement with self-assessment
and evaluation techniques, and
f) teaching time management skills and offer self-paced instruction when
possible.
As our world becomes a global village rather than isolated schools,
communities and countries, we envisage that the classroom and the school
environment have to be modified. The researcher believes that the ideal
school and classroom should be one where:
a) learners can access and analyse information instantly;
b) learners can work together co-operatively with others and are
receptive to new ideas;
c) teachers guide and facilitate learning;
d) teachers team up with other colleagues in order to utilise talents fully;
e) teachers target learning experiences at the varied preferred learning
style of all the learners;
f) schools are provided with sufficient time and monetary resources to
plan programmes;
g) parents are consistently involved in school activities and the education
of their children; and,
h) schools provide on-line research opportunities.

37
Currently initiatives (SchoolNet and LearnLink initiatives) are under way to
link up most rural schools in Namibia with technologies which will bring them
closer to information. Computer centres are also provided in different
constituencies throughout the country and can assist the rural schools to take
advantage of the innovations.

38
CHAPTER THREE
METHODOLOGY
3.1 Introduction
The study made use of qualitative and quantitative measures. The
quantitative measures included the analysis of the results of the August 2000
mock examination in Geography and the qualitative analysis was achieved
through analysis of questionnaires, face-to-face interviews and observations.
The case study approach was adopted in the execution of this study. The
case study is considered to be a way of organising data for the purpose of
reviewing social reality (Best and Kahn, 1993). It examines a social unit as a
whole and in this case the Rehoboth High School is looked at. The
performance of a sample of learners is considered, with specific emphasis on
Grade 12 learners and Geography as a subject. The purpose is to
understand the factors that lead to the performance of the learners at the
school with particular reference to Geography. The advantage of the case
study is that it probes deeply into issues concerning the study and enables us
to understand the factors that lead to the performance of the learners in
Geography. As part of the case study method, interviewing of the
stakeholders was conducted in order to help explain the thinking of the
teachers, learners and the principal at the school.

39
3.2 Population
The population included all the Grade 12 Geography learners, the teachers,
the school inspector and the Geography advisory teacher in Rehoboth High
School.
3.3 Sample and Sampling Procedure
All 96 Geography learners were included in the in-depth interviews. The in-
depth interviews were also conducted with the advisory teacher (one),
inspector, Geography teachers (two) and the school principal. Sixty-six
learners responded to the questionnaire. Only 66 Geography learners were
present the day when the questionnaire was administered. This is alluded to
in the limitation of the study. The researcher believes that this does not
compromise the quality of the study in any way and that the views expressed
can be regarded as representative of the whole group. The in-depth
interviews were however conducted with the whole population on another
occasion and can therefore be said to compensate for the absent
questionnaire responses. The interviews were conducted to focus groups of
twenty learners per group.
3.4 Research Instruments
The instruments that were used are:

40
Questionnaires. Items on the questionnaire sought personal data,
education levels of the parents, community and cultural background,
aptitude and attitude towards Geography as a subject of the learners.
Interview schedule. The Grade 12 Geography learners of 2000, the
subject teacher, the library teacher and the school principal were
interviewed. Questions were about the general characteristics of the
school, preferred teaching and learning style, resources at the school and
the school environment.
Observation schedules. These provided information on important aspects
of the behaviour of the teachers, learners, principal and general aspects
of the school.
Actual mock question papers. The researcher and the advisory teacher
for Geography worked through the August 2000 papers to ascertain the
skill areas that are covered as well as to determine the performance of
learners in the different skill areas. The mock examination was used
because it is supposed to follow the same format as the final examination.
3.5 Data Collection Procedures
The interviews were conducted to gather information regarding the
experiences and knowledge of the learners, teachers and the principal as
well as that of the advisory teacher and the inspector regarding the teaching
of Geography at the school. The questions were structured in such a way
that current and past information on the performance of Grade 12 learners in

41
Geography was obtained. On October 16, 2000, the questionnaire was
administered at the school to 66 (68%) of the 96 Geography learners who
were present at the school. Of those present 37 were females (56%) and 29
were males (44%). It must be mentioned though that the learners were
finished with the work and some of the learners stayed home because they
had to prepare themselves for the final examinations. I got their answer
sheets of the August 2000 mock examination and analyzed the papers. With
the help of the advisory teacher I put the papers in the different skill areas.
Informal observations were also conducted on the occasions that I visited the
school and are integrated in the study. This included characteristics of the
school environment, Geography class, amount of furniture and equipment
and presence or absence of other facilities.
Brief descriptions of the research instruments follow.
(a) Analyses of mock examination papers. The August 2000 papers, set
by the teacher, were analysed in order to ascertain what skill areas are
covered by their papers and whether it is in line with what will be tested at the
end of the year. Answer sheets of the learners were analysed to try to find
out in which skill areas they have problems with. The percentages of marks
obtained, by the learners per skill area, are illustrated in table format in the
discussion of results section of the report. The proportions of actual marks for
August 2000 marks for Geography for a specific skill area are given in
chapter four.

42
(b) Interviews and questionnaires were used to collect data on the social-
cultural factors, resources, methods of teaching and the school environment.
Triangulation was achieved through open-ended interviews, questionnaires
and observations. The principal, advisory teacher for Geography, Geography
teachers and all of the learners were interviewed. Only 66 learners were
present when the questionnaire was administered and this was done in four
groups. The interviews were conducted in groups of twenty and the interview
schedule and questionnaire were used for this purpose.
(c) Observations were conducted to obtain a detailed picture of the
behaviours, events and contexts surrounding schooling at Rehoboth High
School.
3.6 Data Analysis Procedures
The answer papers of the learners were analysed with reference to the
question papers of the teacher to see what skill areas are covered and in
what skill areas the learners are experiencing problems. The variation of
achievement of the learners was determined with the scores of boys and girls
separately. To be able to know if the mean males’ score differed from the
females’ mean score, the T-test was used. The data that was collected with
the questionnaire was analysed question by question and the responses
were given in the appropriate places. A checklist in the questionnaire
solicited responses for the resources at the school. Feedback was also

43
obtained from the learners on their view of the teaching methods of the
teacher. The school environment views were also obtained from the learners
and teachers. All these responses are given in table format in chapter four.
The interviews with the learners, the teachers, the principal, the advisory
teacher and the school inspector were tape recorded, transcribed and
incorporated in the text.
44
CHAPTER FOUR
PRESENTATION AND DISCUSSION OF RESULTS
4.1 Background information on the research site
Rehoboth High School has a staff complement of 34 teachers and six
cleaners. The school had 815 learners as on September 22, 2000. Of the
143 Grade 12 learners (65 males and 78 females), a total of 96 (67%) took
Geography. Of the 96 who took Geography 48 (50%) were females.
The ages of the Grade 12 Geography learners are given below (as of
October 16, 2000) so as to give the reader an idea of the presence of over-
aged learners in the Geography classroom. The teacher that was offering the
Grade 12 Geography syllabus is in his early thirties.

45
Figure 2: Ages of the Geography Grade 12 learners as on October 16, 2000.
0
5
10
15
20
25
Ages
Nu
mb
er
of
lea
rners
Female
Male
Female 10 22 11 1 3 1
Male 9 14 14 8 3 0
17 18 19 20 21 22
4.2 The Structure of the Examination Papers
This section addresses question 1 on page 11. The IGCSE Geography
syllabus is made up of four papers. Papers 1 and 2 are targeted at differential
levels of achievement. The questions on Paper 1 are more structured than
those for Paper 2. All the IGCSE candidates have to take Paper 3 and Paper
5.
Paper 1: Candidates are required to answer three questions (3 X 25 marks).
Six questions are set: two on each of the three themes. The themes are:
1. Population and Settlement;
2. The Natural Environment; and
3. Economic Development and the Use of Resources.

46
Questions are structured with gradients of difficulty and are resource-based,
and tasks are described in Assessment Objectives A, B, and C. A typical
question that could be set for this Paper is to refer to the population pyramids
and learners would then be asked to describe and suggest reasons for the
differences in the shapes.
Paper 2: Candidates are asked to answer three questions (3 X 25 marks).
Six questions are set: two on each of the three themes. The themes are:
1. Population and Settlement;
2. The Natural Environment; and
3. Economic Development and the Use of Resources.
Questions are resource-based, involve problem solving and free-response
writing, and are on tasks described in Assessment Objectives A, B and C. A
typical question for Paper 2 could be to describe population migration and
give reasons why people migrate.
Paper 3: Is 60 marks. All candidates take this paper and they have to answer
all the questions. Candidates have to demonstrate skills of analysis and
interpretation and application of graphical and other techniques as
appropriate. The learners have to study maps and have to explain and give
reasons for the growth of settlements in specific areas.
Paper 5: Is also 60 marks. The learners may opt to undertake school-based
assignments but written approval is required from UCLES. As an alternative

47
to Coursework, a written examination on issues relating to one or more of the
following syllabus themes are set: The themes are:
1. Population and Settlement.
2. The Natural Environment.
3. Economic development and the use of Resources.
Candidates have to answer all the questions. This paper provides an
emphasis on the Assessment Objective D. The Paper concentrates on a
research site and candidates have to draw inferences from the study, e.g.
they have to identify similarities and differences in the pattern of surface flow
across the river at ten selected sites.
In order to answer the questions of the study, the researcher and the
Geography advisory teacher analysed the examination papers and
categorised the papers to the domains as described in Table 2 of this
research report. In view of this, breakdown of the August 2000 mock Grade
12 Geography examination papers at Rehoboth High School (case study
site) together with the format are given in Tables 3, 5 and 7, to ascertain
whether it is in line with the prescriptions in Table 2.
Table 3 gives the breakdown of the different skill areas in paper 1 of the
August 2000 mock Geography Grade 12 examination. The marks indicated in
the “total” column are what each of the individual questions contributed.

48
Table 3: Skill areas of the Grade 12 Geography Paper 1 August 2000 Mock Examination.
Skill areas
Question Total Marks Knowledge with Understanding
Analysis Judgement and Decision Making
Investigation
1 (a) 6* 6*
1 (b) (i) 2 2
1 (b) (ii) 6 6
1 (c) (i) 6 6
1 (c) (ii) 5 5
2 (a) (i) 5 5
2 (a) (ii) 2 2
2 (a) (iii) 3 3
2 (b) (i) 4 4
2 (b) (ii) 2 2
2 (b) (iii) 5 5
2 (c) 4 4
3 (a) (i) 3 3
3 (a) (ii) 1 3 3
3 (a) (ii) 2 5 5
3 (b) (i) 3 3
3 (b) (ii) 2 2
3 (b) (iii) 1 1
3 (c) (i) 1 1
3 (c) (ii) 1 1
3 (c) (iii) 2 2
3 (c) (iv) 4 4
Total 75 46 (61%) 17 (23%) 12 (16%) 0 (0%)
Assessment objec. 40% 30% 30% *Question 1 (a) weighed 6 marks and covered the knowledge with understanding skill area. Assessment Objectives as adopted from Geography syllabus code: 0460:2000
As can be seen from Table 3, knowledge with understanding questions
covered 61% (46 marks out of 75), analysis questions 23% (17 marks out of
75) and judgement and decision-making questions 16% (12 marks out of 75).
This is not what the assessment objectives prescribe (knowledge with
understanding 40%, analysis 30% and judgement and decision-making
30%). In order to record the learner’s achievement accurately, the
performance has to be standardised against agreed upon criteria.

49
The actual marks that the learners achieved in the examination are given in
Table 4. The total number of female learners that sat for Paper 1 is 36 while
35 male learners took the same paper.
Table 4: Marks distribution of learners in Paper 1 (N=71; Females=36, Males=35).
Paper 1
Skill areas (Marks obtained by learners in the skill areas)
Cases Knowledge with Understanding
(Total Marks: 46)
Analysis
(Total Marks: 17)
Judgement and decision-making
(Total Marks: 12)
F (%)* M (%) F (%)* M (%) F (%)* M (%)
# 1 13.0 34.8 5.8 41.2 41.7 58.3
# 2 10.9 15.2 29.4 23.5 8.3 33.3
# 3 4.4 6.5 23.5 29.4 25.0 16.7
# 4 6.5 17.4 35.3 41.2 8.3 16.7
# 5 23.9 6.5 29.4 11.8 41.7 0.0
# 6 6.5 19.6 17.7 47.1 0.0 25.0
# 7 17.4 13.0 23.5 41.2 50.0 25.0
# 8 21.7 21.7 29.4 41.2 33.3 41.7
# 9 15.2 21.7 23.5 29.4 33.3 8.3
# 10 6.5 8.7 35.3 17.7 25.0 8.3
# 11 17.4 6.5 35.3 17.7 16.7 8.3
# 12 10.9 28.3 47.1 47.1 33.3 58.3
# 13 10.9 26.1 35.3 35.3 41.7 33.3
# 14 21.7 2.2 41.2 35.3 25.0 8.3
# 15 13.0 10.9 29.4 23.5 41.7 0.0
# 16 13.0 15.2 11.8 41.2 8.3 16.7
# 17 19.6 6.5 23.5 47.1 33.3 8.3
# 18 8.7 13.0 17.7 17.7 25.0 33.3
# 19 4.4 17.4 29.4 29.4 0.0 25.0
# 20 19.6 17.4 52.9 47.1 8.3 50.0
# 21 13.0 32.6 41.2 41.2 25.0 33.3
# 22 26.1 13.0 23.5 47.1 33.3 25.0
# 23 10.9 32.6 29.4 47.1 16.7 8.3
# 24 8.7 23.9 52.9 11.8 25.0 33.3
# 25 17.4 8.7 17.7 52.9 16.7 25.0
# 26 15.2 26.1 52.9 58.8 16.7 0.0
# 27 10.9 26.1 0.0 29.4 16.7 41.7
# 28 4.4 10.9 47.1 23.5 16.7 33.3
# 29 6.5 19.6 17.7 23.5 0.0 0.0
# 30 21.7 21.7 47.1 29.4 25.0 8.3
# 31 10.9 8.7 52.9 17.7 16.7 16.7
# 32 6.5 30.4 41.2 64.0 16.7 25.0

50
# 33 23.9 23.9 41.2 35.3 33.3 25.0
# 34 17.4 21.7 47.1 35.3 33.3 66.7
# 35 17.4 26.1 17.7 35.3 0.0 25.0
# 36 21.7 41.2 50.0
Total 229 292 195 207 101 101
Average 6.36 8.34 5.42 5.91 2.81 2.89
Average% 13.8 18.1 31.9 34.8 23.4 24.1
T-test -2.38765 -0.92152 -0.17813
* Indicates the marks for female for various skill areas.
It can be seen that the learners taking the mock Paper 1 (core curriculum)
performed on average better in the skill analysis (31.9% females and 34.8%
males respectively) whereas judgement and decision-making assumed on
average the second place overall (23.4% females and 24.1% males
respectively. The learners did not do very well in the knowledge with
understanding section of the paper (13.8% females and 18.1% males
respectively. In order to answer the question on the contrast in performance
between the male and female learners a T-test was performed to see if there
was a significant difference in their performance. The calculated t value of
2.38 at the =0.05 with 79 degrees of freedom is greater than that obtained
from the tables. Therefore there is a significant difference in the scores of the
males and the females in Paper 1 in the skill area knowledge with
understanding. The calculated t value of 0.92 at the =0.05 with 79 degrees
of freedom is smaller than that obtained from the tables. Therefore there is
no significant difference in the scores of the males and the females in Paper
1 in the skill area analysis. The calculated t value of 0.17 at the =0.05 with
79 degrees of freedom is smaller than that obtained from the tables.

51
Therefore there is no significant difference in the scores of the males and the
females in Paper 1 in the skill area judgement and decision-making.
Paper 2 of the Geography examination is taken by the extended curriculum.
This is a more complex curriculum than the core. Table 5 reflects the skill
areas that were tested in Paper 2 in the August 2000 mock Geography
examination.
Table 5: Skill areas of the Grade 12 Geography Paper 2 August 2000 Mock Examination.
Skill areas
Question Total Marks
Knowledge with Understanding
Analysis Judgement and Decision Making
Investigation
1 (a) (i) 4 4
1 (a) (ii) 6 6
1 (b) (i) 8 8
1 (b) (ii) 7 7
2 (a) (i) 1 1
2 (a) (ii) 3 3
2 (a) (iii) 4 4
2 (a) (iv) 3 3
2 (b) (i) 5 5
2 (b) (ii) 4 4
2 (b) (iii) 5 5
3 (a) 5 5
3 (b) (i) 5 5
3 (b) (ii) 8 8
3 (b) (iii) 7 7
Total 75 57(76%) 11(14.7%) 7(9.3%)
Assessment objec. 40% 30% 30% *Question 1 (a) weighed 4 marks and covered the knowledge with understanding skill area. Assessment Objectives as adopted from Geography syllabus code: 0460:2000
As can be seen from Table 5, knowledge with understanding questions
covered 76% (57 marks out of 75), analysis questions14.7% (11 marks out of
75) and judgement and decision-making questions 9.3% (7 marks out of 75).

52
This is not what the assessment objectives prescribe (knowledge with
understanding 40%, analysis 30% and judgement and decision-making
30%). In order to record the learner’s achievement accurately, the
performance has to be standardised against agreed upon criteria.
Table 6 reflects the marks of the learners in the Grade 12 Geography Paper
2 mock examination during August 2000. The total number of female learners
that sat for Paper 2 is 12 while 13 male learners took the same paper.
Table 6: Marks distribution of learners in Paper 2 (N=25; Females=12, Males=13).
Paper 2
Skill areas (Marks obtained by learners in skill areas)
Cases Knowledge with Understanding
(Total marks: 57)
Analysis
(Total marks: 11)
Judgement and decision-making (Total marks: 7)
F (%)* M (%) F (%)* M (%) F (%)* M (%)
# 1 28.1 38.6 36.4 45.5 28.6 71.4
# 2 38.6 29.8 27.3 27.3 42.9 28.6
# 3 45.6 36.8 18.2 45.5 85.7 57.1
# 4 61.4 56.14 36.4 63.6 85.7 57.1
# 5 57.9 54.4 18.2 72.7 71.4 42.9
# 6 28.1 49.1 36.4 27.3 42.9 57.1
# 7 47.4 49.1 9.1 9.1 71.4 71.4
# 8 36.8 38.6 36.4 27.3 57.1 57.1
# 9 38.6 42.1 36.4 18.2 57.1 42.9
# 10 47.4 57.9 18.2 36.4 57.1 28.6
# 11 54.4 31.6 36.4 9.1 57.1 14.3
# 12 61.4 49.1 45.5 36.4 71.4 42.9
# 13 38.6 36.4 28.6
Total 311 326 39 50 51 42
Average 25.9 25.1 3.3 3.9 4.3 3.2
Average % 45.5 44.0 29.5 35.0 60.7 46.1
T-test 0.349893 -0.86399 2.080063
* Indicates the marks for female for various skill areas.

53
It can be seen that the learners taking Paper 2 (extended curriculum)
performed on average better in the skill judgement and decision-making
(60.7% females and 46.1% males respectively) and that knowledge with
understanding came in second, slightly lower on average 45.5% females and
44.0% males respectively. In order to answer the question on the
performance of males and females, a T-test was performed to see if there
was a significant difference in the performance.
The calculated t value of 0.35 at the =0.05 with 23 degrees of freedom is
smaller than that obtained from the tables. Therefore there is no significant
difference in the scores of the males and the females in Paper 2 in the skill
area knowledge with understanding. The calculated t value of 0.86 at the
=0.05 with 23 degrees of freedom is also smaller than that obtained from
the tables. Therefore there is also no significant difference in the scores of
the males and the females in Paper 2 in the skill area analysis. The
calculated t value of 2.08 at the =0.05 with 23 degrees of freedom is greater
than that obtained from the tables. Therefore there is a significant difference
in the scores of the males and the females in Paper 2 in the skill area
judgement and decision-making.
All the candidates take Paper 3. The candidates have to demonstrate skills of
analysis of graphical techniques. Table 7 reflects the skill areas that were
tested in the August 2000 Geography mock examination.

54
Table 7: Skill areas of the Grade 12 Geography Paper 3 August 2000 Mock Examination.
Skill areas
Question
Total Marks
Knowledge with Understanding
Analysis Judgement and Decision Making
Investigation
1 (a) (i) 1* 1*
1 (a) (ii) 1 1
1 (a) (iii) 4 4
1 (b) (i) 1 1
1 (b) (ii) 1 1
1 (c) 4 4
1 (d) 4 4
1 (e) 4 4
2 (a) (i) A 2 2
2 (a) (i) B 2 2
2 (a) (ii) 4 4
2 (a) (iii) 3 3
2 (b) (i) 3 3
2 (b) (ii) 2 2
2 (b) (iii) 4 4
3 (a) 6 6
3 (b) (i) 1 1
3 (b) (ii) 5 5
3 (c) (i) 1 1
3 (c) (ii) 1 1
3 (c) (iii) 6 6
Total 60 23(38.3%) 26(43.3%) 11(18.3%)
Assessment objec. 10% 80% 10% *Question 1 (a) (i) weighed 1 mark and covered the analysis skill area. Assessment Objectives as adopted from Geography syllabus code: 0460:2000
As can be seen from Table 7, knowledge with understanding covered 38.3%
(23 marks out of 60), analysis 43.3% (26 marks out of 60) and judgement
and decision-making 18.3% (11 marks out of 60). This is not what the
assessment objectives prescribe (i.e. it prescribes 10% knowledge with
understanding, 80% analysis and 10% judgement and decision making). In
order to record the learner’s achievement accurately, the performance has to
be standardised against agreed upon criteria.

55
Table 8 shows the marks of the learners in Paper 3 during the August 2000
mock Geography examination. An equal number of female and male learners
(i.e. 48 each) sat for Paper 3.
Table 8: Marks distribution of the learners in Paper 3 (N=96; Females=48, Males=48).
Paper 3
Skill areas (Marks obtained by learners in skill areas)
Cases Knowledge with Understanding
(Total marks: 23)
Analysis
(Total marks: 26)
Judgement and decision-making
(Total marks: 11)
F (%)* M (%) F (%)* M (%) F (%)* M (%)
# 1 13.0 26.1 23.1 34.6 0.0 0.0
# 2 43.5 21.7 30.8 26.9 18.2 18.2
# 3 17.4 17.4 11.5 26.9 9.1 27.3
# 4 13.0 26.1 50.0 19.2 18.2 0.0
# 5 17.4 26.1 26.9 11.5 9.1 9.1
# 6 34.8 17.4 19.2 57.7 0.0 9.1
# 7 30.4 26.1 30.8 26.9 9.1 18.2
# 8 13.0 17.4 23.1 23.1 9.1 9.1
# 9 17.4 47.8 23.1 38.5 9.1 18.2
# 10 21.7 34.8 38.5 7.7 18.2 9.1
# 11 21.7 8.7 30.8 19.2 0.0 9.1
# 12 17.4 17.4 26.9 15.4 9.1 18.2
# 13 30.4 17.4 23.1 19.2 0.0 9.1
# 14 39.1 17.4 50.0 26.9 9.1 9.1
# 15 21.7 13.0 30.8 19.2 0.0 9.1
# 16 17.4 4.4 23.1 19.2 18.2 9.1
# 17 47.8 39.1 15.4 57.7 18.2 0.0
# 18 21.7 39.1 19.2 30.8 9.1 18.2
# 19 21.7 8.7 15.4 15.4 9.1 9.1
# 20 39.1 17.4 23.1 34.6 9.1 9.1
# 21 0.0 8.7 15.4 26.9 9.1 9.1
# 22 17.4 43.5 23.1 38.5 9.1 18.2
# 23 43.5 17.4 42.3 38.5 27.3 9.1
# 24 0.0 8.7 42.3 38.5 0.0 9.1
# 25 26.1 21.7 38.5 42.3 9.1 18.2
# 26 39.1 13.0 26.9 38.5 18.2 9.1
# 27 26.1 34.8 34.6 38.5 9.1 0.0
# 28 21.7 17.4 38.5 23.1 18.2 9.1
# 29 17.4 17.4 23.1 46.2 9.1 0.0
# 30 17.4 8.7 23.1 30.8 0.0 0.0
# 31 21.7 43.5 23.1 46.2 18.2 9.1
# 32 17.4 17.4 11.5 57.7 0.0 18.2

56
# 33 8.7 30.4 15.4 50.0 0.0 9.1
# 34 39.1 26.1 42.3 42.3 9.1 18.2
# 35 60.9 30.4 50.0 46.2 18.2 9.1
# 36 30.4 8.7 23.1 23.1 9.1 9.1
# 37 8.7 43.5 34.6 30.8 0.0 9.1
# 38 21.7 34.8 53.9 57.7 9.1 9.1
# 39 39.1 47.8 34.6 30.7 27.3 18.2
# 40 26.1 30.4 46.2 30.8 0.0 0.0
# 41 30.4 65.2 34.6 38.5 9.1 18.2
# 42 56.5 60.9 42.3 50.0 18.2 18.2
# 43 8.7 47.8 53.9 38.5 9.1 18.2
# 44 39.1 52.2 46.2 34.6 9.1 18.2
# 45 47.8 39.1 61.5 50.0 9.1 27.3
# 46 47.8 26.1 42.3 42.3 18.2 27.3
# 47 34.8 26.1 15.4 15.4 9.1 9.1
# 48 34.8 39.1 30.8 50.0 9.1 27.3
Total 295 300 391 423 52 63
Average 6.2 6.3 8.2 8.8 1.1 1.3
Average % 26.7 27.2 31.3 33.9 9.8 11.9
T-test -0.15547 -0.98039 -1.34804
* Indicates the marks for female #1 for various skill areas.
The candidates overall performed better on average in the skill analysis
(31.3% females and 33.9% males respectively). In the skill area judgement
and decision-making the females got 9.8% and the males 11.9% respectively
on average.
The calculated t value of 0.16 (knowledge with understanding), 0.98
(analysis) and 1.35 (judgement and decision-making) at the =0.05 with 94
degrees of freedom is smaller than that obtained from the tables. Therefore
there is no significant difference in the scores of the males and the females in
Paper 3 in all the skill areas covered.
Paper 5 is taken by all the candidates and is an alternative to coursework. An
equal number of female and male learners sat for Paper 5 (i.e. 48 each).

57
Table 9 reflects the skill areas tested during the August 2000 Geography
mock examination.
Table 9: Skill areas of the Grade 12 Geography Paper 5 August 2000 Mock Examination.
Skill areas (Marks obtained by learners in skill areas)
Question Total Marks
Knowledge with Understanding
Analysis Judgement and Decision Making
Investigation
1 (a) (i) 3* 3*
1 (a) (ii) 2 2
1 (a) (iii) 4 4
1 (a) (iv) 2 2
1 (a) (v) 3 3
1 (b) 4 4
1 (c) (i) 1 1
1 (c) (ii) 3 3
1 (c) (iii) 4 4
1 (d) 5 5
1 (e) 5 5
2 (a) (i) 2 2
2 (a) (ii) 1 1
2 (a) (iii) 5 5
2 (a) (iv) 3 3
2 (b) (i) 5 5
2 (b) (ii) 3 3
2 (b) (iii) 3 3
2 (b) (iv) 2 2
Total 60 16(26%) 11(18%) 0(0%) 33(55%)
Assessment objec. 20% 20% 20% 40% *Question 1 (a) (i) weighed 3 marks and covered the investigation skill area. Assessment Objectives as adopted from Geography syllabus code: 0460:2000
As can be seen from Table 9, knowledge with understanding covered 26%
(16 out of 60), analysis 18% (11 out of 60) and judgement and decision-
making 0% (0 out of 60) and investigation 55% (33 out of 60). This is not
what the assessment objectives prescribe (i.e. knowledge with understanding
20%, analysis 20%, judgement and decision making 20% and investigation

58
40%). In order to record the learner’s achievement accurately, the
performance has to be standardised against agreed upon criteria.
Table 10 shows the marks of the learners during the August 2000 Geography
mock examination.
Table 10: Marks distribution of learners in Paper 5 (N=96; Females=48, Males=48).
Paper 5
Skill areas (Marks obtained by learners in skill areas)
Cases Knowledge with Understanding
(Total marks: 16)
Analysis
(Total marks: 11)
Investigation
(Total marks: 33)
F (%)* M (%) F (%)* M (%) F (%)* M (%)
# 1 62.5 37.5 9.1 36.4 63.6 63.6
# 2 50.0 31.3 18.2 36.4 75.8 63.6
# 3 50.0 18.8 36.4 9.1 39.4 78.8
# 4 50.0 56.3 36.4 36.4 54.6 81.8
# 5 50.0 43.8 36.4 9.1 54.6 78.8
# 6 50.0 56.3 36.4 18.2 45.5 75.8
# 7 56.3 50.0 36.4 36.4 45.5 60.6
# 8 12.5 43.8 9.1 9.1 54.6 78.8
# 9 37.5 50.0 18.2 36.4 36.4 48.5
# 10 43.8 37.5 27.3 36.4 39.4 48.5
# 11 43.8 37.5 36.4 9.1 24.2 60.6
# 12 50.0 43.8 27.3 36.4 63.6 36.4
# 13 31.3 43.8 18.2 36.4 42.4 63.6
# 14 56.3 56.3 36.4 9.1 57.6 54.6
# 15 43.8 6.3 9.1 9.1 36.4 15.2
# 16 31.3 31.3 36.4 36.4 48.5 66.7
# 17 12.5 37.5 36.4 9.1 18.2 42.4
# 18 31.3 56.3 9.1 36.4 18.2 69.7
# 19 50.0 12.5 9.1 9.1 54.6 18.2
# 20 43.8 56.3 18.2 18.2 15.2 36.4
# 21 37.5 37.5 18.2 36.4 72.7 60.6
# 22 50.0 50.0 9.1 9.1 72.7 30.3
# 23 56.3 12.5 36.4 9.1 30.3 36.4
# 24 31.3 43.8 9.1 36.4 66.7 18.2
# 25 56.3 62.5 36.4 36.4 51.5 72.7
# 26 56.3 62.5 9.1 18.2 81.8 57.6
# 27 56.3 50.0 9.1 36.4 27.3 72.7
# 28 12.5 50.0 36.4 36.4 21.2 78.8

59
# 29 50.0 68.8 18.2 27.3 42.4 36.4
# 30 25.0 50.0 36.4 27.3 66.7 63.6
# 31 37.5 56.3 9.1 9.1 66.7 36.4
# 32 18.8 37.5 18.2 45.5 21.2 54.6
# 33 6.3 56.3 9.1 9.1 30.3 30.3
# 34 18.8 50.0 9.1 9.1 15.2 48.5
# 35 37.5 43.8 9.1 36.4 63.6 48.5
# 36 18.8 50.0 9.1 54.6 42.4 69.7
# 37 56.3 37.5 27.3 36.4 36.4 69.7
# 38 12.5 62.5 9.1 18.2 45.5 57.6
# 39 50.0 31.3 18.2 18.2 63.6 24.2
# 40 43.8 31.3 9.1 0.0 57.6 27.3
# 41 31.3 43.8 45.5 63.6 75.8 75.8
# 42 37.5 31.3 36.4 18.2 66.7 15.2
# 43 43.8 56.3 18.2 9.1 54.6 63.6
# 44 50.0 0.0 54.6 9.1 87.9 36.4
# 45 56.3 50.0 9.1 9.1 63.6 54.6
# 46 43.8 50.0 36.4 9.1 57.6 54.6
# 47 37.5 31.3 9.1 9.1 69.7 57.6
# 48 62.5 37.5 45.5 9.1 81.8 51.5
Total 312 328 121 123 799 840
Average 6.5 6.8 2.5 2.6 16.7 17.5
Average % 40.6 42.7 22.9 23.3 50.5 53.0
T-test -0.68027 -0.13021 -0.66214
* Indicates the marks for females for various skill areas.
The learners performed relatively well in the skill of investigation (50.5%
females and 53.0% males respectively) and their knowledge with
understanding was above average (40.6% females and 42.7% males
respectively).
The calculated t value of 0.68 (knowledge with understanding), 0.13
(analysis) and 0.66 (investigation) at the =0.05 with 94 degrees of freedom
is smaller than that obtained from the tables. Therefore there is no significant
difference in the scores of the males and the females in Paper 5 in all the skill
areas covered.

60
From the analysis of the different mock examination papers at Rehoboth
High School it appears that learners performed on average better in the skill
area analysis in Papers 1 (31.9% females and 34.9% males) and in Paper 3,
analysis on average shows 31.3% for females and 33.9% for males
respectively. There is however no significant difference in the performance of
males and females in this skill area. In Paper 2 the learners performed on
average better in the skill knowledge with understanding (45.5% for females
and 44.0% for males respectively). Although the learners did not perform
very well in judgement and decision making the females performed
significantly better on average than the males. In Paper 3 and 5 it seems that
there is no significant difference in the performance of the males and the
females in the mock examination paper. However, in Paper 5 the learners
performed on average better in the skill investigation (50.5% females and
53.0% males respectively). It must however be mentioned that the skill
judgement and decision making was not covered at all in the August 2000
mock examination at the school. It seems that in the skill judgement and
decision making learners performed on average lower in Papers 2 and 3 but
that there is no significant difference in the performance of males and
females.
4.3 Social-cultural factors
This section attempts to answer question 2 on page 11. It is concerned with
community and family factors that might have an influence on the

61
performance of the learners. The questionnaire, tried to determine the home
language(s) of the learners and the question was intended to get an idea of
the different language backgrounds of the learners. Table 11 gives the
responses of the learners that completed the questionnaire.
Table 11: Home languages of the Grade 12 learners (N=66; Females=37, Males=29).
Home Language Female (%) Male (%) Total (%)
Afrikaans 18(27.3) 9(13.6) 27(40.9)
Nama/Damara 8(12.1) 11(16.7) 19(28.8)
Herero 2(3.0) 0(0.0) 2(3.0)
Oshiwambo 2(3.0) 1(1.5) 3(4.6)
Afrikaans and English 1(1.5) 1(1.5) 2(3.0)
Afrikaans and Oshiwambo 1(1.5) 0(0.0) 1(1.5)
English 0(0.0) 2(3.0) 2(3.0)
Afrikaans and Tswana 0(0.0) 1(1.5) 1(1.5)
Afrikaans and Nama/Damara 0(0.0) 1(1.5) 1(1.5)
Learners not answering question 5(7.6) 3(4.6) 8(12.2)
Percentages are given in brackets.
Mother tongues, except Afrikaans, are generally underdeveloped, particularly
with regards to literature. Afrikaans is widely used and there was greater
temptation among many Namibians to use it, instead of mother tongue or
English.

62
The fact that a child acquires his or her mother tongue in a cultural
environment plays a particular important part in the moulding of concepts.
The child will find it hard to grasp any new concepts which are alien to his or
her cultural environment. Geography concepts and English are very different
from the cultural environments of most Namibian learners. Learning
difficulties are therefore greatly increased because, the children do not only
come in contact with Geography concepts for the first time, but also find it
difficult to express themselves in English.
The environment in which the learner stays in during the school week will
either afford him/her opportunities to study or will be inhibiting. To that end, a
question was asked as to where learners stay during the school week. Table
12 summarises the answers of the respondents.
Table 12: Places where learners stay during the school week (N=66; Females 37, Males=29).
Where learners stay during the school week
Males (%) Females (%) Total (%)
With Parents or Guardians 11(16.7) 19(28.8) 30(45.5)
With relatives or other family 5(7.6) 6(9.1) 11(16.7)
In a hostel 9(13.6) 10(15.2) 19(28.8)
On their own with other children 4(6.1) 2(3.0) 6(9.1)
Percentages are given in brackets.
As can be seen from the Table 12, 9.1% of the learners have to take care of
others and themselves. It can therefore be deduced that they will have very

63
little time to pay attention to their schoolwork, as a result of the added
responsibilities.
The researcher is of the opinion that the education levels of the parents of
the learners might influence learners’ academic performance positively or
negatively. The parents with higher education levels are more likely to be
supportive of the school and its activities. A question was asked as to the
education levels of the respondents’ parents and Tables 13 (a) and (b)
summarise the results.
Table 13 (a): Education of Mother (N=66; Females=37, Males=29).
Education level Males (%) Females (%)
Total (%)
Did not go to school 4(6.1) 2(3.1) 6(9.2)
Some Primary School Grades 4(6.1) 11(16.7) 15(22.8)
All of Primary School 1(1.5) 3(4.6) 4(6.1)
Some Secondary School Grades 14(21.2) 14(21.2) 28(42.4)
All of Secondary School 1(1.5) 2(3.0) 3(4.5)
Tertiary Education 0(0.0) 0(0.0) 0(0.0)
Do not know 5(7.6) 5(7.6) 10(15.2)
Percentages are given in brackets.
It seems that the majority of the mothers of the learners attended some
secondary school grades (46.9%). Only 4.5% of the mothers finished
secondary school. It is worrisome that 15.2% of the respondents do not know
the education attainment of their mothers. Due to the low education

64
qualification of the mothers the researcher thinks that the mothers might not
be in a position to effectively aide their children with skills needed in
Geography studies.
Table 13 (b): Education of Father (N=66; Females=37, Males=29).
Education level Males (%) Females (%) Total (%)
Did not go to school 1(1.5) 3(4.6) 4(6.1)
Some Primary School Grades 4(6.1) 6(9.1) 10(15.2)
All of Primary School 3(4.6) 2(3.0) 5(7.6)
Some Secondary School Grades 13(19.7) 8(12.1) 21(31.8)
All of Secondary School 3(4.6) 6(9.1) 9(13.7)
Tertiary Education 0(0.0) 5(7.6) 5(7.6)
Do not know 3(4.6) 6(9.1) 9(13.7)
Learners not answering question 2(3.0) 1(1.5) 3(4.5)
Percentages are given in brackets.
The education levels of the fathers are not remarkably different from that of
the mothers. It seems that 45.5% of the respondents’ fathers have attended
some secondary school grades. Some of the respondents’ fathers have
attended tertiary education institutions (7.6%). What is also disturbing to the
researcher in the responses to this question is that 13.7% of the respondents
do not know the education levels of their fathers. This could be an indication
that effective communication is not taking place in the home environment.
The researcher is of the opinion that the fathers also are not in a position to
render academic support in the acquisition of Geography skills to their
children just as the mothers.

65
There are a number of factors that can make it difficult for learners to
concentrate completely on their studies. Accordingly, the learners were
asked to rank factors that they considered contributed to the learners finding
it most difficult to be successful in Geography. Table 14 gives the ranking of
factors by the learners.
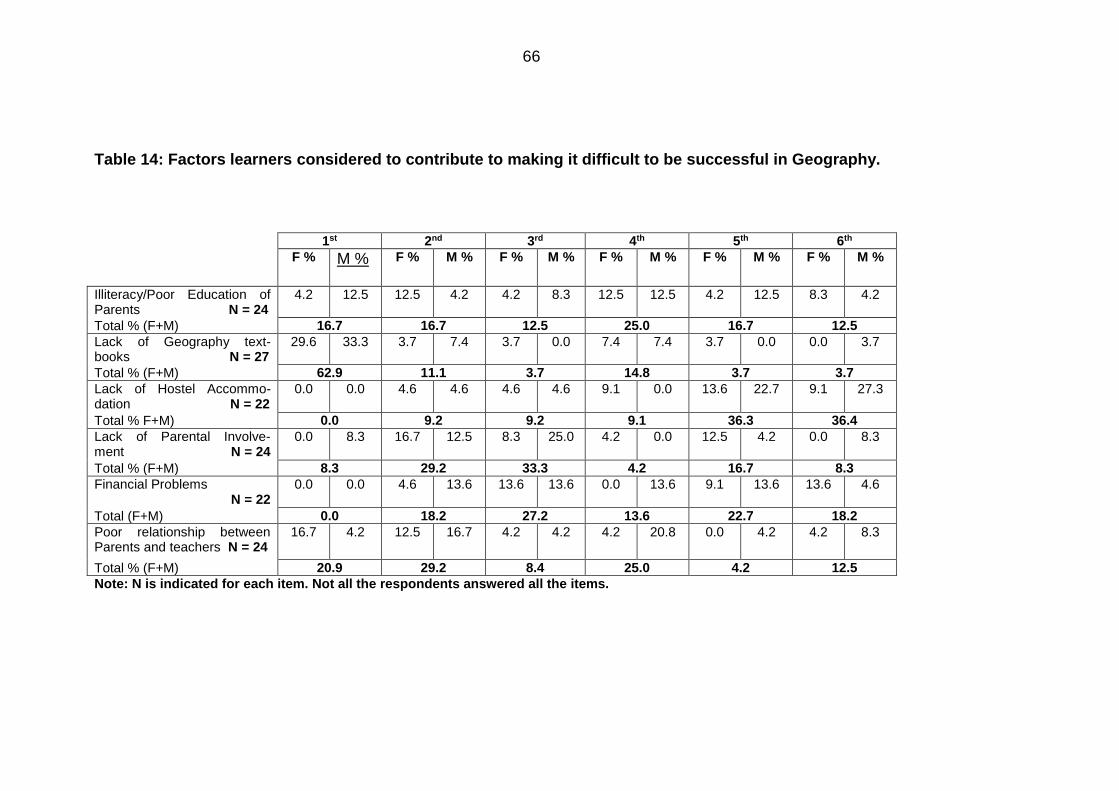
66
Table 14: Factors learners considered to contribute to making it difficult to be successful in Geography.
1st 2nd 3rd 4th 5th 6th
F % M % F % M % F % M % F % M % F % M % F % M %
Illiteracy/Poor Education of Parents N = 24
4.2 12.5 12.5 4.2 4.2 8.3 12.5 12.5 4.2 12.5 8.3 4.2
Total % (F+M) 16.7 16.7 12.5 25.0 16.7 12.5
Lack of Geography text- books N = 27
29.6 33.3 3.7 7.4 3.7 0.0 7.4 7.4 3.7 0.0 0.0 3.7
Total % (F+M) 62.9 11.1 3.7 14.8 3.7 3.7
Lack of Hostel Accommo-dation N = 22
0.0 0.0 4.6 4.6 4.6 4.6 9.1 0.0 13.6 22.7 9.1 27.3
Total % F+M) 0.0 9.2 9.2 9.1 36.3 36.4
Lack of Parental Involve- ment N = 24
0.0 8.3 16.7 12.5 8.3 25.0 4.2 0.0 12.5 4.2 0.0 8.3
Total % (F+M) 8.3 29.2 33.3 4.2 16.7 8.3
Financial Problems N = 22
0.0 0.0 4.6 13.6 13.6 13.6 0.0 13.6 9.1 13.6 13.6 4.6
Total (F+M) 0.0 18.2 27.2 13.6 22.7 18.2
Poor relationship between Parents and teachers N = 24
16.7 4.2 12.5 16.7 4.2 4.2 4.2 20.8 0.0 4.2 4.2 8.3
Total % (F+M) 20.9 29.2 8.4 25.0 4.2 12.5
Note: N is indicated for each item. Not all the respondents answered all the items.
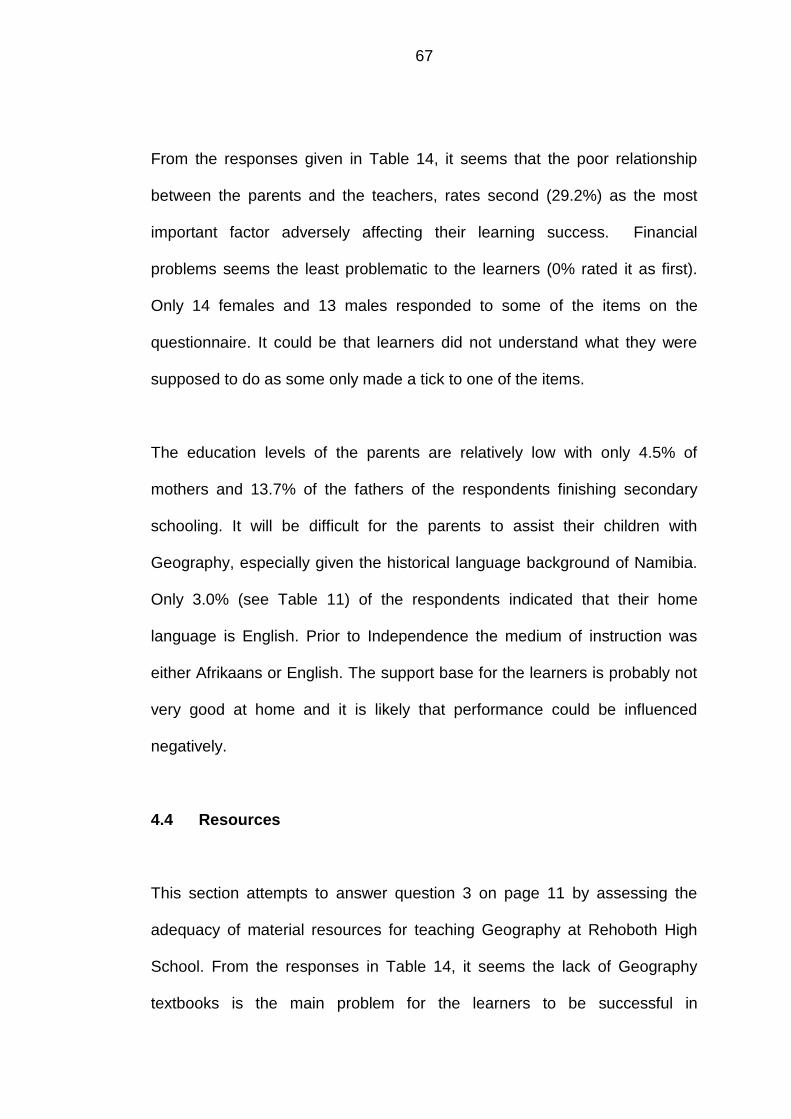
67
From the responses given in Table 14, it seems that the poor relationship
between the parents and the teachers, rates second (29.2%) as the most
important factor adversely affecting their learning success. Financial
problems seems the least problematic to the learners (0% rated it as first).
Only 14 females and 13 males responded to some of the items on the
questionnaire. It could be that learners did not understand what they were
supposed to do as some only made a tick to one of the items.
The education levels of the parents are relatively low with only 4.5% of
mothers and 13.7% of the fathers of the respondents finishing secondary
schooling. It will be difficult for the parents to assist their children with
Geography, especially given the historical language background of Namibia.
Only 3.0% (see Table 11) of the respondents indicated that their home
language is English. Prior to Independence the medium of instruction was
either Afrikaans or English. The support base for the learners is probably not
very good at home and it is likely that performance could be influenced
negatively.
4.4 Resources
This section attempts to answer question 3 on page 11 by assessing the
adequacy of material resources for teaching Geography at Rehoboth High
School. From the responses in Table 14, it seems the lack of Geography
textbooks is the main problem for the learners to be successful in

68
Geography. From the respondents, 62.9% indicated that the lack of
Geography textbooks is the overriding factor which makes learning
Geography difficult. A list was designed as a measure of the provision of
resources in the classroom. Table 15 summarises the responses.
Table 15: State of Materials in the Geography class.
Type of Material Excellent Good Fair Poor
M (%) F (%) M (%) F (%) M (%) F (%) M (%) F (%)
Textbooks N = 66
7.6 12.1 24.2 28.8 6.1 10.6 6.1 4.6
Total %(M+F) 19.7 53.0 16.7 10.7
References N = 64
0.0 6.3 12.5 20.3 17.2 9.4 14.1 20.3
Total (M+F) 6.3 32.8 26.6 34.4
Audio/Visual Aids N = 64
1.6 7.8 9.4 7.8 10.9 10.9 23.4 28.1
Total % (M+F) 9.4 17.2 21.8 51.5
Maps N = 66
7.6 4.6 19.7 22.8 15.2 19.7 1.5 9.1
Total % (M+F) 12.2 42.5 34.9 10.6
Readers N = 63
1.6 6.4 14.3 22.2 19.1 14.3 9.5 12.7
Total % (M+F) 8.0 36.5 33.4 22.2
Map of Namibia N = 62
4.8 9.7 21.0 25.8 12.9 8.1 6.5 11.3
Total % (M+F) 14.5 46.8 21.0 17.8
Map of Africa N = 64
6.3 9.4 21.9 29.7 12.5 11.0 4.7 4.7
Total % (M+F) 15.7 51.6 23.5 9.4
Map of the World N = 64
9.4 11.0 18.8 23.4 12.5 17.2 3.1 4.7
Total % (M+F) 20.4 42.2 29.7 7.8
Atlas N = 60
1.7 8.3 10.0 20.0 21.7 8.3 13.3 16.7
Total % (M+F) 10.0 30.0 30.0 30.0
Classroom Library N = 64
1.6 3.1 3.1 3.1% 14.1 6.3 25.0 43.8
Total % (M+F) 4.7 6.2 20.4 68.8
Wall Charts N = 65
3.1 3.1 7.7 10.8 13.9 18.5 20.0 23.1
Total % (M+F) 6.2 18.5 32.4 43.1
English Dictionary N = 63
11.1 7.9 7.9 17.5 11.1 12.7 14.3 17.5
Total % (M+F) 19.0 25.4 23.8 31.8
Globes 6.7 5.0 10.0 11.7 5.0 11.7 23.3 26.7

69
N = 60
Total % (M+F) 11.7 21.7 16.7 50.0
Compasses N = 63
1.6 1.6 3.2 11.1 7.9 12.7 30.2 31.8
Total % (M+F) 3.2 14.3 20.6 62.0
Note: N is indicated for each item. Not all the respondents answered all the items.
Looking at the resources in the Geography classroom it seems that the
learners that responded to the questionnaire think that textbooks (53.0%),
maps (42.5%), readers (36.5%), map of Namibia (46.8%), map of Africa
(51.6%) and map of the world (42.2%) are “good”. They think that the
references (34.4%), audio/visual aids (51.5%), classroom library (68.8%),
wall charts (43.1%), English dictionary (31.8%), globes (50.0%) and
compasses (62.0%) are in the “poor” category. Atlases are viewed by the
same number of individual’s views as “good” (30.0%) “fair” (30.0%), and
“poor” (30.0%).
On the question of how the learners perceive their school library in terms of
resources in Geography no male learner saw it as excellent. Table 16
summarises the responses to the question.
Table 16: How learners view their school library (N=66; Females=37, Males=29. State of School library Female (%) Male (%) Total (%)
Excellent 6.1 0.0 6.1
Good 9.1 6.1 15.2
Fair 15.2 15.2 30.4
Poor 22.7 21.2 43.9

70
Learners not answering question 3.1 1.5 4.6
The respondents are of the opinion that the library is in the “fair” to “poor”
state. A total of 43.9% of the respondents think that the library is “poor”, while
30.4% think of the library as being “fair”. What is interesting is that 6.1% of
the respondents think that the library is “excellent”. Furthermore, it is
interesting to note that during an interview with the teacher that is responsible
for the library, she indicated that the library was not functional. Due to staff
shortages the teacher was having a full teaching load and only saw the
Grade 12 learners for one period per week. From observations the
researcher is of the view that the library is not in a position to cater for
Geography needs. The teacher also mentioned that the learners were
permitted to take out books but due to thefts of books, the issuing had been
stopped during the library period on the timetable. She mentioned that she
had suggested that the school appoint an out of school youth to run the
school library who would be paid from the school fees. But, approval has yet
to be obtained from the Regional Office and the Permanent Secretary before
this could be started. In the interview, the learners indicated that the Ministry
of Basic Education, Sport and Culture should provide more textbooks and
equipment.
The respondents are of the opinion that the resource base of the school is
relatively good. However, the resources in the Geography class seem
problematic. The respondents rate the classroom library and the audio/visual

71
aids overwhelmingly as poor. The respondents also rate the school library as
poor (51.5%). It seems that lack of resources in the Geography classroom
might influence the performance in Geography learners negatively.
4.5 Teaching Methods
This section attempts to answer question 4 on page 11, namely to identify the
teaching methods used by the Geography teacher. Several responses were
obtained from the question which sought information from the learners
regarding the teaching methods used in teaching of Geography at the school.
Table 17 summarises their answers to the question of Geography teaching at
Rehoboth High School.
Table 17: Verbatim responses of learners on teaching methods.
Kindly add any comments that you would like to make with regard to teaching Geography at the school. Respondent 1: “I would like to see that learners are being taken to places like rivers to do the exercises practically. It is also one of the factors contributing to poor results of learners”. Respondent 2: “Learners should do a lot of practical work as well as writing tests after each chapter.” Respondent 3: “Teachers should pay more attention to children that have problems in the subject”. Respondent 4: “The teacher laughs when you ask a question, so one gets afraid of asking a question, but Geography is the most interesting subject”.

72
Respondent 5: “I think another problem contributing to the lack of high results is the lack of geographical material. The fact that the learners do not go out on field trips, in part because of a lack of finances and if this could be overcome, the results could improve as well”. Respondent 6: “Improve the textbooks, Please!”. Respondent 7: “More outdoors projects for us and more textbooks. The book we have does not contain all the things of Geography”. Respondent 8: “Making it more interesting and by making use of different experiments. Giving students more attention”. Respondent 9: “I think that the teacher should let us do things in groups and the lack of Geography textbooks play a part in the path of unsuccessful learning”. Respondent 10: “I would really like our Geography teacher to let us work in groups and respond to him or let us have debates at the school”. Respondent 11: “My geography teacher is good and there is no problem with the teaching of Geography at the school”. Respondent 12: “Teaching at the school is excellent because Geography is the science of the earth”. Respondent 13: “Teaching is made very clear and I hope that every learner understands it”.
Apparently, according to the learners during the interview, they indicated that
the Grade 11 learners have textbooks, whilst a number of the Grade 12
learners have to go without textbooks. They feel that the Grade 12s should
be given preference.
Follow up questions addressed the issue of the actual teaching methods
mostly used in the Geography classroom. Table 18 (a) reflects the learners’
responses.

73
Table 18 (a): Frequency of the use of identified teaching methods.
Teaching method Regularly Often Seldom Never
M (%) F (%) M (%)
F (%) M (%)
F (%) M (%)
F (%)
Groupwork N = 65
4.6 0.0 4.6 9.2 16.9 24.6 18.5 21.5
Total % (M+F) 4.6 13.8 41.5 40.0
Discussion N = 66
19.7 24.2 19.7 19.7 4.6 4.6 0.0 7.6
Total % (M+F) 43.9 39.4 9.2 7.6
Peer-group learning N = 60
6.7 1.7 13.3 11.7 8.3 18.3 16.7 23.3
Total % (M+F) 8.4 25.0 26.6 40.0
Practical Activity N = 62
8.1 12.9 22.6 11.3 4.8 17.7 9.7 12.9
Total % (M+F) 21.0 33.9 22.5 22.6
Learners able to initiate discussion or activity N = 63
7.9 17.5 19.1 22.2 14.3 7.9 4.8 6.4
Total % (M+F) 25.4 41.3 22.2 11.2
Teacher gives positive comments to learners N = 66
19.7 31.8 13.6 13.6 3.0 6.1 7.6 4.6
Total % (M+F) 51.5 27.2 9.1 12.2
Note: N is indicated for each item. Not all the respondents answered all the items.
From the responses in Table 18 (a) it seems that group discussion (43.9%) is
regularly used while positive comments on learners work are made on a
regular basis (51.5%). The respondents also indicated that the teacher
seldom or never makes use of group work and peer group learning. The
respondents (41.3%) indicated that the teacher allows time for discussion
and activity initiated by the learners. 40% of the respondents indicated that
the teacher never uses peer-group learning in the teaching of Geography.
The teacher is seen as someone who is the arbiter of knowledge and whose
task it is to pass it on to the learners. The teacher is therefore in a unique

74
position to control the learning opportunities. If the teacher introduces the
topic before teaching it, the learners can fit it into a broader framework of the
curriculum. The teacher therefore provides the context of individual lessons
within a theme. In addition, if the teacher asks questions to assess
comprehension, the teacher is in a position to vary the teaching approach
and the learners become involved in the teaching/learning process. The
learners are therefore in a position to identify their problems with certain
concepts early on and the teacher could explain to them a second time or
use another approach to explain to them. In addition, if the teacher produces
his or her own teaching materials the teacher is better prepared to teach the
topic. Questions were asked to the learners to indicate the frequency that the
teacher makes use of selected methods and Table 18 (b) summarises the
responses.
Table 18 (b): Frequency of the use of selected teaching approaches.
Selected teaching approach
Regularly Often Seldom Never
M F M F M F M F
Introducing the topic before teaching it N = 65
35.4 36.9 9.2 7.7 0.0 3.1 0.0 7.7
Total % (M+F) 72.3 16.9 3.1 7.7
Asking questions to assess topic compre- hension N = 65
20.0 38.5 20.0 10.8 3.1 4.6 1.5 1.5
Total % (M+F) 58.5 30.8 7.7 3.0
Using his/her own materials N = 65
10.8 10.8 15.4 15.4 10.8 16.9 7.7 12.3
Total % (M+F) 21.6 30.8 27.7 20.0
Note: N is indicated for each item. Not all the respondents answered all the items.

75
From the responses it seems that the teacher often introduces the topic
before teaching it on a regular basis (72.3%). A total of 30.8% of the
respondents indicated that the teacher makes use often of his own materials
to present the lessons to them, and asks questions to ascertain learner
understanding of the topic given by 58.5% of the respondents.
The methodological approach to be implemented at all school levels is one
where learners should be actively involved in the teaching and learning
process. It is referred to as the learner-centred approach. A question was
asked to the learners in order to ascertain to what extent this approach was
being applied in the Geography class. Table 19 summarises the responses.
Table 19: The extent to which learner-centred education was applied in the Geography class (N=66; Females=37, Males=29). Extent of use of learner-centred method
Males % Females % Total %
Very successfully 7.6 6.1 13.7
Moderately successful 22.7 33.3 56.0
Unsuccessful 7.6 7.6 15.2
Not attempted 6.1 1.5 7.6
Learners not answering question 0.0 7.6 7.6
From the responses given in Table 19, it seemed that the teacher uses the
learner-centred approach moderately successfully (56.0%). The learners also
76
had the opportunity to rate the Geography teacher on certain traits. Table 20
reflects their ratings.
Table 20: Rating of the teacher on certain traits (N=66; Females=37, Males=29). Teacher trait Excellent Good Fair Poor
M % F % M % F % M % F % M % F %
Knowledge of content
22.7 30.3 18.2 22.7 1.5 1.5 1.5 1.5
Total % (M+F) 53.0 40.9 3.0 3.0
Friendliness
13.6 18.2 18.2 25.8 10.6 6.1 1.5 6.1
Total % (M+F) 31.8 43.9 16.7 7.6
Helpfulness
15.2 34.9 22.7 18.2 3.0 1.5 3.0 1.5
Total % (M+F) 50.1 40.9 4.5 4.5
Ability to inspire learners
10.6 22.7 22.7 16.7 4.6 12.1 6.1 4.6
Total % (M+F) 33.3 39.4 16.7 10.7
English proficiency
16.7 21.2 16.7 30.3 9.1 3.0 1.5 1.5
Total % (M+F) 37.9 47.0 12.1 3.0
From the responses 53.0% of the respondents think that the teacher’s
knowledge and content of the Geography subject is “excellent”. Friendliness
and helpfulness are rated by 43.9% and 40.9% respectively in the “good”
category. Likewise is the ability to inspire and the English proficiency rated in
the “good” category by 39.4% and 47.0% respectively by the respondents.

77
The teachers interviewed were also asked to indicate the role of the advisory
teacher and factors they considered most important and most difficult for a
Geography teacher. The responses of the teachers are given in Table 21.
Table 21: Responses of Geography teachers on the role of the advisory teacher and factors they considered most important and most difficult for a Geography teacher.
What do you consider is the role of the advisory teacher? The advisory teacher should: * explain curriculum content * clarify educational objectives * recommend new teaching materials * make suggestions to improve teaching materials * encourage professional contact between different Geography teachers * provide information for self-development Indicate factors that you consider make it most important to being a Geography teacher. * seeing learners learn * more adequate teaching materials * assistance from the advisory teacher * regular Geography subject meetings * smaller class sizes * quality classroom supplies * quality school buildings * quality school management and administration * amicable working relationships with other teachers * study opportunities for teachers * good relationships with the local community * availability of teacher housing and accommodation * higher salary * expanded opportunities for promotion Indicate factors that you consider most difficult to be an effective Geography teacher. * lack of Geography textbooks * lack of parental involvement * illiteracy and poor education of the parents
78
* poor relationship between parents and teachers * too high teaching load with limited or no time for preparation * lack of hostel accommodation * financial problems
In summary; the teaching methods are varied to accommodate the different
learning styles and that the learner centred teaching is moderately
successfully implemented in the Geography classroom. The teacher is also
rated very highly in competencies in content, language proficiency,
helpfulness and inspiration ability. It seems that teaching in the classroom is
contributing positively to learner performance and that the teaching
approaches used in the Geography classroom is not contributing adversely
on the performance of learners.
4.6 Attitude towards Geography as a subject
This section provides the answer to question 5 on page 11. It examines the
attitudes of Grade 12 learners towards Geography. On the question of
whether learners like Geography as a subject 88.33% of the respondents
indicated that they liked Geography as a subject and 16.67% indicated that
they disliked it.
Regarding the attitudes of the learners towards the subject, Table 22 gives
the learners’ responses:

79
Table 22: Attitude of the learners towards Geography (N=66; Females=37, Males=29). Attitude towards Geography Female % Male % Total %
Excellent 6.1 9.1 15.2
Good 21.2 30.3 51.5
Fair 21.2 1.5 22.7
Poor 4.6 3.0 7.6
Learners not answering question 3.0 0.0 3.0
Fifty two per cent of the respondents think that they have a “good” attitude
towards Geography as a subject. A total of 22.7% of the respondents
indicated that they have a “fair” attitude and 7.6% thought their attitude
towards the subject is “poor”. Table 23 gives the verbatim responses of three
of the learners that were interviewed.
Table 23: Verbatim responses of learners on attitude towards subject.
What is your view towards Geography as a subject? Respondent 1: “Geography is such an interesting subject which teaches us about life, therefore I would like teachers to inspire the learners to take more part in Geography”. Respondent 2: “I find it difficult to start with my work, as I do not possess the ability to motivate myself. Respondent 3: “I think the problem is always from myself because I do not offer my best”.
The learners were not very responsive towards this question. It seems that
the majority of the respondents have a positive attitude towards the subject.

80
As mentioned earlier in the text a positive attitude towards Geography as a
subject makes a difference between success and failure.
4.7 School environment
This section gives the answers to question 6 on page 11, with respect to the
extent the school environment influences the learners’ performance in
Geography. Learners were asked to give their opinions whether the school
creates opportunities for them to live and learn peacefully. The responses
are given in Table 24.
Table 24: Opportunities for peaceful study (N=66; Females=37, Males=29). Response Male % Female % Total %
Yes 15.2 33.3 48.5
No 18.2 15.2 33.4
Learners not answering question 10.6 7.6 18.2
A total of 48.5% of the respondents indicated “yes” and 33.4% indicated “no”.
The verbatim responses of the learners on this question are given in Table
25.
Table 25: Verbatim responses on whether the school provides a chance for peaceful study.
In your opinion, does the school create opportunities for learners to live and learn peacefully? Respondent 1: “In some cases there are opportunities to learn but teachers sometimes break our confidence and disappoint us”.

81
Respondent 2: “There is always some kind of disturbance to prevent the learners from studying peacefully”. Respondent 3: “Some teachers tend to listen more to some learners than others”. Respondent 4: “Some teachers are too involved in my life as a student, and going to my parents for the smallest mistakes I sometimes made. I think they should assist me in my school work and there it should stop”. Respondent 5: “In some classes there is simply no order and learners are not motivated and encouraged to give attention to their work and to study hard. Some differences also usually occur in the learner-to-learner or teacher-learner relationship, but they are usually resolved in one or another way”. Respondent 6: “Teachers are not doing enough to create the opportunities, as we are not given enough time to study”. Respondent 7: “The school is providing opportunities for us but that we do not make use of it” Respondent 8: “We as learners don’t use the opportunities because we have our own interests and sometimes our friends don’t want us to learn”. Respondent 9: “We are just busy with unnecessary things and we don’t care of all the things the school creates for us”. Respondent 10: “Strict rules are introduced and the school is given us access to the library and are giving attention to our problems”. Respondent 11: “The school is providing hostel accommodation for learners to live and learn peacefully”. Respondent 12: “I feel very welcome here at this school. This is the best school for me in this town”. Respondent 13: “It is enjoyable for learners to live and learn at the school”. Respondent 14: “The environment does not have an influence on me as I am at school to study and do not pay much attention to the environment. The colour of the school is not distracting me”.
A follow up question was posed to ascertain how the learners perceive the
condition of the school buildings. Table 26 summarises the responses.

82
Table 26: How learners perceive the condition of the school buildings (N=66; Females=37, Males=29). Condition of school buildings Male % Female % Total %
Need major repairs 33.3 37.9 71.2
Need minor repairs 10.6 13.6 24.2
Is in good condition 0.0 4.6 4.6
It appears that the majority of the learners (71.2%) think that major repairs
need to be done and only 4.6% (all female) think that the school buildings are
in a good condition. When the researcher visited the school it seemed as if
the school had started to repaint some of the blocks but that the exercise was
discontinued. This was probably due to a lack of funds, as the principal
indicated that the support and attendance of the parents and community
members at meetings and functions, were not very encouraging.
The school environment seems to provide the opportunity for learners to
study Geography. Some of the respondents felt that they do not make use of
the opportunities provided to them and they could not indicate why they do
not make use of the opportunities. It also seems that some respondents
blame their fellow learners for not providing them the opportunity to do their
work. The learners feel that the school buildings need major repairs but some
feel that it does not have an influence on their Geography performance.

83
CHAPTER FIVE
SUMMARY AND RECOMMENDATIONS
5.1 Summary
There are many factors that affect how well a learner performs in Geography
and whether that performance will deteriorate or improve. The factors that
affect learning are related to the structure of the examination papers, social-
cultural factors, resources, teaching methods, attitude towards Geography as
a subject and the school environment.
In this study it seems that the learners overall performed better in the skill
analysis section of the examination papers. In Paper 2 there was also a
significant difference in performance in the skill judgement and decision
making between the males and the females. In all the other skill areas there
appeared to be no significant difference in the performance of males and
females.
Parents and guardians play a major role in supporting and facilitating the
teaching and learning of the learners. This calls for a good relation and
cooperation between the teachers and the parents and the guardians. The
poor relationships between parents and teachers received the second
highest rating as one of the factors that learners considered made it most
difficult for them to be successful in Geography. The teacher and/or the

84
principal need to hold meetings with the parents and visit those parents that
are not responding positively or actively in helping the learners to get their
work done or attend to studies at home. The school communities should also
provide opportunities to learners to get to know each other. Davis (2001)
indicates that contact outside the classroom provides strong motivation for
learners to perform well in the class and to participate in the broad social and
intellectual life of the school. Teachers and community members can get a
sense of how the learners feel about the social and cultural environment of
the school. This will also serve a valuable purpose in that it will inform the
teachers and the community members about the history and culture of the
learners.
From the responses of the learners regarding Geography specific resources
in the classroom, the learners are in general agreement that the resources
(maps, readers, map of Namibia, map of Africa and map of the world) are
“good”. Improving the use of instructional materials in the Geography
classroom is imperative for learning to take place. It is crucial in helping the
learners learn what the syllabus requires. The learners rated the lack of
Geography textbooks as the major factor making it most difficult for them to
be successful in Geography. According to Lockheed and associates (1991)
choosing effective inputs is the first step toward improving learning, but
managing them well at the school level is also necessary. The impact of
enhanced inputs ultimately depends on how well the school uses the
available resources. It requires that the school constantly and continuously

85
monitors the progress of the learners in order to determine whether what is
required is actually attained. It also requires that those outside the school
should be aware of the situation of learners.
Instructional materials and practical exposure to the content are critical
ingredients in learning and the syllabus cannot be easily implemented without
them. Instructional materials and fieldwork provide opportunities to the
learners to better understand what they are learning. Practical exposure has
the unique opportunity to help the learners acquire and strengthen attitudes
on which a solid Geography knowledge can be built. The fieldwork activities
also promote learner independence. Griffith (1999) suggests that with
choices and power, the soul begins to emerge as it associates with the
environment. The learners therefore begin to learn from experience what is
real, what is valuable and what really matters. Effective teaching strategies
are also vital and it should be paced to the learners’ level and it should take
individual differences into consideration. It also calls for time when the
learners can practice and apply what they have learned, particularly in
relation to their own experiences. These can only be achieved if adequate
provision is made for fieldwork and practical activity.
In order to improve the attitudes of the learners towards the study of
Geography, the parents and the teachers can encourage the learners to do
well. The teachers and the parents should also model high expectations and

86
that will promote learning. When learners are well guided they can become
hardworking and successful in their learning.
The researcher believes that all learners are able to learn under favourable
conditions. Favourable conditions that can have a positive influence on the
learning at school are when:
learners have textbooks to use;
learners are motivated to learn;
learners show consideration for one another and for the teachers; and
learners have a good attitude towards their work.
The learners also need an environment where all of them are treated equally.
According to Wadsworth and Mennen (1997) classrooms that are
characterised by equity are ones in which all the learners, regardless of their
gender, race or background, have an equal opportunity to learn and master
the course content.
5.2 Recommendations
Recommendation One: Educational policy should be put in place to provide
indicators of how learners perform in order to develop test items that can be
standardised and also enforce the setting of mock examinations that are in
compliance with end of year requirements. This means that tests
administered at various stages during the years should cover the same

87
content and criteria and are scored exactly the same for all the learners. This
means that teachers have to ensure that the testing conditions and the
format of the examinations have to be consistent with the mock examination
prescriptions.
Recommendation Two: The school should conduct workshops for parents,
teachers and learners. The workshops should contain helpful, productive and
idea-orientated information that will fulfil the interests of the parents, the
teachers and the learners. The participants will gain the personal satisfaction
of knowing they can have direct involvement in learning how to make a
difference in the learning process. The workshop content can be different
every time and can cover contentious issues that influence the performance
of the learners at school.
The school could also try to have continuous parent-teacher activities like an
open door policy whereby parents can come to school any time. The school
could also give progress notes to parents on a regular basis. Occasional
telephone calls to parents and guardians can also go a long way to motivate
the learners and the parents to stay engaged in the learning process. A
Geography newsletter can also highlight the important events, concepts and
jargon of the subject. Geography meetings could also be scheduled on a
regular basis to discuss problems. In these meetings the teachers, parents
and learners could develop lists of recommendations to help the home and
school contribute to the learners’ success in Geography. The group can also

88
develop a handbook that includes information describing the respective roles
and how they are sensitive to diverse family structures, academic
performance, values and needs of the learners. This can also serve as a
forum to answer the following questions:
What kind of obstacles does the teacher encounter in working with the
learners?
How can the school be oriented more toward parents and families?
What kind of assistance should be provided for parents unable to
attend workshops and parent meetings?
What can parents and families do at home to help teachers in the
learning and teaching process?
What kinds of school activities promote good parent-teacher
relationships?
Recommendation Three: The examiners, moderators and evaluators of the
examination and other test materials should be sensitive to the learners
whose first language is not English. These individuals can develop topics that
encourage learners to explore roles that are prevalent in their own respective
communities and backgrounds and give exams that recognise learners’
diverse backgrounds and special interests.
Recommendation Four: In order to maximise the chances for learners to be
successful, learners can form study teams that meet outside the class. By
studying together, the learners can both improve their academic performance

89
and overcome making the seven problems that Phiri (1998) mentioned,
namely:
Rubric errors.
Failure to follow basic instructions stipulated in the papers.
Failure to recognise the demands of the examinations.
Difficulties in the interpretation of resources provided in a question.
Language and communication skills.
Limited knowledge of subject matter.
Difficulties associated with investigative and/or research skills.
Recommendation Five: Although it will be important for the school to
provide resources to the Geography classroom and the school environment it
is also imperative that current resources be managed efficiently. The school
should also add inputs that may contribute significantly to learning and must
acquire those resources that are the least expensive relative to their
educational contributions. Lockheed, Verspoor, Bloch, Englebert, Futler,
King, Middleton, Paqueo, Rodd, Romain and Welmond (1991) state that
national education authorities should actively seek national financial support
corresponding to the high priority that the education deserves. This,
according to them, involves studying the overall allocation of government
resources and developing an effective strategy for strengthening political and
bureaucratic support for the education sector.

90
Recommendation Six: It is also recommended that a follow up study be
done in order to compare the results of the learners in the November 2000
external examination and the August 2000 mock examinations. This is to
determine the reliability of the mock August 2000 results as an indicator of
actual performance in the final examinations.

91
REFERENCES
Angula, N. (1993). Statement to Parliament on Admission of Learners to
Grade 11 in 1994, Windhoek, July 27.
Best, J.W. & Kahn, J.V. (1993). Research in Education, Seventh Edition.
New Jersey. Prentice-Hall.
Bey, T. M. (1996). Making the School a place of Peace. California. Corwin
Press.
Bonwell, C. & Eison, J. A. (1991). Active Learning: Creating Excitement in
the Classroom. Eric Digests. ERIC Clearinghouse. ERIC Identifier:
ED340272.
Bowman, B.T. (1994). Educating language minority children: Challenges
and Opportunities. Eric Digests. ERIC Clearinghouse. ERIC Identifier:
ED355836.
Campbell, L., Campbell, B, & Dickinson, D. (1996). Teaching and Learning
through multiple intelligences. Boston. Allyn & Bacon.

92
Creemers, B. (ed.) (1989). School Effectiveness and School
Improvement: proceedings of the Second International Congress,
Rotterdam 1989. Rotterdam. Netherlands. Swets & Zeitlinger.
Davis, B. (2001). Diversity and Complexity in the Classroom:
Considerations of Race, Ethnicity, and Gender. Los Angeles. University of
California.
Diekhoff, G.M. (1996). Basic Statistics for the Social and Behavioral
Sciences. New Jersey. Prentice-Hall.
Ford-Martin, P. (2001). Attitude and behavior.
http://www.findarticles.com/cf_dld/g2699/0003/2699000381/p1/article.jhtml
Gale Encyclopedia of Psychology.
Good, T.L. & Brophy, J.E. (1997). Looking in Classrooms. Seventh Edition.
New York. Longman.
Goodwin, A.L. (ed.) (1997). Assessment for Equity and Inclusion:
Embracing all our Children. New York. Routledge.
Greenman, J. (1988). Caring spaces, learning places: children’s
environments that work. Redmond. Exchange Press.

93
Griffith, L. (1999). Creating new attitudes: camp can shape the soul.
North Carolina. Gale Group.
Griggs, S. A. (1991). Learning Styles Counselling. Eric Digests. ERIC
Clearinghouse. ERIC Identifier: ED341890.
Hitchcock, G. & Hughes, D. (1995). Research and the Teacher: A
Qualitative Introduction to School-based Research. Second Edition.
London. Routledge.
Hopkins, C.D. & Antes, R.L. (1979). Classroom testing: Administration,
Score Interpretation. Illinois. F.E. Peacock.
Lockheed, M.E., Verspoor, A.M., Bloch, D., Englebert, P., Futler, B., King, E.,
Middleton, J., Paqueo, V., Rodd, A., Romain, R., and Welmond, M. (1991).
Improving Primary Education in Developing Countries. A World Bank
Publication. Oxford. Oxford University Press.
Lumsden, L. S. (1994). Student Motivation To Learn. Eric Digests. ERIC
Clearinghouse. ERIC Identifier: ED370200.
McLeod, B. (ed.) (1994). Language and Learning: Educating
Linguistically Diverse Students. Albany. State University of New York
Press.

94
Ministry of Basic Education and Culture, (1991). Language Policy for
Schools 1992-1996 and Beyond. Windhoek.
Ministry of Basic Education and Culture, (1996). Annual Report for the year
ending December 1996.
Ministry of Basic Education and Culture, (2000). Geography Syllabus code:
0460. Windhoek.
Ministry of Basic Education and Culture/EMIS (1996). Education Statistics.
(Windhoek, Namibia: Education Management Information Systems, Ministry
of Basic Education and Culture, 1997.
Ministry of Basic Education and Culture/EMIS (1998). Education Statistics.
(Windhoek, Namibia: Education Management Information Systems, Ministry
of Basic Education and Culture, 1999.
Ministry of Education and Culture, (1994). How much do Namibia’s
children learn in school? Findings from the 1992 National Learner
Baseline Assessment. Windhoek. Capital Press.
Ministry of Education and Culture, (1993). Questions and Answers on
IGCSE and HIGCSE, November 1993. Windhoek.

95
Ministry of Education and Culture, (1993). Toward Education for All: A
Development Brief for Education, Culture and Training. Windhoek.
Gamsberg Macmillan.
Mobley, M. (1986) All about GCSE: A Clear and Concise Summary of all
the Basic Information about GCSE. London. Heineman Educational Books.
Ltd.
Phiri, F.A. (1998). Perspectives on the (H)IGCSE paradigm: Why do
Namibian learners fail? In C.D. Kasanda (ed.). Enhancing Learner
Performance in Five School Subjects through a Teacher In-service
Workshop. Faculty of Education, University of Namibia, Windhoek. Namibia.
Powdrill, L.A., Just, H.D., Garcia, T., Amador, N.A. (1997). The effects of
classroom perceptions on motivation. Austin. University of Texas at
Austin.
Purkey, W.W. & Novak, J.M. (1984). A Self-concept approach to teaching
and learning, Second Edition. California. Wadsworth.
Renchler, R. (1992). School Leadership and Student Motivation. Eric
Digest Number 71. Oregon. Eric Clearinghouse on Educational Management.

96
Riding, R. & Butterfield, S. (1990). Assessment and Examination in the
Secondary School: A Practical Guide for Teachers and Trainers.
London. Routledge.
Rogers, R. (ed.) (1986). Education and Social Class. London. Falmer
Press.
Shinn, G. (1981). The Miracle of Motivation. Allahabad. St Paul Press
Training School.
Snyder, C.W. (Jr.) & Voigts, F.G.G. (ed.) (1998). Inside Reform: Policy
Programming Considerations in Namibia's Basic Education Reform.
Directorate of Planning and Development, MBEC.
Stoltman, J.P. (1991). Teaching Geography at School and Home. Eric
Digests. ERIC Clearinghouse.
Wadsworth, E.M. and Mennen D.R. (1997). Classroom Climate Workshops
for Graduate Teaching Assistants.
http://www.cic.uiuc.edu/wise/best1guidebook/classroom_climate_workshops
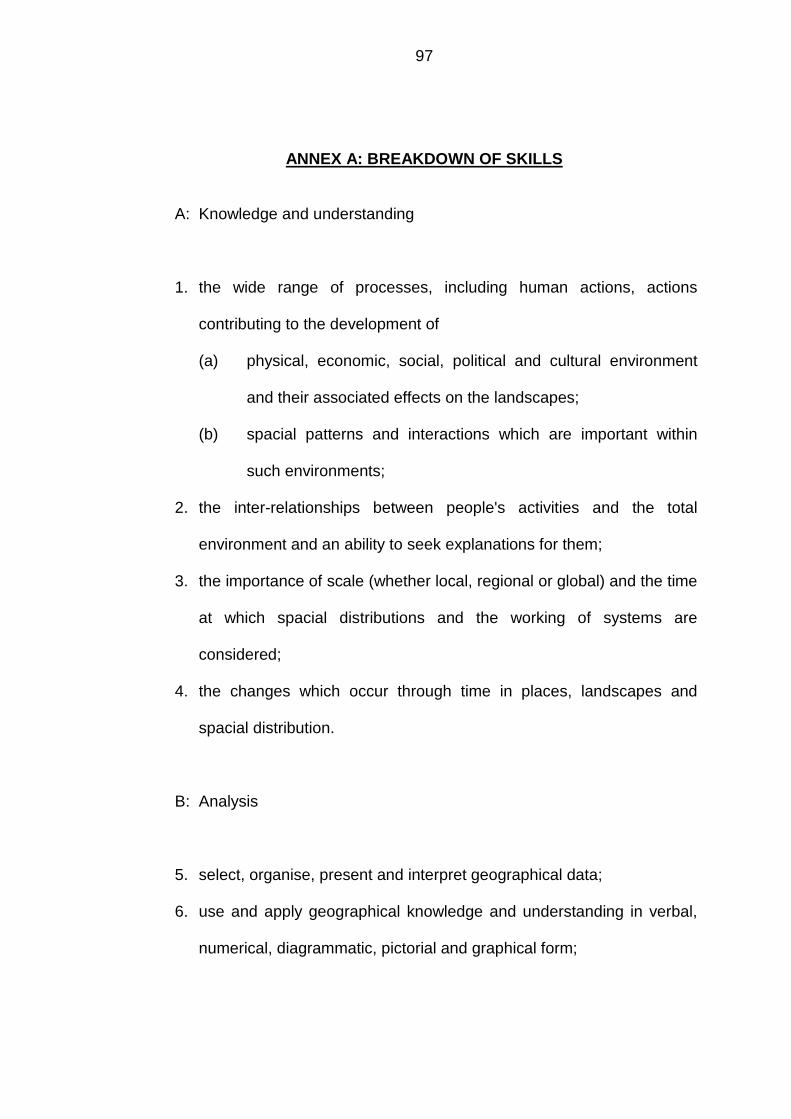
97
ANNEX A: BREAKDOWN OF SKILLS
A: Knowledge and understanding
1. the wide range of processes, including human actions, actions
contributing to the development of
(a) physical, economic, social, political and cultural environment
and their associated effects on the landscapes;
(b) spacial patterns and interactions which are important within
such environments;
2. the inter-relationships between people's activities and the total
environment and an ability to seek explanations for them;
3. the importance of scale (whether local, regional or global) and the time
at which spacial distributions and the working of systems are
considered;
4. the changes which occur through time in places, landscapes and
spacial distribution.
B: Analysis
5. select, organise, present and interpret geographical data;
6. use and apply geographical knowledge and understanding in verbal,
numerical, diagrammatic, pictorial and graphical form;

98
7. use geographical data to recognise patterns in such data and to
deduce relationships
C: Judgement and decision making
8. reason, make judgements (including evaluation and conclusions)
which demonstrate, where appropriate
(a) a sensitivity to, and a concern for, landscape and the
environment;
(b) an aesthetic appreciation of the earth including its people,
places, landscapes, natural processes and phenomena;
(c) an appreciation of the attitudes, values and beliefs of others in
cultural, economic, environmental, political and social issues
which have a geographical dimension;
(d) an awareness of the contrasting opportunities and constrains of
people living in different places and under different physical and
human conditions;
(e) a willingness to review their own attitudes in the light of new
knowledge and experiences;
9. recognise the role of decision making within a geographical context as
affected by;
(a) the physical and human contexts in which decisions are made;
(b) the values and perceptions of groups or individuals;

99
(c) the choices available to decision makers and the influences and
constraints within which they operate.
D: Investigation (enquiry, practical and presentation skills)
10. select and use suitable basic techniques for observing, collecting,
classifying, presenting, analysing and interpreting data;
11. use a variety of sources for obtaining information including
(a) maps and plans at a variety of scales;
(b) audiovisual materials such as pictures, photographs, film,
television and radio;
(c) documentary materials such as books, newspapers and
magazines;
(d) statistics
12. depict information in simple map and diagrammatic form;
13. select, use and present geographical information in an appropriate
form and an effective manner.
Adopted from Geography syllabus code: 0460

100
ANNEX B: GRADE 12 GEOGRAPHY LEARNER QUESTIONNAIRE
Dear Geography Learner
I am a Master of Education (M.Ed.) student at the University of Namibia and would
like to investigate factors influencing Grade 12 Geography results at
Rehoboth High School. Your views will only be incorporated in my dissertation,
as partial fulfillment of the requirements for the Master of Education Degree. Your
views will be treated with confidentiality. Would you be so kind to respond to the
items below and please try to answer every item.
A. Biographical Data
1. Name of School: Rehoboth High School
2. Your sex (a) Male
(b) Female
3. What is your age? (a) 16-17
(b) 18-19
(c) 20-21
(d) 21-22
(e) >22
4. Home Language(s) (a) English
(b) Afrikaans
(c) Otjiherero
(d) Nama/Damara
(e) Oshiwambo
(f) Tswana
(g) Other ..Specify ………………………
B. Socio-Cultural Factors
5. Where do you stay during the school week?
(a) With Parents or Guardians
(b) With Relatives or other family
(c) In a hostel
(d) On your own with other children
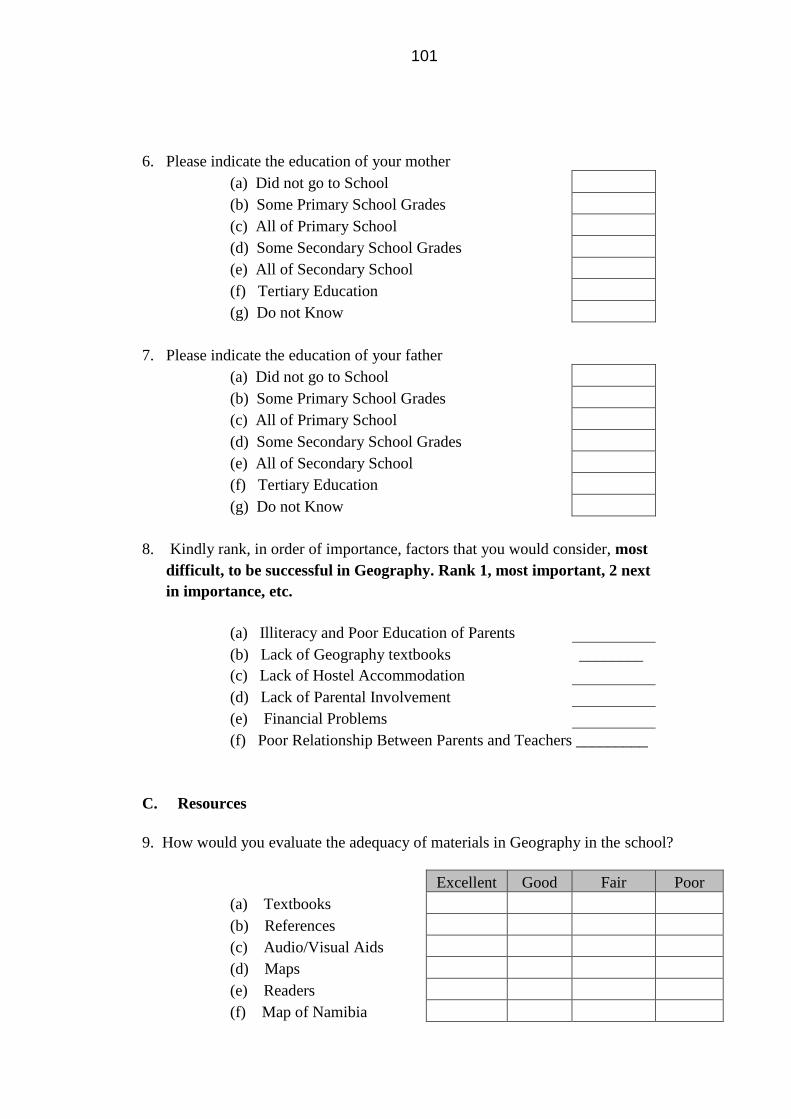
101
6. Please indicate the education of your mother
(a) Did not go to School
(b) Some Primary School Grades
(c) All of Primary School
(d) Some Secondary School Grades
(e) All of Secondary School
(f) Tertiary Education
(g) Do not Know
7. Please indicate the education of your father
(a) Did not go to School
(b) Some Primary School Grades
(c) All of Primary School
(d) Some Secondary School Grades
(e) All of Secondary School
(f) Tertiary Education
(g) Do not Know
8. Kindly rank, in order of importance, factors that you would consider, most
difficult, to be successful in Geography. Rank 1, most important, 2 next
in importance, etc.
(a) Illiteracy and Poor Education of Parents
(b) Lack of Geography textbooks ________
(c) Lack of Hostel Accommodation
(d) Lack of Parental Involvement
(e) Financial Problems
(f) Poor Relationship Between Parents and Teachers _________
C. Resources
9. How would you evaluate the adequacy of materials in Geography in the school?
Excellent Good Fair Poor
(a) Textbooks
(b) References
(c) Audio/Visual Aids
(d) Maps
(e) Readers
(f) Map of Namibia

102
(g) Map of Africa
(h) Map of the World
(i) Atlas
(j) Classroom Library
(k) Wall charts
(l) English Dictionary
(m) Globes
(n) Compasses
10. How would you rate your school library in terms of resources in Geography?
Excellent Good Fair Poor
D. Teaching Methods
11. Please indicate the frequency that the teacher is using the methods below:
Regularly Often Seldom Never
(a) Groupwork
(b) Discussion
(c) Peer-group learning
(d) Practical Activity
(e) Learners able to initiate discussion
or activity
(f) Teacher gives positive comments
to learners
12. Please indicate the frequency that the teacher is using the methods below:
Regularly Often Seldom Never
(a) Introducing Background of topic
before teaching it
(b) Asking questions to assess topic
comprehension
(c) Using his/her materials
13. The methodological approach to be implemented at all school levels is one
where learners should be actively involved in the teaching and learning
process (learner-centred education). To what extent has this been

103
successfully implemented at your school?
(a) Very Successful
(b) Moderately Successful
(c) Unsuccessful
(d) Not Attempted
14. How would you rate your Geography teacher on the following?
Excellent Good Fair Poor
(a) Knowledge of content
(b) Friendliness
(c) Helpfulness
(d) Ability to inspire learners
(e) English proficiency
E. School Environment
15. In your opinion, does the school create opportunities for learners to live and
learn peacefully?
…………………………………………………………………………………
…………………………………………………………………………………
…………………………………………………………………………………
16. How do you perceive the condition of the school buildings?
(a) Need major repairs
(b) Need minor repairs
(c) Is in good condition
F. Attitude Towards Geography
17. Do you like Geography as a subject?
Yes
No
18. How would you rate your attitude towards Geography as a learner?
Excellent Good Fair Poor
104
19. Kindly add any other comments that you would like to make with regard to
teaching/learning Geography at the school.
…………………………………………………………………………………
…………………………………………………………………………………
Thank you for completing the questionnaire.
C. Titus

105
ANNEX C: INTERVIEW SCHEDULE
(FOR LEARNERS AND TEACHERS)
How often does the teacher meet with learners?
How often do you have a meeting with parents at the school?
How often do the teachers meet?
How often does the management of the school meet?
How often does the school board meet?
What extra-mural activities does the school offer?
What factors are considered most important to be an effective teacher?
What are some of the major/minor management problems at school?
How does teacher morale rate at the school?
What is the role of the advisory teacher?
How often does the learners write formal tests?
How are the resources at the school? - Availability? Frequency of use?

106
ANNEX D: OBSERVATION SCHEDULE
Is there evidence of a good atmosphere in the school, with positive
discipline?
Are the school grounds clean and well cared for?
Availability of Resources Yes No
(a) Textbooks
(b) References
(c) Audio/Visual Aids
(d) Maps
(e) Readers
(f) Map of Namibia
(g) Map of Africa
(h) Map of the World
(i) Atlas
(j) Classroom Library
(k) Wall Charts
(l) English Dictionary
Teaching Strategies
Never Often Seldom Regularly
(a) Groupwork
(b) Discussion
(c) Peer group learning
(d) Practical Activity
(e) Learners able to initiate discussion or activity
(f) Teachers giving positive comments to learners
Yes No Is the classroom organised to accommodate learner-centred
learning?
Is the classroom attractively decorated, and are the materials
properly displayed?
Do classroom seating arrangements prevent learners from

107
disturbing one another when entering or exiting the room?
Does the classroom have adequate heating, lighting and
ventilation?
Does the classroom have enough space for the teacher and the
learners to move easily about the room?
Does the classroom present the image that the school is a safe
and peaceful place in which to learn?

108
ANNEX E: AUGUST 2000 MOCK EXAMINATION QUESTION PAPERS
PAPER 1 PAPER 2 PAPER 3 PAPER 5